Abstract
The application of ECC materials in major stress and energy dissipation regions of prefabricated reinforced concrete (RC) shear walls to form prefabricated ECC/RC combined shear walls can improve the seismic capacity of structures. The stress and damage mechanism of a 1/2-scale two-story spatial structure specimen of the prefabricated ECC/RC combined shear wall under low cyclic loading is numerically simulated. By comparing the numerical simulation results with the experimental results, the correctness of the numerical simulation method is verified. On this basis, a detailed whole process analysis is carried out by the numerical simulation method, including the stress distribution of the concrete and ECC, compression damage of the concrete and ECC, crack distribution of the concrete and ECC, stress distribution of the reinforcement, and structural and fabricated joint displacement. The whole process analysis effectively reflects the cracking, damage, and failure law of the specimen and extensively reveals the failure mechanism and internal force distribution law of the fabricated ECC/RC combined shear wall structure. Based on the stress and damage mechanism, the seismic energy dissipation performance with different ranges of ECC use in the bottom of the wall is studied. The results show that when the ECC height of the bottom walls is 400 mm, the energy dissipation performance of the prefabricated ECC/RC combined shear wall structure reaches an optimal value.
1. Introduction
Energy is the foundation and driving force for the progress of human civilization. Every small step of change in the field of energy will have a profound impact on social and economic development and is significantly related to the survival and development of all mankind. To make sustainable and rational use of energy worldwide, China is continuously promoting “carbon peak and carbon neutralization”. One of the important measures taken is to further promote energy savings and consumption reduction in key areas such as industry, construction, and transportation. As a construction method actively promoted in China’s construction field at this stage, prefabricated buildings are of strategic significance to China’s construction industry reform, low-carbon emission reduction, energy conservation, and environmental protection. As the main structural form of high-rise and super high-rise buildings, the shear wall structure is combined with the assembly type, which is in line with the guiding ideology of “energy saving and land saving” and “building industrial systems” for residential industrialization. It can effectively reduce resources and energy consumption, achieve energy savings and emission reduction, and protect the environment. It has significant economic and social benefits.
The wide application of prefabricated shear wall structures mainly depends on whether their seismic performance can meet the requirements. Due to various architectural constraints, such as the size of doors and windows, it is necessary to use short coupling beams with small shear span ratios. Unfortunately, RC coupling beams often fail in the brittle shear mode under earthquakes due to the small span-to-depth ratio. In this case, the coupling beams absorb little energy and are often seriously damaged, resulting in a weakening of the seismic performance of the shear wall structure.
One method to improve the seismic performance of the shear wall structure is to change the reinforcement form of coupling beams, e.g., by using diagonal forms. Four concrete coupling beams with different diagonal reinforcements were tested by Jang and Han [1] to study their performance under cyclic loading. Park et al. [2] investigated the effect of various reinforcement configurations on the seismic performance of diagonally reinforced coupling beams as part of a coupled reinforced concrete wall system. Their research indicated that diagonally reinforced concrete coupling beams can dissipate a large amount of input energy generated by earthquakes, and with increasing reinforcement, more energy is dissipated. However, due to the dense and complex reinforcement in the coupling beams, the performance of concrete cannot be guaranteed. Some scholars have also proposed using steel plates to strengthen coupling beams [3]. However, when applied to shear wall structures, the joints between coupling beams and shear walls lead to very difficult on-site installation.
Another option to improve the seismic performance of the shear wall structure is to use highly ductile materials such as engineered cementitious composites (ECCs). The compressive and tensile strengths of ECC and concrete are similar. However, ECC is a highly ductile material with very good tensile strain hardening ability, which forms dense cracks after cracking [4]. Its tensile strain is approximately 3~7% [5,6,7], and the crack spacing is only 3~6 mm [8,9,10]. Additionally, ECC is significantly better than concrete in shear carrying capacities and shear deformations [11]. To date, there have been many studies on the mechanical properties of ECC materials. Meng et al. [12] studied the flexural and shear behaviors of ECC beams. Compared with ordinary concrete beams, ECC beams have greater bending and shear deformation capacity. Abbas et al. [13] conducted experimental studies on 12 ECC beams and 4 concrete beams. Compared with the corresponding normal concrete beams, ECC beams can withstand higher cracking and ultimate loads. The ductility and toughness of ECC beams are higher than those of ordinary concrete beams. Amiri and Esfahani [14] examined the effect of the strengthening layer thickness of ECC on the punching shear strength and post-punching behaviour of flat slabs. The use of ECC as a strengthening layer for the flat slabs significantly increased the punching and post-punching shear strength capacities.
ECC has good crack width control ability, deformation ability, and self-healing ability [15]; therefore, it is an ideal material for seismic structures. To date, the seismic performance of ECCs in many components and structures has been studied by several scholars. Zhang et al. [16] investigated the seismic performance of ECC coupling beams. The test results demonstrate that ECC coupling beams exhibit superior seismic performance. The seismic performance of exterior beam–column joints constructed with ECCs was studied by Suryanto et al. [17]. It was shown that the seismic performance of the structurally relaxed ECC specimens was comparable, and in some cases was better than the concrete specimens designed according to the seismic design provisions. Cai et al. [18] investigated the seismic behaviors of assembled monolithic ECC/RC composite frames and RC frames by experimental and simulation methods. The results showed that the energy dissipation capacity, ductility, and stiffness of the ECC/RC composite frame were higher than those of the RC frame. Khan et al. [19,20] studied the seismic performance of ECC/RC composite frames by eliminating shear reinforcement in beam–column joints by a shaking table test. The ECC beam–column joint without shear ties achieved a 75% larger R-factor than the code-specified value. The efficient use of ECC in critical regions of frame structures can be vital in mitigating seismic risk. Through the low cyclic loading test of reinforced ECC (RECC)-coupled shear walls and RC-coupled shear walls, Ye et al. [21] found that the seismic performance of reinforced ECC (RECC)-coupled shear walls was obviously better than that of RC-coupled shear walls.
Research on the performance of prefabricated buildings plays a part in solving global climate problems and has positive significance for promoting “carbon neutralization and carbon peaks” in China. The main structural form of high-rise buildings is the shear wall structure. Whether the prefabricated shear wall structure can be widely promoted mainly depends on its seismic performance. There are two main measures to improve the seismic performance of prefabricated shear wall structures. One is to change the reinforcement form of the coupling beams, and the second is to add high ductility materials. The first method has difficulty guaranteeing the performance of concrete in the joint areas due to the complexity of reinforcement. The second method has been proven by several scholars to be applicable to beams, beam–column joints, slab–column joints, frame structures, and cast-in-place shear walls. However, to date, there are few reports on the seismic performance of prefabricated, coupled shear walls with ECC materials used in the main stress and energy dissipation areas. There is no research on the force or energy dissipation mechanism of prefabricated ECC/RC combined shear walls.
Our research group performed experimental research in the early stage, investigating the seismic behavior of precast concrete-coupled shear walls with ECC in critical cast-in-place regions [22]. The research highlighted the comparison between the ECC/RC specimen and the RC specimen in terms of the load capacity, damage tolerance, ductility, and energy absorption ability. Based on previous research, this paper further studies the stress and damage mechanism of prefabricated ECC/RC combined shear walls under low cycle repeated loading by means of numerical analysis, including the stress distribution of concrete and ECC, compression damage of concrete and ECC, crack distribution of concrete and ECC, stress distribution of reinforcement, and structural and fabricated joint displacement. Based on the stress and damage mechanism, the seismic energy dissipation performance of different ECC use ranges at the bottom of the wall will be studied, and the optimal use range of ECC will be proposed.
In this paper, a new structure–prefabricated ECC/RC combined shear wall is formed by adding high ductile material ECCs to major stress and energy dissipation regions. The innovation of this research is to extensively reveal the failure mechanism and internal force distribution law of the prefabricated ECC/RC combined shear wall structure and propose design optimization suggestions accordingly It is expected to provide a theoretical reference for further research and application of prefabricated ECC/RC-coupled shear wall structures.
2. Establishment of the Finite Element Model
2.1. Material Constitutive Relations
The materials used in the finite element model are mainly concrete, ECC, and steel bars. This paper adopts the concrete uniaxial stress–strain curve provided by “Code for design of concrete structures” (2015 Edition) (GB50010-2010) [23]. In addition to inputting the uniaxial stress–strain data, damage factors are also input into the finite element model. The uniaxial stress–strain curve of concrete, together with the damage factors, constitute the plastic damage model. In the model, the damage factor, D, is defined as the modification of the elastic modulus of the concrete during elastic unloading. After the elastic stage, the stiffness of the concrete decreases to (1-D) times the initial stiffness. The deterioration of the mechanical properties of concrete under cyclic loading is described by inputting the damage index corresponding to the inelastic strain of the material in ABAQUS. The value range of the damage factor is 0~1, and the greater the value is, the greater the damage. The damage plasticity model proposed by Zhang et al. [24] is mainly used, and the tensile damage factor, Dc, and the compressive damage factor, Dt, are determined by the following formulas:
where is the ratio of the compressive plastic strain to the inelastic strain, taken as 0.5; is the inelastic strain of the concrete; is the initial elastic modulus; and is the proportional coefficient of the tensile plastic strain and inelastic strain, taken as 0.75.
ECC adopts the stress–strain curve proposed by Pan’s research group [25] and obtains the ECC plastic damage model of ECC tensile and compressive damage factors according to the energy damage principle of Amrane and Sidoroff [26].
The stress–strain relationship curve of the steel bar adopts a typical double-line model. The steel bar can be considered completely elastic before yielding, and it is approximately simplified as a gentle diagonal after yielding. The elastic modulus in the strengthening stage is approximately 0.01 of the initial elastic modulus, Es. The constitutive relation of steel bars is shown in Figure 1. The specific parameters of the steel bar in the ABAQUS model are obtained according to the material property test: the ultimate strain εu = 0.07, the initial elastic modulus is 2.0 × 10⁵, and Poisson’s ratio is 0.3.
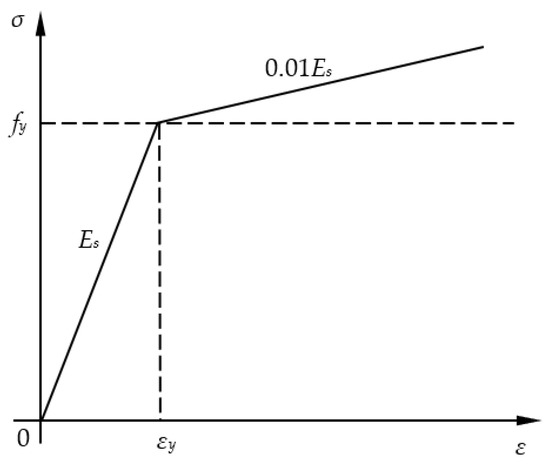
Figure 1.
Stress–strain curve of the steel bars.
2.2. Element Selection and Model Building
The choice of element type of each component in the finite element model greatly affects the accuracy and convergence of the numerical simulation. Both concrete and ECC elements are carried out with an eight-node hexahedral linear reduced-integration element C3D8R [27]. A two-node spatial linear beam element, B31, is used to simulate the vertical reinforcement at the prefabricated joint. The element can simulate shear deformation and can accurately simulate the bending of longitudinally connected steel bars within a certain range around the joint, thereby generating horizontal shear force on the longitudinally connected steel bar section. The rest of the reinforcement is simulated by the space truss element T3D2, which only bears the axial tensile and compressive loads and does not bear the bending moment and the lateral load in the vertical direction. A finite element analysis model of a 1/2-scale two-story spatial structure specimen of the prefabricated ECC/RC combined shear wall whose dimensions are consistent with the test member is established [22], as shown in Figure 2. Figure 2a is the finite element model of the specimen, and ECCs are used in the cast-in-place beam-to-wall joints and the upper regions of the composite coupling beams. Figure 2b shows the steel cage of the spatial structure specimen model.
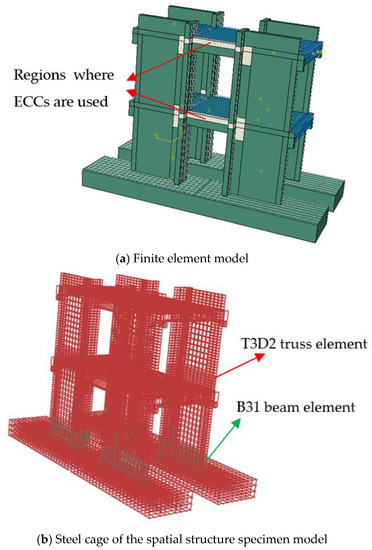
Figure 2.
Finite element analysis model of the 1/2-scale two-story spatial structure specimen of the prefabricated ECC/RC combined shear wall.
2.3. Simulation Method of Prefabricated Joint
The prefabricated joint is the weak part of the prefabricated component. Under the action of an internal force, the contact surface of the concrete at the joint will prematurely bond and fail, forming a straight crack that runs through the entire section. The internal force distribution of the concrete and longitudinal connecting steel bars at the joint position is more complicated due to the horizontal relative slippage of the interface and the vertical opening displacement of the jointed joint after penetration. The main interaction internal forces of the contact surface of prefabricated joints include the horizontal friction effect and vertical compression force of concrete or ECC, interfacial force between steel bar and concrete (or ECC), shear effect of steel pin and key, and tension and compression effect of steel bars. Therefore, the numerical simulation of prefabricated joints needs to reflect the above interaction forces.
2.3.1. Horizontal Friction and Vertical Compression between Concrete and Concrete and between Concrete and ECC
ABAQUS general finite element software provides a variety of interface contact elements, which can easily and quickly simulate the horizontal friction and vertical extrusion between different components. When ABAQUS performs solid element calculations, surface-to-surface contact elements are usually used to simulate the contact mechanics between different components. The mechanical simulation of the contact surface is realized by parameter setting of normal behavior and tangential behavior. In this paper, the contact between the wall pier and the base, the precast concrete part of the composite coupling beam and the cast-in-place ECC part, and the composite coupling beam and the wall pier are all simulated by surface-to-surface contact. The normal direction adopts the “hard” contact that allows the contact to be disengaged again, the tangential direction adopts the “penalty” friction contact, and the friction coefficient is taken as 0.4 [28].
2.3.2. Interfacial Bonding between Steel and Concrete, Steel and ECC
For steel reinforcement in the non-joint position, the interface slip between the steel reinforcement and the concrete is very small under the action of an external force, which is usually negligible. When modelling, a separate model is used, the steel reinforcement and concrete are treated as different units, and the steel reinforcement works together with the concrete through the “built-in area” method. The deformation between the steel reinforcement and the ECC is coordinated, and the tangential slip is smaller, so the relationship between the steel reinforcement and the ECC is also handled by the “built-in area”. For the joint area, the effective transmission of the longitudinal internal force of the steel reinforcement can be achieved through the sleeve connection [29]. The relative slip between the longitudinally connecting steel reinforcement and concrete is almost zero [30]. Therefore, the numerical simulation of the cohesion and compressive forces between the longitudinally connecting steel reinforcement and concrete is also achieved by using the “built-in area” contact in the finite element.
2.3.3. The Pin-Cut Key Effect and Tension-Compression Effect of Longitudinally Connecting Steel Reinforcement
The horizontal relative slippage and vertical opening displacement of the fabricated splices cause the pin-cut key action and the axial tension (compression) action of the longitudinally connected steel reinforcement, respectively. The pin-cut key action of the steel reinforcement can make the longitudinal connecting steel reinforcement bend within a certain range around the joint, thereby generating horizontal shear force on the longitudinal connecting steel reinforcement section and reducing the axial tensile (compressive) strength of the longitudinal connecting steel reinforcement. Therefore, the simulation of prefabricated joints needs to be able to reflect the adverse effects of steel reinforcement pin-cut key action on the tensile and compressive strength of steel reinforcement. The beam element belongs to the rod element and can be used to simulate the axial tension, compression, bending, and shearing of the rod. Due to the obvious bending and shearing effect of the pin-cut key on the longitudinal connecting steel reinforcement at the prefabricated joints, the longitudinal connecting steel reinforcement is simulated by using B31 beam elements.
2.4. Boundary Conditions and Loading Methods
The accurate simulation of boundary conditions is the premise to ensure the reliability of finite element calculation results. The lower end face of the base of the specimen is anchored with a fixed end, which is consistent with the experimental conditions. The vertical load of the numerical simulation space structure is calculated according to the axial compression ratio, converted into a uniform load, and applied to the loading beams (Figure 3). The horizontal load adopts the form of low reversed cyclic loading, which is realized by force–displacement loading introduced by the “Specification for seismic test of buildings” (JGJ/T 101-2015) [31]. At the initial stage of loading, the force loading method is adopted, and the force gradually increases according to the amplitude. Each stage is loaded with one cycle, and the size is a multiple of 50 kN. After the yield displacement is reached, displacement loading is used instead. The displacement loading is carried out with the amplitude loading according to the integer multiple of the yield displacement, and three cycles are performed for each stage until the specimen reaches the failure state. Figure 4 shows the simulation of the cyclic loading history. Py and Δy represent yield load and yield displacement, respectively. A reference point, RP, is set at the top center of the spatial structure model, the reference point is connected with all nodes on the loading beam surface at the near end and the far end by “coupling” (Figure 5), and the horizontal force and horizontal displacement are applied at the reference point, RP (Figure 6).
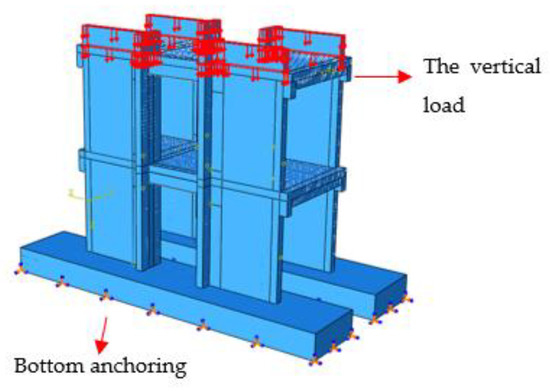
Figure 3.
Boundary conditions and vertical loads.
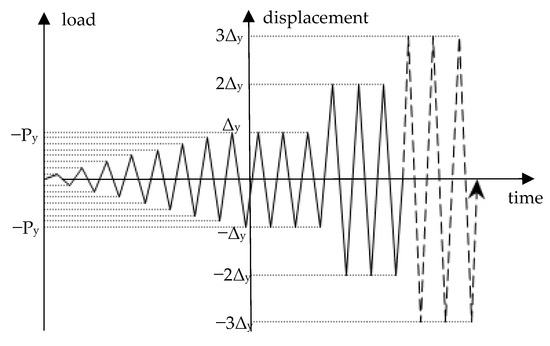
Figure 4.
Simulation of cyclic loading history.
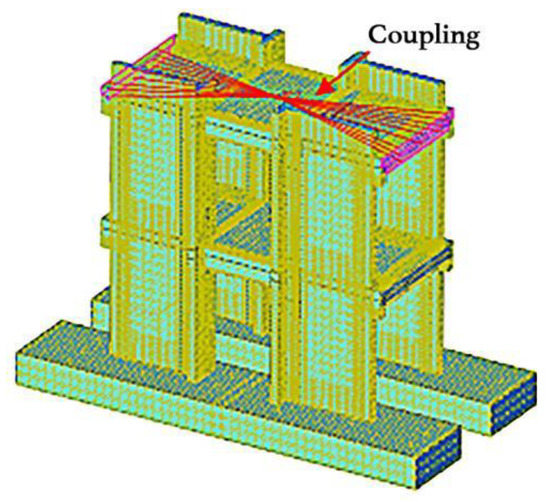
Figure 5.
Near-end and far-end loading surface coupling.
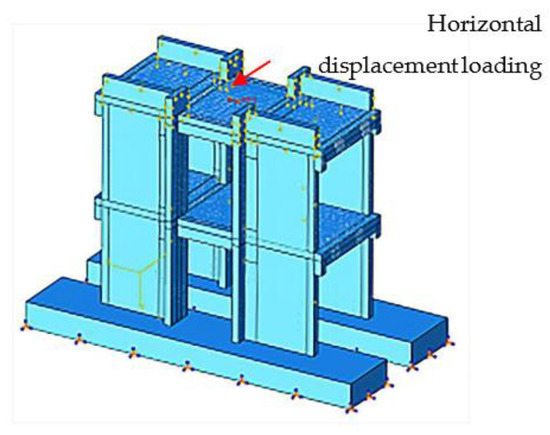
Figure 6.
Low cycle repeated horizontal displacement loading.
2.5. Meshing and Analytical Calculations
The mesh division has a direct impact on the accuracy of the finite element calculation. The swept mesh method is mainly used to divide the model. The cutting surface is set during mesh generation to make the mesh generation more regular. The mesh size of all elements, such as steel bars, wall piers, coupling beams, floor slabs, loading beams, and bases, is taken as 0.05 m. The grid of the spatial structure model is shown in Figure 7.
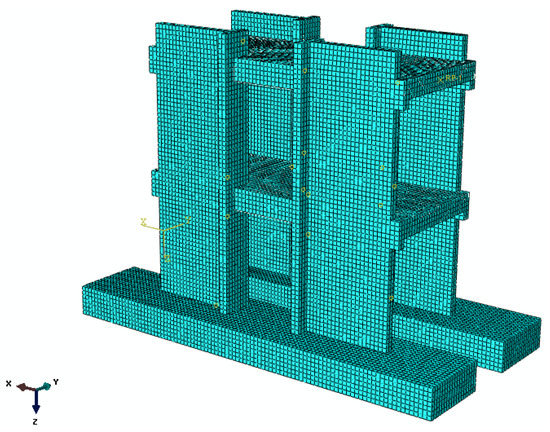
Figure 7.
Finite element model meshing.
Two analysis steps are set in the model calculation. In the first step, the base is set to a fixed end. The contact relationship between components is set. Vertical loads are applied. In the second step, the displacement outside the two side faces of the loading beam parallel to the wall surface is limited to prevent the wall from losing stability during the loading process. Then, horizontal loads are applied.
The Newton–Raphson method decomposes the analysis step into several incremental steps, and the load is gradually applied to the test piece in the form of increments. In each load increment step, the software will carry out a series of iterations. In each iteration, the modified stiffness matrix obtained from the last iteration is used for calculation, and the calculation results are continuously modified until the balance equation is satisfied, so the software has good convergence. In this paper, the Newton–Raphson method is used for iterative calculation. When the convergence of the finite element calculation results is difficult or the calculation efficiency is very low, it can be adjusted by reducing the initial step size and the minimum incremental step of the analysis step.
2.6. Introduction of Damage Criterion
The damage criterion used in the finite element ABAQUS analysis in this paper is based on the plastic damage principle proposed by Zhang Jin et al. [24]. The deterioration of the mechanical properties of concrete and ECC under cyclic loading is reflected by the value of the damage factor. The compressive and tensile damage of concrete and ECC materials are reflected by the compressive damage factor and tensile damage factor, respectively. The range of the damage factor is 0~1, and the larger the value is, the greater the damage. The crack distribution of the concrete and ECC in ABAQUS is reflected by the tensile damage factor. The closer the damage factor is to 1.0, the more serious the damage to the concrete or ECC is.
2.7. Comparison of Calculation Results and Experimental Results
The yield load and yield displacement were obtained by unidirectional pushover loading on the two-story spatial structure specimen of the prefabricated ECC/RC combined shear wall. After that, low-cycle repeated loading is carried out, and the load–displacement hysteresis curve of the numerical simulation and test measurement [22] can be obtained, as shown in Figure 8. The load–displacement skeleton curve is obtained, as shown in Figure 9. Figure 8 and Figure 9 show that the load–displacement hysteresis curve and the load–displacement skeleton curve of the numerical simulation of the specimen are approximately consistent with the experimental test results. However, the finite element method shows a slightly stiffer rigidity and a lower displacement. The reason for this is that the finite element calculation method uses the finite degree of freedom to approximate the infinite degree of freedom in the real structure. The finite element solution is equivalent to making the structure deform according to the given shape function. Compared with the real situation, the constraints are increased in the finite element simulation, so the stiffness is larger than the real solution. Correspondingly, the displacement is a little smaller.
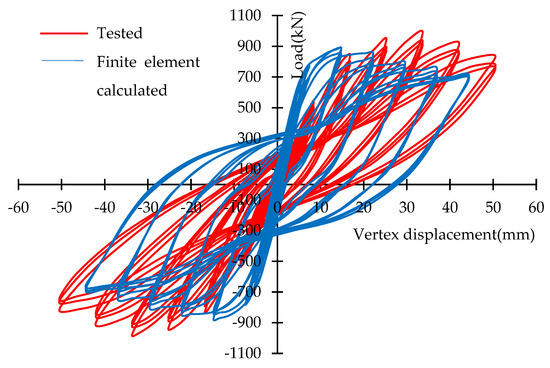
Figure 8.
Load–displacement hysteresis curves.
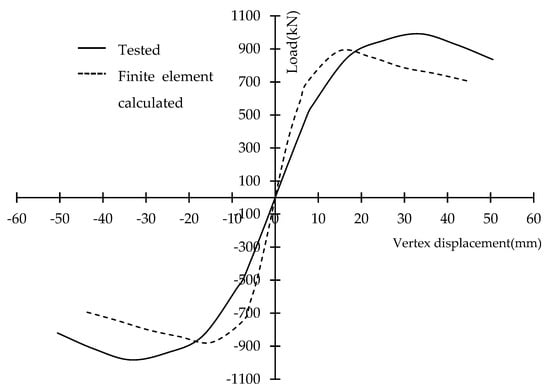
Figure 9.
Load–displacement skeleton curves.
Figure 10 is the comparison of experimentally measured cracks and finite element simulation cracks of the spatial structure specimen of the prefabricated ECC/RC combined shear wall. Figure 10 shows that the webs are mainly flexural shear diagonal cracks, and the flanges are mainly horizontal bending cracks. The crack pattern simulated by the finite element model is approximately consistent with the actual crack pattern.
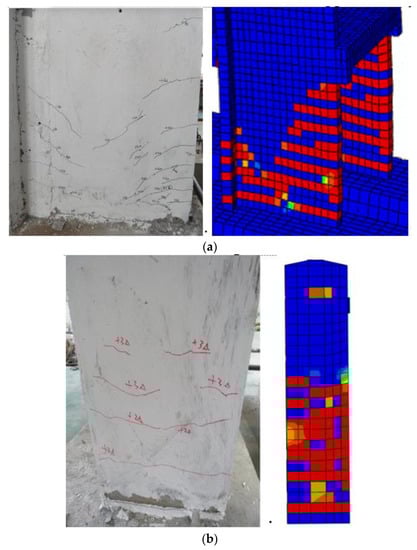
Figure 10.
Comparison of experimentally measured cracks and finite element simulation cracks. (a) Experimentally measured cracks and finite element simulation cracks of the web; (b) Experimentally measured cracks and finite element simulation cracks of the flange.
The comparison between the experimental and numerical simulation results of the load–displacement curves and the cracking morphology verifies the correctness of the numerical simulation method.
3. Analysis of the Stress and Damage Mechanism
Based on the verification of the numerical simulation method in the previous section, a detailed whole process analysis is carried out, including the stress distribution of the concrete and ECC, compression damage of the concrete and ECC, crack distribution of the concrete and ECC, stress distribution of the steel bars, and structural and fabricated joint displacement.
3.1. Stress Distribution of Concrete and ECC
Figure 11 shows the stress distribution of the concrete and ECC of the spatial structure specimen of the prefabricated ECC/RC combined shear wall calculated by finite element under the peak load. It can be concluded from Figure 11 that the internal force distribution of the wall piers is a bending-shear distribution under low cyclic loading. The bottom bending moment is larger, and the concrete in the compression area bears a larger compressive stress. The stress distribution in the compression zone of the flange walls is relatively uniform, and the stress concentration occurs in the compression zones at the edges of the webs. The main reason for this is that the area of the compression zone at the edge of the T-section web is small, the pressure diffusion zone is small, and the phenomenon of stress concentration occurs. It is predicted that if the ECC material with better deformation performance is used in the compression zones of the web edges, the damage to the wall piers will be reduced.
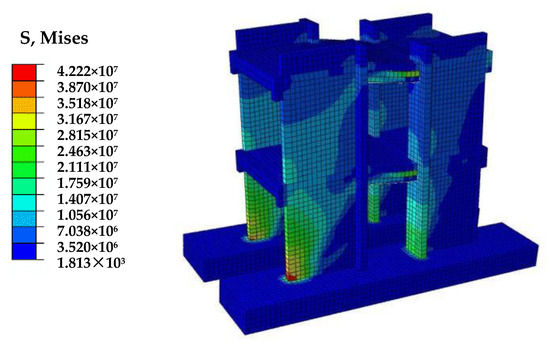
Figure 11.
Stress distribution of spatial structure specimen of the prefabricated ECC/RC combined shear wall.
Figure 12 shows the stress distribution of one of the composite coupling beams. The stress of the precast concrete of the superimposed coupling beam is larger than that of the cast-in-place layer ECC, and the stress concentration appears in the end region, while the ECC stress distribution is relatively uniform.
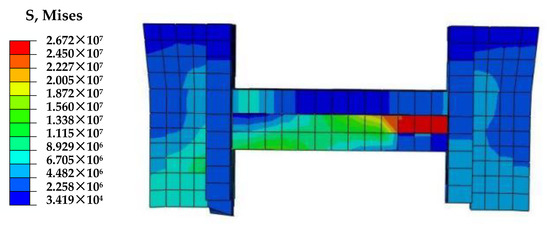
Figure 12.
Stress distribution of composite coupling beam.
3.2. Compression Damage of Concrete and ECC
The compressive damage factor can reflect the compressive failure of concrete and ECC materials in the spatial structure specimen of the prefabricated ECC/RC combined shear wall. Figure 13 shows the compressive damage distribution of the concrete and ECC when the specimen is subjected to low-cycle repeated loads in the yield state, peak state, and failure state. With continuous loading, the compressive damage factor increases, and the damage factor is the largest at the bottom of the web compression wall near the edge. In the final failure state, the damage factor at the bottom of the web is greater than 0.9, and the damage is serious. Due to the large cross-sectional area of the flange, the stress distribution is relatively uniform, and no major damage occurs, so the damage factor at the flange is very small. From the distribution law of damage factors, it can be predicted that if ECC material with better ductility is used in the bottom areas of the webs instead of concrete, the damage to the webs will be significantly reduced.
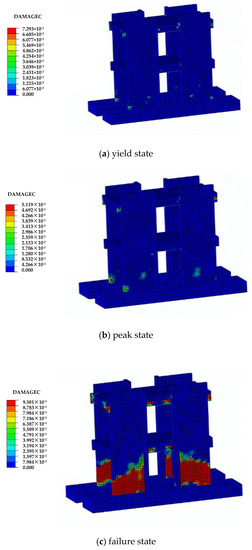
Figure 13.
Compressive damage distribution of the prefabricated ECC/RC combined shear wall.
3.3. Crack Distribution of Concrete and ECC
As mentioned in Section 2.6, the crack distribution of the concrete and ECC in ABAQUS is reflected by the tensile damage factor. The closer the damage factor is to 1.0, the more serious the damage to the concrete or ECC is. Figure 14 shows the distribution and variation of the tensile damage factor of the spatial structure specimen of the prefabricated ECC/RC combined shear wall in the initial crack state, yield state, peak state, and final failure state.
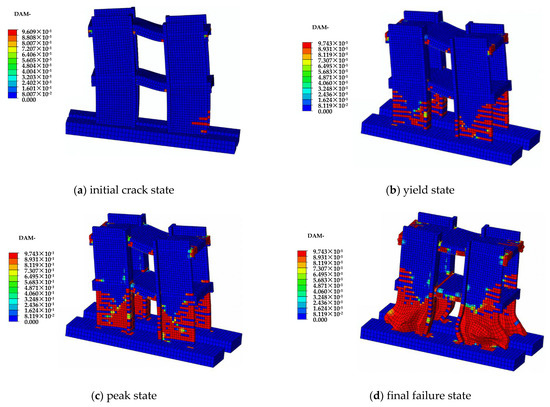
Figure 14.
Crack distribution of the prefabricated ECC/RC combined shear wall.
Figure 14 shows that cracks first appeared in the precast concrete part at the end of the superimposed coupling beam and the bottom of the tension web wall pier. The cracks of the superimposed coupling beams are vertical, and the cracks of the web wall piers are horizontal, all of which are flexural cracks. With continuous loading, the damage factor in the coupling beam increases, and the damage spreads to the middle. The cracks of the web wall pier gradually appeared from the bottom to the upper part. Before the yield state, the horizontal cracks were the main cracks, and then the horizontal cracks gradually developed obliquely downwards to the inside of the web. The original cracks became longer in length and larger in width (the damage factor became larger). The flange wall also has cracks from bottom to top, mainly horizontal cracks caused by bending. The bottom bending moment of the space structure is large, and the tensile stress caused by the bending moment is large, so the wall piers in the tension zone are gradually cracked from bottom to top. When the structure is finally damaged, the coupling beams, webs, and flanges are seriously damaged, indicating that the performance of all prefabricated components is fully exerted.
3.4. Stress Distribution of the Steel Bars
Figure 15 shows the von Mises stress nephogram of the steel bars in the spatial structure specimen of the prefabricated ECC/RC combined shear wall at the yield state and the failure state. From Figure 15, we can see that the steel bars reach yield at 538.4 MPa, and the maximum stress reaches 598.8 MPa in the failure state. The areas with high reinforcement stress are the tension area and the compression area of the first floor walls and the end of the coupling beams due to the large bending moments or shear forces subjected.
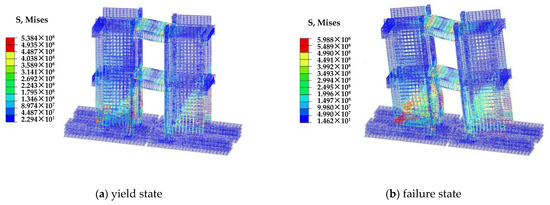
Figure 15.
Stress distribution of the steel bars in the spatial structure specimen of the prefabricated ECC/RC combined shear wall.
3.5. Structural and Fabricated Joint Displacement
Figure 16 shows the horizontal displacement (U1) of the spatial structure specimen of the fabricated ECC/RC combined shear wall in the yield state and failure state simulated by the finite element. We can see that the displacement at the top of the structure specimen is the largest and decreases as it decreases. The vertex displacement at the loading beam is approximately 7.4 mm when the prefabricated ECC/RC combined shear wall yields, and the vertex displacement is approximately 44.4 mm when it fails.
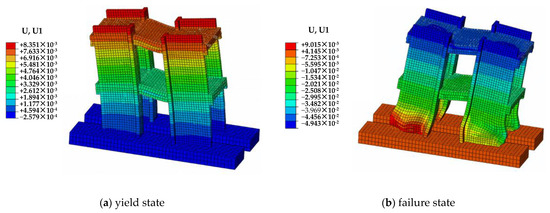
Figure 16.
Horizontal displacement of the spatial structure specimen of the fabricated ECC/RC combined shear wall.
The vertical opening displacement of the contact surface between the wall pier and the base of the fabricated ECC/RC combined shear wall simulated by the finite element is shown in Figure 17. When the wall pier is in tension, the vertical opening displacement reaches 15.49 mm, which can be seen in the data of U3 in the dark blue figure of Figure 17. Of course, the unit of measurement in the figure is meters. This indicates that slip failure along the contact surface will occur at this same position, which is consistent with the damage measured in the test (Figure 18).
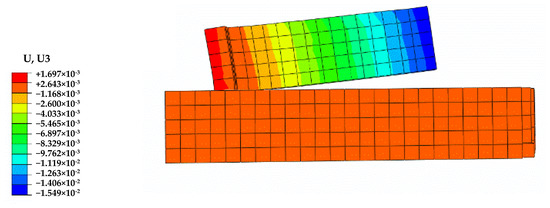
Figure 17.
Vertical opening displacement of the contact surface between the wall pier and the base of the fabricated ECC/RC combined shear wall.
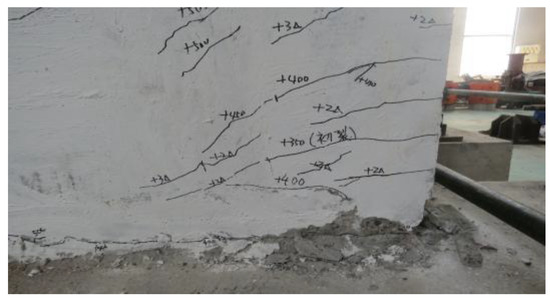
Figure 18.
The damage of the contact surface between the wall pier and the base measured in the test.
4. Seismic Energy Dissipation Performance Optimization
As the 1/2-scale two-story spatial structure specimen of a prefabricated ECC/RC combined shear wall analyzed above is taken from the actual project, it is of great significance to study the energy dissipation capacity of the specimen. From the above stress and damage analysis, it can be speculated that the use of ECC materials at the bottom of the prefabricated ECC/RC combined shear wall can reduce the damage and improve the energy dissipation performance. However, the question is, what is the best range to use ECC materials in the bottom of the wall to balance the higher cost and better seismic energy dissipation capacity? Now, we will change the ranges of the use of ECCs at the bottom of the wall and study their seismic energy dissipation capacity to answer this question.
4.1. Parameter Value
Due to the high cost of ECC, it is not economical to use full ECC shear walls. It is necessary to quantitatively analyze the influence of the use range of ECC in the bottom walls on the seismic energy dissipation performance of the prefabricated ECC/RC composite-coupled shear walls. The variation parameters of the use area of ECC in the bottom of the walls are shown in Table 1. Other unspecified parameters are the same.

Table 1.
The variation parameters of the use area of ECC in the bottom of the walls.
4.2. Load–Displacement Hysteresis Curves under Low Cyclic Loading
The load–displacement hysteretic curves of the 1/2-scale two-story spatial structure specimens under low cyclic loading when ECC is applied at different heights of the bottom of the walls are shown in Figure 19. Figure 19a–e correspond to specimens 1–5, and the height of the ECC in the bottom wall limb is 0~800 mm. With increasing ECC height, the load–displacement hysteresis curves tend to be fuller, but the increase in fullness gradually decreases.
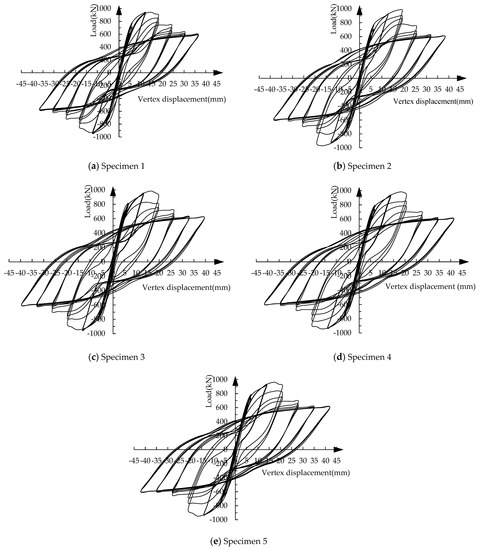
Figure 19.
Load–displacement hysteresis curves under low cyclic loading.
4.3. Seismic Energy Dissipation Capacity with Different Ranges of ECC
Under low cyclic loading, the energy dissipation capacity can be measured by the area surrounded by the hysteresis loop. Based on the load–displacement hysteresis curve obtained by finite element simulation, the approximate integral method is used to calculate the single-cycle energy dissipation value when completing a hysteresis loop. After that, the cumulative energy dissipation value is calculated in turn to evaluate the energy dissipation performance. Because the specimen is basically in the elastic stage during the force loading stage, the energy dissipation value is very small. This calculation starts from the displacement loading stage. The one-cycle and cumulative energy dissipation values of the specimens when ECCs are applied in different areas of the bottom of the walls are shown in Table 2. In the table, Δ represents the yield displacement.
Table 2.
Single cycle/cumulative energy dissipation of specimens (J).
From Table 2, it can be seen that in the first cycle of the first displacement loading, the single cycle energy consumption value of the specimen is Specimen 1 > Specimen 2. The main reason for this is that the specimen has just yielded, and the small content of ECC (200 mm) has not fully reflected the delay effect of yielding. The stiffness of the specimen at this stage plays a major role in energy dissipation. The energy dissipation capacity of Specimen 1 is greater than that of Specimen 2 because the stiffness of concrete is greater than that of ECC. Specimen 2 < Specimen 3, indicating that with the increase in ECC content (400 mm), the yield displacement increases greatly, and the contribution of the increase in yield displacement to the energy dissipation is greater than the contribution of the elastic modulus of concrete. Specimen 3 > Specimen 4 > Specimen 5, indicating that after the ECC content increases again (600~800 mm), the contribution of the increase in the structural yield displacement to the structural energy consumption is less than the contribution of the decrease in the structural stiffness to the structural energy consumption. However, with continuous loading, for the single cycle energy consumption value and cumulative energy consumption value, Specimen 5 > Specimen 4 > Specimen 3 > Specimen 2 > Specimen 1, indicating that as the amount of ECC in the wall increases (0~800 mm), the energy consumption capacity continues to increase.
The calculation shows that when the specimen is loaded at the end of 6Δ, the cumulative energy dissipation values of Specimen 1–Specimen 5 are 343,860.7, 380,645.6, 414,415.9, 426,352.3, and 431,535.6 J, respectively. Compared with Specimen 1, the cumulative energy consumption of Specimens 2–5 increased by 10.7, 20.5, 23.9, and 25.5%, respectively. When the height of the ECC at the bottom of the wall is 400 mm, the increase in the cumulative energy consumption value is more than 20% higher than that of the specimen without ECC at the bottom of the wall. As the height of the ECC continues to increase, the cumulative energy consumption value still increases, but the increase rate decreases. For example, compared with Specimen 2, the energy consumption of Specimen 3 only increased by 8.9%, while compared with Specimen 1, Specimen 2 increased by 20.5%.
With continuous loading, the damage of the specimen continues to accumulate, and the specimen continues to dissipate the input energy. To better evaluate the energy dissipation capacity, the energy dissipation coefficient, e, is introduced [31]. The calculation expression of e is:
In the formula, —Sum of the area surrounded by hysteresis curve; —Sum of the area of two corresponding triangles. Figure 20 shows the calculation diagram.
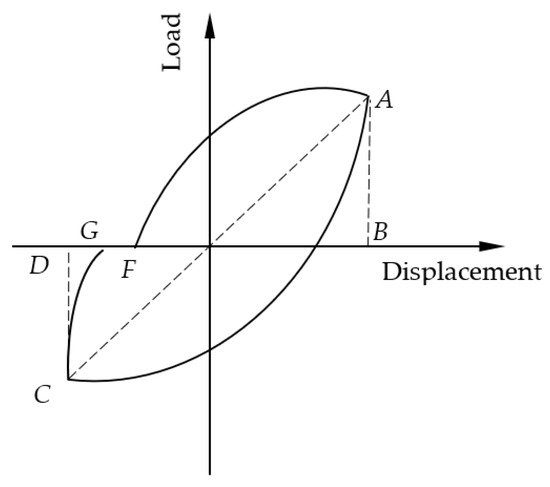
Figure 20.
The hysteretic curve energy dissipation coefficient calculation diagram.
Table 3 shows the energy dissipation coefficients, e (the following abbreviations e), of the five specimens at the yield and peak points. The e at the peak point is greater than that at the yield point, indicating that the energy dissipation capacity is enhanced after yielding. Comparing the e of the five specimens, it can be seen that the e at both the yield point and the peak point are the largest in Specimen 3. The e of the five specimens at the peak point is Specimen 3 > Specimen 5 > Specimen 4 > Specimen 2 > Specimen 1.
Table 3.
Energy dissipation coefficients of the five specimens.
The energy dissipation performance of the specimen is the best when the height of the ECC is 400 mm. The reason for this is that ECC has high ductility and strong tensile, compressive, and shear deformation resistance, but its stiffness is smaller than that of concrete, and the energy dissipation performance is determined by the stiffness, bearing capacity, and deformation capacity of the specimen. Considering the energy dissipation capacity and price factors, when the ECC height of the bottom walls is 400 mm, the energy dissipation performance of the specimen reaches an optimal value.
5. Conclusions
In this paper, the stress mechanism and energy dissipation performance optimization of prefabricated ECC/RC combined shear walls under low cyclic loading was studied. The following conclusions are derived:
The comparison between the experimental and numerical simulation results of the load–displacement curves and the cracking morphology verifies the correctness of the numerical simulation method.
The stress concentration occurs in the compression zones at the edges of the webs, and the damages are the largest at the bottom of the web compression walls near the edges. The wall piers in the tension zone are gradually cracked from bottom to top, and the bottom wall piers are the most severely damaged when the final failure occurs. The areas with high reinforcement stress are the tension area and the compression area of the first floor walls and the end of the coupling beams.
The vertex displacement at the loading beam is approximately 7.4 mm when the prefabricated ECC/RC combined shear wall yields, and the vertex displacement is approximately 44.4 mm when it fails. When the wall pier is in tension, the vertical opening displacement of the contact surface between the web and the base reaches a large value.
When the ECC height of the bottom walls is 400 mm, the energy dissipation performance of the prefabricated ECC/RC combined shear wall structure reaches an optimal value.
Based on the stress and damage mechanism, this paper optimized the seismic energy dissipation performance of different ECC usage ranges in the plastic hinge area at the bottom of the wall. In addition, the factors that affect the seismic energy dissipation performance of the prefabricated ECC/RC combined shear wall structure are the reinforcement ratio, steel strength, ECC strength, etc. The influence degree of these factors has not been studied in this paper. In future research, we will perform this work to further improve the seismic energy dissipation performance of this new structural system.
Author Contributions
Conceptualization, J.Y. and G.Y.; Software, L.J.; Validation, L.J.; Formal analysis, J.Y.; Investigation, J.Y.; Resources, J.Y.; Data curation, J.Y.; Writing—original draft, J.Y.; Writing—review & editing, L.J.; Visualization, L.J.; Supervision, L.J.; Project administration, H.G. and G.Y.; Funding acquisition, J.Y. and H.G. All authors have read and agreed to the published version of the manuscript.
Funding
The research was funded by the “2022 Doctoral Research Startup Project of Shenzhen Institute of Information Technology” (Grant No. SZIIT2022KJ014), supported by “The Eighth Batch of Education and Teaching Reform Research Projects of Shenzhen Institute of Information Technology” (Grant No. 2021dbpjgyb25) and by “Guangdong Province Ordinary University Features Innovative Projects” (Grant No. 2020 ktscx300).
Institutional Review Board Statement
Not applicable.
Informed Consent Statement
Not applicable.
Data Availability Statement
No new data were created.
Conflicts of Interest
The authors declare no conflict of interest.
References
- Jang, J.; Han, S.W. Experiments of Diagonal Reinforced Concrete Coupling Beams under Quasi-static Cyclic Loading. J. Archit. Inst. Korea 2020, 36, 133–140. [Google Scholar]
- Park, W.S.; Kang, T.H.K.; Kim, S.; Yun, H.D. Seismic Performance of Moderately Short Concrete Coupling Beams with Various Reinforcements. ACI Struct. J. 2020, 117, 141–154. [Google Scholar]
- Zeng, H.Y.; Gitomarsono, J.; Kawatu, A.J.; Chan, W.T.; Chiu, S.C.; Cheng, M.Y. Cyclic Behavior of Short Reinforced Concrete Coupling Beams Confined by Steel Plates. ACI Struct. J. 2022, 119, 263–276. [Google Scholar]
- Li, V.C. Engineered cementitious composites (ECC) material, structural, and durability performance. In Concrete Construction Engineering Handbook; Nawy, E., Ed.; Chapter 24; CRC Press: Boca Raton, FL, USA, 2008; pp. 1–78. [Google Scholar]
- Yu, J.; Yao, J.; Lin, X.; Li, H.; Lam, J.Y.; Leung, C.K.; Shih, K. Tensile performance of sustainable Strain-Hardening Cementitious Composites with hybrid PVA and recycled PET fibers. Cem. Concr. Res. 2018, 107, 110–123. [Google Scholar] [CrossRef]
- Yu, K.Q.; Yu, J.T.; Dai, J.G.; Lu, Z.D.; Shah, S.P. Development of ultra-high performance engineered cementitious composites using polyethylene (PE) fibers. Constr. Build. Mater. 2018, 158, 217–227. [Google Scholar] [CrossRef]
- Abd Elmoaty, A.E.M.; Morsy, A.M.; Harraz, A.B. Effect of Fiber Type and Volume Fraction on Fiber Reinforced Concrete and Engineered Cementitious Composite Mechanical Properties. Buildings 2022, 12, 2108. [Google Scholar] [CrossRef]
- Abouhussien, A.A.; Hassan, A.A.; Ismail, M.K.; AbdelAleem, B.H. Evaluating the cracking behavior of ECC beam-column connections under cyclic loading by acoustic emission analysis. Constr. Build. Mater. 2019, 215, 958–968. [Google Scholar] [CrossRef]
- Hao, Z.; Lu, C.; Li, Z. Highly accurate and automatic semantic segmentation of multiple cracks in engineered cementitious composites (ECC) under dual pre-modification deep-learning strategy. Cem. Concr. Res. 2023, 165, 107066. [Google Scholar] [CrossRef]
- Huang, B.T.; Wu, J.Q.; Yu, J.; Dai, J.G.; Leung, C.K.; Li, V.C. Seawater sea-sand engineered/strain-hardening cementitious composites (ECC/SHCC): Assessment and modeling of crack characteristics. Cem. Concr. Res. 2021, 140, 106292. [Google Scholar] [CrossRef]
- Gu, D.; Pan, J.; Mustafa, S.; Huang, Y.; Luković, M. Shear transfer mechanism in reinforced engineered cementitious composite (ECC) beams: Quantification of Vs and Vc. Eng. Struct. 2022, 261, 114282. [Google Scholar] [CrossRef]
- Meng, D.; Lee, C.K.; Zhang, Y.X. Structural behavior of reinforced polyvinyl alcohol engineered cementitious composite (PVA-ECC) beams under static and fatigue loadings. In Advances in Engineered Cementitious Composites; Woodhead Publishing: Sawston, UK, 2022; pp. 161–208. [Google Scholar]
- Abbas, A.A.; Arna’Ot, F.H.; Abid, S.R.; Özakça, M. Flexural behavior of ECC hollow beams incorporating different synthetic fibers. Front. Struct. Civ. Eng. 2021, 15, 399–411. [Google Scholar] [CrossRef]
- Amiri, M.; Esfahani, M.R. Effect of using Engineered Cementitious Composites (ECC) on failure behavior of flat slab-column connections. Structures 2023, 47, 2397–2407. [Google Scholar] [CrossRef]
- Zhang, Z.; Qian, S.; Ma, H. Investigating mechanical properties and self-healing behavior of micro-cracked ECC with different volume of fly ash. Constr. Build. Mater. 2014, 52, 17–23. [Google Scholar] [CrossRef]
- Zhang, Z.Y.; Ding, R.; Fan, J.S.; Nie, X.; Zhang, J. Seismic performance and shear strength of coupling beams using engineered cementitious composites with different reinforcement layouts. Eng. Struct. 2020, 219, 110895. [Google Scholar] [CrossRef]
- Suryanto, B.; Tambusay, A.; Suprobo, P.; Bregoli, G.; Aitken, M.W. Seismic performance of exterior beam-column joints constructed with engineered cementitious composite: Comparison with ordinary and steel fibre reinforced concrete. Eng. Struct. 2022, 250, 113377. [Google Scholar] [CrossRef]
- Cai, J.; Pan, J.; Xu, L.; Li, G.; Ma, T. Mechanical behavior of RC and ECC/RC composite frames under reversed cyclic loading. J. Build. Eng. 2021, 35, 102036. [Google Scholar] [CrossRef]
- Khan, F.A.; Khan, S.W.; Khan, W. Seismic performance of RC-ECC composite frame by eliminating shear reinforcement in beam-column joint: Shake table tests. Adv. Struct. Eng. 2022, 25, 2966–2980. [Google Scholar] [CrossRef]
- Khan, F.A.; Rashid, M.; Khan, S.W.; Rizwan, M.; Badrashi, Y.I.; Fahim, M.; Gul, A. Comparative seismic performance assessment of RC and RC/ECC hybrid frame structures: A shake table study. Innov. Infrastruct. Solut. 2022, 7, 1–17. [Google Scholar] [CrossRef]
- Ye, B.; Wang, H.; Ma, Y.; Pan, P. Seismic performance of flexure-dominated reinforced-engineered cementitious composites coupled shear wall. Eng. Struct. 2022, 272, 114992. [Google Scholar] [CrossRef]
- Yang, J.; Liang, S.; Zhu, X.; Sun, C.; Guo, Z. Seismic behavior of precast concrete coupled shear walls with engineered cementitious composite (ECC) in the critical cast-in-place regions. Sci. China Technol. Sci. 2017, 60, 1244–1254. [Google Scholar] [CrossRef]
- GB 50010-2010; Code for Design of Concrete Structures (2015 Edition). China Architecture & Building Press: Beijing, China, 2015.
- Zhang, J.; Wang, Q.; Hu, S.; Wang, C. Parameters verification of concrete damaged plastic model of ABAQUS. Build. Struct. 2008, 38, 127–130. [Google Scholar]
- Yuan, F.; Pan, J.; Wu, Y. Numerical study on flexural behaviors of steel reinforced engineered cementitious composite (ECC) and ECC/concrete composite beams. Sci. China Technol. Sci. 2014, 57, 637–645. [Google Scholar] [CrossRef]
- Amrane, M.N.; Sidoroff, F. Residual modal energy evaluating of fatigue damaged composite structure. Mechanics 2011, 17, 45–49. [Google Scholar] [CrossRef]
- Kien, D.N.; Chen, X.; Zhuang, X.; Rabczuk, T. Radial Basis Function Based Finite Element Method for Bending, Vibration and Buckling Analysis of Laminated Composite Mindlin-Reissner Plates. In Advances in Engineering Research and Application, Proceedings of the International Conference on Engineering Research and Applications, ICERA 2022, Thai Nguyen, Vietnam, 1–2 December 2022; Springer International Publishing: Cham, Switzerland, 2023; pp. 806–822. [Google Scholar]
- Palieraki, V.; Vintzileou, E.; Silva, J.F. Behavior of RC interfaces subjected to shear: State-of-the art review. Constr. Build. Mater. 2021, 306, 124855. [Google Scholar] [CrossRef]
- Zhou, L.; Li, X.; Yan, Q. Performance of Grouting Sleeve-Connected Prefabricated Beams Subjected to Impact Loading. Buildings 2022, 12, 2146. [Google Scholar] [CrossRef]
- Hemamalini, S.; Vidjeapriya, R.; Jaya, K.P. Performance of Precast Shear Wall Connections Under Monotonic and Cyclic Loading: A State-of-the-Art Review. Iran. J. Sci. Technol. Trans. Civ. Eng. 2021, 45, 1307–1328. [Google Scholar] [CrossRef]
- JGJ/T 101-2015; Specification for Seismic Test of Buildings. China Architecture & Building Press: Beijing, China, 2015.


Disclaimer/Publisher’s Note: The statements, opinions and data contained in all publications are solely those of the individual author(s) and contributor(s) and not of MDPI and/or the editor(s). MDPI and/or the editor(s) disclaim responsibility for any injury to people or property resulting from any ideas, methods, instructions or products referred to in the content. |
© 2023 by the authors. Licensee MDPI, Basel, Switzerland. This article is an open access article distributed under the terms and conditions of the Creative Commons Attribution (CC BY) license (https://creativecommons.org/licenses/by/4.0/).