
Experimental Study and Damping Effect Analysis of a New Tuned Liquid Damper Based on Karman Vortex Street Theory


Abstract
:1. Introduction
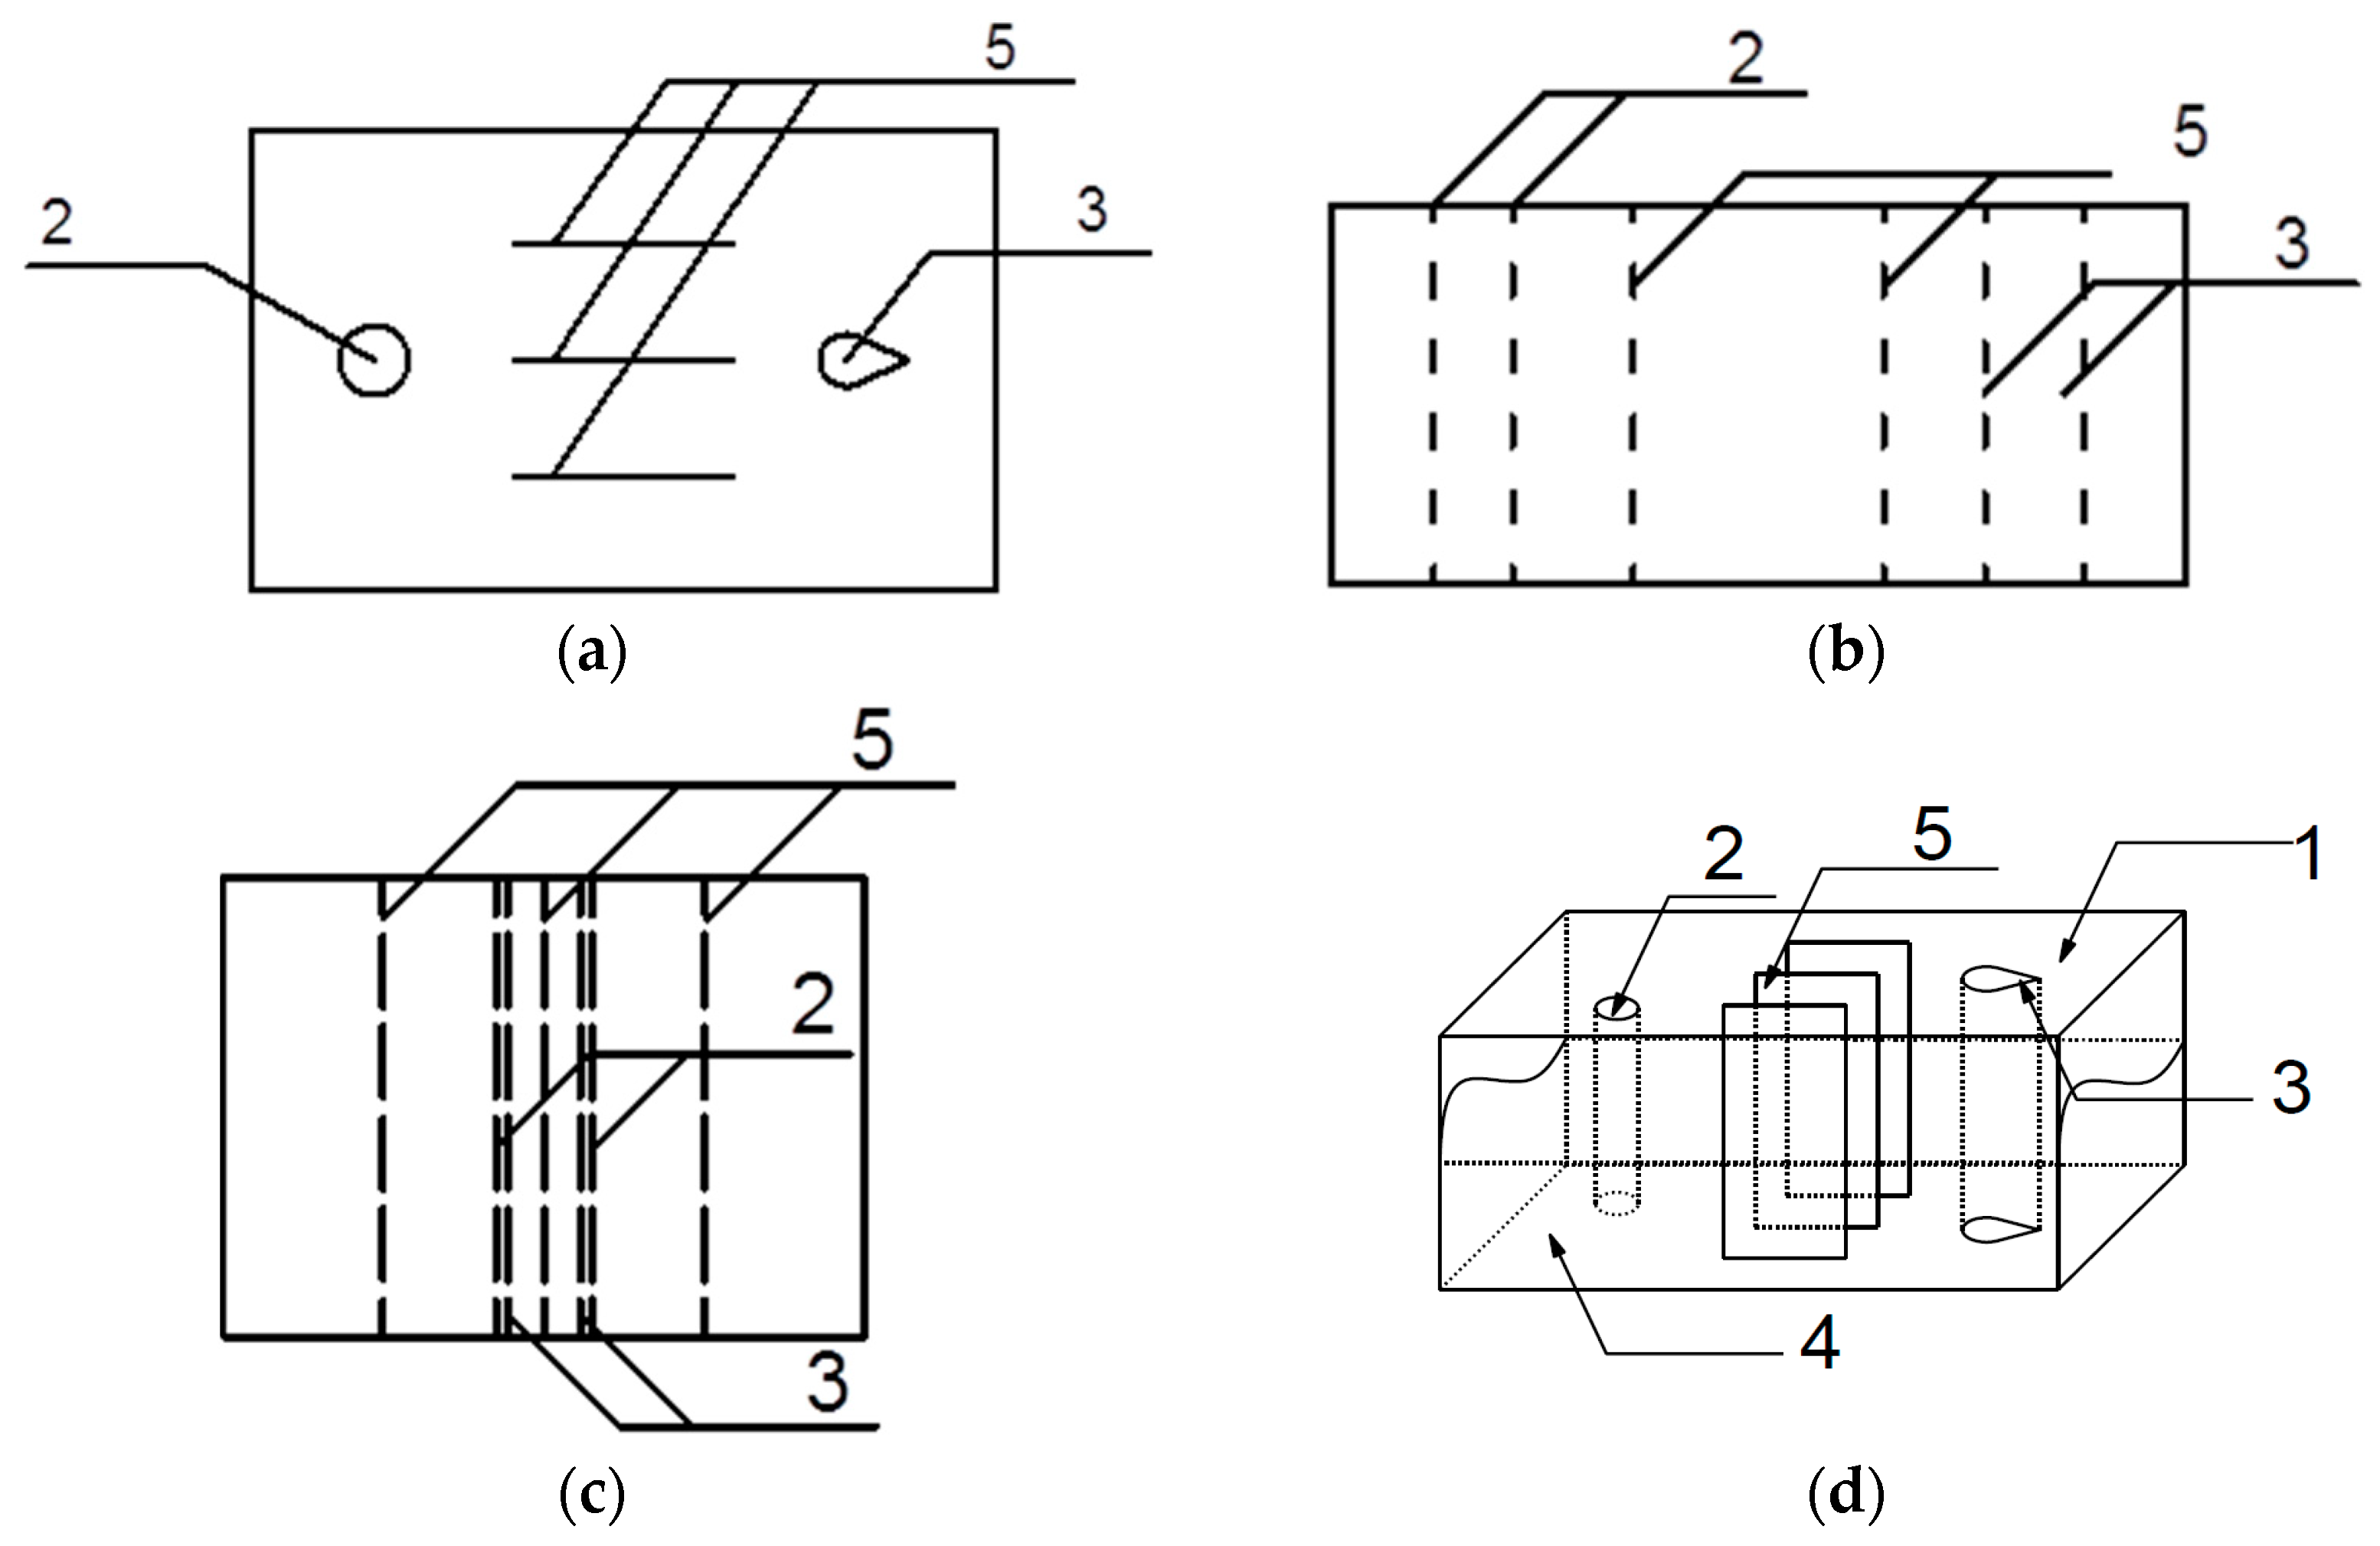
2. Design of KV-TLD
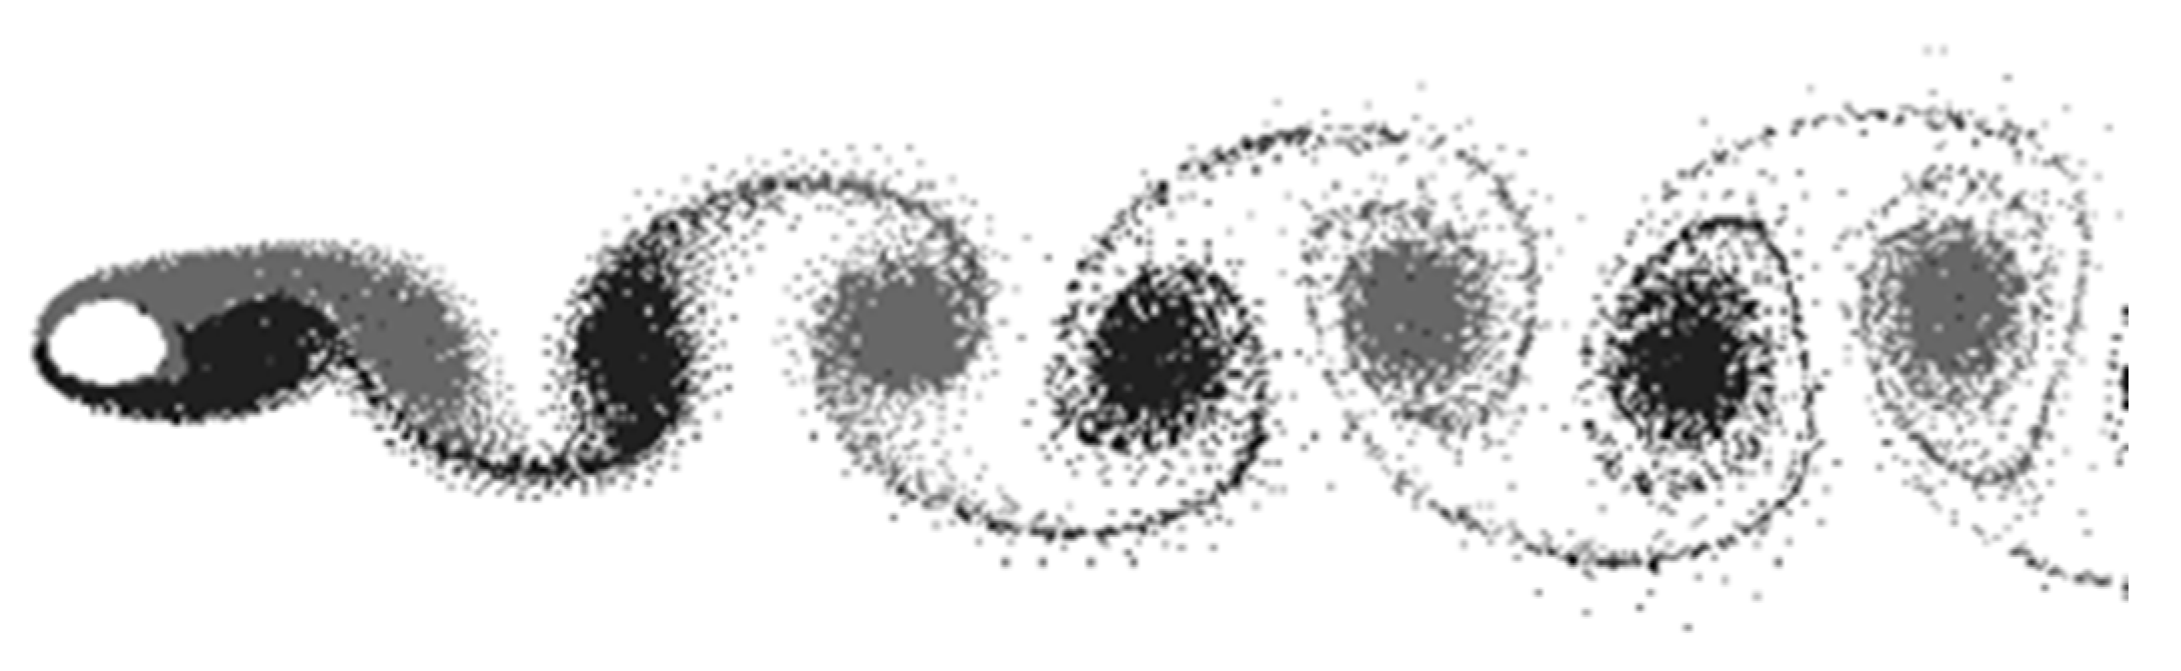
2.1. Basic Information about Karman Vortex Street
2.2. Design of KV-TLD
3. Experiment and Performance Analysis
3.1. Experiment
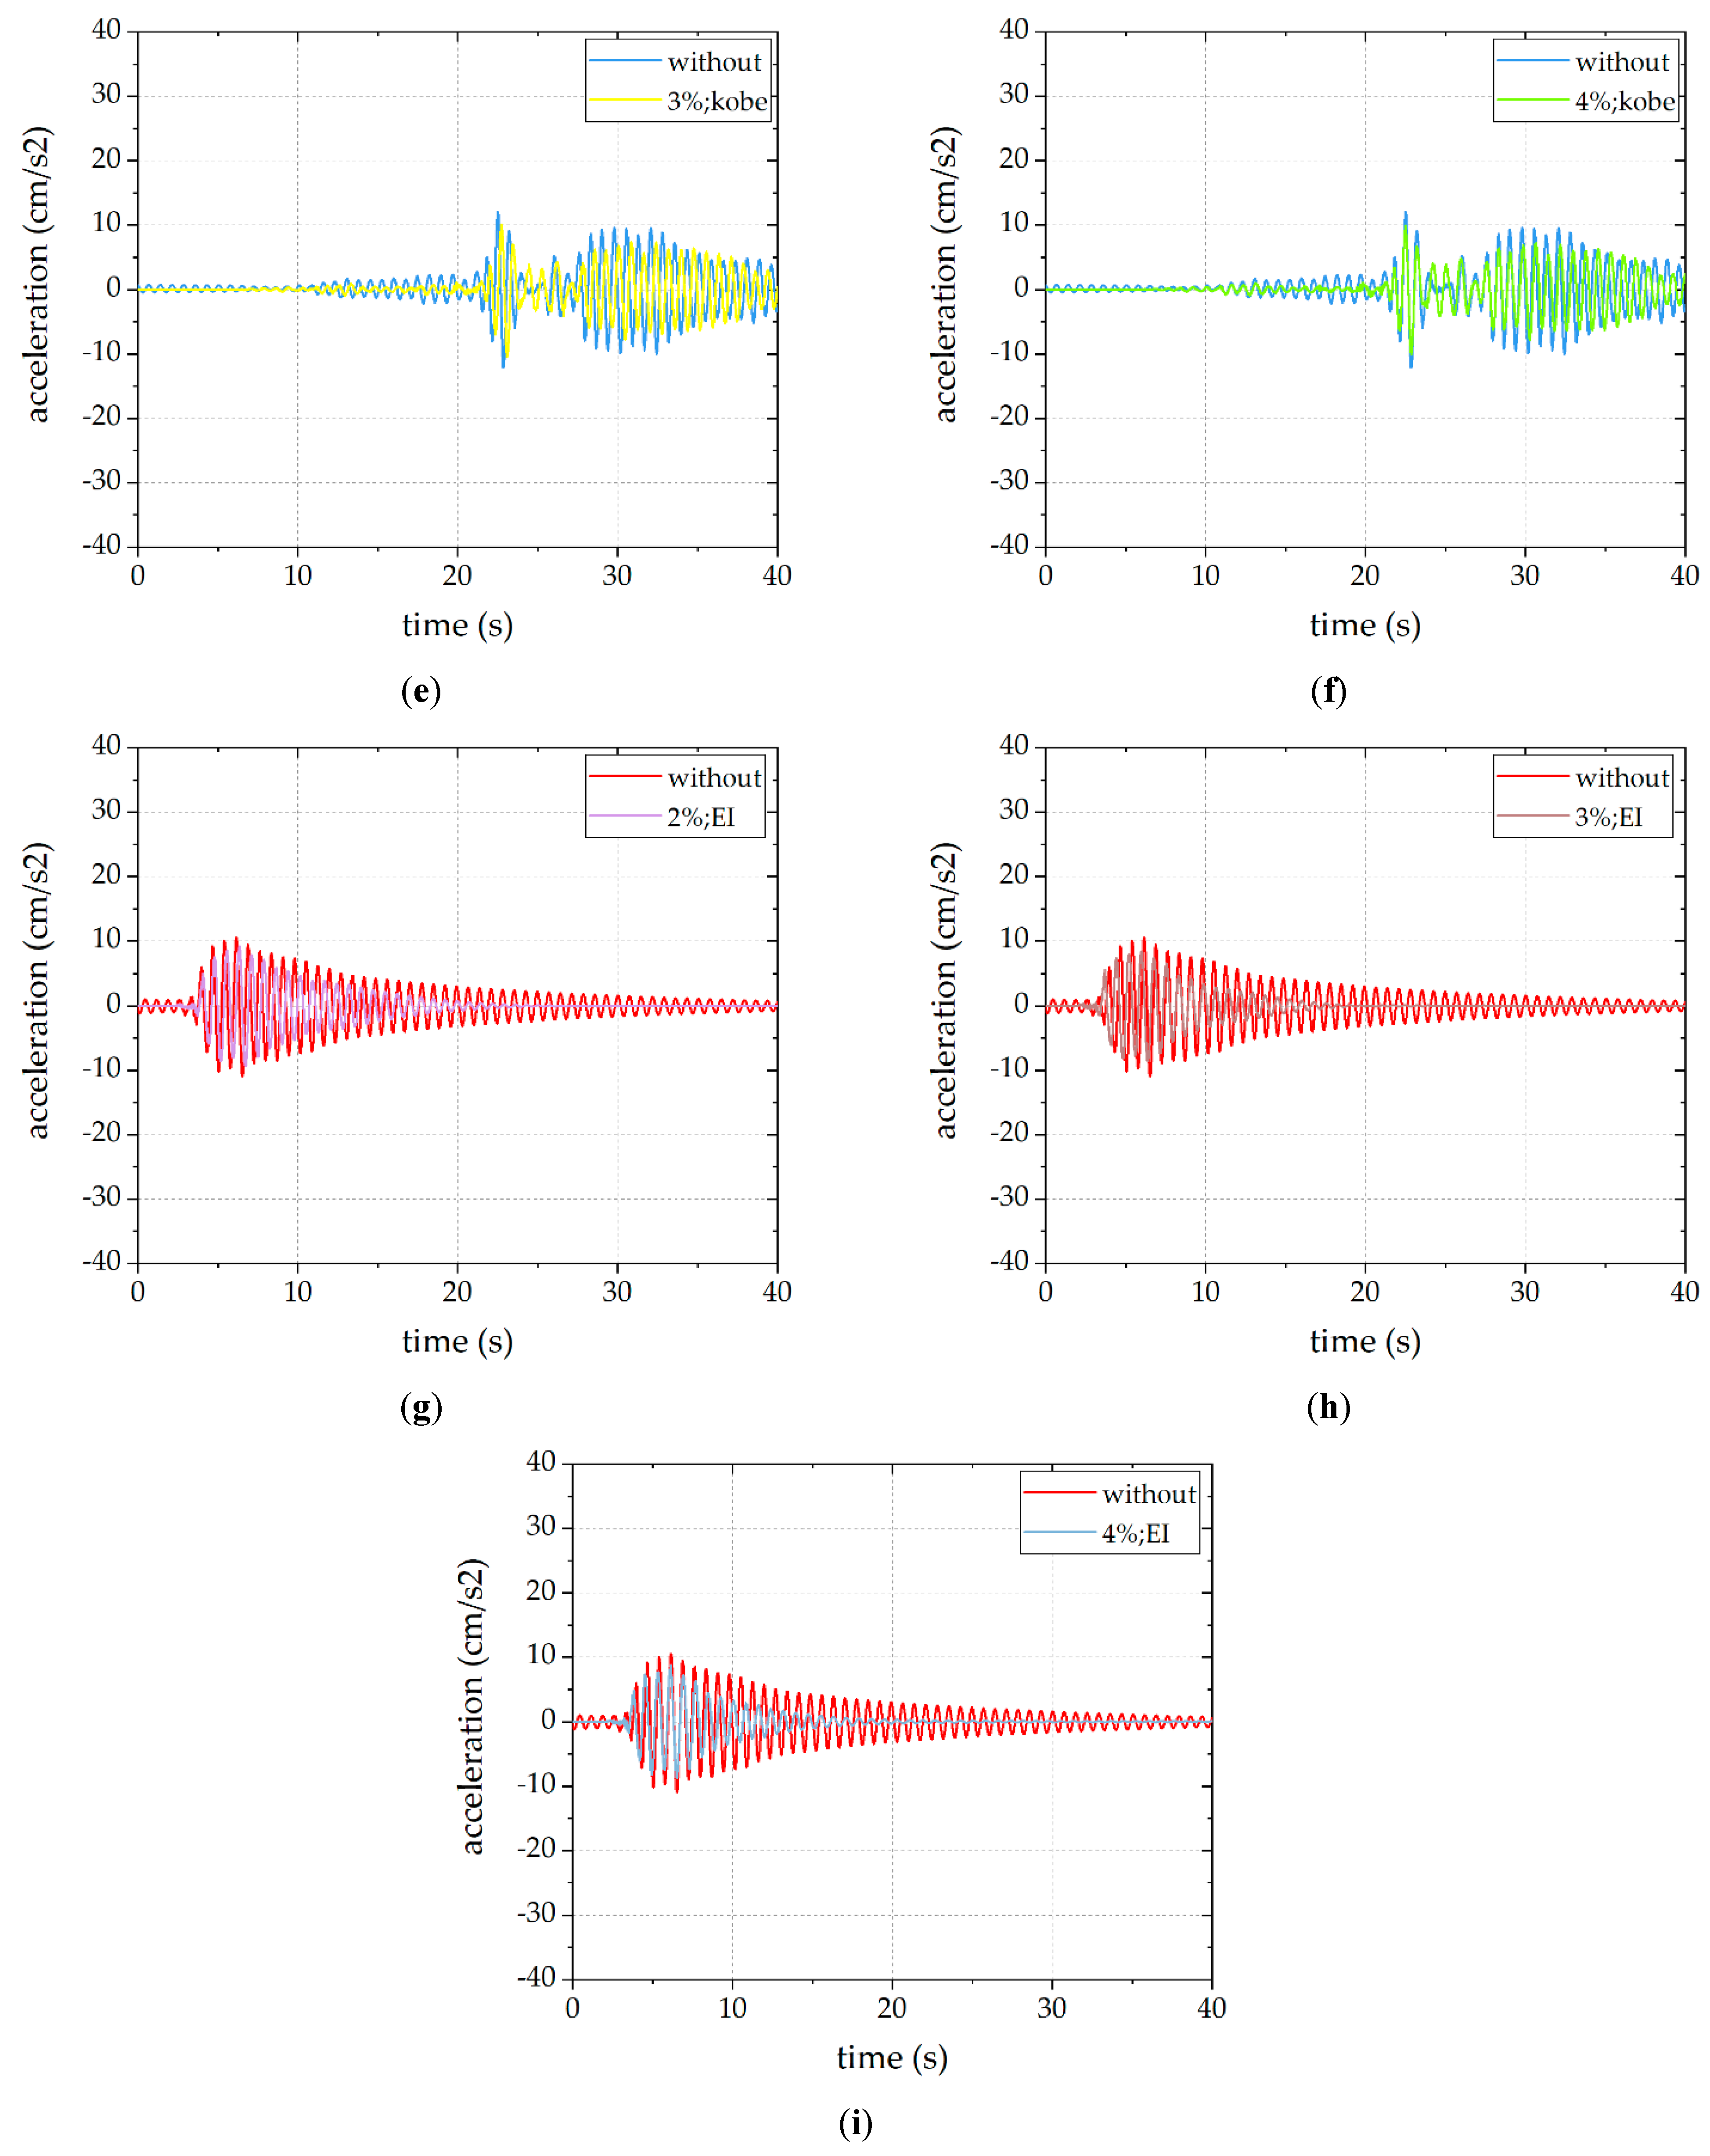
3.2. Effectiveness Demonstration and Influence of Mass Ratio
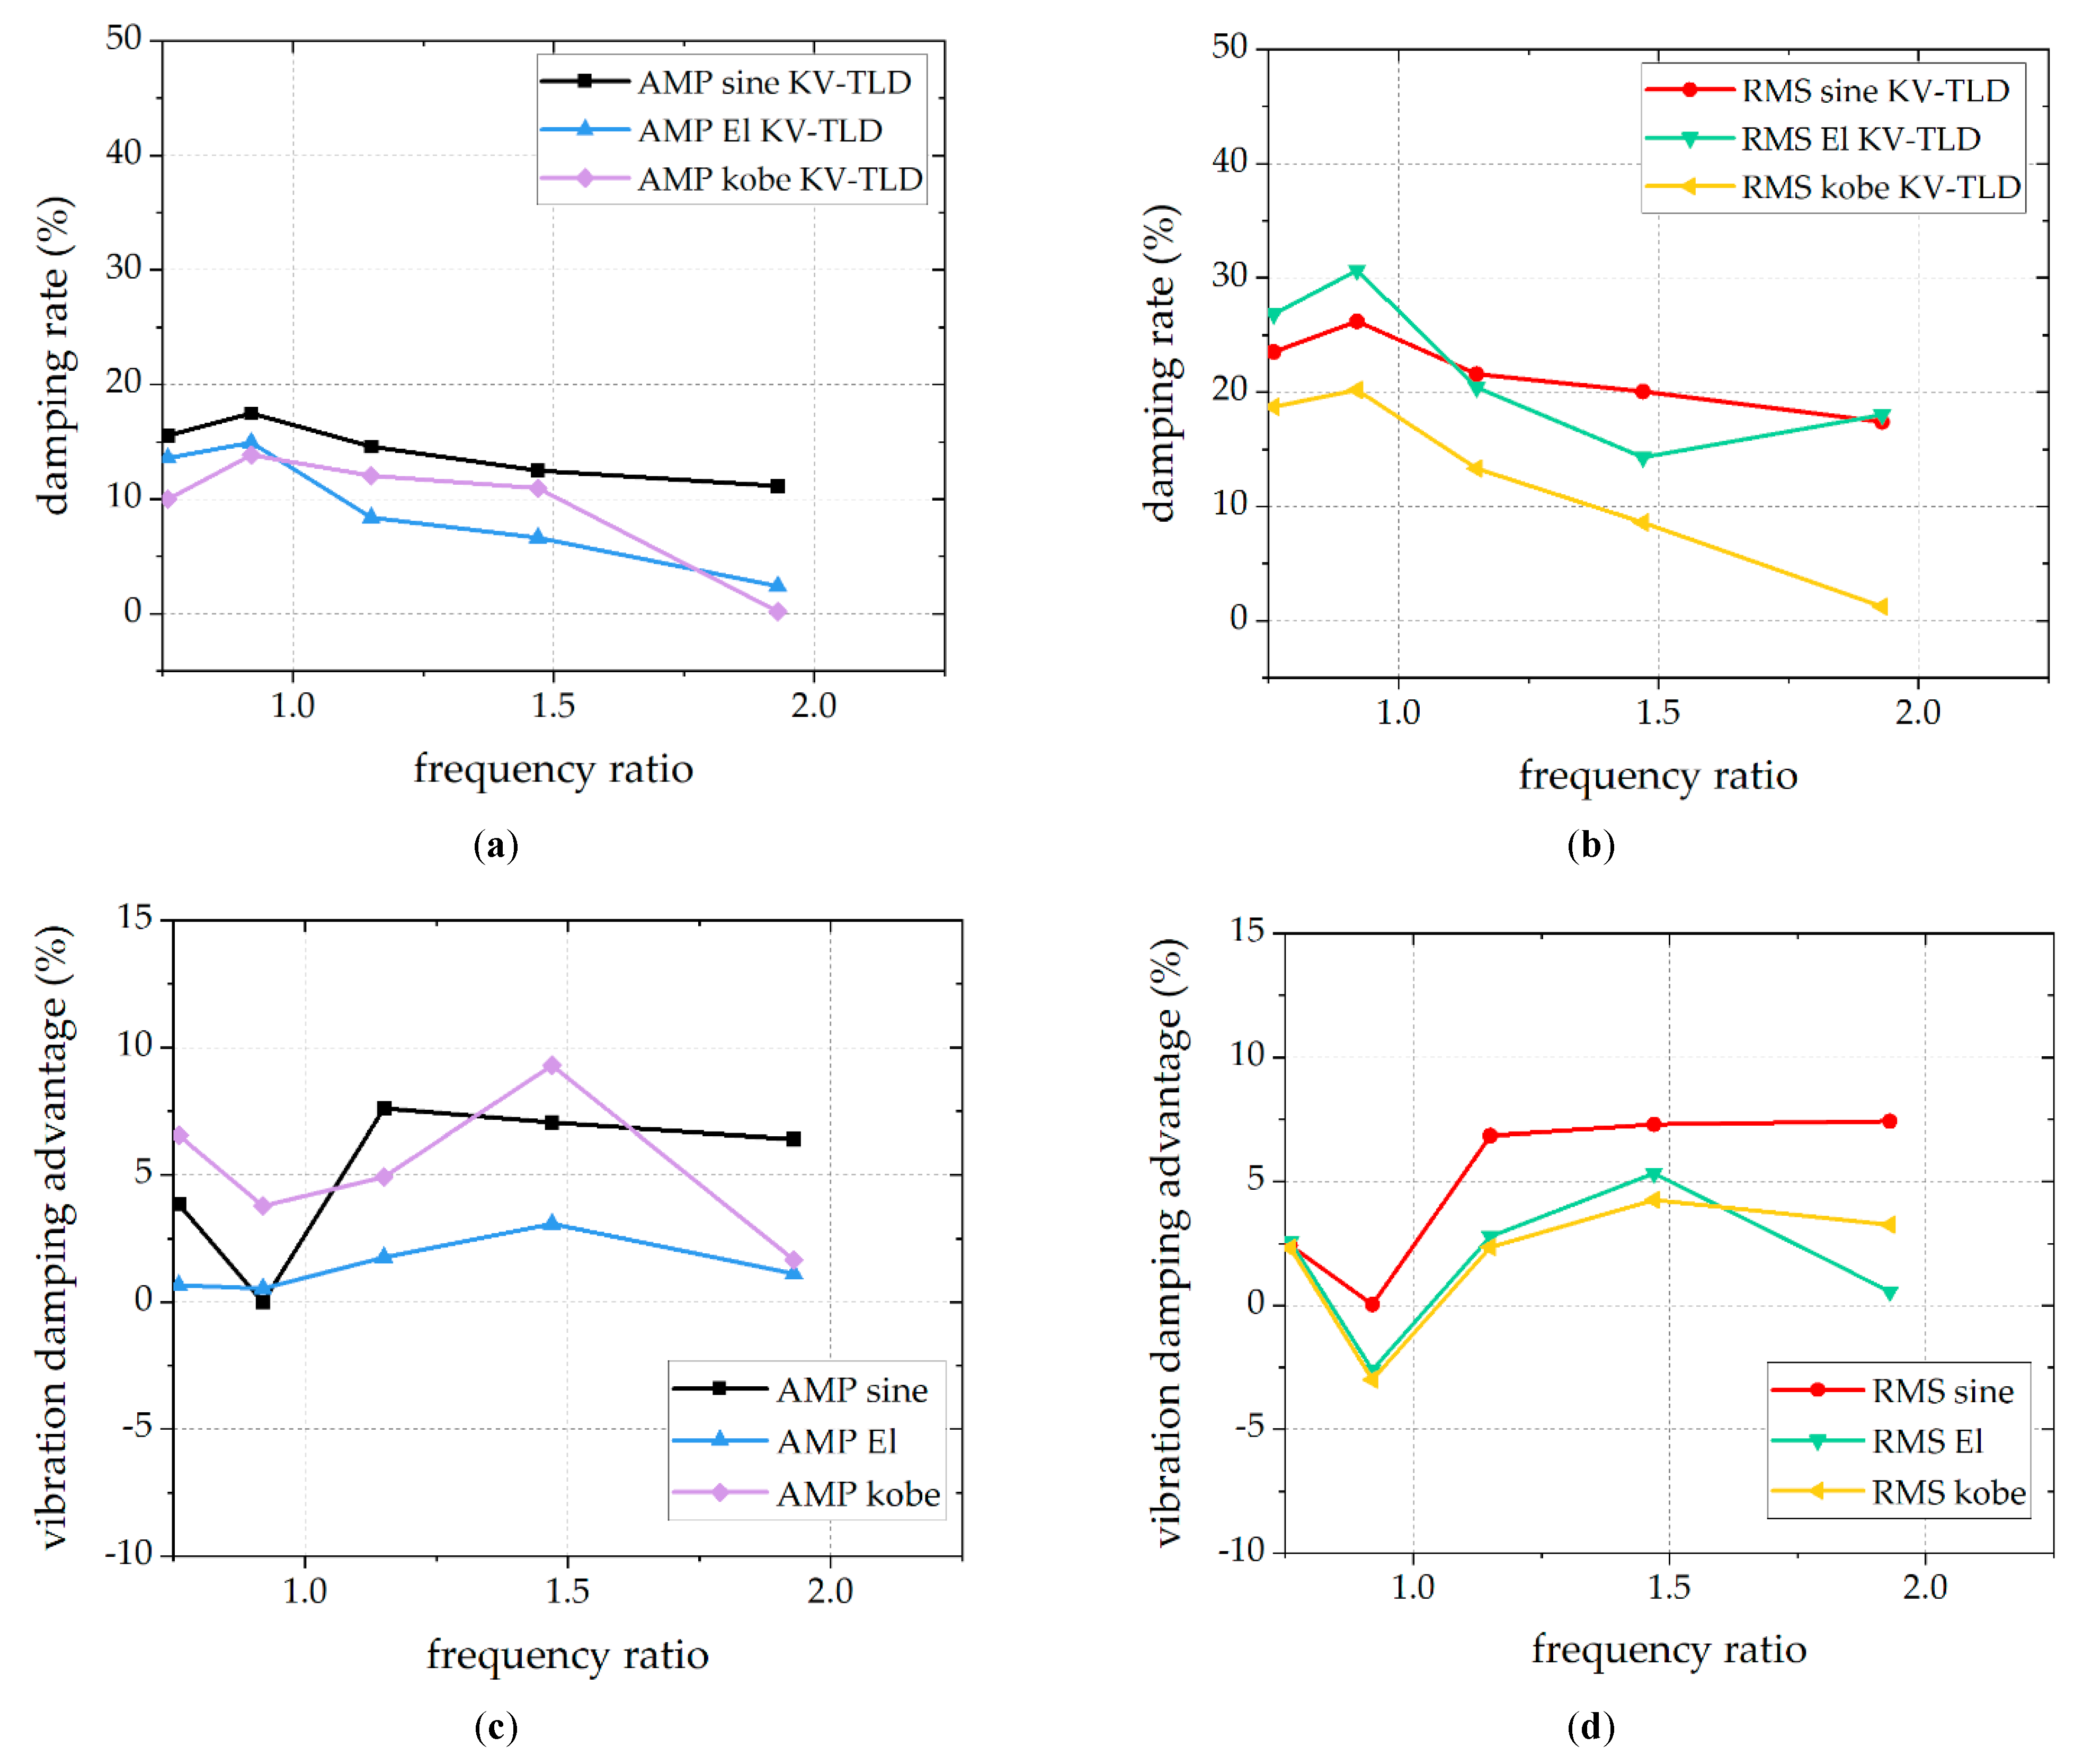
3.3. Superiority of KV-TLD and Influence of Frequency
3.3.1. Superiority of KV-TLD
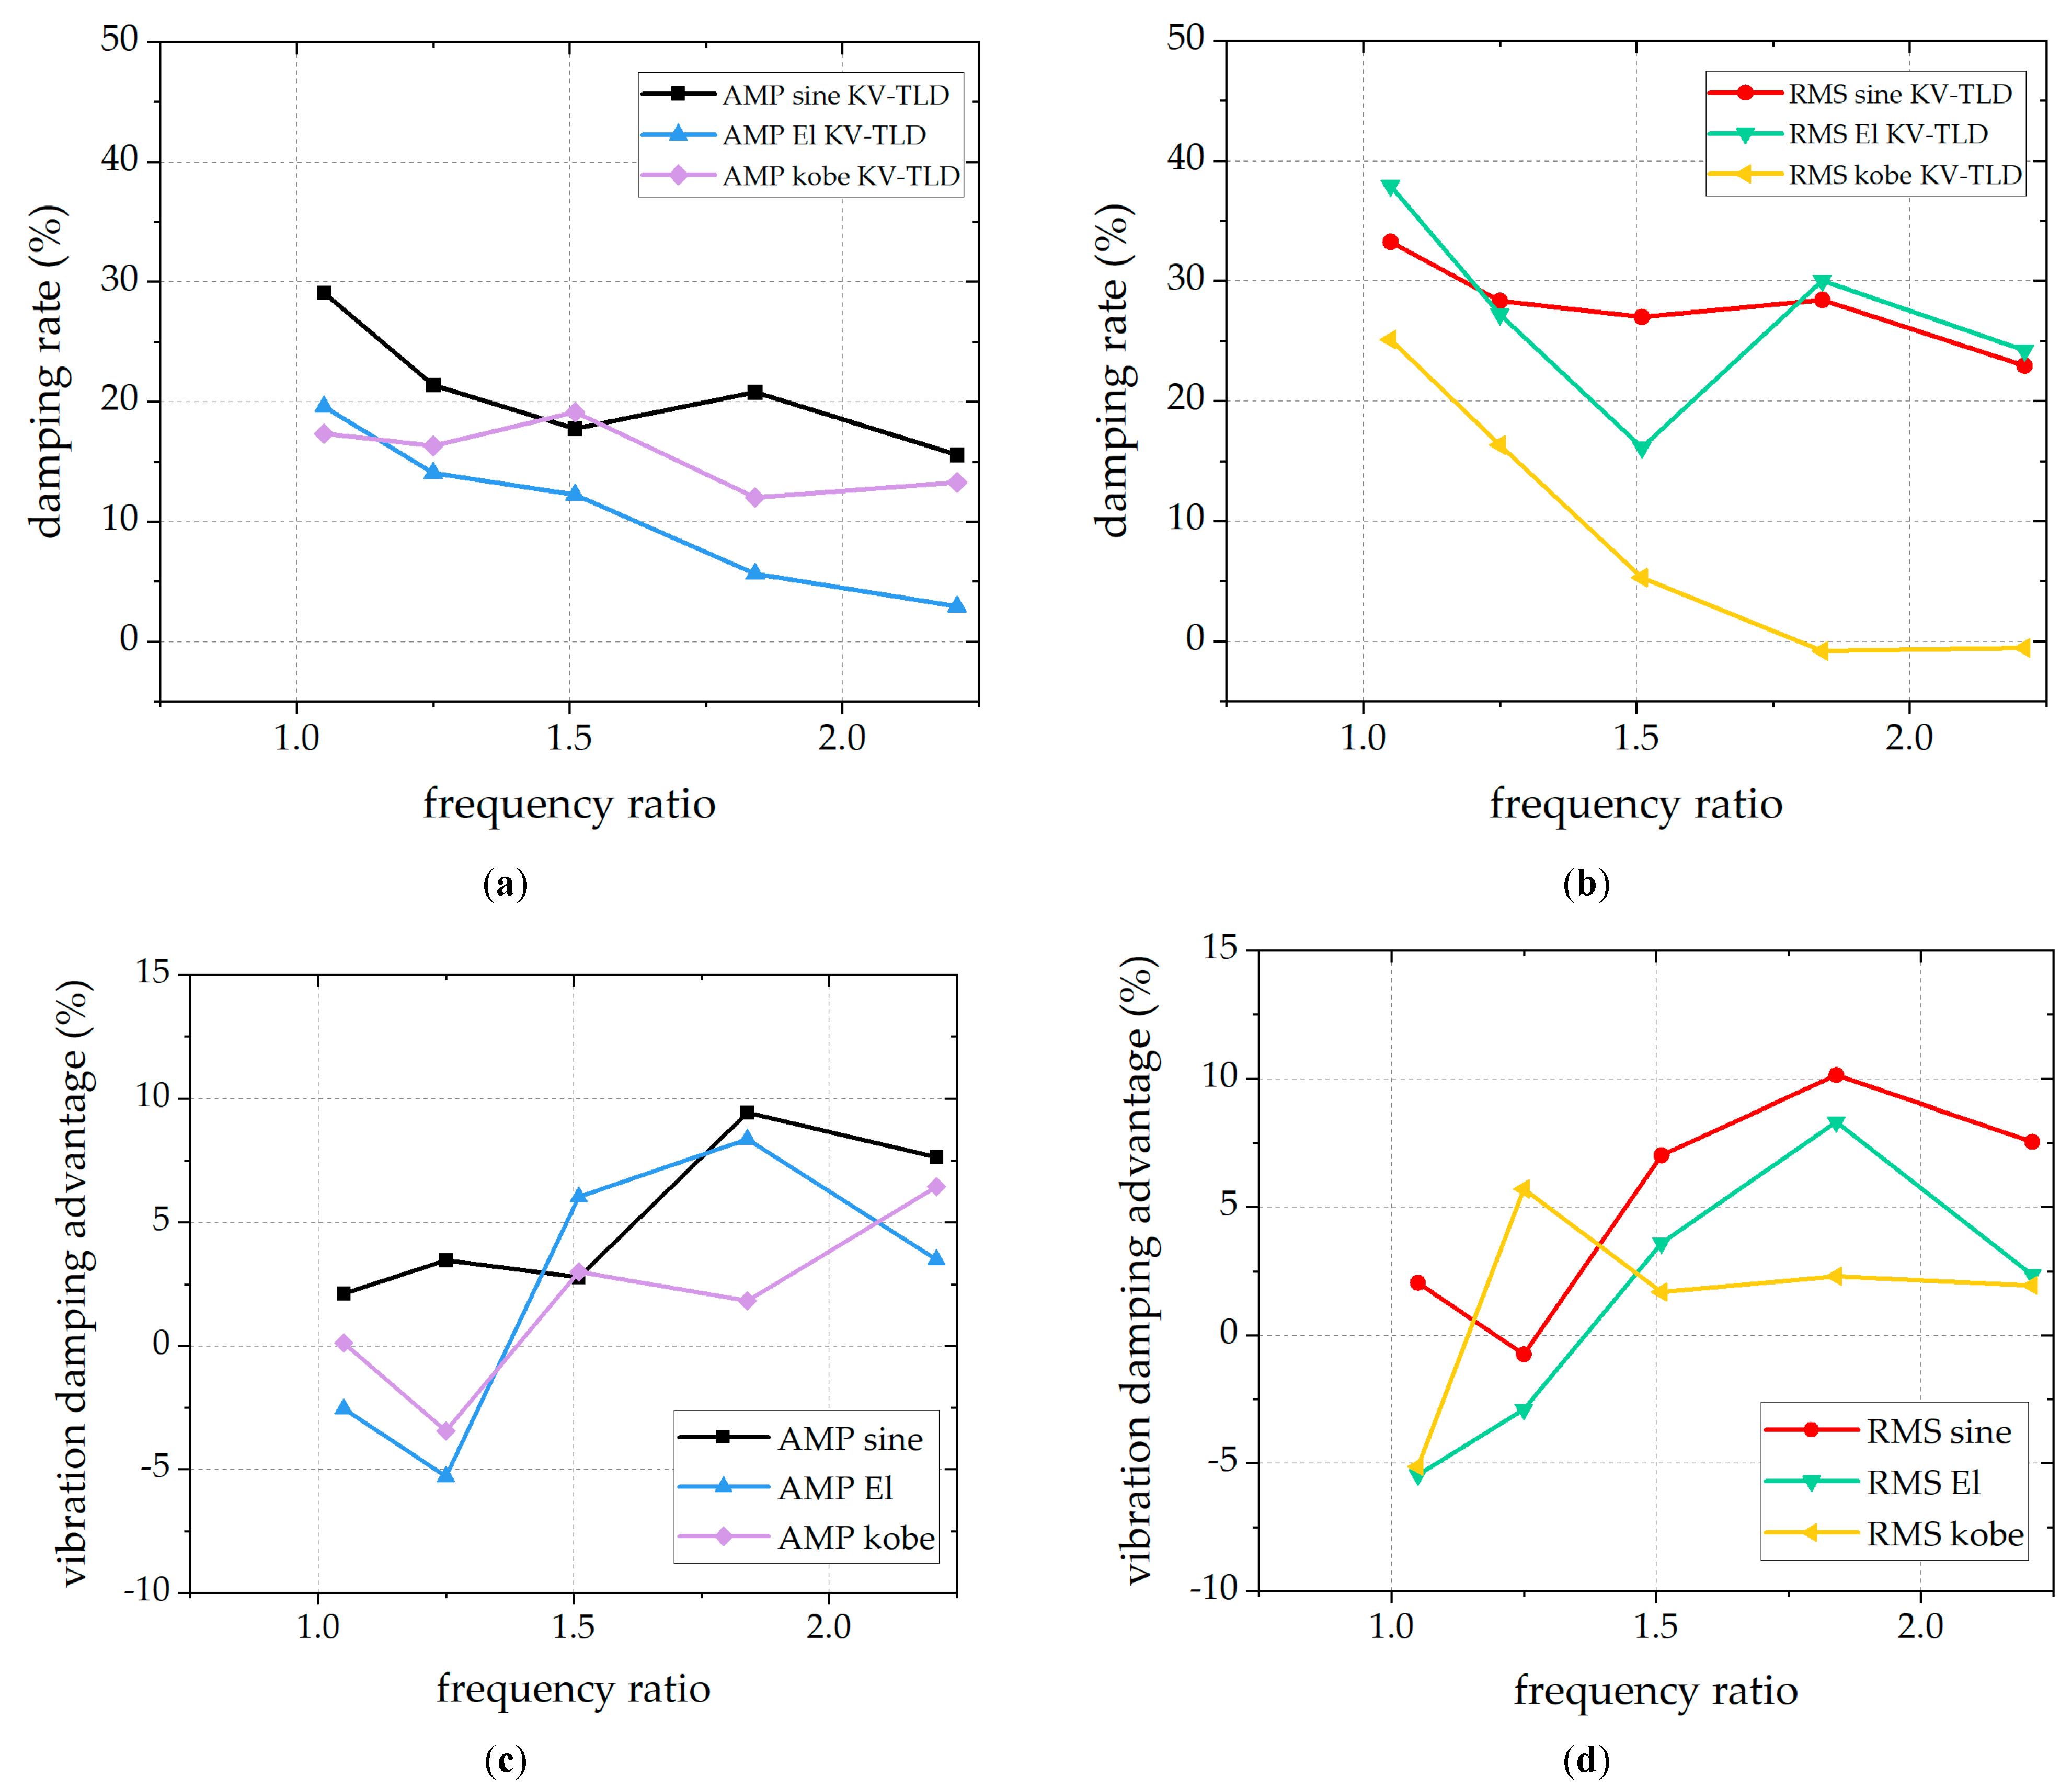
3.3.2. Influence of Frequency Ratio
4. Conclusions
- (1)
- The effectiveness of the KV-TLD is confirmed under the action of sine, El-Centro, and Kobe waves. The AMP and RMS damping rates can both reach an average level of 20%. The damping rate under the El-Centro wave is generally more obvious than those of the other two waves, and the largest damping rate (nearly half) is achieved under the condition of the El-Centro wave and a 4% mass ratio.
- (2)
- In general, under the condition that other parameters remain unchanged, the larger the mass ratio, the better the damping effect of the KV-TLD, which is in accordance with traditional TLD theory. In engineering application, the appropriate mass ratio can be selected according to this law and can be combined with the water consumption demand of the building to achieve the ideal damping effect.
- (3)
- Under the same conditions, the damping effect of the KV-TLD is basically superior to the traditional TLD (although there are some individual cases where the TLD has better significant damping rate values).
- (4)
- The damping effect is significantly influenced by the frequency ratio. The closer the frequency ratio is to 1.0, the better and more obvious the damping effect is and the lower the damping advantage is. The damping characteristic of the KV-TLD largely solves the problems of a narrow frequency band and sensitivity to the degree of frequency tuning of traditional deep-water TLDs, which greatly increases the feasibility and effectiveness of deep-water TLDs in engineering applications.
Author Contributions
Funding
Institutional Review Board Statement
Informed Consent Statement
Data Availability Statement
Acknowledgments
Conflicts of Interest
References
- Symans, M.D.; Constantinou, M.C. Semi-active control systems for seismic protection of structures: A state-of-the-art review. Eng. Struct. 1999, 21, 469–487. [Google Scholar] [CrossRef]
- Haroun, M.A.; Pires, J.A.; Won, A. Active orifice control in hybrid liquid column dampers. In Proceedings of the First World Conference On Structural Control, Los Angeles, CA, USA, 3–5 August 1994. [Google Scholar]
- Crewe, A. Passive energy dissipation systems in structural engineering. Struct. Saf. 1998, 20, 197–198. [Google Scholar] [CrossRef]
- Vandiver, J.K.; Mitome, S. The Effect of Liquid Storage Tanks on the Dynamic Response of Offshore Platforms. J. Pet. Technol. 1979, 31, 1231–1240. [Google Scholar] [CrossRef]
- Bauer, H.F. Oscillations of immiscible liquids in a rectangular container: A new damper for excited structures. J. Sound Vib. 1984, 93, 117–133. [Google Scholar] [CrossRef]
- Tamura, Y.; Fujii, K.; Ohtsuki, T.; Wakahara, T.; Kohsaka, R. Effectiveness of tuned liquid dampers under wind excitation. Eng. Struct. 1995, 17, 609–621. [Google Scholar] [CrossRef]
- Tait, M.J.; Isyumov, N.; El Damatty, A.A. Performance of Tuned Liquid Dampers. J. Eng. Mech. 2008, 134, 417–427. [Google Scholar] [CrossRef]
- Shadman, M.; Akbarpour, A.; Asme. Comparative study of utilizing a new type V-Shaped Tuned Liquid Column Damper and U-Shaped Tuned Liquid Column Damper in floating wind turbines. In Proceedings of the 31st ASME International Conference on Ocean, Offshore and Arctic Engineering, Rio de Janeiro, Brazil, 1–6 July 2012; pp. 277–283.
- Lou, M.; Niu, W.; Zong, G.; Chen, G. Shaking table model test for a steel structure under control of tuned liquid damper. Earthq. Eng. Eng. Vib. 2006, 26, 145–151. [Google Scholar]
- Yu, J.-K.; Wakahara, T.; Reed, D.A. A non-linear numerical model of the tuned liquid damper. Earthq. Eng. Struct. Dyn. 1999, 28, 671–686. [Google Scholar] [CrossRef]
- Reed, D.; Yu, J.; Yeh, H.; Gardarsson, S. Investigation of Tuned Liquid Dampers under Large Amplitude Excitation. J. Eng. Mech. 1998, 124, 405–413. [Google Scholar] [CrossRef]
- Kim, Y.-M.; You, K.-P.; Cho, J.-E.; Hong, D.-P. The vibration performance experiment of Tuned Liquid damper and Tuned Liquid Column damper. J. Mech. Sci. Technol. 2006, 20, 795–805. [Google Scholar] [CrossRef]
- Fei, Z.; Jinting, W.; Feng, J.; Liqiao, L. Control performance comparison between tuned liquid damper and tuned liquid column damper using real-time hybrid simulation. Earthq. Eng. Eng. Vib. 2019, 18, 695–701. [Google Scholar] [CrossRef]
- Fujii, K.; Tamura, Y.; Sato, T.; Wakahara, T. Wind-induced vibration of tower and practical applications of Tuned Sloshing Damper. J. Wind Eng. Ind. Aerodyn. 1990, 33, 263–272. [Google Scholar] [CrossRef]
- Kamgar, R.; Gholami, F.; Zarif Sanayei, H.R.; Heidarzadeh, H. Modified Tuned Liquid Dampers for Seismic Protection of Buildings Considering SoilStructure Interaction Effects. Iran. J. Sci. Technol. Trans. Civ. Eng. 2020, 44, 339–354. [Google Scholar] [CrossRef]
- Hongnan, L.I.; Qinyang, J.; Lichang, W.; Fanlin, L.I. Wind-induced vibration control of dalian international trade center using tuned liquid dampers. Chin. J. Comput. Mech. 2007, 24, 733–740. [Google Scholar]
- Jing, Q.; Li, H.; Wang, L.; Li, F. Wind-induced vibration control of International Trade Building of Dalian using tuned liquid dampers. Earthq. Eng. Eng. Vib. 2006, 26, 111–118. [Google Scholar]
- Zhao, Z.; Zhang, R.; Jiang, Y.; Pan, C. A tuned liquid inerter system for vibration control. Int. J. Mech. Sci. 2019, 164, 105171. [Google Scholar] [CrossRef]
- Pandey, D.K.; Sharma, M.K.; Mishra, S.K. A compliant tuned liquid damper for controlling seismic vibration of short period structures. Mech. Syst. Signal Process. 2019, 132, 405–428. [Google Scholar] [CrossRef]
- Zhang, J.; Kwok, K. Robust design of a new composite tuned liquid damper. In Proceedings of the 14th International Symposium on Structural Engineering (ISSE-14), Beijing, China, 12–15 October 2016; pp. 1050–1055. [Google Scholar]
- Hokmabady, H.; Mojtahedi, A.; Mohammadyzadeh, S.; Ettefagh, M.M. Structural control of a fixed offshore structure using a new developed tuned liquid column ball gas damper (TLCBGD). Ocean Eng. 2019, 192, 106551. [Google Scholar] [CrossRef]
- Jin, Q. Wind-Induced Vibration Control of Dalian International Trade Center Using Tuned Liquid Damper; Dalian University of Technology: Dalian, China, 2005. (In Chinese) [Google Scholar]
- Dong, S.; Triantafyllou, G.S.; Karniadakis, G.E. Elimination of vortex streets in bluff-body flows. Phys. Rev. Lett. 2008, 100, 204501. [Google Scholar] [CrossRef] [Green Version]
- Kim, S.; Alam, M.M.; Maiti, D.K. Wake and suppression of flow-induced vibration of a circular cylinder. Ocean Eng. 2018, 151, 298–307. [Google Scholar] [CrossRef]
- Yao, G.; Wang, H.; Yang, C.; Wen, L. Research and design of underwater flow-induced vibration energy harvester based on Karman vortex street. Mod. Phys. Lett. B 2017, 31, 1750076. [Google Scholar] [CrossRef]
- Tang, Z.; Dong, Y.; Liu, H.; Li, Z. Frequency domain analysis method of tuned liquid damper controlled multi-degree of freedoms system subject to earthquake excitation. J. Build. Eng. 2022, 48, 103910. [Google Scholar] [CrossRef]
- Pandit, A.R.; Biswal, K.C. Seismic control of multi degree of freedom structure outfitted with sloped bottom tuned liquid damper. Structures 2020, 25, 229–240. [Google Scholar] [CrossRef]
- Farmani, S.; Ghaeini-Hessaroeyeh, M.; Hamzehei-Javaran, S. Investigating Performance of Tuned Liquid Damper Using Finite-Element Method Based on Lagrange and Hankel Functions with Nonlinear Boundary Conditions. J. Eng. Mech. 2021, 147, 04021083. [Google Scholar] [CrossRef]


| Total Height of the Whole Structure/cm | Weight/kg | Frequency/Hz | Lateral Stiffness/(N/m) |
|---|---|---|---|
| 53 | 1.60 | 2.5 | 500 |
| Length of Container/cm | Mass Ratio/% | Water Depth/cm | Frequency/Hz | Frequency Ratio |
|---|---|---|---|---|
| 8 | 2 | 2.33 | 2.66 | 1.93 |
| 8 | 3 | 3.50 | 2.93 | 2.12 |
| 8 | 4 | 4.67 | 3.04 | 2.21 |
| 10 | 2 | 1.87 | 2.03 | 1.47 |
| 10 | 3 | 2.80 | 2.35 | 1.70 |
| 10 | 4 | 3.73 | 2.54 | 1.84 |
| 12 | 2 | 1.56 | 1.58 | 1.15 |
| 12 | 3 | 2.33 | 1.88 | 1.36 |
| 12 | 4 | 3.11 | 2.09 | 1.51 |
| 14 | 2 | 1.33 | 1.27 | 0.92 |
| 14 | 3 | 2.00 | 1.53 | 1.11 |
| 14 | 4 | 2.67 | 1.73 | 1.25 |
| 16 | 2 | 1.17 | 1.05 | 0.76 |
| 16 | 3 | 1.75 | 1.27 | 0.92 |
| 16 | 4 | 2.33 | 1.45 | 1.05 |
| Acceleration (Without Control)/(cm/s2) | Acceleration (KV-TLD)/(cm/s2) | Damping Rate/% | |||||
|---|---|---|---|---|---|---|---|
| Wave Type | Mass Ratio/% | Peak (AMP) | Root Mean Square (RMS) | Peak (AMP) | Root Mean Square (RMS) | Peak (AMP) | Root Mean Square (RMS) |
| sine | 2 | 26.1841 | 18.0580 | 22.0993 | 13.7954 | 23.61 | 15.60 |
| 3 | 26.1841 | 18.0580 | 19.0563 | 12.4453 | 31.08 | 27.22 | |
| 4 | 26.1841 | 18.0580 | 18.5545 | 12.0399 | 33.33 | 29.14 | |
| El-Centro | 2 | 10.8815 | 3.855 | 9.4034 | 2.8205 | 26.84 | 13.58 |
| 3 | 10.8815 | 3.855 | 8.6370 | 2.4578 | 36.24 | 20.63 | |
| 4 | 10.8815 | 3.855 | 8.7494 | 2.3931 | 37.92 | 19.59 | |
| Kobe | 2 | 12.2715 | 2.5610 | 11.0463 | 2.0815 | 18.72 | 9.98 |
| 3 | 12.2715 | 2.5610 | 10.4682 | 1.8743 | 14.7 | 27.39 | |
| 4 | 12.2715 | 2.5610 | 10.1426 | 1.9176 | 17.35 | 30.26 | |
| Mass Ratio/% | 2% | 3% | 4% | ||||||
|---|---|---|---|---|---|---|---|---|---|
| Wave Type | Frequency Ratio | AMP/% | RMS/% | Frequency Ratio | AMP/% | RMS/% | Frequency Ratio | AMP/% | RMS/% |
| sine | 1.93 | 6.39 | 7.42 | 2.12 | 9.98 | 8.87 | 2.21 | 7.64 | 7.55 |
| 1.47 | 7.05 | 7.29 | 1.70 | 7.08 | 6.13 | 1.84 | 9.45 | 10.14 | |
| 1.15 | 7.60 | 6.84 | 1.36 | 7.64 | 6.15 | 1.51 | 2.78 | 7.03 | |
| 0.92 | −0.01 | 0.04 | 1.11 | 0.91 | 0.99 | 1.25 | 3.47 | −0.75 | |
| 0.76 | 3.85 | 2.42 | 0.92 | 2.34 | 2.01 | 1.05 | 2.12 | 2.05 | |
| El-Centro | 1.93 | 1.11 | 0.56 | 2.12 | 6.02 | 7.71 | 2.21 | 3.50 | 2.35 |
| 1.47 | 3.08 | 5.34 | 1.7 | 3.61 | 4.13 | 1.84 | 8.37 | 8.33 | |
| 1.15 | 1.76 | 2.78 | 1.36 | 3.98 | 3.53 | 1.51 | 6.04 | 3.60 | |
| 0.92 | 0.53 | −2.61 | 1.11 | 1.27 | −0.66 | 1.25 | −5.28 | −2.90 | |
| 0.76 | 0.66 | 2.58 | 0.92 | 1.92 | −2.81 | 1.05 | −2.54 | −5.46 | |
| Kobe | 1.93 | 1.66 | 3.26 | 2.12 | 1.20 | 9.85 | 2.21 | 6.45 | 1.94 |
| 1.47 | 9.29 | 4.26 | 1.7 | 3.59 | 4.01 | 1.84 | 1.83 | 2.30 | |
| 1.15 | 4.92 | 2.35 | 1.36 | 2.15 | 2.62 | 1.51 | 3.00 | 1.69 | |
| 0.92 | 3.78 | −3.00 | 1.11 | 2.01 | −0.04 | 1.25 | −3.44 | 5.71 | |
| 0.76 | 6.55 | 2.32 | 0.92 | 2.59 | −0.58 | 1.05 | 0.12 | −5.13 | |
Disclaimer/Publisher’s Note: The statements, opinions and data contained in all publications are solely those of the individual author(s) and contributor(s) and not of MDPI and/or the editor(s). MDPI and/or the editor(s) disclaim responsibility for any injury to people or property resulting from any ideas, methods, instructions or products referred to in the content. |
© 2023 by the authors. Licensee MDPI, Basel, Switzerland. This article is an open access article distributed under the terms and conditions of the Creative Commons Attribution (CC BY) license (https://creativecommons.org/licenses/by/4.0/).
Share and Cite
Ren, H.; Fan, Q.; Lu, Z. Experimental Study and Damping Effect Analysis of a New Tuned Liquid Damper Based on Karman Vortex Street Theory. Buildings 2023, 13, 1013. https://doi.org/10.3390/buildings13041013
Ren H, Fan Q, Lu Z. Experimental Study and Damping Effect Analysis of a New Tuned Liquid Damper Based on Karman Vortex Street Theory. Buildings. 2023; 13(4):1013. https://doi.org/10.3390/buildings13041013
Chicago/Turabian StyleRen, Hongmei, Qiaoqiao Fan, and Zheng Lu. 2023. "Experimental Study and Damping Effect Analysis of a New Tuned Liquid Damper Based on Karman Vortex Street Theory" Buildings 13, no. 4: 1013. https://doi.org/10.3390/buildings13041013