Article

Study on the Air Inlet Velocity and Temperature Distribution in an Inclined Tunnel with Single Shaft under Natural Ventilation

1
School of Civil Engineering, Central South University, Changsha 410075, China
2
Hefei Institute for Public safety Research Tsinghua University, Hefei 230601, China
*
Author to whom correspondence should be addressed.
Buildings 2023, 13(4), 842; https://doi.org/10.3390/buildings13040842
Submission received: 14 December 2022 / Revised: 28 February 2023 / Accepted: 20 March 2023 / Published: 23 March 2023

Abstract

:
The emergence of inclined tunnels under natural ventilation has brought many new fire safety issues. The smoke movement in the tunnel is affected by the chimney effect induced by the shaft and the downstream tunnel. The characteristics of temperature distribution in inclined tunnels are different from horizontal tunnels, which is worthy of further study. A series of conditions were carried out in an inclined model tunnel with a single shaft to investigate the temperature distribution characteristics. In this study, the longitudinal air inlet velocity is used to replace the longitudinal ventilation wind velocity. Results showed that the variation of fire source location Lf,, shaft height Ls, and the tunnel slope φ have obvious effect on the air inlet velocity. Based on the previous theories and the non-dimension analysis, the formulas of the dimensionless longitudinal inlet air velocity and the distribution of the maximum smoke temperature under the ceiling are proposed, which show good consistency with the simulation results. The reduced-scale experiments were conducted to validate the results of numerical simulation. The error range between the theoretical results and the simulation results is less than 20%.

1. Introduction

Fire is one of the most serious disasters that endanger the safety of people and property in tunnels [1,2]. Damages of tunnel fire accidents have attracted wide attention [3,4,5]. Toxic smoke in the long and narrow space spreads apace, which makes the evacuation and the fire rescue operation difficult [6,7]. Therefore, it is necessary to exhaust the hot smoke from tunnel quickly and efficiently. In the past several years, natural ventilation with vertical shafts had been applied to urban road tunnels due to the merits of high economic efficiency [1]. Many scholars have studied the feasibility and effectiveness of shafts when it comes to fire. The geometric structure of the shaft has significant influence on the smoke exhaust effect, shaft height, cross-sectional area and group arrangement will affect the airflow in the tunnel [8,9,10]. The plug-holing phenomena caused by the increase of shaft height was observed [11,12]. Zhao et al. developed a theoretical model for predicting the critical shaft height, it is found that with increasing shaft length, the critical shaft height decreases first and then remains stable until it finally decreases to zero [13]. Yu and Zhong found the shaft height can affect the induced air flow velocity, and the fire mass loss rate increased with the induced air flow velocity [14]. Natural ventilation is often used in the inclined tunnels too. When the fire accident occurred, stack effect, buoyancy, thermal expansion, natural wind will drive the smoke movement [15]. Ji et al. focused on the effect of slope on the temperature field, and proposed an empirical equation to predict the upstream ceiling gas temperature in tunnels with different slopes first [16]. Zhang et al. using FDS to study tilted tunnel fire with slope of 0–8%, the maximum temperature and smoke back-layering length were studied, a model for the maximum temperature rise was proposed, the smoke temperature decayed by exponential functions on the two sides of the fire [17]. Wang et al. found the similar exponential decay pattern, and the buoyancy induced airflow velocity at the entrance increases with tunnel slope [18].
For the inclined tunnel with single shaft, the smoke flow is influenced by the chimney effects result from shaft and slope respectively, the path of smoke spread is more complex. Previous studies only consider the fire source in one side of the shaft, and did not concern the effect of shaft height on smoke spread [19]. When the relative position of fire source and shaft changed, the chimney effect arise from the vertical shaft and downstream of tunnel may have synergistic or antagonistic relationship. Hence, further study of the flow field and temperature distribution in inclined tunnel with single shaft under natural ventilation is necessary.
In this study, numerical simulations using FLUENT were used to research the effects of the tunnel structure and the fire source location on the characteristics of air motion and the temperature distribution in the inclined tunnel. The longitudinal inlet air velocity and maximum gas temperature beneath ceiling are theoretically analyzed. The theoretical model is validated with simulation result.

2. Theoretical Analysis

2.1. Dimensionless Longitudinal Inlet Air Velocity

A burning fire source creates a pressure difference between tunnel and environment, affecting the gas temperature distribution in the tunnel. In the inclined tunnel, the longitudinal inlet air flow is affected by the buoyancy variation due to difference in height and gas temperature.
For the inclined tunnels without shafts, Merci conducted a quantitative analysis on the inlet air velocity V in at tunnel entrance under natural ventilation, and proposed the relevant empirical formula [20]:
V in = 22 L 0.25 φ 0.36 ε 0.11 Q ˙ c 0.33 [ 1 exp ( 0.5 H ) ]
where L is the tunnel length, φ is the tangent of tunnel slope, ε is the roughness, Q ˙ c is the convective part of the fire heat release rate, H is the hydraulic diameter.
Wan et al. developed a dimensionless formula of inlet air velocity at the entrance of the inclined tunnel with single shaft under natural ventilation [19]:
V * = Q ˙ * 0.42 L f * 0.57 ( 0.84 + 14.53 φ 2.41 )
where V * = V in / H , Q ˙ * = Q ˙ / c p T 0 H 5 / 2 g 1 / 2 ρ 0 , L f * = L f / H , V * -dimensionless inlet air velocity, Q ˙ * -dimensionless heat release rate, L f * is the dimensionless fire source location, Q ˙ is the heat release rate, c p is the thermal capacity of air, T 0 is the ambient temperature, g is the gravitational acceleration, ρ 0 is the ambient density, L f is the distance from fire source center to tunnel entrance.
The inlet air velocity of inclined tunnel is mainly related to the fire load, the fire source location, and the inclined angle [19,21]. Additionally, the chimney effect induced by the shaft is also very important. Analyzing the process of air entering the tunnel, the parameter relation in the inclined tunnel with single shaft can be expressed as:
f ( V in , Q ˙ , ρ 0 , c p , T 0 , g , H , φ , L s , L f ) = 0
Taking H , ρ 0 , g , T 0 as the basic parameters, the dimensionless analysis is as follows:
V in H g = f ( Q ˙ H 7 / 2 g 3 / 2 ρ 0 , L f H , L s H , φ , c p T 0 H g ) = f ( Q ˙ c p T H 5 / 2 g 1 / 2 ρ 0 , L f H , L s H , φ )
V * = f ( Q ˙ * , L f * , L s * , φ )
where L s * = L s / H , L s is the shaft height, L s * is the dimensionless shaft height.

2.2. Distribution of the Maximum Smoke Temperature under the Ceiling

Kurioka et al. established a model for the maximum excess temperature of smoke layer beneath the tunnel ceiling [22]:
Δ T max T 0 = γ ( Q ˙ * 2 / 3 Fr 1 / 3 ) a , { Q ˙ * 2 / 3 / Fr 1 / 3 < 1.35 , γ = 1.77 , a = 1.2 Q ˙ * 2 / 3 / Fr 1 / 3 1.35 , γ = 2.54 , a = 0
However, it is found that the measured maximum temperature beneath the tunnel ceiling is generally lower than the prediction result of Equation (6) [23].
Li et al. proposed a formula for Δ T max under longitudinal ventilation [24]:
Δ T max = { 11.04 σ Q ˙ 2 / 3 H d 5 / 3 , V * * 0.19 1.876 σ g 1 / 3 ( ρ 0 c p T 0 ) 1 / 3 Q ˙ V t r 1 / 3 H d 5 / 3 , V * * > 0.19
where V * * = V t w * , w * = ( Q ˙ c g r ρ 0 c p T 0 ) 1 / 3 , Q ˙ c = 0.7 Q ˙ , σ is the correction coefficient, V * * is the dimensionless ventilation velocity, r is the radius of the fire source, w * is the characteristic plume velocity, V t is the longitudinal ventilation velocity, H d is the height from the fire surface to the tunnel ceiling.
Hu et al. proposed the longitudinal decay formula of the smoke temperature under the ceiling along the tunnel [23,25]:
Δ T x = Δ T ref e K ( x x 0 )
where K = α D c p m , α = h c + h r D + B D , Δ T x is the temperature rise of smoke at x from fire source, Δ T ref is the temperature rise of smoke at reference point, K is the longitudinal attenuation coefficient, x is the distance from the reference point, x0 is the location of the reference point.
It should be noted that the values of reference points can change in different fire scenarios. It is generally considered that the area after the density jump location is a one-dimensional flow region, and the density jump location can be calculated by the following formula:
l x h = 0.6 ( l b h ) 1 / 3 + l b h
Delichatsios proposed that ceiling-jet can be segmented into three regions (axisymmetric radial ceiling-jet region, one-dimensional shooting flow region, and one-dimensional tranquil flow region) [26]. When L f changes, the shaft can be located in any region. Based on this model, Oka et al. proposed the ceiling jet prediction formula [27]:
h T h = { 0.08417 ( x h l b h ) + 0.1523 ( l b h ) 1 / 3 , x h 2.045 0.2483 ( l b h ) 1 / 3 , x h > 2.045
where h T is the ceiling-jet thickness, h is the tunnel height, l b is the half width of the tunnel.
In the three regions, the thickness of the smoke layer in the one-dimensional area can be assumed as the initial thickness of the ceiling-jet due to the lower air entrainment [10].
When L f 330 , Cong et al. proposed that when the distance between the fire source and the shaft is greater than 0.564 m, the reference point can be located at any position between the density jump point and the shaft. In this study, the density jump location is 7.5 m [10]. According to the simulation results, when L f > 330 , the maximum smoke temperature rise beneath the tunnel ceiling is around 10 m away from the fire source. Therefore, the position of 10 m away from the fire source is selected as the reference position, and the maximum smoke temperature under the tunnel ceiling is assumed to be the reference temperature rise.
Peng proposed a calculation formula for the longitudinal distribution of smoke temperature along the inclined tunnel [28]:
T x = T 0 m g sin θ α D + ( T ref T 0 + m g sin θ α D ) exp ( α D m c p ( x x 0 ) )
where D = B + 2 h t or D = 2 R arcos R h t R , T x is the temperature of smoke at x from fire source, T ref is the temperature rise of smoke at reference point, R is the radius of the tunnel section, h t is the thickness of smoke layer.
Equation (11) can be written as:
Δ T x = Δ T ref e K ( x x 0 ) ϕ ( 1 e K ( x x 0 ) )
where ϕ = m g sin θ α D .
It shows that the gas temperature beneath the tunnel ceiling decreases faster along the inclined tunnel than along the horizontal tunnel. When the tunnel tilts, fresh air enters into the lower entrance of the tunnel, the hot smoke is discharged rapidly from the higher exit due to the chimney effect. The buoyancy-induced airflow velocity increases with the slope, and the vigorous flow entraining the ambient air from tunnel entrance to the downstream smoke layer through the interface [29]. And because the longitudinal velocity is larger, the heat transfer coefficient between the tunnel boundary and the smoke is probably larger. This not merely shortens the heating time of gas in the tunnel, but also reduces the smoke temperature by mixing. Which explains why the ceiling temperature rise along the tunnel declines obviously.
Li et al. proposed a prediction formula of the mass flow rate of inclined plumes under longitudinal ventilation [30]:
m ˙ = { 0.3735 Q ˙ c 1 / 3 H d 5 / 3 V * * , V * * > 0.19 0.071 Q ˙ c 1 / 3 H d 5 / 3   , V * * 0.19
By substituting Equations (9)–(13) into Equation (8), the prediction formula for the distribution of maximum smoke temperature beneath ceiling along the inclined tunnel with single shaft under natural ventilation can be expressed as:
Δ T q x = { ( g ρ 0 c p T 0 ) 1 3 ( 2.17 Q ˙ V in r 1 / 3 H d 5 / 3 35.14 ) e K ( x x 0 ) , L f < L d ( g ρ 0 c p T 0 ) 1 3 ( 4.08 Q ˙ V k r 1 / 3 H d 5 / 3 232.9 ) e K ( x x 0 ) , L f > L d
where K = 5.355 α R arcos R 0.2483 h 4 / 3 l b 1 / 3 R c p Q ˙ c 1 / 3 H d 5 / 3 V * * .

3. Model Setup

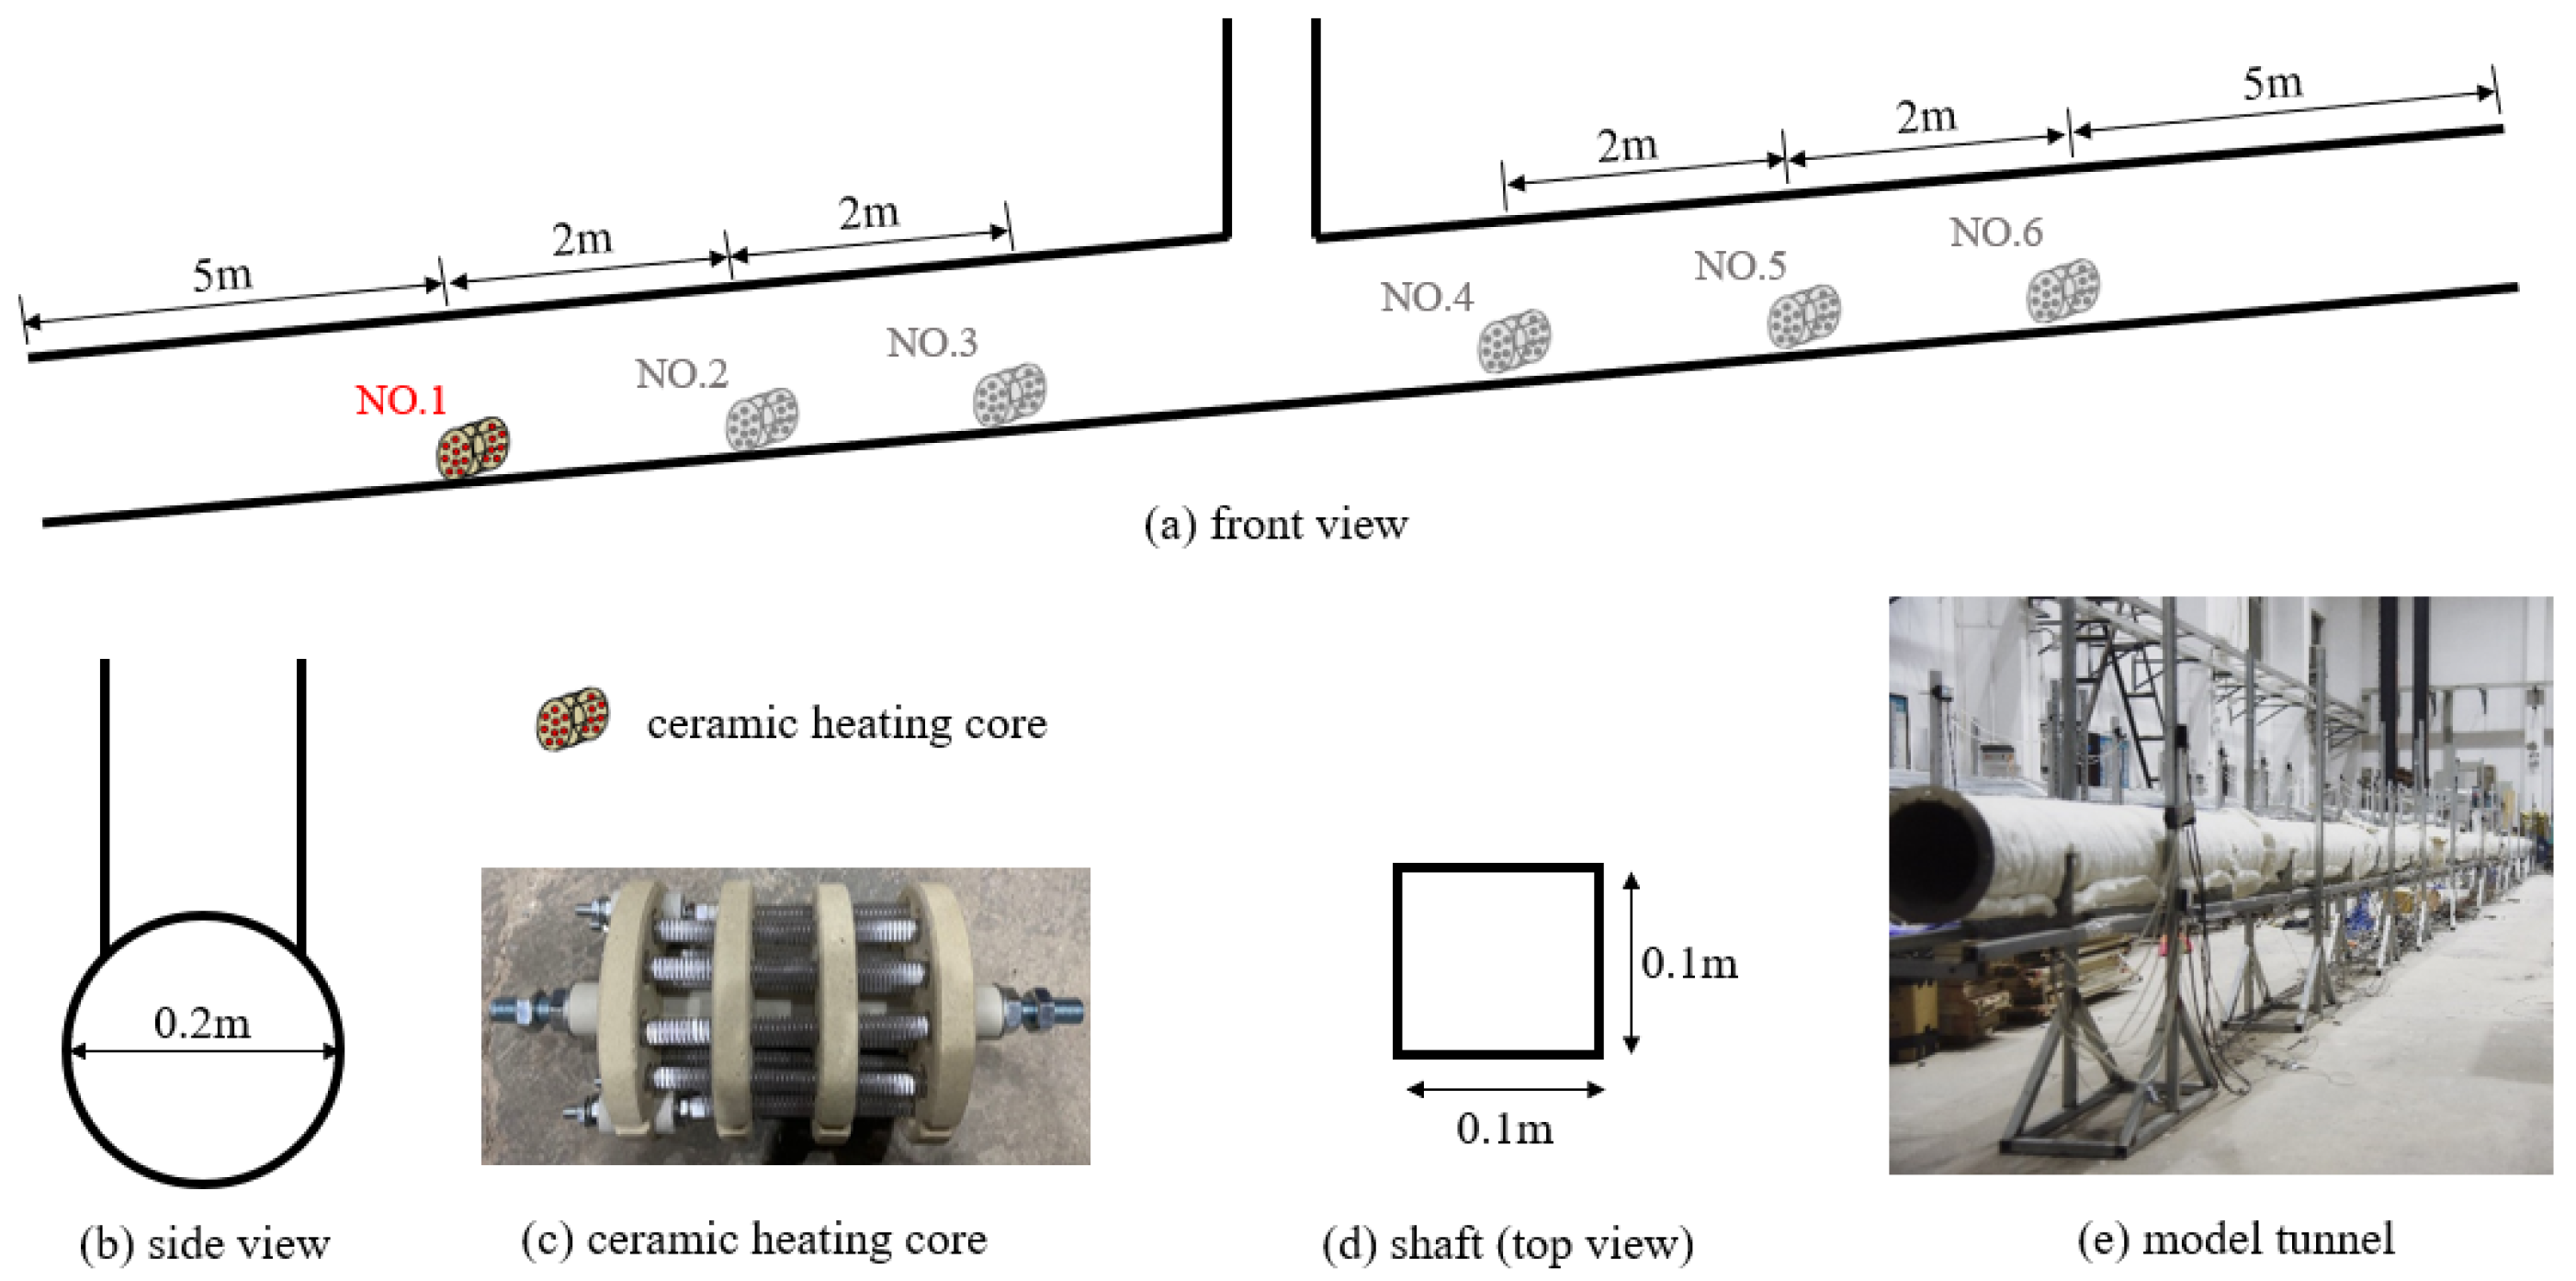
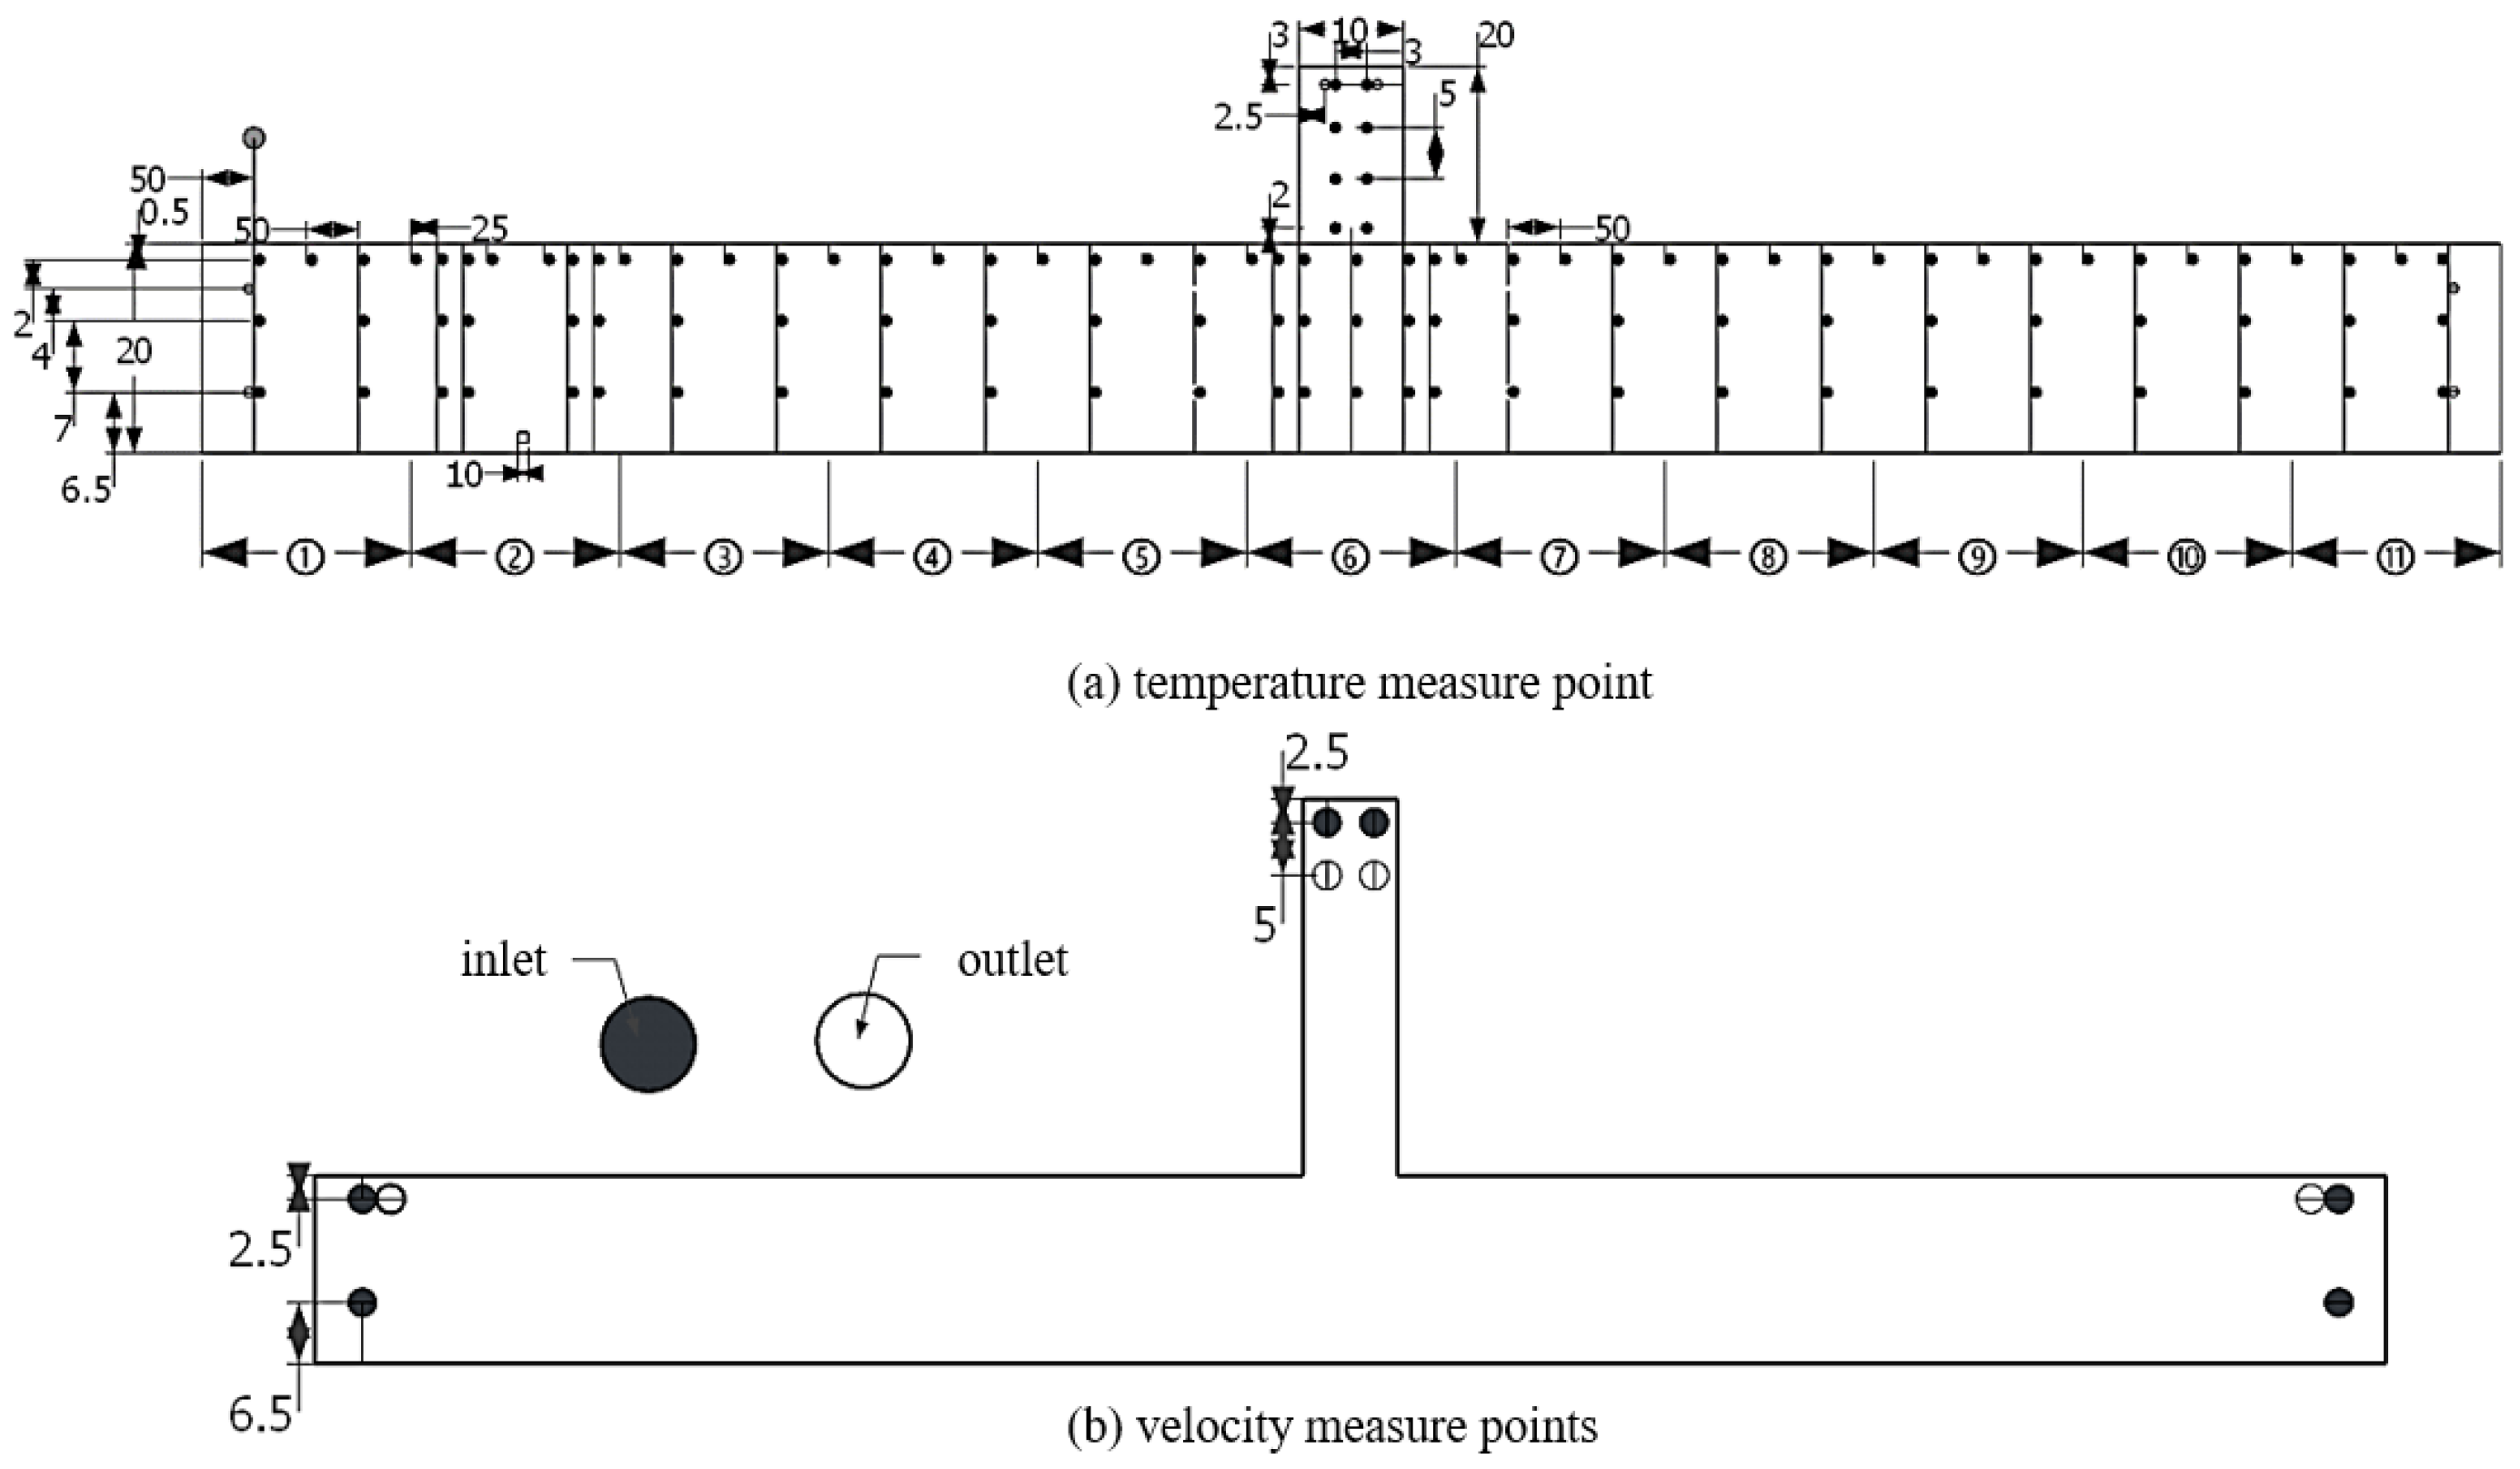
3.1. Experimental Model

A 22 m long small-scale model tunnel (1:30) was built in stainless-steel, and the vertical shaft is set in the middle of the tunnel (shown in Figure 1). In order to reduce the heat loss from the tunnel wall, asbestos was laid on the outer wall of the tunnel. The heat source is a ceramic heating core with power of 3 kW.
A total of 110 type K thermocouples were arranged in the model tunnel, 5 cm, 6.5 cm, 13.5 cm beneath the tunnel ceiling respectively with an interval of 50 cm, see Figure 2a. For every 10 cm increase in shaft height, four measuring points are added in the shaft. To study the air flow at the tunnel entrance, ten pitot tubes were arranged in the tunnel and shaft entrance to measure the inlet and outlet air velocity, see in Figure 2b. Two velocity measuring points of air inlet and exhaust are set in parallel at a place 50 cm away from the exit of the tunnel on the central axis, 2.5 cm away from the tunnel ceiling, and a velocity measuring point of air inlet is set at a distance of 6.5 cm from the bottom. Two parallel exhaust velocity measuring points are set at 2.5 cm away from the shaft outlet, and two parallel inlet velocity measuring points are set at 7.5 cm away from the shaft outlet.
The experimental results show that only when the slope increases by 2% will the relevant parameters change significantly. In order to analyze the change law of each parameter with slope more systematically, the tunnel slope needs to be increased continuedly. According to the specifications for design of highway tunnels in China, the slope of road tunnel should be between 0.3% and 3%, and can be increased to 4% under special circumstances. At present, the maximum longitudinal slope of road tunnels in China is 5% [31]. Urban tunnels with larger slopes are rare in daily life, and it is also difficult to build reduced-scale model with larger slopes. Therefore, numerical simulation is chosen for further study.

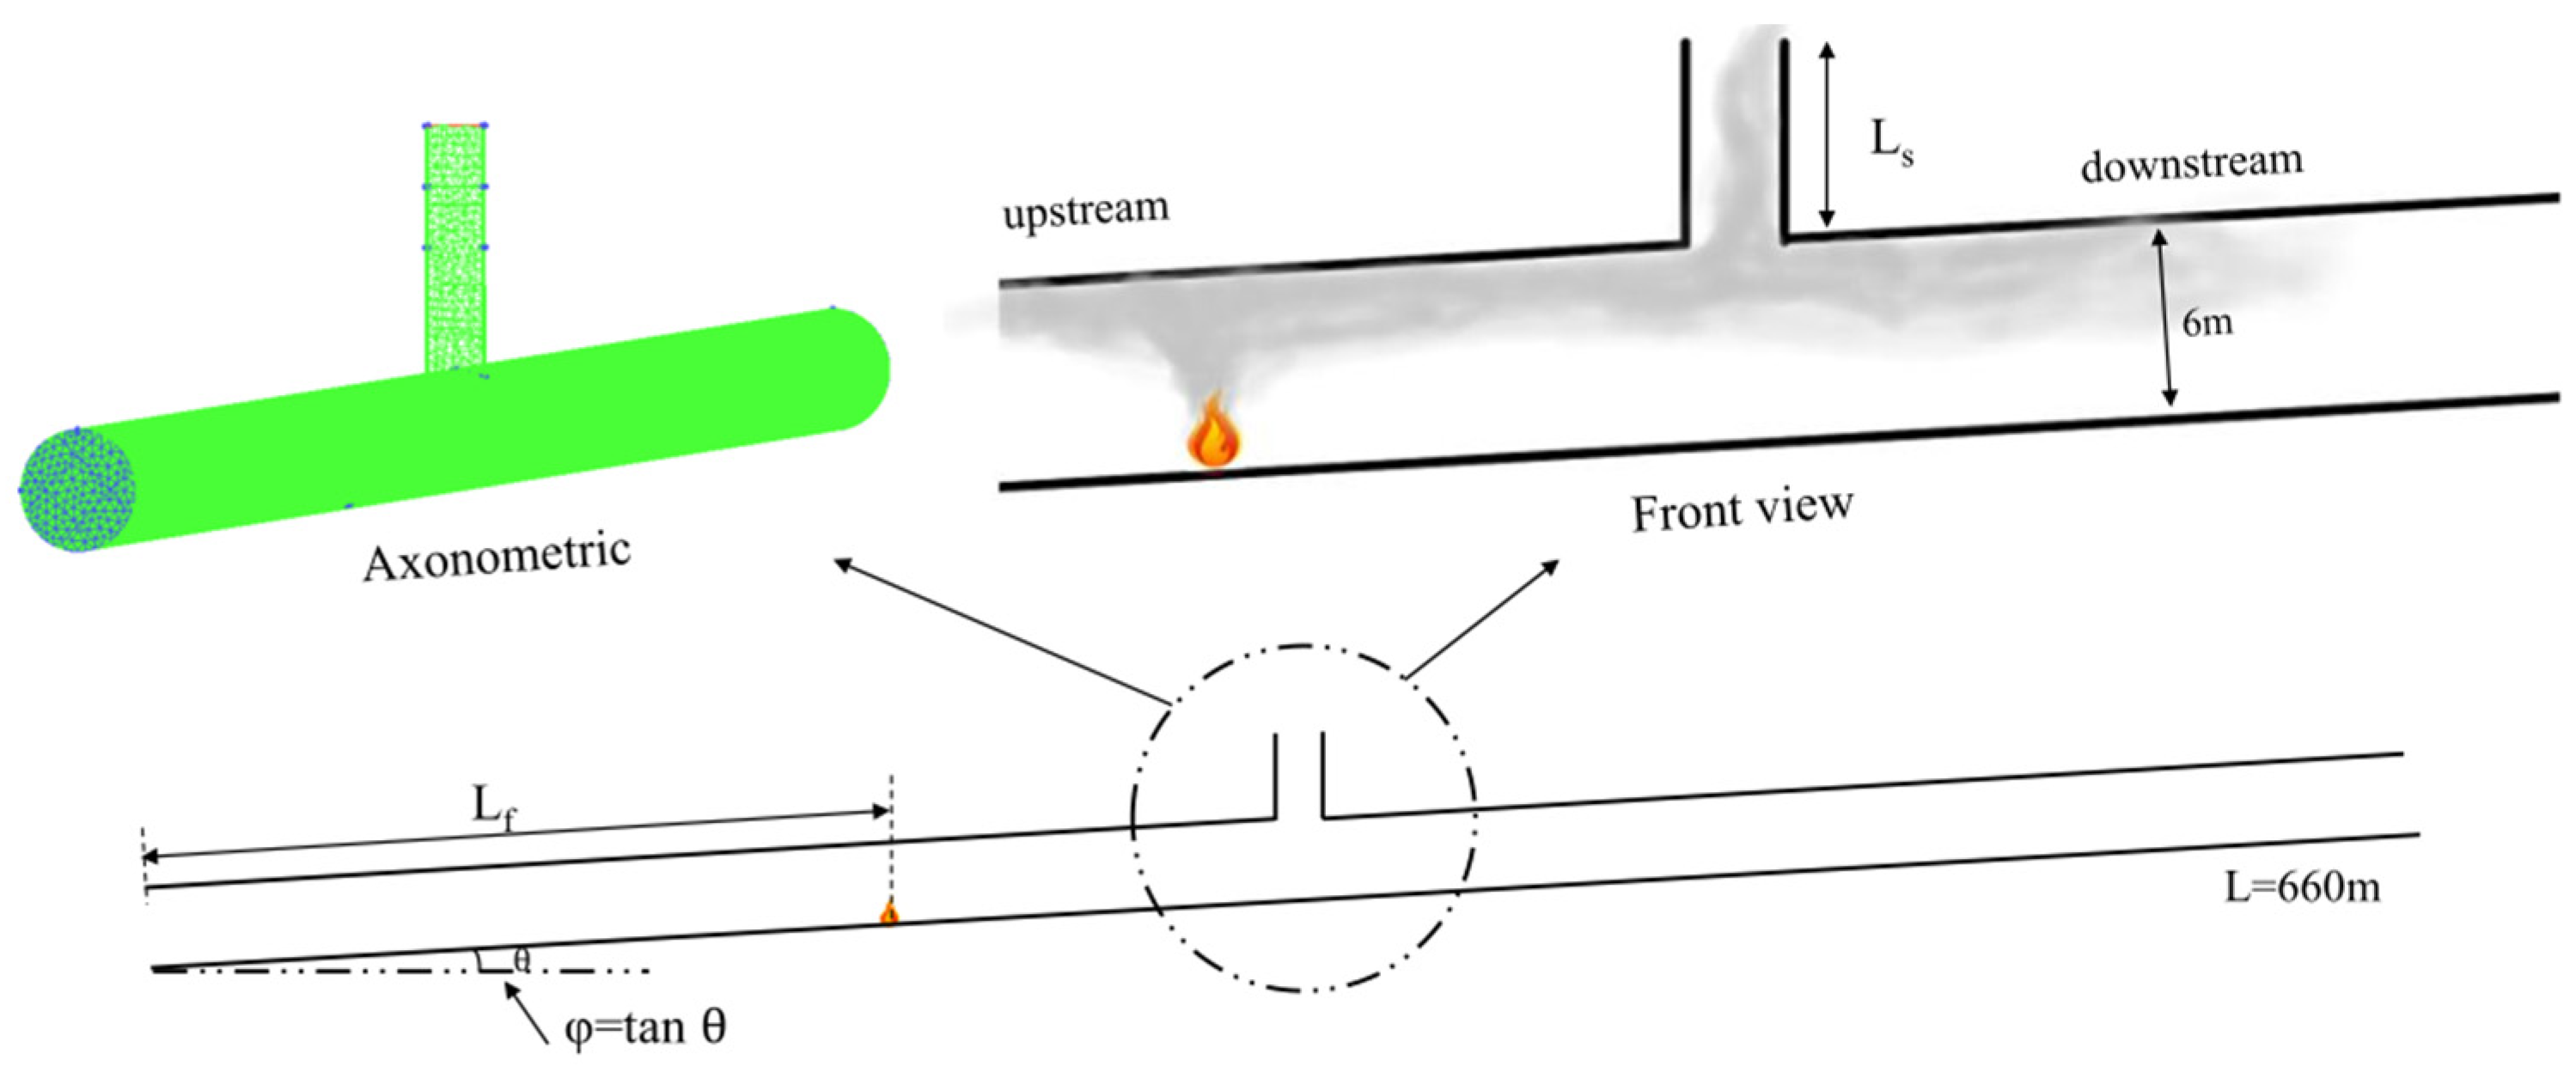
3.2. Numerical Simulation Model

Based on a section of the Mazao Expressway in Yunnan Province, China, an inclined tunnel with a cross-section diameter of 6 m and 660 m long was established. The height of the shaft is designed to be 6–12 m, Lf is located in 90–570 m, its position is symmetric about the shaft. A shaft is located in the center of the tunnel. The tunnel model is shown in Figure 3. Fluent is one of the most popular software in CFD (computational fluid dynamics) software package. It is also widely used in tunnel fire and tunnel ventilation research [32,33]. Based on the consideration of engineering model and calculation process, the RANS (Reynolds-averaged Navier–Stokes equations) was used in this simulation, and the RNG k-ε turbulence model was utilized in this research. Detailed parameter settings are in the preceding paper [34]. A summary of the simulation conditions is listed in Table 1.
A model tunnel is built, Ls = 6 m, θ = 0 , Lf = 90 m, the size of the fire source is 3 m × 3 m × 2.8 m. For choosing the most appropriate grid size, 4 grid sizes were selected to calculate. Figure 4 shows the vertical temperature variation at 200 m from the tunnel entrance under different grid sizes. It can be observed that from 0.4 m to 0.8 m, the curves of vertical temperature distribution trend to be uniform. Thus, the grid size of 0.5 m was chosen for the simulation.

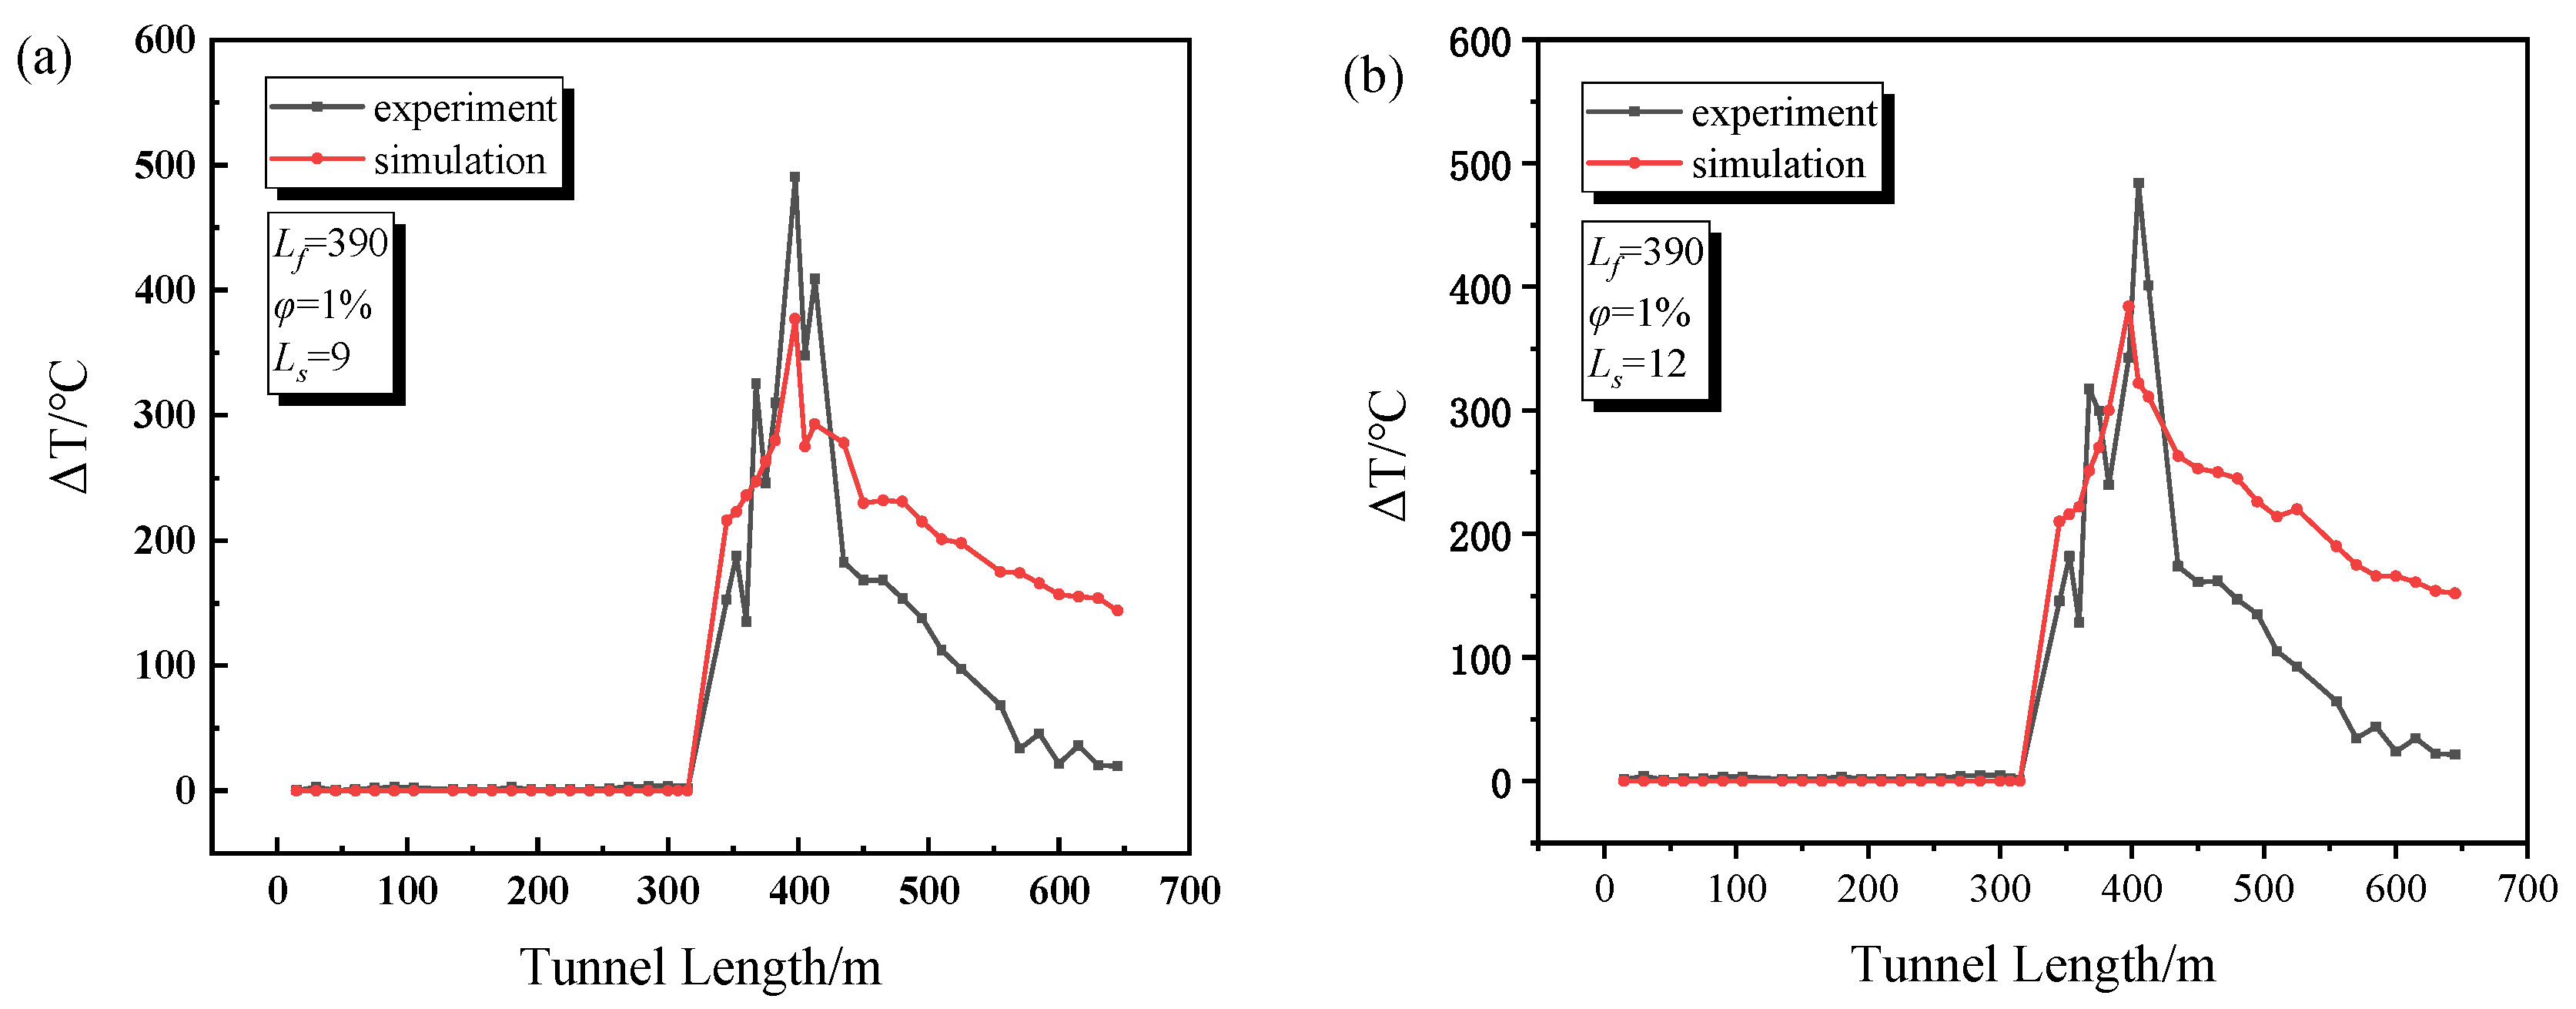
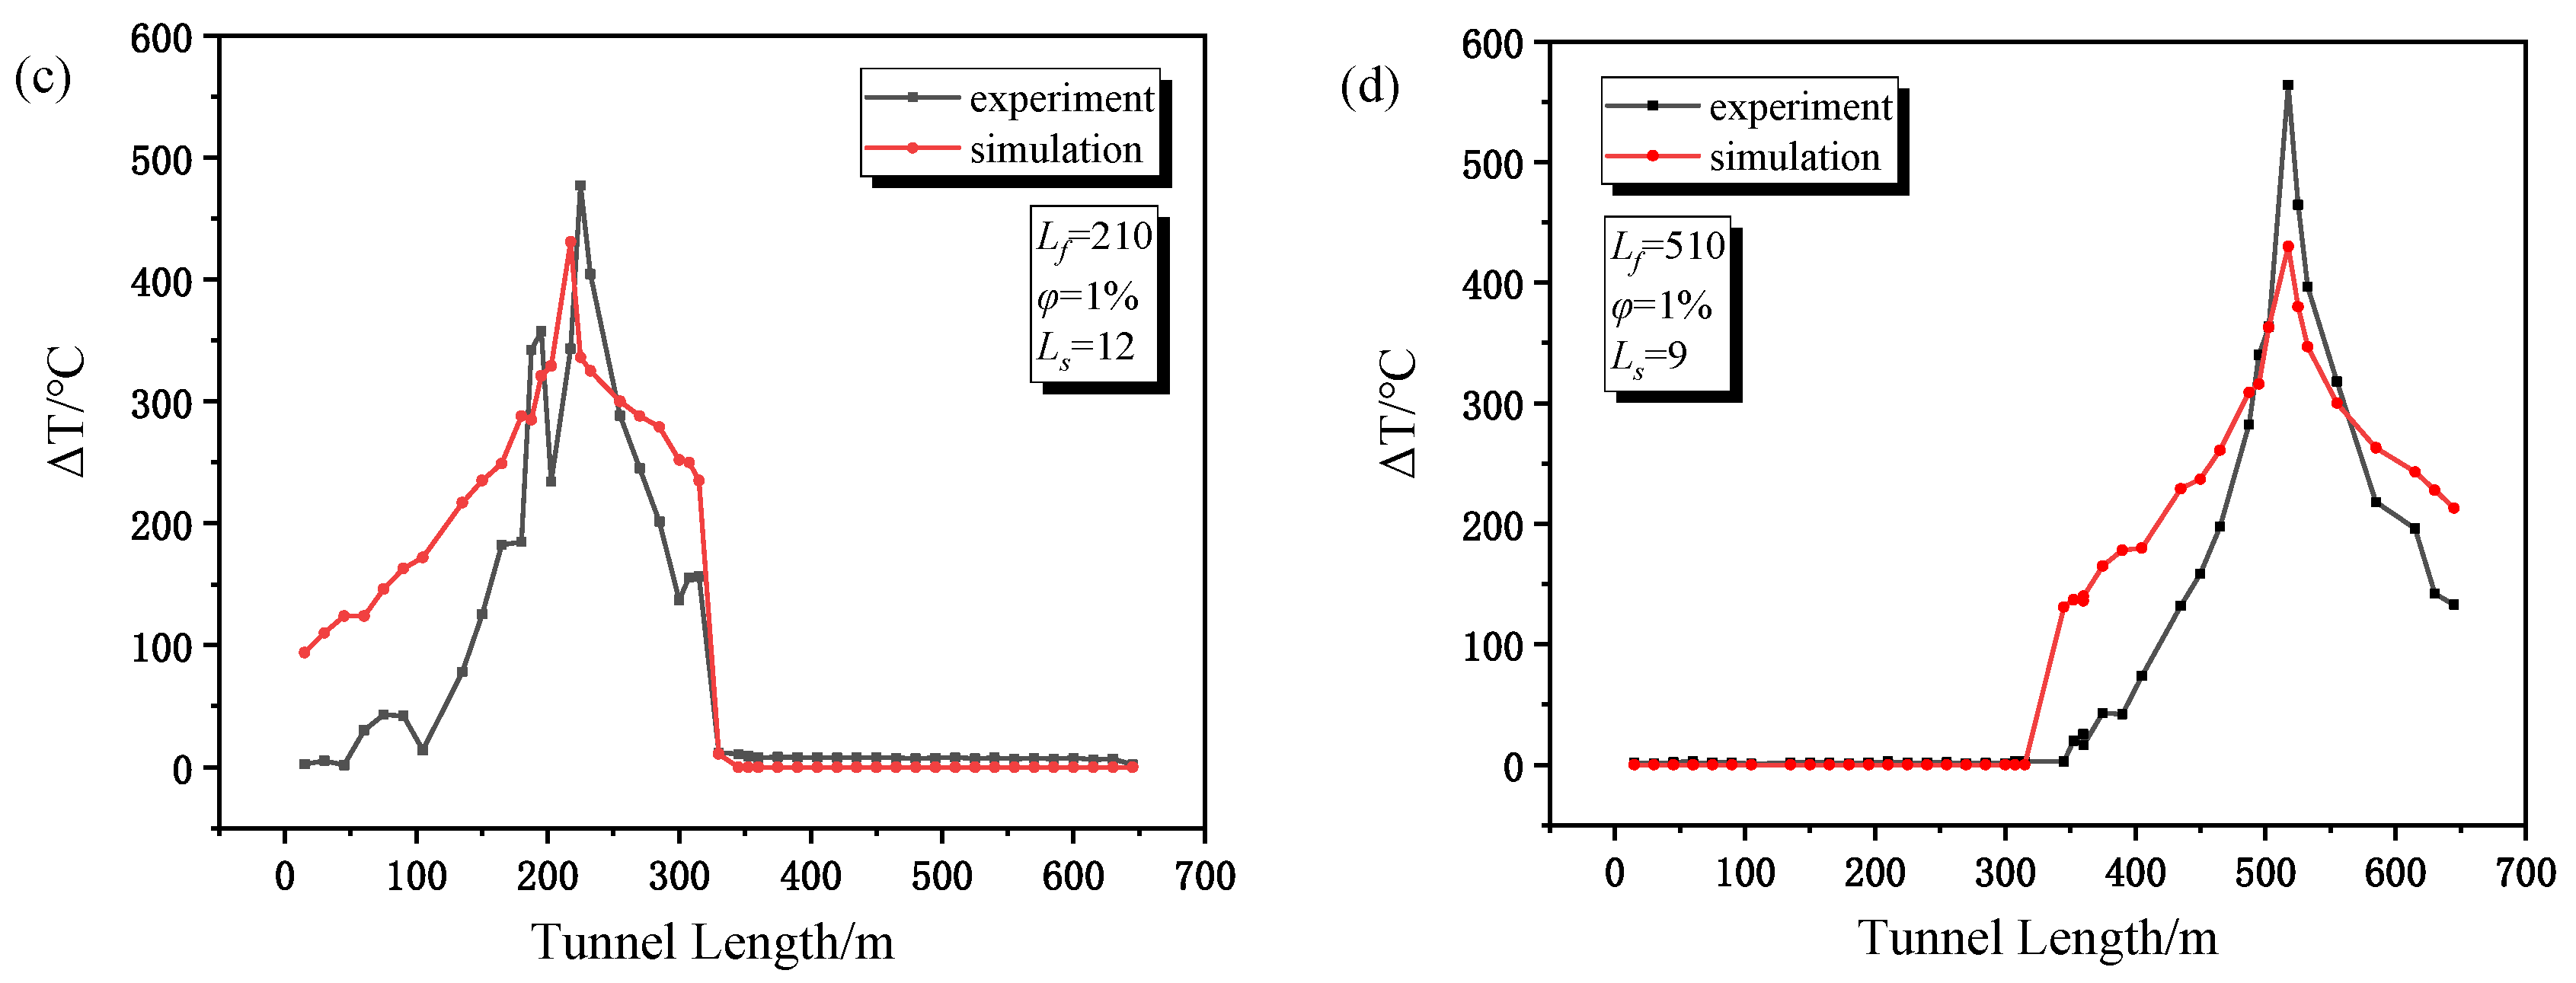
3.3. Experimental Verification

In this paper, numerical results by FLUENT model were verified by the small-scale experimental results. The comparison of maximum smoke temperature rise beneath the tunnel ceiling between numerical and experimental results is shown in Figure 5. The variation tendency of temperature was semblable and the two correlate well, but the maximum temperature was slightly different. This may be caused by the unavoidable heat loss and the use of electric heating.

4. Results and Discussion

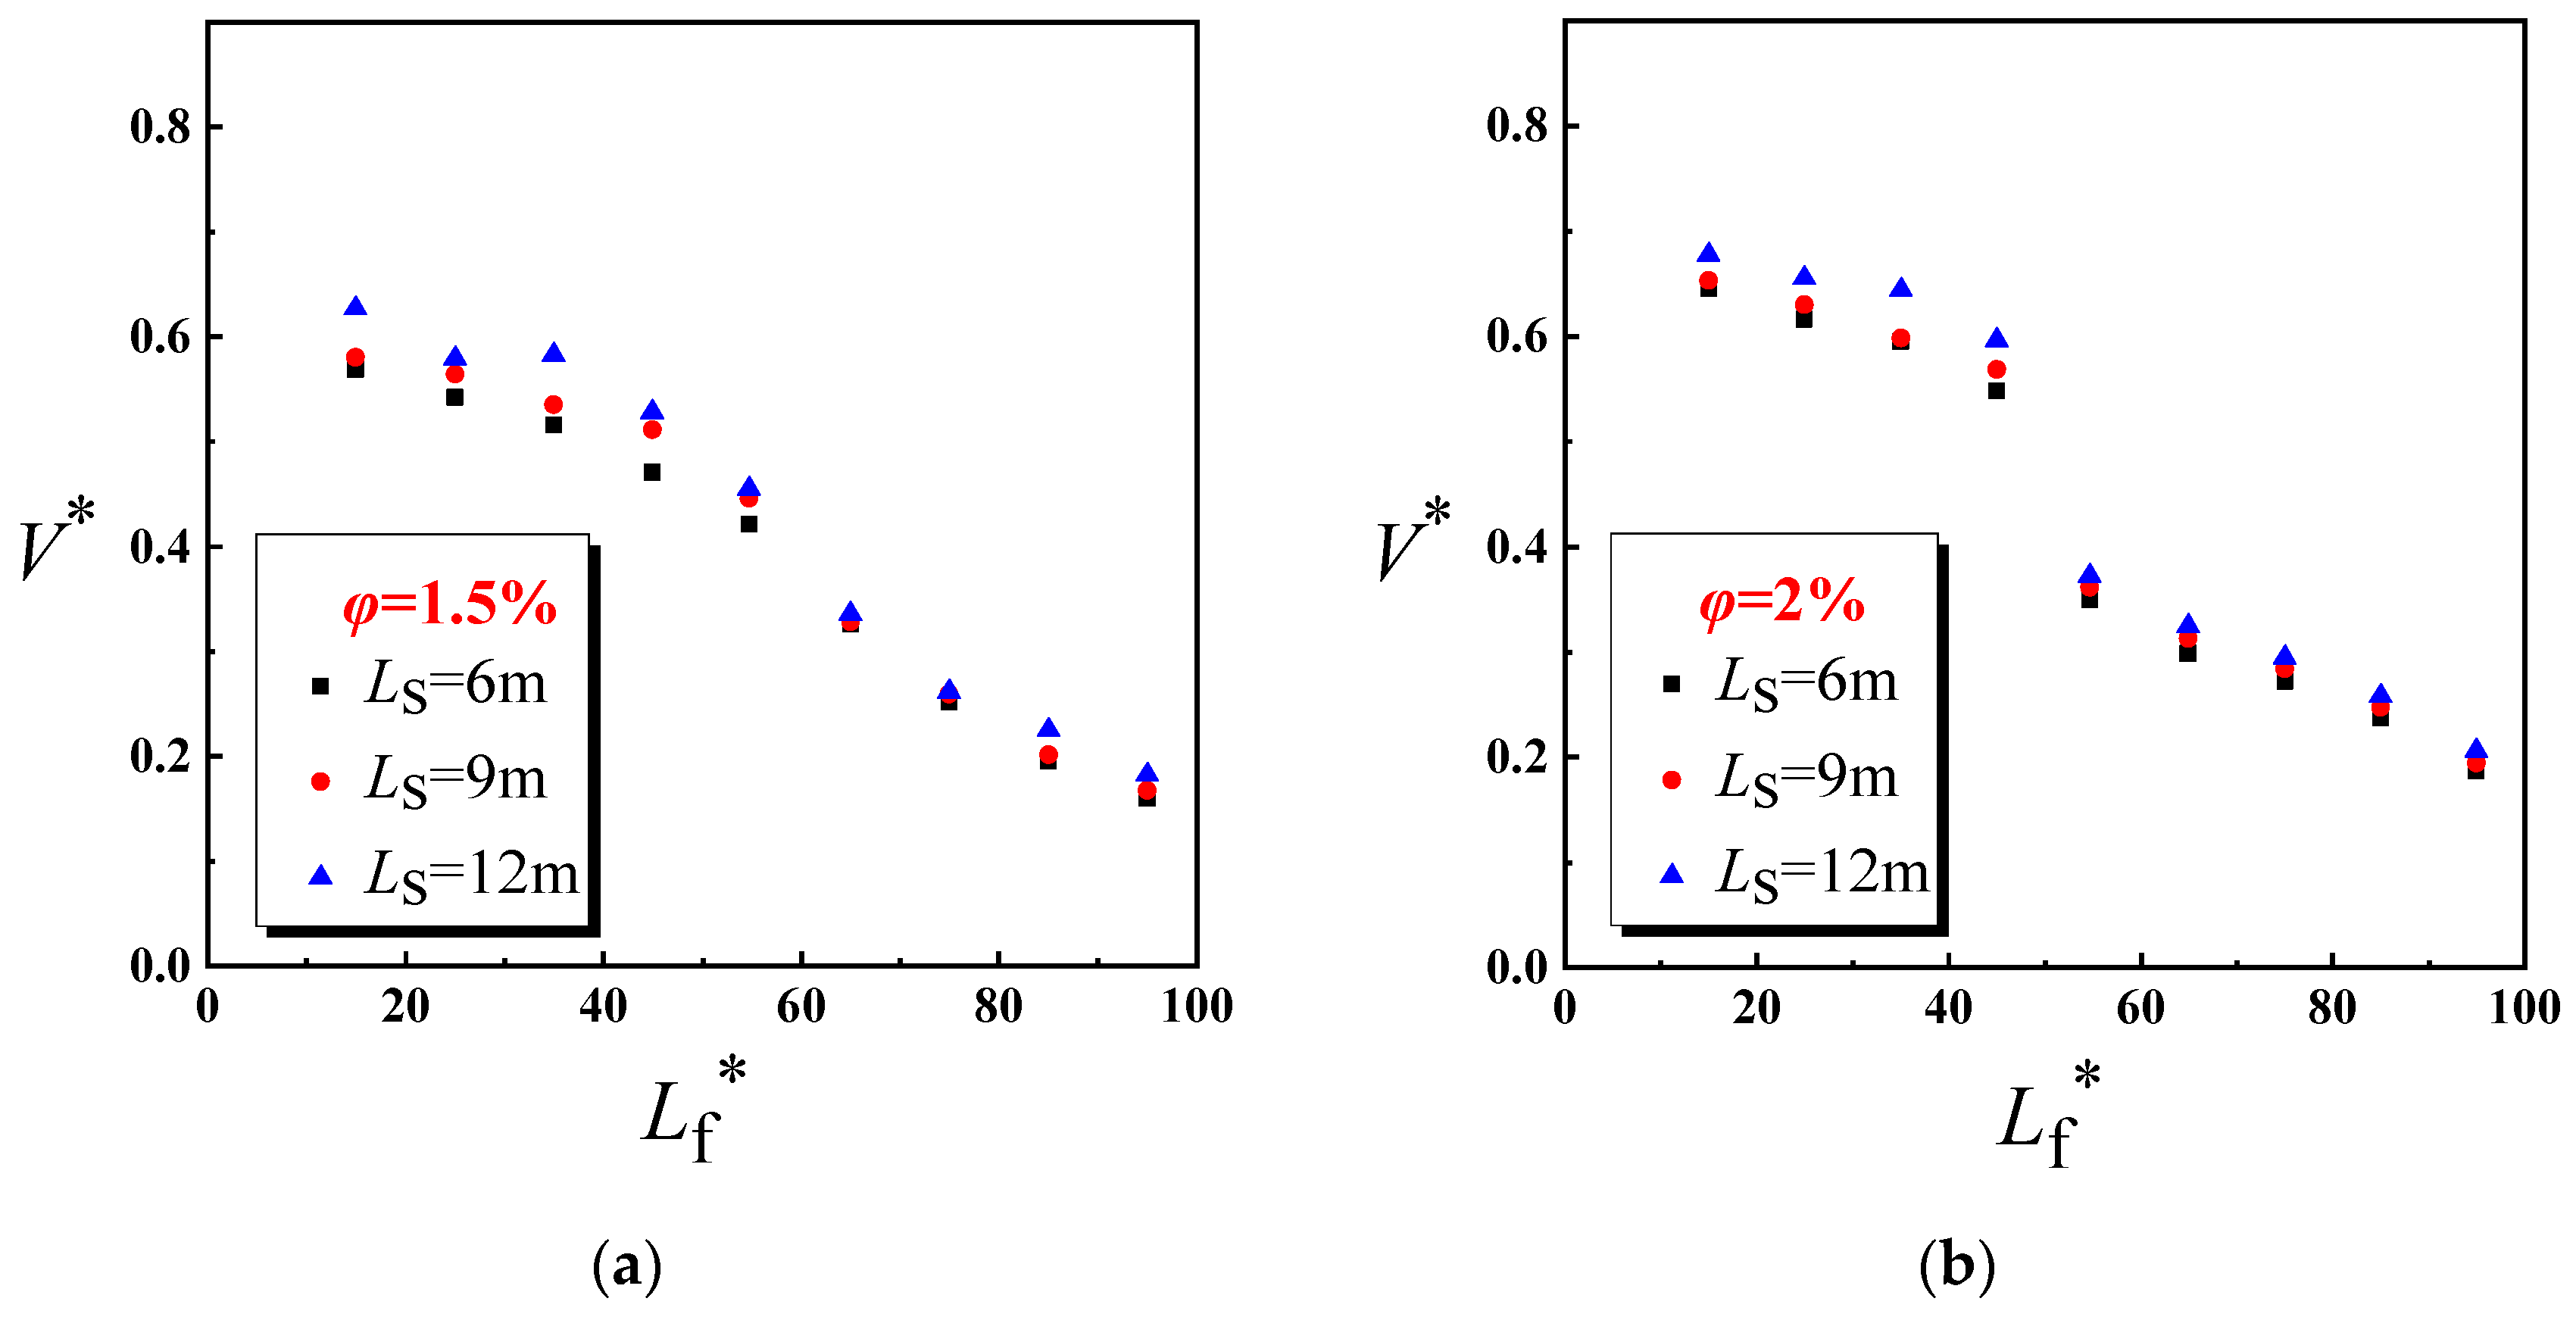
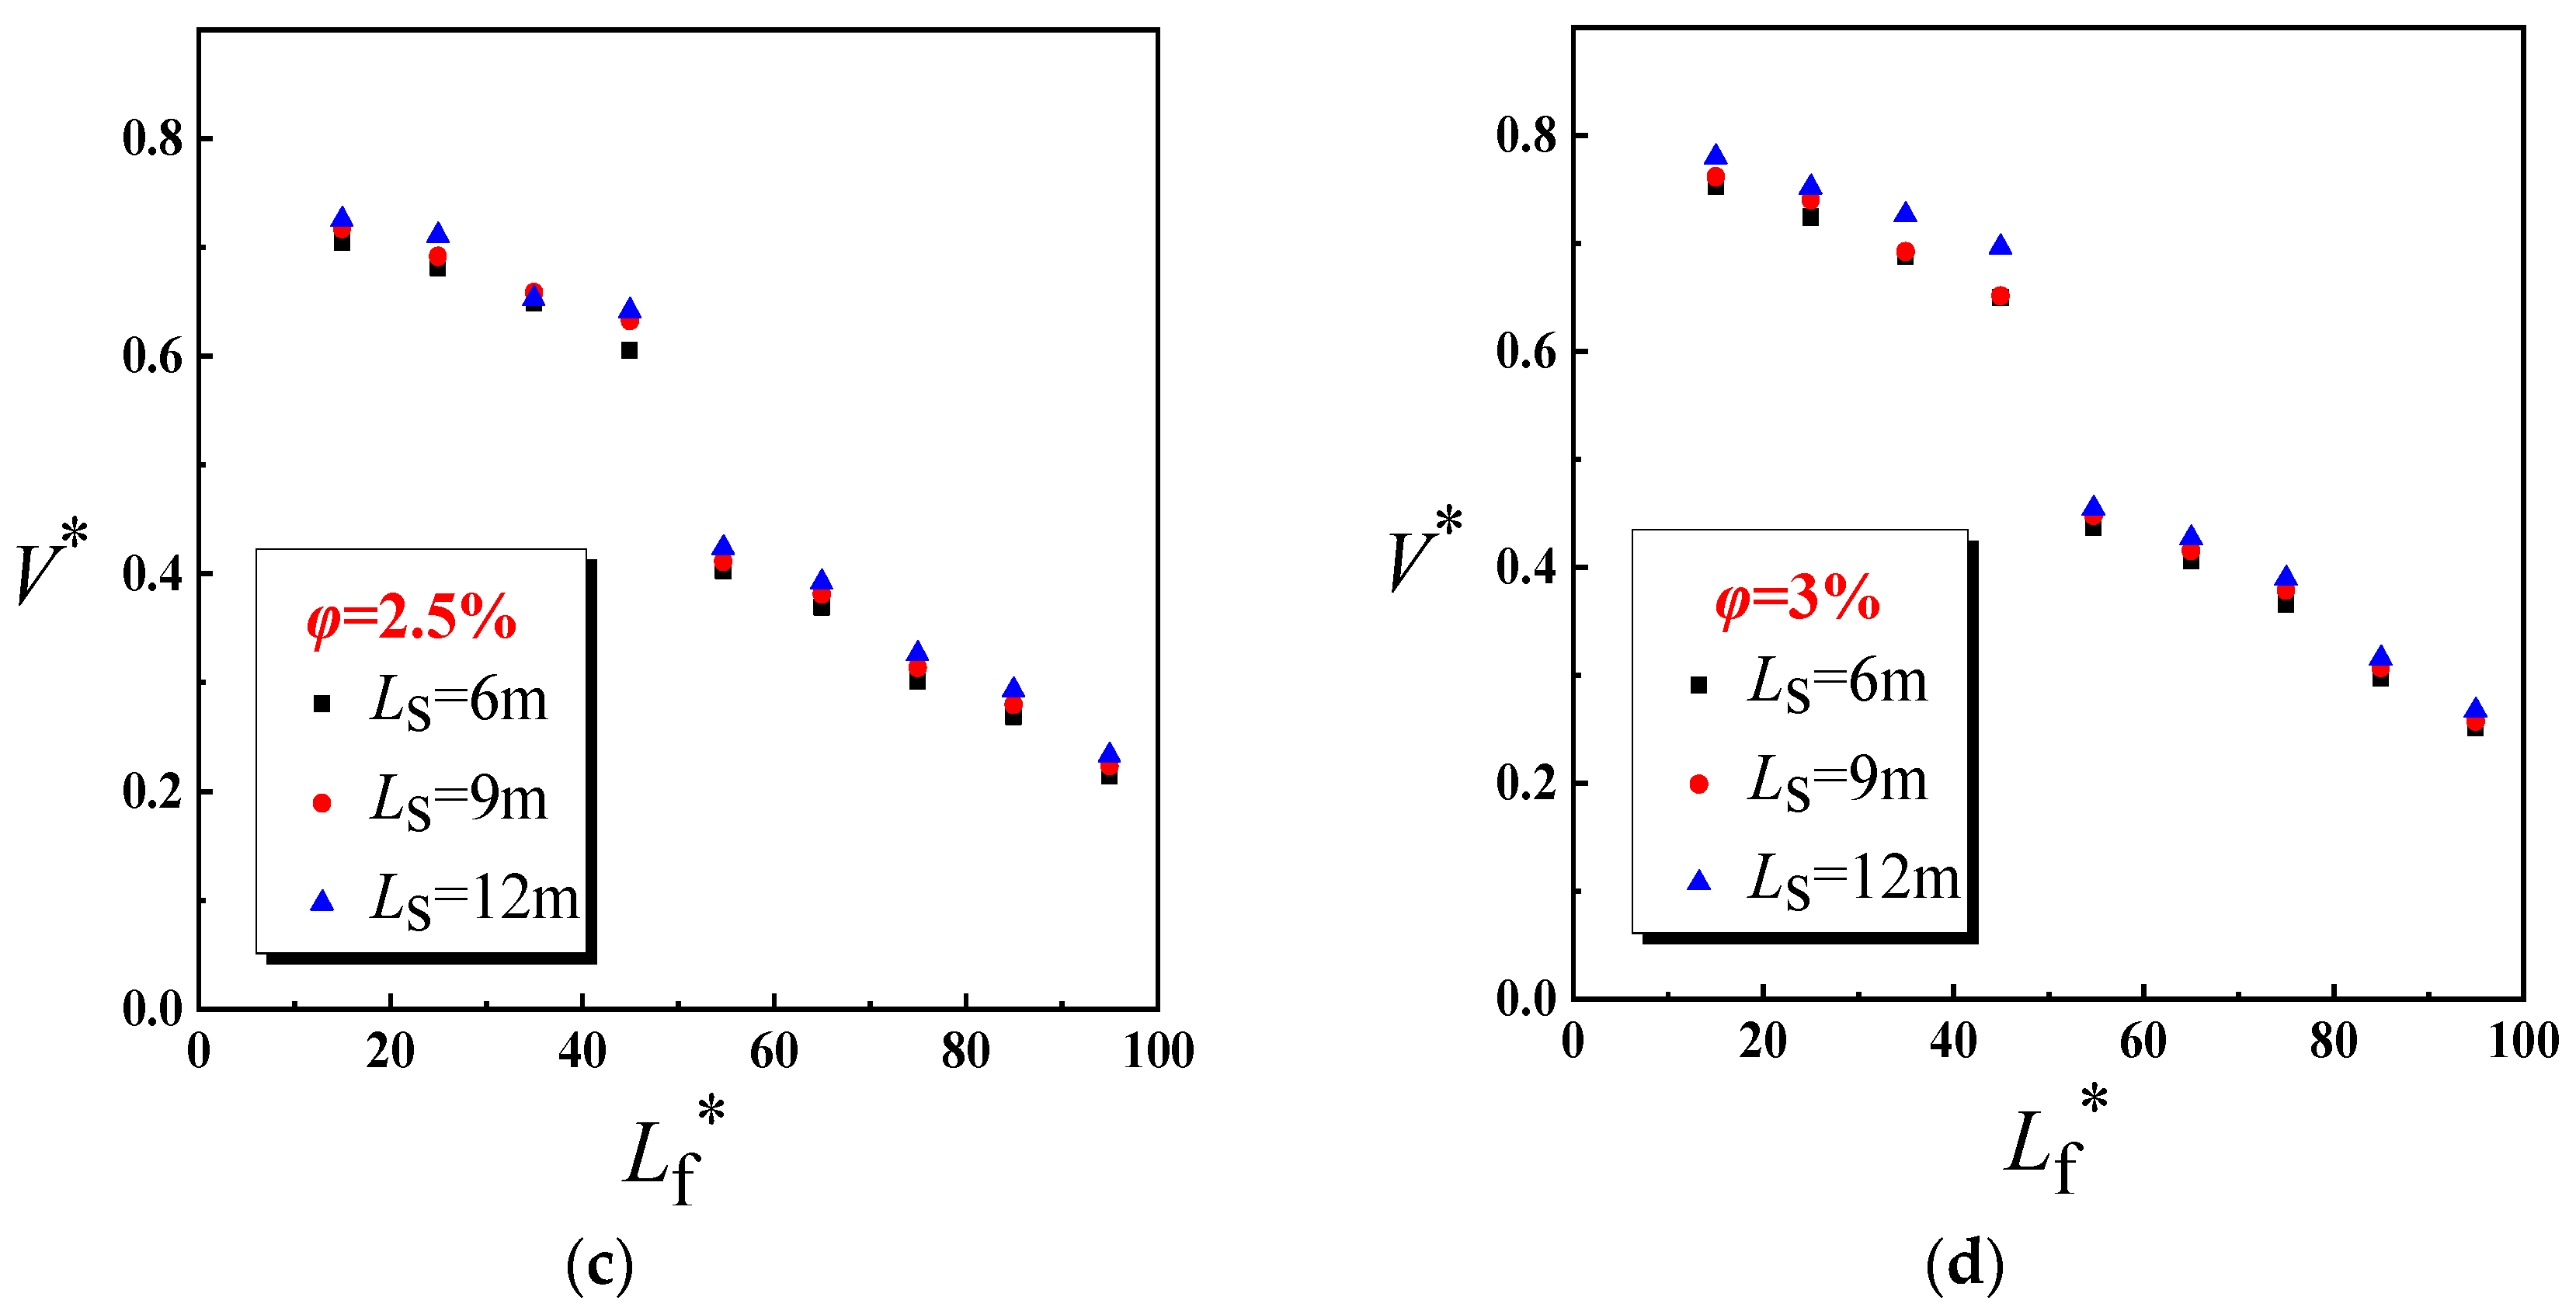
4.1. Dimensionless Longitudinal Inlet Air Velocity

Based on the theoretical analysis, the temperature field of the inclined tunnel with single shaft can be obtained by replacing the longitudinal ventilation speed with the longitudinal inlet air velocity. When the slope is greater than 1.5%, there is no outflow of smoke at the upstream entrance of the tunnel, but only the inflow of fresh air. Therefore, only the situations when the slope is greater than 1.5% will be discussed. Figure 6 shows the dimensionless relationship between inlet air velocity and Lf. Under different slopes, Lf has an important influence on inlet air velocity. Hence, the cases where the fire sources are located upstream and downstream of the shaft will be discussed separately.
According to Figure 7 and Figure 8, with the increase in Lf, the inlet air velocity decreases exponentially. It is worth noting that when the fire source is located downstream of the shaft, the variation trend of velocity under φ = 1.5 % is different from others. Through the flow field analysis, it is found that when φ = 1.5 % , the weak stack effect cannot prevent the backflow, the hot smoke spread to the shaft and been exhausted, the obvious temperature difference and pressure difference inside and outside the shaft drives the longitudinal flow, resulting in a lager inlet air velocity. The subsequent analysis temporarily ignores the conditions when L f 330 and φ = 1.5 % .
In this paper, the HRR is constant, and Equation (5) can be simplified as:
V * = q f ( L f * , L s * , φ )
The dimensionless relations between inlet air velocity and fire source location are fitted, the fitting coefficients are shown in Table 2 and Table 3. The average of the fitting curve coefficient is selected. When L f 330 , V * is positively correlated with ( L f * ) 0.12 . When L f > 330 , V * is positively correlated with ( L f * ) 0.96 . Therefore, dimensionless relationship can be written as:
V * q ( L f * ) 0.12 = f ( L s * , φ ) ,   L f 330
V * q ( L f * ) 0.96 = f ( L s * , φ ) ,   L f > 330
Substituting the simulation results into Equations (16) and (17), the dimensionless relationship between tunnel slope and inlet air velocity can be obtained as shown in Figure 9 and Figure 10. With the increase in slope, the inlet air velocity increases. The dimensionless relation between inlet air velocity and slope is fitted, and the average of the fitting curve coefficient is selected. When L f 330 , V * is positively correlated with φ0.38. When L f > 330 , V * is positively correlated with φ0.59. Moreover, the dimensionless expressions are:
V * q ( L f * ) 0.12 φ 0.38 = f ( L s * ) ,   L f 330
V * q ( L f * ) 0.96 φ 0.59 = f ( L s * ) ,   L f > 330
Substituting the simulation results into Equations (18) and (19), the dimensionless relationships between Ls and inlet air velocity can be presented as Figure 11 and Figure 12. As the height of the shaft increases, the inlet air velocity increases slowly. When L f 330 , V * is positively correlated with 4.42 + 0.138 ( L s * ) 1.477 . When L f > 330 , V * is positively correlated with 71.06 + 1.40 ( L s * ) 2.63 .
As mentioned above, the dimensionless relation between the inlet air velocity, the tunnel slope, the shaft height, and the fire source distance can be expressed as:
V * = { q ( L f * ) 0.12 φ 0.38 ( 4.42 + 0.138 ( L s * ) 1.477 ) ,   L f   330 q ( L f * ) 0.96 φ 0.59 ( 71.06 + 1.40 ( L s * ) 2.63 ) ,   L f > 330
Figure 13 shows the comparison of dimensionless inlet air velocity between predicted and simulated. As can be seen from Figure 13, the predicted model gives satisfactory result, and the error range is within 15%.
When L f > 330 , the dimensionless relation curve between the inlet air velocity at the shaft outlet and the shaft height is shown in the Figure 14. The fitting coefficients are shown in Table 4. With the increase in the shaft height, the inlet air velocity decreases. V s * is positively correlated with ( L s * ) 0.32 , the dimensionless relation between inlet air velocity at the shaft outlet and the shaft height can be expressed as:
V s * q ( L s * ) 0.32 = f ( L f * , φ ) ,   L f 330 m
Substituting the simulation results into Equation (20), the dimensionless relationship between inlet air velocity at the shaft outlet and tunnel slope is shown in Figure 15.
The inlet air velocity at the shaft outlet changes positively as the tunnel slope increases. When the distance between fire source and shaft gets closer, the temperature and pressure difference between inside and outside the shaft is larger, and then the slope has stronger effect on the inlet air velocity.
When L f > 330 , V s * is positively correlated with φ 2.45 and the relation can be expressed as:
V s * q ( L s * ) 0.32 φ 2.45 = f ( L f * )
The simulation results were substituted into Equation (22), the dimensionless relation between the inlet air velocity at the shaft outlet and the fire source location is shown in Figure 16. As the distance between the fire source and the shaft increases, the inlet air velocity at the shaft outlet shows a weakening trend.
The dimensionless relation between the fire source location and the inlet air velocity of the shaft outlet is fitted, and the relation can be expressed as:
V s * = q ( L s * ) 0.32 φ 2.45 ( 14.12 + 16.91 ( L f * ) 0.04 )
Based on the continuity equation and the law of conservation of mass, Equation (24) can be obtained:
A t V k = A s V s + A t V in
A t is the tunnel cross sectional area, A s is the shaft cross sectional area, V k is the tunnel inlet air velocity when L f > 330 , V s is the air inlet velocity at shaft export.
Based on Equations (20), (23), and (24), longitudinal inlet air velocity can be written as:
V k * = V k g H = q ( L f * ) 0.96 φ 0.59 ( 71.06 + 1.40 ( L s * ) 2.63 ) + A s A t q ( L s * ) 0.32 φ 2.45 ( 14.12 + 16.91 ( L f * ) 0.04 )
Vk can be determined by fire load, slope, fire source distance, and shaft height.

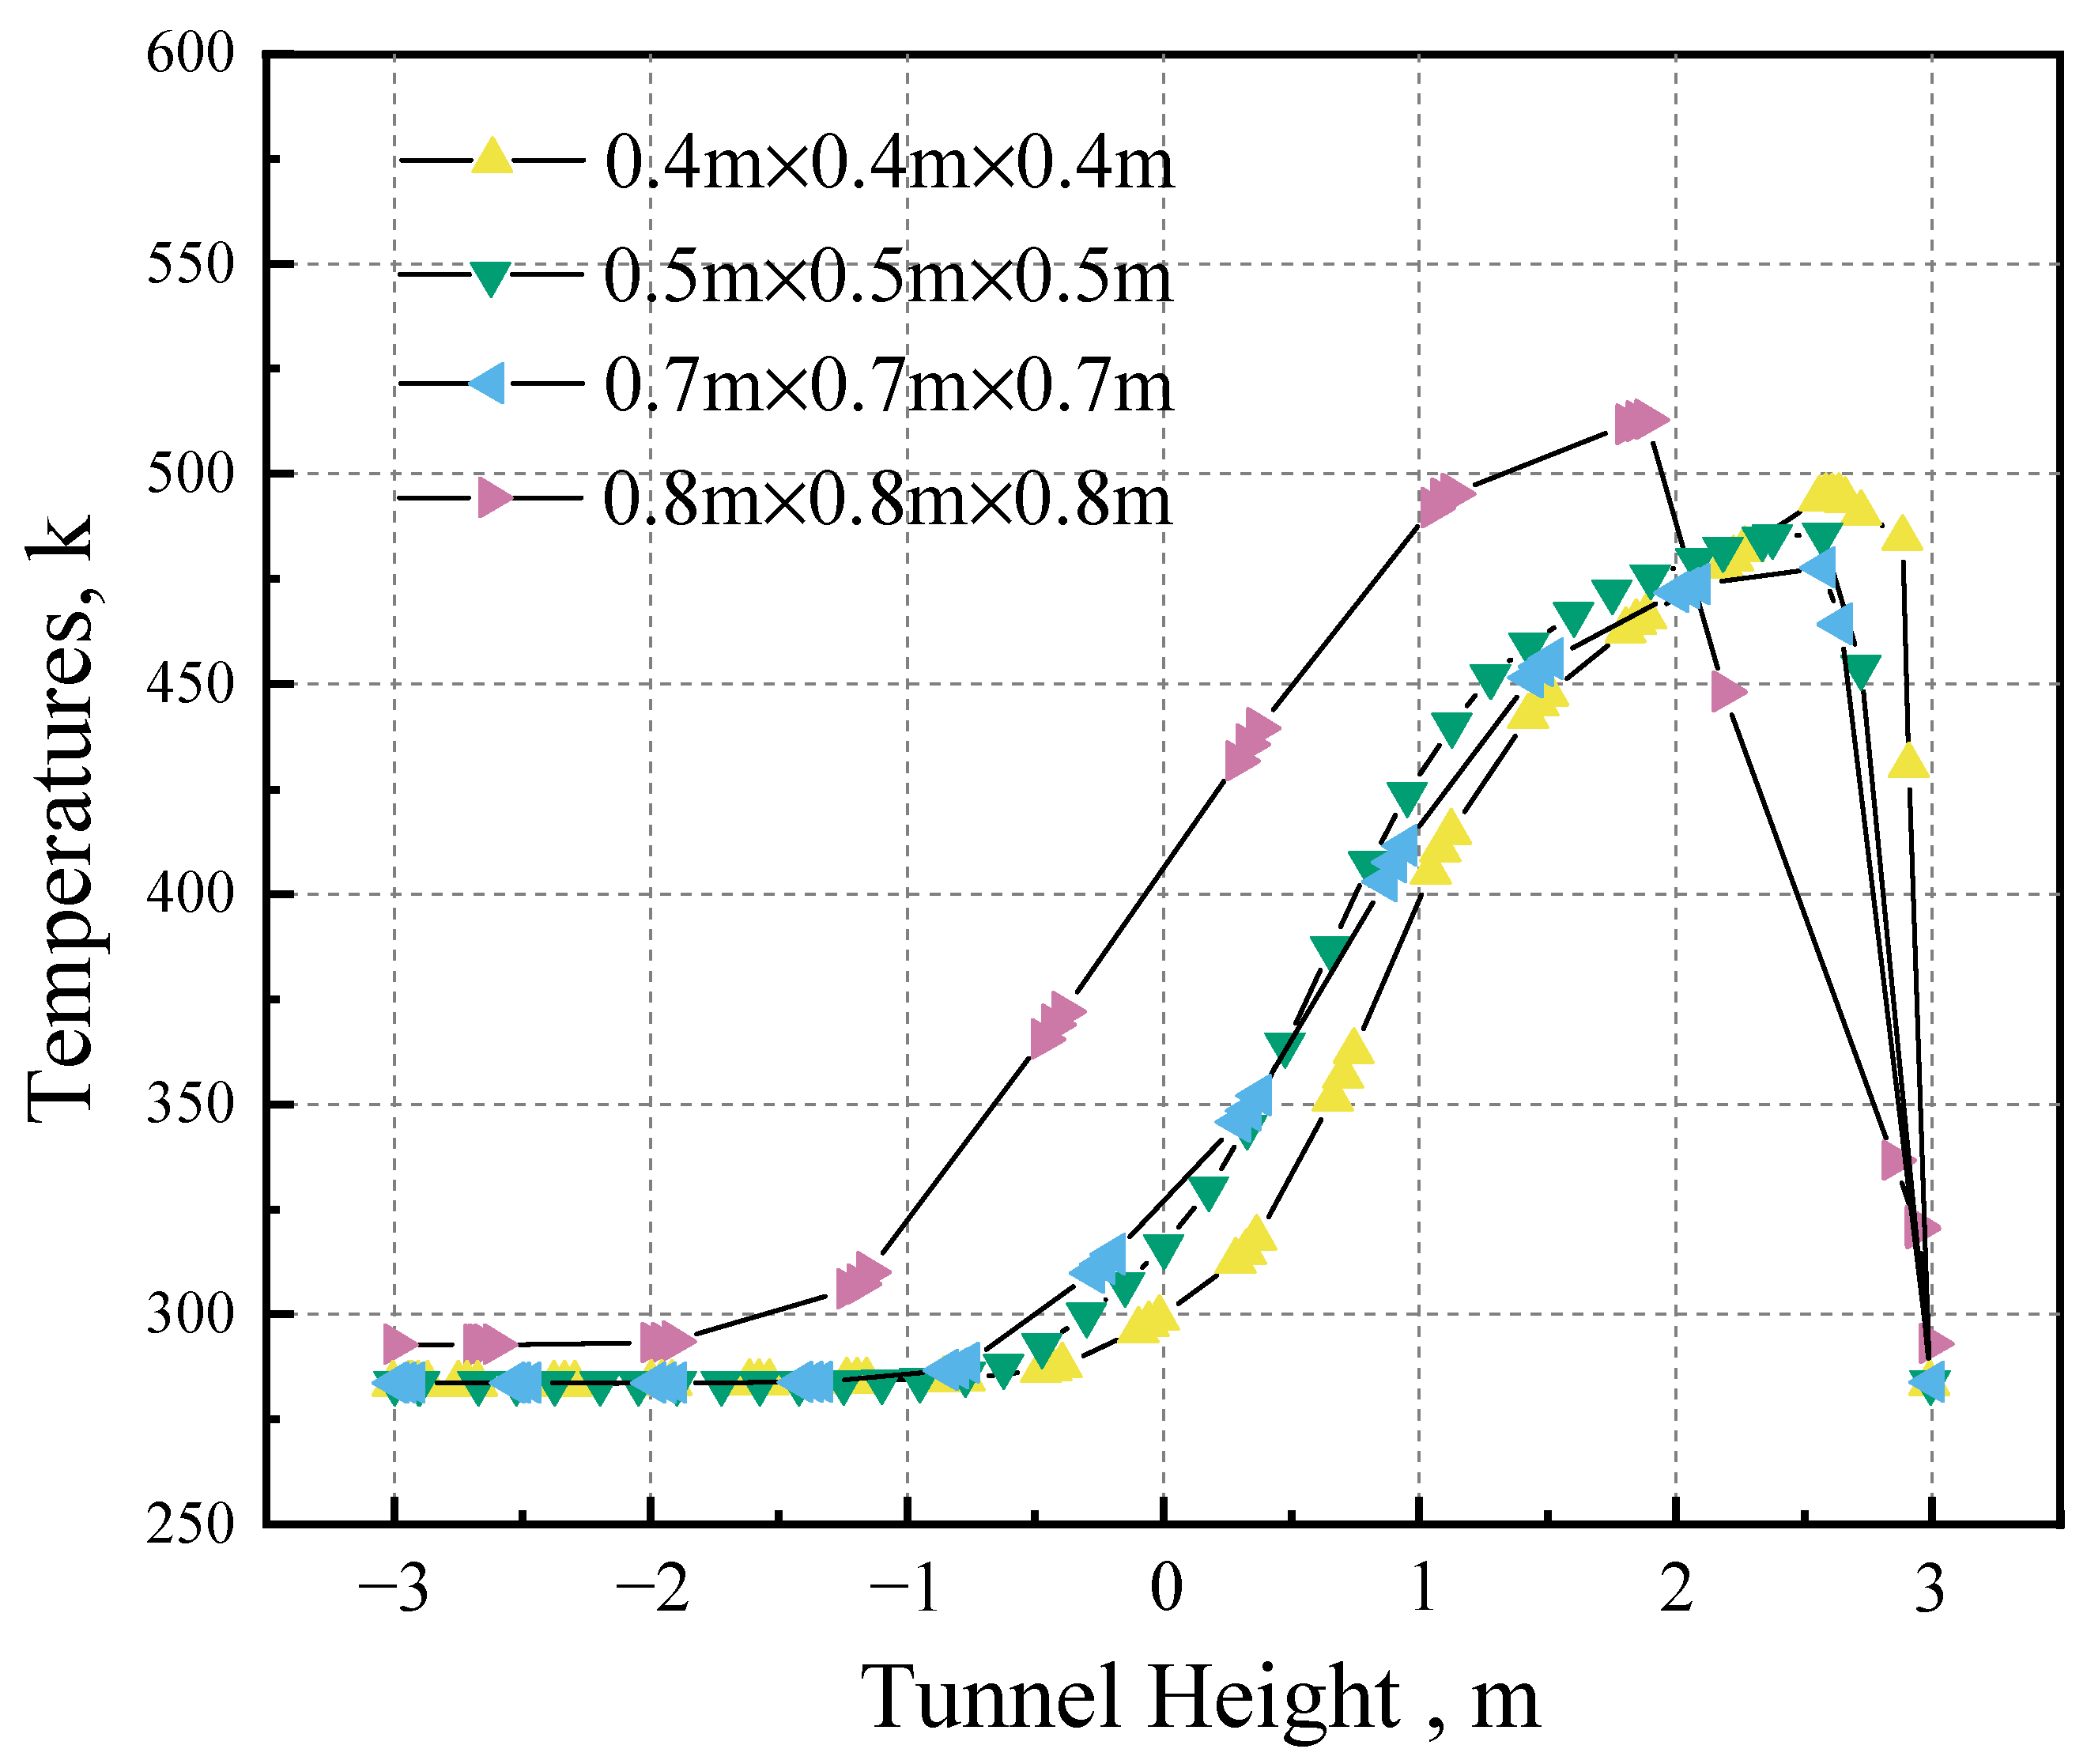
4.2. Distribution of the Maximum Smoke Temperature under the Ceiling

According to Equation (7), V** has strong effect on Δ T max . By substituting the longitudinal inlet air velocity into Equation (7), it can be found that V * * > 0.19 no matter where the fire source location is. f ( σ ) is fitted separately when the fire source is located upstream or downstream of the shaft. As shown in Figure 17, Δ T max is linearly related to f ( σ , Q ˙ / V t r 1 / 3 H d 5 / 3 ) . Therefore, Δ T max can be further written as:
Δ T max ( ρ 0 c p T 0 ) 1 / 3 1.876 g 1 / 3 = f ( σ , Q ˙ V t r 1 / 3 H d 5 / 3 ) ,   V * * > 0.19
Δ T max = { ( g ρ 0 c p T 0 ) 1 3 ( 2.17 Q ˙ V in r 1 / 3 H d 5 / 3 35.14 ) ,   L f   <   L d ( g ρ 0 c p T 0 ) 1 3 ( 4.08 Q ˙ V k r 1 / 3 H d 5 / 3 232.9 ) ,   L f   >   L d
Figure 18 shows that the prediction results are in good agreement with the simulation results, and the error range is less than 20%.
The comparison between the simulation and prediction results of the distribution of the maximum smoke temperature under the tunnel ceiling when Lf = 150 m and Lf = 450 m is shown in Figure 19. The predicted results are consistent with the simulation results, and the error range is less than 20%.

5. Conclusions

In this paper, the effects of the fire source location, the tunnel slope, and the shaft height on the smoke temperature distribution in an inclined tunnel with single shaft were studied and the major conclusions are as follows:
(1)
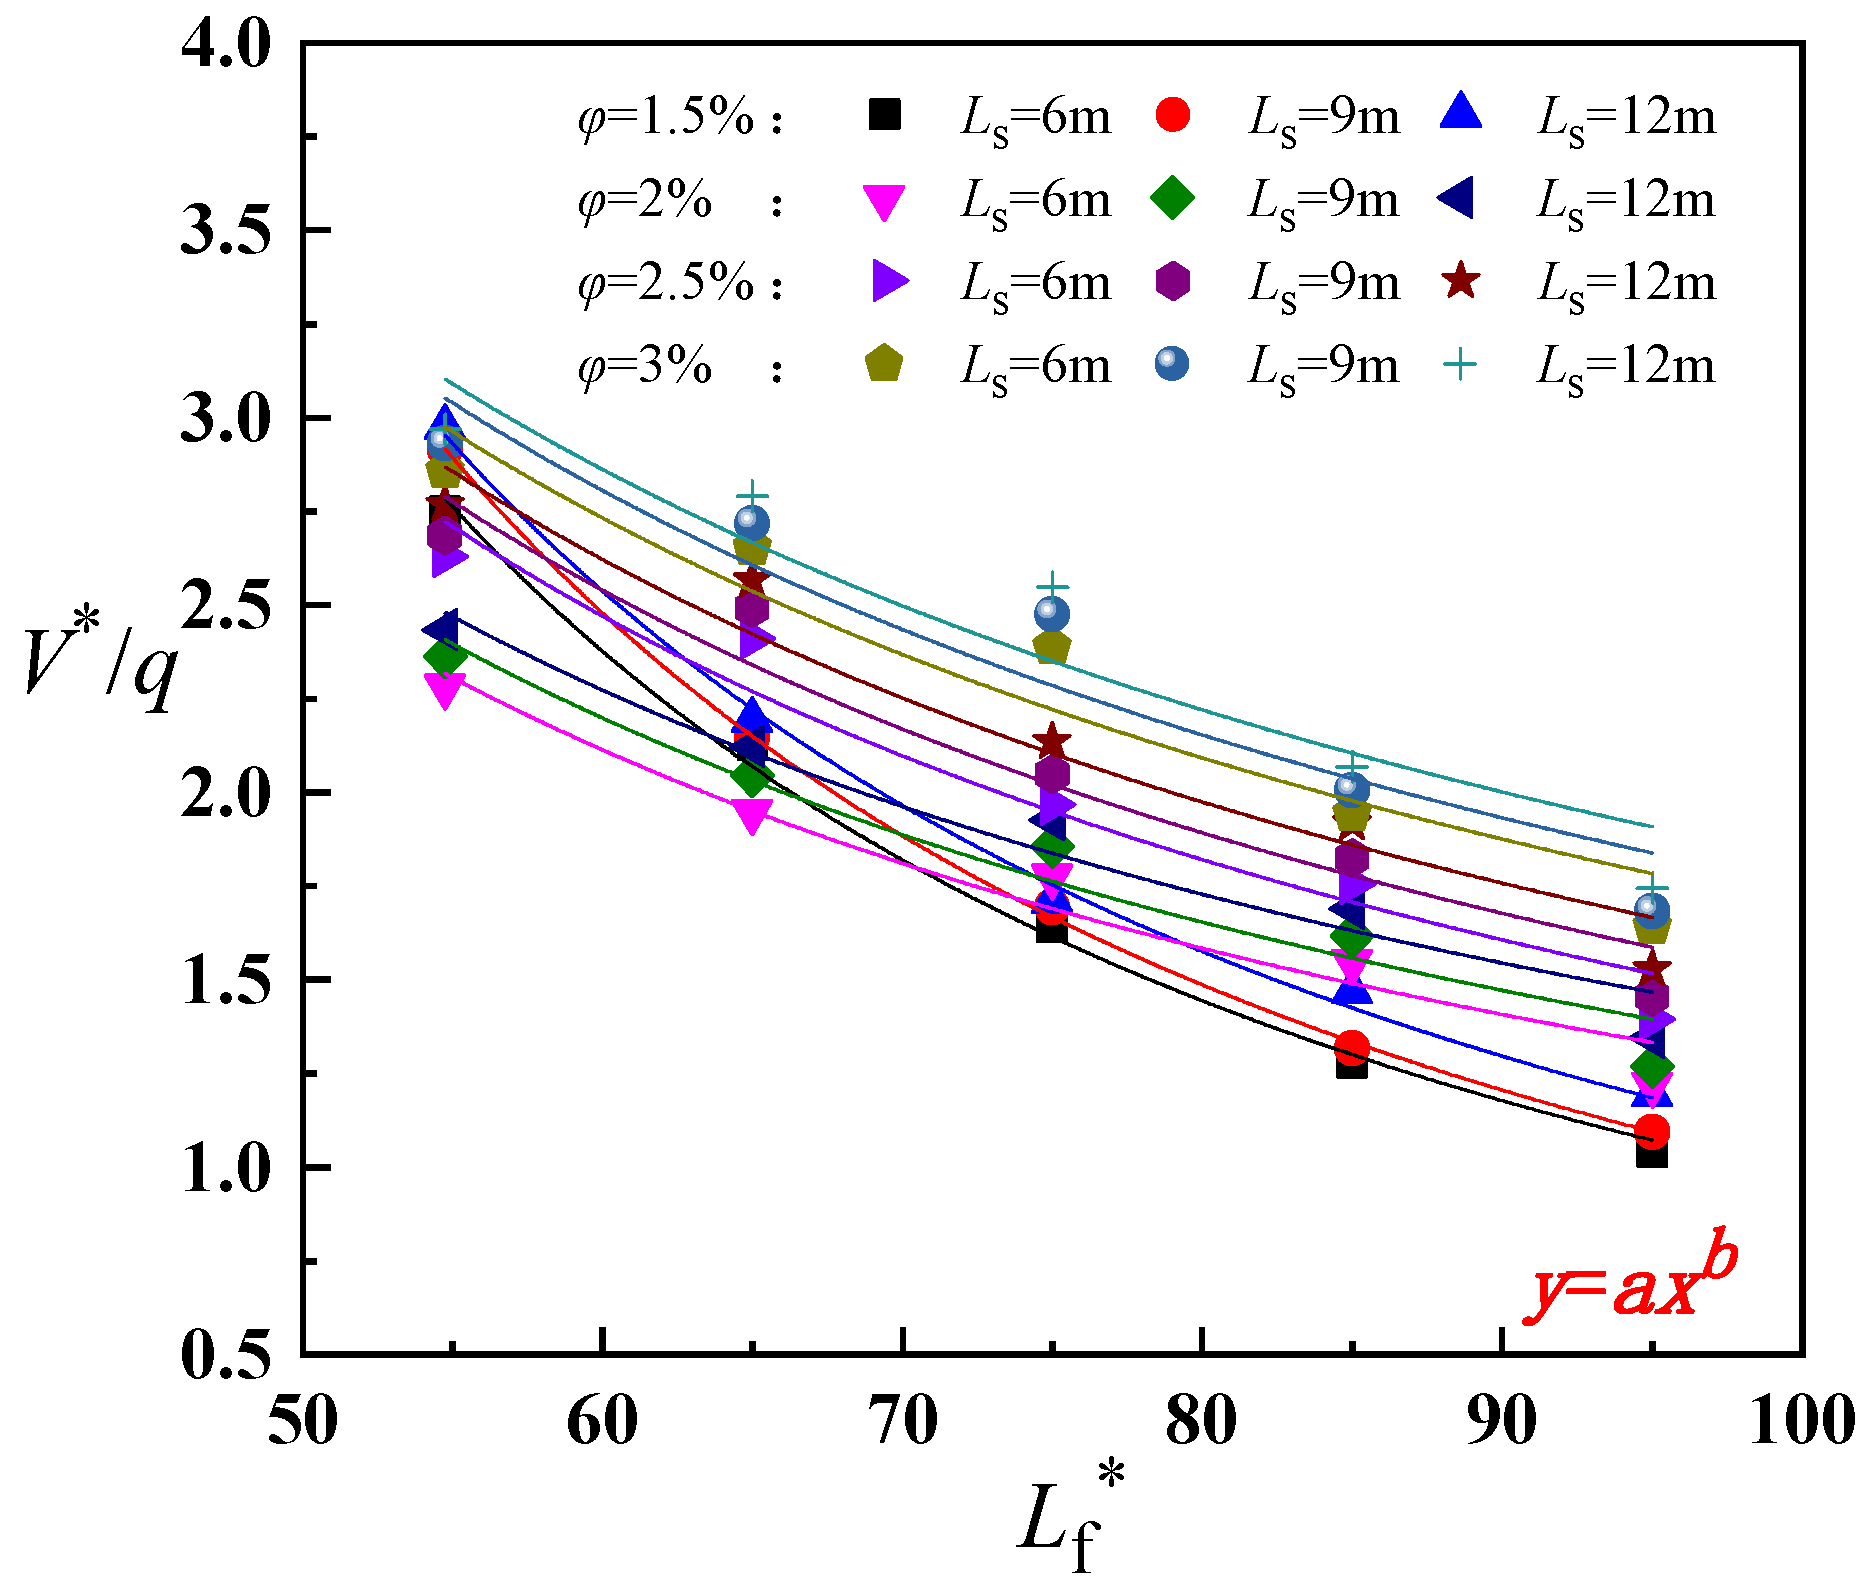
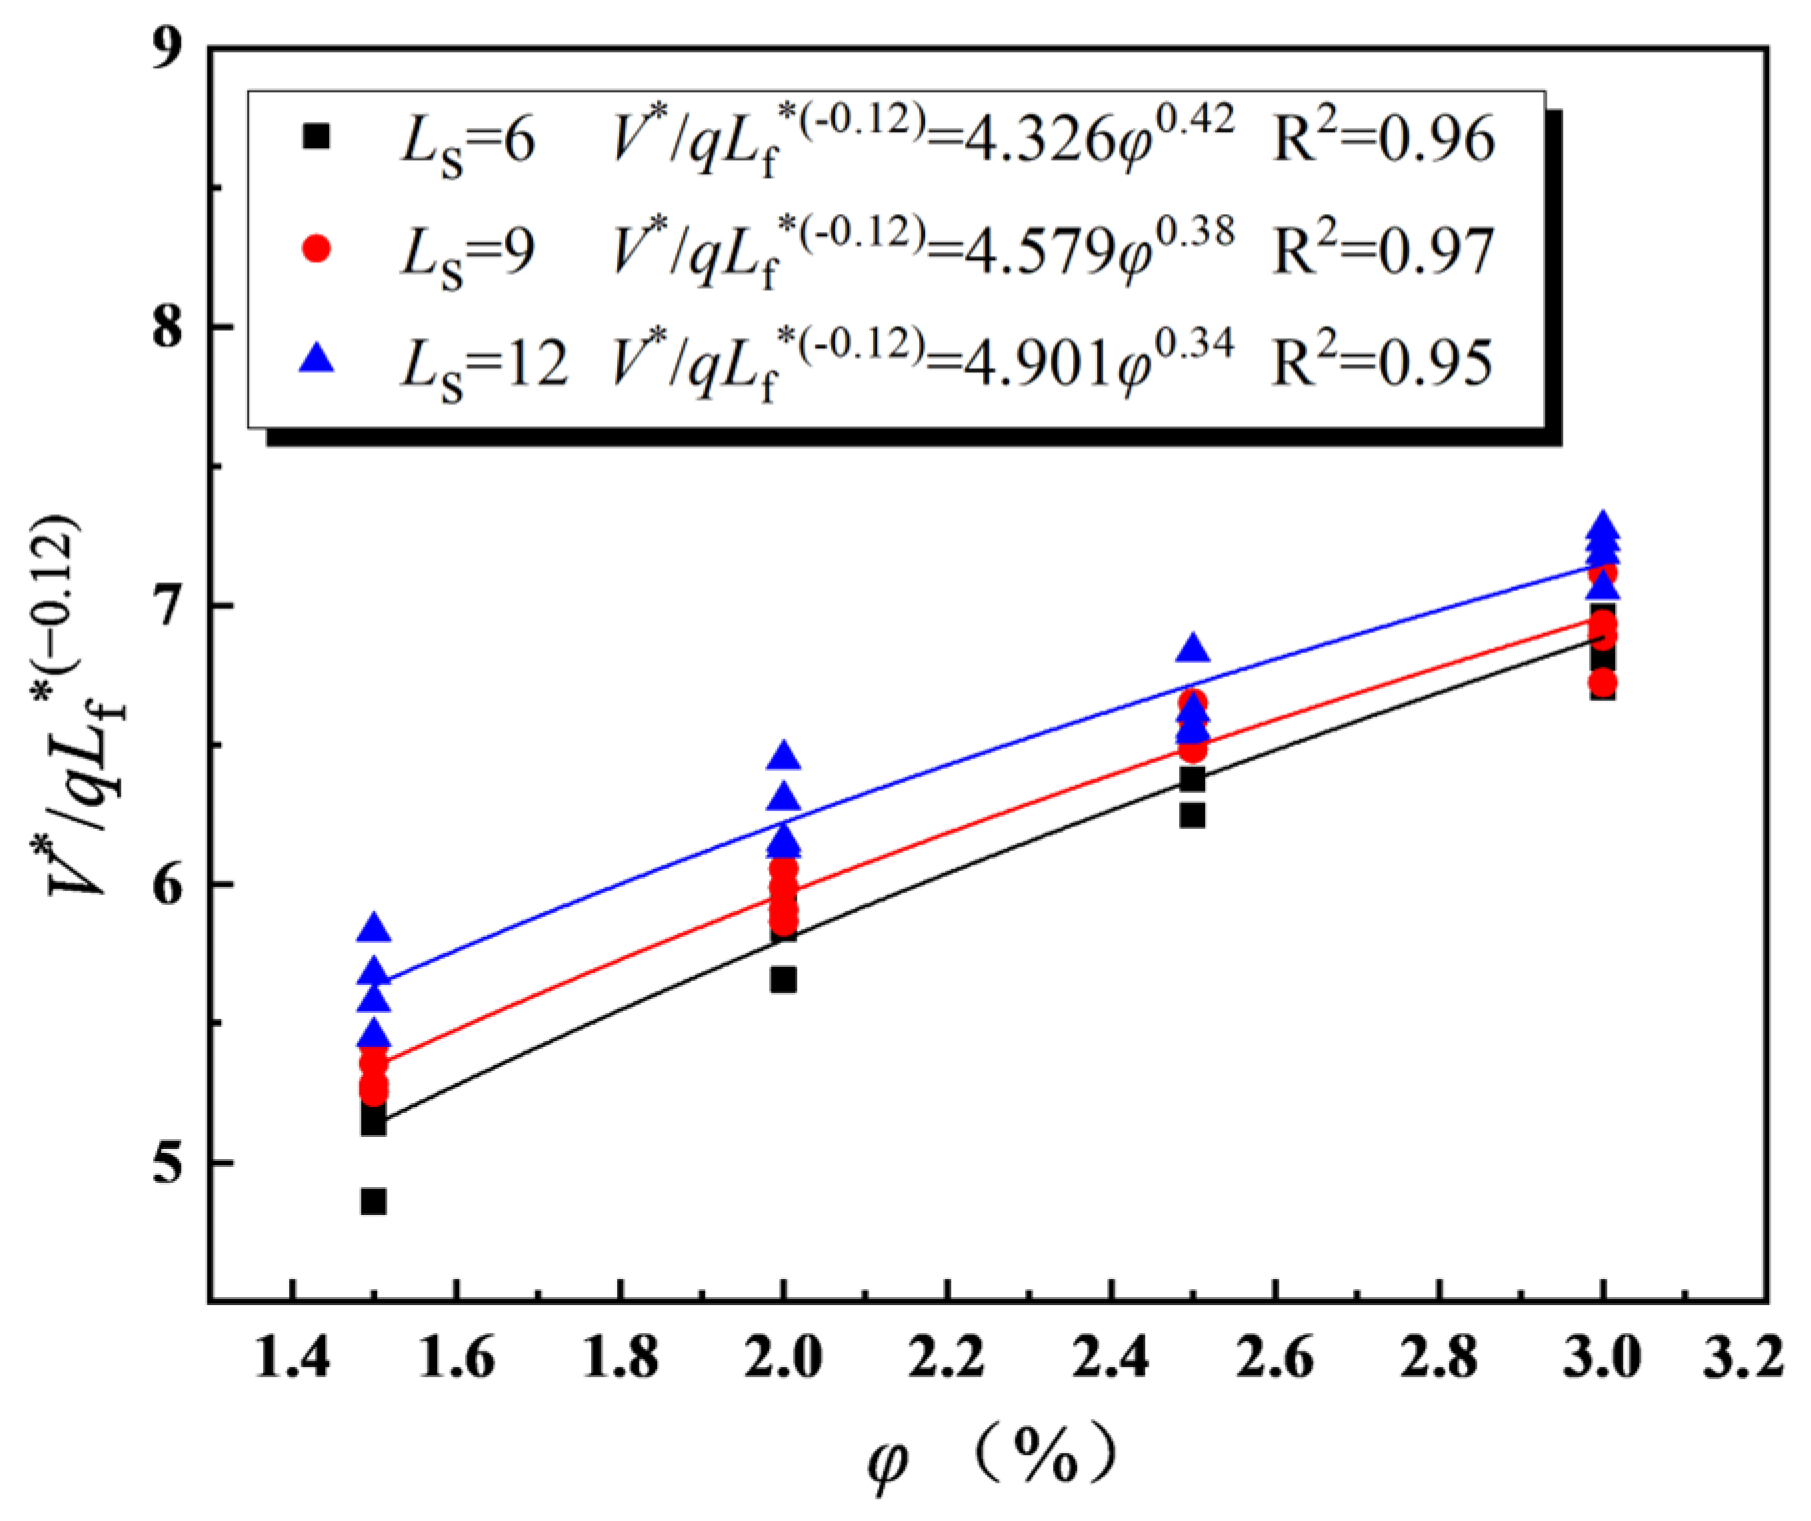
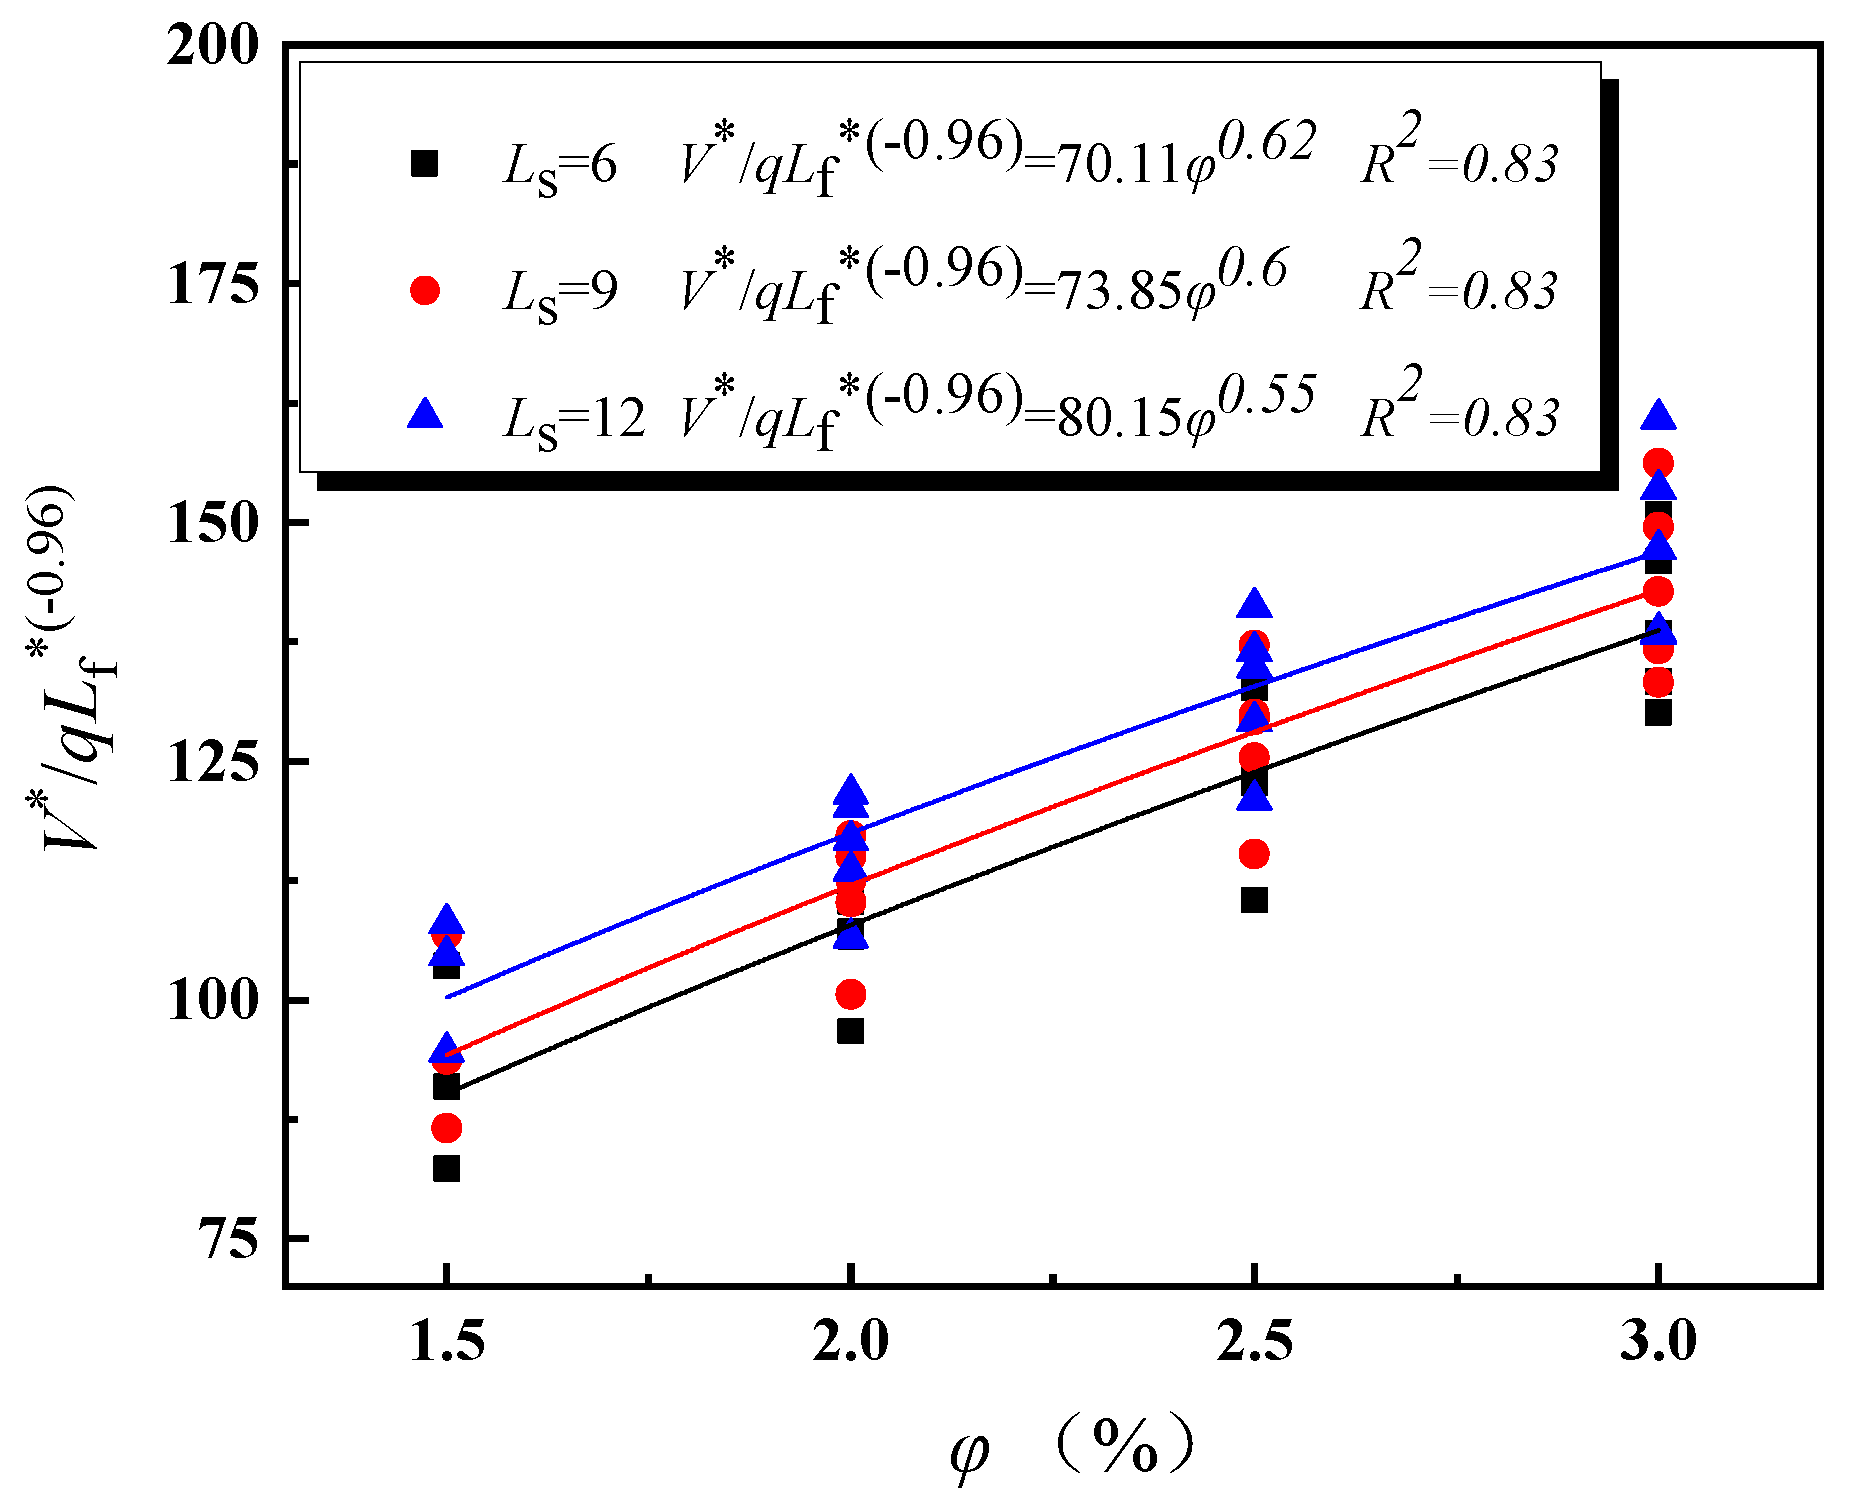
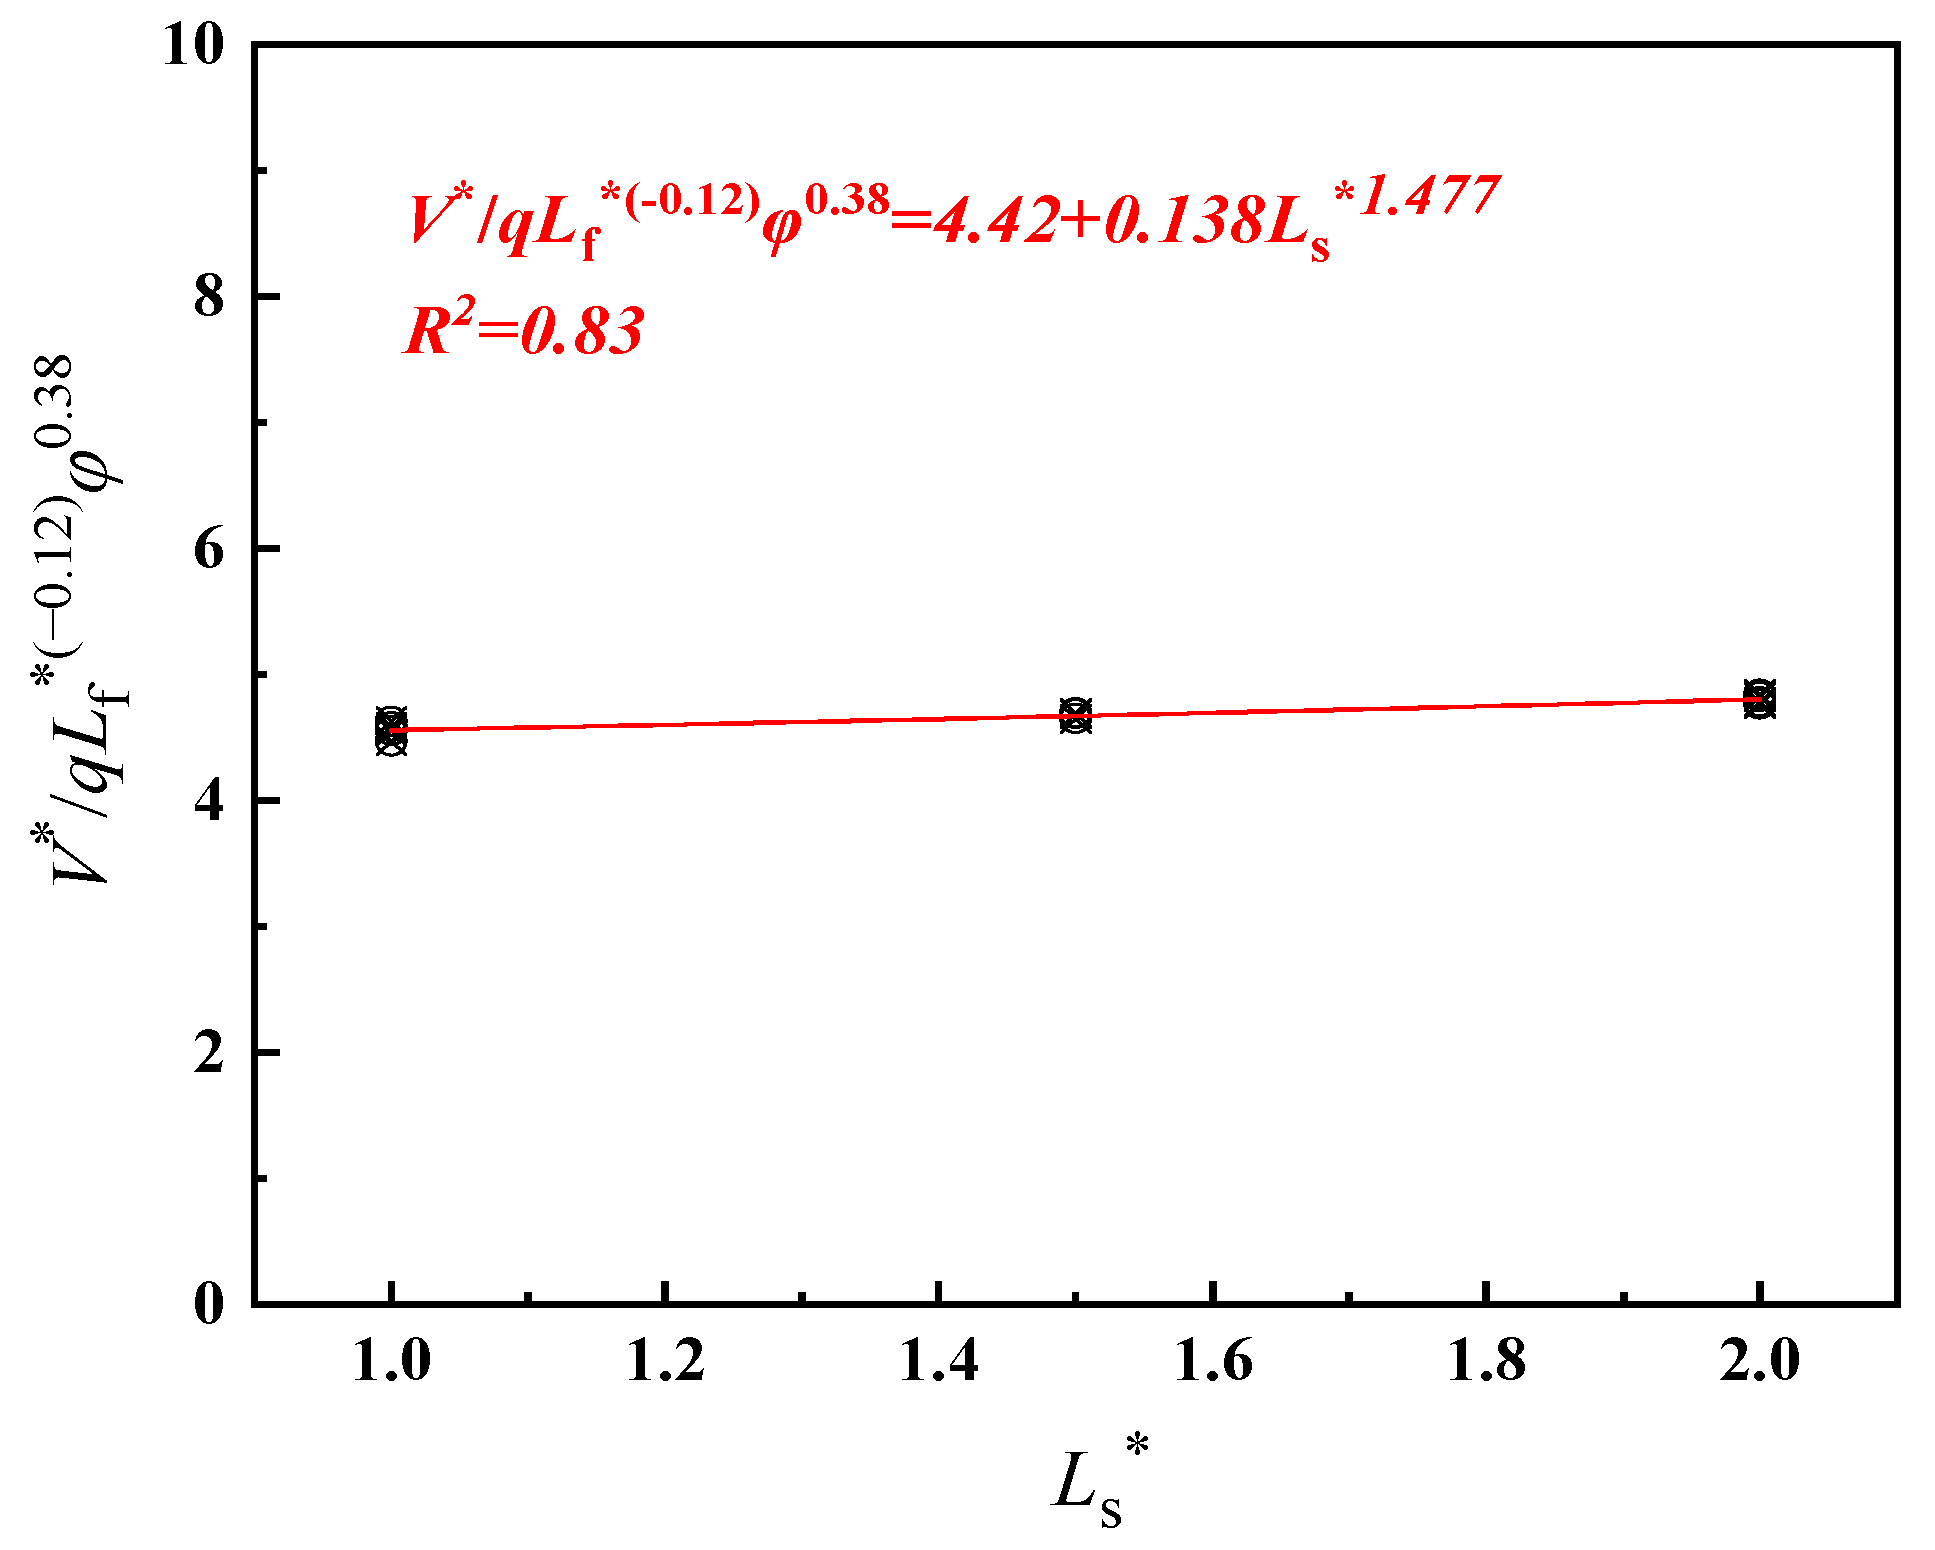
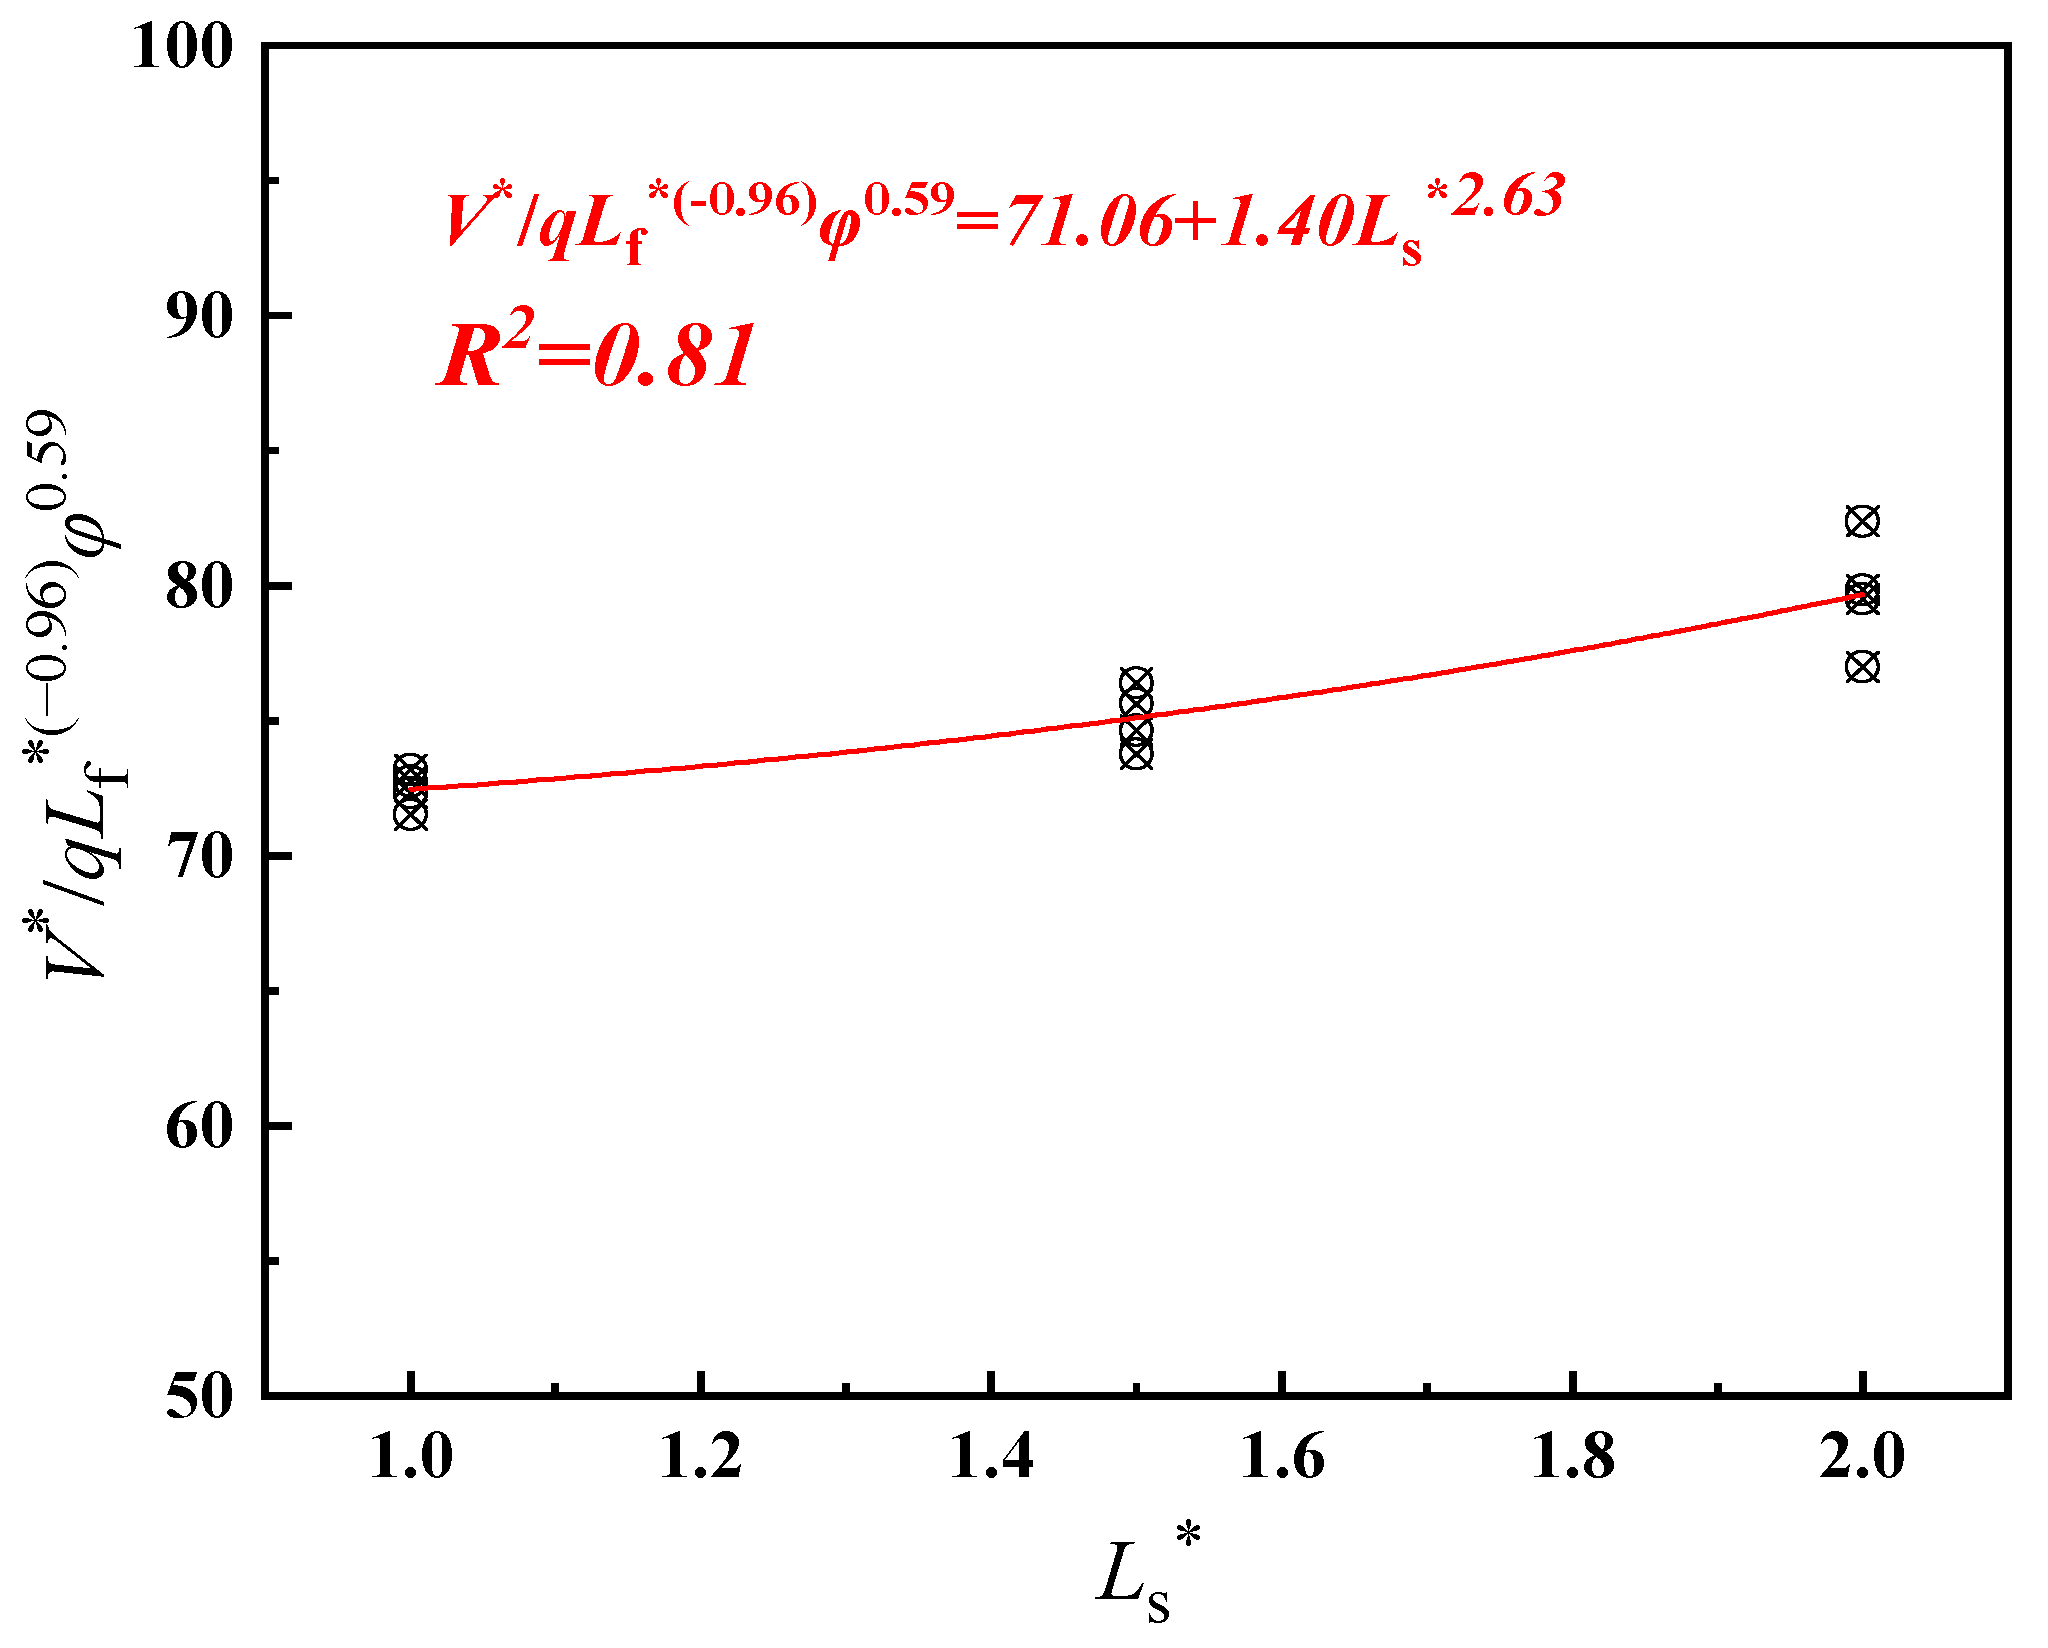
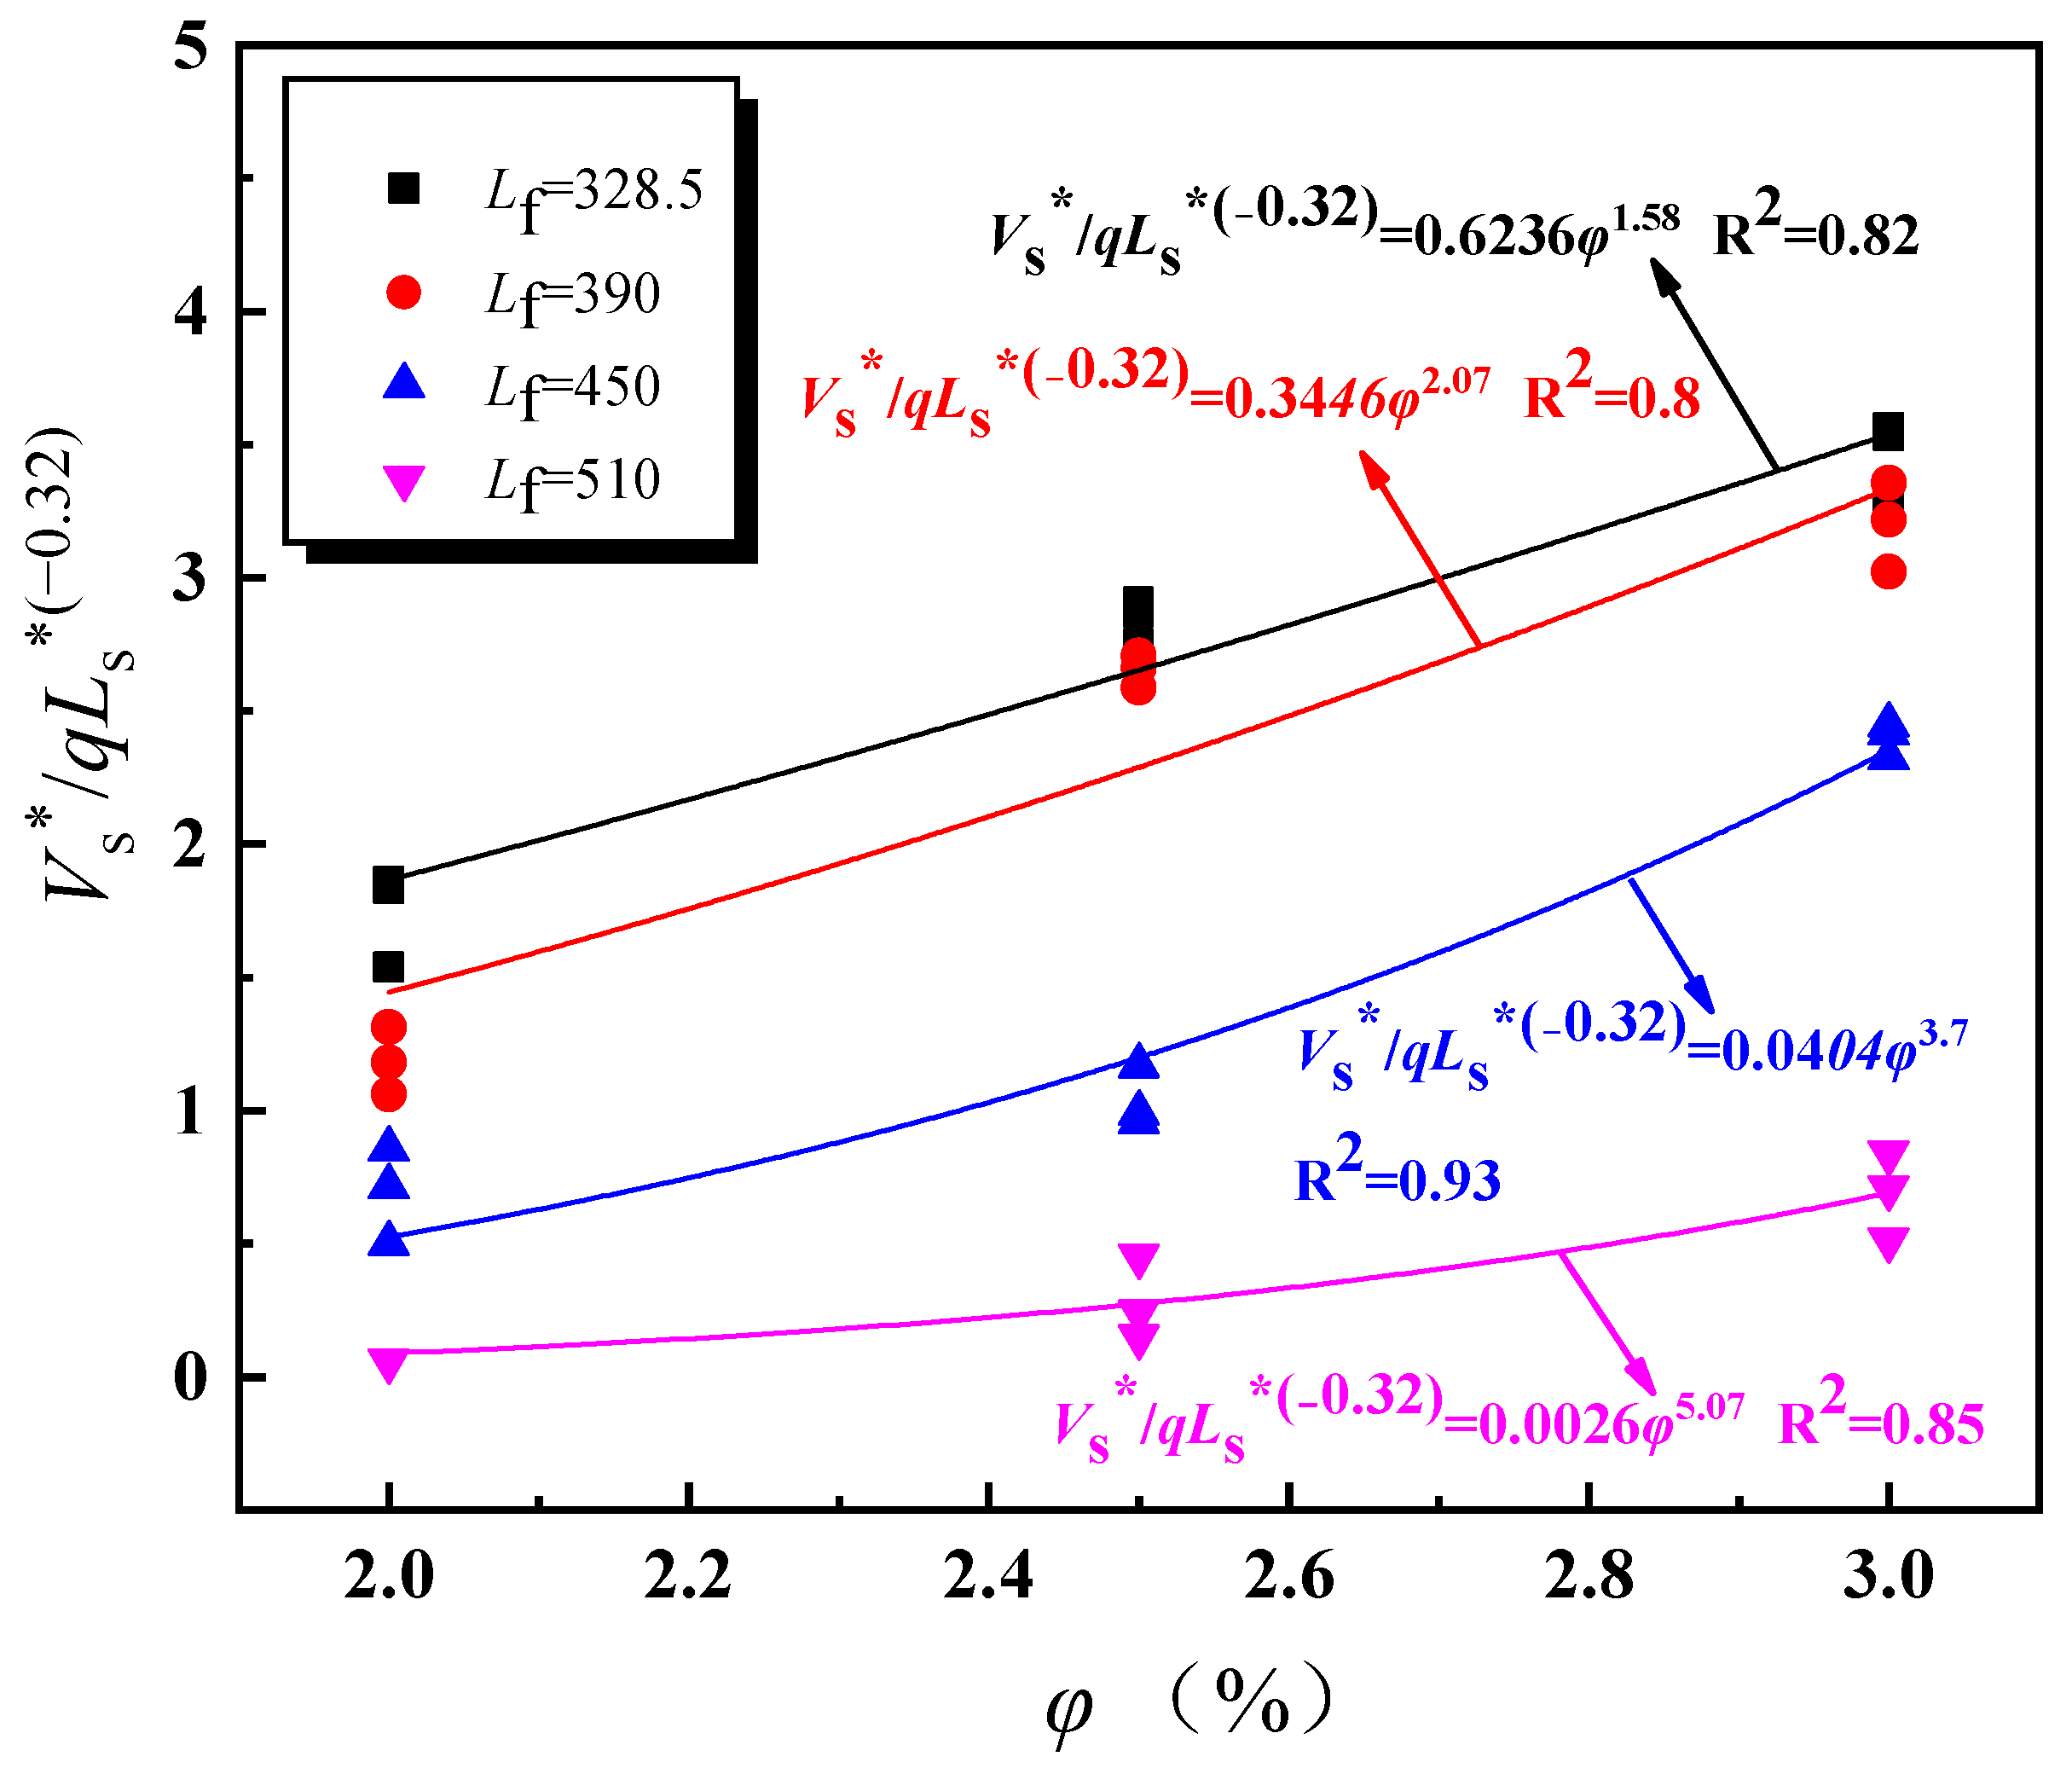
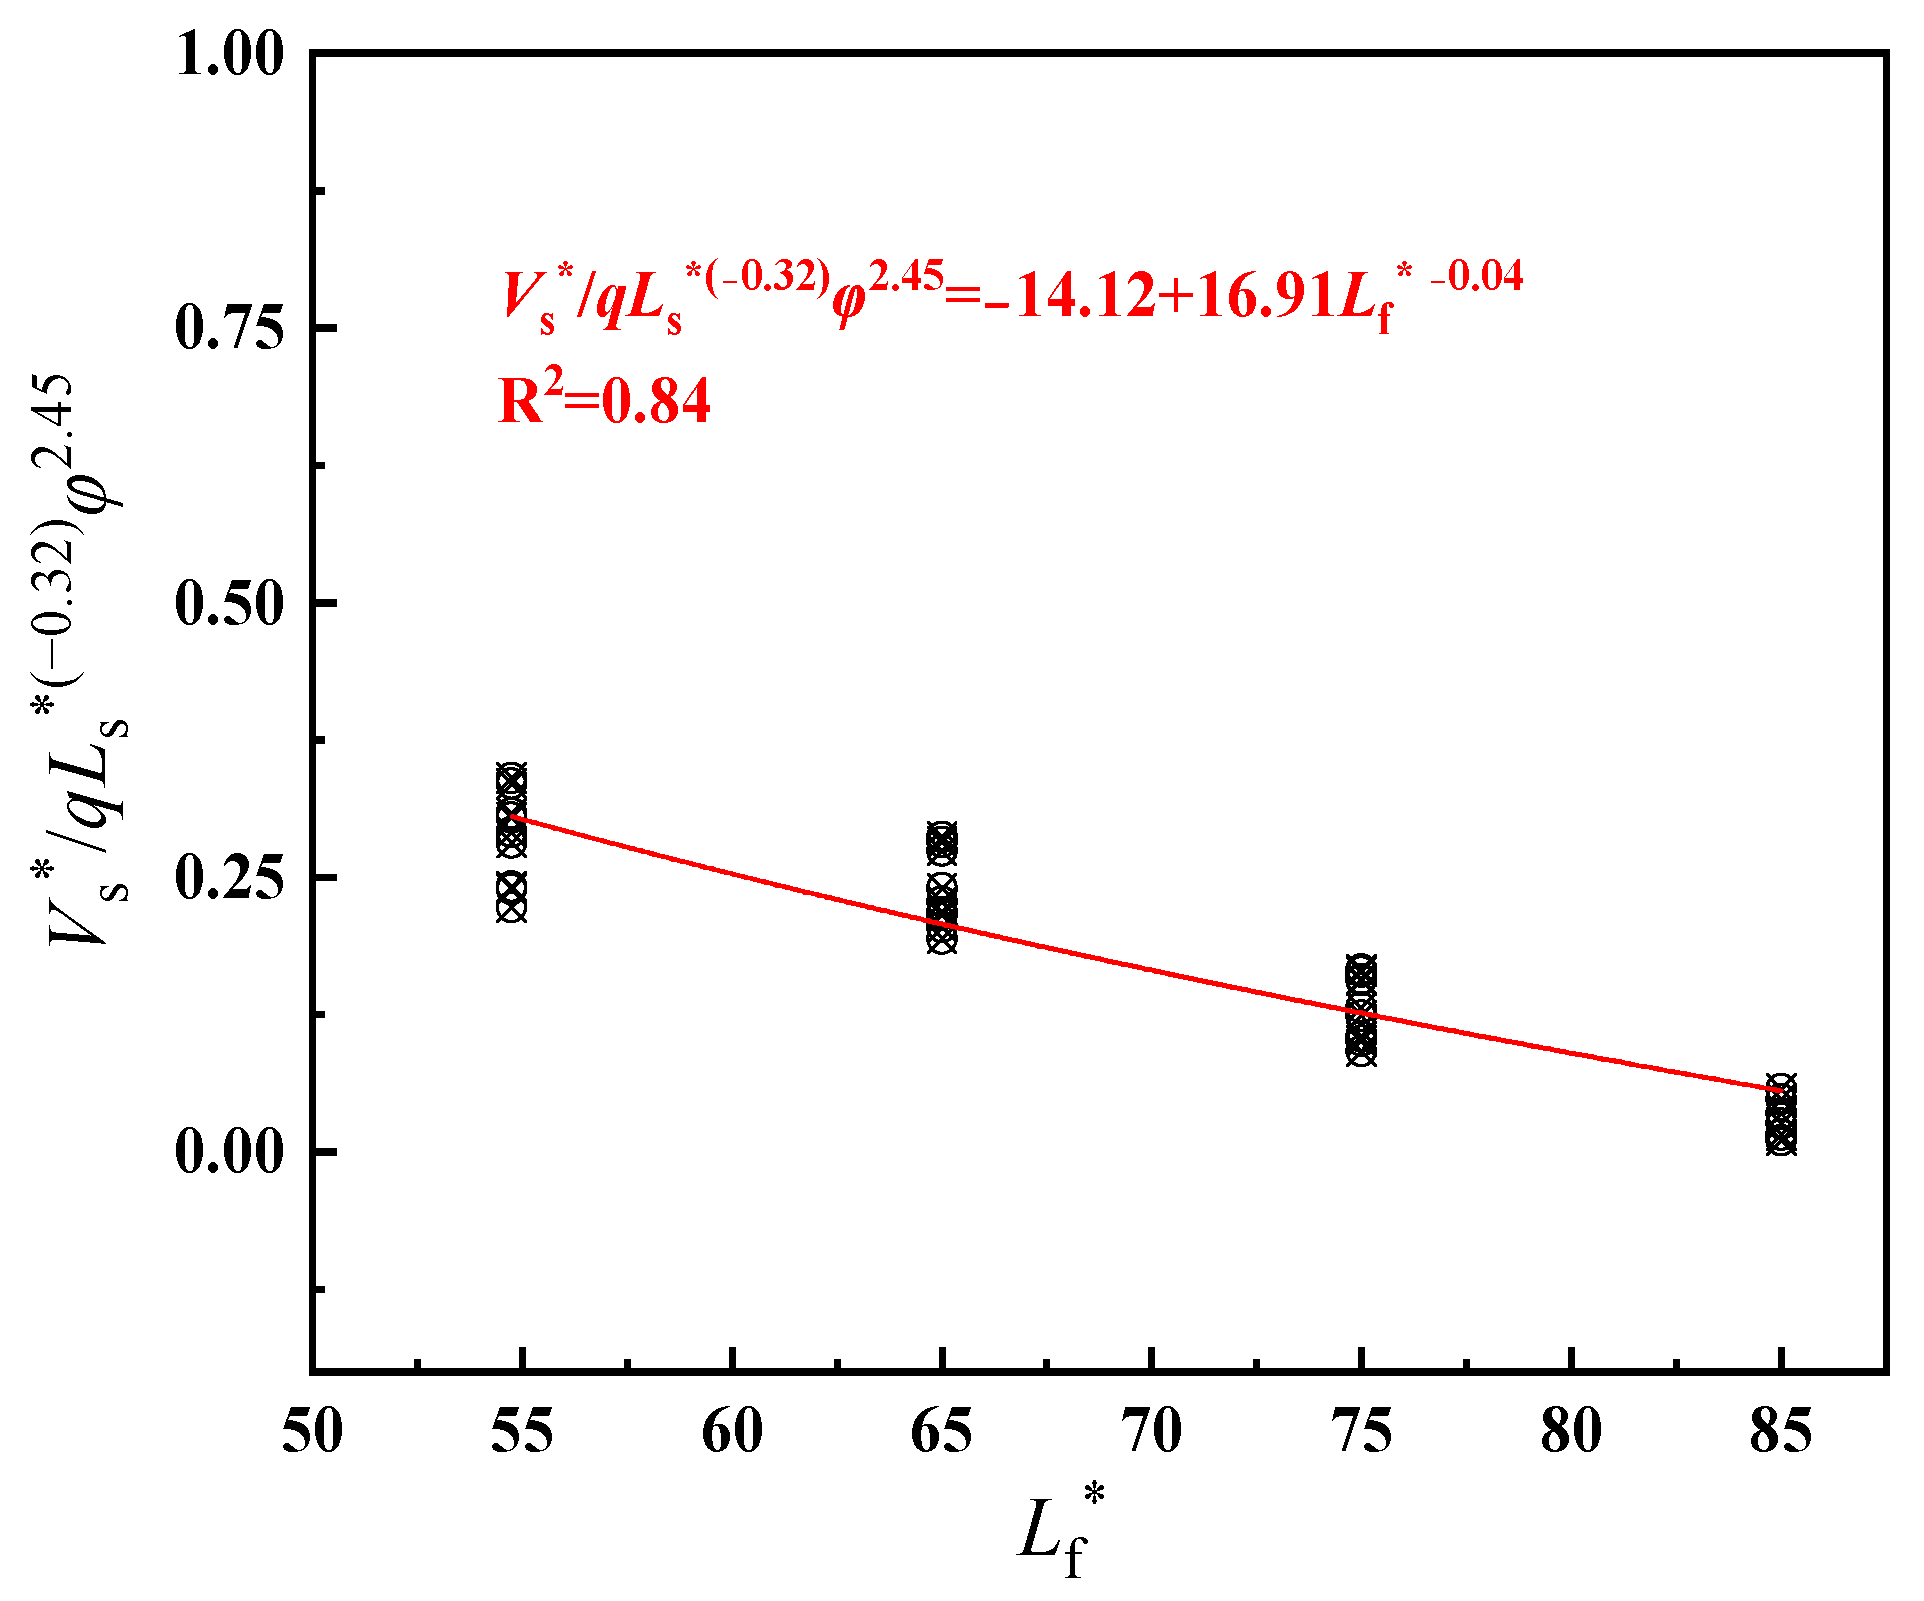
The longitudinal air inlet velocity under nature ventilation is used to replace the longitudinal ventilation velocity under mechanical ventilation. When Lf ≤ 330 m, the air inlet velocity at tunnel entrance equals to the longitudinal air inlet velocity. When Lf > 330 m, the tunnel shaft also acts as air supplement in some conditions, the longitudinal air inlet is the confluence of two streams. Through the dimensional analysis, the expression of dimensionless longitudinal inlet air velocity in an inclined tunnel with single shaft under natural ventilation is obtained. The air inlet velocity at tunnel entrance decreases exponentially as Lf increases, and increases exponentially with the increase in φ and Ls. The shaft air inlet velocity decreases exponentially as Lf and Ls increase, and increases exponentially with the increase in φ.
(2)
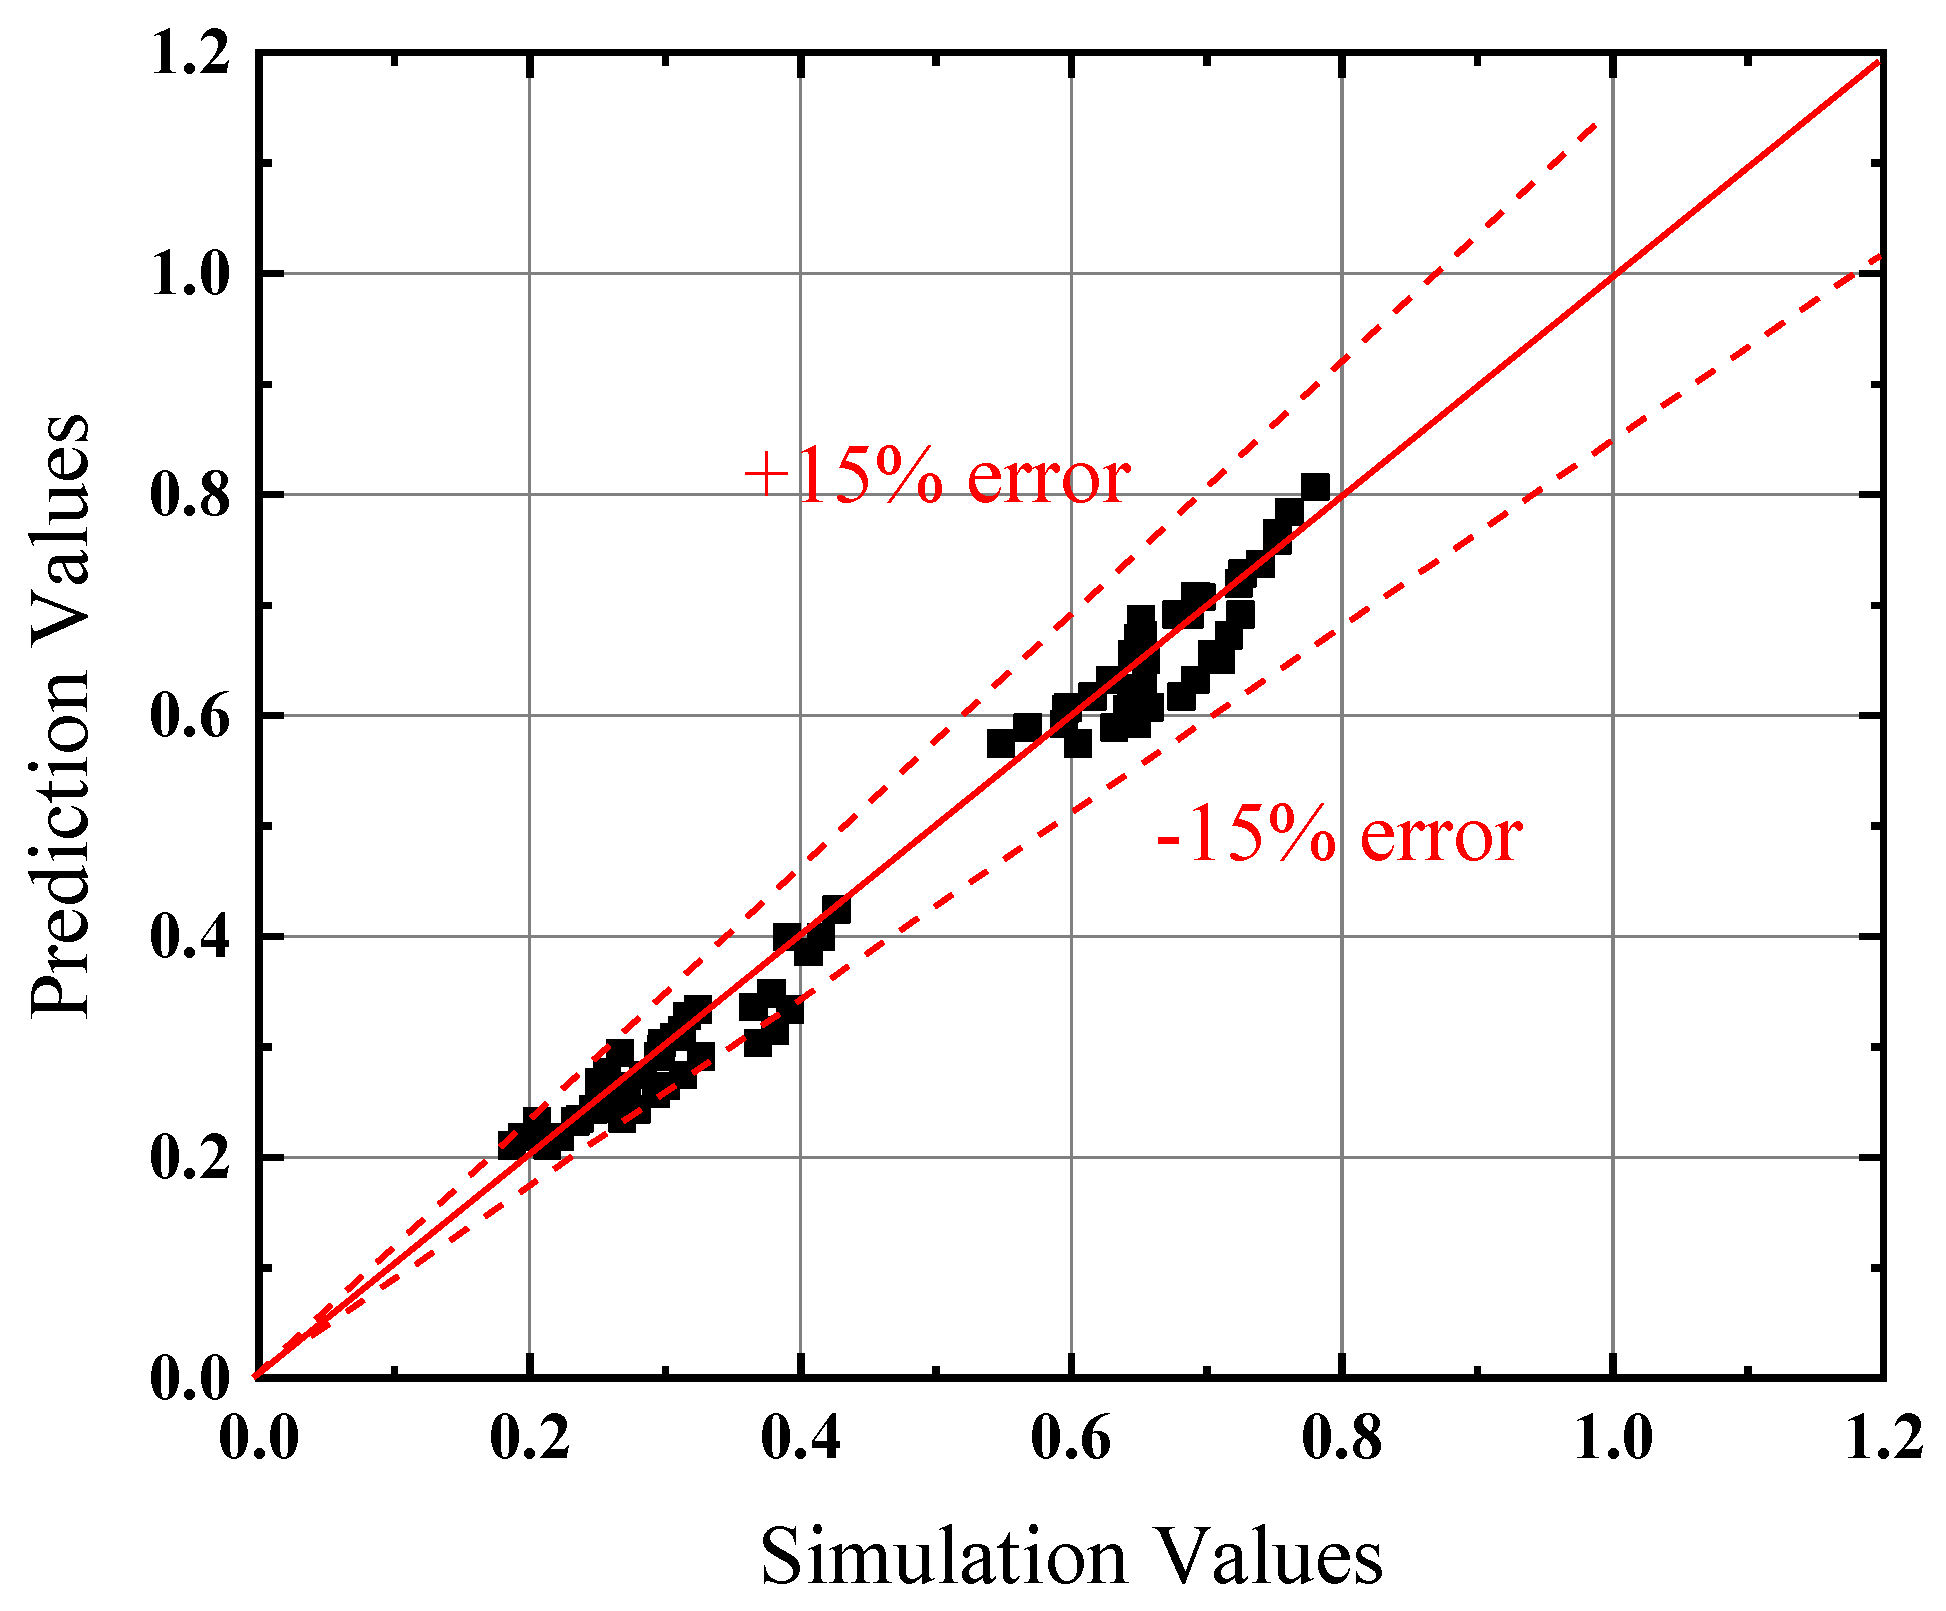
Based on the analysis of non-dimension longitudinal inlet air velocity, an empirical prediction formula of the maximum smoke temperature under the tunnel ceiling in inclined tunnel with single shaft under natural ventilation is obtained. The error range between the simulation and prediction results is within 20%.
Δ T max = { ( g ρ 0 c p T 0 ) 1 3 ( 2.17 Q ˙ V in r 1 / 3 H d 5 / 3 35.14 ) ,   L f   <   L d ( g ρ 0 c p T 0 ) 1 3 ( 4.08 Q ˙ V k r 1 / 3 H d 5 / 3 232.9 ) ,   L f   >   L d
(3)
A new correlation for the calculation of the distribution of maximum smoke temperature under the tunnel ceiling in inclined tunnel with single shaft under natural ventilation is obtained. And the error range between the simulation and prediction results is within 20%.
Δ T q x = { ( g ρ 0 c p T 0 ) 1 3 ( 2.17 Q ˙ V in r 1 / 3 H d 5 / 3 35.14 ) e K ( x x 0 ) , L f < L d ( g ρ 0 c p T 0 ) 1 3 ( 4.08 Q ˙ V k r 1 / 3 H d 5 / 3 232.9 ) e K ( x x 0 ) , L f > L d
In this study, only one kind of fire load was investigated. Further numerical studies should consider variations in fire load and HRR. In addition, the investigation on the smoke exhaust efficiency in the inclined tunnel with shaft should be performed in the future studies.

Author Contributions

Methodology, resources, supervision, L.Y.; investigation, formal analysis, writing—original draft, S.L.; formal analysis, X.W.; validation, writing—reviewing and editing, R.B. and J.Z.; methodology, writing—reviewing and editing, Y.Z. All authors have read and agreed to the published version of the manuscript.

Funding

This research was funded by the Natural Science Foundation of Hunan Province (No. 2021JJ30860) and Fundamental Research Funds for the Central Universities of Central South University (No. 2022ZZTS0667).

Institutional Review Board Statement

Not applicable.

Informed Consent Statement

Not applicable.

Data Availability Statement

Not applicable.

Conflicts of Interest

The authors declare no conflict of interest.

References

  1. Takeuchi, S.; Tanaka, F.; Yoshida, K.; Moinuddin, K.A.M. Effects of Scale Ratio and Aspect Ratio in Predicting the Longitudinal Smoke-Temperature Distribution during a Fire in a Road Tunnel with Vertical Shafts. Tunn. Undergr. Sp. Technol. 2018, 80, 78–91. [Google Scholar] [CrossRef]
  2. Jiang, X.; Xiang, Y.; Wang, Z.; Mao, Y.; Park, H. A Numerical Study on the Effect of the Shaft Group Arrangement on the Natural Ventilation Performance in Tunnel Fires. Tunn. Undergr. Sp. Technol. 2020, 103, 103464. [Google Scholar] [CrossRef]
  3. Beard, A.N. Fire Safety in Tunnels. Fire Saf. J. 2009, 44, 276–278. [Google Scholar] [CrossRef]
  4. Casey, N. Fire Incident Data for Australian Road Tunnels. Fire Saf. J. 2020, 111, 102909. [Google Scholar] [CrossRef]
  5. Carvel, R.O.; Beard, A.N.; Jowitt, P.W. The Influence of Longitudinal Ventilation Systems on Fires in Tunnels. Tunn. Undergr. Sp. Technol. 2001, 16, 3–21. [Google Scholar] [CrossRef]
  6. Wu, N.; Yang, R.; Zhang, H.; Qiao, L. Decentralized Inverse Model for Estimating Building Fire Source Location and Intensity. J. Thermophys. Heat. Transf. 2013, 27, 563–575. [Google Scholar] [CrossRef]
  7. Chaabat, F.; Salizzoni, P.; Creyssels, M.; Mos, A.; Wingrave, J.; Correia, H.; Marro, M. Smoke Control in Tunnel with a Transverse Ventilation System: An Experimental Study. Build. Environ. 2020, 167, 106480. [Google Scholar] [CrossRef]
  8. Cong, H.; Wang, X.; Kong, X.; Xu, H. Effects of Fire Source Position on Smoke Extraction Efficiency by Natural Ventilation through a Board-Coupled Shaft during Tunnel Fires. Proc. Combust. Inst. 2019, 37, 3975–3984. [Google Scholar] [CrossRef]
  9. He, L.; Xu, Z.; Markert, F.; Zhao, J.; Liu, Q.; Tao, H.; Wang, Z.; Fan, C. Experimental Study of Heat Exhaust Efficiency with Natural Ventilation in Tunnel Fire: Impact of Shaft Height and Heat Release Rate. J. Wind. Eng. Ind. Aerodyn. 2020, 201, 104173. [Google Scholar] [CrossRef]
  10. Xie, B.; Han, Y.; Huang, H.; Chen, L.; Zhou, Y.; Fan, C.; Liu, X. Numerical Study of Natural Ventilation in Urban Shallow Tunnels: Impact of Shaft Cross Section. Sustain. Cities Soc. 2018, 42, 521–537. [Google Scholar] [CrossRef]
  11. Zhang, S.; He, K.; Yao, Y.; Peng, M.; Yang, H.; Wang, J.; Cheng, X. Investigation on the Critical Shaft Height of Plug-Holing in the Natural Ventilated Tunnel Fire. Int. J. Therm. Sci. 2018, 132, 517–533. [Google Scholar] [CrossRef]
  12. Ji, J.; Gao, Z.H.; Fan, C.G.; Zhong, W.; Sun, J.H. A Study of the Effect of Plug-Holing and Boundary Layer Separation on Natural Ventilation with Vertical Shaft in Urban Road Tunnel Fires. Int. J. Heat. Mass. Transf. 2012, 55, 6032–6041. [Google Scholar] [CrossRef]
  13. Zhao, P.; Chen, T.; Yuan, Z.; Xie, Y.; Yu, N. Critical Shaft Height for Complete Smoke Exhaustion during Fire at the Worst Longitudinal Fire Location in Tunnels with Natural Ventilation. Fire Saf. J. 2020, 116, 103207. [Google Scholar] [CrossRef]
  14. Li, Y.; Zhong, W. Experimental Study of the Influence of Natural Ventilation by Shaft on the Maximum Ceiling Temperature of Buoyancy Plume in Tunnel Fires. Tunn. Undergr. Sp. Technol. 2021, 108, 103715. [Google Scholar] [CrossRef]
  15. Klote, J.H. Smoke Control. In SFPE Handbook of Fire Protection Engineering, 1st ed.; 3–143 to 3–157; Society of Fire Protection Engineers and National Fire Protection Association: Quincy, MA, USA, 1998. [Google Scholar]
  16. Ji, J.; Wan, H.; Li, K.; Han, J.; Sun, J. A Numerical Study on Upstream Maximum Temperature in Inclined Urban Road Tunnel Fires. Int. J. Heat. Mass. Transf. 2015, 88, 516–526. [Google Scholar] [CrossRef]
  17. Chow, W.K.; Gao, Y.; Zhao, J.H.; Dang, J.F.; Chow, N.C.L. A Study on Tilted Tunnel Fire under Natural Ventilation. Fire Saf. J. 2016, 81, 44–57. [Google Scholar] [CrossRef]
  18. Wang, Z.; Ding, L.; Wan, H.; Ji, J.; Gao, Z.; Yu, L. Numerical Investigation on the Effect of Tunnel Width and Slope on Ceiling Gas Temperature in Inclined Tunnels. Int. J. Therm. Sci. 2020, 152, 106272. [Google Scholar] [CrossRef]
  19. Wan, H.; Gao, Z.; Han, J.; Ji, J.; Ye, M.; Zhang, Y. A Numerical Study on Smoke Back-Layering Length and Inlet Air Velocity of Fires in an Inclined Tunnel under Natural Ventilation with a Vertical Shaft. Int. J. Therm. Sci. 2019, 138, 293–303. [Google Scholar] [CrossRef]
  20. Merci, B. One-Dimensional Analysis of the Global Chimney Effect in the Case of Fire in an Inclined Tunnel. Fire Saf. J. 2008, 43, 376–389. [Google Scholar] [CrossRef]
  21. Ji, J.; Wang, Z.; Ding, L.; Yu, L.; Gao, Z.; Wan, H. Effects of Ambient Pressure on Smoke Movement and Temperature Distribution in Inclined Tunnel Fires. Int. J. Therm. Sci. 2019, 145, 106006. [Google Scholar] [CrossRef]
  22. Kurioka, H.; Oka, Y.; Satoh, H.; Sugawa, O. Fire Properties in near Field of Square Fire Source with Longitudinal Ventilation in Tunnels. Fire Saf. J. 2003, 38, 319–340. [Google Scholar] [CrossRef]
  23. Hu, L.H.; Huo, R.; Peng, W.; Chow, W.K.; Yang, R.X. On the Maximum Smoke Temperature under the Ceiling in Tunnel Fires. Tunn. Undergr. Sp. Technol. 2006, 21, 650–655. [Google Scholar] [CrossRef]
  24. Li, Y.Z.; Ingason, H. The Maximum Ceiling Gas Temperature in a Large Tunnel Fire. Fire Saf. J. 2012, 48, 38–48. [Google Scholar] [CrossRef]
  25. Hu, L.H.; Huo, R.; Li, Y.Z.; Wang, H.B.; Chow, W.K. Full-Scale Burning Tests on Studying Smoke Temperature and Velocity along a Corridor. Tunn. Undergr. Sp. Technol. 2005, 20, 223–229. [Google Scholar] [CrossRef]
  26. Delichatsios, M.A. The Flow of Fire Gases under a Beamed Ceiling. Combust. Flame 1981, 43, 1–10. [Google Scholar] [CrossRef]
  27. Oka, Y.; Oka, H.; Imazeki, O. Ceiling-Jet Thickness and Vertical Distribution along Flat-Ceilinged Horizontal Tunnel with Natural Ventilation. Tunn. Undergr. Sp. Technol. 2016, 53, 68–77. [Google Scholar] [CrossRef]
  28. Peng, J.Z. Study on the Effect of Slope on the Fire Spreading Characteristics in Extra-Long Road Tunnels; Central South University: Changsha, China, 2011. [Google Scholar]
  29. Du, T.; Yang, D.; Wei, H.; Zhang, Z. Experimental Study on Mixing and Stratification of Buoyancy-Driven Flows Produced by Continuous Buoyant Source in Narrow Inclined Tank. Int. J. Heat. Mass. Transf. 2018, 121, 453–462. [Google Scholar] [CrossRef]
  30. Li, Y.Z.; Lei, B.; Ingason, H. The Maximum Temperature of Buoyancy-Driven Smoke Flow beneath the Ceiling in Tunnel Fires. Fire Saf. J. 2011, 46, 204–210. [Google Scholar] [CrossRef]
  31. Li, Y.; Wang, Y.; Zhao, M.; Yang, X. Fire temperature distribution of sloping tunnels. Fire Sci. Technol. 2016, 35, 1677–1679. (In Chinese) [Google Scholar]
  32. Zhang, S.; Wu, Z.; Zhang, R.; Kang, J. Dynamic Numerical Simulation of Coal Mine Fire for Escape Capsule Installation. Saf. Sci. 2012, 50, 600–606. [Google Scholar] [CrossRef]
  33. Huang, Y.; Gong, X.; Peng, Y.; Lin, X.; Kim, C.-N. Effects of the Ventilation Duct Arrangement and Duct Geometry on Ventilation Performance in a Subway Tunnel. Tunn. Undergr. Sp. Technol. 2011, 26, 725–733. [Google Scholar] [CrossRef]
  34. Yi, L.; Lan, S.; Wang, X.; Bu, R.; Zhou, Y. Study on the Smoke Back-Layering Length in a Tilted Tunnel with Vertical Shaft under Natural Ventilation. Case Stud. Therm. Eng. 2022, 39, 102412. [Google Scholar] [CrossRef]
Figure 1. Schematic of tunnel model.
Buildings 13 00842 g001
Figure 2. Arrangement of measure points.
Buildings 13 00842 g002
Figure 3. Schematic of CFD tunnel model.
Buildings 13 00842 g003
Figure 4. Vertical temperature variation with different grid sizes.
Buildings 13 00842 g004
Figure 5. Comparison of experimental and numerical maximum ceiling temperature rise. (a) Lf = 390, φ = 1%, Ls = 9 (b) Lf = 390, φ = 1%, Ls = 12 (c) Lf = 210, φ = 1%, Ls = 12 (d) Lf = 210, φ = 1%, Ls = 9.
Buildings 13 00842 g005aBuildings 13 00842 g005b
Figure 6. Dimensionless relation between inlet air velocity and fire source location (a) φ = 1.5%, (b) φ = 2.0%, (c) φ = 2.5%, (d) φ = 3.0%.
Buildings 13 00842 g006aBuildings 13 00842 g006b
Figure 7. Dimensionless relationship between inlet air velocity and fire source location (Lf ≤ 330).
Buildings 13 00842 g007
Figure 8. Dimensionless relationship between inlet air velocity and fire source location (Lf > 330).
Buildings 13 00842 g008
Figure 9. Dimensionless relationship between inlet air velocity and slope (Lf ≤ 330).
Buildings 13 00842 g009
Figure 10. Dimensionless relationship between inlet air velocity and slope (Lf > 330 m).
Buildings 13 00842 g010
Figure 11. Dimensionless relation between inlet air velocity and shaft height (Lf ≤ 330 m).
Buildings 13 00842 g011
Figure 12. Dimensionless relation between inlet air velocity and shaft height (Lf > 330 m).
Buildings 13 00842 g012
Figure 13. Comparison of dimensionless inlet air velocity values with the predictions by Equation (20).
Buildings 13 00842 g013
Figure 14. Dimensionless relation curve between the inlet air velocity at the shaft outlet and the shaft height.
Buildings 13 00842 g014
Figure 15. Dimensionless relationship between inlet air velocity at the shaft outlet and slope.
Buildings 13 00842 g015
Figure 16. Dimensionless relationship between the inlet air velocity at the shaft outlet and the fire source distance.
Buildings 13 00842 g016
Figure 17. Fitting relation of Δ T max and Q ˙ (a) L f 330 , (b) L f > 330 .
Buildings 13 00842 g017
Figure 18. Comparison of numerically measured Δ T max values and the predictions by Equation (27).
Buildings 13 00842 g018
Figure 19. Comparison of numerically measured Δ T q x values and the predictions by Equation (14).
Buildings 13 00842 g019
Table 1. Simulation conditions.
Simulation No.Slope
Gradient
Shaft Height (m)Fire Source Location (m)
1–90.5%690/150/210/270/328.5/390/450/510/570
10–18990/150/210/270/328.5/390/450/510/570
19–271290/150/210/270/328.5/390/450/510/570
28–361%690/150/210/270/328.5/390/450/510/570
37–45990/150/210/270/328.5/390/450/510/570
46–541290/150/210/270/328.5/390/450/510/570
55–631.5%690/150/210/270/328.5/390/450/510/570
64–72990/150/210/270/328.5/390/450/510/570
73–811290/150/210/270/328.5/390/450/510/570
82–902%690/150/210/270/328.5/390/450/510/570
91–99990/150/210/270/328.5/390/450/510/570
100–1081290/150/210/270/328.5/390/450/510/570
109–1172.5%690/150/210/270/328.5/390/450/510/570
118–126990/150/210/270/328.5/390/450/510/570
127–1351290/150/210/270/328.5/390/450/510/570
136–1443%690/150/210/270/328.5/390/450/510/570
145–153990/150/210/270/328.5/390/450/510/570
154–1621290/150/210/270/328.5/390/450/510/570
Table 2. Fitting coefficients of the dimensionless relation between inlet air velocity and fire source location (Lf ≤ 330).
Slope1.5%2%2.5%3%
Shaft Height6912691269126912
b−0.16−0.11−0.13−0.13−0.12−0.1−0.12−0.11−0.11−0.12−0.13−0.09
R20.860.90.780.860.920.750.860.940.830.910.850.95
Table 3. Fitting coefficients of the dimensionless relation between inlet air velocity and fire source location (Lf > 330).
Slope2%2.5%3%
Shaft Height691269126912
b−1−0.99−0.95−1−1−0.99−0.93−0.92−0.88
R20.950.940.950.940.930.930.90.890.87
Table 4. Fitting coefficient of the dimensionless relation between the inlet air velocity at the shaft outlet and the shaft height.
Fire Source Location328.5390450510
Slope(%)22.5322.5322.532.53
b−0.55−0.24−0.21−0.62−0.26−0.17−0.99−0.63−0.25−1.9−0.94
R20.870.990.830.990.990.990.930.970.940.990.94
Disclaimer/Publisher’s Note: The statements, opinions and data contained in all publications are solely those of the individual author(s) and contributor(s) and not of MDPI and/or the editor(s). MDPI and/or the editor(s) disclaim responsibility for any injury to people or property resulting from any ideas, methods, instructions or products referred to in the content.

