Article

Mechanical Properties of Corroded Reinforcement

by
František Bahleda
1,
Jozef Prokop
1,
Peter Koteš
1,* and
Agnieszka Wdowiak-Postulak
2
1
Department of Structures and Bridges, Faculty of Civil Engineering, University of Zilina, 010 26 Zilina, Slovakia
2
Department of Strength of Materials and Building Structures, Faculty of Civil Engineering and Architecture, Kielce University of Technology, 25-314 Kielce, Poland
*
Author to whom correspondence should be addressed.
Buildings 2023, 13(4), 855; https://doi.org/10.3390/buildings13040855
Submission received: 23 February 2023 / Revised: 18 March 2023 / Accepted: 22 March 2023 / Published: 24 March 2023

Abstract

:
Reinforced concrete (RC) structures are basically composite elements because they consist of two materials—concrete and reinforcement (reinforcing steel bars). From the point of view of the design of new constructions, it is necessary to design them in such a way as to ensure their reliability, safety and durability throughout their design lifetime, Td. However, all elements, including RC members, are affected by the environment in which they are located. An aggressive environment causes degradation of materials. In the case of reinforcement, corrosion of the reinforcement is considered to be the most well-known and at the same time the most serious way of degradation. From the point of view of existing reinforced concrete elements, it is therefore important to know whether and how the corrosion of the reinforcement affects the mechanical properties of the given reinforcement. The mechanical properties of reinforcement are very important when assessing the actual condition of reinforced concrete (RC) elements, to determine the resistance and load-carrying capacity of the elements. Therefore, it is necessary to investigate the effect of corrosion on mechanical properties of reinforcement. The paper reports on the results of an experimental analysis of the effect of corrosion on the change in the mechanical properties of reinforcement. Furthermore, it presents both the redistribution of mechanical properties along the cross-section of reinforcement, produced by various techniques, such as hot-rolling, hot-rolling with controlled cooling from rerolling temperature and cold-rolled as well as the mechanical properties under the action of corrosion.

1. Introduction

Reinforced concrete (RC) structures are among the most widespread types of structures in practice. New structures must be designed to ensure their reliability [1,2,3,4], safety, robustness and durability and serviceability [5,6,7]. Durability means that the elements must withstand all loads and environmental influences and fulfil their purpose throughout the design life, Td. New RC structures are designed according to the valid standards STN EN 1992-1-1 [8] (Basic Code including the National Annex and all corrigenda) valid for structures and STN EN 1992-2 [9] (Basic Code including the National Annex and all corrigenda) valid for bridges. The foundation structures are also an important part of every construction. There are known different types of foundations, but even in this case, the most widespread foundations are made of reinforced concrete (RC) members. The design of the foundation structures is done according to the code STN EN 1997-1 [10] (Basic Code including the National Annex and all corrigenda).
However, it is also important to evaluate and assess the existing RC structures including foundation members, while it is also possible to take into account modified reliability levels and thus modified partial safety factors for load and materials’ characteristics [11,12,13]. The reasons for assessing existing structures can be different:
-
changing the purpose of the building—other loads must be considered, which may be even greater than originally considered;
-
verification of the feasibility of rebuilding or the possibility of extending the service lifetime of the building;
-
reliability check (e.g., for seismic effects, increased load) required by state authorities, insurance company, owner, etc.;
-
detection of structural failures due to time-dependent loading (e.g., corrosion, fatigue, defects or damaged parts, increase in deformations, increased vibrations, etc.) or extraordinary loading [14].
As a part of the assessment of existing RC structures, it is necessary to take into account the actual geometric and material properties of the members, including the reinforcement. Those properties are (or should be) verified by detailed diagnostics [15,16,17,18,19]. If it is focused on the reinforcement, it is necessary to determine its position, the axial distance between the reinforcing steel bars, the thickness of the concrete cover layer, the type of reinforcement and the diameter of the reinforcement. Currently valid code STN ISO 13822 [20] defines the requirements for determining the actual properties of materials as follows:
“The properties of the materials that are used for evaluation must be the actual properties of the materials of the existing structure and not the properties of the materials specified in the original design of the structure or in a standard or regulation. When determining the properties of the materials, degradation and possible load effects must be considered” [19]. In the case of reinforcement, corrosion of the reinforcement [21,22] and fatigue failure [5,23] are considered to be the main causes of degradation. The paper focuses on the corrosion of reinforcement.
If there are doubts about the properties of the materials, then these properties should be determined experimentally, including non-destructive or destructive tests of the materials. Furthermore, the National Annex (NA) of the code STN ISO 13822 [20] for determining the properties of the reinforcement lists the design values of the strength of the various types of reinforcement based on the design year of the structure, shape and surface treatment. The properties of the reinforcements, which are not mentioned in the NA of the code, should be verified by tests or the values of reinforcement of type 10 216 are taken (the type of reinforcement marked as 10 216 is according to the already not valid old Slovak standards in the former Czechoslovakia—it is a smooth reinforcement with a yield strength of fy = 210 MPa). If there is no certainty in determining the type of reinforcement and its characteristics, it is possible to take samples for tests from structures at a suitable place. The design value of the yield strength fyd, the code allows to determine from the characteristic value of the yield strength fyk, resp. of 0.2 % proof strength f0.2k, if yield phenomenon is not present, through the partial safety factor of reinforcement γS, which is determined in accordance with table 2.1 N in STN EN 1992-1-1 (γS = 1.15) and Annex A STN EN 1992-1-1 [8].
The characteristic value should be determined as actual from the samples, or according to the type of reinforcement (as previously mentioned). To determine the real characteristics, samples must be taken from the structure. If we want to determine the yield strength and the tensile strength, it is not needed to know only the forces at the yield point and at failure (tensile strength), but the cross-sectional area of the reinforcement has to be accurately determined as well, possibly taking into account degradation (corrosion) too.
In common construction practice, the corrosion of reinforcement is expressed by the reduction of the cross-sectional area of the reinforcement, which depends on the size of the corrosion loss rcorr. It is questionable which cross-sectional area should be considered, or how to determine this area that should be considered for determining the resistance of the reinforcement that is corroded. It is about the correct determination of the yield strength and strength of the reinforcement. Instructions for determining the size of this area is the novelty of this paper. Another novelty is, as will be presented in the paper, whether the local corrosion (pitting corrosion) has the same or different effect on the mechanical properties of the reinforcement. This effect has not yet been investigated and is the main contribution of the presented article. Of course, in the case of reinforced concrete (RC) structures, the concrete provides some protection of reinforcement during the passive and active stage, which slows the corrosion rate. The paper deals with mechanical properties over the cross-section of reinforcement before corrosion and during corrosion. The effect of corrosion of reinforcement on the surrounding concrete and the speed of corrosion (corrosion rate) is significant, but this paper does not consider this effect. In this case, it is only corrosion of the reinforcement and its impact on the change of mechanical properties of the reinforcement without the influence of the surroundings and time.

2. Reinforcement Production Method

The code STN EN 10080 [24] prescribes the general requirements for the operational characteristics of weldable steel reinforcement used for reinforcing concrete structures, delivered as finished products in the form of rods, wires in the form of scrolls, welded reinforcing nets, two- or three-dimensional grids [25]. According to this standard, reinforcing steels can have a ribbed, indented or smooth surface. It leaves the melting process and the method of deoxidation dependent on the decision of the reinforcing steel manufacturer. In addition, the process of making scrolls and rods depends on the manufacturer’s decision. However, the standard prohibits the production of reinforcing steel for reinforcement by rolling finished products (e.g., plates or rails).
The code STN EN 10080 [24] determines the weldability of reinforcing steel, based on the carbon equivalent and limiting the content of certain chemical elements. The durability of products in terms of this standard is ensured by the prescribed chemical composition of reinforcing steel.
Bažant et al. [26] stated, in 1979, that: “According to the method of production, reinforcements are divided into hot-rolled, which have the largest representation among reinforcing steels, then into cold-drawn, cold-twisted and cold-drawn and simultaneously cold-rolled.” This distribution will be supplemented by thermally refined steels, the production of which is being prepared in the Czechoslovak metallurgy”.
This is followed by the Technical Provision [27], which states that “Since approximately the 90 s of the last century, reinforcement has been produced as microalloyed steel, hot-rolled, or as hot-rolled controlled-cooled steel, or as cold-rolled steel”.
The paper is focused on all three types of rebar production, namely cold rolled steel (abbreviated as CRS) [28,29,30], on hot rolled steel (abbreviated as HRS), and thermal refinement of the reinforcement (hot rolled)—controlled cooling from the rolling temperature referred to as Tempcore® (abbreviated as TMT) [31,32,33,34,35].

2.1. Cold Forming—Cold Rolled Steel/CRS

The code [20] states, that “Strain hardening is manifested by an increase in yield strength, tensile strength and hardness and a decrease in ductility, contraction and toughness. The yield strength increases with deformation faster than the tensile strength, while ductility decreases at the same time”.
Cold forming (cold rolled steel—CRS) can be realized by twisting or drawing and profiling the bars or wires obtained by hot rolling. The detailed production procedure can be found in the work [26].

2.2. Hot Forming—Hot Rolled Steel/HRS

The hot rolled steel bars are processed directly on the steel mold in the steel furnace in the steel processing plant. That is, the finished product that comes out of the furnace is hot (hence the name “hot rolled”) and can be used after cooling. In this case, it is cooling directly in the air.
Hot rolled (HRS) steel bar is produced by a pressure treatment method, which allows the processed steel billet to pass through the gap between a pair of rotating rolls (various shapes) at high temperatures, and the cross-section of the material is reduced due to the compression of the roll, and the length is increased. Hot rolled steel bars have low yield strength and good plastic properties.

2.3. Thermal Refinement/Controlled Cooling from Rolling over Temperature, TEMPCORE®, TMT

This method of producing reinforcement was developed by C.R.M. Liége in the eighties of the twentieth century [36,37] (see Figure 1). The reinforcement bar is shaped while hot, but in contrast to classically hot-rolled reinforcing steel, its surface is suddenly cooled by water. After this sudden but very short cooling, the reinforcement is allowed to cool in air. In this way, a composite cross-section is created: a surface layer with a high yield strength and tensile strength but low ductility (tempered martensite), and a core with a lower yield strength and tensile strength but greater ductility (ferritic-pearlitic structure).
Within the former Czechoslovakia, in the 1990s, Třinecké železárny Ltd. produced hot-rolled reinforcement with controlled cooling from the post-rolling temperature (thermally refined reinforcement) with the designation 10 505.9 (R). Today it is a reinforcement with the designation B500 B according to codes STN EN 1992-1-1 [8] and STN EN 10080 [24]—this designation will be used further in the text.
Different methods of production of reinforcement can lead to different approaches when considering the effects of corrosion in the framework of the presence of the existing structures diagnostics. Cold and hot formed reinforcements have practically constant resistance across the cross-section, which is not true of the hot-formed reinforcements with cooling control, which have the greatest resistance in the surface layer. Therefore, in the research, we focused on documenting the tensile strength and yield strength of these reinforcements when exposed to a corrosive environment.

3. Corrosion

Corrosion is a physical-chemical reaction between the material and the environment. In a simplified form, it can be said that corrosion is interaction between a metal and the environment. Its result is a permanent chemical change of the metal, which significantly changes its chemical, physical and mechanical properties. Corrosion of metals occurs spontaneously because the metal tends to reach a thermodynamically stable state (the natural state in which it is found in nature). In the production of pure metal, a huge amount of energy is expended, part of which becomes part of the metal. This energetically richer state of pure metal is referred to as metastable, therefore it tends to return to a stable state under normal conditions [38].
The environment includes all the conditions to which the metal is exposed such as air, water, sun, sheltered or unsheltered conditions, de-icing salt and all other actions affecting the metal. The corrosion effect can be determined by many ways, such as visual inspection, measured or calculated corrosion speed (i.e., corrosion rate rcorr or corrosion loss Dcorr, current density icorr or weight loss ∆m). The most widespread type of corrosion is uniform corrosion (corrosion over the whole surface of a metal) or pitting corrosion (corrosion localized on the small area of a metal) under outdoor conditions, the so-called atmospheric corrosion. It can be said that local corrosion (pitting corrosion) causes local notches on the reinforcement. The effect of notches due to corrosion on the mechanical properties of the reinforcement has also not been investigated in the previous papers.
The result of corrosion acting on reinforced concrete structures is a reduction in the cross-sectional area of the reinforcement and volume changes of the corrosive products (rust). The cross-sectional area reduces the resistance of the element, and the volume changes of the corrosive products degrade the concrete cover layer and thereby reduce the lifetime of the element [39,40,41,42,43]. Ultimately, this can lead to a structural failure [44,45] or collapse of the structure [46,47,48].
Long-term research is ongoing in the field of reinforcement corrosion. Many research works were focused on the effect of reinforcement corrosion on change in resistance and stiffness of elements (or the entire structure). It is mainly about the effect of corrosion on the bending resistance or shear resistance of reinforced concrete (RC) elements. Val has examined the effect of corrosion of reinforcing steel on flexural and shear strength, and subsequently on reliability, of reinforced concrete beams, [49]. Two types of corrosion—general and pitting—were considered, with particular emphasis on influence of the pitting corrosion of stirrups on performance of beams in shear. The authors of works [49,50,51] also dealt with the effect of reinforcement corrosion on change in resistance of the RC elements subjected to bending or/and shear. It has been shown that the change in resistance of an RC element in shear is more sensitive to corrosion than the change in resistance of an element subjected to bending. This is due to the fact that the shear reinforcement is closer to the surface (smaller concrete cover layer) and therefore begins to corrode significantly earlier than the main longitudinal reinforcement. Francois et al. [52] dealt with the impact of corrosion on the mechanical properties of steel in reinforced concrete. Steel bars were extracted from a 27-year-old corroded reinforced concrete beam that had been exposed to a chloride environment. Bars with different degrees of corrosion and with different corrosion pit depths were tested in tension. The work [53] dealt with the potential effect of corrosion damage on performance of the reinforced concrete member. The problem was solved by numerical modelling. The thesis presented a parametric study to assess the influence of different levels of corrosion to the structural performance. Li et al. [54] deals with the effect of reinforcement corrosion in combination with sustained load on the resistance of the compressed member (column). However, the resistance of the elements depends on the bond between the reinforcement and the concrete as well, which is also affected by corrosion [55,56,57,58]. The effect of corrosion of the reinforcement on the bond between concrete and reinforcement is significant mainly for smooth reinforcement and depends on the type and method of anchoring the reinforcement [59,60].
Many times, however, it is first necessary to know the effect of corrosion on the change in the resistance of the reinforcement itself, that is, on the change in the mechanical properties of the reinforcement. The effect of reinforcement corrosion on the mechanical properties of SAE 1020 structural steel was investigated by Martínez et al. [61]. As part of the research, the reinforcement samples were exposed to various aggressive environments from C2 to C5 for a period of 36 months. It was demonstrated that all mechanical properties of the reinforcement decreased as a function of environmental atmospheric aggressiveness. Tsonev et al. [62] once again investigated the impact of atmospheric corrosion on mechanical properties of B235 steel bars. In this case, the samples were exposed to natural atmospheric corrosion in a temperate climate zone for 25 years. The initial stress-percentage extension curves were determined. Apostolopoulos et al. [63] investigated the tensile behavior of corroded reinforcing bars BSt 500s. The experiments in the laboratory showed that the corrosion exposure causes an appreciable mass loss which increases with increasing duration of exposure. That led to a significant increase of the applied stress. Allam et al. [64] investigated the influence of atmospheric corrosion on the mechanical properties of reinforcement. This paper reports the results of an investigation carried out to evaluate the mechanisms of atmospheric corrosion of reinforcing steel in arid regions, and their influence on the weight loss, strength, elongation and bendability. The results indicated that atmospheric corrosion begins as a localized attack at discrete points on the metal surface. Wenjun et al. [65] were dealing with influence of corrosion degree and corrosion morphology on ductility of steel reinforcement. It was demonstrated that the corrosion morphology significantly influenced the ductility of corroded reinforcement, and an empirical model was proposed to quantify the effect of corrosion morphology. Changes in the mechanical properties of corroded reinforcement were also assessed in the works [66,67]. In the research, the uniform and pitting corrosion was investigated. Moreover, the numerical model supporting the experimental measurements was performed. Influence of time-dependent corrosion on mechanical properties as strength, ductility, and so on, was investigated by Ghafur [68] and Balestra et al. [69]. A total of 99 samples with six different diameters were tested in [68]. The three exposure periods and six different environments were considered to assess the influence of corrosion on mechanical properties of reinforcing bars. Reinforcement buried and naturally corroded for 60 years were studied in [69]. The mechanical properties were compared to reference reinforcements, which also remained buried for 60 years. The influence of corrosion and corrosion rate on the mechanical performance of carbon and stainless steel, using an experimental program, was dealt with by Wang et al. [70].
The response of corroded reinforcing steel bars under cycling loading was investigated by Kashani et al. [71]. The paper reports results from experimental investigations on the behavior of corroded reinforcements in tension, compression and under cyclic loading including buckling. The corrosion effect on mechanical properties of high-strength steel bars under dynamic loading was investigated by Chen et al. [72]. High strength reinforcing steel bars were corroded by using accelerated corrosion methods and tensile tests were carried out under different strain rates. Corrosion of the reinforcement also affects the fatigue behavior (properties) of the reinforcement. This issue was studied in [40,73,74]. The TEMPCORE® steel bars were investigated. A sectional fiber model was described. The model alloys obtaining σ-ε and fatigue curves of corroded steel.

4. Experimental Study Program

The experimental program was realized on the cold rolled reinforcement ϕ6 B500 B (CRS) and on hot-formed reinforcement with cooling control ϕ10 B500 B (TMT). It is also necessary to point out the different notation of quantities according to STN EN 10080 [24] and STN EN 1992-1-1 [8]—see Table 1. We will keep this double marking in this paper as well.

4.1. Cold Rolled Reinforcement ϕ6

For experimental purposes, the cold-rolled reinforcement B500 B of a 6 mm diameter was considered (see Figure 2), which has a practically constant tensile strength across the cross-section, which is indicated by the dependence of hardness on the radius shown in Figure 3. Similar results were also confirmed in research work [75]. The hardness test was executed with an automatic machine Zwick/Roel ZHVµ-A according to STN EN ISO 6507-1 [76] on a rebar shown in Figure 2. The measurements were performed in air at room temperature using the load of 500 gf for a holding time of 10 s. The largest and smallest values were discarded and then the average of the remaining values was obtained for evaluation.
To describe the material response of the non-corroded reinforcement, 3 samples were created from B500 B ϕ6 reinforcement without modifications (surface modification or treatment).

4.2. The Effect of Corrosion on Reinforcement ϕ6

To determine the effect of corrosion on mechanical properties, tensile tests of cold-formed reinforcement ϕ6 were performed. The samples were stored in a corrosion chamber DCTC 1200P with a 5 % NaCl solution (salt chamber) at a temperature of 35 °C taking into account STN EN ISO 9227, which describes the operating conditions in the corrosion chamber. A total of 22 corroded samples were prepared and tested. To verify the effect of corrosion (thickness of the corroded layer), 16 samples were in the corrosion chamber for 62 days and the remaining 6 samples for up to 233 days—see Table 2.
Static tensile tests were carried out in accordance with STN EN ISO 6892-1 [77] and STN EN ISO 15630-1 [78]. The non-corroded samples without treatment and corroded ones were tested.
Table 2 shows the weight values of samples before and after removal from the corrosion chamber after 62 or 233 days; the relative weight loss marked as α, the force at yield strength Fe and the force at tensile strength Fm. The relative weight loss α was calculated according to formula:
α = ( m 0 m corr ) m 0 .
To be able to determine the yield strength and tensile strength as accurately as possible, we needed to determine the cross-sectional area of the reinforcement as accurately as possible. In the case of the non-corroded reinforcement, the nominal cross-sectional area A0, based on the diameter of the reinforcement (in our case, ϕ6 or ϕ10 mm), can be considered. The cross-sectional area is then calculated from the basic relationship:
A 0 = π ϕ 2 4 .
As previously mentioned, the standard STN ISO 13822 [20] says that the actual properties of the materials should be considered, that is, the diameter of the reinforcement should be measured in several places and the minimum diameter ϕmin should be used and calculated using it the minimum area of reinforcement Amin using the equation:
A min = π ϕ min 2 4 .
The Amin area can be determined both for non-corroded reinforcement and for corroded reinforcement. The diameter of the reinforcement can be measured using a caliper. In our case, 10 measurements were made on each sample, which were statistically evaluated. Average values are presented. The disadvantage of this method is that a circular cross-section of the reinforcement is assumed, which is not entirely true. Therefore, the standard STN EN 13822 [20] recommends, if possible, to take samples from the structure and modify them according to the standard [77,78] into the shape of “bones” (standardly-treated samples)—this creates the exact circular shape of the reinforcement using a lathe with a diameter of ϕS and thus it is able to determine the area AS using the equation:
A S = π ϕ S 2 4 .
In our case, since the research was done in the laboratory on small samples, it was possible to determine the cross-sectional area Ag of the reinforcement using the weight loss of the reinforcement using the equation:
m = A 0 . 7850 . l , m 1 = A g . 7850 . l cor , m 1 = A g . 7850 . l cor , l l cor , m 1 m 0 = A g . 7850 . l A 0 . 7850 . l A g = m 1 m 0 A 0 ,
where m1 is the weight after corrosion [kg], m0 is the weight before corrosion (initial weight) [kg], l is the initial length of sample before corrosion [m], lcor is the length of sample after corrosion [m].
Figure 4 describes the mutual ratios of the nominal cross-sectional area A0, the area determined from the mass loss Ag, and the minimum area Amin measured on the sample (in which the sample broke during the tensile test). All values are valid for ϕ6.
In Figure 5, one can see the orientation of the steel structure due to the production method (cold rolling) in the corroded part (Figure 5b).
The curves Ft⇔As (Fy⇔As) in Figure 6 and Figure 7 represent the dependence between the force and a cross-sectional area on non-corroded ϕ6 samples (three points from three samples are very close to each other in the upper part, which was connected to the “zero” point). The measured values in Figure 6 and Figure 7, marked Rm,g = Fm⇔Ag (Re,g = Fe⇔Ag) represent the relationship between the tensile strength (yield strength) and the cross-sectional area determined from the weight loss (marked as Ag). The measured values marked in Figure 6 and Figure 7 Rm,min = Fm⇔Amin (Fe⇔Amin) represent the relationship between the tensile strength (yield strength) and the minimum cross-sectional area of the corroded sample (marked as Amin). The measured values of Rm,min (Re,min) are above the Ft⇔As (Fy⇔As) curve, which means that the stress reached at the tensile strength (yield strength) is greater than the stress reached on non-corroded samples.
From the figures of the force vs. the cross-section (Figure 6 and Figure 7) as well as the ratios of stresses between the tensile strength of the corroded to non-corroded samples (tensile strength Rm/ft) to the weight loss (see Figure 8) and the ratios of the strengths between the yield strength of the corroded to non-corroded samples (yield strength Re/fy) to by mass loss (see Figure 9), it is obvious that the strengths reached in the cross-sections with the minimum area are higher than the strengths in the cross-section of the standardly-treated samples. The stresses value in standard cross-sections (non-corroded) is represented by the curve Ft⇔As (Fy⇔As) in Figure 6 and Figure 7 and the value “1” in Figure 8 and Figure 9.
In the case of tensile strength, the stress in the minimum cross-section was greater by 0.7 to 25.9 % than the stress reached in standard (non-corroded) samples. In the case of the yield strength, the stress in the minimum cross-section was greater by 6.2 to 32.3 % than the stress reached during the standard tests. This increase is due to notches created by corrosion.

4.3. Hot-Rolled Reinforcement with Controlled Cooling ϕ10 (Thermal Refinement, TMT)

For comparison, a hot-formed reinforcement with controlled cooling B500 B with a diameter of 10 mm, which has no constant tensile strength along the cross-section [79], was considered. To describe the material response, samples of B500 B (TMT) ϕ10 reinforcement were created and tested:
-
4 pcs (samples) without modifications,
-
3 pcs (samples) without ribs, 3 pcs ϕ8 mm, 3 pcs ϕ7.24 mm, 3 pcs ϕ6.35 mm, 6 pcs ϕ5 mm, 3 pcs ϕ4 mm (total 21 samples)—those samples were standardly-treated samples to smaller diameters to verify whether the cross-sectional strength is constant or changes.
Static tensile tests were performed in accordance with STN EN ISO 6892-1 [77] and STN EN ISO 15630-1 [78] on an Instron 250 kN hydraulic jack.
Figure 10 shows values of the forces obtained at the tensile strength ft (force Fm) and the yield strength fy (force Fe) depending on the area of the reinforcement. The dependences are not linear, which is caused by the reinforcement production method, when there is a layer of softened martensite around the perimeter and the core is pearlitic (see Figure 11). Figure 11 also shows the thickness of the tempered martensite layer, which reaches 0.48 to 0.75 mm outside the ribs, in a cross section.
The hardness profile on three samples of the hot rolled ϕ10 with controlled cooling is shown in Figure 12. For comparison, the hardness distribution of reinforcement ϕ6 is also shown (blue line with cross marks). Figure 13 describes the mechanical properties (tensile and yield strength) of the reinforcement of diameter ϕ10 by individual layers depending on the radius of the reinforcement. Figure 13 is created based on the as difference in the strengths of samples obtained during the tensile tests of samples with different diameters. It is obvious that the surface layer formed by tempered martensite has greater tensile strength than the pearlite core.

4.4. The Effect of Corrosion on Reinforcement ϕ10

Even in this case, tensile tests of hot rolled concrete reinforcement with controlled cooling B500B ϕ10 were performed to determine the effect of corrosion on the mechanical properties. The samples were also stored in the corrosion chamber with a 5 % NaCl solution at a temperature of 35 °C. Static tensile tests were again performed in accordance with STN EN ISO 6892-1 [77] and STN EN ISO 15630-1 [78]. A total of 19 corroded samples were prepared and tested. Again, to verify the effect of corrosion (thickness of the corroded layer), 9 samples were in the corrosion chamber for 62 days, 8 samples were in the corrosion chamber for 233 days, and the remaining 2 samples for up to 296 days—see Table 3.
Table 3 shows the weight values of samples ϕ10 reinforcement before and after removal from the corrosion chamber, the relative weight loss marked as α, the force at yield strength Fe and the force at tensile strength Fm. The relative weight loss α was again calculated according to Formula (1).
Figure 14 describes the mutual ratios of the nominal cross-sectional area A0, the area determined from the mass loss Ag, and the minimum area measured on the Amin sample (in which the sample broke during the tensile test)—valid for ϕ10.
In Figure 15 and Figure 16, the plotted values of Fm/As (Fe/As) correspond to the forces of non-corroded samples depending on the tensile strength (yield strength) limits at the real cross-sectional area (As). The values Rm,g = Fm/Ag (Re = Fe/Ag) represent the forces of the corroded samples at the tensile strength (yield strength) depending on the area determined from the mass loss (Ag). The values Rm,min = Fm/Amin (Re,min = Fe/Amin) represent the forces of the corroded samples to tensile strengths (yield strength) depending on the minimum area measured on the sample (Amin).
Figure 17 and Figure 18 show the ratios of the strengths between the tensile strength (yield strength) of corroded samples to non-corroded samples ((Rm,min/ft), (Re,min/fy)) and ((Rm,g/ft), (Re,g/fy)) to the loss of cross-sectional area determined to the relevant loss of cross-sectional area of reinforcement ϕ10 ((1 − Ag/A0) or (1 − Amin/A0)). The loss of cross-sectional area was chosen for comparison to take into account the effect of changing material characteristics along the cross-section of the reinforcement. It follows from Figure 17 and Figure 18 that the stresses determined from the area calculated from the weight loss are lower than those from the minimum cross-sectional area.
The values of fti and fyi are the values of the standard tensile strength and yield strength of the samples, respectively, corresponding to the area of the non-degraded cross-section. The limit value here is 1.0.
It is now possible to compare the ϕ6 reinforcements to the ϕ10 ones (see Figure 19 and Figure 20). From the results follows that ϕ6min,m and ϕ6min,e reach higher values compared to ϕ10min,m and ϕ10min,e, which is caused by the corrosion of the “better quality” surface layer (tempered martensite) on the ϕ10 reinforcement samples.

5. Evaluation of Results and Discussion

The yield strength and tensile strength, determined from the minimum cross-sectional area determined on corroded reinforcements, are higher than the yield strength and tensile strength obtained on non-corroded samples. This has been documented on both CRS and TMT reinforcement.
The obtained higher values of yield strength and tensile strength in places of minimum cross-section are Amin can be explained by the action of multiaxial tension in the cross-section caused by the existence of notches created by corrosion (pitting corrosion). When determining the material characteristics, the basic assumption is uniaxial stress. In corroded samples, due to the impact of notches, multiaxial tension appears, and by relating the obtained force to this minimum cross-sectional area, it is possible to obtain the higher stresses (and thus strength) than if the standard parameters of the sample were observed. The results of tensile tests of corroded reinforcements should not be used to determine the tensile strength and the yield strength for the assessment of existing structures, because notches from corrosion (pitting corrosion) can cause the multiaxial tension into the cross-section.
For the cross-sectional multiaxial stress analysis, an experimental program was performed on the same reinforcement ϕ10 B500 B (TMT). In the experimental program, it concerns the simulation of a local notch from corrosion (pitting corrosion) and its effect on multiaxial tension. Since it is not so easy to experimentally simulate pitting corrosion in a corrosion chamber (corrosion is more surface than pitting, it is problematic to accurately measure the area of pitting corrosion and thus also the cross-sectional area of the reinforcement, etc.), it was decided to simulate pitting corrosion by means of mechanical treatment of the samples—by milling the notches.
Figure 21 shows the dependence of the tensile stresses and displacement of the crosshead (hydraulic grip) of the hydraulic jack during the tensile test. The markings used in the figure are: ϕ10—is the reinforcement without modification (with the nominal cross-sectional area A0), ϕ10-ϕ7.4 is the ϕ10 reinforcement modified according to the standard requirements to a diameter of ϕ7.4 mm, ϕ10-ϕ6.3 is the ϕ10 modified reinforcement according to standard requirements for a diameter of ϕ6.3 mm, ϕ10-V-ϕ7 is a reinforcement ϕ10 with a created “V” notch of a diameter of ϕ7 mm, ϕ10-V-ϕ6 is a reinforcement ϕ10 with a created “V” notch of a diameter of ϕ6 mm. The shift of the crossbar of the hydraulic jack in the figure is insignificant, because the samples had different lengths. In the display, the size of the tensile stress in the cross-section is significant.
To verify the given effect, a second experimental program was carried out on the hot rolled (HRS) reinforcement, as well, which possesses the constant material characteristics across the cross-section. In the second experimental measurements, the test samples were made of S355 steel with a smooth surface of ϕ12 mm in diameter. Samples were tested:
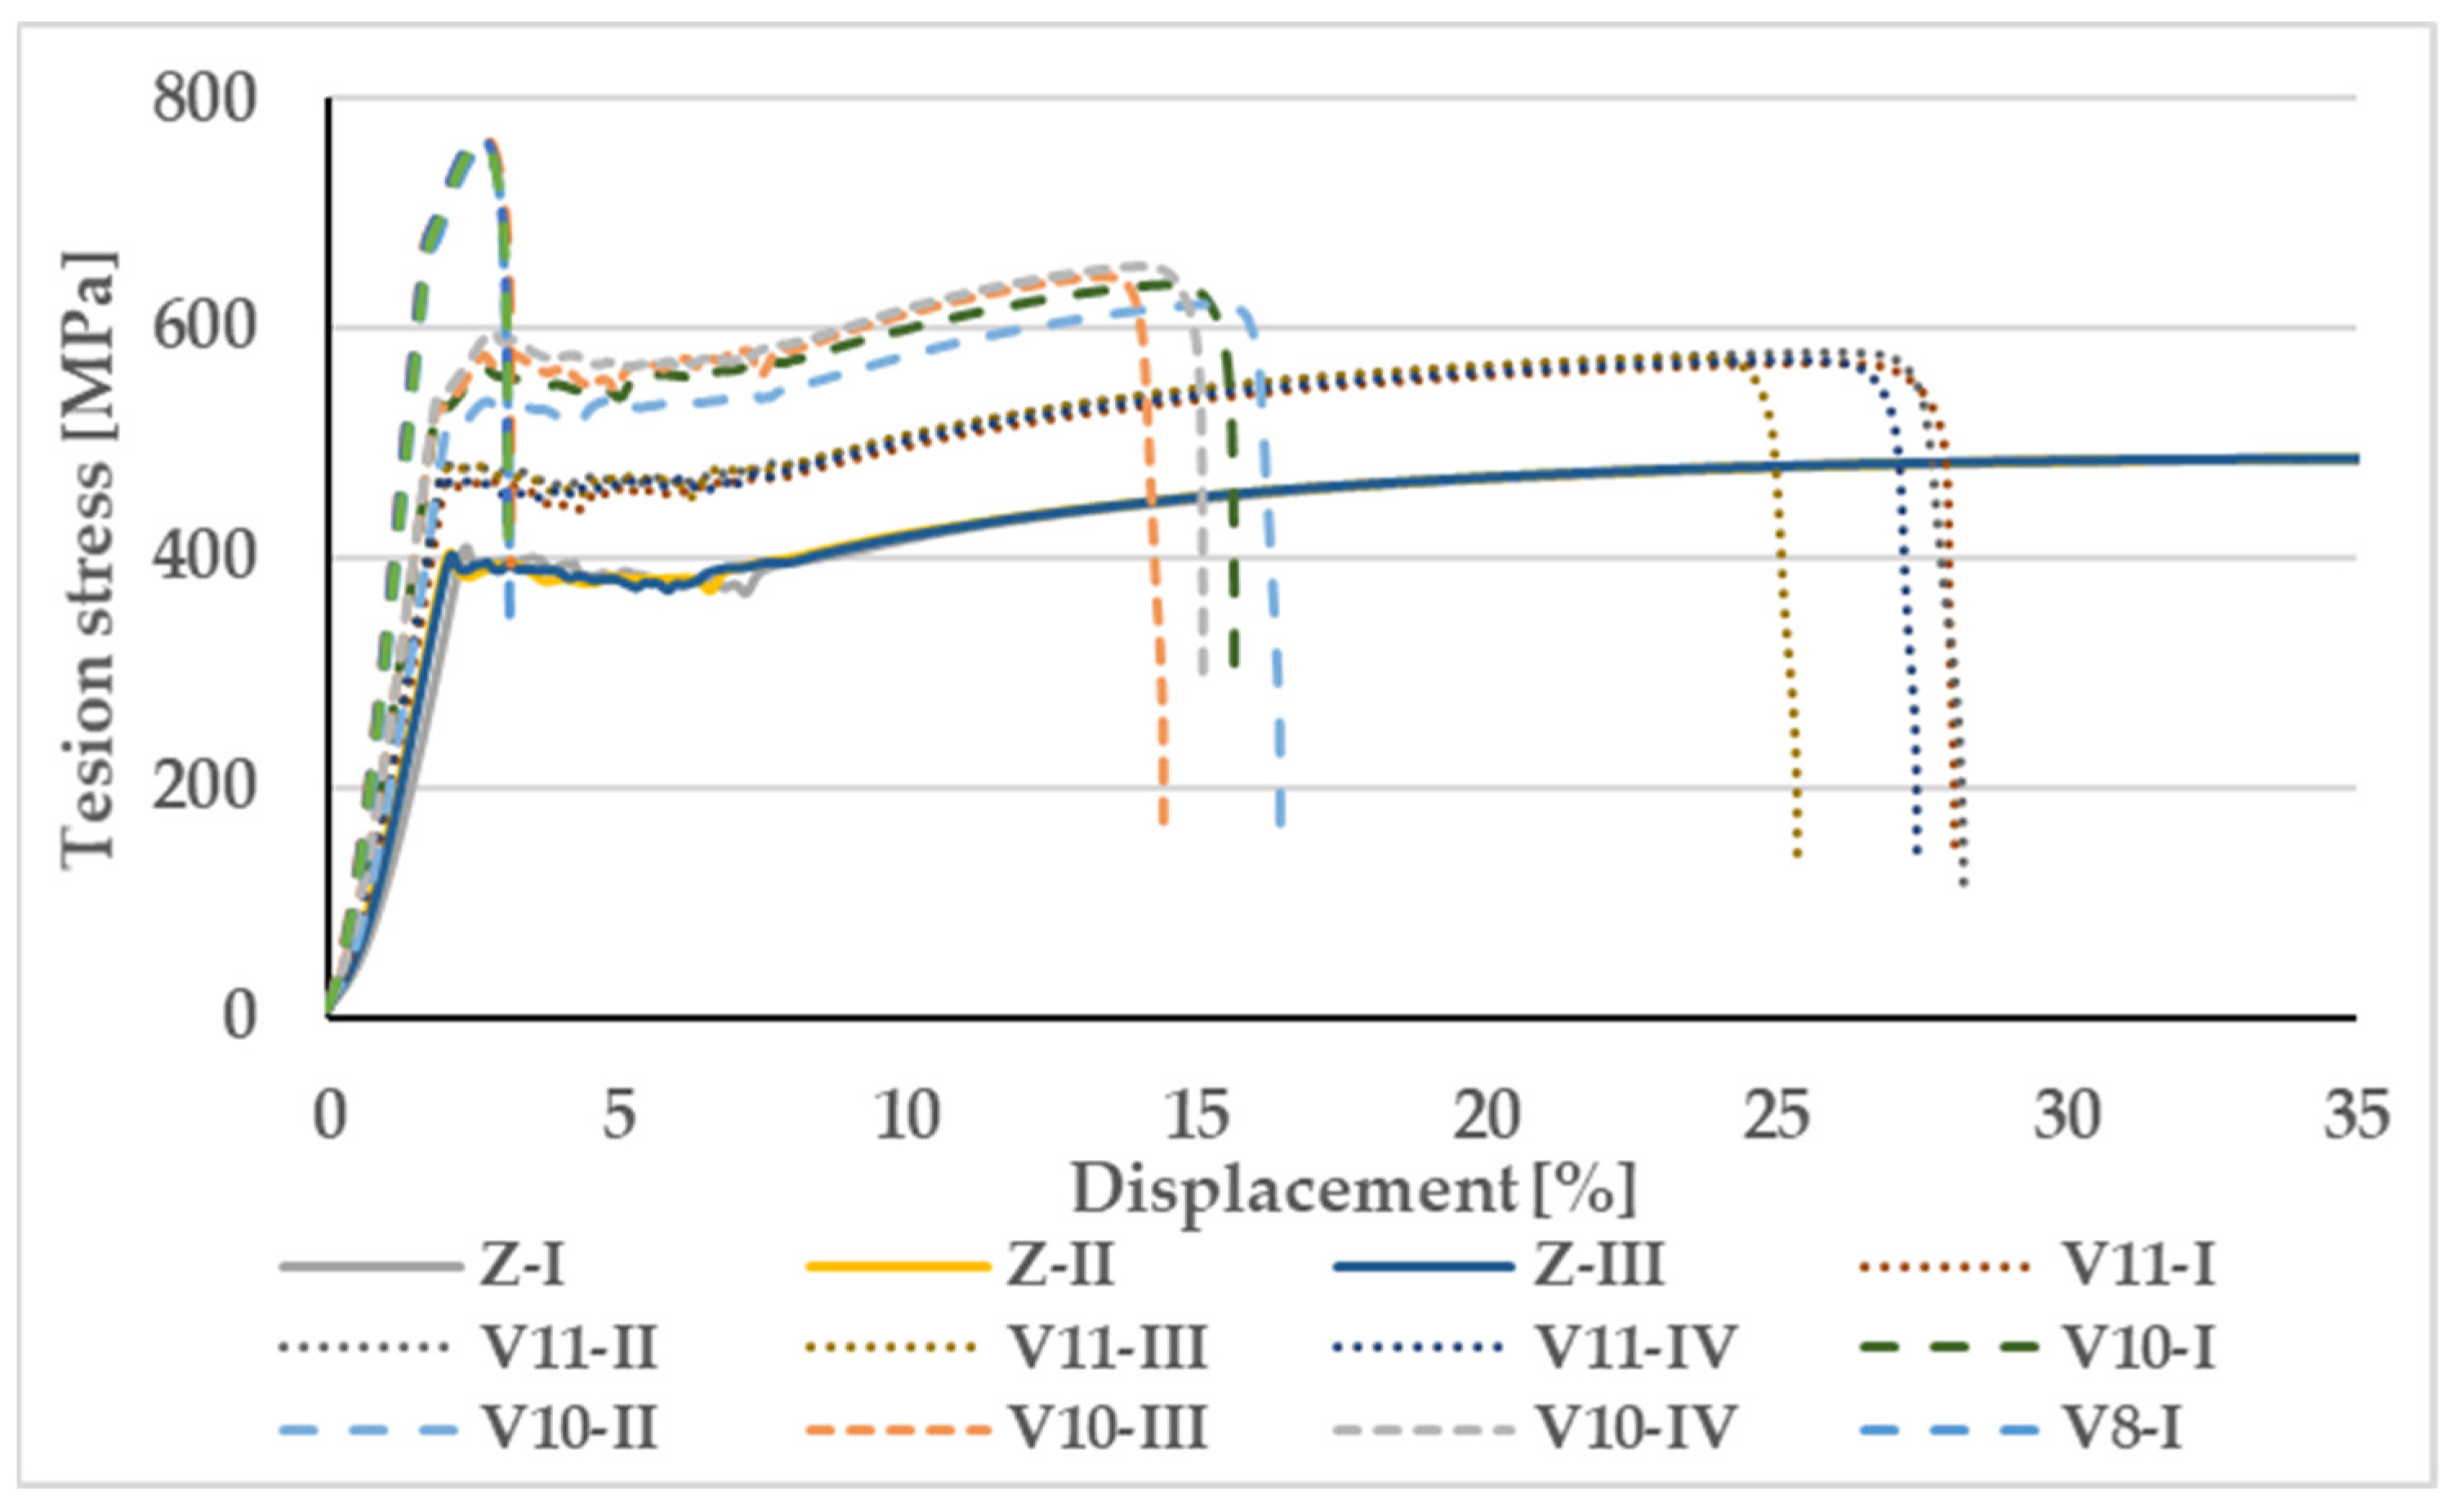
  • Z—samples without modification (without simulating pitting corrosion), length 120 mm between jaws in hydraulic jack—3 pcs,
  • N11—samples with a diameter of 11 mm (turned in a lathe from 12 to 11 mm), length of processing Lc = 77 mm (simulating surface corrosion)—according to the standard [74],
  • N10—samples with a diameter of 10 mm (turned in a lathe from 12 to 10 mm), length of processing Lc = 70 mm (simulating surface corrosion)—according to the standard [74],
  • N8—samples with a diameter of 8 mm (turned in a lathe from 12 to 8 mm), length of processing Lc = 56 mm (simulating surface corrosion)—according to the standard,
  • V11—the sharp notch so that the inner diameter is 11 mm (simulating pitting corrosion), the distance between the jaws was 120 mm,
  • V10—the sharp notch so that the inner diameter is 10 mm (simulating pitting corrosion), the distance between the jaws was 120 mm,
  • V8—the sharp notch so that the internal diameter is 8 mm, the width of the notch was 4 mm (simulating pitting corrosion), and the distance between the jaws was 120 mm.
Figure 22 illustrates the stress-deformation diagram of the tensile test of samples Z—without modifications, V11 with a notch (simulating pitting corrosion) so that the core diameter was 11 mm, V10 with a notch so that the core diameter was 10 mm (simulating pitting corrosion), V8 with a notch so that the core diameter was 8 mm (simulating pitting corrosion). In those cases (samples), the width of the notch core was 0.2 mm, the width of the entire notch measured on the surface of V8 was 4 mm, i.e., the slope of the notch edge was 45°. The x-axis of the figure represents again the displacement (deformation) of the crosshead of the hydraulic jack during the tensile test. From the results follow that the deeper the notch, the core is able to carry the higher stresses. A significant uneven distribution of tension stresses is created in the notch.
Figure 23 shows the dependence between the cross-sectional area (core of the notch) and the maximum force obtained when the sample breaks. Straight line (blue)—represents standard processed samples and Z samples. Notched line (orange)—are samples with notches V11, V10, V8 and Z samples. The points of the curve ϕ12 are the tensile forces at the standard tests (Z and N11, N10, N8), the points of the curve ϕ12-V are the tensile forces on the specimens with the “V” notch (Z, V11, V10, V8).
Although the given experimental analysis of the impact of notches is quite simplified, it serves to illustrate the issue of influence of the local notches on the change in the stress state in the cross-section at the place of the notch and thus on the mechanical properties of the reinforcement.
In the case of the cold-formed reinforcements, the material characteristics are approximately constant throughout the cross-section. The effect of a corrosive environment on the hot-formed reinforcement with controlled cooling leads to the degradation of a layer with better material characteristics. It follows that with the same mass loss due to corrosion, the CRS reinforcement will have a higher resistance than the TMT reinforcement.
When determining the material characteristics of corroded reinforcing steel samples taken from the existing structure by modifying the shape required by the standard in the case of the CRS reinforcement, we obtained the material characteristic values valid for the entire cross-section, but when adjusting the diameter of the TMT samples, we removed a better part of the cross-section and we therefore determined the material characteristics depending on the thickness of the removed part (notch).
By performing the tensile tests on corroded samples with consideration of the minimum area Amin, it is possible to obtain the tensile strength (yield strength) higher than that of the original non-corroded material. Considering the average cross-sectional area determined from the weight loss of Ag, the obtained tensile strengths (yield strength) are lower than those of the original material (non-corroded). Determining the average cross-sectional area from the mass loss is possible in laboratory conditions under the action of full-surface corrosion, but in real conditions it is rather complicated.
To determine the material characteristics (yield and tensile strengths) of corroded reinforcing steel bars in the structure, it is recommended to remove the reinforcing steel bars and adjusting their cross-section to a diameter corresponding to the minimum diameter found on the corroded reinforcement in the structure. For the CRS reinforcements, the material characteristics, corresponding to the entire cross-section of the reinforcement, can be determined, while for the TMT reinforcements it takes into account the degradation of the surface layer with the best material characteristics within the cross-section.
The higher strength (resistance) is caused by the notch effect. Uniaxial tension occurs in samples for determining the standard parameters. In corroded samples, due to the impact of notches, multiaxial tension appears, and by relating the obtained force to this minimum cross-sectional area, it is possible to obtain a higher tension than if the standard parameters of the sample were observed.
The effect of the notch is more pronounced with the cold-formed reinforcement than with hot-formed one. In the case of the hot-formed reinforcement Tempcore, this effect is eliminated by corrosion of the stronger martensitic layer. The results of tests of corroded reinforcements should not be used to determine the strength limit and the yield strength for the assessment of existing structures, because corrosion notches introduce multiaxial tension into the cross-section.

6. Conclusions

Evaluation of the reinforced concrete (RC) structures is a rather complex and demanding process. To determine the resistance of elements (e.g., in bending, shear, pressure and their combination), it is necessary to know their material properties as accurately as possible, including the mechanical properties of the reinforcements. The paper is dedicated to determining the mechanical properties (yield strength and tensile strength) of the cold-formed reinforcement and thermal refinement reinforcement (with controlled cooling from rolling over temperature). Subsequently, the effect of corrosion of the reinforcement on the change of mechanical properties and, in addition to the effect of the notch on the stress at the point of failure was investigated. An experimental program in laboratory was used to investigate the mentioned effects. It can be problematic that the creation of pitting corrosion (notches) is not a simple natural process, and therefore it was created mechanically in the experimental measurements. It would be interesting to perform experimental measurements on real samples exposed to an aggressive environment (not accelerated corrosion tests), but this is time-consuming and expensive.
The results of the experimental measurements point to the following conclusions:
-
It has been proven that there is a difference in the mechanical properties of the cross-section reinforcements produced by different production methods (cold rolled and hot rolled thermal refinement); thus, from the point of view of recalculation of the existing structure attacked by corrosion, it is necessary to know how the resistance of the reinforcement can change (tensile strength—yield strength) over time due to corrosion, which means that it is necessary to find out how the reinforcement was manufactured, or to verify this fact by tests on samples.
-
It was confirmed that in the case of the cold rolled reinforcement, the mechanical properties after the cross-section are approximately the same (constant),
-
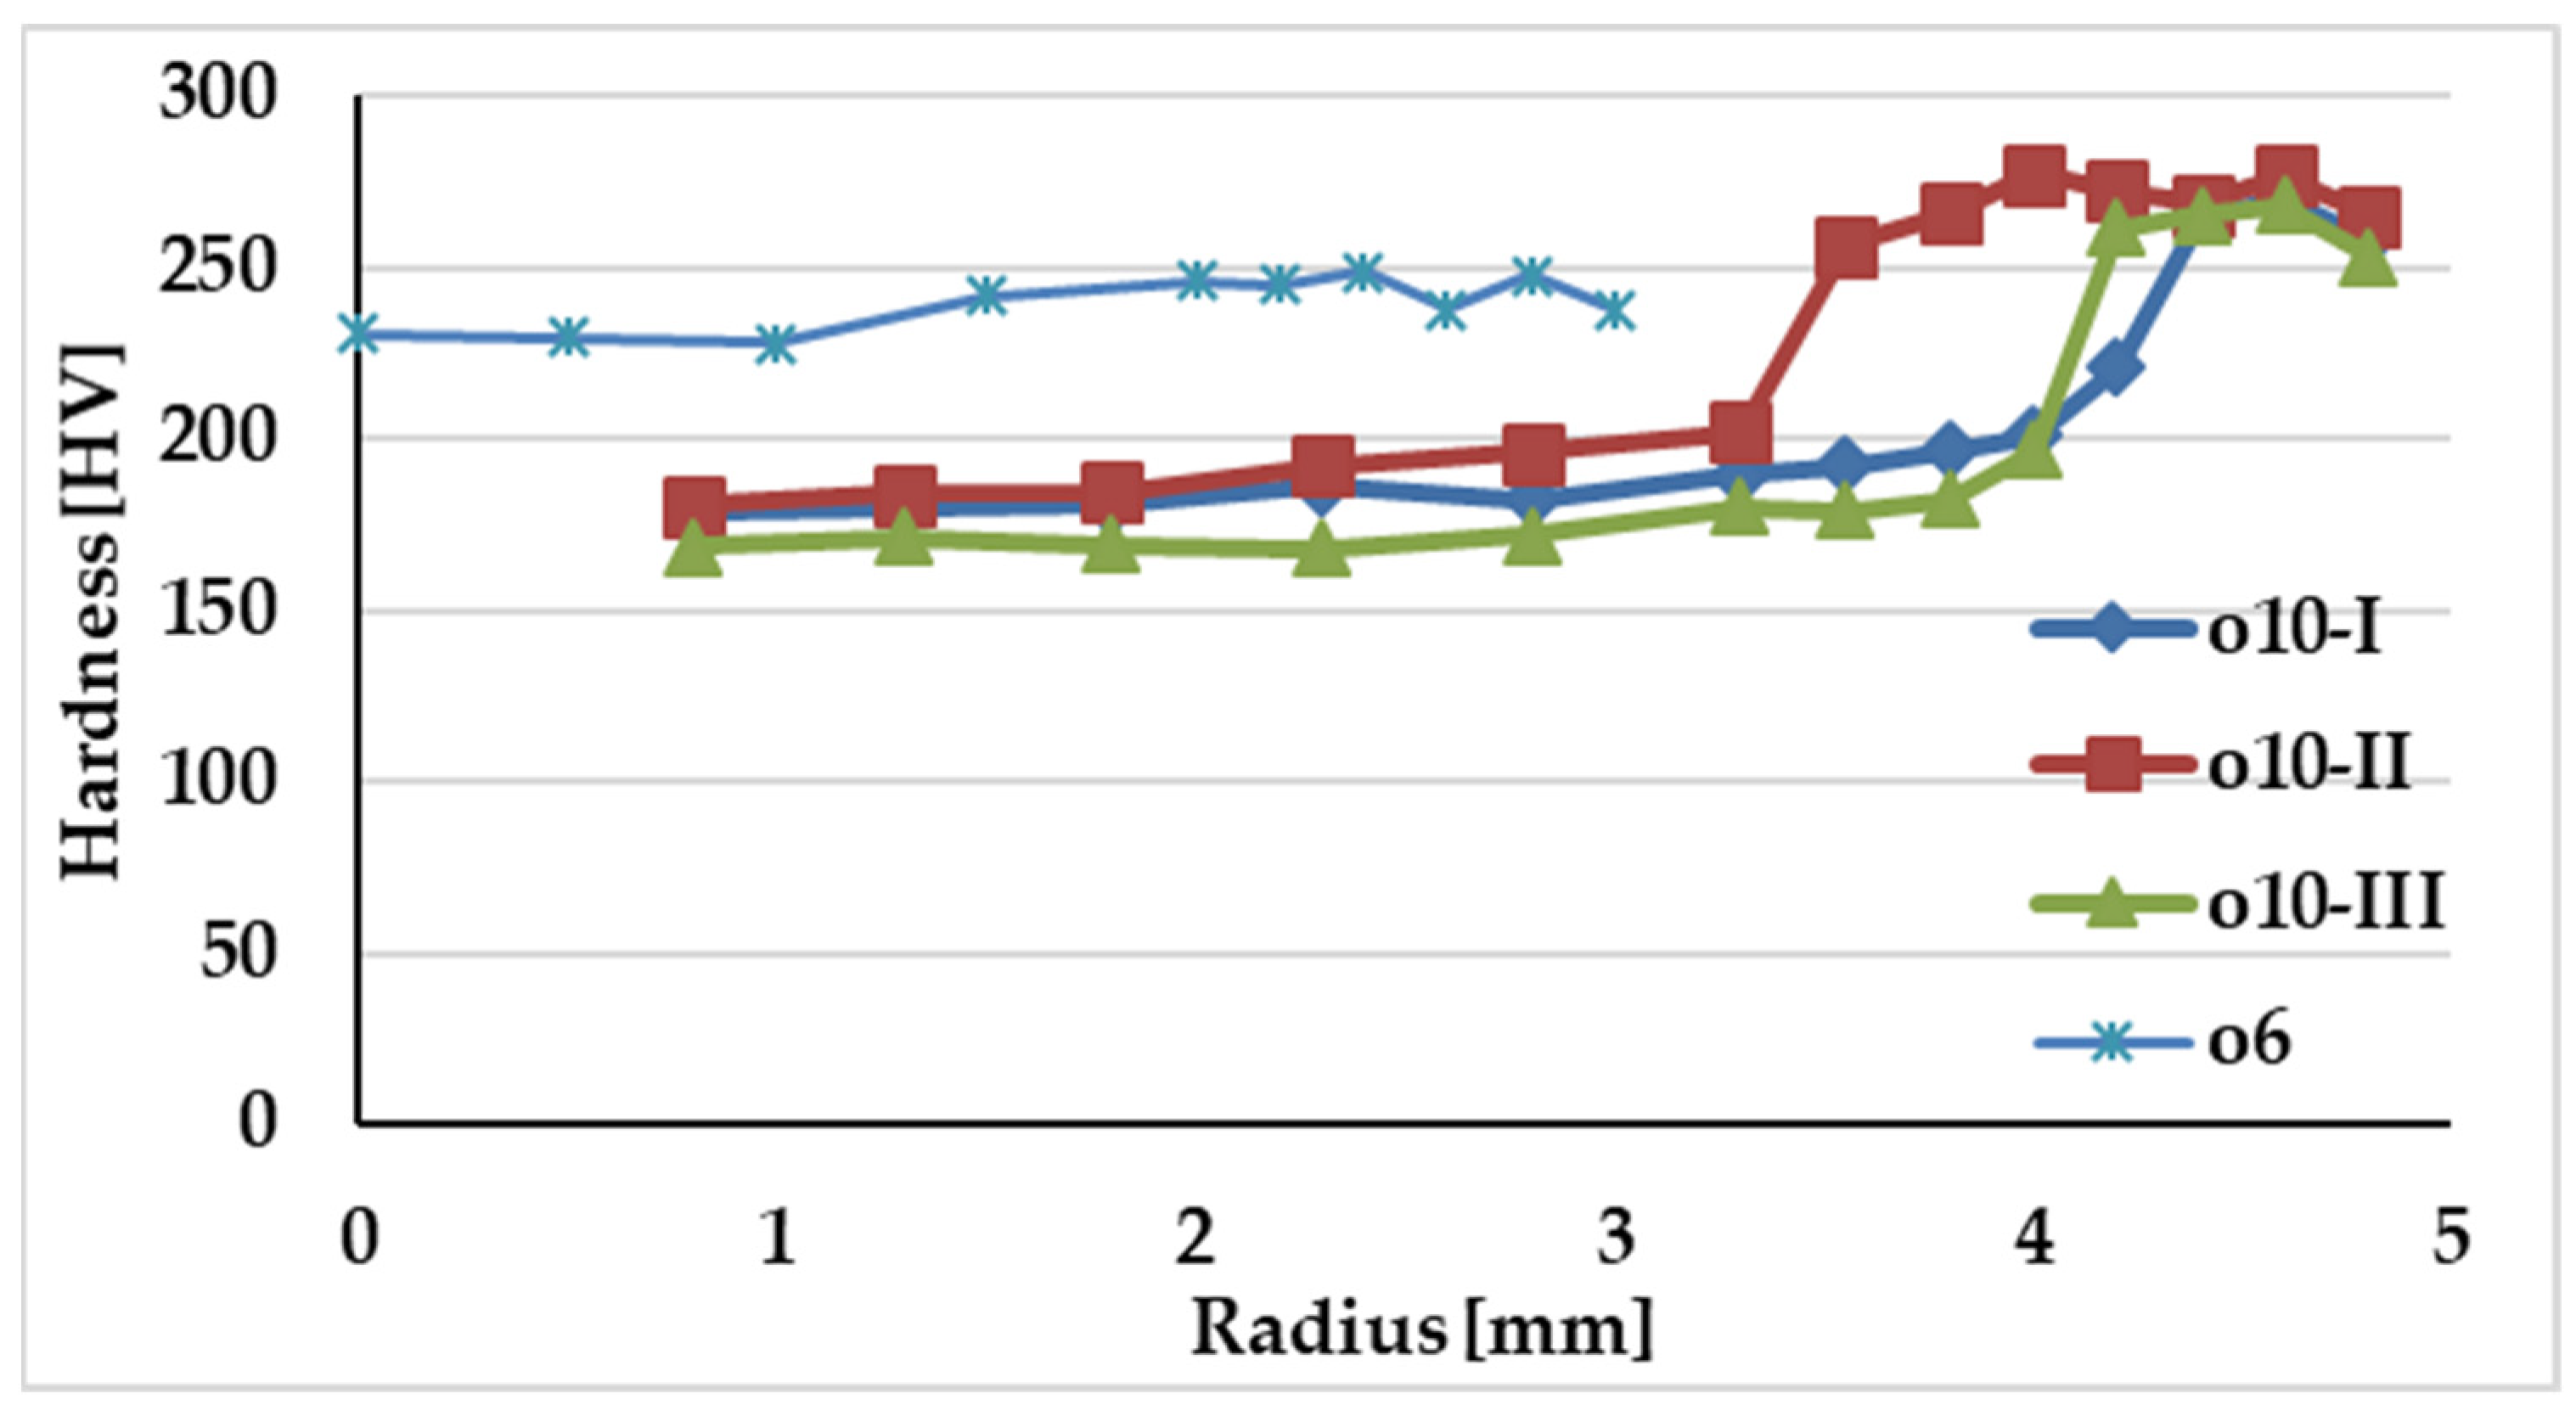
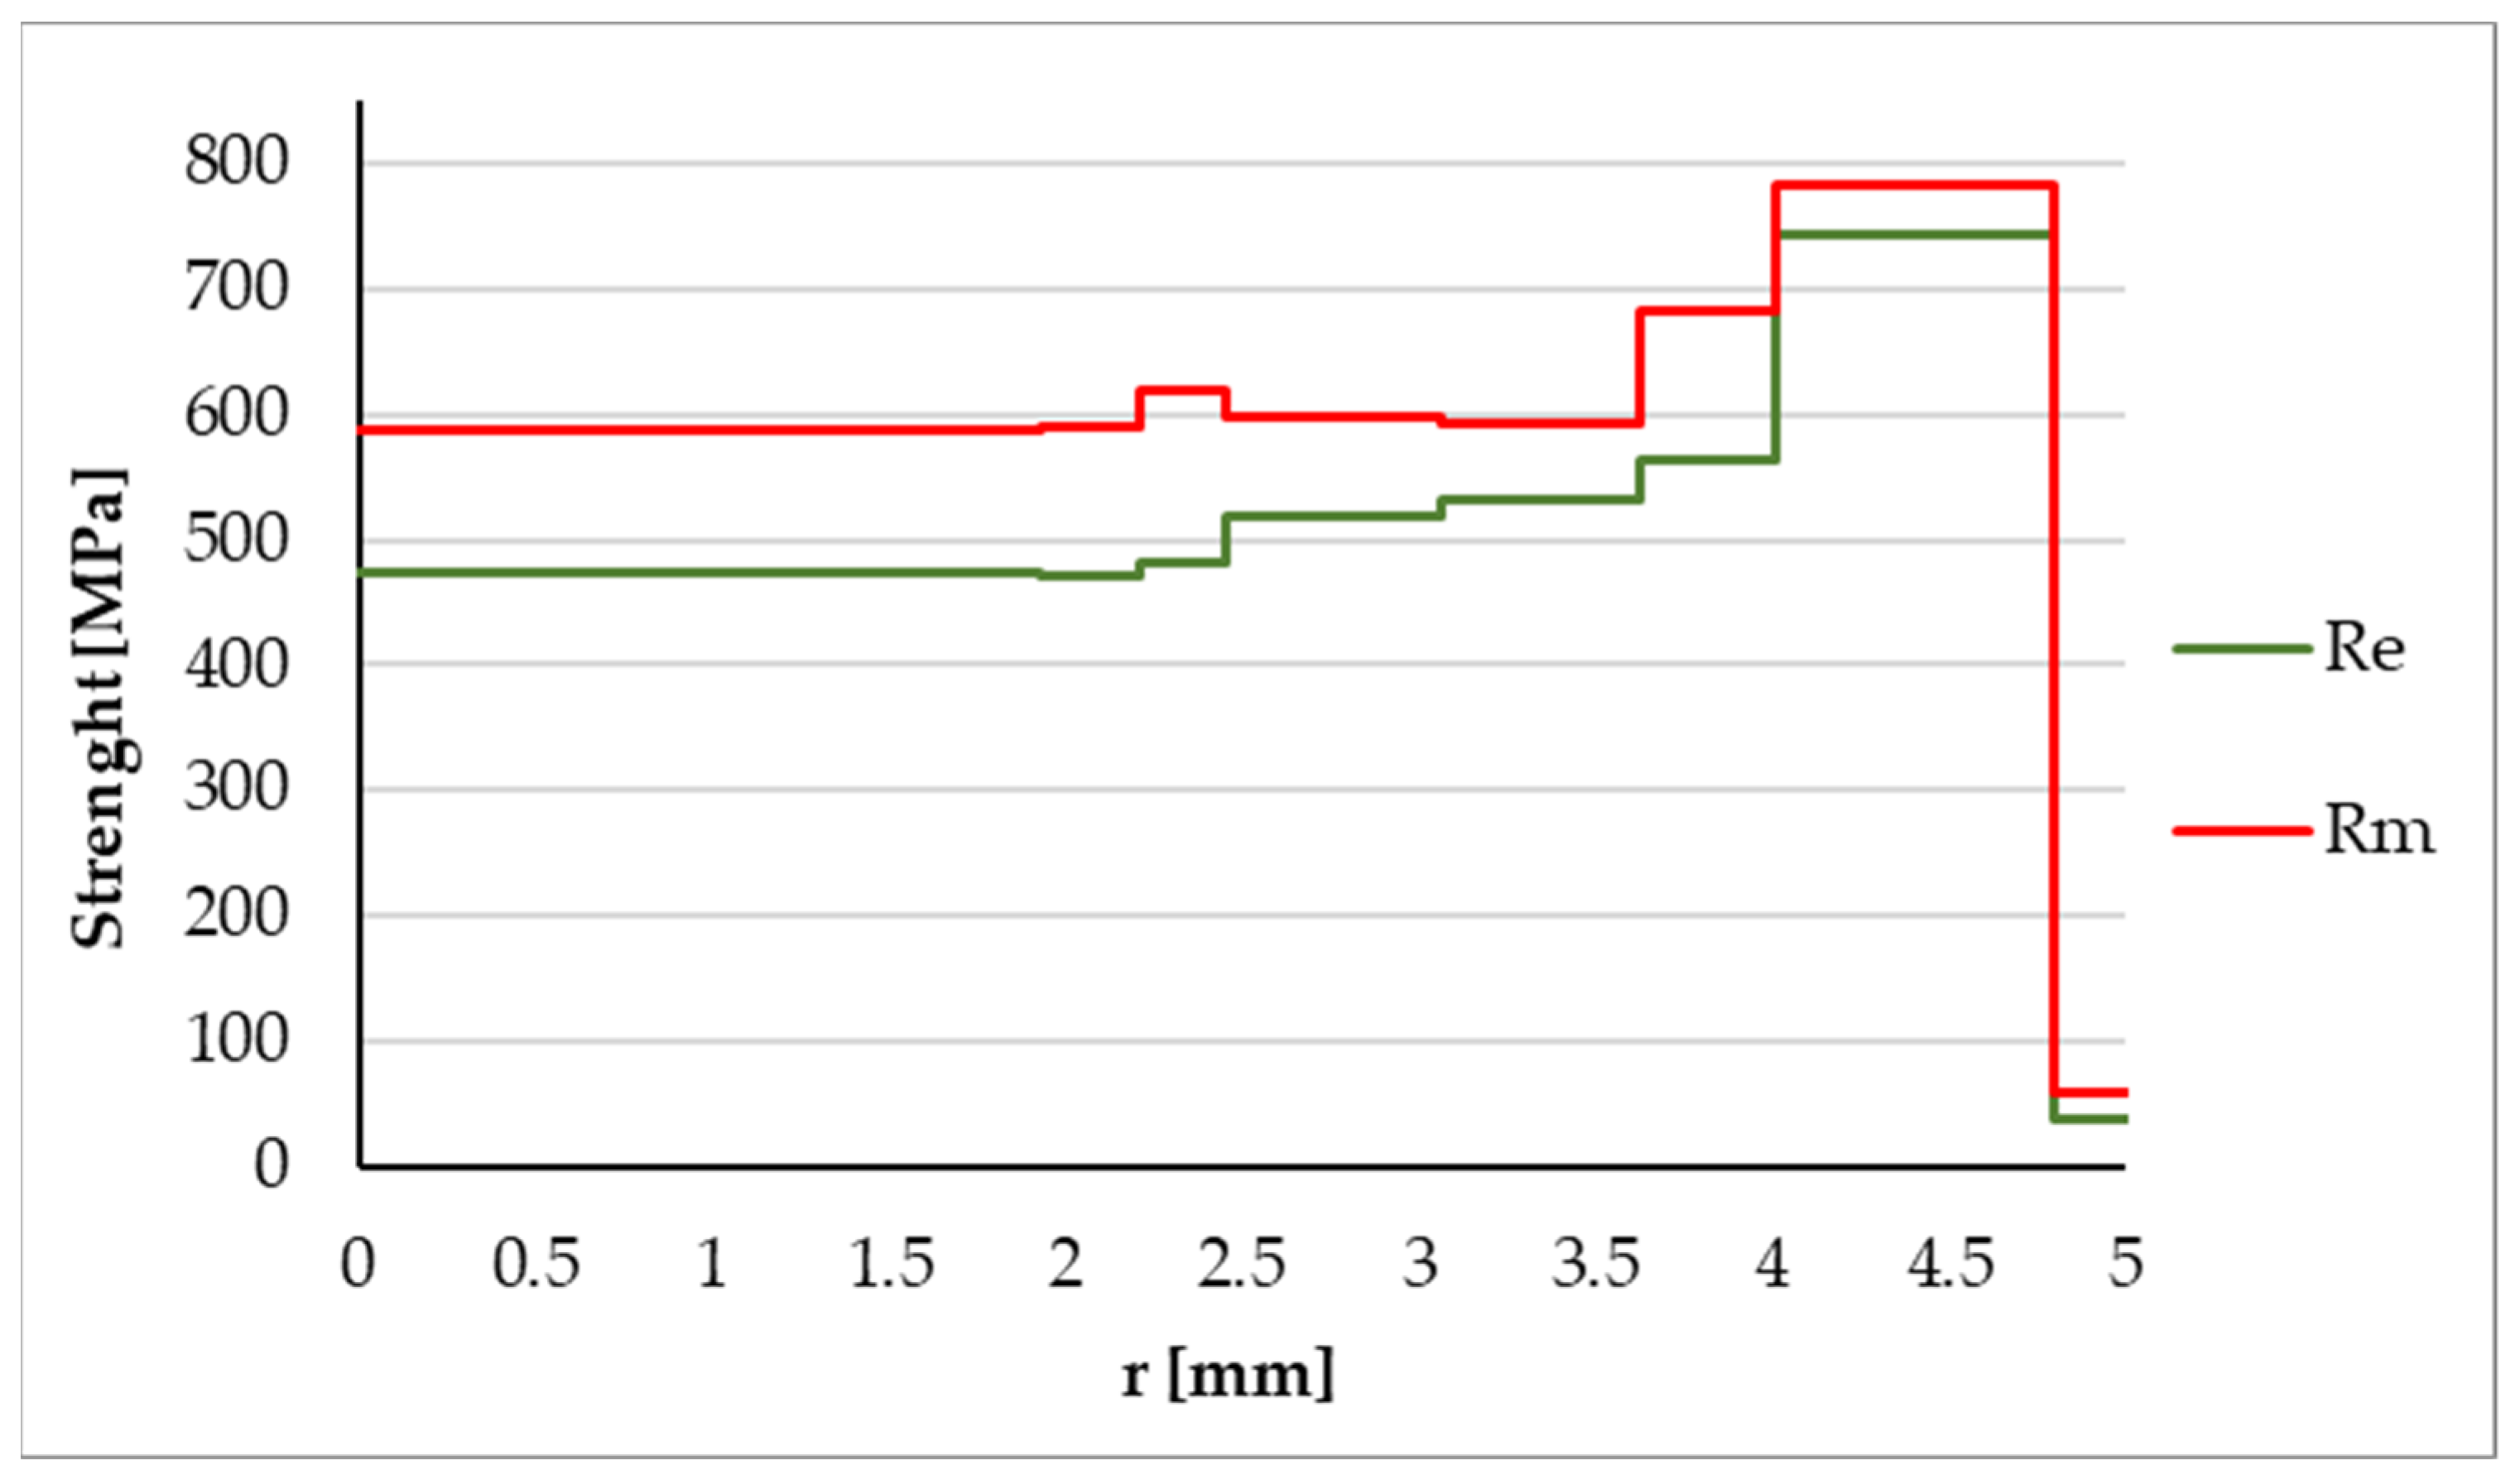
In the case of reinforcement produced by the Tempore method (thermal refinement), it was confirmed that in the core (ferrite-pearlite) there is an area with the lower yield strength and tensile strength, and that the surface layer has high yield strength and tensile strength.
-
Corrosion of the reinforcement in the case of the cold formed reinforcement is not so important for changing the mechanical properties; however, in the case of the thermally refined reinforcement it has a significant effect—corrosion of the reinforcement causes a decrease in the yield strength and tensile strength because it first corrodes the surface layer, which has a higher yield strength and tensile strength.
-
It has been proven that the notches that are developed as a result of corrosion have a significant effect on the spatial tension in the reinforcement at the place of the notch and increases the values of the yield strength and the tensile strength of the reinforcement.
-
If it was necessary to determine the mechanical properties of the reinforcement as accurately as possible, then it is necessary to determine the cross-sectional area of the reinforcement as accurately as possible—it is recommended to take samples of the reinforcement from the structure and standard-treat them (standardly-treated samples) to obtain the exact area of the reinforcement Amin and thus determine as accurately as possible the yield and tensile strength.
-
If it is not possible to take samples (to avoid the failure of reinforced concrete (RC) member), it is necessary to find the places with the smallest diameter ϕmin and determine Amin from it, and if it is reinforcement produced by Tempcore method, it is necessary to reduce the yield strength and the tensile strength to correspond to the core yield strength.
As part of future research in this area, we are planning a more extensive study that would document this effect even at lower levels of corrosion loss on a larger number of diameters and different manufacturers of individual reinforcements. This should also document the influence of the chemical composition of the material and the size of the cross-section within the individual levels of corrosion loss. A more distant goal is to verify this influence not for all-surface corrosion, but for pitting (local) corrosion occurring in the cracks of reinforced concrete elements.

Author Contributions

Conceptualization, P.K. and F.B.; methodology, F.B. and J.P.; validation, P.K., F.B. and J.P.; formal analysis, P.K., F.B., J.P. and A.W.-P.; investigation, F.B.; resources, P.K. and F.B.; data curation F.B. and A.W.-P.; writing—original draft preparation, F.B. and P.K.; writing—review and editing, P.K., F.B., J.P. and A.W.-P.; visualization, F.B.; supervision, P.K. and F.B. All authors have read and agreed to the published version of the manuscript.

Funding

This paper was supported under the project of Operational Programme Integrated Infrastructure: Application of innovative technologies focused on the interaction of engineering constructions of transport infrastructure and the geological environment, ITMS2014+ code 313011BWS1. The project is co-funding by European Regional Development Fund.

Institutional Review Board Statement

Not applicable.

Informed Consent Statement

Not applicable.

Data Availability Statement

Some or all data, and results used during the study are available from the corresponding author by request.

Acknowledgments

We would like to thank the journal experts who edited this paper. We also appreciate the constructive suggestions and comments on the manuscript from the reviewers and editors.

Conflicts of Interest

The authors declare no conflict of interest.

References

  1. Kala, Z. Global sensitivity analysis of reliability of structural bridge system. Eng. Struct. 2019, 194, 36–45. [Google Scholar] [CrossRef]
  2. Benko, V. Reliability of Building Structures (According to Eurocodes), 1st ed.; SKSI: Bratislava, Slovakia, 2010; p. 86. (In Slovak) [Google Scholar]
  3. Kala, Z. Sensitivity Analysis in Probabilistic Structural Design: A Comparison of Selected Techniques. Sustainability 2020, 12, 4788. [Google Scholar] [CrossRef]
  4. Prokop, J.; Vican, J. Comparison of beam-column resistance according to European Standards. Transp. Res. Procedia 2019, 40, 883–890. [Google Scholar] [CrossRef]
  5. Krejsa, M.; Koubova, L.; Flodr, J.; Protivinsky, J.; Nguyen, Q.T. Probabilistic prediction of fatigue damage based on linear fracture mechanics. Frat. Integrita Strutt. 2017, 11, 143–159. [Google Scholar] [CrossRef] [Green Version]
  6. Bobalo, T.; Blikharskyy, Y.; Kopiika, N.; Volynets, M. Serviceability of RC Beams Rein-forced with High Strength Rebar’s and Steel Plate. In Proceedings of Advances in Resource-Saving Technologies and Materials in Civil and Environmental Engineering (CEE 2019); Lecture Notes in Civil Engineering; Springer International Publishing: Berlin/Heidelberg, Germany, 2020; Volume 47, pp. 25–33. [Google Scholar]
  7. Drusa, M.; Mihalik, J.; Muzik, J.; Gago, F.; Stefanik, M.; Rybak, J. The Role of Geotechnical Monitoring at Design of Foundation Structures and their Verification—Part 2. Civ. Environ. Eng. 2021, 17, 681–689. [Google Scholar] [CrossRef]
  8. STN EN 1992-1-1 Eurocode 2; Design of Concrete Structures—Part 1-1: General Rules and Rules for Buildings. Basic Code including the National Annex and All Corrigendum. SUTN: Bratislava, Slovakia, 2015.
  9. STN EN 1992-2 Eurocode 2; Design of Concrete Structures. Concrete Bridges. Design and Detailing Rules. Basic Code Including the National Annex and All Corrigendum. SUTN: Bratislava, Slovakia, 2007.
  10. STN EN 1997-1 Eurocode 7; Geotechnical Design. Part 1: General Rules. Basic Code Including the National Annex and All Corrigendum. SUTN: Bratislava, Slovakia, 2005.
  11. Koteš, P.; Vičan, J. Recommended reliability levels for the evaluation of existing bridges according to Eurocodes. Struct. Eng. Int. 2013, 23, 411–417. [Google Scholar] [CrossRef]
  12. Koteš, P.; Vičan, J. Reliability levels for existing bridges evaluation according to Eurocodes. In Proceedings of the Conference Steel Structures and Bridges 2012, 23rd Czech and Slovak International Conference, Podbanské, Slovakia, 26–28 September 2012; pp. 211–216. [Google Scholar]
  13. Koteš, P.; Vičan, J. Reliability-based evaluation of existing concrete bridges in Slovakia according to Eurocodes. In Proceedings of the Fourth International Fib Congress 2014, Mumbai, “Improving Performance of Concrete Structures”, Mumbai, India, 10–14 February 2014; pp. 227–229. [Google Scholar]
  14. Moravčík, M.; Kraľovanec, J. Determination of Prestress Losses in Existing Pre-Tensioned Structures Using Bayesian Approach. Materials 2022, 15, 3548. [Google Scholar] [CrossRef] [PubMed]
  15. Koteš, P.; Vavruš, M.; Moravčík, M. Diagnostics and Evaluation of Bridge Structures on Cogwheel Railway. In Proceedings of the 1st Conference of the European Association on Quality Control of Bridges and Structures, EUROSTRUCT 2021, Lecture Notes in Civil Engineering, Padua, Italy, 29 August–1 September 2021; Volume 200, pp. 93–101. [Google Scholar]
  16. Odrobiňák, J.; Hlinka, R. Degradation of Steel Footbridges with Neglected Inspection and Maintenance. Procedia Eng. 2016, 156, 304–311. [Google Scholar] [CrossRef] [Green Version]
  17. Odrobiňák, J.; Gocál, J.; Jošt, J. NSS test of structural steel corrosion. Rocz. Inżynierii Bud. 2017, 15, 7–14. [Google Scholar]
  18. Bujnakova, P.; Kralovanec, J.; Perkowski, Z.; Bouchair, A. Verification of Precast Concrete Girder Bridge Under Static Load. Civ. Environ. Eng. 2022, 18, 760–767. [Google Scholar] [CrossRef]
  19. Moravcik, M.; Dreveny, I. Strengthening and verification of the prestressed road bridge using external prestressing. In Proceedings of the 2nd International Conference on Concrete Repair, Rehabilitation and Retrofitting “Concrete Repair, Rehabilitation and Retrofitting II”, Cape Town, South Africa, 24–26 November 2008; pp. 385–386. [Google Scholar] [CrossRef]
  20. STN ISO 13822 (73 0038); Bases for Design of Structures. Assessment of Existing Structures. SUTN: Bratislava, Slovakia, 2012.
  21. Bacharz, K.; Raczkiewicz, W.; Bacharz, M.; Grzmil, W. Manufacturing Errors of Concrete Cover as a Reason of Reinforcement Corrosion in a Precast Element—Case Study. Coatings 2019, 9, 702. [Google Scholar] [CrossRef] [Green Version]
  22. Blikharskyy, Y.; Selejdak, J.; Kopiika, N. Specifics of corrosion processes in thermally strengthened rebar. Case Stud. Constr. Mater. 2021, 15, e00646. [Google Scholar] [CrossRef]
  23. Blikharskyy, Y.; Selejdak, J.; Kopiika, N. Corrosion Fatigue Damages of Rebars under Loading in Time. Materials 2021, 14, 3416. [Google Scholar] [CrossRef] [PubMed]
  24. STN EN 10080; Steel for the Reinforcement of Concrete. Weldable Reinforcing Steel. General. SUTN: Bratislava, Slovakia, 2006.
  25. Procházka, J.; Šmejkal, J. Reinforcing Steel. Manufacturing and Joining Trends; ČVUT: Prague, Czech Republic, 2008; 151p. (In Czech) [Google Scholar]
  26. Bažant, B.; Beranova, V.; Hutař, J.; Nekolný, Z.; Novák, M. Reinforced Concrete Structures and New Reinforcing Materials (Progressive Reinforcing Materials and Mechanical Properties of the Basic Materials of Reinforced Concrete Structures); SNTL: Prague, Czech Republic, 1979; 254p. (In Czech) [Google Scholar]
  27. Technical Provision TP 193: Welded Reinforcement and Other Types of Joints (Svarovaní betonárske výstuže a jiné typy spojú); Mott MacDonald: Prague, Czech Republic, 2008; 132p. (In Czech)
  28. Majdi, Y.; Hsu, C.-T.T.; Punurai, S. Local bond–slip behavior between cold-formed metal and concrete. Eng. Struct. 2014, 69, 271–284. [Google Scholar] [CrossRef]
  29. Kim, S.-H.; Choi, S.-M. Compressive behavior of H-shaped brace strengthened with non-welded cold-formed element. J. Constr. Steel Res. 2015, 112, 30–39. [Google Scholar] [CrossRef]
  30. Taheri, E.; Fard, S.E.; Zandi, Y.; Samali, B. Experimental and Numerical Investigation of an Innovative Method for Strengthening Cold-Formed Steel Profiles in Bending throughout Finite Element Modeling and Application of Neural Network Based on Feature Selection Method. Appl. Sci. 2021, 11, 5242. [Google Scholar] [CrossRef]
  31. Zheng, H.; Abel, A. Elasto-plastic transition in TEMPCORE reinforcing steel. In Proceedings of the 4th International Conference on Low Cycle Fatigue and elasto-Plastic Behaviour of Materials, Garmisch-Partenkirchen, Germany, 7–11 September 1998; pp. 373–378. [Google Scholar]
  32. Santos, J.; Henriques, A.A. Strength and Ductility of Damaged Tempcore Rebars. In Proceedings of the 1st International Conference on Structural Integrity, ICSI 2015, Procedia Engineering, Funchal, Portugal, 1–4 September 2015; Volume 114, pp. 800–807. [Google Scholar]
  33. Park, C.S.; Van Tyne, C.J.; Lee, S.-J.; Lee, T.; Kim, J.H.; Moon, Y.H. Prediction of Tempcore Rebar Strength Using a Thermomechanical Simulator with a Designed Hollow Specimen. Steel Res. Int. 2019, 91, 1900520. [Google Scholar] [CrossRef]
  34. Kopiika, N.; Selejdak, J.; Blikharskyy, Y. Specifics of physico-mechanical characteristics of thermally-hardened rebar. Prod. Eng. Arch. 2022, 28, 73–81. [Google Scholar] [CrossRef]
  35. Hortigon, B.; Ancio, F.; Nieto-Garcia, E.J.; Herrera, M.A.; Gallardo, J.M. Influence of rebar design on mechanical behaviour of Tempcore steel. Procedia Struct. Integr. 2018, 13, 601–606. [Google Scholar] [CrossRef]
  36. Rehm, G.; Russwurm, D. Assessment of Concrete Reinforcing Bars Made by the Tempcore Process of Concrete; CRM Revue: Liège, Belgium, 1977; pp. 1–16. [Google Scholar]
  37. Noville, J.F. TEMPCORE, the most convenient process to produce low cost high strength rebars form 8 to 75 mm. In Proceedings of the METEC and 2nd European Steel Technology and Application Days (ESTAD), Dusseldorf, Germany, 15–19 June 2015; Available online: https://www.crmgroup.be/sites/default/files/downloads/2018-10/tempcore_the_most_convenient_process_metec-2015_2.pdf (accessed on 19 June 2015).
  38. Palček, P.; Hadzima, B.; Chalupová, M. Material Characteristics; EDIS ŽU: Žilina, Slovakia, 2004; 163p. [Google Scholar]
  39. Hawileh, R.A.; Abdalla, J.A.; Al Tamimi, A.; Abdelrahman, K.; Oudah, F. Behavior of Corroded Steel Reinforcing Bars Under Monotonic and Cyclic Loadings. Mech. Adv. Mater. Struct. 2011, 18, 218–224. [Google Scholar] [CrossRef]
  40. Zhang, W.; Song, X.; Gu, X.; Li, S. Tensile and fatigue behavior of corroded rebars. Constr. Build. Mater. 2012, 34, 409–417. [Google Scholar] [CrossRef]
  41. Oyado, M.; Kanakubo, T.; Sato, T.; Yamamoto, Y. Bending performance of reinforced concrete member deteriorated by corrosion. Struct. Infrastruct. Eng. 2011, 7, 121–130. [Google Scholar] [CrossRef]
  42. Andisheh, K.; Scott, A.; Palermo, A. Seismic Behavior of Corroded RC Bridges: Review and Research Gaps. Int. J. Corros. 2016, 2016, 3075184. [Google Scholar] [CrossRef] [Green Version]
  43. Andisheh, K.; Scott, A.; Palermo, A.; Clusas, D. Influence of chloride corrosion on the effective mechanical properties of steel reinforcement. Struct. Infrastruct. Eng. 2019, 15, 1036–1048. [Google Scholar] [CrossRef]
  44. Proske, D.; Sykora, M.; Gutermann, M. Correction of failure probability of bridges based on experimental load tests. Bautechnik 2020, 98, 80. [Google Scholar] [CrossRef]
  45. Proske, D.; Hostettler, S.; Friedl, H. Correction Factors for Collapse Probability of Bridges. Beton Stahlbetonbau 2020, 115, 128–135. [Google Scholar] [CrossRef]
  46. Hofmann, C.; Proske, D.; Zeck, K. Comparison of collapse frequency and failure probability of retaining structures. Bautechnik 2020, 98, 475. [Google Scholar] [CrossRef]
  47. Proske, D. Bridge Collapse Frequencies versus Failure Probabilities; Springer: Cham, Switzerland, 2018. [Google Scholar] [CrossRef]
  48. Kraľovanec, J.; Moravčík, M.; Bujňáková, P.; Jošt, J. Indirect Determination of Residual Prestressing Force in Post-Tensioned Concrete Beam. Materials 2021, 14, 1338. [Google Scholar] [CrossRef]
  49. Val, D.V. Deterioration of Strength of RC Beams due to Corrosion and Its Influence on Beam Reliability. J. Struct. Eng. 2007, 133, 1297–1306. [Google Scholar] [CrossRef]
  50. Koteš, P.; Strieška, M.; Bahleda, F.; Bujňáková, P. Prediction of RC Bridge Member Resistance Decreasing in Time under Various Conditions in Slovakia. Materials 2020, 13, 1125. [Google Scholar] [CrossRef] [Green Version]
  51. Koteš, P.; Vičan, J. Influence of reinforcement corrosion on moment and shear resistance in time of RC bridge girder. In Proceedings of the Conference IABMAS 2016 “Maintenance, Monitoring, Safety, Risk and Resilience of Bridges and Bridge Networks”, Paraná, Brazil, 26–30 June 2016; pp. 484–491. [Google Scholar]
  52. François, R.; Khan, I.; Dang, V.H. Impact of corrosion on mechanical properties of steel embedded in 27-year-old corroded reinforced concrete beams. Mater. Struct. 2013, 46, 899–910. [Google Scholar] [CrossRef]
  53. Noh, H.M.; Sonoda, Y. Potential Effects of Corrosion Damage on the Performance of Reinforced Concrete Member. In Proceedings of the 3rd International Conference on Civil and Environmental Engineering for Sustainability (IConCEES 2015), MATEC Web of Conferences, Melaka, Malaysia, 1–2 December 2015; Volume 47, p. 02007. [Google Scholar] [CrossRef] [Green Version]
  54. Li, Q.; Dong, Z.; He, Q.; Fu, C.; Jin, X. Effects of Reinforcement Corrosion and Sustained Load on Mechanical Behavior of Reinforced Concrete Columns. Materials 2022, 15, 3590. [Google Scholar] [CrossRef]
  55. Syll, A.S.; Kanakubo, T. Impact of Corrosion on the Bond Strength between Concrete and Rebar: A Systematic Review. Materials 2022, 15, 7016. [Google Scholar] [CrossRef] [PubMed]
  56. Ouglova, A.; Berthaud, Y.; Foct, F.; François, M.; Ragueneau, F.; Petre-Lazar, I. The influence of corrosion on bond properties between concrete and reinforcement in concrete structures. Mater. Struct. 2007, 41, 969–980. [Google Scholar] [CrossRef]
  57. Batis, G.; Rakanta, E. Corrosion of steel reinforcement due to atmospheric pollution. Cem. Concr. Compos. 2005, 27, 269–275. [Google Scholar] [CrossRef]
  58. Kearsley, E.P.; Joyce, A. Effect of corrosion products on bond strength and flexural behaviour of reinforced concrete slabs. J. S. Afr. Inst. Civ. Eng. 2014, 56, 21–29. [Google Scholar]
  59. Pishro, A.A.; Feng, X.; Ping, Y.; Dengshi, H.; Shirazinejad, R.S. Comprehensive equation of local bond stress between UHPC and reinforcing steel bars. Constr. Build. Mater. 2020, 262, 119942. [Google Scholar] [CrossRef]
  60. Pishro, A.A.; Zhang, Z.; Pishro, M.A.; Xiong, F.; Zhang, L.; Yang, Q.; Matlan, S.J. UHPC-PINN-parallel micro element system for the local bond stress–slip model subjected to monotonic loading. Structures 2022, 46, 570–597. [Google Scholar] [CrossRef]
  61. Martínez, C.; Briones, F.; Villarroel, M.; Vera, R. Effect of Atmospheric Corrosion on the Mechanical Properties of SAE 1020 Structural Steel. Materials 2018, 11, 591. [Google Scholar] [CrossRef] [Green Version]
  62. Tsonev, V.; Nikolov, N.; Penkov, K. Impact of atmospheric corrosion on the mechanical properties of B235 steel rods. IOP Conf. Ser. Mater. Sci. Eng. 2020, 878, 012064. [Google Scholar] [CrossRef]
  63. Apostolopoulos, C.; Papadopoulos, M.; Pantelakis, S. Tensile behavior of corroded reinforcing steel bars BSt 500s. Constr. Build. Mater. 2006, 20, 782–789. [Google Scholar] [CrossRef]
  64. Allam, I.M.; Maslehuddin, M.; Saricimen, H.; Al-Mana, A.I. Influence of atmospheric corrosion on the mechanical properties of reinforcing steel. Constr. Build. Mater. 1994, 8, 35–41. [Google Scholar] [CrossRef]
  65. Zhu, W.; François, R.; Poon, C.S.; Dai, J.-G. Influences of corrosion degree and corrosion morphology on the ductility of steel reinforcement. Constr. Build. Mater. 2017, 148, 297–306. [Google Scholar] [CrossRef]
  66. Imperatore, S. Mechanical Properties Decay of Corroded Reinforcement in Concrete—An Overview. Corros. Mater. Degrad. 2022, 3, 210–220. [Google Scholar] [CrossRef]
  67. Cairns, J.; Plizzari, G.A.; Du, Y.; Law, D.W.; Franzoni, C. Mechanical Properties of Corrosion-Damaged Reinforcement. ACI Mater. J. 2005, 102, 256–264. [Google Scholar]
  68. Ghafur, H.A. Influence of time-dependent corrosion on strength and ductility of reinforcing steel bars exposed to natural and aggressive environments. Polytech. J. 2022, 15, 40–54. [Google Scholar]
  69. Balestra, C.E.T.; Lima, M.G.; Mendes, A.Z.; Medeiros-Junior, R.A. Effect of corrosion degree on mechanical properties of reinforcements buried for 60 years. Rev. IBRACON Estrut. Mater. 2018, 11, 474–498. [Google Scholar] [CrossRef]
  70. Wang, H.L.; Sun, X.Y.; Kong, H.T. Effect of Corrosion and Corrosion rate on the Mechanical Performance of Carbon and Stainless Steel Reinforcing Bars. In Proceedings of the Sixth International Conference on Durability of Concrete Structures, Leeds, UK, 18–20 July 2018. [Google Scholar]
  71. Kashani, M.M.; Crewe, A.J.; Alexander, N.A. Stress-Strain Response of Corroded Reinforcing Bars under Monotonic and Cyclic Loading. In Proceedings of the 15th World Conference on Earthquake Engineering 2012 (15WCEE), Lisbon, Portugal, 24–28 September 2012; pp. 3315–3323. [Google Scholar]
  72. Chen, H.; Zhang, J.; Yang, J.; Ye, F. Experimental Investigation into Corrosion Effect on Mechanical Properties of High Strength Steel Bars under Dynamic Loadings. Int. J. Corros. 2018, 2018, 7169681. [Google Scholar] [CrossRef] [Green Version]
  73. Fernandez, I.; Bairán, J.M.; Marí, A.R. Corrosion effects on the mechanical properties of reinforcing steel bars. Fatigue and σ–ε behavior. Constr. Build. Mater. 2015, 101, 772–783. [Google Scholar] [CrossRef]
  74. Fernandez, I.; Bairán, J.M.; Marí, A.R. Mechanical model to evaluate steel reinforcement corrosion effects on σ–ε and fatigue curves. Experimental calibration and validation. Eng. Struct. 2016, 118, 320–333. [Google Scholar] [CrossRef] [Green Version]
  75. Bahleda, F.; Pastorek, F.; Jančula, M. Effect of corrosion on mechanical properties of reinforcement and corrosion rate. In Concrete Days 2018; STU Bratislava: Bratislava, Slovakia, 2018; pp. 301–306. [Google Scholar]
  76. STN EN ISO 6507-1 (42 0374); Metallic materials—Vickers Hardness Test—Part 1: Test Method. SUTN: Bratislava, Slovakia, 2018.
  77. STN EN ISO 6892-1; Metallic Materials. Tensile Testing. Part 1: Method of Test at Room Temperature. SUTN: Bratislava, Slovakia, 2015.
  78. STN EN ISO 15630-1; Steel for the Reinforcement and Prestressing of Concrete—Test Methods—Part 1: Reinforcing Bars, Rods and Wire (ISO 15630-1:2019). SUTN: Bratislava, Slovakia, 2019.
  79. Bahleda, F.; Bujňáková, P.; Koteš, P.; Hasajová, L.; Nový, F. Mechanical Properties of Cast-in Anchor Bolts Manufactured of Reinforcing Tempcore Steel. Materials 2019, 12, 2075. [Google Scholar] [CrossRef] [PubMed] [Green Version]
Figure 1. The principle of the Tempcore process.
Buildings 13 00855 g001
Figure 2. The cross-section of reinforcement ϕ6 (B500 B).
Buildings 13 00855 g002
Figure 3. Hardness distribution along the cross-section of the reinforcement ϕ6 (B500 B).
Buildings 13 00855 g003
Figure 4. Ratios of the minimum Amin, nominal cross-sectional area A0 and the “average” area determined based on the weight loss Ag—ϕ6 (B500 B).
Buildings 13 00855 g004
Figure 5. The sample ϕ6 (B500 B) after corrosion in corrosion chamber: (a) whole sample, (b) detail.
Buildings 13 00855 g005
Figure 6. Dependence of the force Fm on the tensile strength Rm related to the relevant area of the cross-section ϕ6 (to minimum area Amin and to the area determined from the weight loss Ag).
Buildings 13 00855 g006
Figure 7. Dependence of the force Fe on the yield strength Re related to the relevant area of the cross-section ϕ6 (to minimum area Amin and to the area determined from the weight loss Ag).
Buildings 13 00855 g007
Figure 8. Dependence of the tensile strength ratio of the corroded to non-corroded samples (Rm,g/ft) and (Rm,min/ft) on the relevant loss of cross-sectional area of reinforcement ϕ6 ((1 − Ag/A0) or (1 − Amin/A0)).
Buildings 13 00855 g008
Figure 9. Dependence of the yield strength ratio of the corroded to non-corroded samples (Re,g/fy) and (Re,min/fy) on the relevant loss of cross-sectional area of reinforcement ϕ6 ((1 − Ag/A0) or (1 − Amin/A0)).
Buildings 13 00855 g009
Figure 10. Dependence of the forces Fe and Fm on the yield strength Re and the tensile strength Rm related to the area As (standardly-treated samples).
Buildings 13 00855 g010
Figure 11. The cross-section of reinforcement ϕ10 (B500 B).
Buildings 13 00855 g011
Figure 12. Hardness distribution along the cross-section of the reinforcement ϕ10.
Buildings 13 00855 g012
Figure 13. Yield strength and tensile strength of concrete reinforcement ϕ10—individual layers.
Buildings 13 00855 g013
Figure 14. Ratios of the minimum Amin, nominal cross-sectional area A0 and the “average” area determined based on the weight loss Ag—ϕ10.
Buildings 13 00855 g014
Figure 15. Dependence of the force on the tensile strength Fm related to the relevant area of the cross-section ϕ10 (to minimum area Amin and to the area determined from the weight loss Ag).
Buildings 13 00855 g015
Figure 16. Dependence of the force on the yield strength Fe related to the relevant area of the cross-section ϕ10 (to minimum area Amin and to the area determined from the weight loss Ag).
Buildings 13 00855 g016
Figure 17. Dependence of the tensile strength ratio of the corroded to non-corroded samples (Rm,g/ft) and (Rm,min/ft) on the relevant loss of cross-sectional area of reinforcement ϕ10 ((1 − Ag/A0) or (1 − Amin/A0)).
Buildings 13 00855 g017
Figure 18. Dependence of the yield strength ratio of the corroded to non-corroded sample (Re,g/ft) and (Re,min/ft) on the relevant loss of cross-sectional area of reinforcement ϕ10 ((1 − Ag/A0) or (1 − Amin/A0)).
Buildings 13 00855 g018
Figure 19. Dependence of the tensile strength ratio of the corroded (Rm,g/ft) and non-corroded sample (Rm,min/ft) on the relevant loss of cross-sectional area of reinforcement ((1 − Ag/A0) or (1 − Amin/A0))—comparison ϕ6 and ϕ10.
Buildings 13 00855 g019
Figure 20. Dependence of the yield strength ratio of the corroded (Re,g/ft) and non-corroded sample (Re,min/ft) on the relevant loss of cross-sectional area of reinforcement ((1 − Ag/A0) or (1 − Amin/A0))—comparison ϕ6 and ϕ10.
Buildings 13 00855 g020
Figure 21. Dependence of stresses and deformations due to different depth of notch—reinforcement ϕ10 B500 B.
Buildings 13 00855 g021
Figure 22. Dependence of stresses and deformations due to different notch depths—reinforcement ϕ12 mm of steel S355.
Buildings 13 00855 g022
Figure 23. Dependence of the maximum force Fmax at failure and the corresponding cross-sectional area (core at the point of failure).
Buildings 13 00855 g023
Table 1. Comparison of the quantities used in STN EN 10080 to those used in EN 1992-1-1.
CharacteristicsSTN EN 10080 [24]STN EN 1992-1-1 [8]
Yield strengthRefyk
0.2% proof strengthRp0.2fp0.2k
Tensile strengthRmft
Ratio of tensile strength to yield strengthRm/Reft/fy
Percentage elongation at maximum forceAgtεu
Nominal diameterdϕ
Table 2. The relative weight loss α, the force at yield strength Fe and the force at tensile strength Fm of cold-formed corroded reinforcement ϕ6.
ϕ6
n.
m0—Weight before Corrosion [g]mcorr—Weight after Corrosion [g]—After 62 Daysmcorr—Weight after Corrosion [g]—After 233 DaysαFe
[kN]
Fm
[kN]
164.8641.09 0.3669.79710.30
263.3041.43 0.34510.14910.43
360.8042.66 0.29810.37310.75
461.6539.46 0.3607.5427.57
561.5937.71 0.3889.2679.61
662.0741.69 0.3289.5249.59
760.1840.47 0.3289.0789.19
859.4536.91 0.3797.4687.47
956.5039.56 0.3008.8298.94
1057.6740.15 0.3049.0739.42
1156.9539.81 0.3018.8578.86
1255.4837.92 0.3179.4029.64
1353.0038.02 0.2837.6277.64
1453.7838.74 0.2809.5159.65
1553.1639.75 0.2529.1979.37
1653.5538.27 0.2858.6988.89
1763.98 22.940.6413.8883.90
1865.04 30.180.5365.0995.18
1964.98 21.510.6692.5862.59
2064.36 24.800.6153.9653.96
2164.20 22.740.6463.3053.35
2264.14 23.600.6324.0194.03
Table 3. The relative weight loss α, the force at yield strength Fe and the force at tensile strength Fm of the hot rolled with thermal refinement corroded reinforcement ϕ10.
ϕ10
n.
m0—Weight before Corrosion [g]mcorr—Weight after Corrosion [g]—After 62 Daysmcorr—Weight after Corrosion [g]—After 233 Daysmcorr—Weight after Corrosion [g]—After 296 DaysαFe
[kN]
Fm
[kN]
1185.63 84.230.54615.0416.65
2185.86 86.710.53315.5717.20
3183.60144.06 0.21528.9933.74
4184.98151.12 0.18330.9436.25
5182.01150.46 0.17329.9135.63
6182.40148.62 0.18529.9835.83
7180.22151.89 0.15729.1134.81
8175.41150.42 0.14229.7335.01
9172.36148.10 0.14129.2735.13
10172.25147.37 0.14428.4434.2
11167.83146.41 0.12828.8434.67
12188.08 122.62 0.34823.3828.63
13187.74 116.51 0.37924.7729.63
14186.90 118.26 0.36719.9624.22
15185.65 116.47 0.37321.5326.52
16185.34 119.09 0.35720.7625.21
17187.44 122.04 0.34923.2127.07
18190.17 126.67 0.33423.5229.04
19185.95 120.55 0.35223.5628.38
Disclaimer/Publisher’s Note: The statements, opinions and data contained in all publications are solely those of the individual author(s) and contributor(s) and not of MDPI and/or the editor(s). MDPI and/or the editor(s) disclaim responsibility for any injury to people or property resulting from any ideas, methods, instructions or products referred to in the content.

