Article

Seismic Performance of Concrete Column Connection with Square-Upper-Circular-Lower Steel Tube for Antique Buildings

School of Civil Engineering, Chang’an University, Xi’an 710061, China
*
Author to whom correspondence should be addressed.
Buildings 2023, 13(4), 916; https://doi.org/10.3390/buildings13040916
Submission received: 9 March 2023 / Revised: 26 March 2023 / Accepted: 26 March 2023 / Published: 30 March 2023
(This article belongs to the Special Issue Advanced Research and Prospect of Buildings Seismic Performance)

Abstract

:
The antique building combines traditional design with contemporary technology, making it an important structural style. Columns, as a crucial structural component, directly affect how well the building functions as a whole. This paper proposes a new connection form with the upper square concrete-filled steel tube-lower circular concrete-filled steel tube (USCFST-LCCFST). This study investigates the seismic performance of the proposed connection form of the columns. First, the finite element software ABAQUS-2021 is used to simulate and analyze the connection forms of the upper square concrete-filled steel tube and lower circular reinforced concrete (USCFST-LCRC) and the upper square steel reinforced concrete and lower circular reinforced concrete (USSRC-LCRC) above the antique building, respectively, which confirms the rationality of the modeling method explored in this paper. Then, geometric modeling of the USCFST-LCCFST connection is performed using ABAQUS. Simulation results demonstrate the superior seismic performance of the proposed connection form. In addition, the influence law of steel tube yield strength and the ratio of upper and lower column linear stiffness on its seismic performance are analyzed and determined through the variational parameter analysis of the USCFST-LCCFST connection form. The steel tube yield strength of USCFST-LCCFST column connection components is recommended to be 355–420 MPa and the ratio of upper and lower column linear stiffness should be no less than 0.063. In order to ensure the good seismic performance of the connection, the steel tube yield strength and the ratio of upper and lower column stiffness should be efficiently controlled in the design of antique buildings’ USCFST-LCCFST column connection components.

1. Introduction

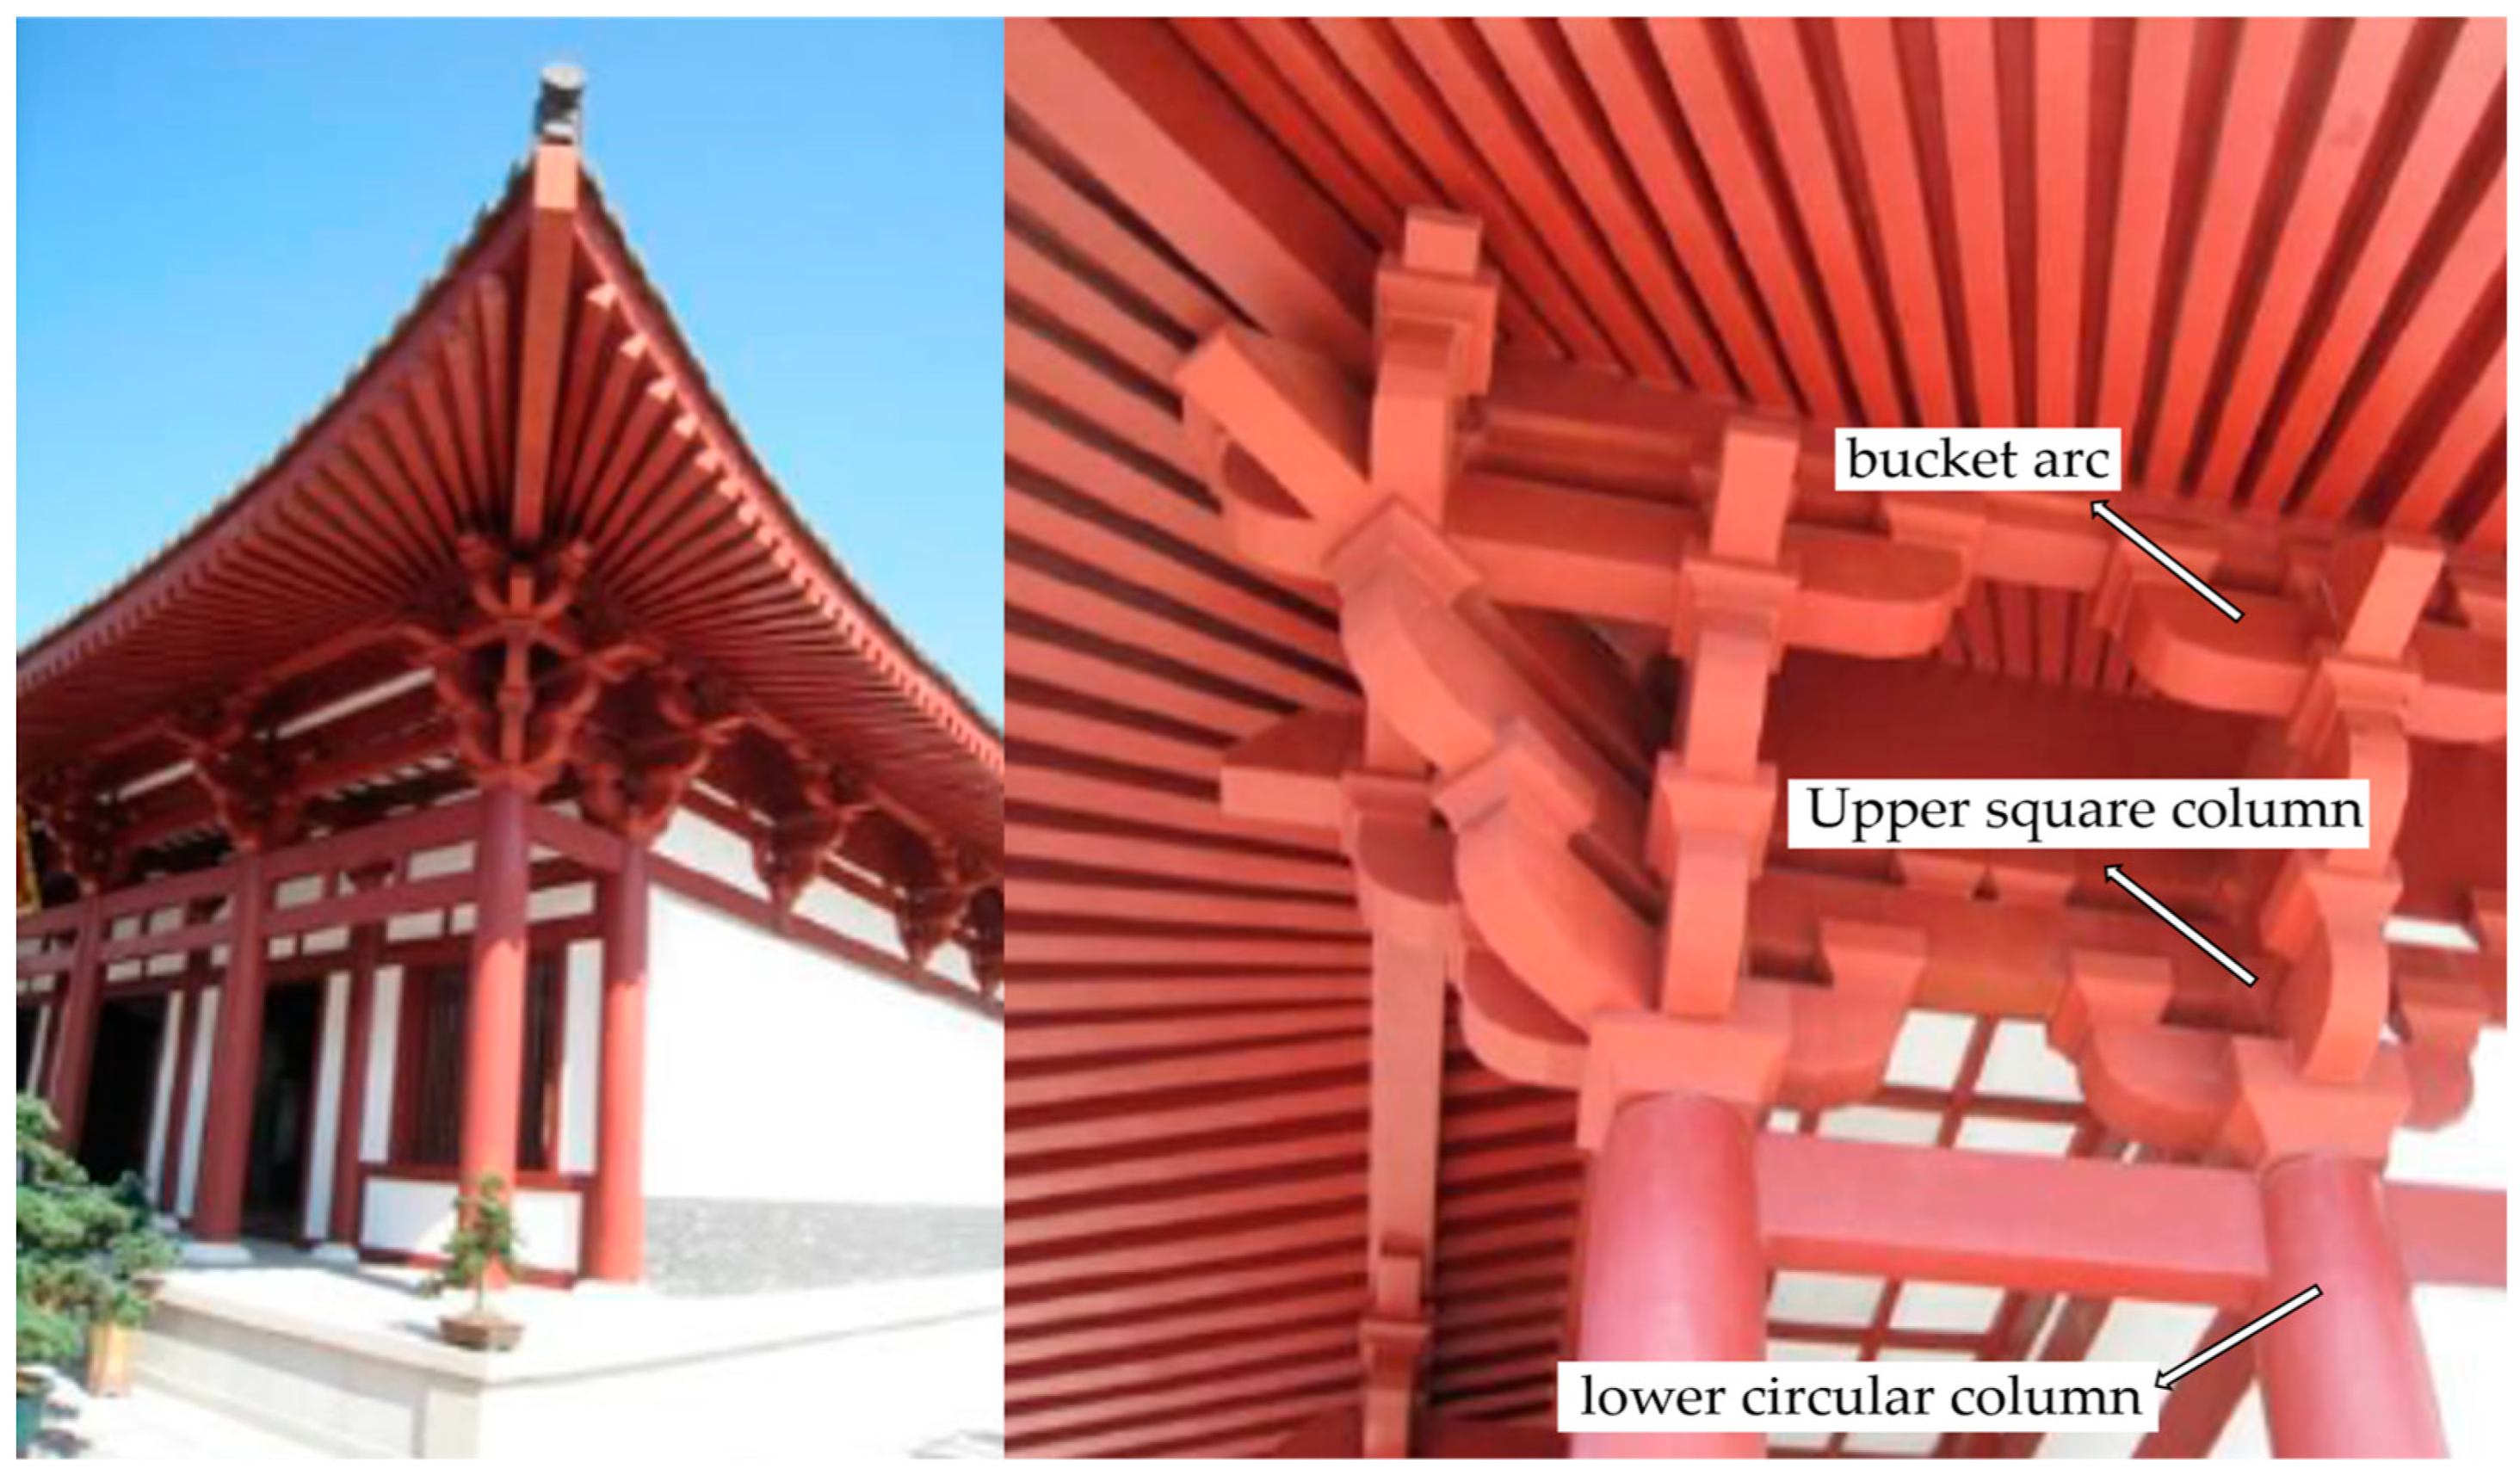
Antique architecture has drawn a lot of interest in the academic field of civil engineering because it is a type of building that flawlessly combines traditional style and modern technology [1]. Since the structural stress characteristics of the antique building differ from those of the actual ancient building, using regulations of modern buildings to design the antique building may cause more serious consequences, as demonstrated by the 921 Taiwanese Earthquake, which destroyed Wuchang Palace [2]. The modern recreation of ancient structures in the shape and form of conventional structures to mirror the force system is very dissimilar from the original ancient structures. In conventional architecture, the bucket arch serves as both a decorative element and a component that transmits force [3]. However, for easier construction, in the imitation of ancient buildings, the bucket arch and other components are mostly used for decorative purposes, and lightweight materials are adopted for the bucket arch. The section of the columns of an antique building should be circular, and decorative bucket arch should be placed on the top of the circular column, as shown in Figure 1. The eaves column, a crucial component of ancient buildings, is typically made of wood, while steel or reinforced concrete are primarily used in the imitation of ancient buildings for easier construction. The columns are designed as cylindrical columns, which are typically extended upward and welded together with decorative bucket arches in order to mimic the shape of ancient buildings. The columns that are extended upward are gathered into rectangular shrunken columns, whose stiffness and cross-sectional dimensions are altered, in order to ensure the convenience of installation of bucket arches.
Many researchers today have studied the architecture of historic buildings in depth. Yu et al. [4] built a hybrid building flow field mesh model using CFD to numerically simulate the station house of Lijiang Railway Station, an antique steel structure in a typical ethnic style. The results demonstrate that the finite element simulation results are in good agreement with the specifications. With the help of Midas for structural design, SAP2000 for comparative verification, and ABAQUS for important node analysis, Wang et al. [5] completed the structural design of the display building of Luoyang Sui and Tang City paradise site conservation and confirmed that the results of the finite element software simulation were accurate. Through the use of ABAQUS numerical simulation, Xue et al. [6] proposed the connection form of upper square concrete-filled steel tube-lower circle reinforced concrete (USCFST-LCRC) for the historic building. The result showed that the damage to the connection between the lower column and the upper column is primarily bending damage, and that the plastic hinge is formed at the root of both upper and lower columns. Based on the design and production of two beam-column node specimens, Xue et al. [7] discovered that the damage to the specimens began at the plastic hinge area at the ends of their beams. With the help of seismic isolation technology, Zhang et al. [8] used MIDAS to simulate an old building. The results revealed that after reinforcement with vibration isolation technology, the structure’s seismic response was significantly reduced. Luo [9] discovered that the column hysteresis curve would be distorted if spring units were used in the analysis after numerically simulating a Y-shaped hybrid column with cast steel nodes using ABAQUS. In an experimental study on thin-walled circular steel tube regenerated hybrid column-reinforced concrete beam-column nodes, Wu et al. [10] discovered that the stiffness of the node is significantly influenced by the thickness of the thin-walled steel tube. In an experimental study on the connection of a circular reinforced concrete column under a steel bone concrete column above an antique building, Ge [11] discovered that the specimens connected to the circular reinforced concrete column under the steel bone concrete column had typical bending damage. In order to analyze and study concrete-filled steel tube column, Chen [12] used VFEAP finite element software. The results indicated that, within a certain range, changing the concrete strength inside the structure has little effect on the member’s ductility, and that, as the length to slenderness ratio increases, the horizontal bearing capacity of the frame is significantly decreased.
On the connection portion of hybrid structural columns, there is, however, little research in the field of civil engineering. In order to provide a theoretical foundation and a point of reference for the design and implementation of structural columns for similar antique buildings, this paper proposes the connection form of the upper square concrete-filled steel tube-lower circle concrete-filled steel tube (USCFST-LCCFST) above the antique building.

2. Finite Element Model Establishment and Verification

Researchers are currently studying the connection form of the eave column of the Buddhist college’s Mahamudra Hall. The connection form is primarily an upper square concrete-filled steel tube-lower circle reinforced concrete (USCFST-LCRC) and an upper square steel reinforced concrete-lower circle reinforced concrete (USSRC-LCRC). The connection form of the upper square concrete-filled steel tube-lower circle concrete-filled steel tube (USCFST-LCCFST) is proposed in this paper based on prior works, and a comparison with the performance of the two previous connection forms demonstrates that the USCFST-LCCFST connection form proposed in this paper performs better. The modeling approach used in this paper has sufficient accuracy and produces trustworthy results, as shown by the ABAQUS modeling analysis of the USCFST-LCRC and USCFST-LCCFST and by comparison with the experimental data.

2.1. Verification of USCFST-LCRC Column Connections for Antique Buildings

2.1.1. Model Establishment

The validation specimen is the LJ-1 test specimen from the literature [2], whose dimensions, reinforcement, and parameters are shown in Figure 2 and Table 1, respectively. The finite element model is created by ABAQUS. The specimen is a USCFST-LCRC above the antique building, and the contact between the lower and upper columns is in the form of closing points. The connection area is the focus of this study.
The lower reinforced concrete column’s longitudinal reinforcement ratio is 1.13%, and the composite stirrup is used for strengthening. The steel tube in the LJ-1 specimen is a square steel tube of Q345 grade with C30 concrete; the height of the variable section at the closing point is 177 mm, and the steel tube of the upper column is 200 mm from the bottom beam. The model size, material ontology, and loading regime were maintained throughout the simulation in accordance with the literature [2]. The material properties and associated parameters were exactly the same as those in the literature [2], and were not repeated here. The C3D8R unit was used for steel pipe and concrete, and the T3D2 unit was used for steel reinforcement. In order to account for the boundary effect of the thick plate theory, the steel pipe was arranged along the thickness direction of 5 integral points, and the overall mesh division is shown in Figure 3. The grid size of concrete elements, longitudinal reinforcement, stirrup, and steel pipe elements are all 45 mm in size. Although the bond between the reinforcement and concrete cannot be taken into consideration, embedded constraints were used to simulate the reinforcement embedded in concrete. The difference in accuracy between the simulation results and the experimental results was acceptable. In reality, the steel pipe is connected to the concrete inside the steel pipe by welding anchor pins. Since the small slip between the square steel tube and the concrete outside the square steel tube was not taken into consideration, its restraint was used in the contact between the square steel tube and the concrete outside the square steel tube. The face-to-face contact between the square steel tube and the concrete inside the square steel tube was used to simulate the contact relationship between the two materials. Tangential behavior was simulated using a penalty function. The friction coefficient was set at 0.3, and the normal behavior was hard contact. To maintain consistency with the experiment, the bottom beam’s boundary condition was set to solidify. A coupling constraint was used to create a constraint relationship with the top surface of the column in order to apply the load after setting a reference point at the top of the column.
The loading regime is identical to that described in the literature [2]. First, an axial pressure of 1057.63 kN was applied in accordance with an axial compression ratio. Next, the axial pressure was maintained while the horizontal loading was managed by displacement. The loading regime is shown in Figure 4.

2.1.2. Comparison between Finite Element Results and Test Results

Figure 5a depicts the specimen LJ-1’s stress cloud diagram at the time of damage, with the maximum stress at the bottom of the lower column. Figure 5b depicts the damage pattern of the LJ-1 test, with a significant area of concrete spalling at the root of the lower column and a significant amount of exposed reinforcement. Figure 5c shows the damage stress cloud. The damage conditions in the three images are essentially consistent, as shown in Figure 5.
Figure 6 shows the hysteresis curve of the LJ-1 specimen. It is shown in Figure 6 that, although the hysteresis curves simulated by the method—embedded steel bars into the concrete—are significantly fuller than those obtained by experiment and cannot reflect the pinching effect, the results are of sufficient accuracy to simulate the bearing capacity and failure patterns of the structure. This is because the bond slip behavior between reinforcement and concrete is not taken into account when modeling the built-in area. Figure 7 compares the skeleton curve of the LJ-1 specimen to the extracted skeleton curve using a simulated hysteresis curve, demonstrating the high degree of agreement between the two trends. The comparison of the LJ-1 specimens’ parameters is shown in Table 2. It can be observed that the test data and simulated results of these parameters are generally closed, with a maximum error of 8.08%, and the two results are in good agreement. This demonstrates the effectiveness of the modeling approach used in this section.

2.2. Validation of USSCR-LCRC Column Connections for Antique Buildings

2.2.1. Model Establishment

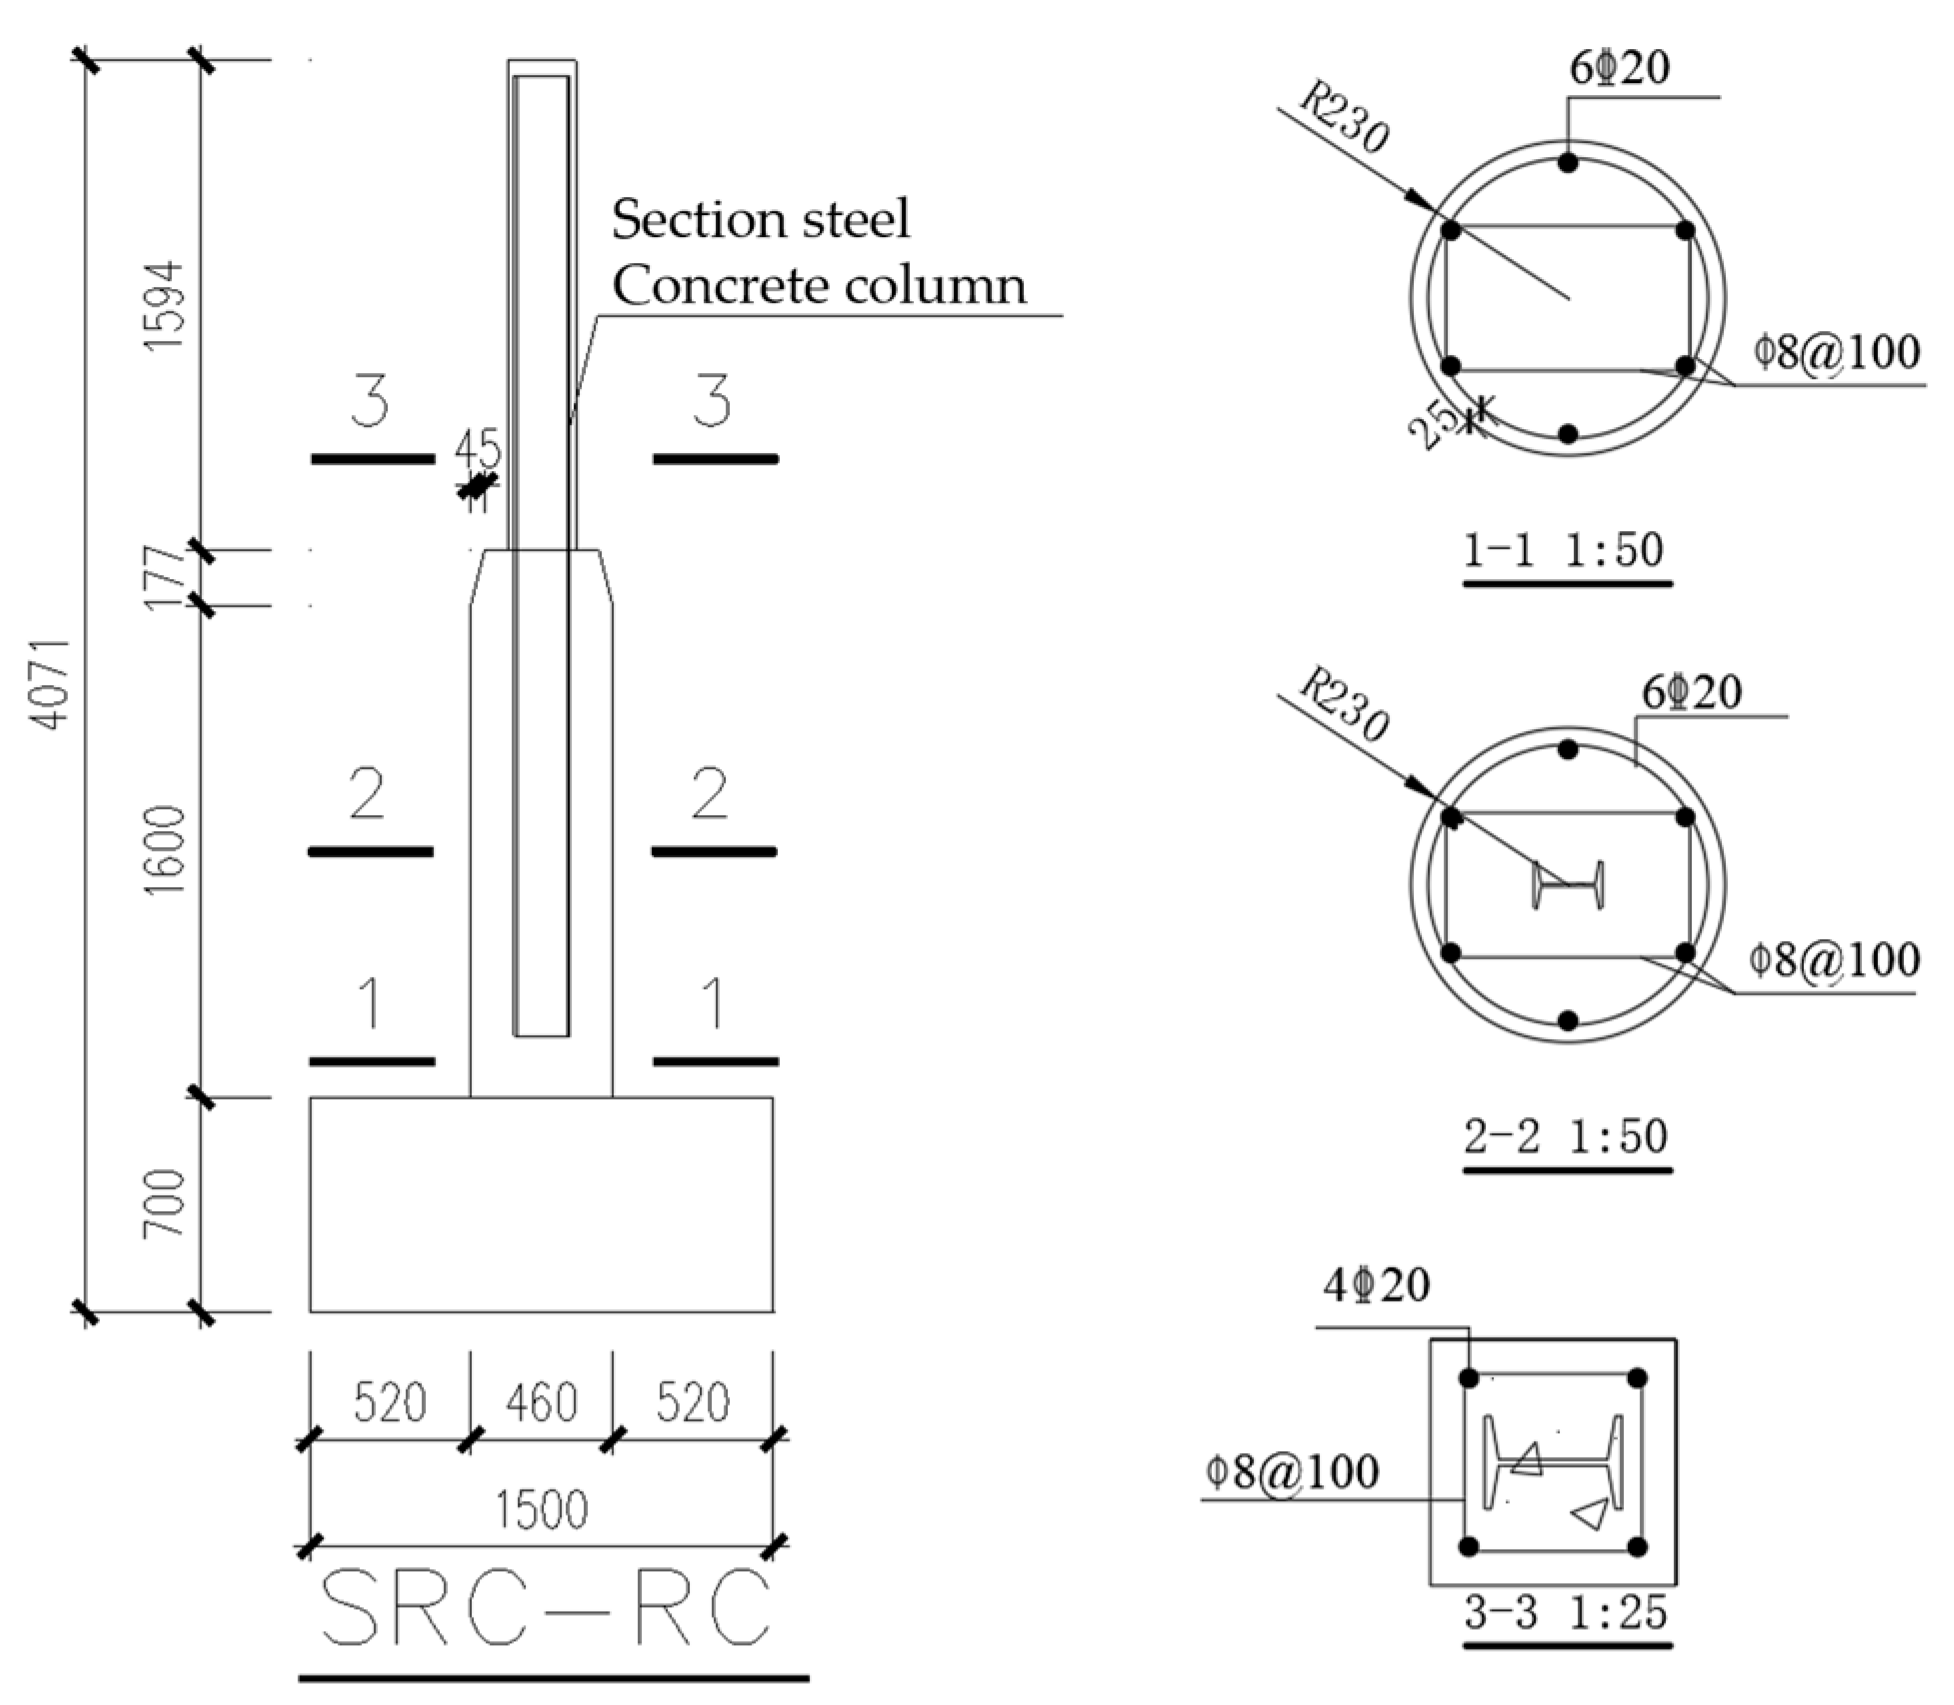
The specimen USSRC-LCRC1, a circular reinforced concrete column and lower steel bone concrete column above the historic building in the literature [11], was chosen in this section. The model’s dimensions, material properties, and loading regimes were kept consistent with those in the literature for the simulation [11], and the simulation’s dimensions, reinforcement, and parameters are displayed in Figure 8 and Table 3 in the same manner as in Section 2.1.1.

2.2.2. Comparison between Finite Element Results and Test Results

The specimen USSRC- LCRC1’s stress cloud at the time of damage was obtained, as shown in Figure 9. Figure 9a depicts the finite element stress cloud of the USSRC-LCRC1 test, with the maximum stress occurring at the bottom of the upper column. Figure 9b presents the damage pattern of the test, with a significant amount of concrete falling off on the east and west side of the upper column heel, a significant area of exposed reinforcement, significant debonding in the north and south sections, and broken concrete at the corner of the column. The two damage scenarios are essentially identical.
Figure 10 provides a more in-depth analysis of this specimen, USSRC-LCRC1, by comparing the skeleton curves of the test and numerical simulation of the USSRC-LCRC1 specimen. The simulation results for the skeleton curves of the USSRC-LCRC1 specimen are in strong agreement with the test results. The parameter comparison for the USSRC-LCRC1 specimen is shown in Table 4. The parameter values of each important point are close, and the maximum error is 9.91% between the simulated and experimental data. It demonstrates that the modeling approach used in this section is reasonable, efficient, and applicable to further analysis.
The modeling approach used in this section for the USCFST-LCRC and USSRC-LCRC specimens using finite element software for simulation is reasonable, and the results are reliable, as can be seen in Figure 6 and Figure 9. Therefore, the study of USCFST-LCCFST components in this paper can be approached using the same modeling methodology.

3. Seismic Performance of the USCFST-LCCFST Column Connection

3.1. Finite Element Modeling

3.1.1. Model Size

The USCFST-LCCFST column connection components of the antique structure are the subject of a seismic performance study known as C-1, and their dimensions are identical to those of the eaves column in the Mahamudra Hall of Putuo Mountain Buddhist College [13]. The lower column is a circular steel tube column with a radius of 230 mm, the thickness of the steel tube is 8 mm, and the bottom plate of the specimen is a 100 mm steel plate. Figure 11 shows the C-1 specimen’s dimensions, and Table 5 lists the specimen’s parameters.

3.1.2. Constitutive Relationship

CFST Column Concrete

In this paper, the uniaxial stress-strain relationship model of core concrete is modified as follows, using the concrete stress-strain principal structure relationship, which is based on the model proposed by Han and modified by Liu [14].
x = { 2 x x 2 ( x 1 ) x β 0 ( x 1 ) η + x ( x 1 )
x = ε ε 0 y = σ σ 0 σ 0 = f c
ε 0 = ( 1300 + 12.5 f c ) × 10 6
where f c is the compressive strength of the concrete cylinder.
η = { 2 ( c i r c l e   c o n c r e t e   f i l l e d   s t e e l   t u b e ) 1.6 + 1.5 x ( s q u a r e   c o n c r e t e   f i l l e d   s t e e l   t u b e )
β 0 = { ( 2.36 × 10 6 ) [ 0.25 + ( ξ 0.5 ) 7 ] f c 0.5 0.5 0.12 f c 0.1 1.2 1 + ξ
Concrete material definitions based on the formulas above input to ABAQUS are displayed in Table 6 and Table 7, respectively, along with definitions of concrete compression damage. Table 8 shows Concrete tensile damage.

Steel Principal Structure Relationship

The simplified bifold model for steel was chosen, and the steel parameters were taken as shown in Figure 12 and Table 9. The post-yield stiffness was assumed to be 1/100 of the initial stiffness.

3.1.3. Modeling

C3D8R units were adopted for the concrete and steel pipe. The unit size of concrete was 30 mm, and the unit size of circular steel pipe was 45 mm. The unit size of the square steel pipe was 45 mm, and five integral points were arranged along the thickness direction. The bottom plate was 50 mm in size, and four local seeds were arranged along the thickness direction. The meshing of the C-1 specimen is shown in Figure 13a–d. Other characteristics of the specimen were defined in accordance with the modeling approach in Section 2.

3.2. Comparative Analysis of the Seismic Performance of Column Connection

3.2.1. Hysteresis Curve and Skeleton Curve Analysis

The USCFST-LCCFST simulated specimen C-1 proposed in this section has the same upper square and lower cylinder column dimensions and length as the USCFST-LCRC type connection component LJ-1 and the USSRC-LCRC type connection component USSRC-LCRC1 in Section 2. Since the rest of the variables are identical except for their connection forms, their results are comparable. Figure 14 and Figure 15 show the skeleton curves and the three components’ hysteresis curves, respectively. It can be observed that the proposed USSRC-LCCFST column connection’s hysteresis curve is the most full, with the highest load capacity, highest energy dissipation capacity, best ductility, and smoothest decreasing trend.

3.2.2. Load-Bearing Capacity and Ductility Analysis

The three components’ ductility indices were calculated, and Table 10 displays both their load-bearing capacity and ductility indices. Peak loads of USCFST-LCCFST increased by 27.60% compared to USCFST-LCRC and 178.38% compared to USSRC-LCRC. The ductility coefficient increased by 7.71% and 26.67% compared to USCFST-LCRC and USSRC-LCRC respectively, which reflects a significant improvement of the superior deformation capacity of the concrete-filled steel tube.

3.2.3. Stiffness Degradation Curve Analysis

Figure 16 depicts the stiffness degradation curves for the three components. It can be observed that the USCFST-LCCFST component has a larger stiffness and degrades slightly slowly compared with that of USCFST-LCRC and USSRC-LCRC, with a larger characteristic point stiffness. As the displacement increases, the components’ stiffness degradation tends to slow down, and at the broken position, the stiffness values of the three components are fairly close to one another.

3.2.4. Analysis of Energy Consumption Capacity

The equivalent viscous damping coefficients of the three column connection components were compared, along with the energy consumption indices of the three components in Table 11. The table shows that the equivalent viscous damping coefficient of USCFST-LCCFST is 95.73% and 90.31% higher than that of USCFST-LCRC and USSRC-LCRC, respectively, in the failure phase, which means USCFST-LCCFST can dissipate more energy. This shows that the USCFST-LCCFST column connection has significantly better seismic performance than the other two connection components.
In this section, a finite element analysis of the USCFST-LCCFST column connection above the antique building was conducted, in order to demonstrate the superiority, validity, and better seismic performance of the connection form.

4. Variable Parameter Analysis of USCFST-LCCFST Column Connection

In this section, the seismic performance of USCFST-LCCFST column connection was simulated and studied through the change of parameters, which can provide a reference for design.

4.1. Variable Parameter Design

Considering the yield strength of steel tube (TY) and the ratio of the stiffness of the upper and lower column (LS), four TY and four LS replica antique building CFST-CFSE column connection specimens were established. The yield strengths of the steel tubes of the TY specimen were 235 MPa, 355 MPa, 390 MPa, 420 MPa, and the ratio of the upper and lower column stiffnesses of the LS specimen were 0.012, 0.027, 0.063, and 0.159, respectively, and the specific settings of the 8 USCFST-LCCFST column connection components are shown in Table 12.

4.2. Effect of Yield Strength of Steel Tubes

4.2.1. Analysis of Failure Morphology

The loading system in the horizontal direction is shown in Figure 17. The finite element model was established in the same manner as the modeling in the previous two sections. The top of the column was subjected to a vertical pressure of 62.5 kN.
Figure 18 shows the stress cloud of the steel tube after failure of the TY specimen. As can be observed, there is a stress concentration at the root of the upper column, and the upper and lower columns are more severely damaged in the connection part. In addition, the upper square steel tube yields in a specific area connected with the lower column. With the increase of the yielding strength of the steel tube, the yielding range of the connected prescription steel tube expands.

4.2.2. Hysteresis Curve and Skeleton Curve Analysis

Figure 19 compares the hysteresis curve and skeleton curve of the TY specimen. Figure 19a displays the hysteresis curve, which shows a shape that is closer to a full shuttle with the increase of yield strength of the steel tube. According to the skeleton curve in Figure 19b, the peak load of the specimen rises as steel yield strength increases. In addition, as steel yield strength increases, the trend of the specimen’s falling section becomes more stabilized.

4.2.3. Load-Bearing Performance and Ductility Analysis

The bearing performance and ductility are very important in evaluating the seismic performance of the components. Table 13 shows the bearing performance and ductility indices of TY specimens, and the peak loads of TY-2~TY-4 specimens increased by 29.95%, 20.39%, and 67.58%, respectively, compared with TY-1 specimens, which indicates that the yield strength of steel pipe has a significant effect on the enhancement of the bearing capacity of the specimens. When compared to the TY-1 specimen, the ductility coefficient decreased by 0.01%, 8.60%, and 11.47%, respectively. As shown, the load-bearing capacity increases as the yield strength of the steel tube adopted for the USCFST-LCCFST column connection component increases. Thus, increasing the load carrying capacity of USCFST-LCCFST components without significantly lowering their ductility is possible by making a reasonable choice of steel tube yield strength.

4.2.4. Energy Consumption Capacity Analysis

The equivalent viscous damping coefficient of the TY specimen is shown along with the energy dissipation performance index of each TY specimen at each stage in Table 14. This coefficient of the TY specimen exhibits a decreasing pattern as steel tube strength increases. In comparison to TY-1, the coefficient of TY-2 to TY-4 decreased by 0.68%, 11.19%, and 15.33%, respectively. This indicates that an increase in steel tube yield strength will decrease the energy dissipation of the component to some extent. In addition, specimens with lower yielding strength of the steel tube reach the yielding state earlier and have stronger energy dissipation capacity.

4.2.5. Stiffness Degradation Analysis

Figure 20 depicts the stiffness degradation curve of the TY specimen based on the stiffness degradation index and degradation stiffness graph that were calculated for each TY specimen. It is evident that the specimens’ initial stiffnesses are similar and that the overall stiffness degradation curves have a monotonically decreasing trend. At the beginning of the loading, the specimen’s stiffness decreases steeply. When the displacement reaches approximately ±68 mm, the decreasing trend starts to slow down. At the failure stage, the specimen’s deformation gradually increases, and the stiffness of each specimen falls to its lowest value. The characteristic point stiffness of the TY specimen gradually grows as steel yield strength increases.
In conclusion, when the yield strength of the steel tube is taken at a reasonable value, its load-bearing performance can be significantly improved without a severe decline in ductility, and the trend of stiffness degradation is slow. The yield strength of the steel tube for USCFST-LCCFST column joint components is therefore recommended to be 355–420 MPa.

4.3. Effect of Upper and Lower Column Linear Stiffness Ratio

4.3.1. Analysis of Failure Pattern

In antique architecture, the ratio of the upper and lower column linear stiffness will have a greater impact on its bearing capacity and deformation performance, because the bending stiffness of the upper and lower column sections varies with the change in the cross section. Figure 21 depicts the stress cloud diagram of the steel tube when the specimen LS is at the point of failure. It is clear from the diagram that, in the case of lower linear stiffness of the upper and lower columns, the outer steel tube of the upper square column has fully yielded while the lower column’s steel tube is far from yielding, leading to the uncoordinated deformation between the upper column and the lower column. Greater deformation is caused by the upper column, which lowers its seismic performance. The ratio of the upper and lower column linear stiffness must be kept within a suitable range to guarantee the column’s seismic performance.

4.3.2. Hysteresis Curve and Skeleton Curve Analysis

The seismic performance of the USCFST-LCCFST column joint components is significantly influenced by the ratio of the linear stiffnesses of the upper and lower columns. The hysteresis curve in Figure 22a shows that as the ratio of upper and lower column line stiffness of the specimen increases, the hysteresis curve of the specimen gradually assumes a full shuttle shape. The skeleton curve in Figure 22b shows that when the ratio of upper and lower column line stiffness of the specimen is low, the horizontal bearing capacity tends to decrease significantly.

4.3.3. Load-Bearing Performance and Ductility Analysis

The CFST-CFST components’ ductility and load-bearing capabilities were examined. The load-bearing capacity and ductility indices of LS specimens are displayed in Table 15. In comparison to LS-1, the peak loads of LS-2~LS-4 are higher by 111.80%, 86.55%, and 455.19%, respectively. The ductility is higher by 14.24%, 109.80%, and 154.64%, respectively, with LS-1 and LS-2 specimens having lower ductility. The ratio of the components’ upper and lower column stiffnesses should be strictly constrained in practical applications.

4.3.4. Energy Consumption Capacity Analysis

The equivalent viscous damping coefficients of LS specimens are shown in Table 16 along with the energy dissipation performance indices of the specimens with various ratios of upper and lower column linear stiffness. At the same stage of failure, LS-3 and LS-4 have equivalent viscous damping coefficients that are 47.75% and 36.35% higher than that of LS-1. This is because the difference between the upper and lower flexural stiffness of the USCFST-LCCFST column connection component above decreases as the ratio of upper and lower column linear stiffness increases, allowing it to exert its full capacity for energy dissipation.

4.3.5. Stiffness Degradation Analysis

The stiffness degradation index of each LS specimen was calculated and plotted in Figure 23. It is clear that as the ratio of upper to lower column stiffness rises, the stiffness index value of the specimen rises as well, the range of decline increases, and the stiffness degradation curve steepens. When the stiffness index value of each specimen reaches 68 mm, the stiffness degradation of each specimen gradually slows down, but there is still a significant gap between the stiffness values of specimens LS-1 to LS-4. In the subsequent loading process, the stiffness degradation index values of each specimen gradually approach each other. The information above demonstrates that the stiffness degradation is significantly affected by the parameter of the upper to lower column stiffness ratio.
In conclusion, it is advised that the ratio of upper and lower column linear stiffness should be no less than 0.063 in order to ensure the seismic performance of the USCFST-LCCFST column connection components.

5. Conclusions

In this paper, a new connection form USCFST-LCCFST, namely, the upper square concrete-filled steel tube-lower circle concrete-filled steel tube in the antique building, is proposed. By FEM numerical simulation, the seismic performance of the connection is studied and several influence parameters are analyzed. The specific conclusions are as follows:
(1)
Compared to the conventional USCFST-LCRC and USSRC-LCRC column connection components, the USCFST-LCCFST column connection component proposed in this paper has fuller hysteresis curves and better peak loads, which can improve the ductility of the column connection component and result in a higher equivalent viscous damping coefficient in the damage phase. The stiffness degradation is good, indicating that the column connection component form for the USCFST-LCCFST has a good seismic performance.
(2)
The yield strength of the steel tube is recommended to be between 355 and 420 MPa because yield strength in this range can significantly improve the load-bearing capacity of the USCFST-LCCFST column connection component while reducing the ductility and slowing the rate of stiffness degradation.
(3)
The upper and lower column linear stiffness ratio of the connection should be strictly limited, and the recommended value is no less than 0.063. This is because when the upper and lower column linear stiffness ratio is small, the bearing capacity and ductility of the USCFST-LCCFST column connection components are significantly reduced, and column deformation would be too large, which would result in reduced seismic performance.
(4)
Since the connection forms for USCFST-LCCFST show excellent performances, it is recommended to adopt this connection form when designing column in the antique building.

Author Contributions

Software, Q.G.; Formal analysis, X.S.; Data curation, B.W.; Writing—original draft, Y.X.; Writing—review & editing, J.G. All authors have read and agreed to the published version of the manuscript.

Funding

This research was fund by the Natural Science Foundation of Shaanxi Province, China (Grant number: 2021SF-525).

Data Availability Statement

Due to the nature of this research, participants of this study did not temporarily agree for their data to be shared publicly, so supporting data is not available.

Acknowledgments

The authors gratefully acknowledge all reviewers of the paper. Also, thanks to all the authors of the references.

Conflicts of Interest

The authors declare no conflict of interest.

References

  1. Wang, L. Comparative Study on Structural Behavior between Ancient Structure and Antique Building of a Qing-style Hall. Master’s Thesis, Xi’an University of Architecture and Technology, Xi’an, China, 2012. [Google Scholar]
  2. Lin, J. Experimental Study on Seismic Behavior of Imitated Ancient Building Connections between Concrete Filled Square Steel Tube Columns and Reinforced Concrete Circular Columns. Master’s Thesis, Xi’an University of Architecture and Technology, Xi’an, China, 2015. [Google Scholar]
  3. Xue, J. Steel & Concrete Composite Structure; Huazhong University of Science and Technology Press: Wuhan, China, 2007; p. 9. [Google Scholar]
  4. Yu, Z.; Zhao, S.; Wu, H.; Wei, T. CFD analysis of wind load on large cantilever steel structures with multi-slope double-hipped roofs of Lijiang Railway Station. J. Build. Struct. 2009, 153–158. [Google Scholar] [CrossRef]
  5. Wang, C.; Xu, K.; Tian, L. Structure Design of Mingtang for the Protection of the Ruins of Ancient Buildings Built in the SUI and TANG Dynasty in Luoyang City. Steel Struct. 2011, 26, 32–36. [Google Scholar]
  6. Xue, J.; Ma, L.; Lin, J.; Wu, K.; Ge, H. Experimental study on seismic behavior of imitated ancient building connections between concrete filled square steel tubular columns and reinforced concrete circular columns. J. Build. Struct. 2018, 39, 37–44. [Google Scholar]
  7. Xue, J.; Ma, L.; Yang, K.; Wu, Z.; Sui, Y. Dynamic experimental study on the single beam-column joints and double beams-column joints in steel archaized buildings. J. Vib. Eng. 2020, 33, 1044–1052. [Google Scholar]
  8. Zhang, W.; Ren, W.; Fu, S.; Hao, Y.; Liu, G. Seismic isolation and reinforcement technique of imitated ancient buildings. China Earthq. Eng. J. 2021, 43, 1444–1451. [Google Scholar]
  9. Luo, W. Study on Seismic Behavior of Y-Shaped Hybrid Column with Cast-Steel Joint. Master’s Thesis, Tongji University, Shanghai, China, 2007. [Google Scholar]
  10. Wu, B.; Zhao, X.; Yang, Y. Seismic tests and numerical simulations on beam-to-column joints with demolished concrete blocks filled in thin-walled circular steel tubular columns. China Civ. Eng. J. 2013, 59–69. [Google Scholar] [CrossRef]
  11. Ge, Z. Experimental Study on Seismic Behavior of Connection between Steel Reinforced Concrete Square Column and Reinforced Concrete Circular Column in Traditional Style Building. Master’s Thesis, Xi’an University of Architecture and Technology, Xi’an, China, 2017. [Google Scholar]
  12. Chen, J. Non-Linear Simulation Analysis of Lateral Performance of RC Frame-Core Tube Structure Considering Composite Structural Columns. Master’s Thesis, Nanchang University, Nanchang, China, 2021. [Google Scholar]
  13. Wang, J.; Jia, J.; Liu, F.; Li, J. Structural design and research on Mahavira Hall of Mount Putuo Buddhist Institute. Build. Struct. 2017, 47, 25–29. [Google Scholar]
  14. Yin, J.; Liang, S.; Jiang, Y.; Wang, L.; Zhu, X. Design and Experimental Study on Transitional Column of CFST. Ind. Build. 2003, 33, 61–63. [Google Scholar]
Figure 1. Photo of bucket arc and connection of upper and lower column.
Buildings 13 00916 g001
Figure 2. Dimensions and reinforcement of LJ-1 specimen.
Buildings 13 00916 g002
Figure 3. Overall model and mesh division.
Buildings 13 00916 g003
Figure 4. Horizontal loading regime.
Buildings 13 00916 g004
Figure 5. Simulation and test results comparison of Specimen LJ-1: (a) finite element stress cloud; (b) test damage pattern; (c) damage stress cloud.
Buildings 13 00916 g005
Figure 6. Hysteresis curve of LJ-1 specimens.
Buildings 13 00916 g006
Figure 7. Comparison of skeleton curves of LJ-1 specimens.
Buildings 13 00916 g007
Figure 8. Dimensions and reinforcement of USSRC-LCRC1 specimens.
Buildings 13 00916 g008
Figure 9. Comparison of simulation and experimental results of USSRC-LCRC1: (a) Finite element stress cloud diagram; (b) Test damage pattern.
Buildings 13 00916 g009
Figure 10. Comparison of skeleton curves of SRC-RC1 specimen.
Buildings 13 00916 g010
Figure 11. Dimensions of C-1 specimen.
Buildings 13 00916 g011
Figure 12. The stress-strain relationship of steel.
Buildings 13 00916 g012
Figure 13. Meshing diagram of each component: (a) circular steel tube meshing; (b) square steel tube meshing; (c) concrete meshing; (d) overall model and meshing.
Buildings 13 00916 g013
Figure 14. Comparison of the skeleton curves of the three types of components.
Buildings 13 00916 g014
Figure 15. Comparison of the hysteresis curves of the three types of components.
Buildings 13 00916 g015
Figure 16. Comparison of stiffness degradation curves of the three types of column connection components.
Buildings 13 00916 g016
Figure 17. Horizontal displacement loading system.
Buildings 13 00916 g017
Figure 18. The stress cloud of the steel tube of TY specimen at failure: (a) TY-1; (b) TY-2; (c) TY-3; (d) TY-4.
Buildings 13 00916 g018
Figure 19. Hysteresis curve and skeleton curve of TY specimen: (a) hysteresis curve; (b) skeleton curve.
Buildings 13 00916 g019
Figure 20. Stiffness degradation curve of TY specimen.
Buildings 13 00916 g020
Figure 21. The stress cloud of steel tube for specimen LS at failure: (a) LS-1; (b) LS-2; (c) LS-3; (d) LS-4.
Buildings 13 00916 g021
Figure 22. Hysteresis curve and skeleton curve of specimen LS: (a) hysteresis curve; (b) skeleton curve.
Buildings 13 00916 g022
Figure 23. Stiffness degradation curve of LS specimens.
Buildings 13 00916 g023
Table 1. Parameters of the LJ-1 specimen.
SpecimenSteel Tube Cross-Sectional Size (mm)
LJ-1180 × 180 × 8
Table 2. Comparison of test and simulation parameters of LJ-1 specimen.
PhaseYield PointPeak PointFailure Point
P y / k N Δ y / mm P max / k N Δ max / mm P u / k N Δ u / mm
Test55.2533.5471.8683.8261.08147.84
Simulation58.6435.7876.3884.0064.923135.89
Error (%)6.146.686.290.216.298.08
Note: Py is calculated using the universal yield moment method; Pu = 0.85 × Pm.
Table 3. Parameters of the USSRC-LCRC1 specimen.
SpecimenMetal TypeRatio of Axial CompressionLongitudinal Reinforcement in the UpperLongitudinal Support at the LowerStirrup Configuration
USSRC-LCRC1Q235b
(100 × 68 × 4.5)
0.34Buildings 13 00916 i001206Buildings 13 00916 i00120ϕ8@100
Table 4. Comparison of test and simulation parameters for SRC-RC1 specimens.
PhaseYield PointPeak PointFailure Point
P y / k N Δ y / mm P max / k N Δ max / mm P u / k N Δ u / mm
Test24.9723.3032.9455.4928.0087.39
Simulation24.1825.1431.2857.9026.5996.05
Error (%)3.177.905.044.345.059.91
Table 5. Parameters of C-1 specimen.
SpecimenSteel Tube Size (mm)Axial Compression RatioLength to Slenderness RatioSteel TubeConcrete Strength
C-1180 × 180 × 80.2561.35Q355C30
Table 6. Concrete basic parameters.
Density
t/mm3
Young’s ModulusPoisson’s RatioDilation AngleEccentricityfb0/fc0KViscosity Parameter
2.4 × 10−933,683.30.2380.11.160.666670.01
Table 7. Concrete compression damage.
Yield StressPlastic StrainDamage ParametersInelastic Strain
15.88461008000
22.973245330.0007038410.4471558330.000703841
26.506302260.0012967790.5636194890.001296779
28.427750950.0019385530.642892350.001938553
29.528473760.0026051980.699626010.002605198
30.173290510.0032856580.741920380.003285658
30.54805480.0039743010.7794484620.003974301
30.754989540.0046680310.8002806010.004668031
30.853791470.0053650370.8211278580.005365037
30.881024450.0060642110.8382990990.006064211
29.271113220.0075129970.8714003330.007512997
25.981631150.0090126780.9015535280.009012678
22.5203460.0105175650.9249782110.010517565
19.462830540.0120102170.9421665760.012010217
16.921109290.0134872390.9546331770.013487239
Table 8. Concrete tensile damage.
Yield StressCracking StrainDamage ParametersCracking Strain
3.067031000
0.90.1
Table 9. Bifold model parameters of steel.
Density
t/mm3
Young’s ModulusPoisson’s RatioYield StressPlastic Strain
7.85 × 10−92.72 × 1050.3323.80
388.560.0235
Table 10. Load-bearing performance and ductility index of the three types of components.
Member Δ y / mm Δ u / mm P y / k N P max / k N P u / k N μ
USCFST-LCCFST44.4211.083.791.777.94.75
USCFST-LCRC33.5147.855.271.961.14.41
USSRC-LCRC23.387.425.032.928.03.75
Table 11. Comparison of equivalent viscous damping coefficients of the three types of column connection components.
MemberEquivalent Viscous Damping Coefficients
Yield PhasePeak PhaseFailure Phase
USCFST-LCCFST0.0920.3000.550
USCFST-LCRC0.0930.1830.281
USSRC-LCRC0.1150.1610.289
Table 12. Specific settings of the variable parameters of the USCFST-LCCFSE column connection components.
Specimen No. f y / M P a f c / M P a i u p / i d o w n n b / m m L / m m
TY-1235300.0630.381080
TY-2355
TY-3390
TY-4420
LS-1355300.0120.381080
LS-20.027
LS-30.063
LS-40.159
Table 13. Load-bearing performance and ductility index of TY specimens.
Specimen Δ y / mm Δ max / mm Δ u / mm P y / k N P max / k N P u / k N μ
TY-137.3848.00177.7358.6770.5759.984.75
TY-244.3887.99211.0084.7191.7077.954.75
TY-350.4987.99219.42101.24110.4093.844.35
TY-453.3287.99224.44105.29118.26100.524.21
Table 14. Equivalent viscous damping coefficient of TY specimens.
Specimen No.Equivalent Viscous Damping Coefficient
Yield StagePeak StageFailure Stage
TY-10.2590.4150.554
TY-20.0920.3000.550
TY-30.1160.2300.492
TY-40.1050.2000.469
Table 15. Load-bearing performance and ductility index of LS specimens.
Specimen Δ y / mm Δ max / mm Δ u / mm P y / k N P max / k N P u / k N μ
LS-147.3587.99107.3022.9123.2119.732.27
LS-245.9987.99119.0747.2949.1641.782.59
LS-344.3887.99211.0084.7191.7077.954.75
LS-442.8388.00247.15115.98128.86109.535.77
Table 16. Equivalent viscous damping coefficients of LS specimens.
SpecimenEquivalent Viscous Damping Coefficients
Yield StagePeak StageFailure Stage
LS-10.0810.1060.372
LS-20.1420.1440.355
LS-30.0920.3000.550
LS-40.1800.2530.508
Disclaimer/Publisher’s Note: The statements, opinions and data contained in all publications are solely those of the individual author(s) and contributor(s) and not of MDPI and/or the editor(s). MDPI and/or the editor(s) disclaim responsibility for any injury to people or property resulting from any ideas, methods, instructions or products referred to in the content.