
Mechanical Properties of Steel Fiber-Reinforced, Recycled, Concrete-Filled Intersecting Nodes in an Oblique Grid

Abstract
:1. Introduction
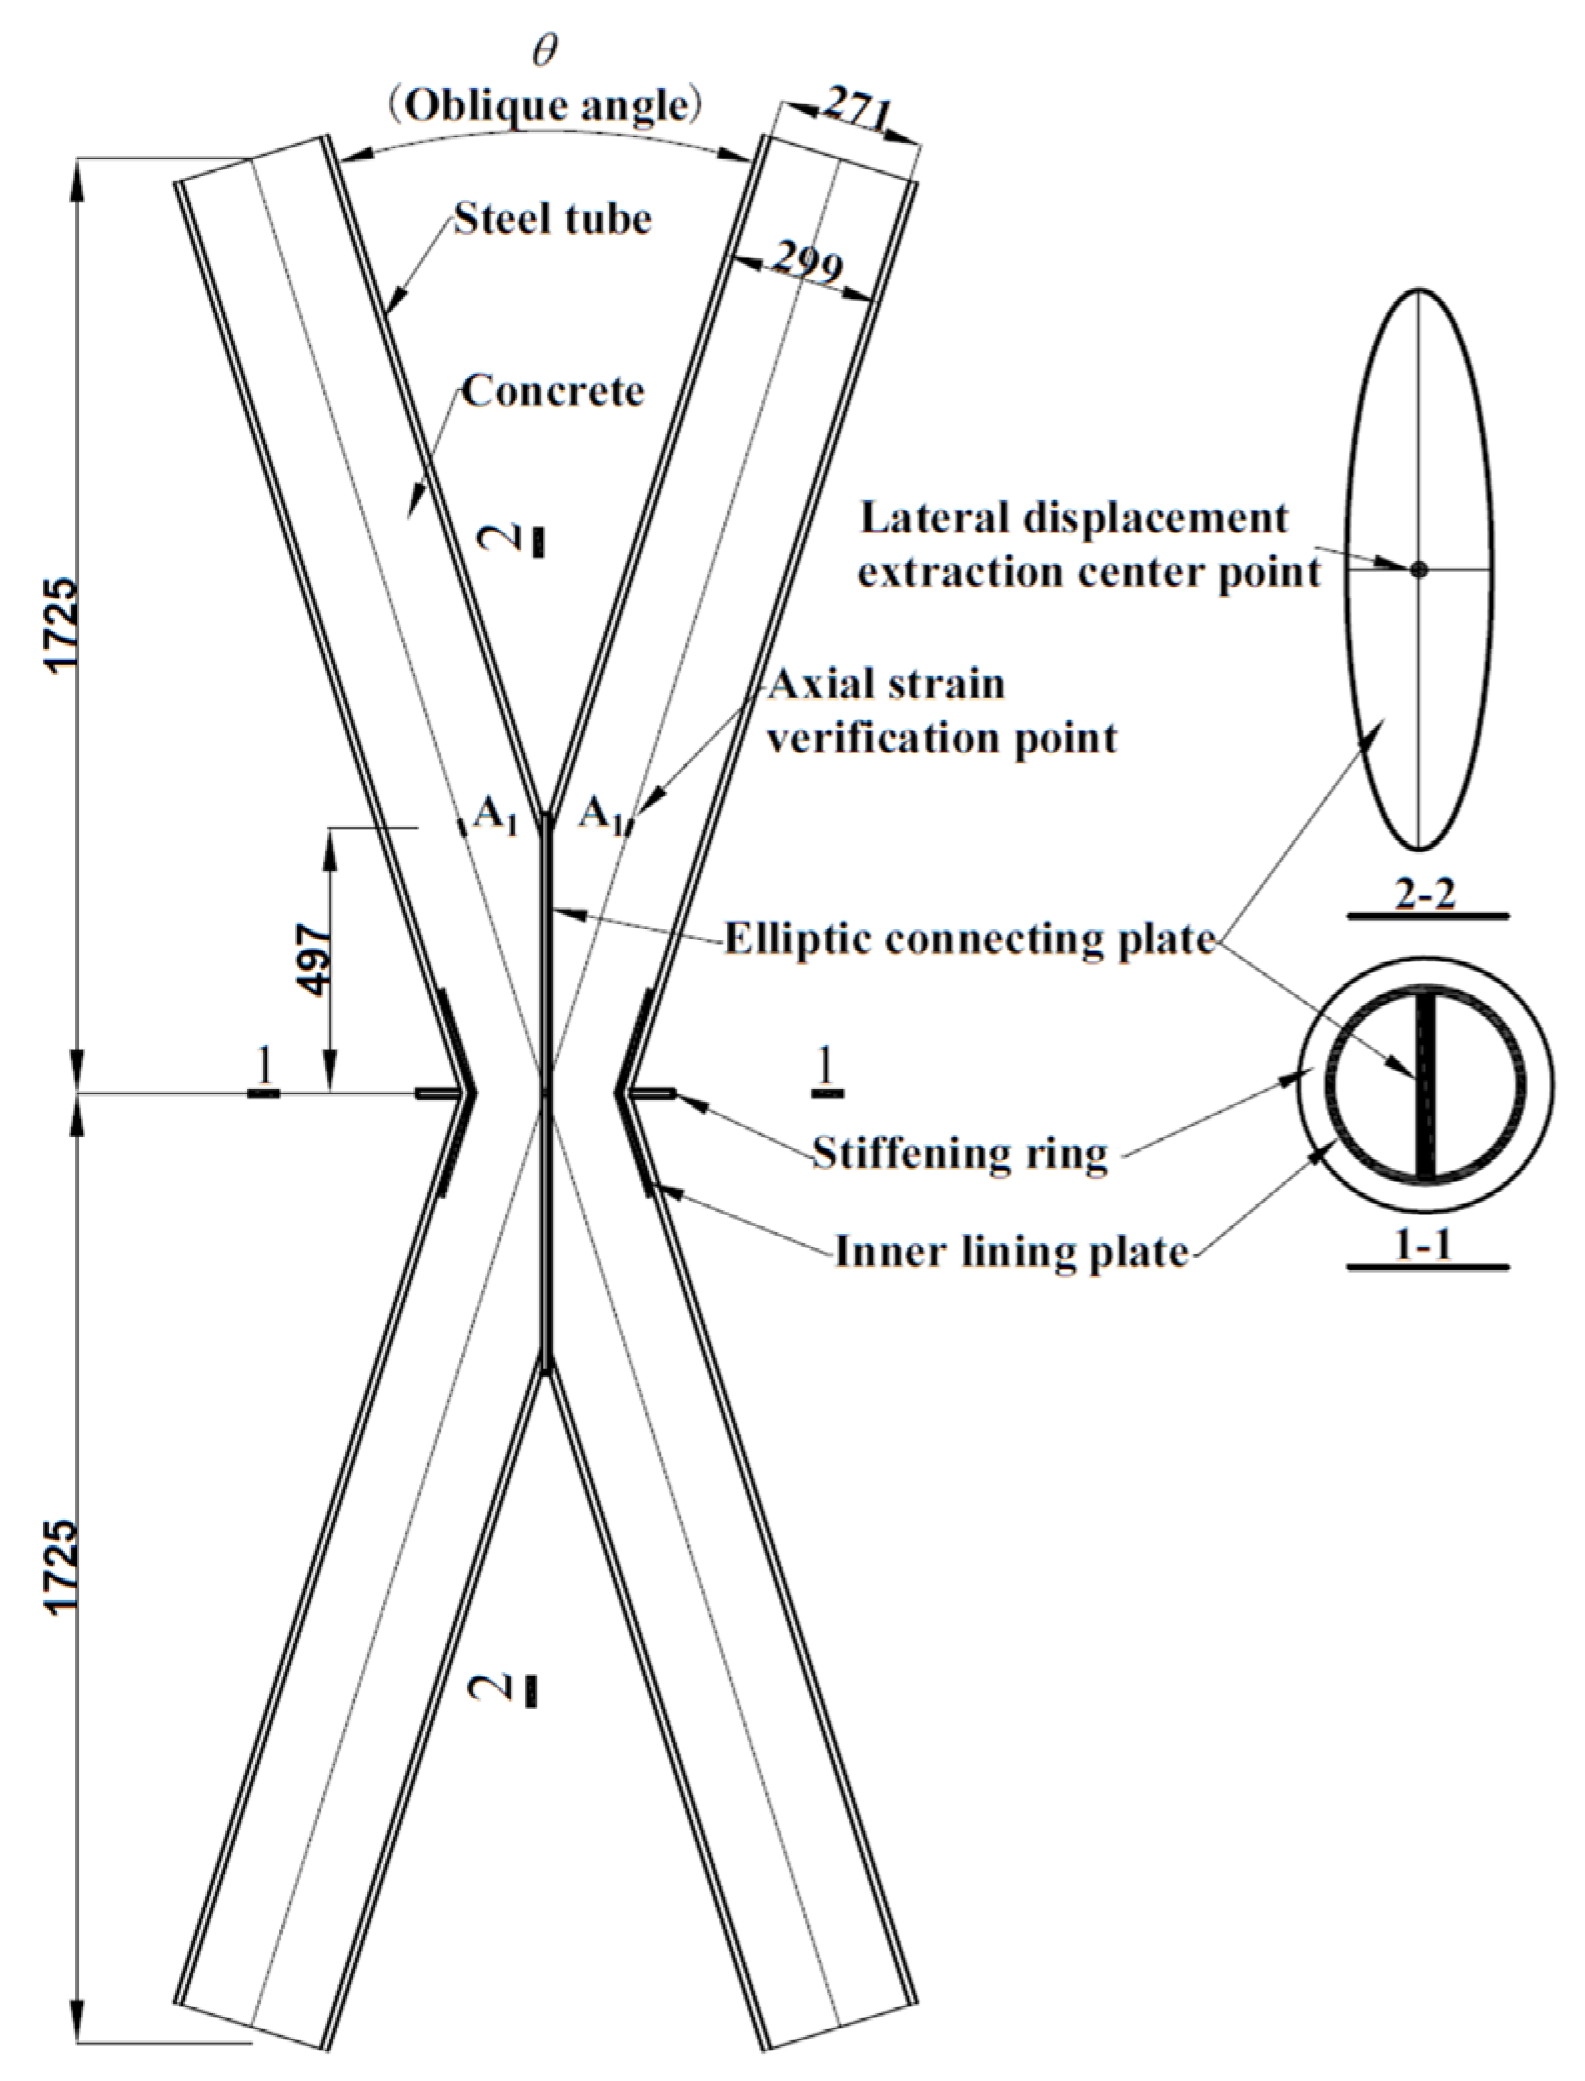
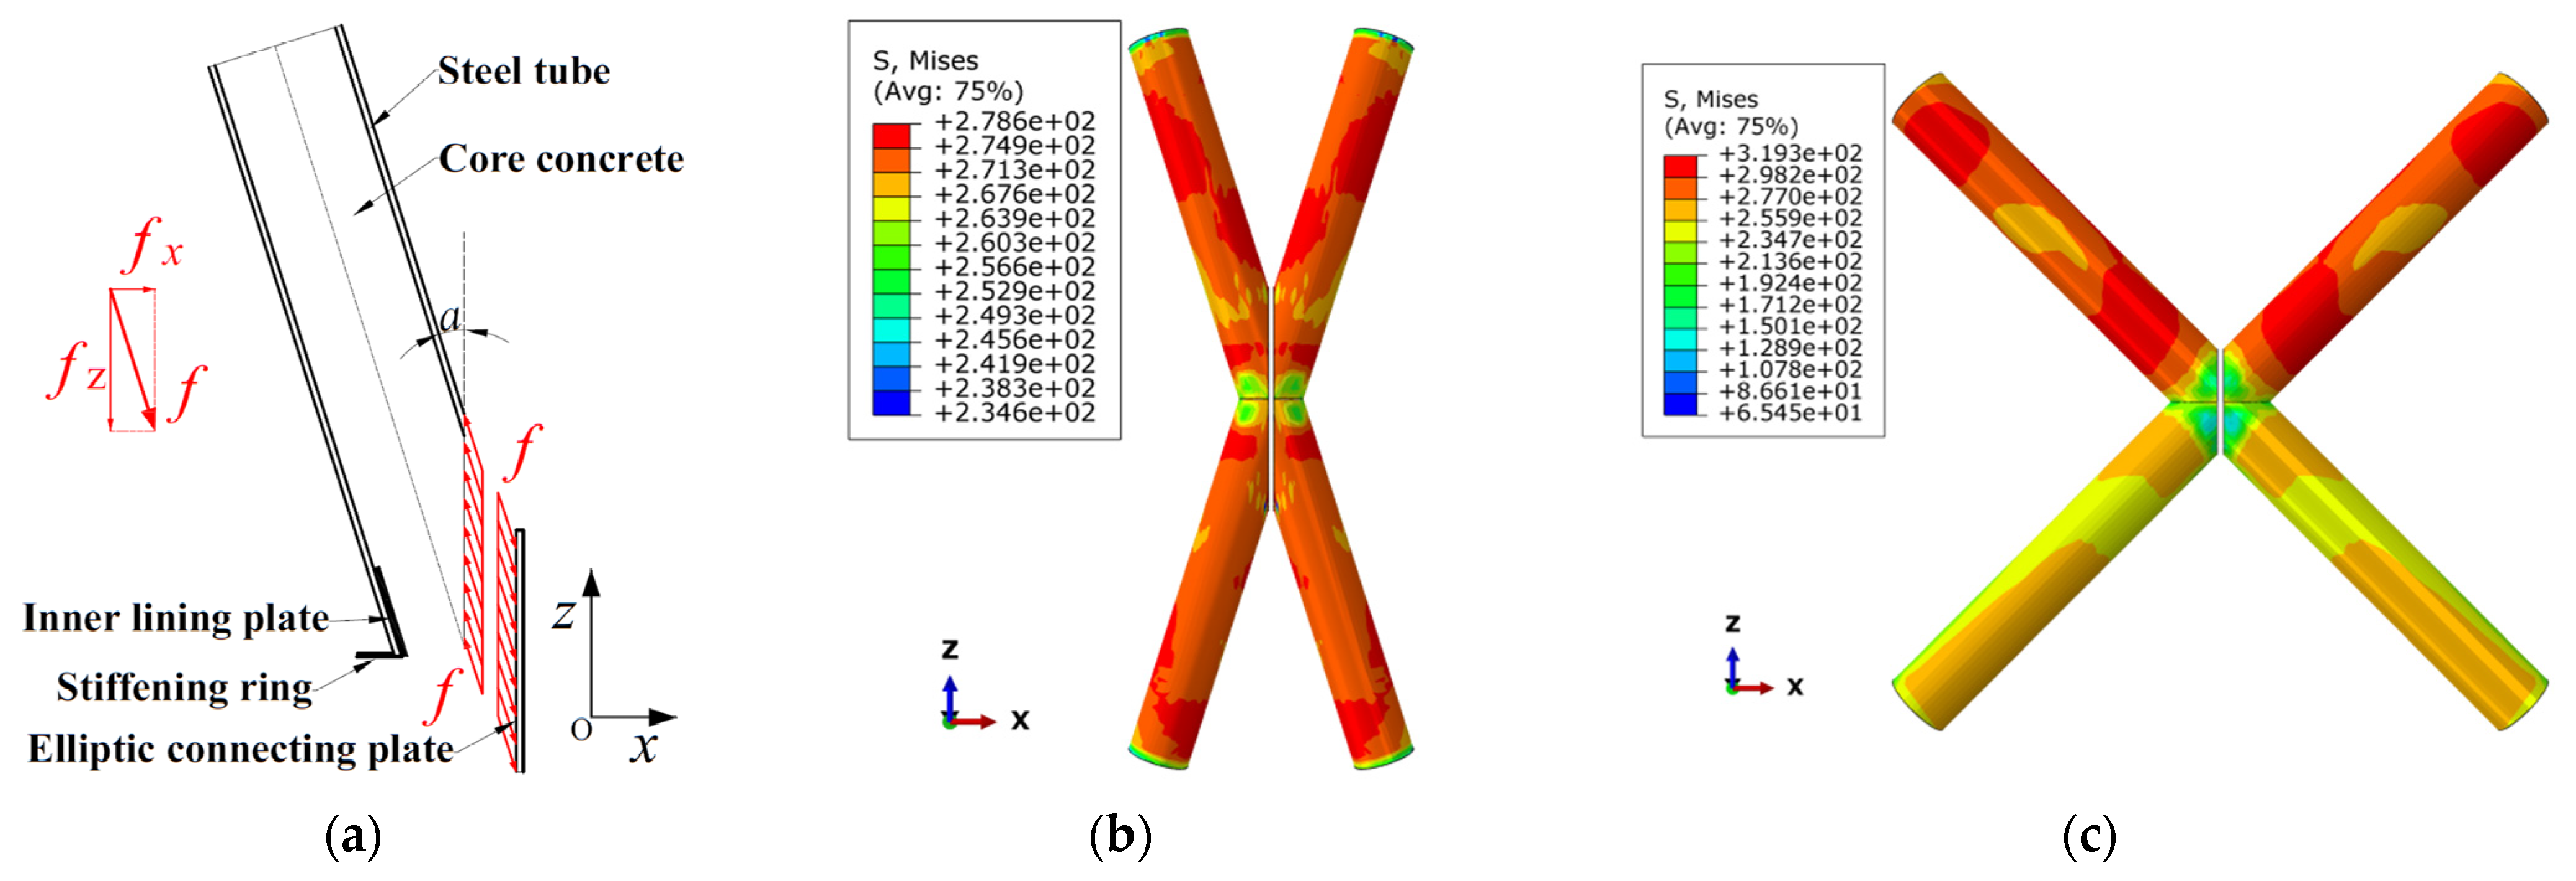
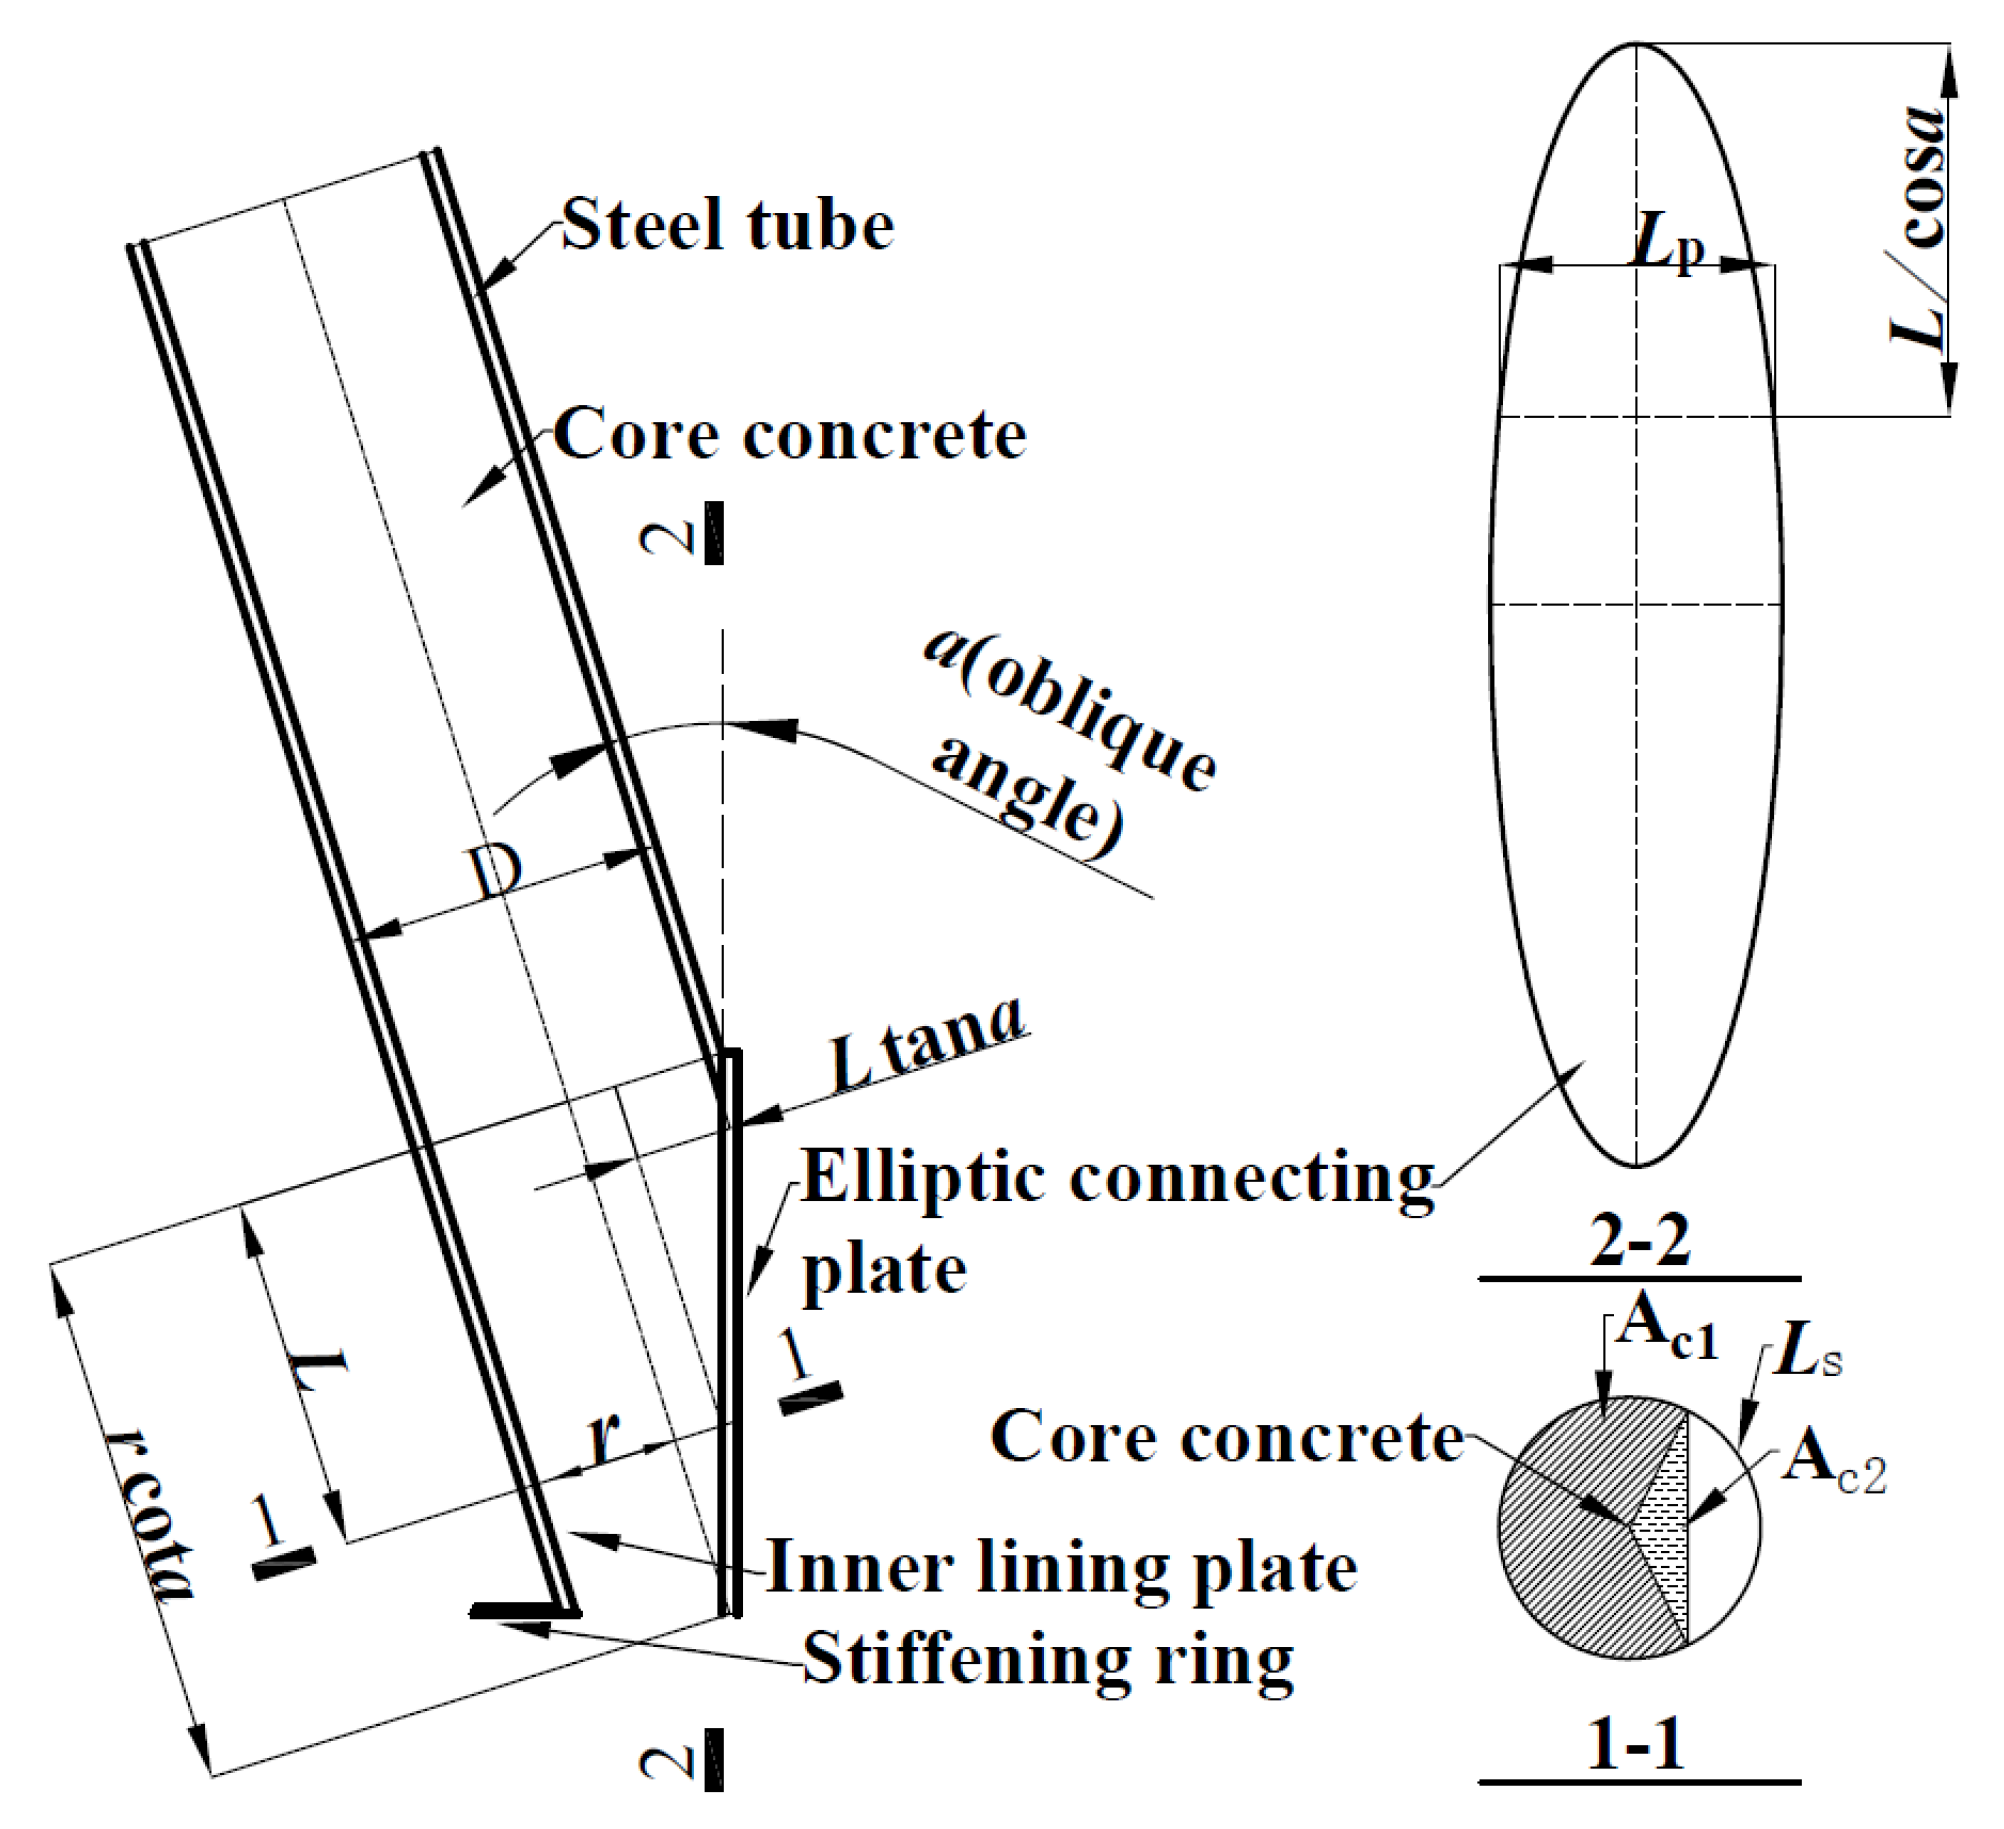
2. Node Construction
3. Finite Element Model
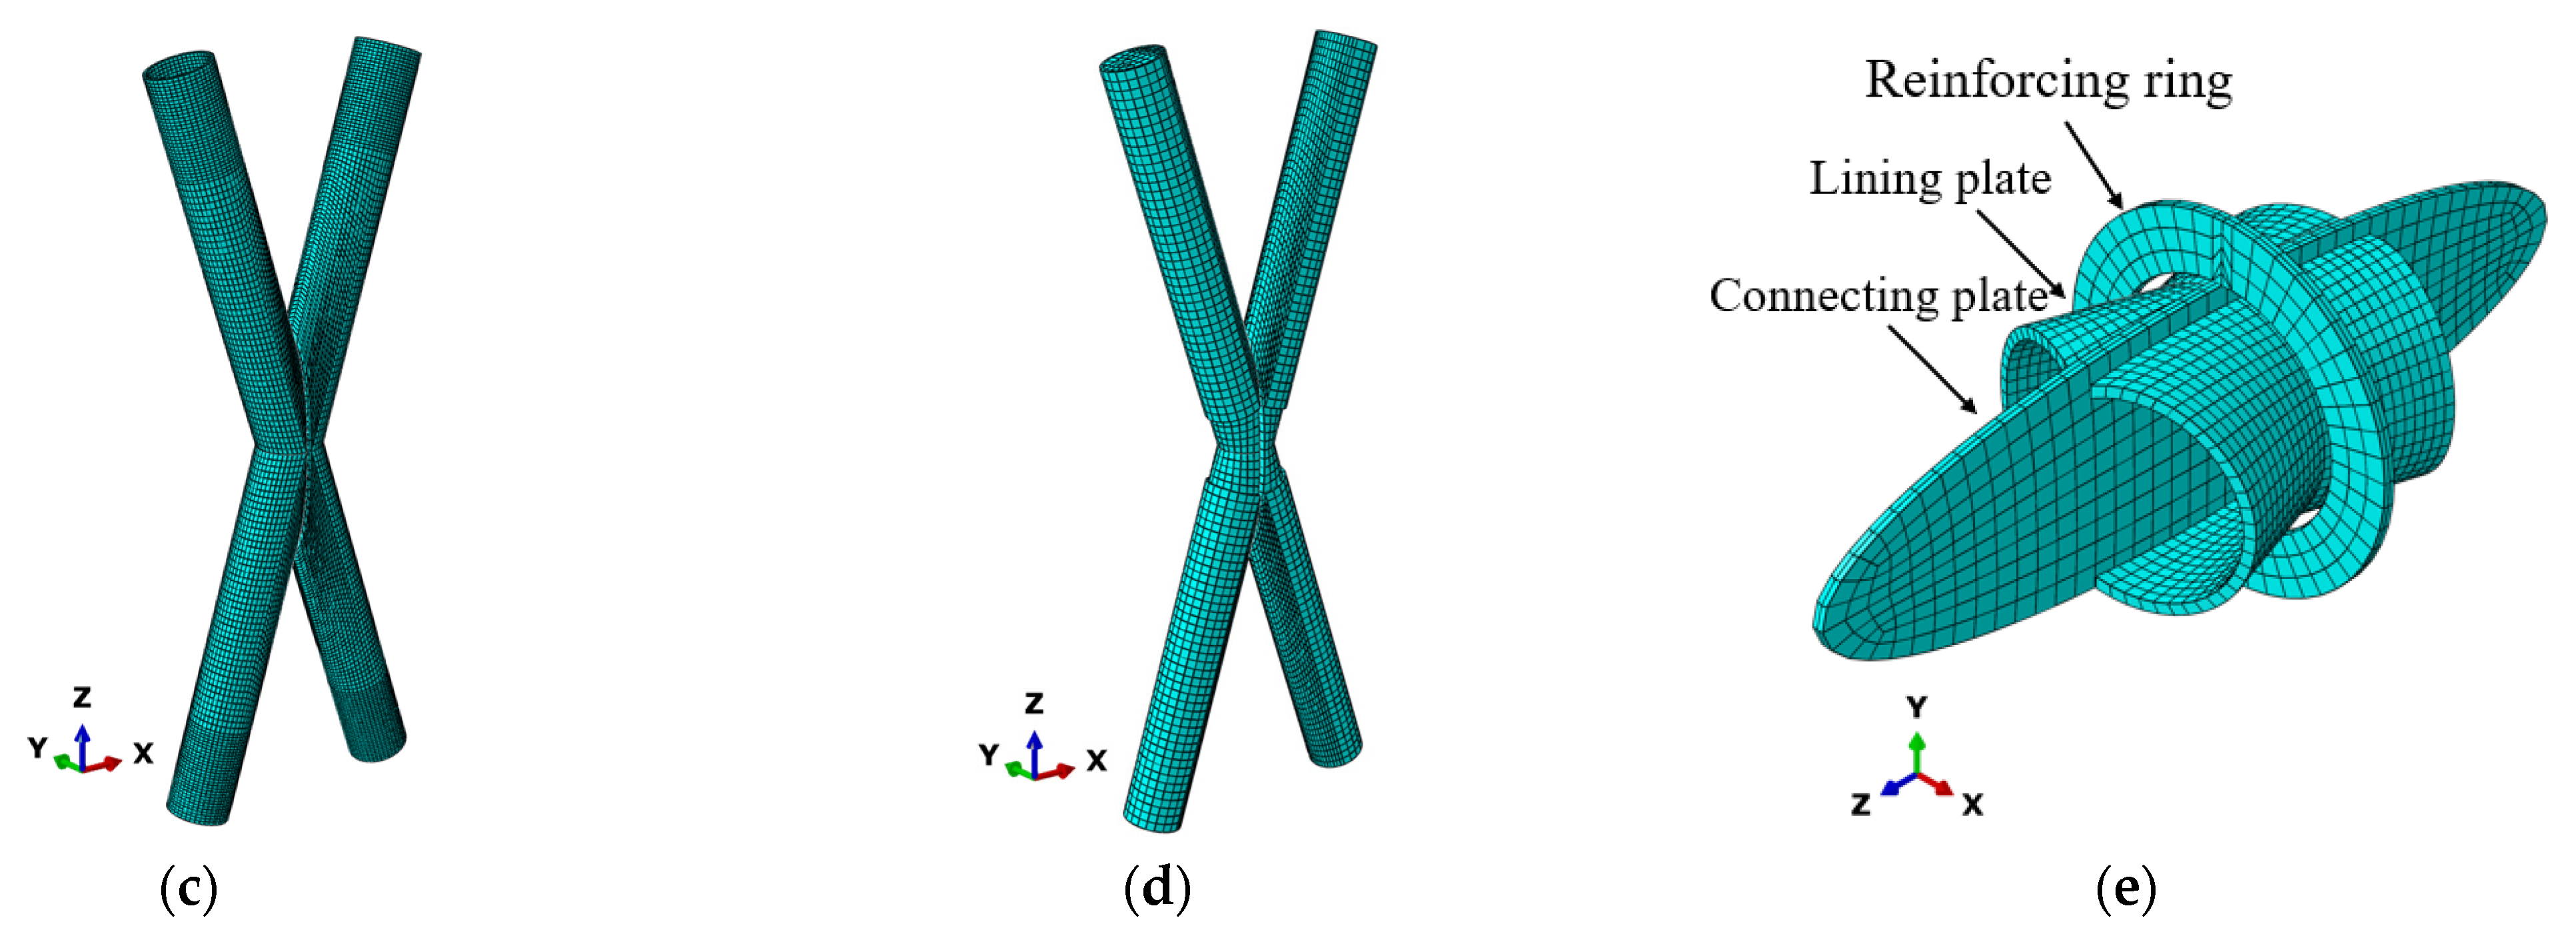
3.1. Model Establishment and Boundary Conditions
3.2. Constitutive Parameters of Material and Cohesive Force Element
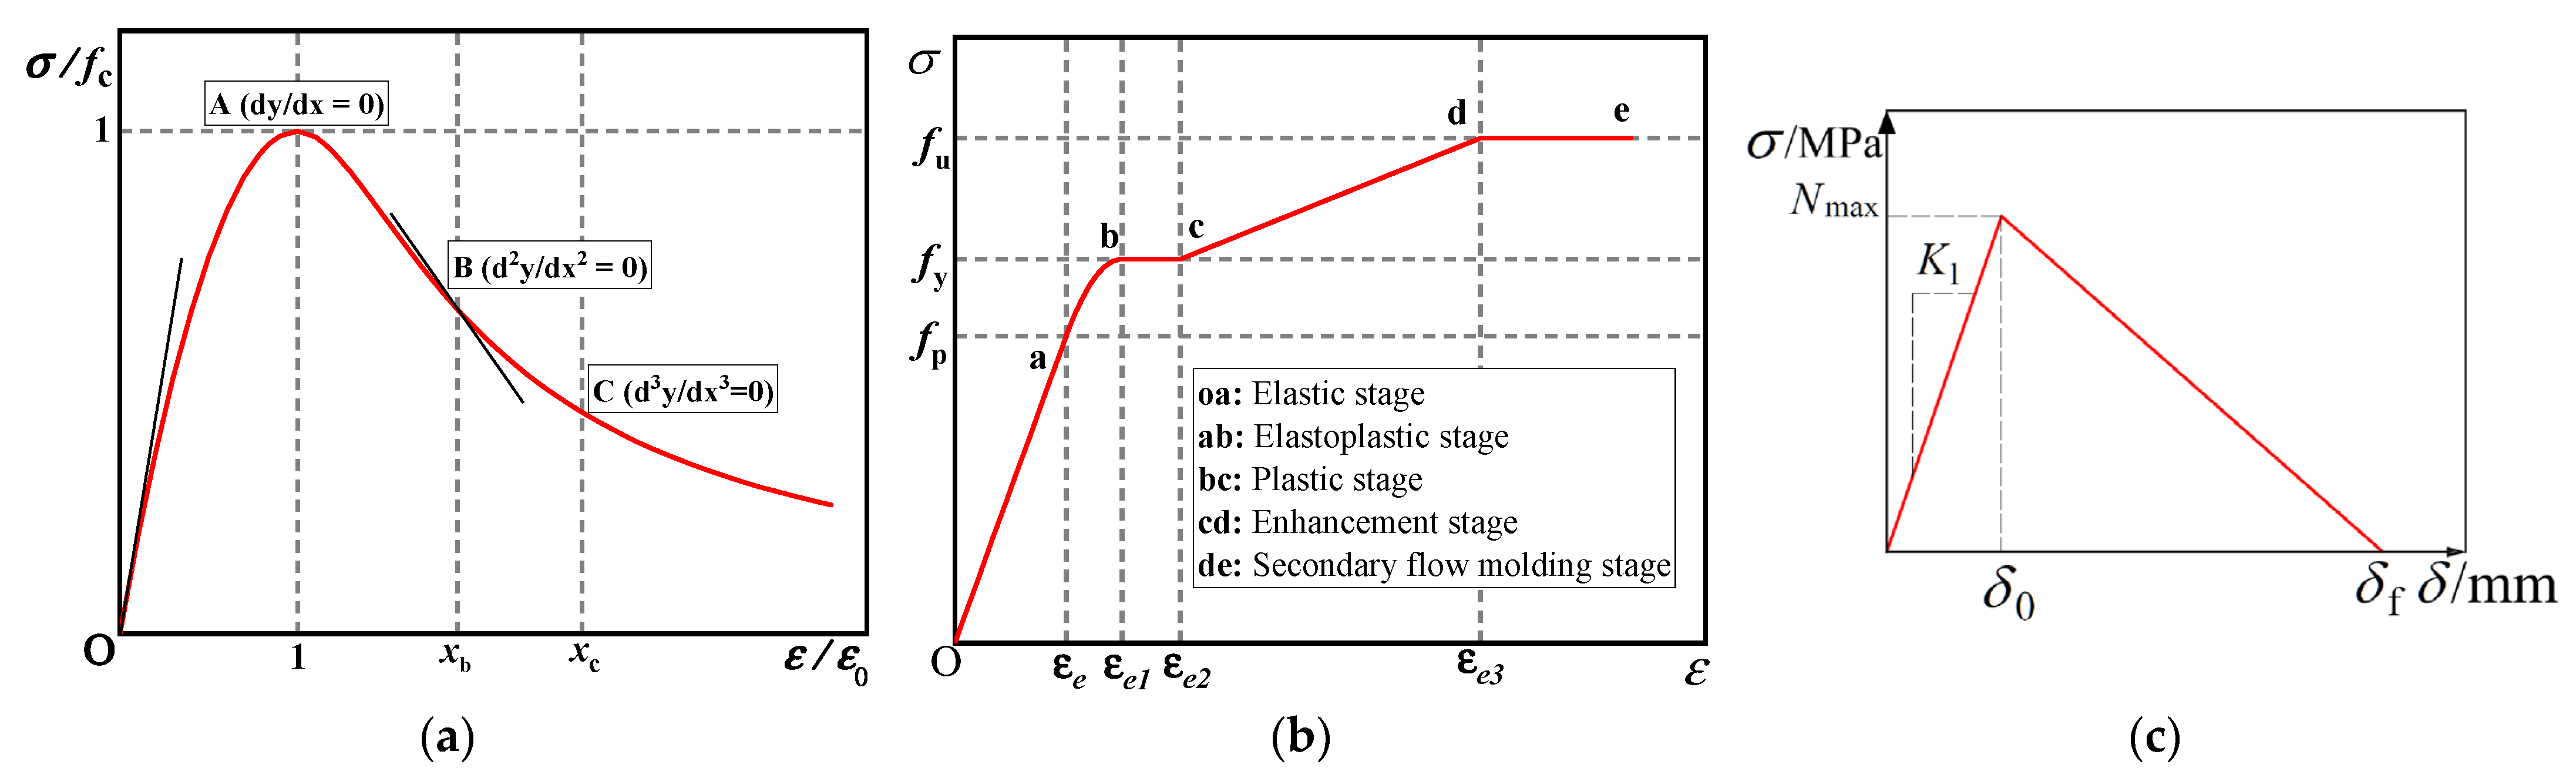
3.2.1. Constitutive Model of Recycled Concrete
3.2.2. Steel Constitutive Relation
3.2.3. Cohesive Constitutive Model
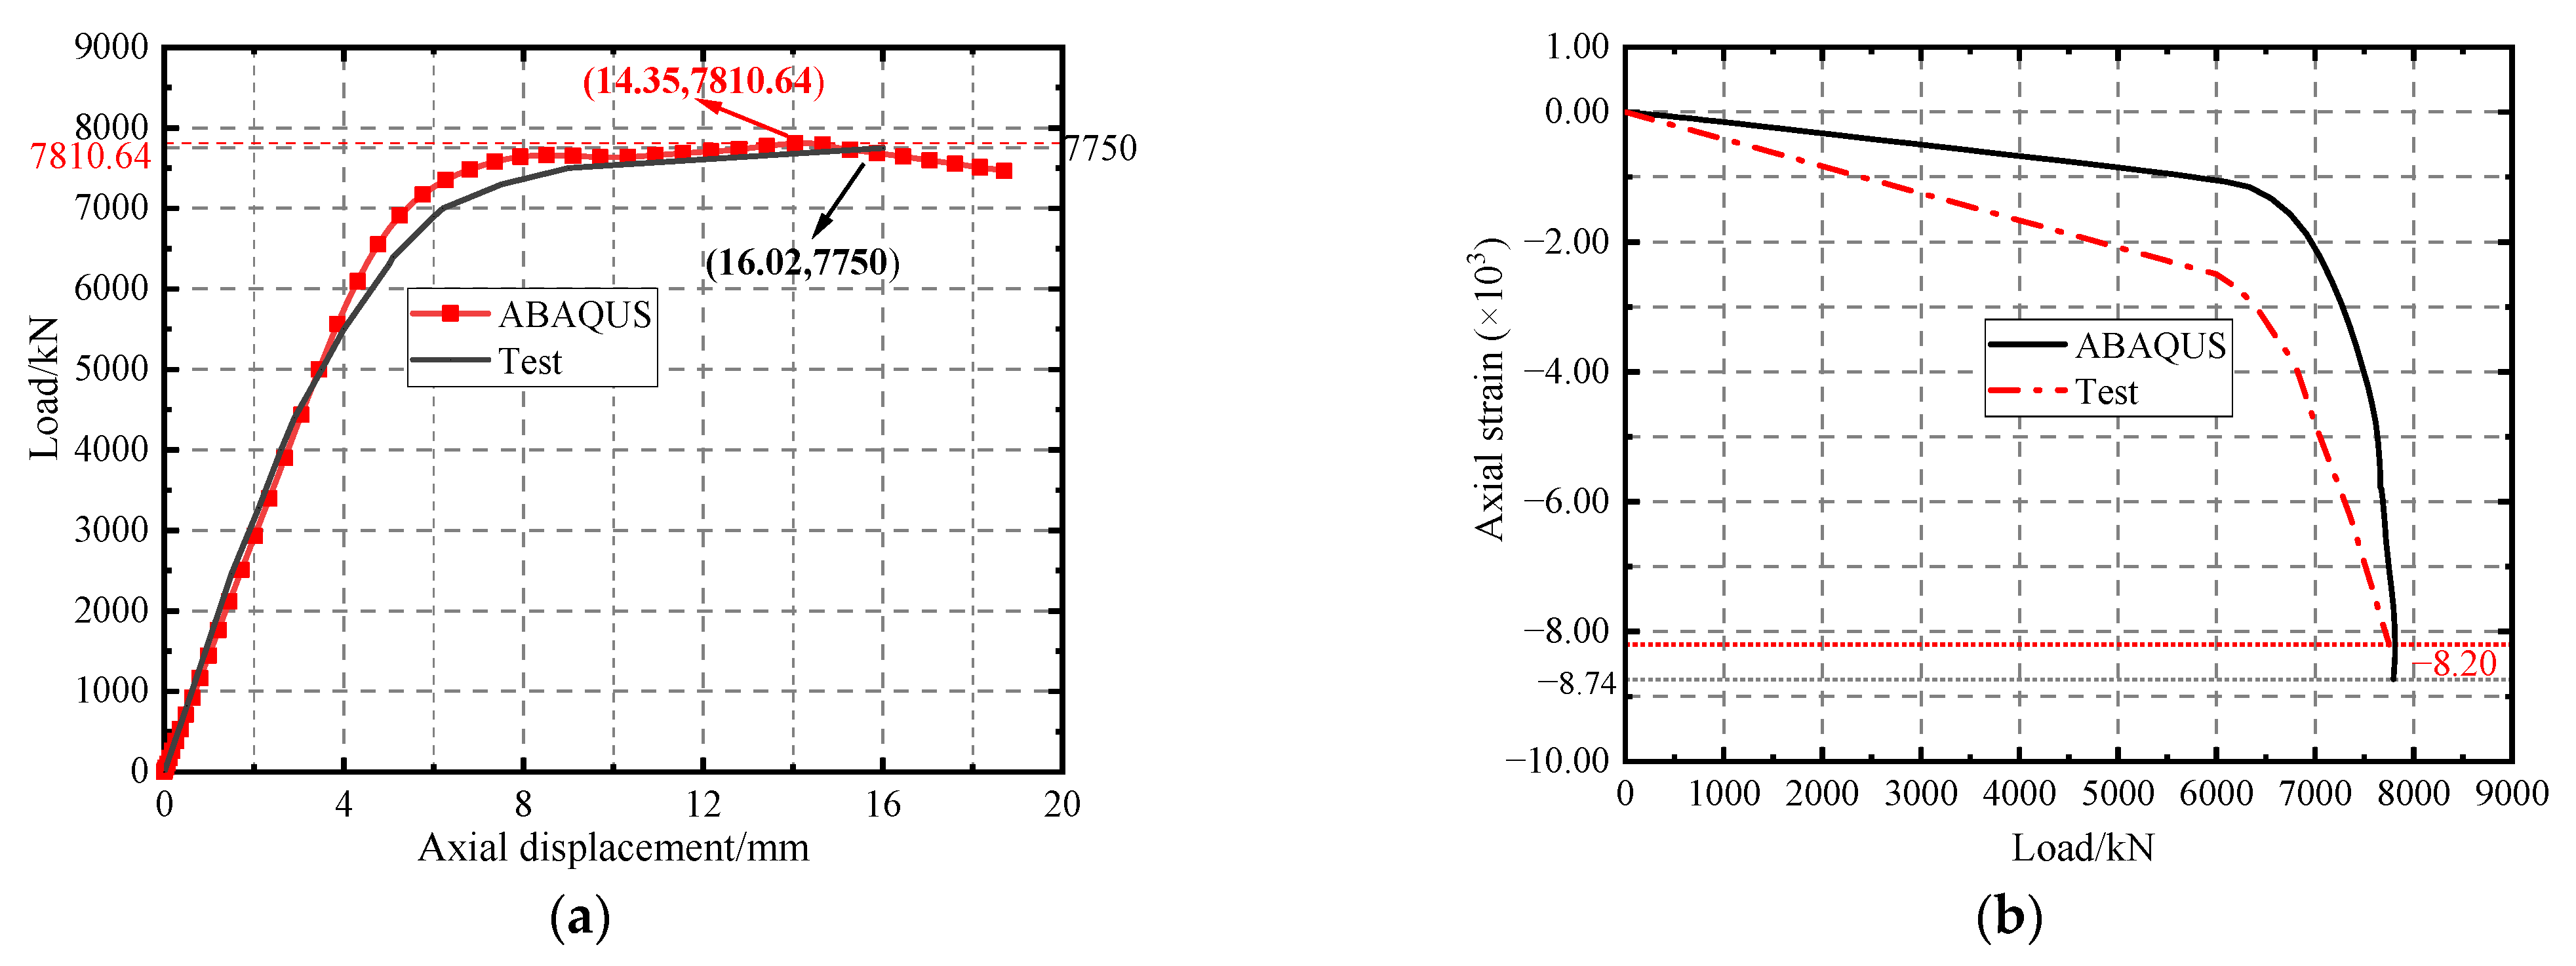
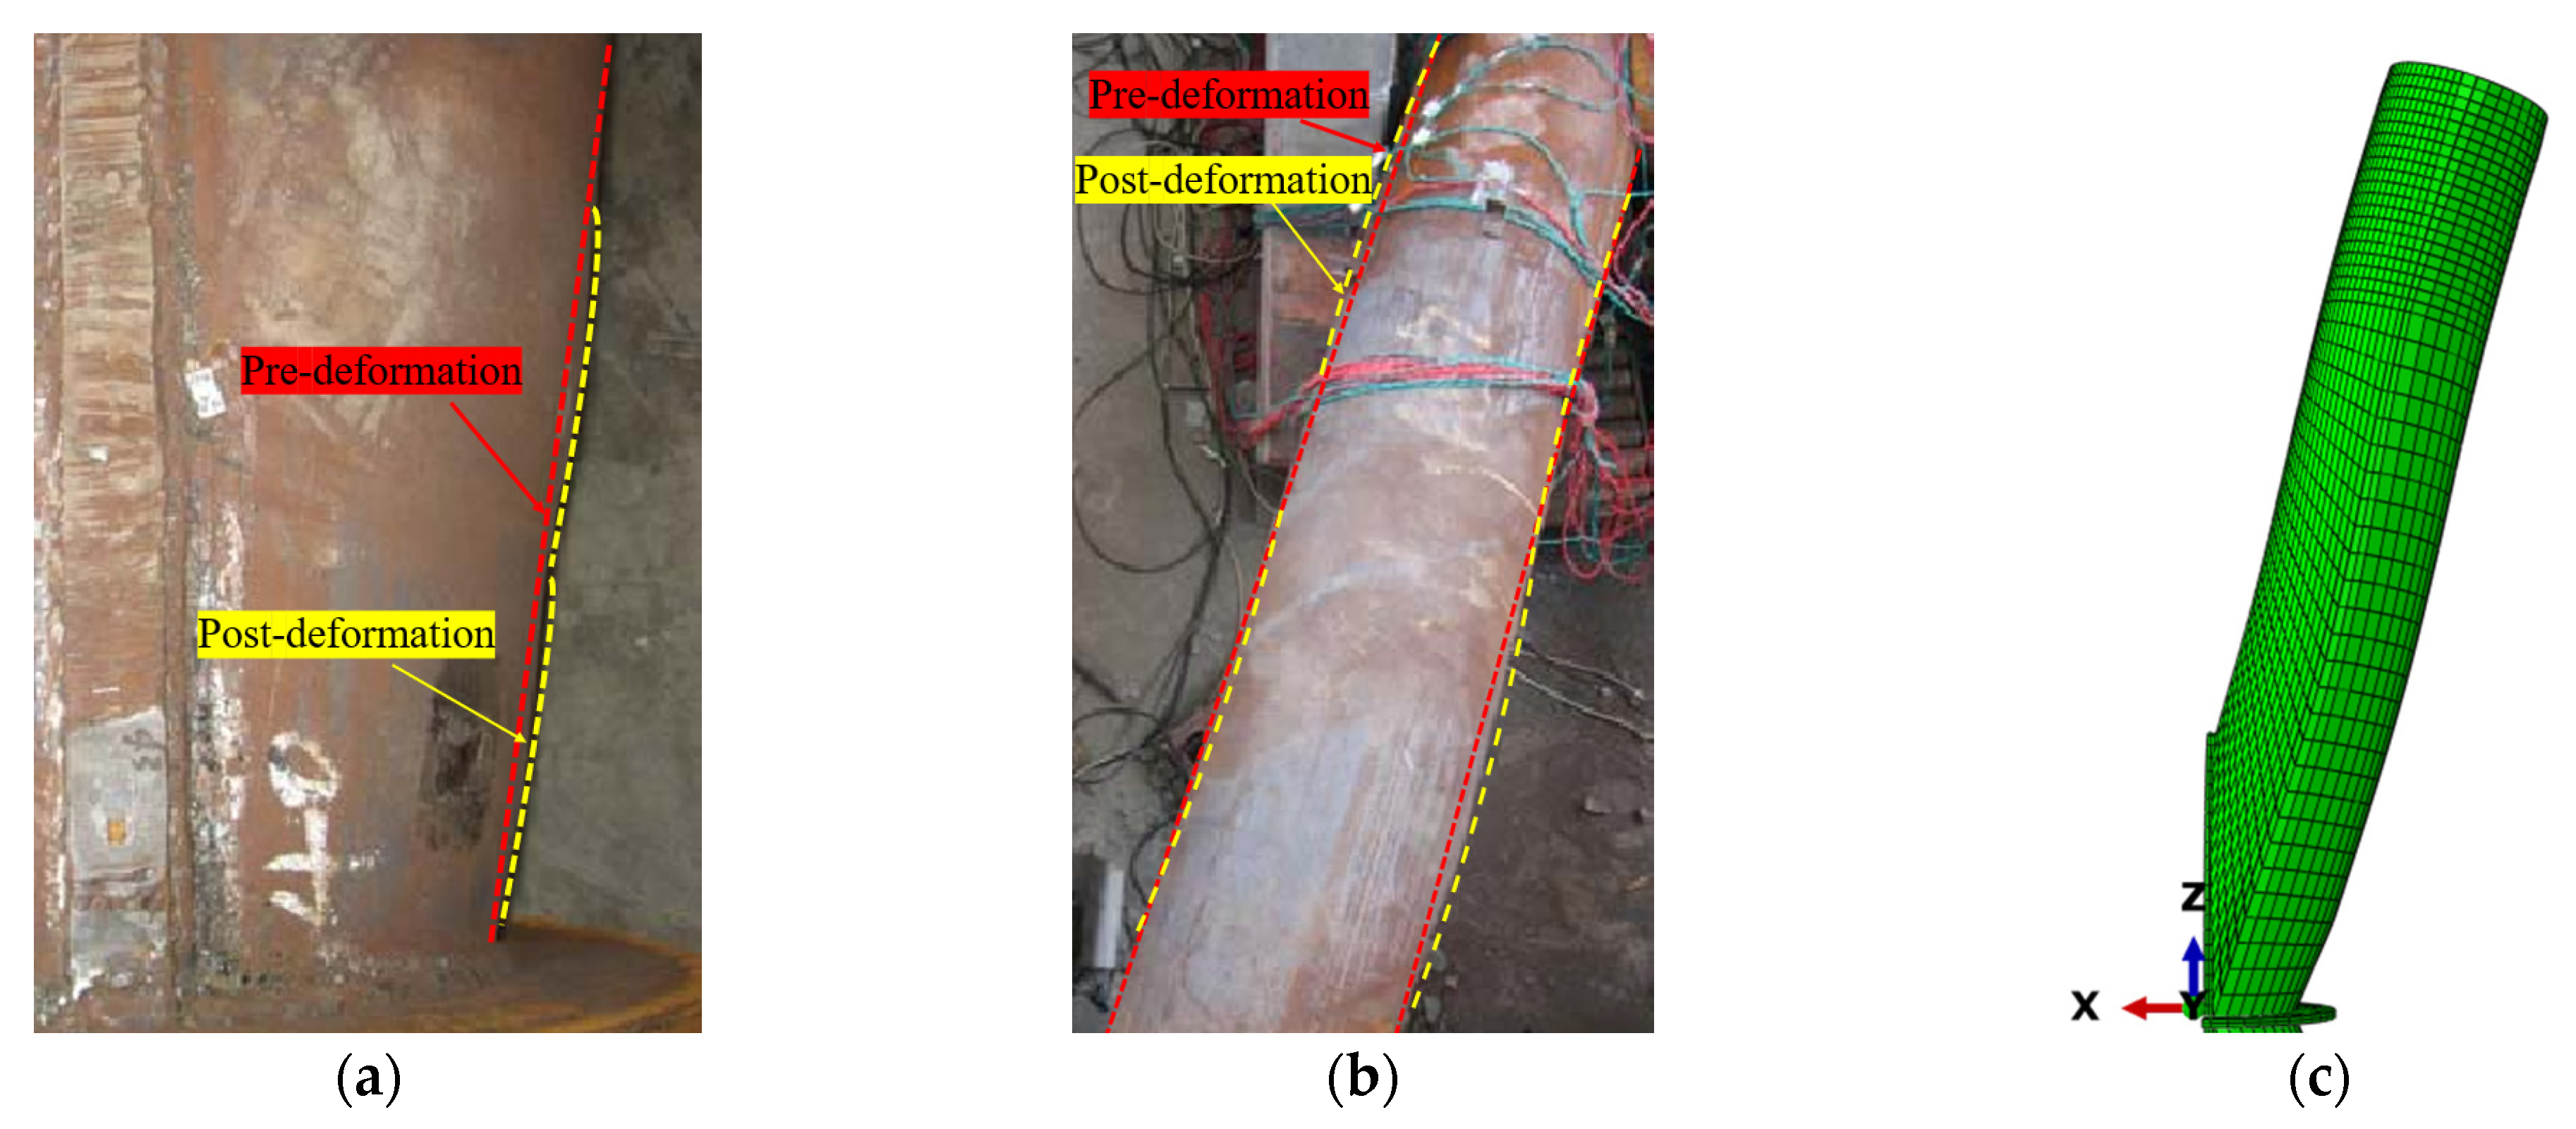
3.3. Reliability Verification of Finite Element Model
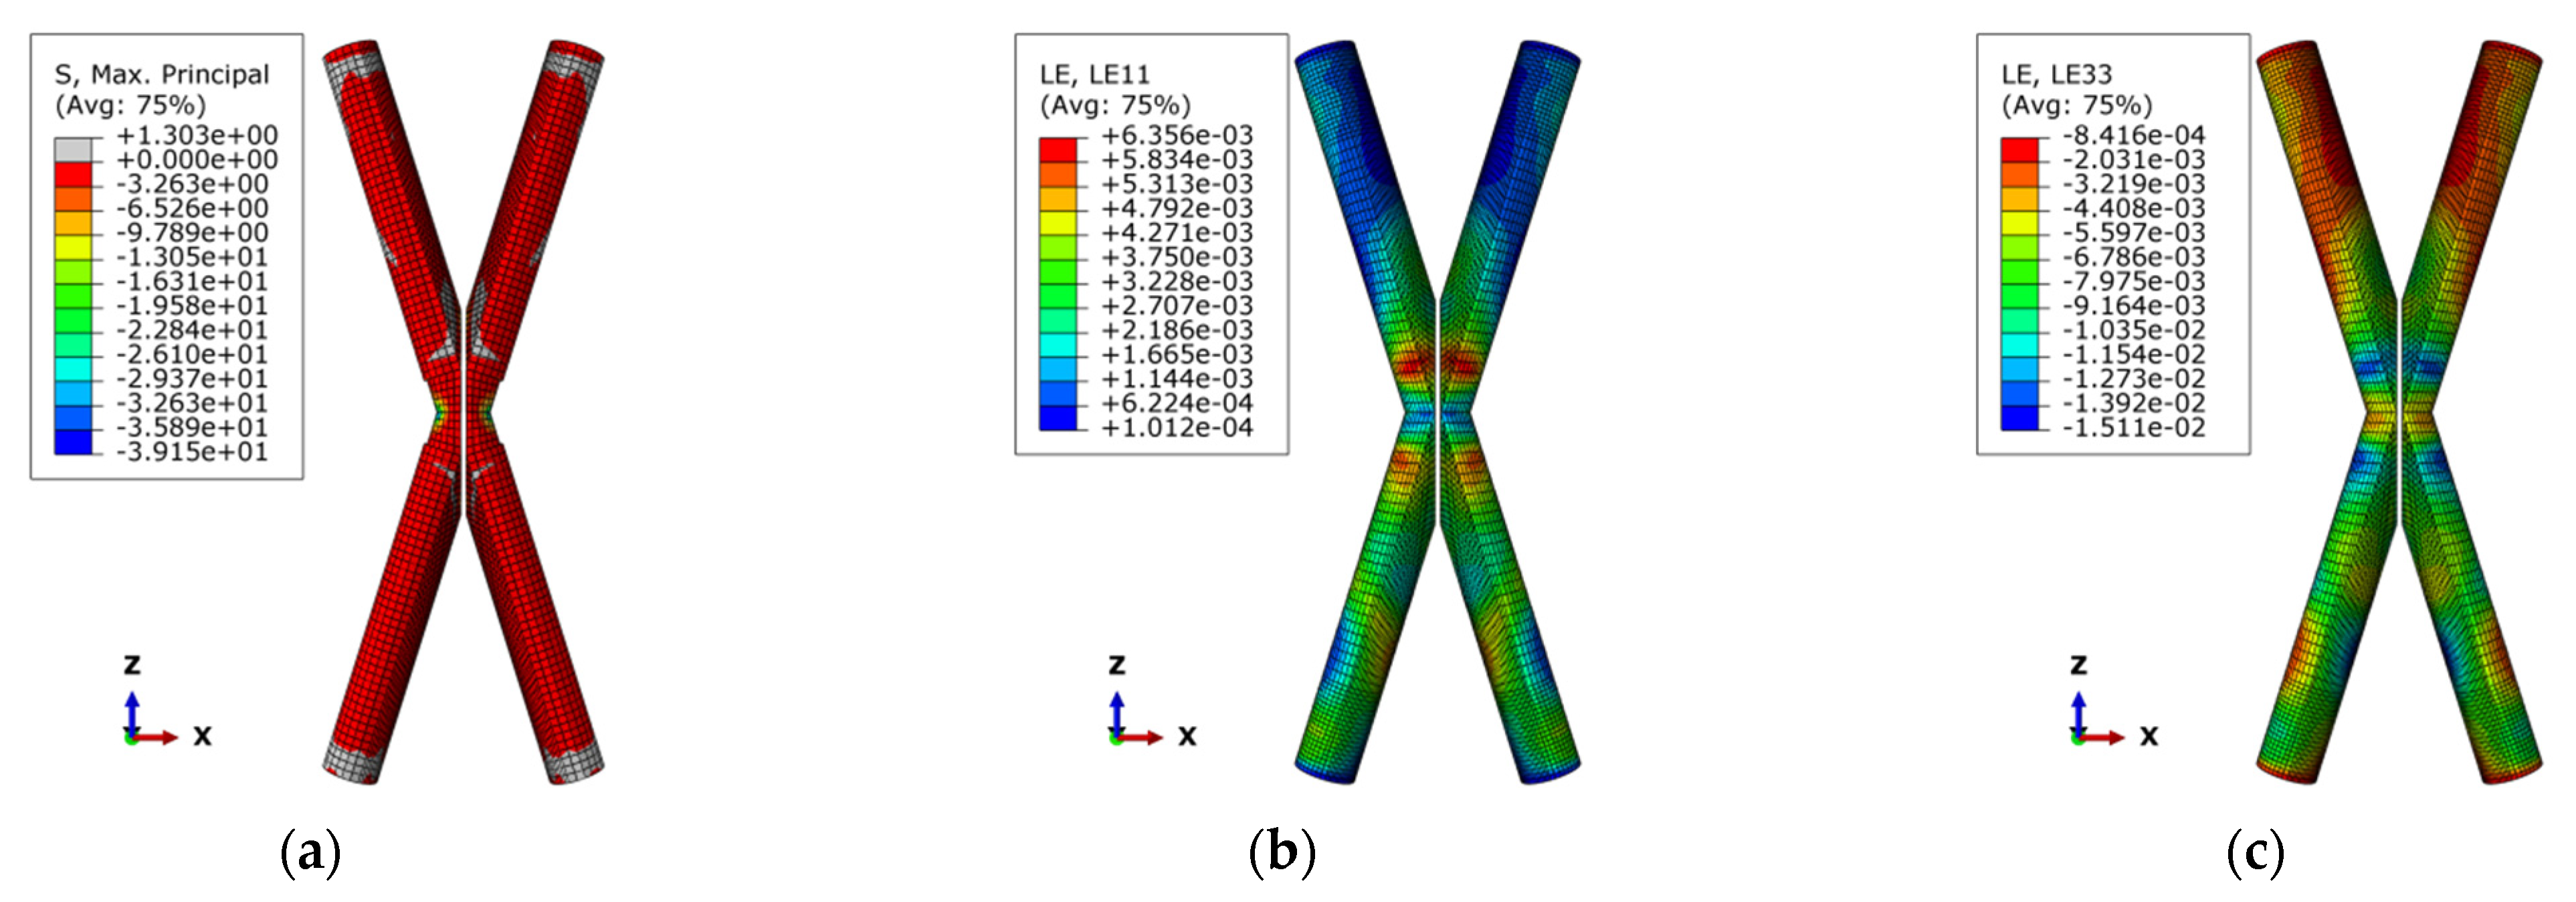
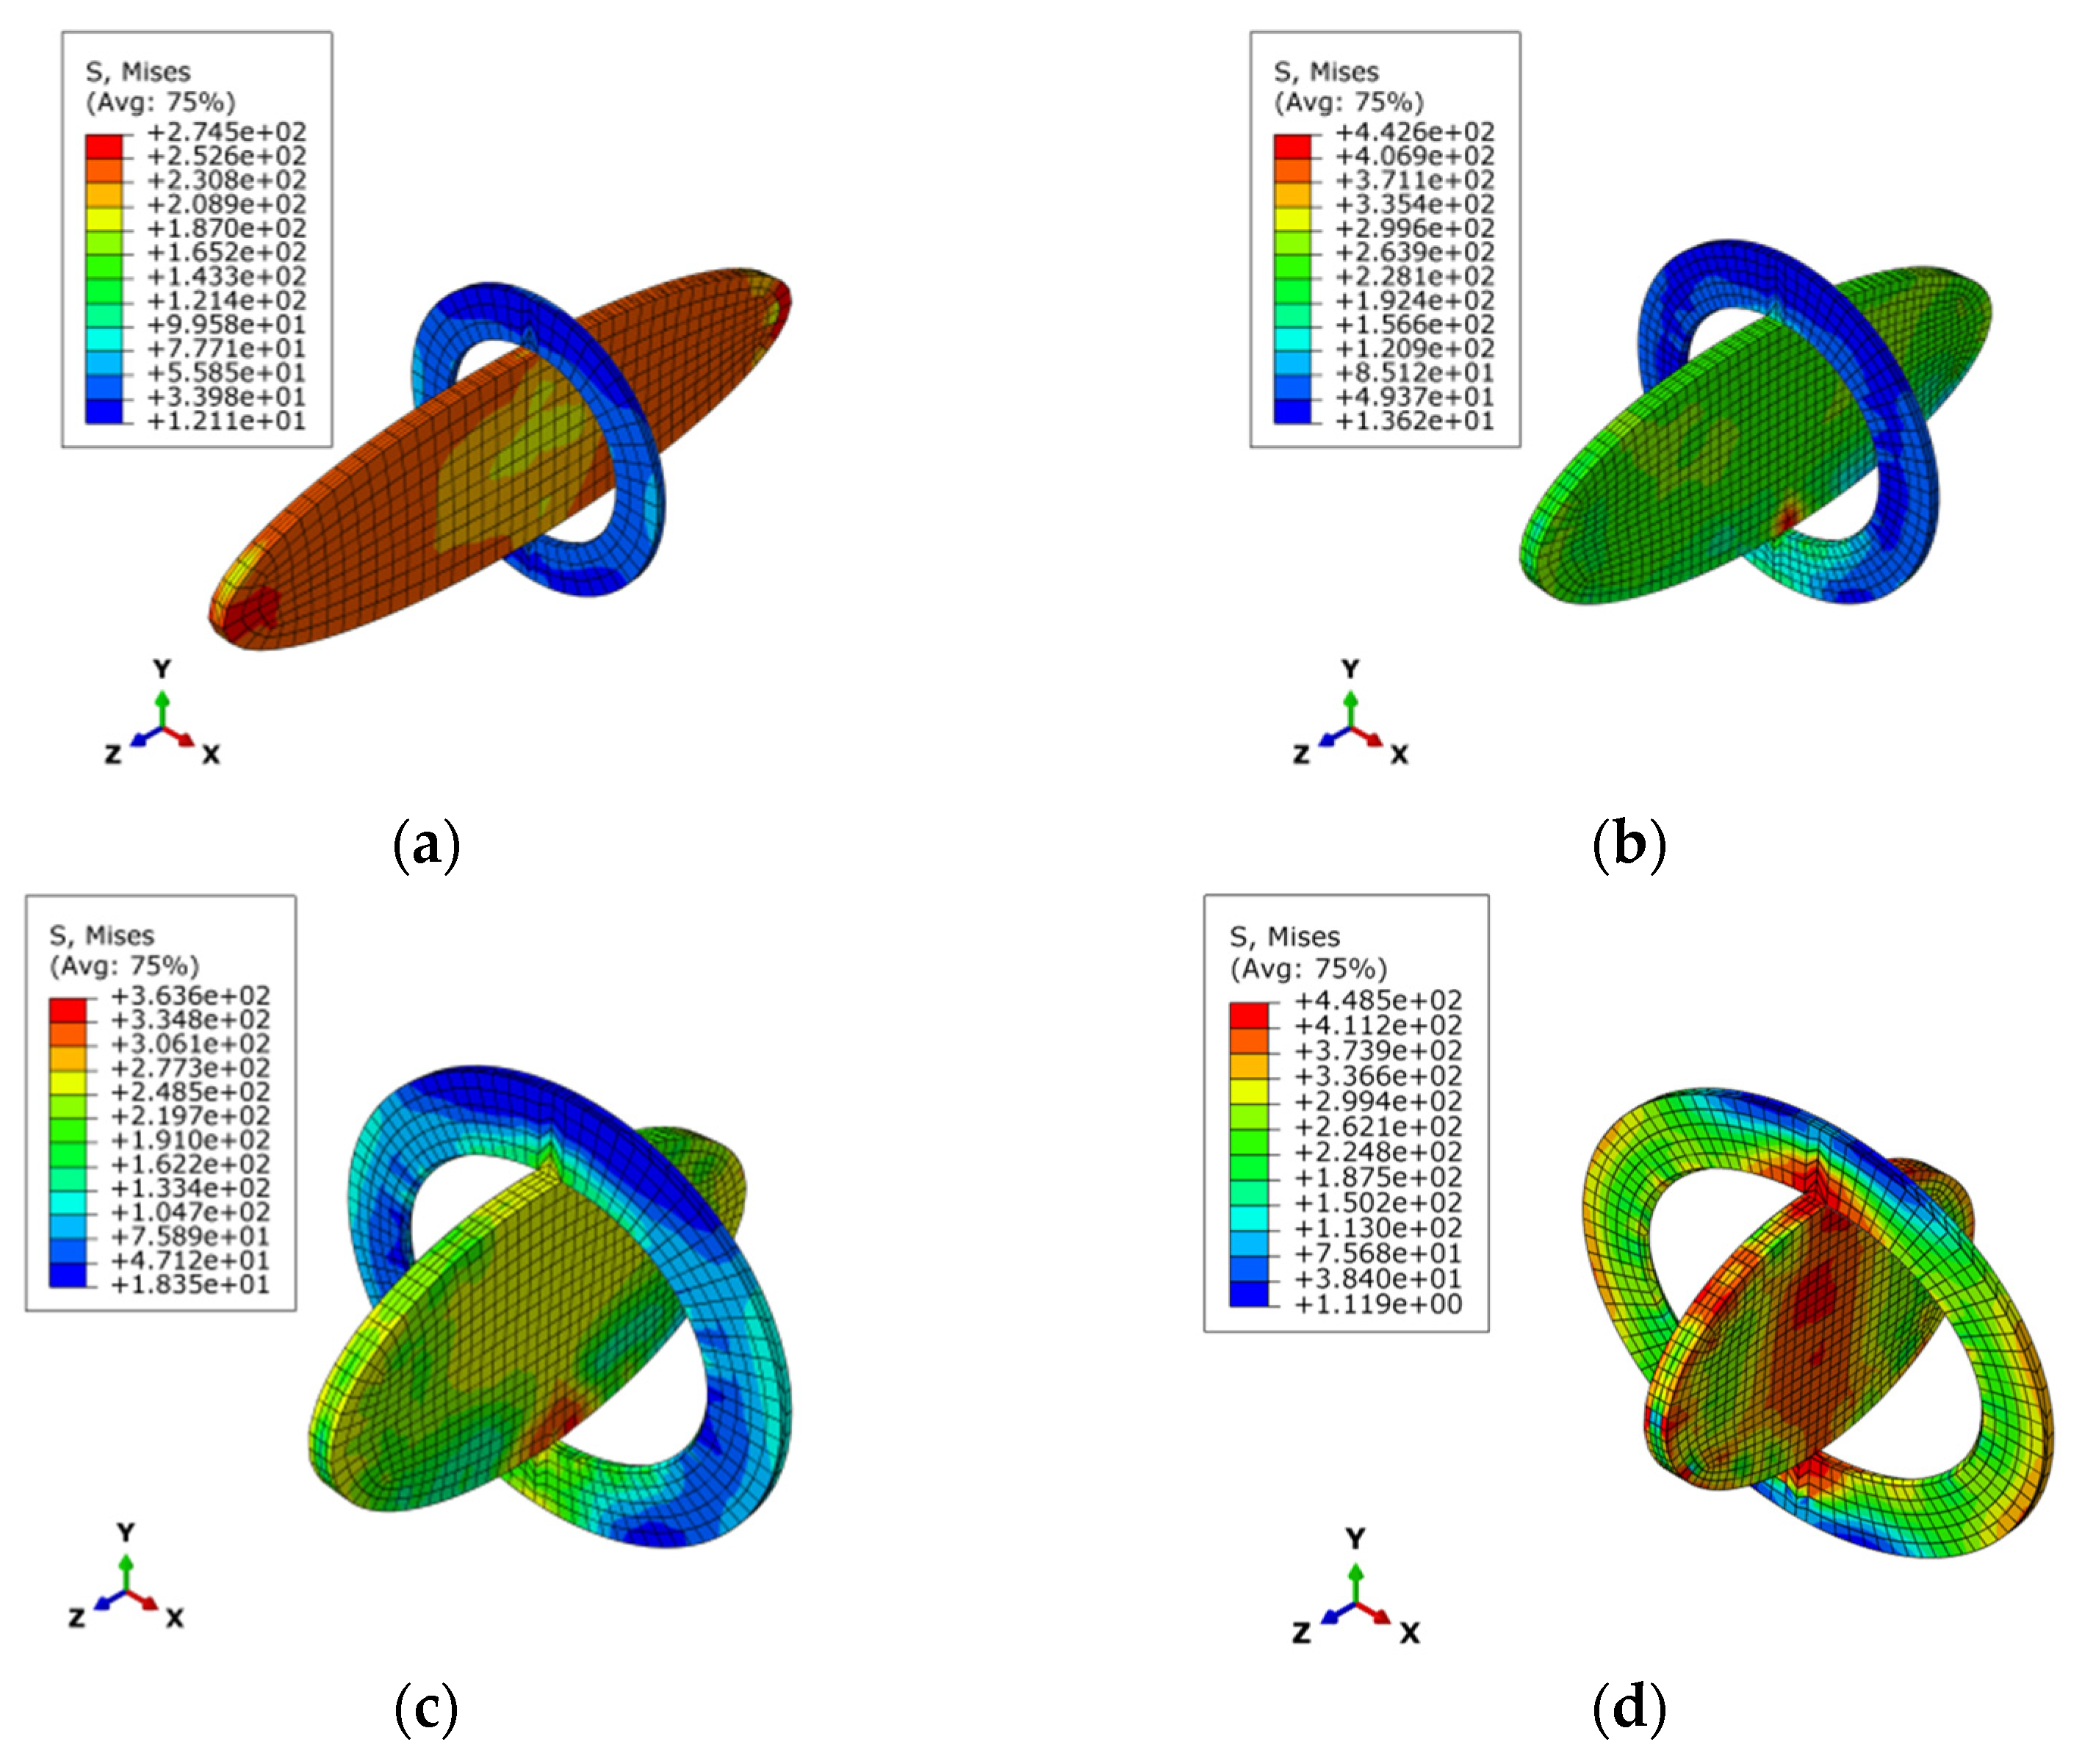
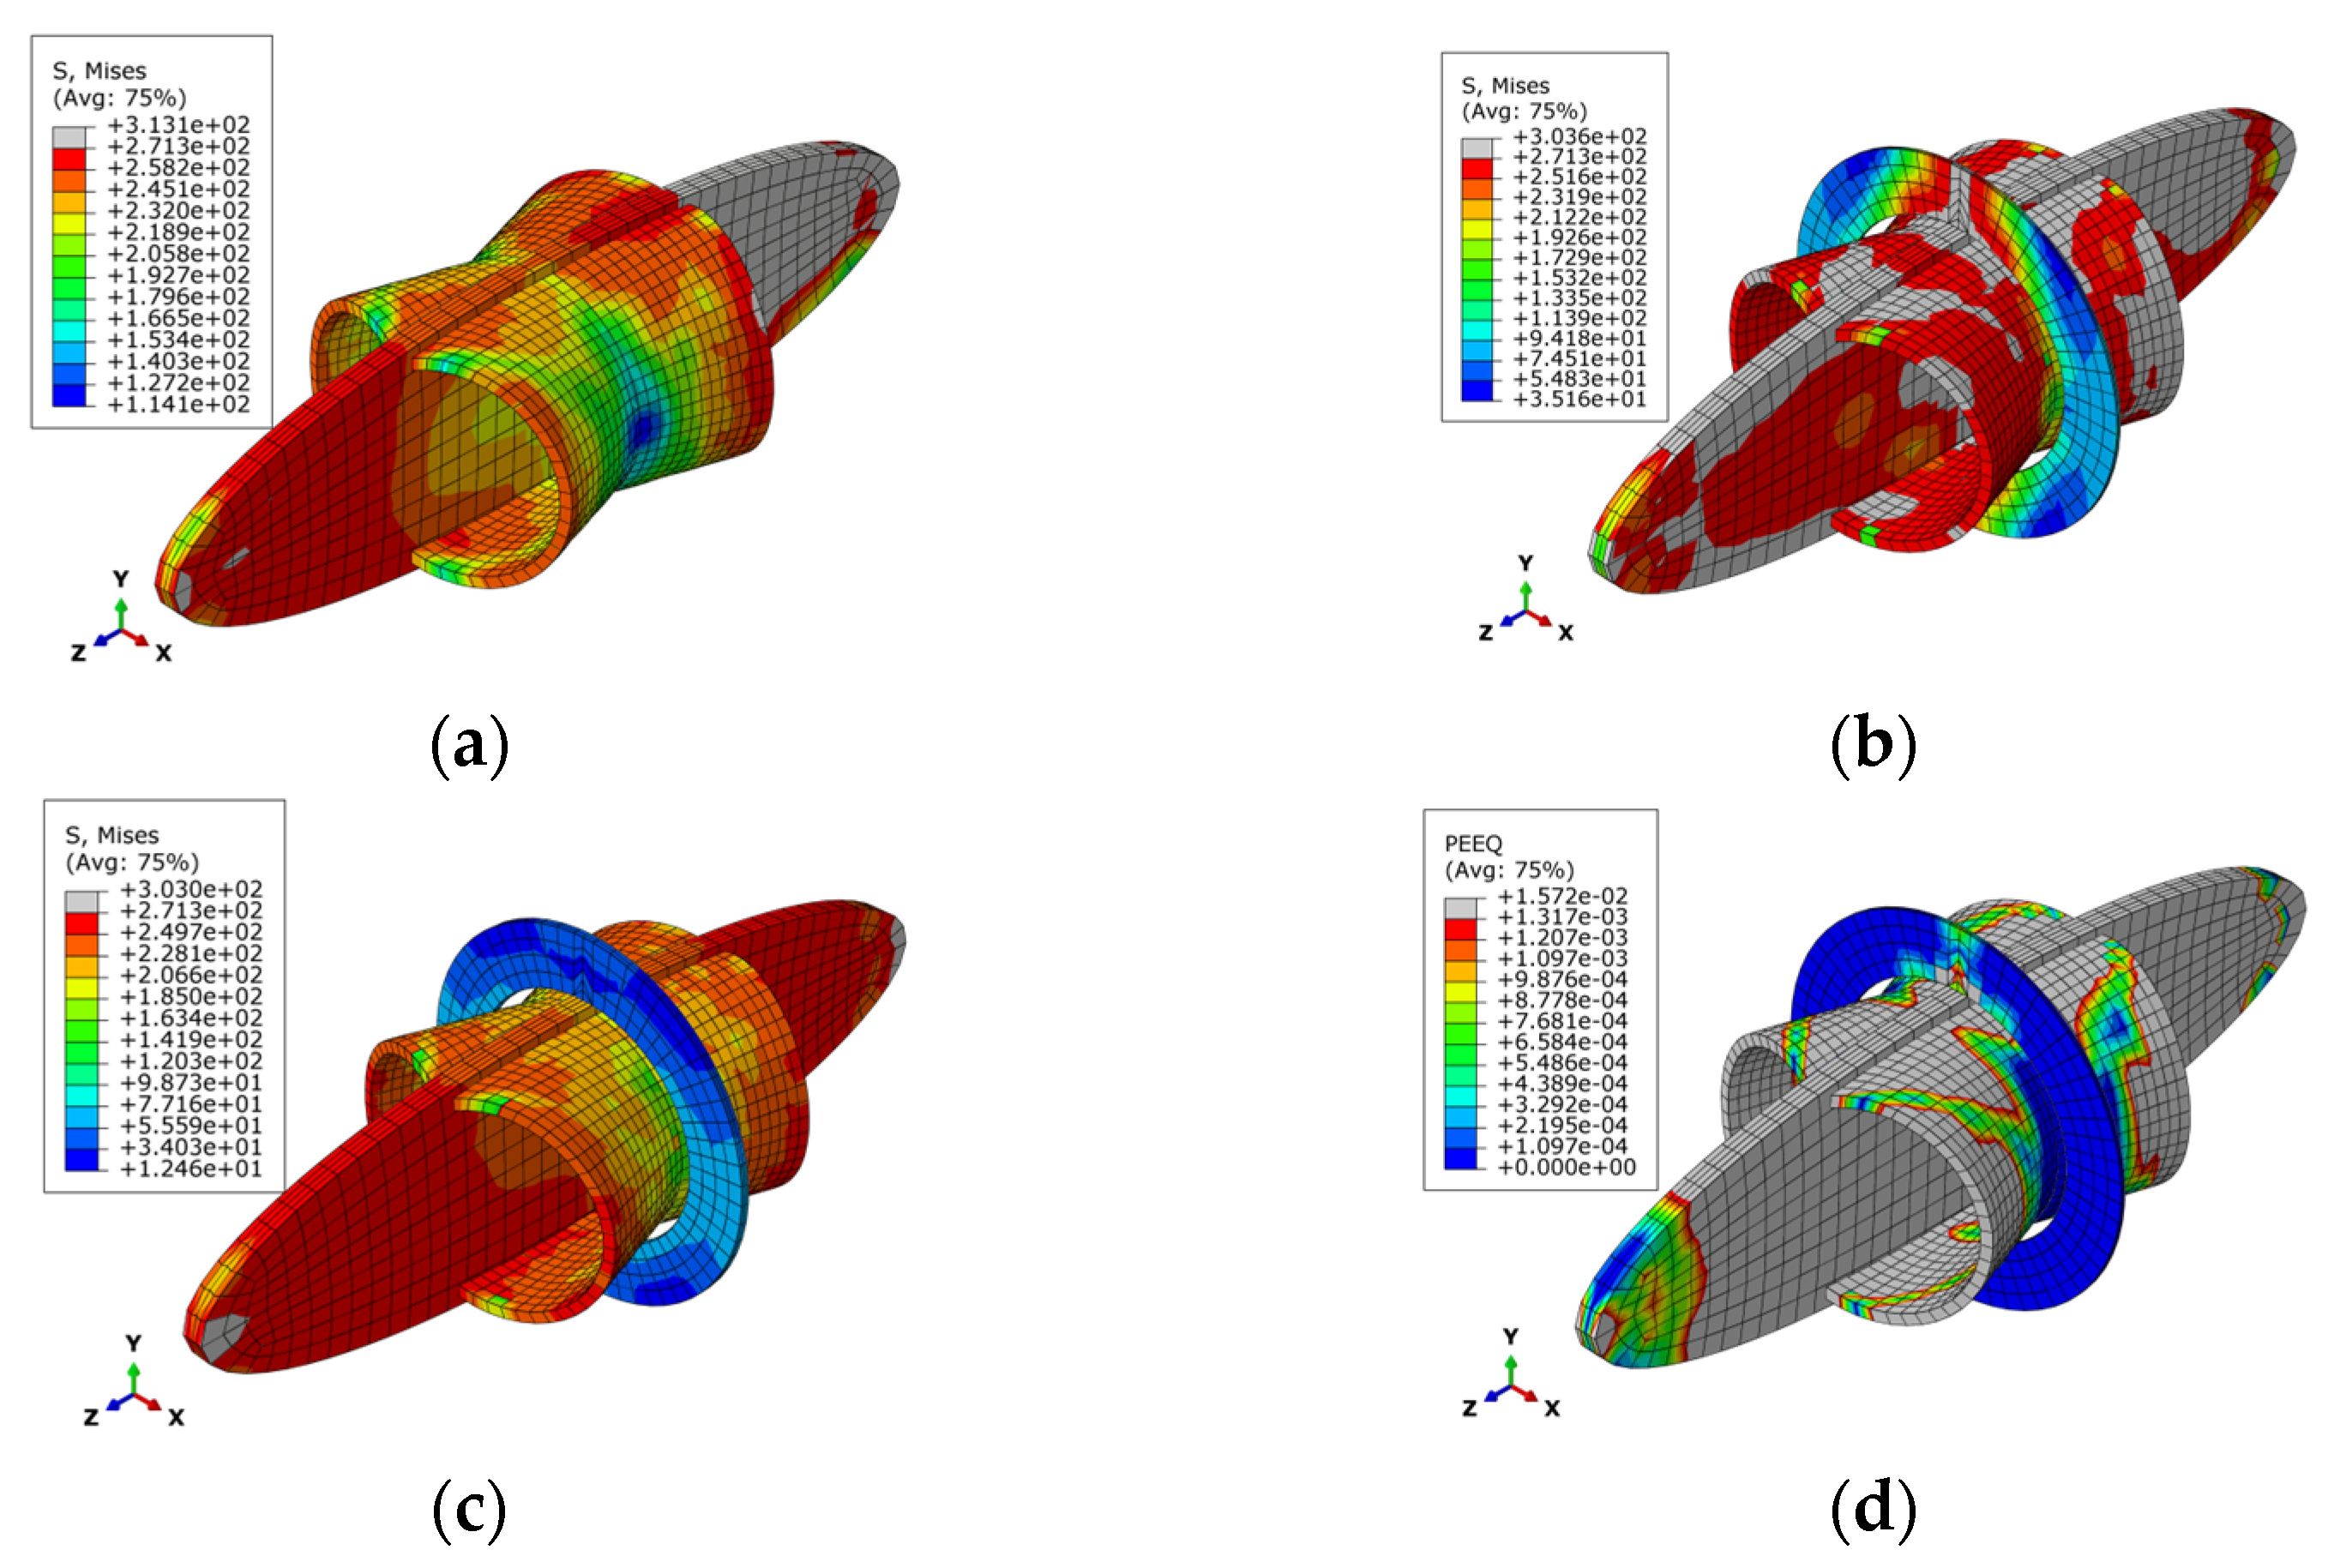
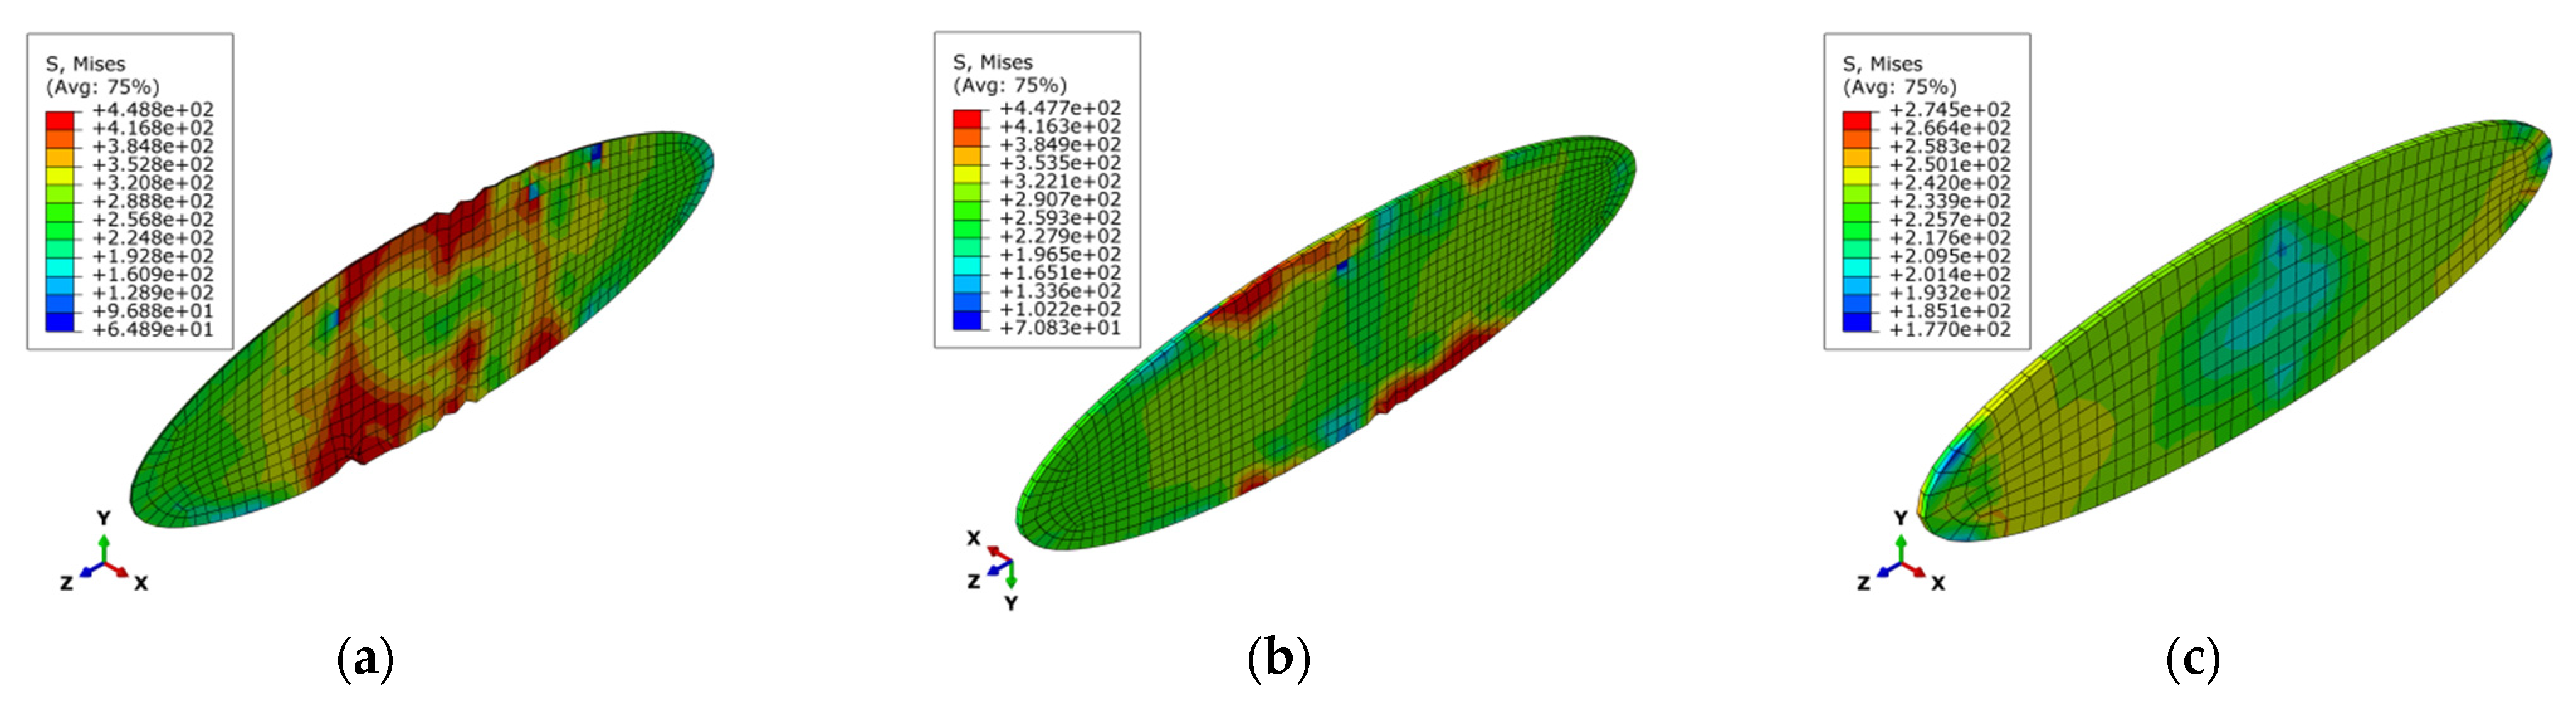
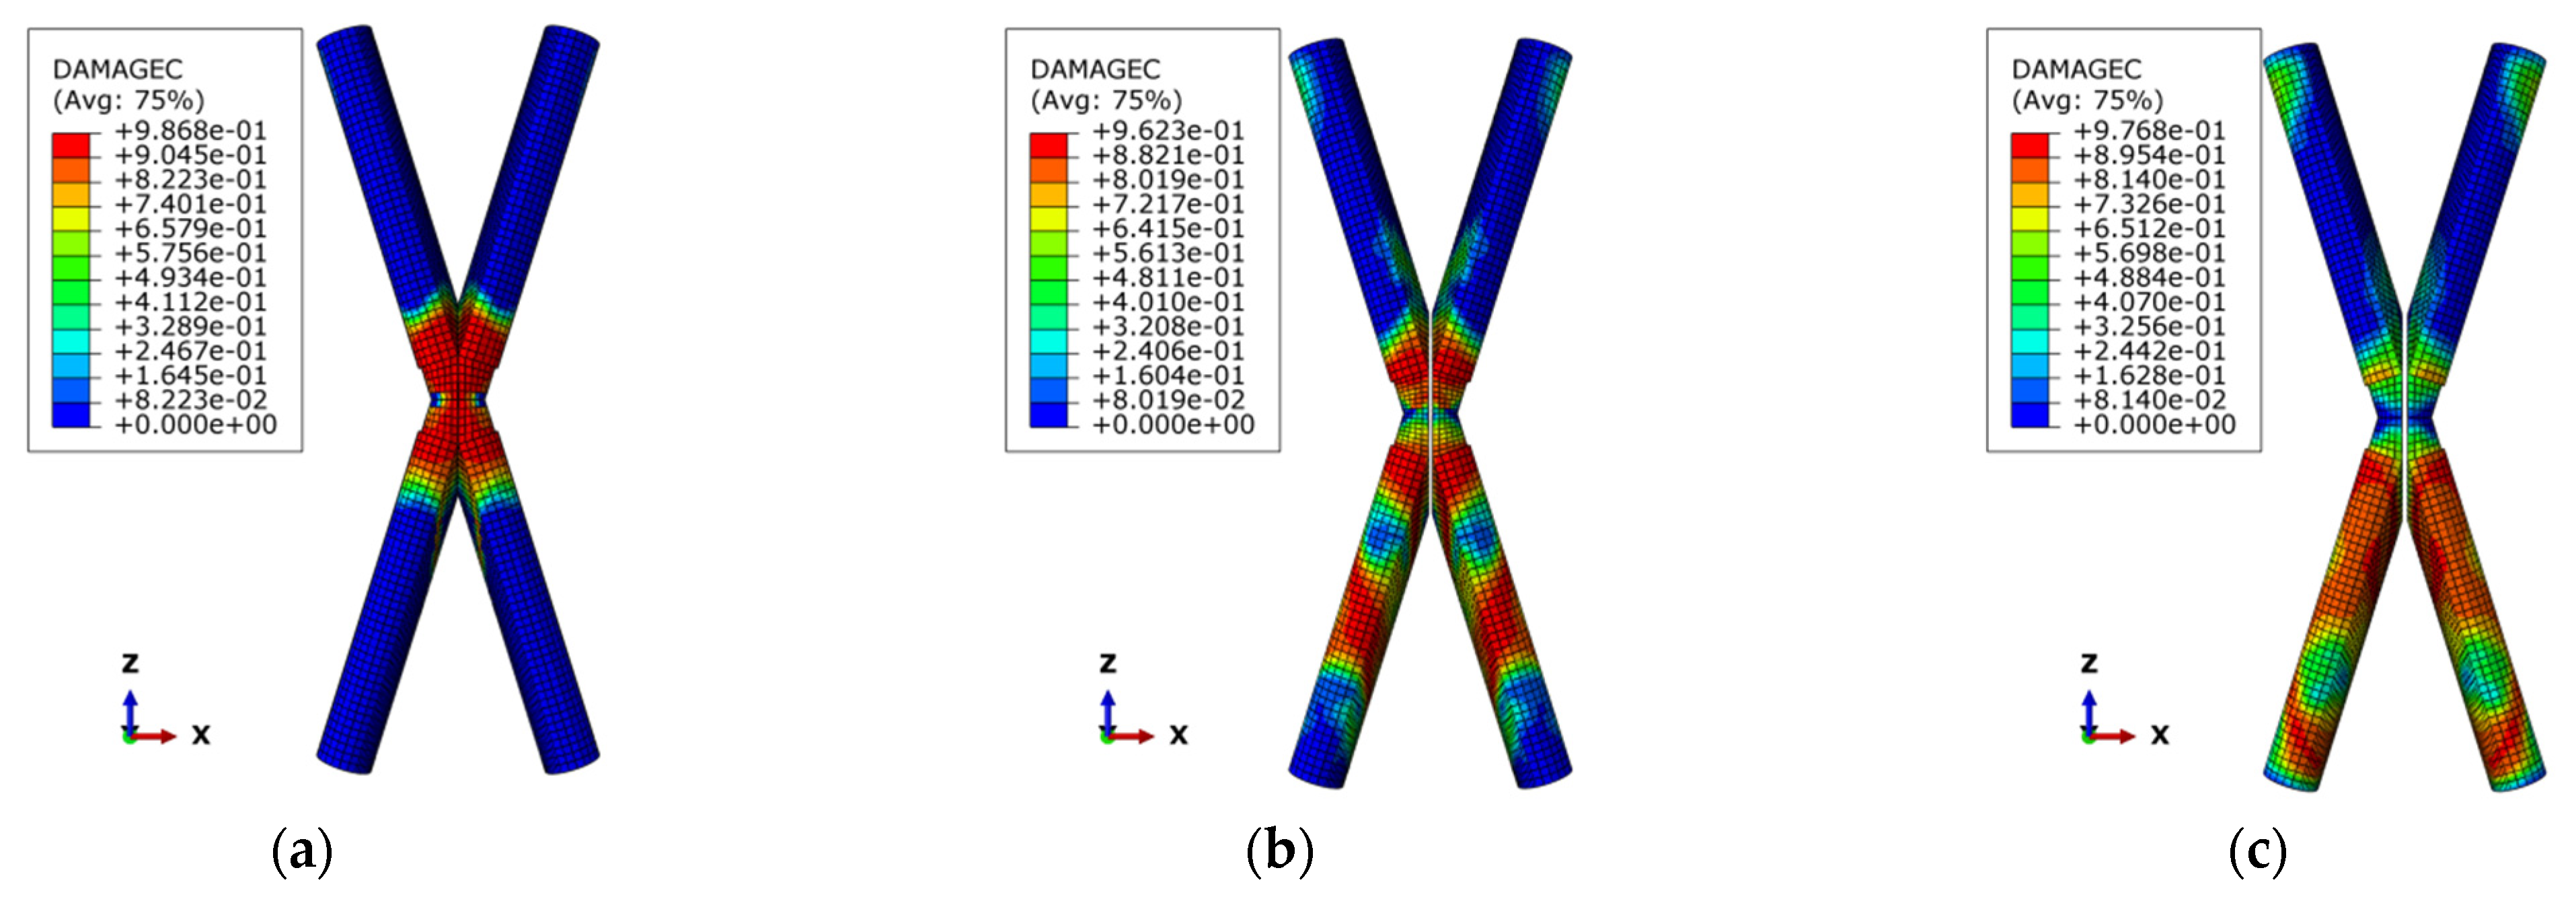
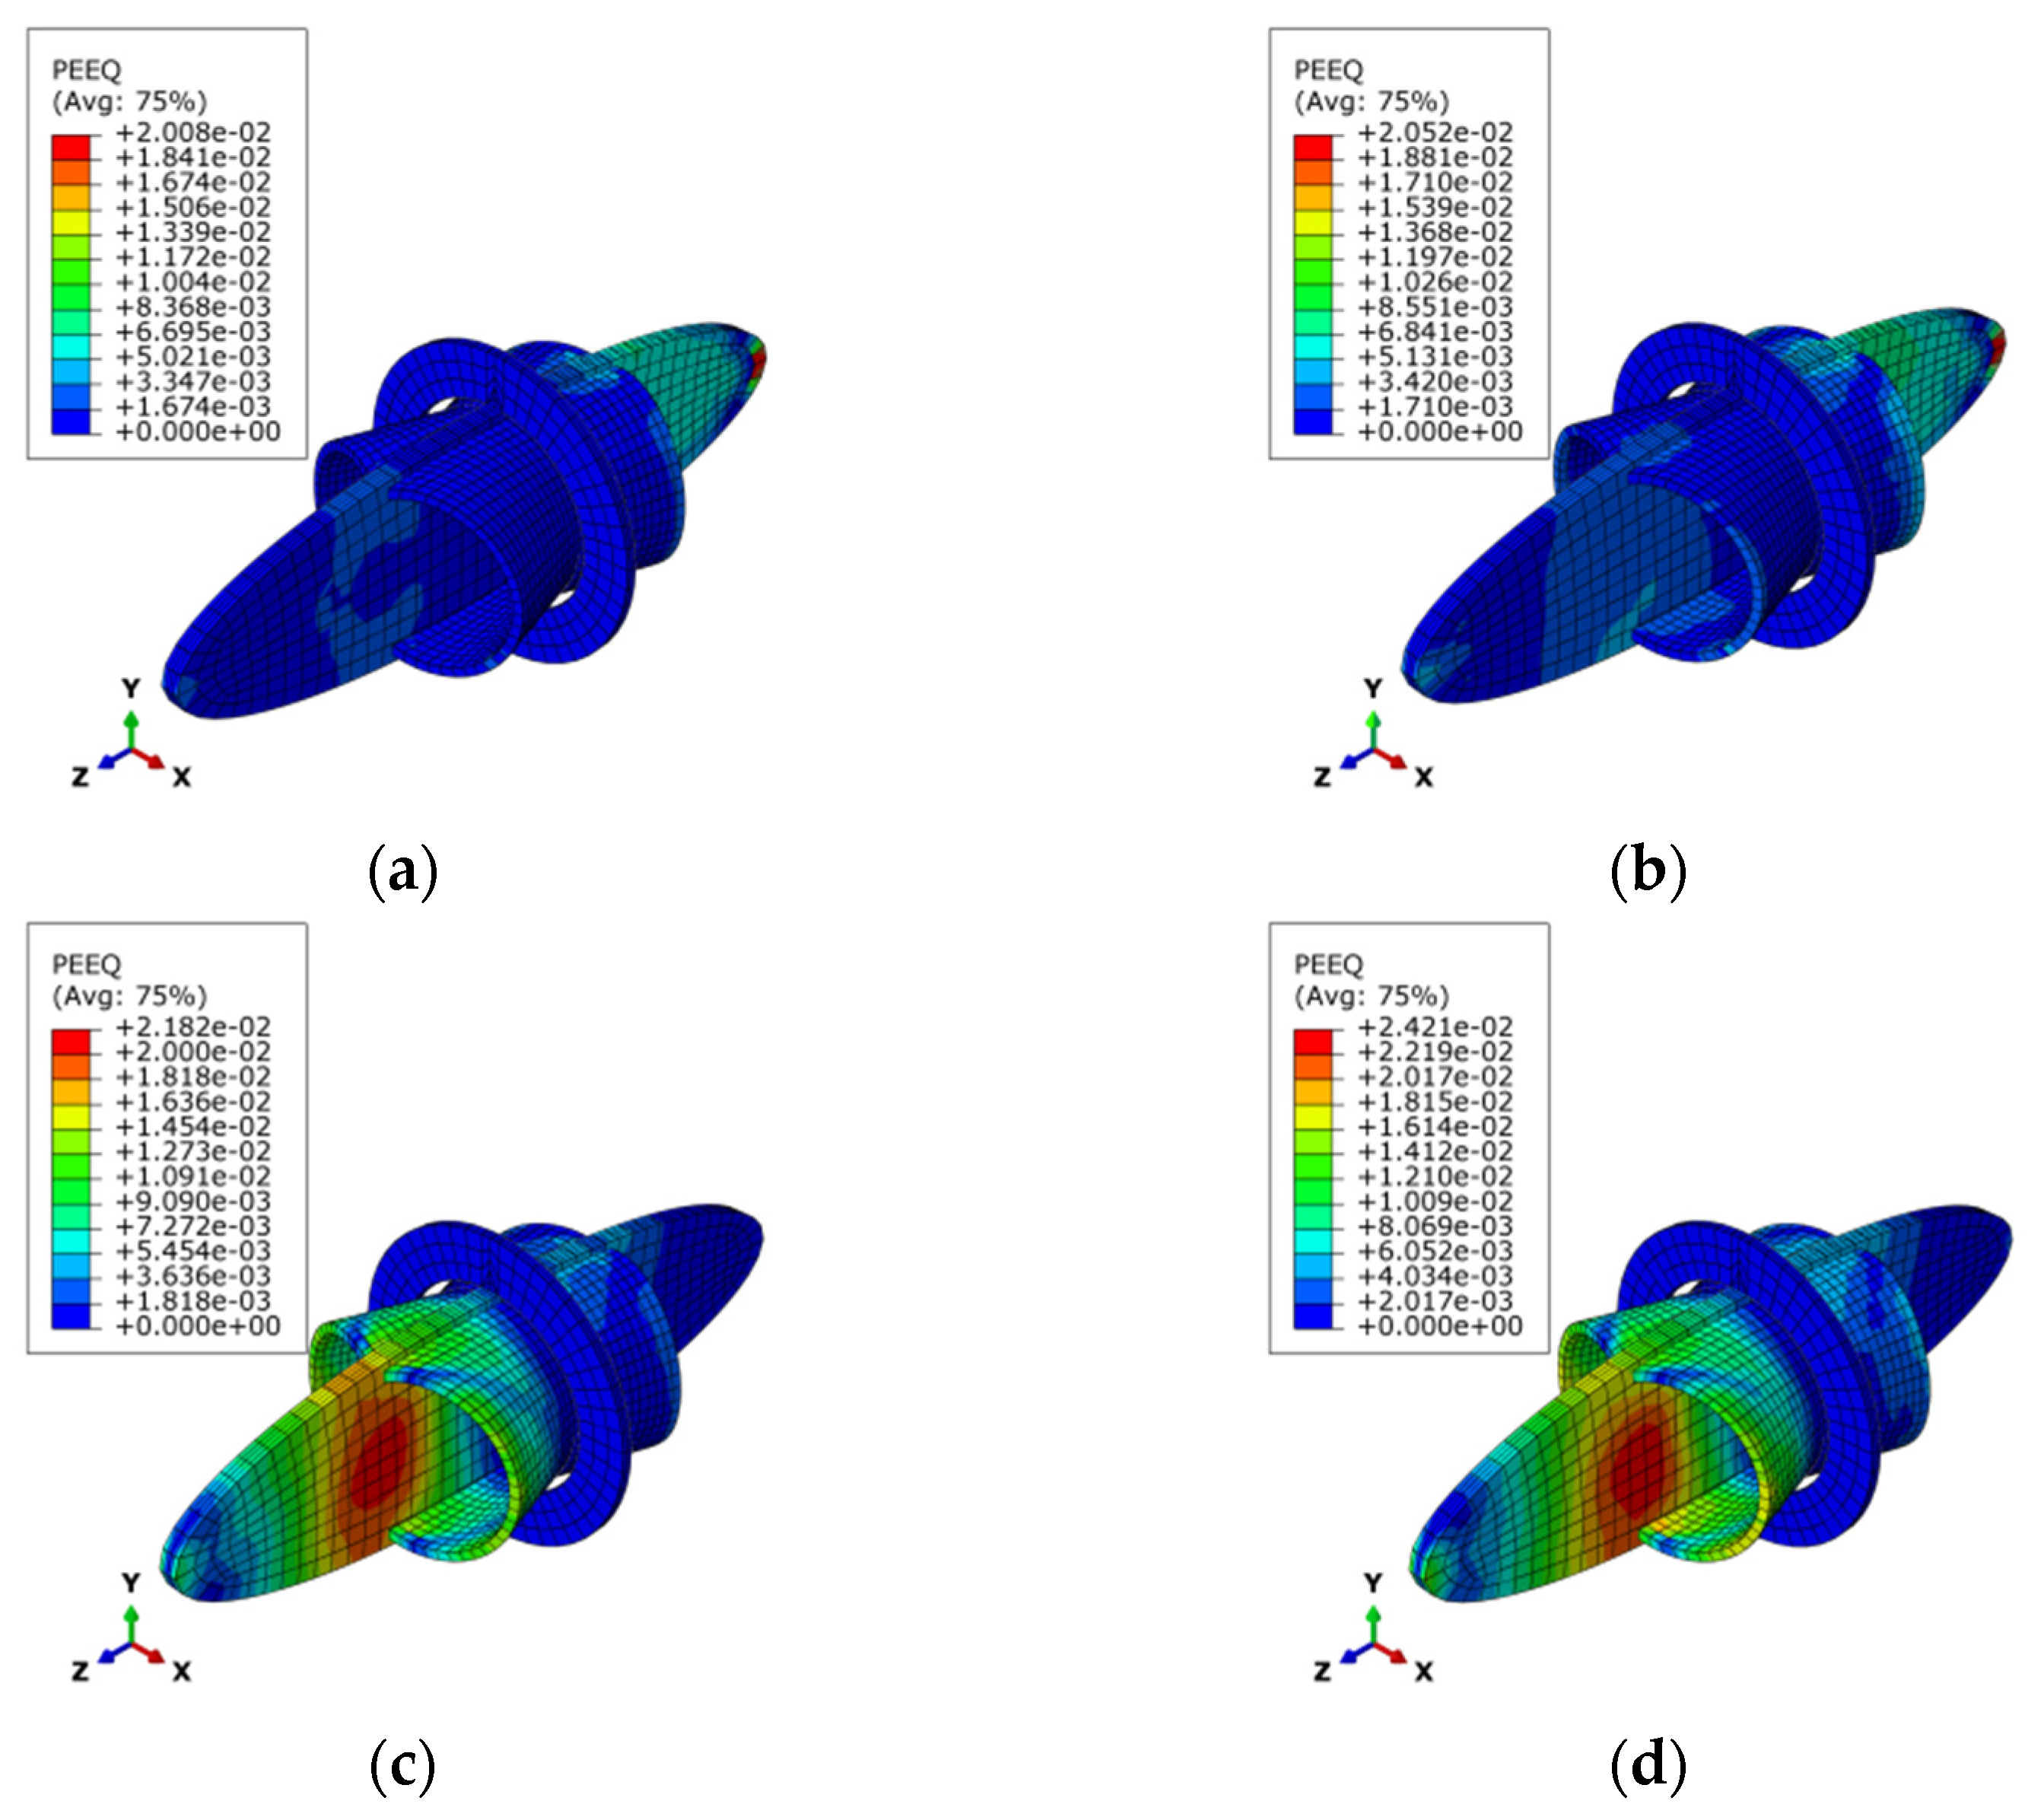
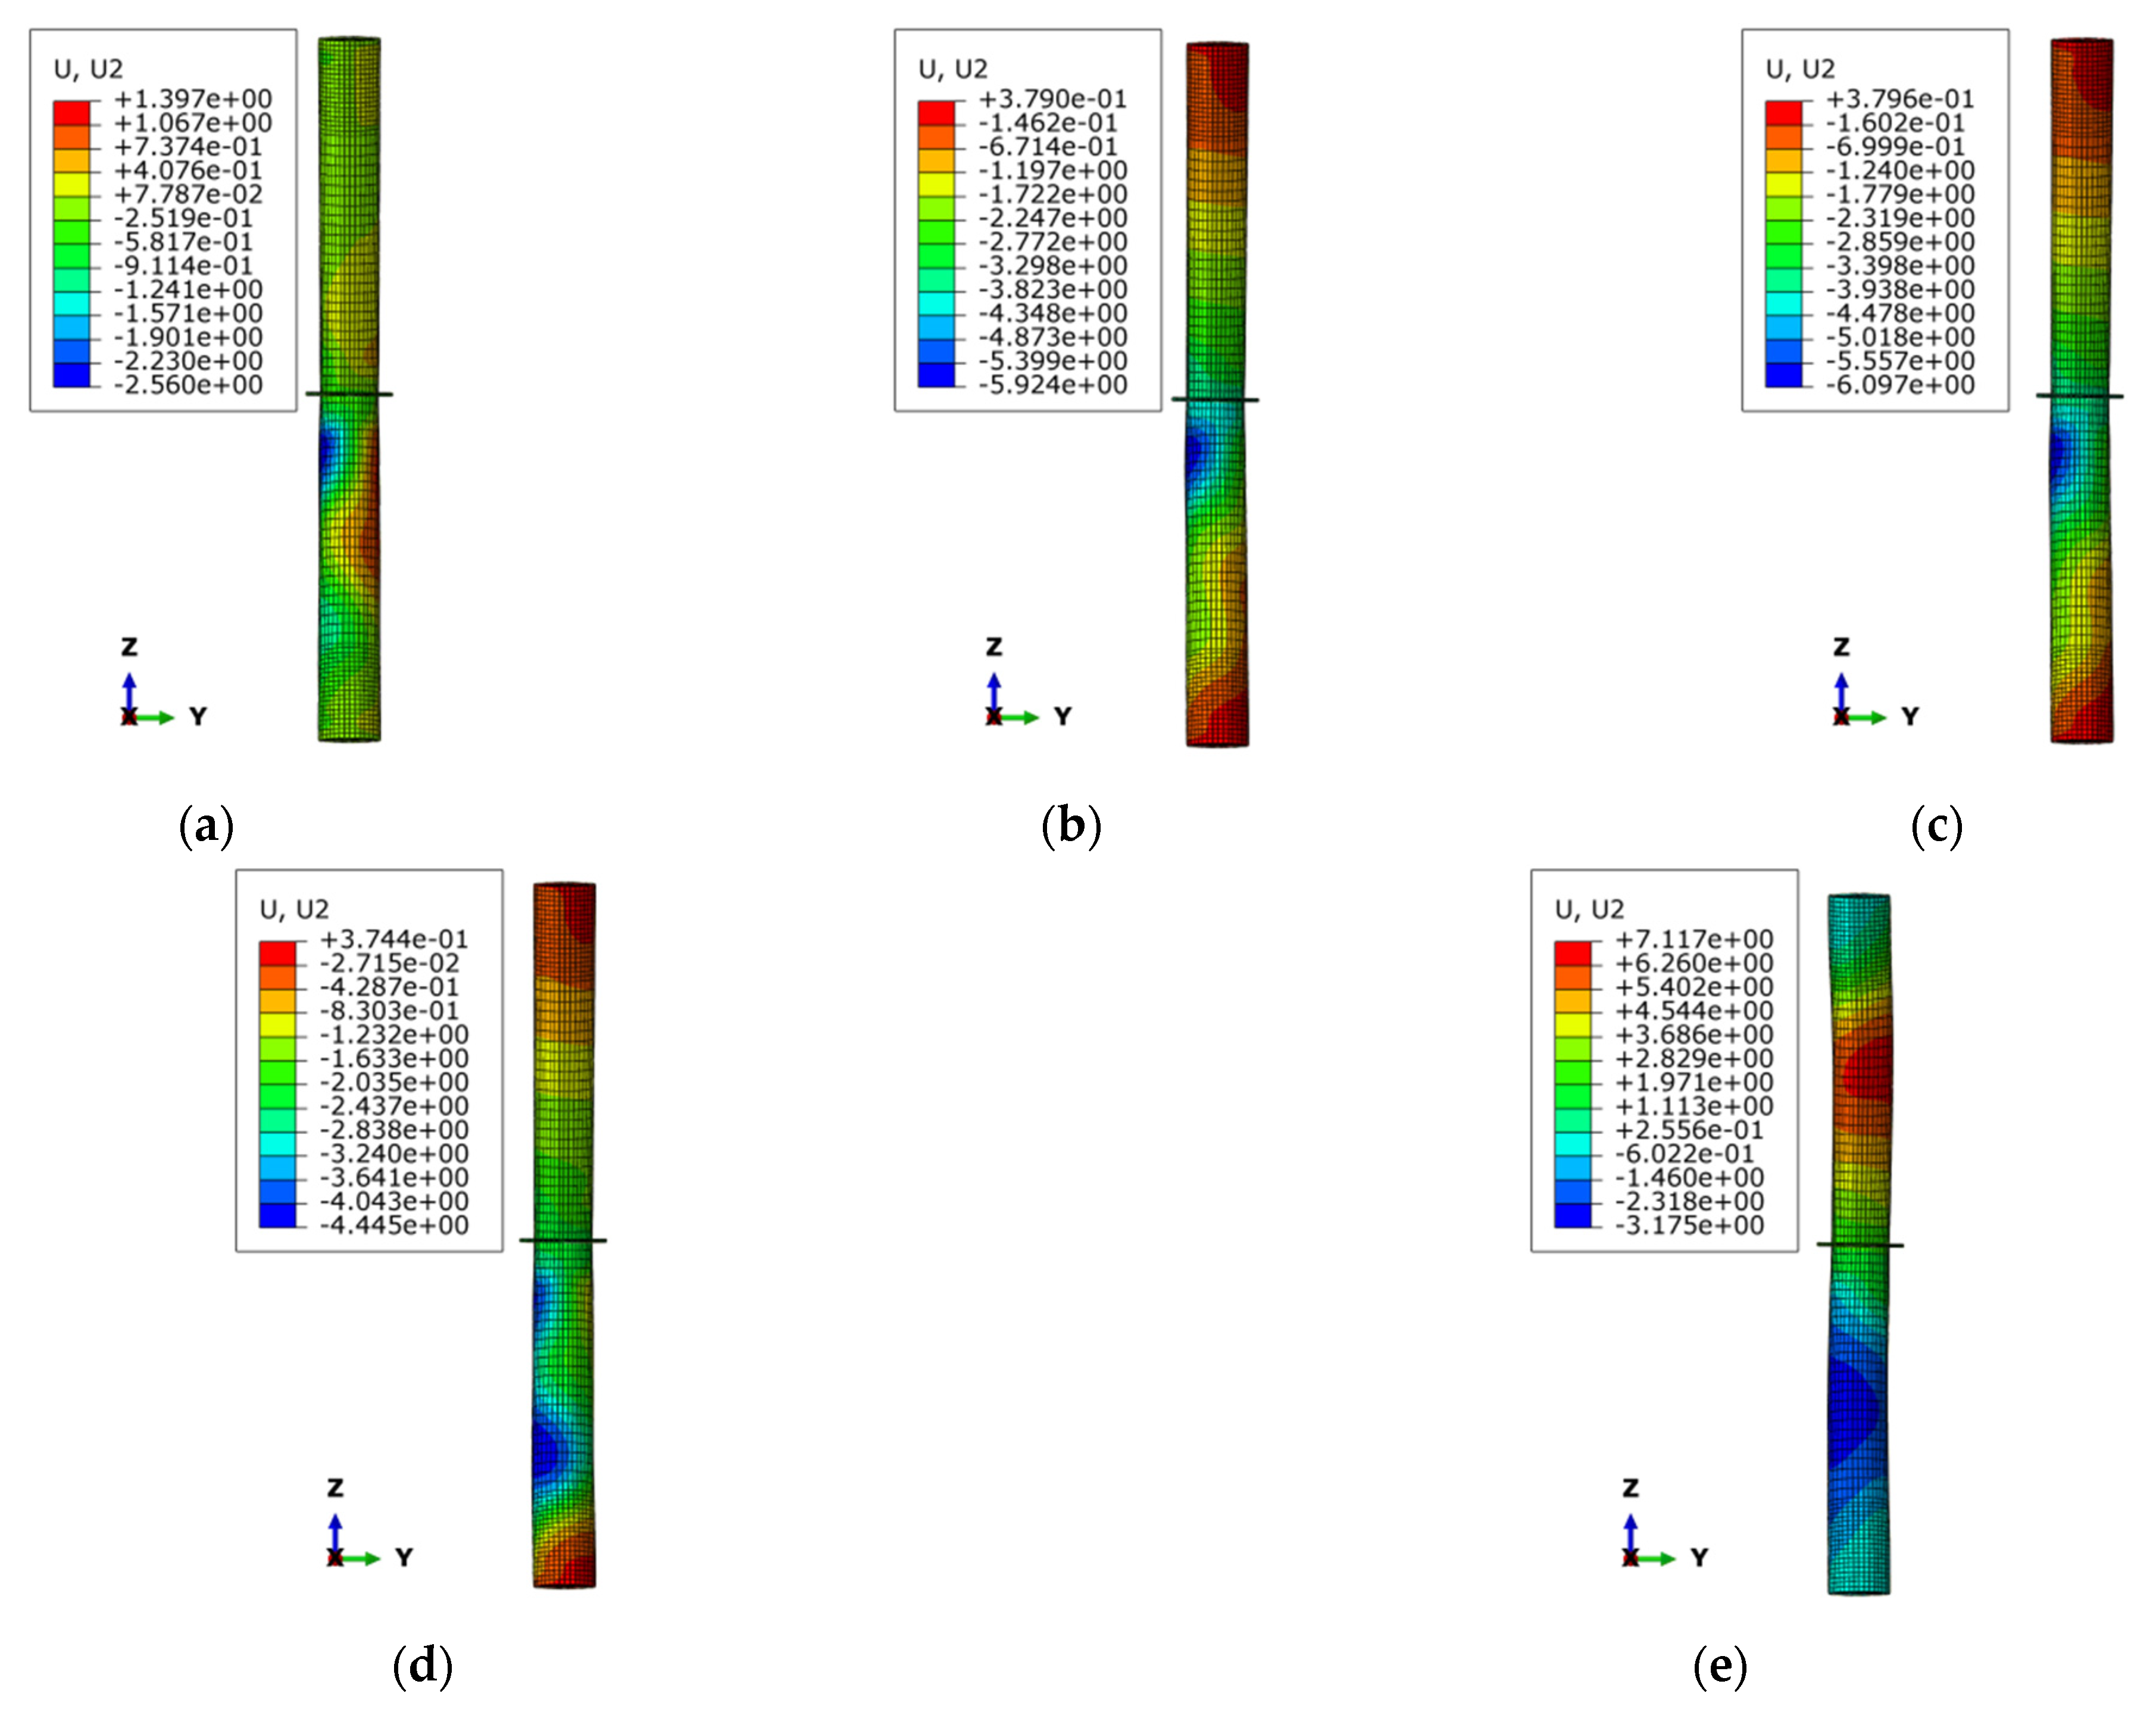
3.4. Analysis of Finite Element Results
4. Parameter Setting
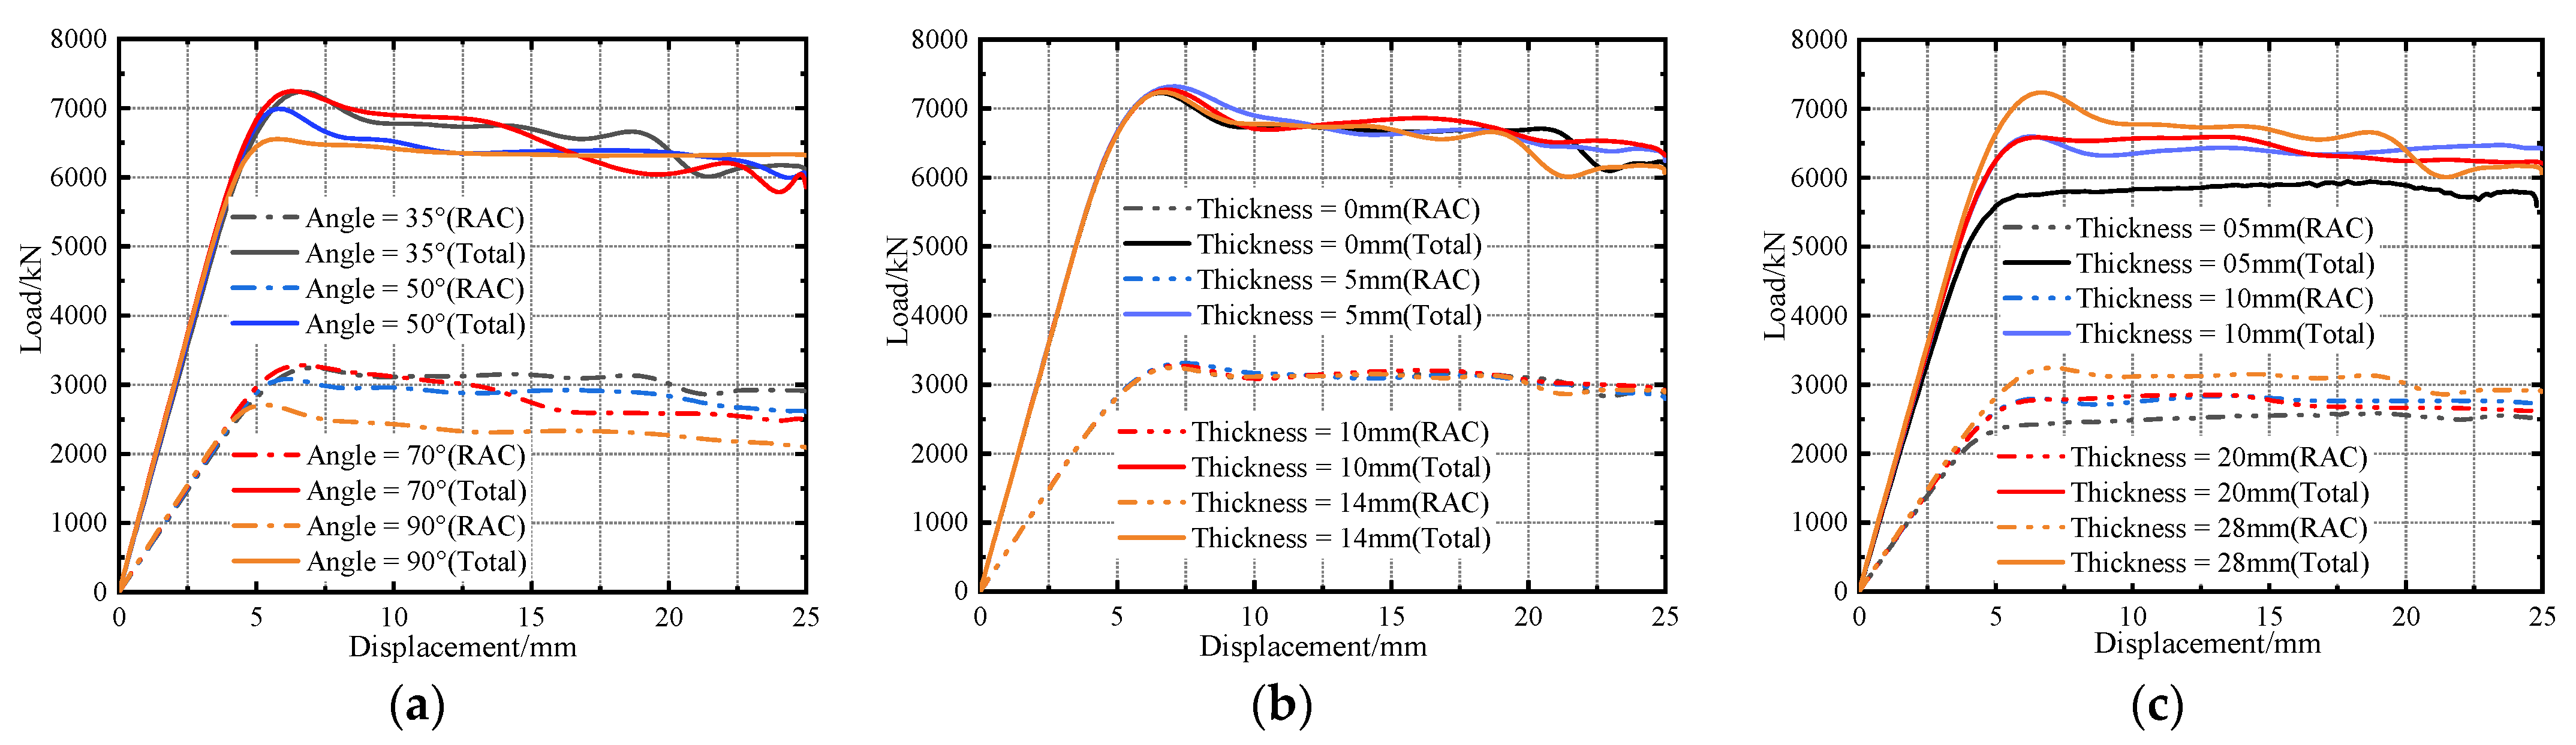
5. Results
6. Discussion
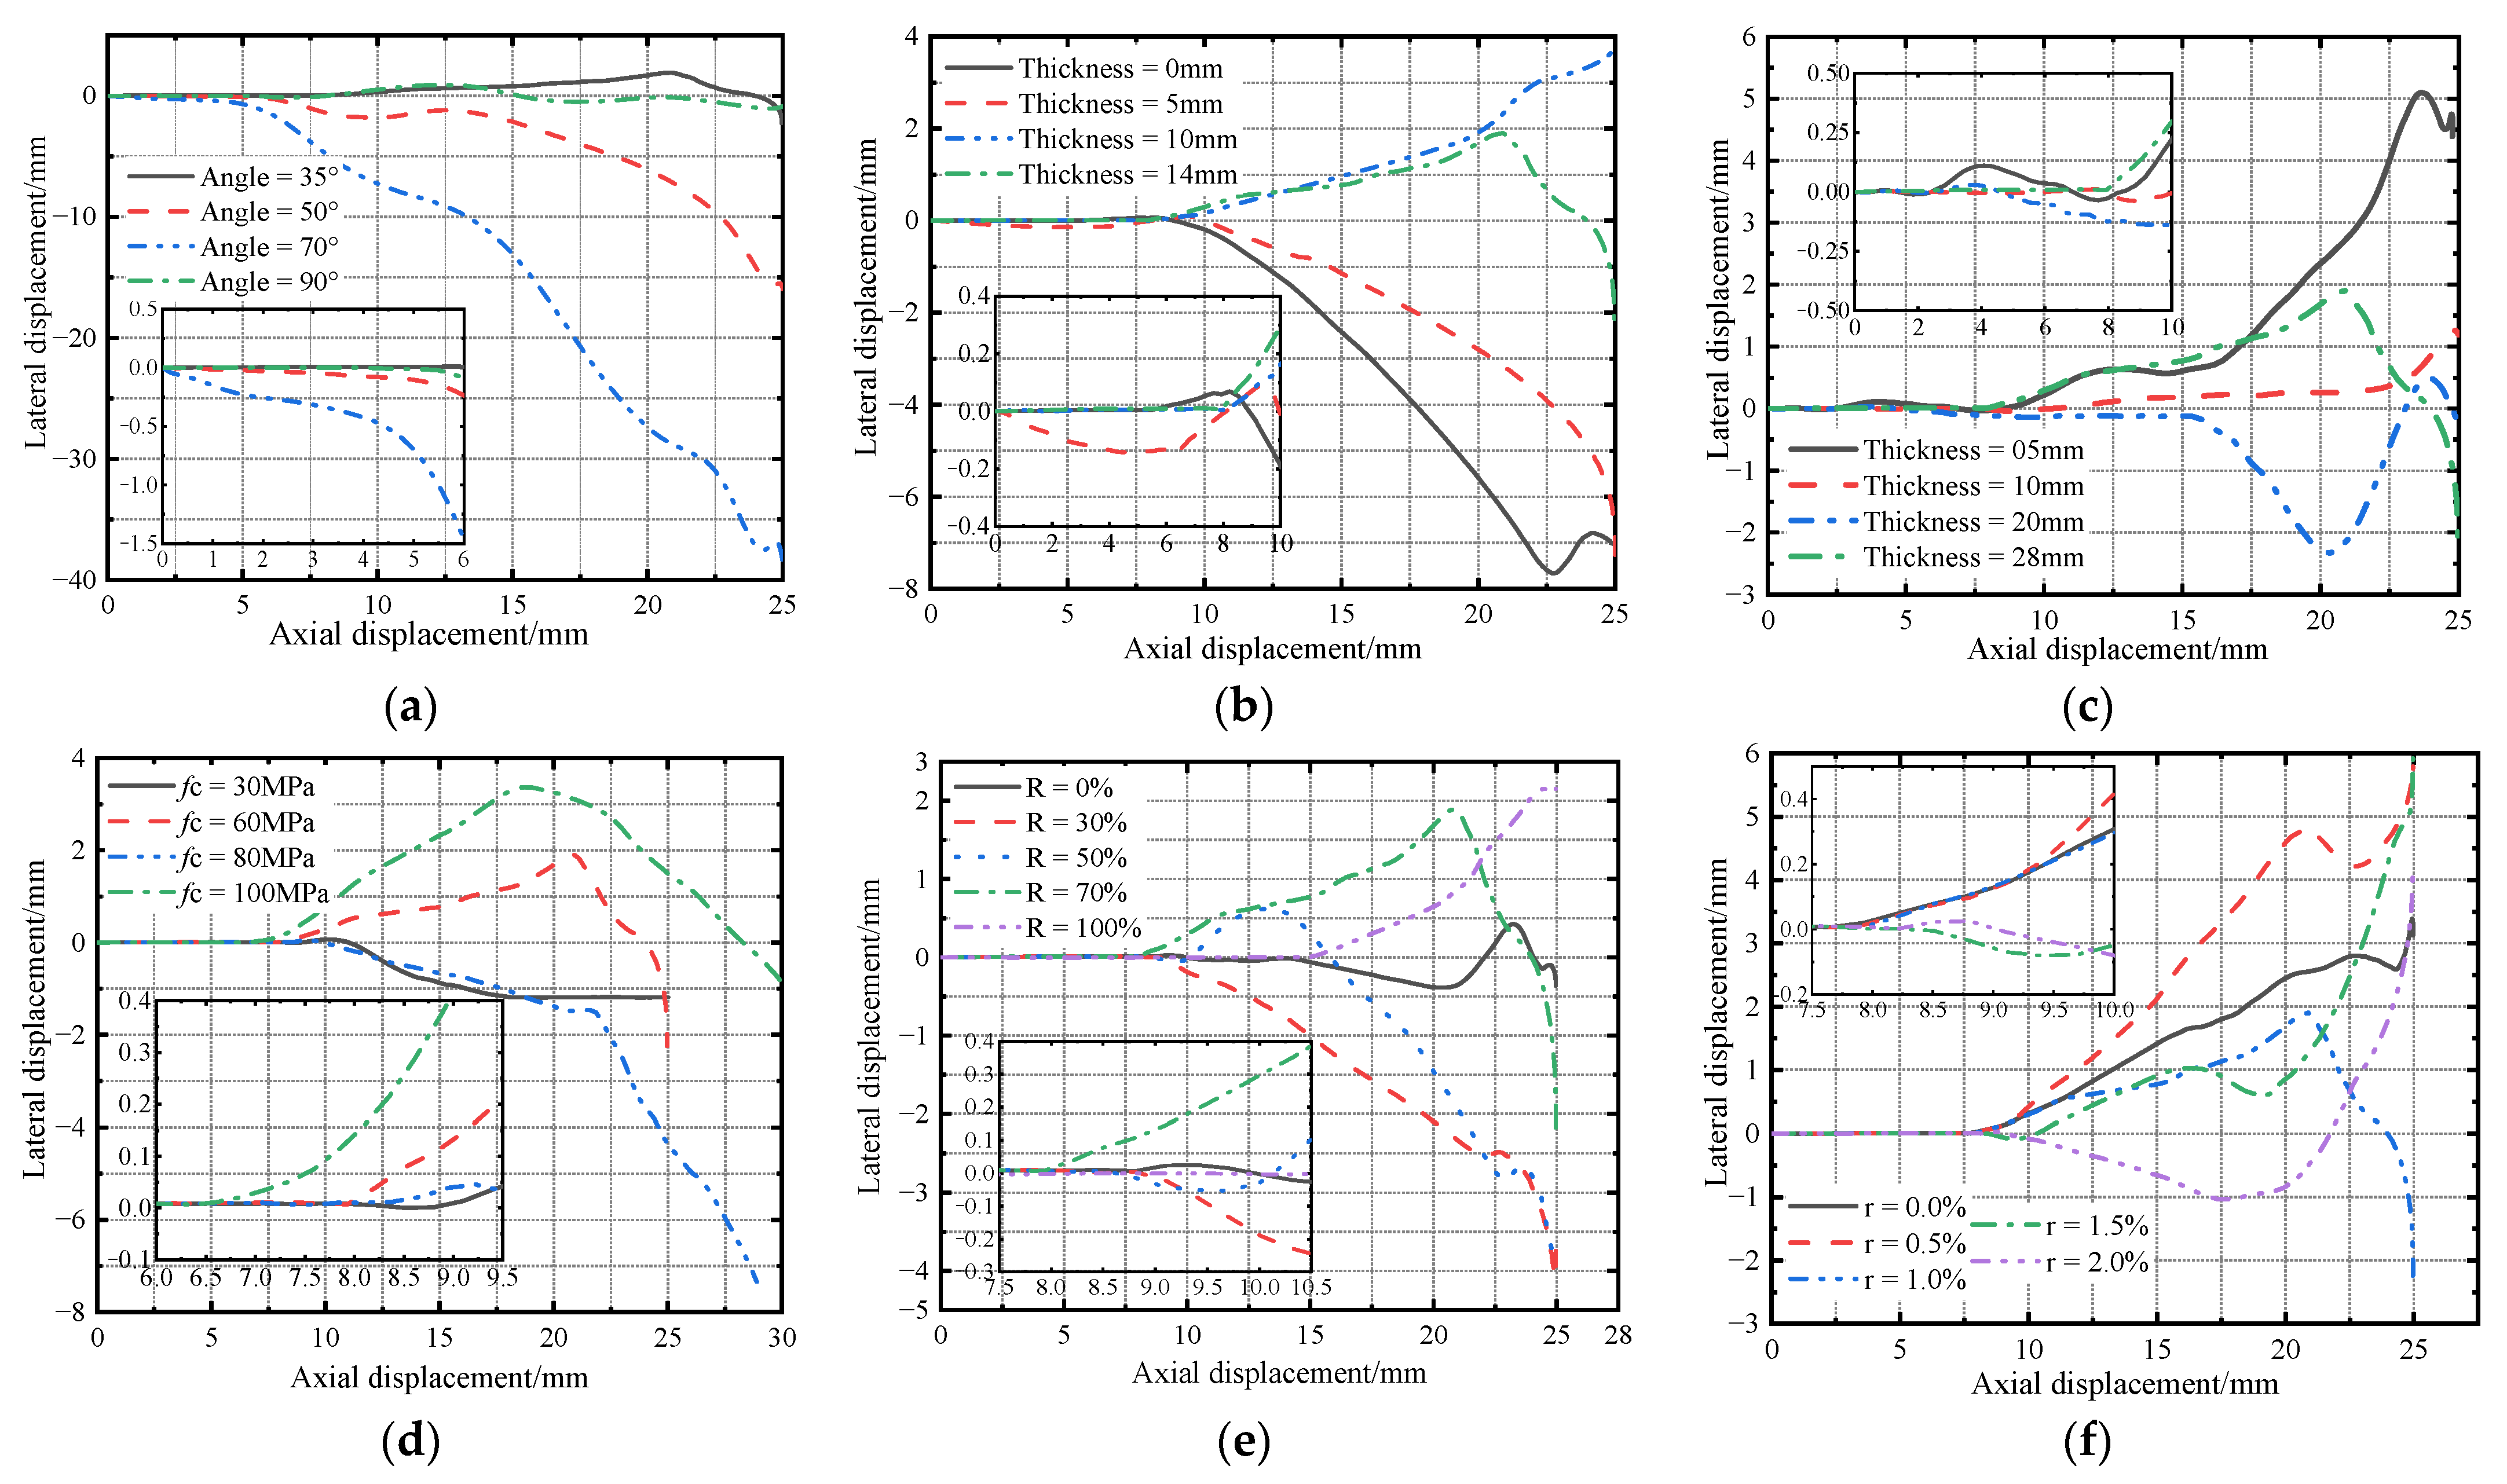
6.1. Oblique Angle
6.2. Thickness of Reinforcing Ring
6.3. Thickness of Connecting Plate
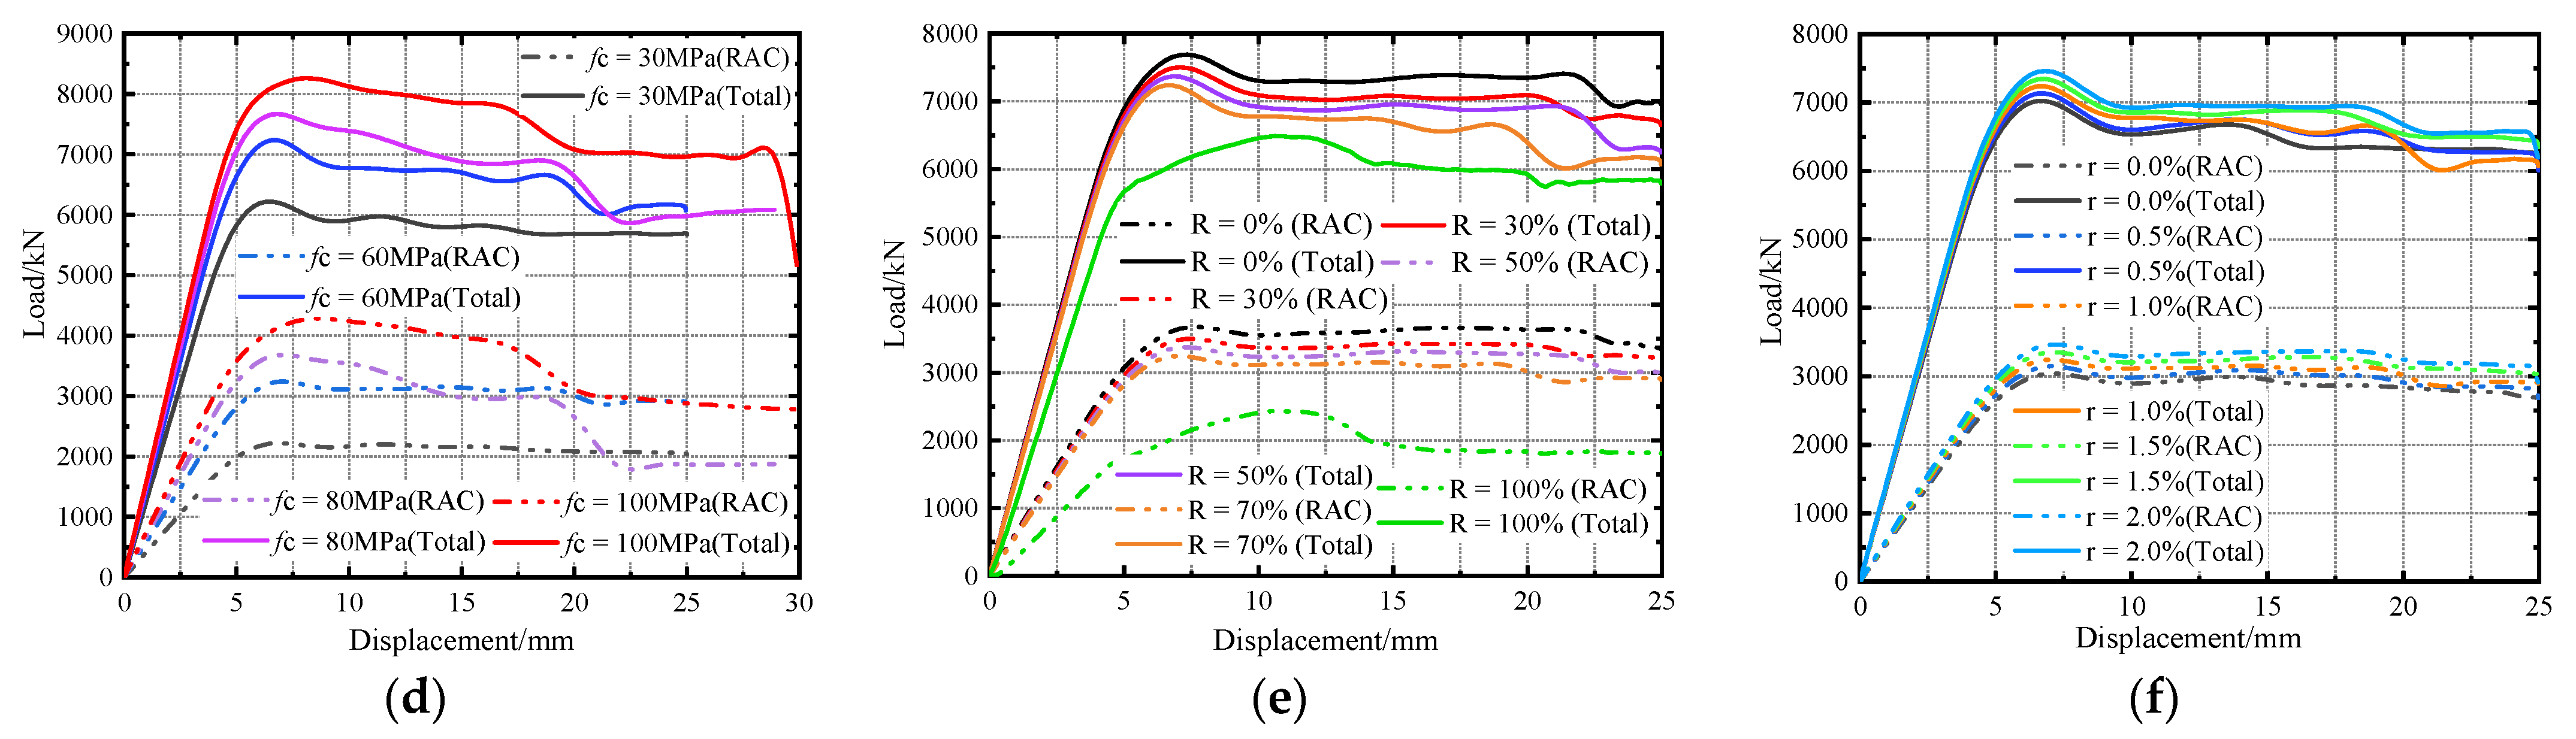
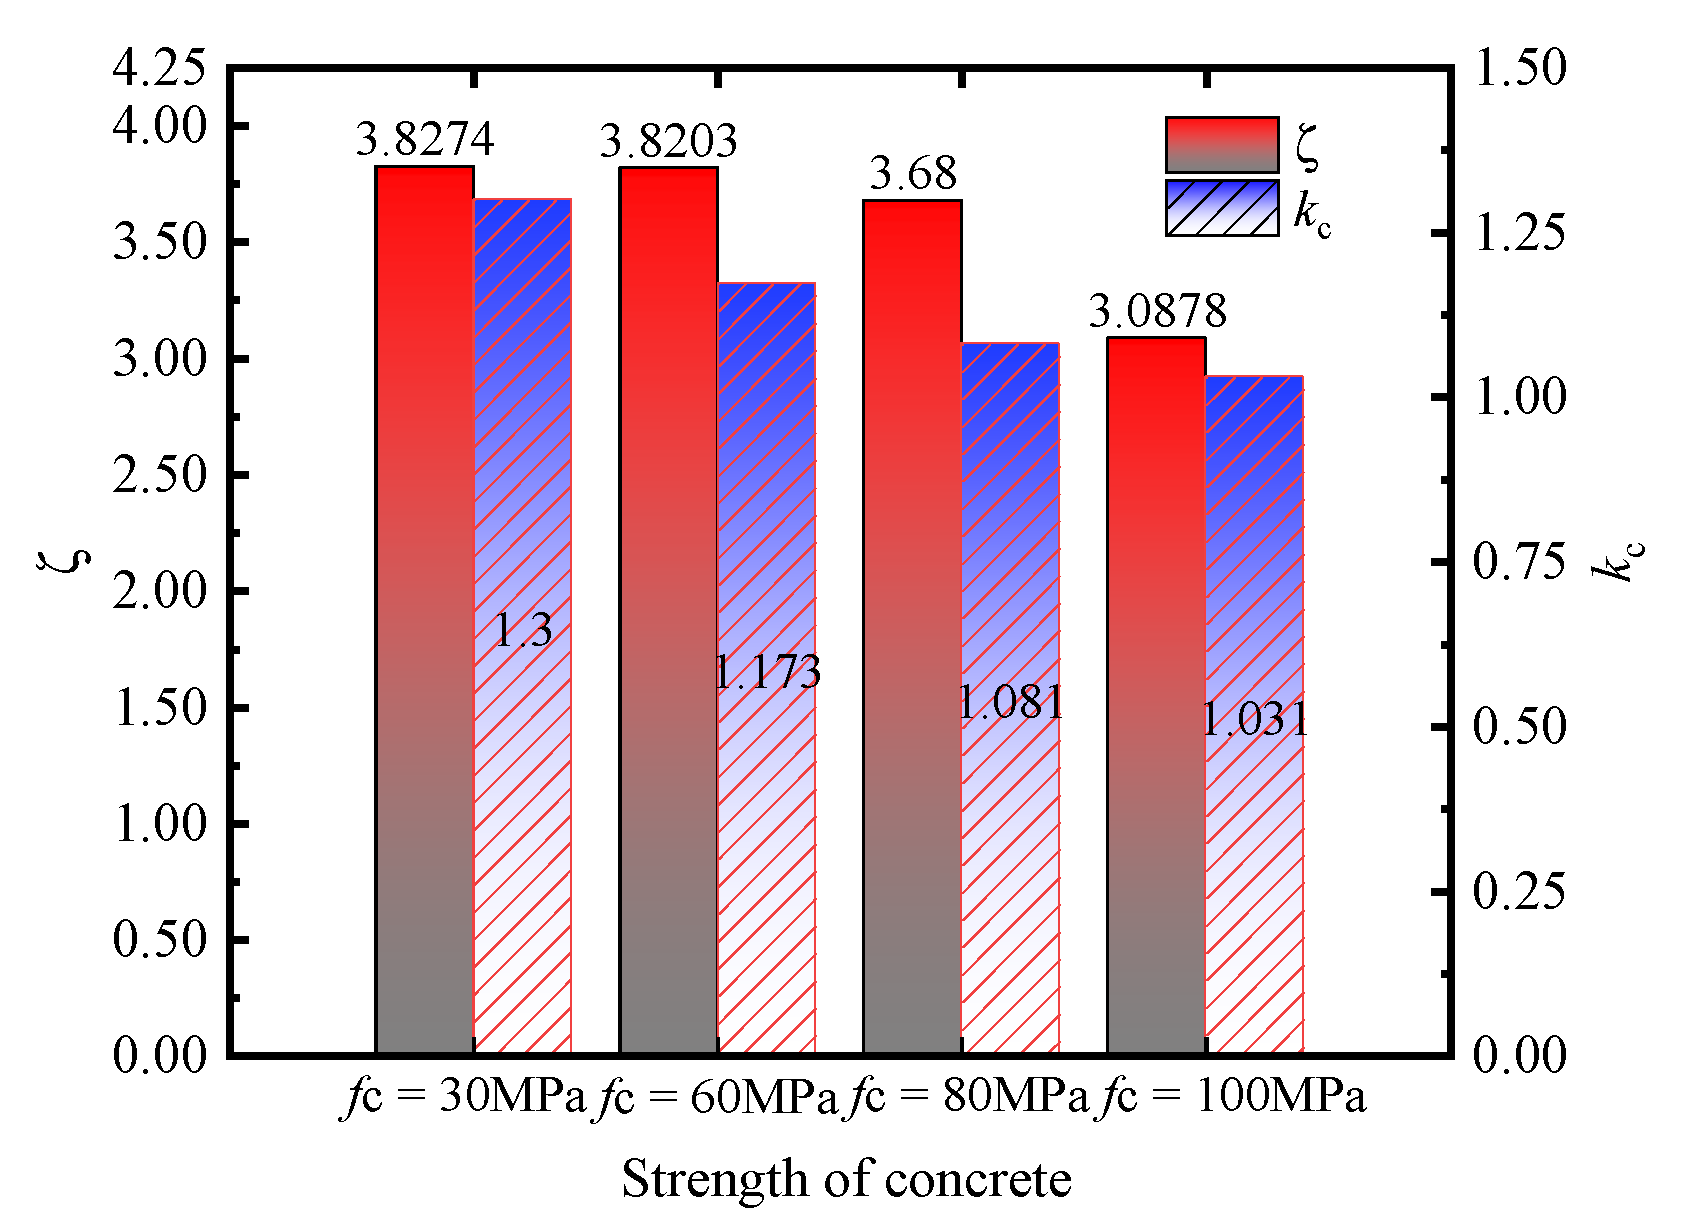
6.4. Concrete Strength
6.5. Recycled Aggregate Replacement Rate
6.6. Steel Fiber Content
7. Feasibility Analysis of OGSFRCIN
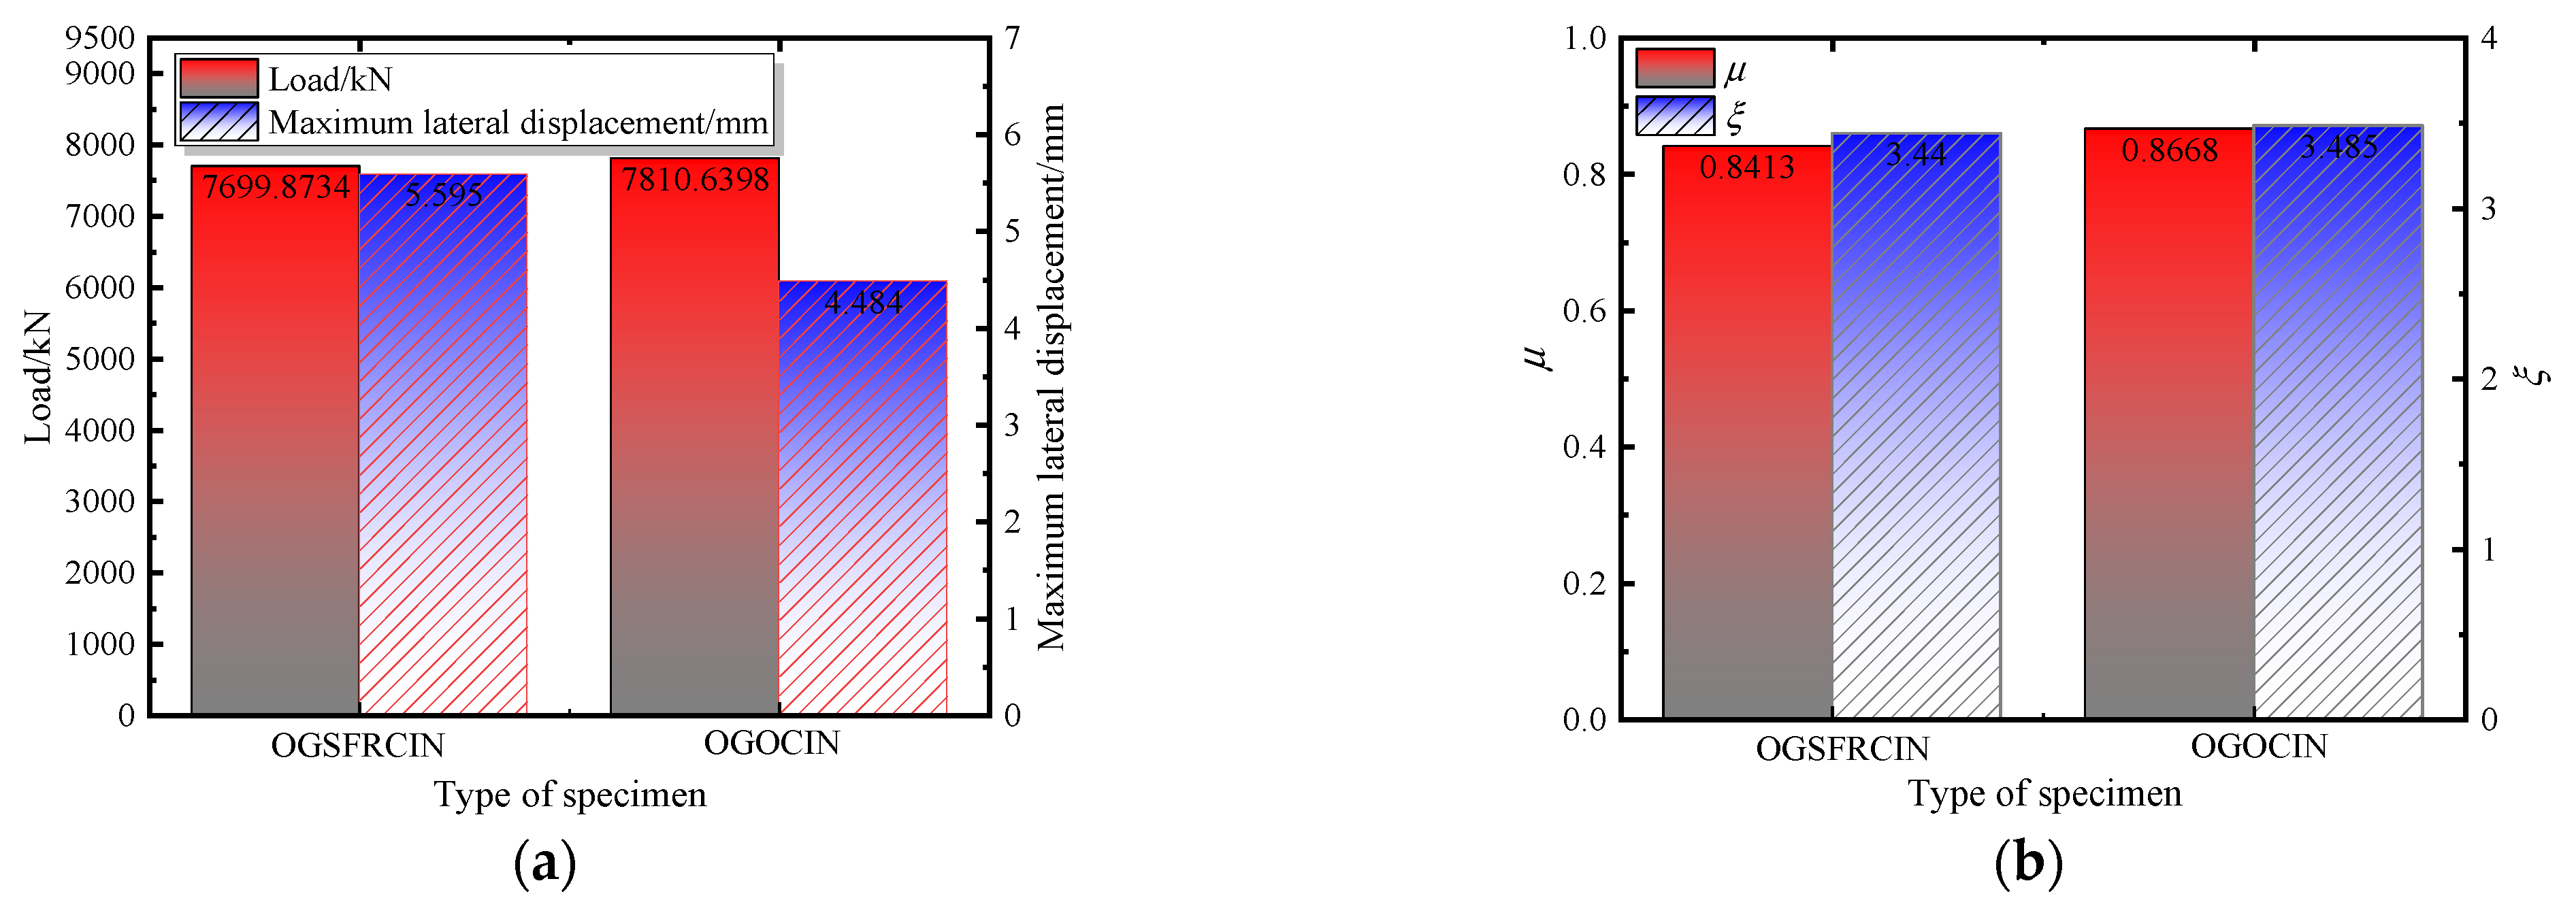
7.1. Monotonic Axial Compression Performance
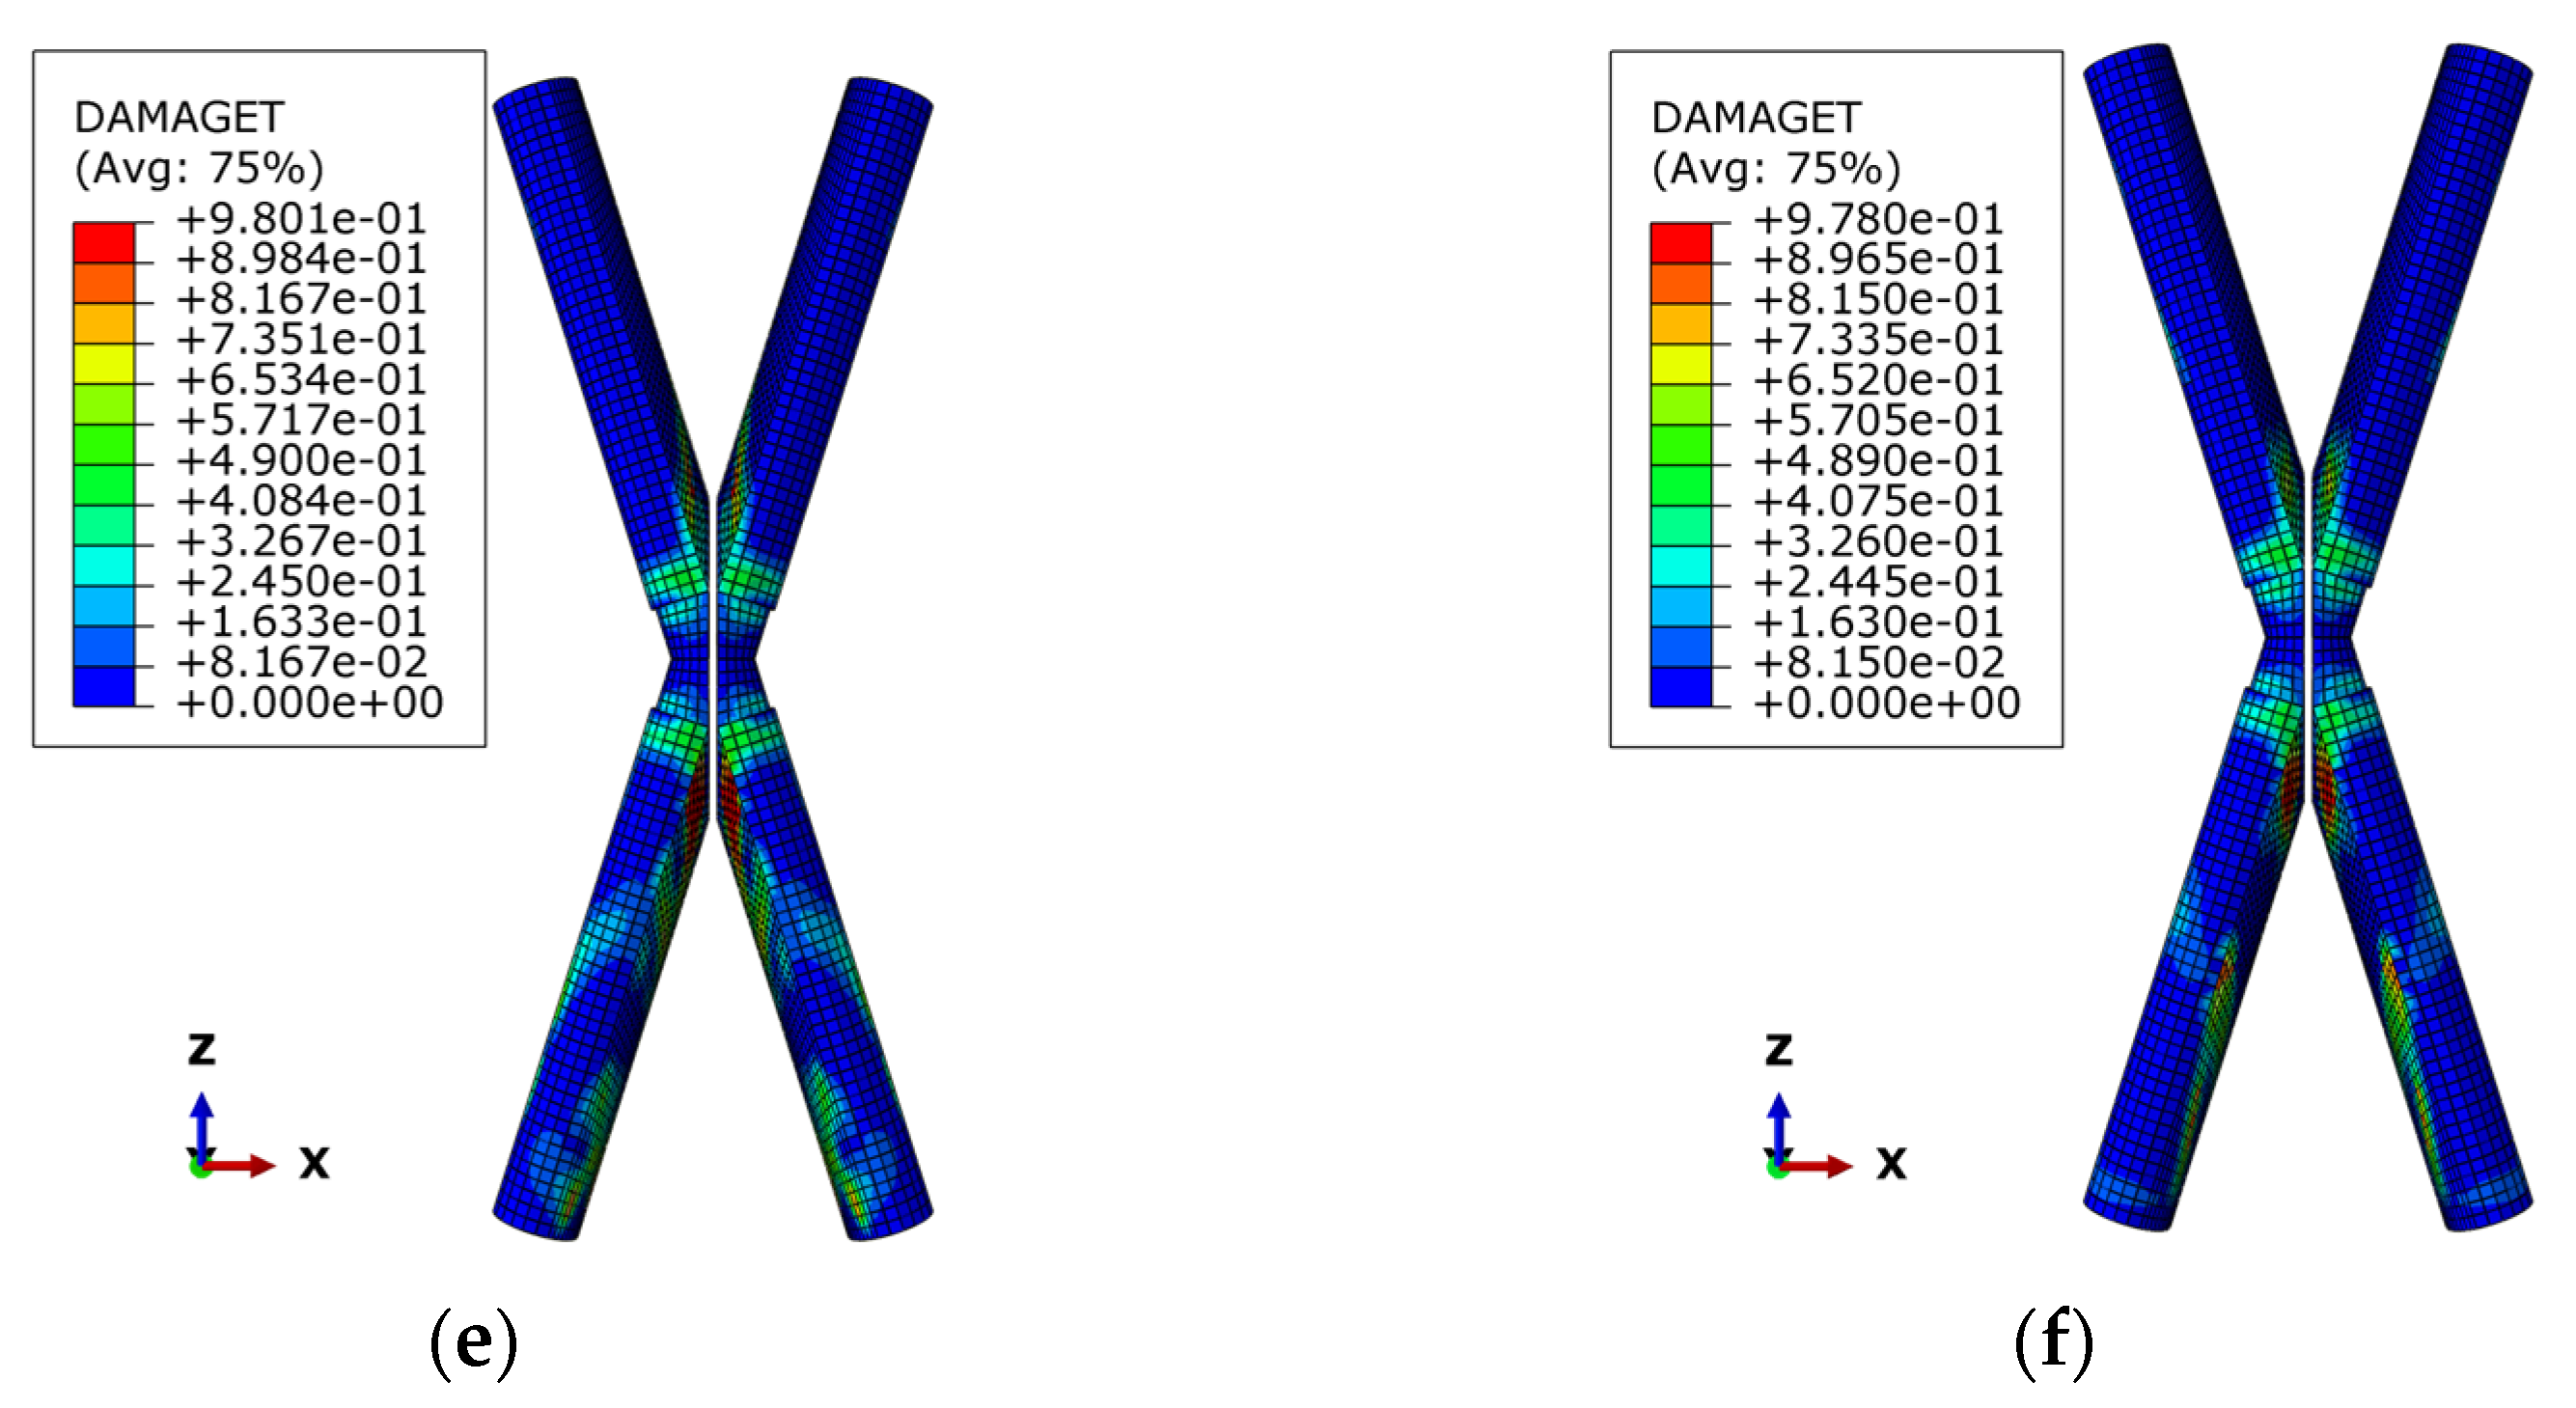
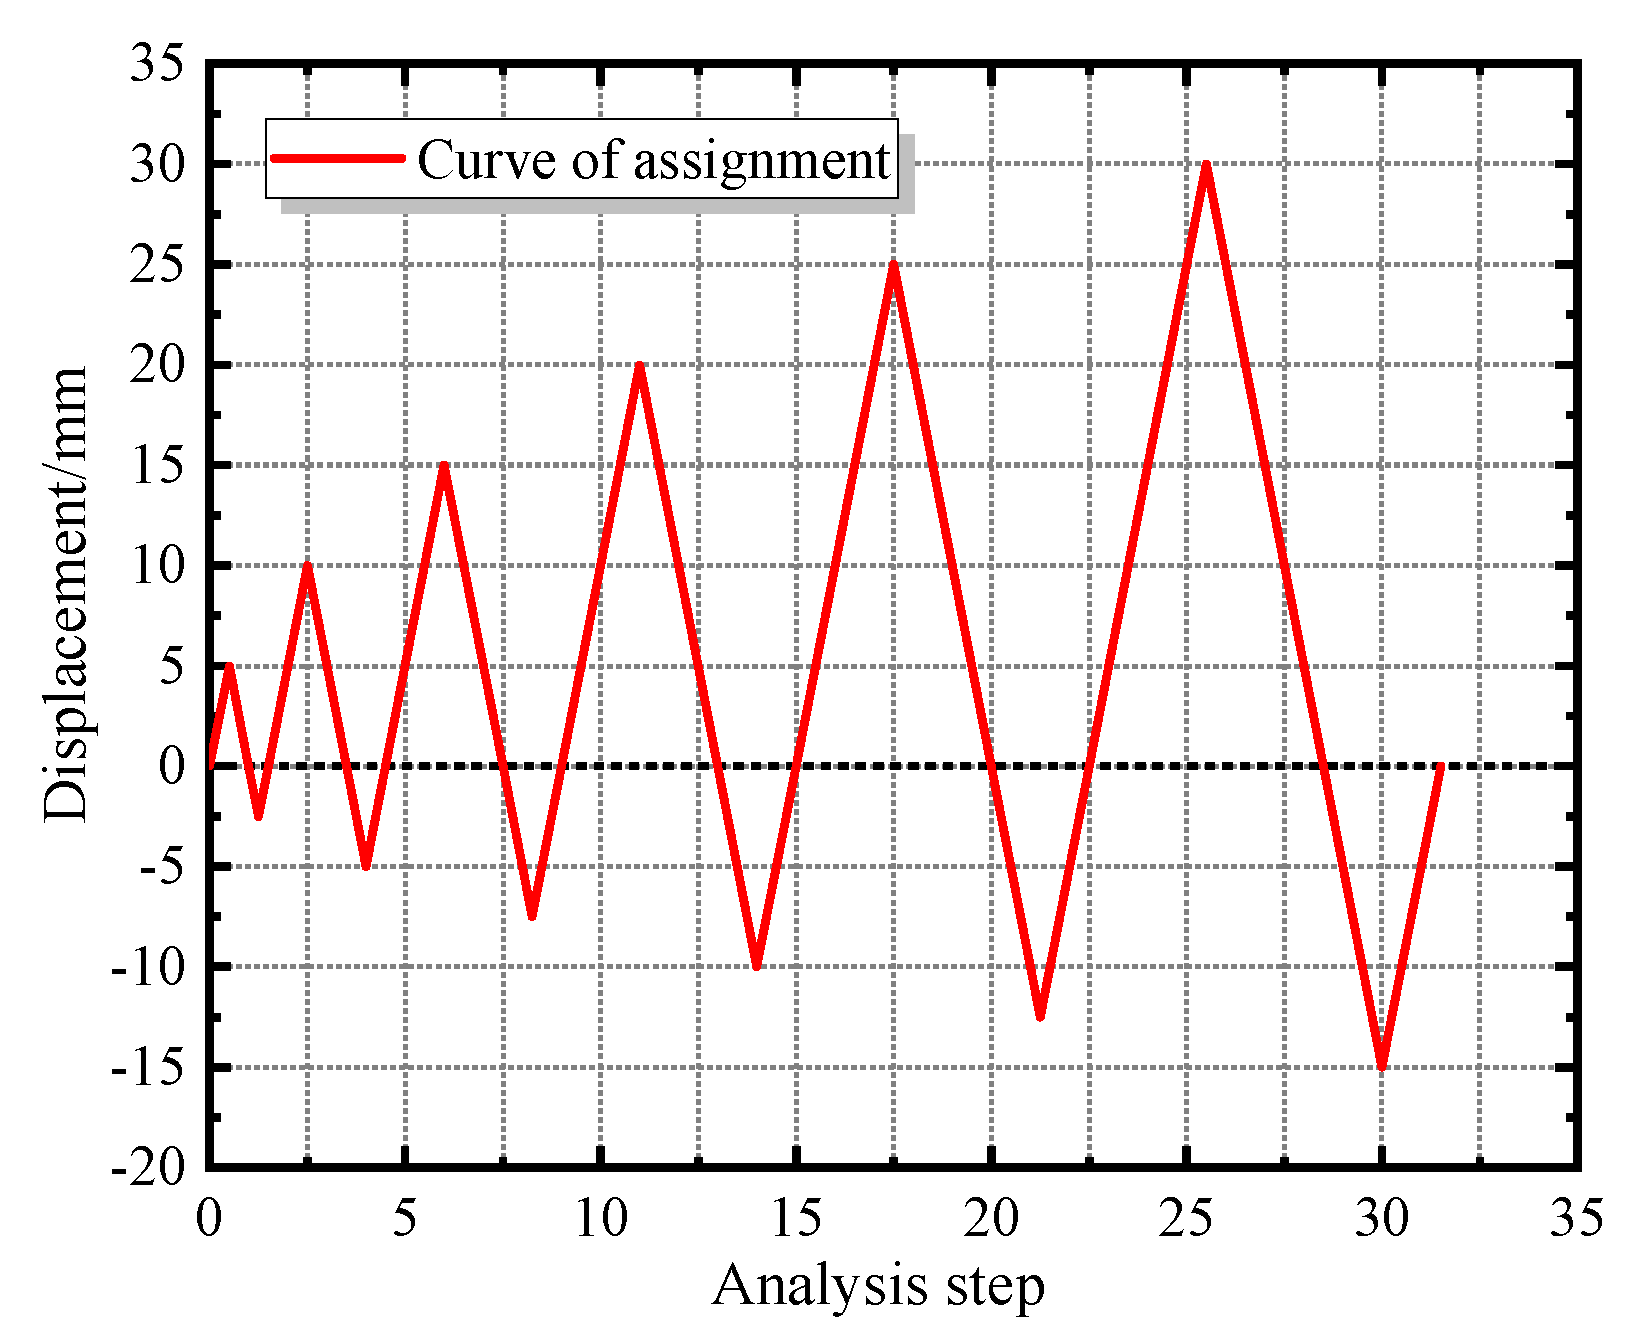
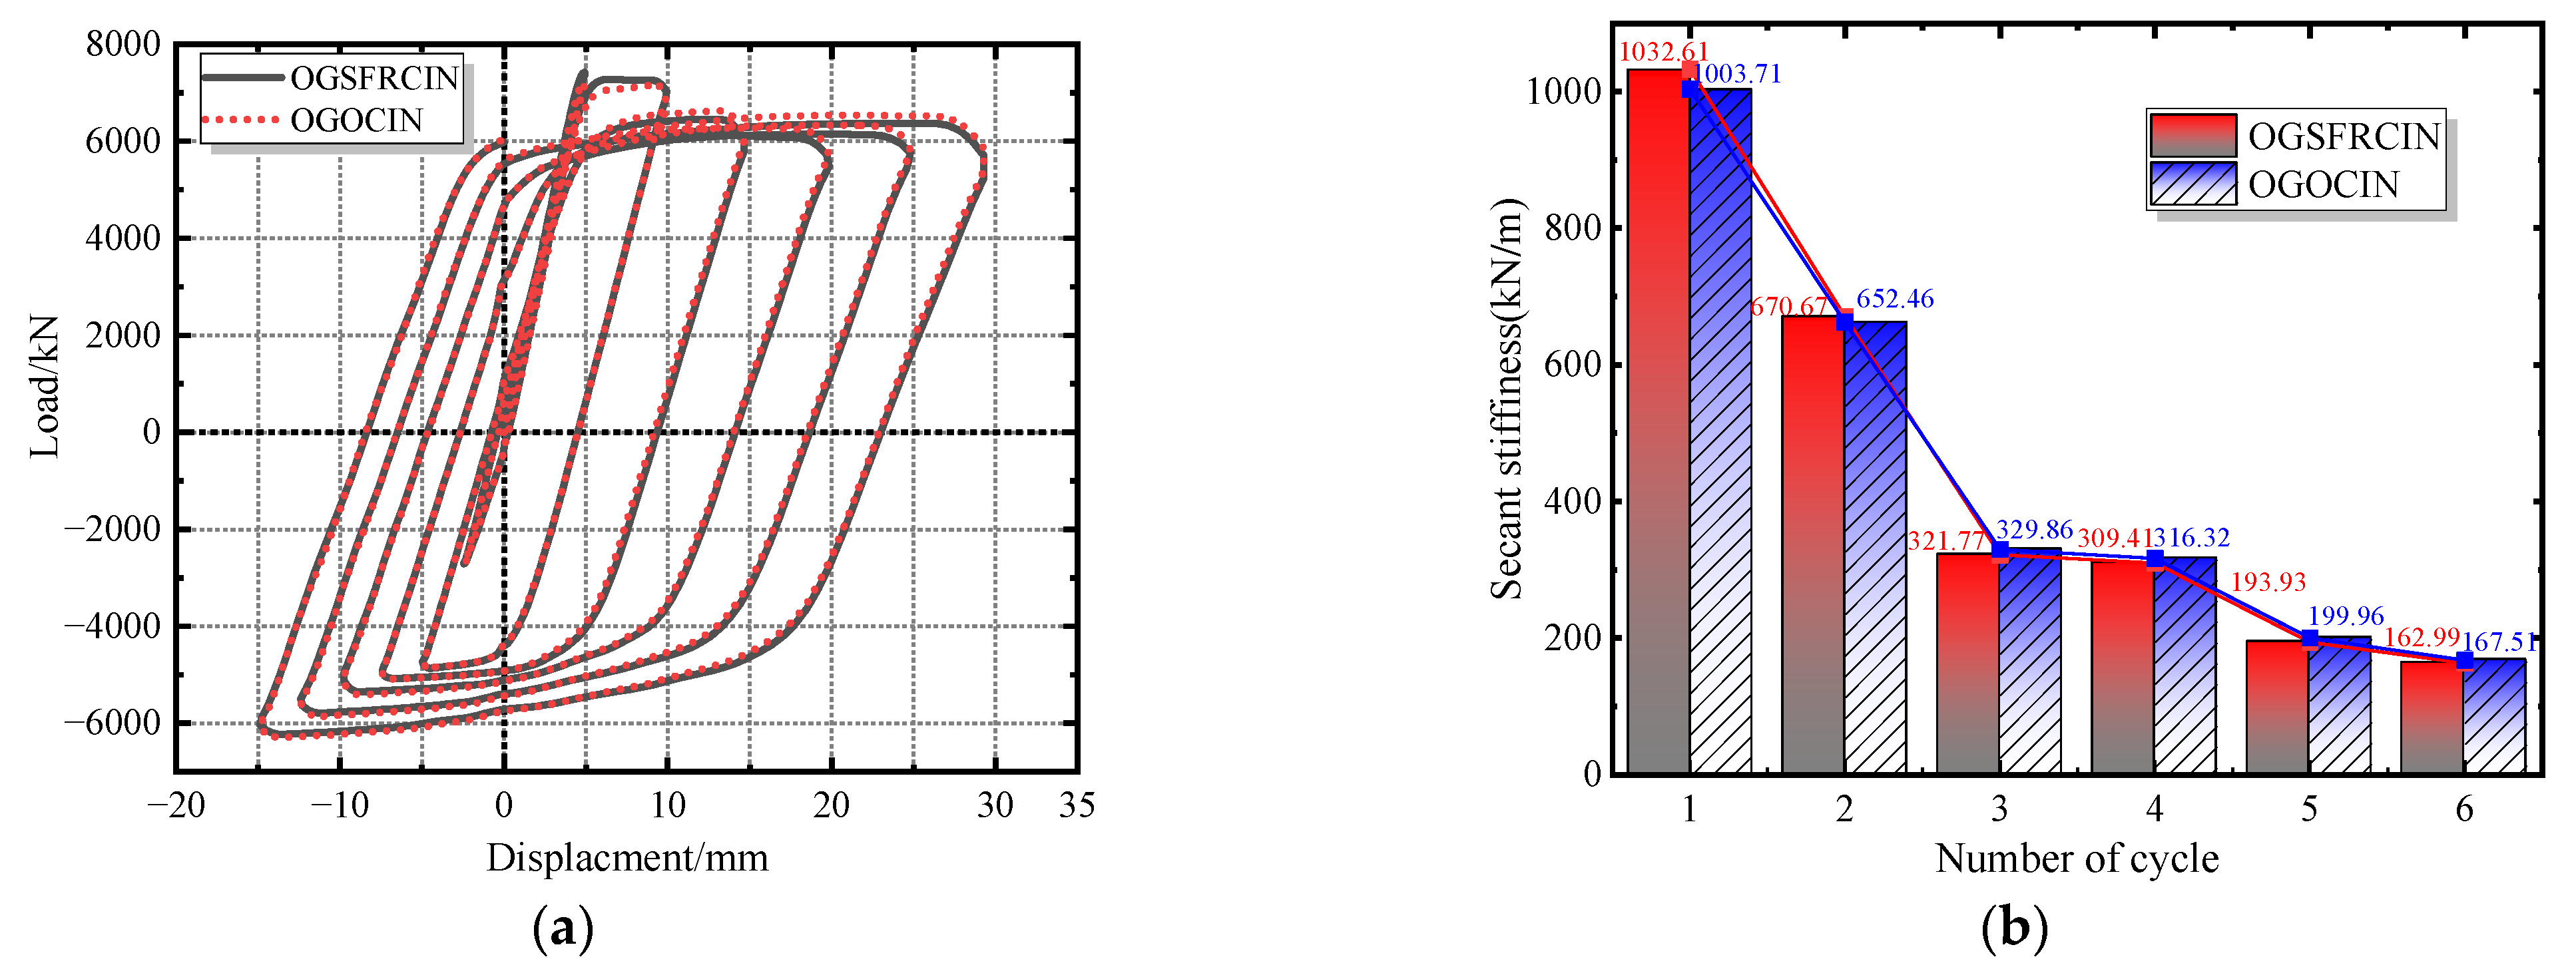
7.2. Seismic Performance
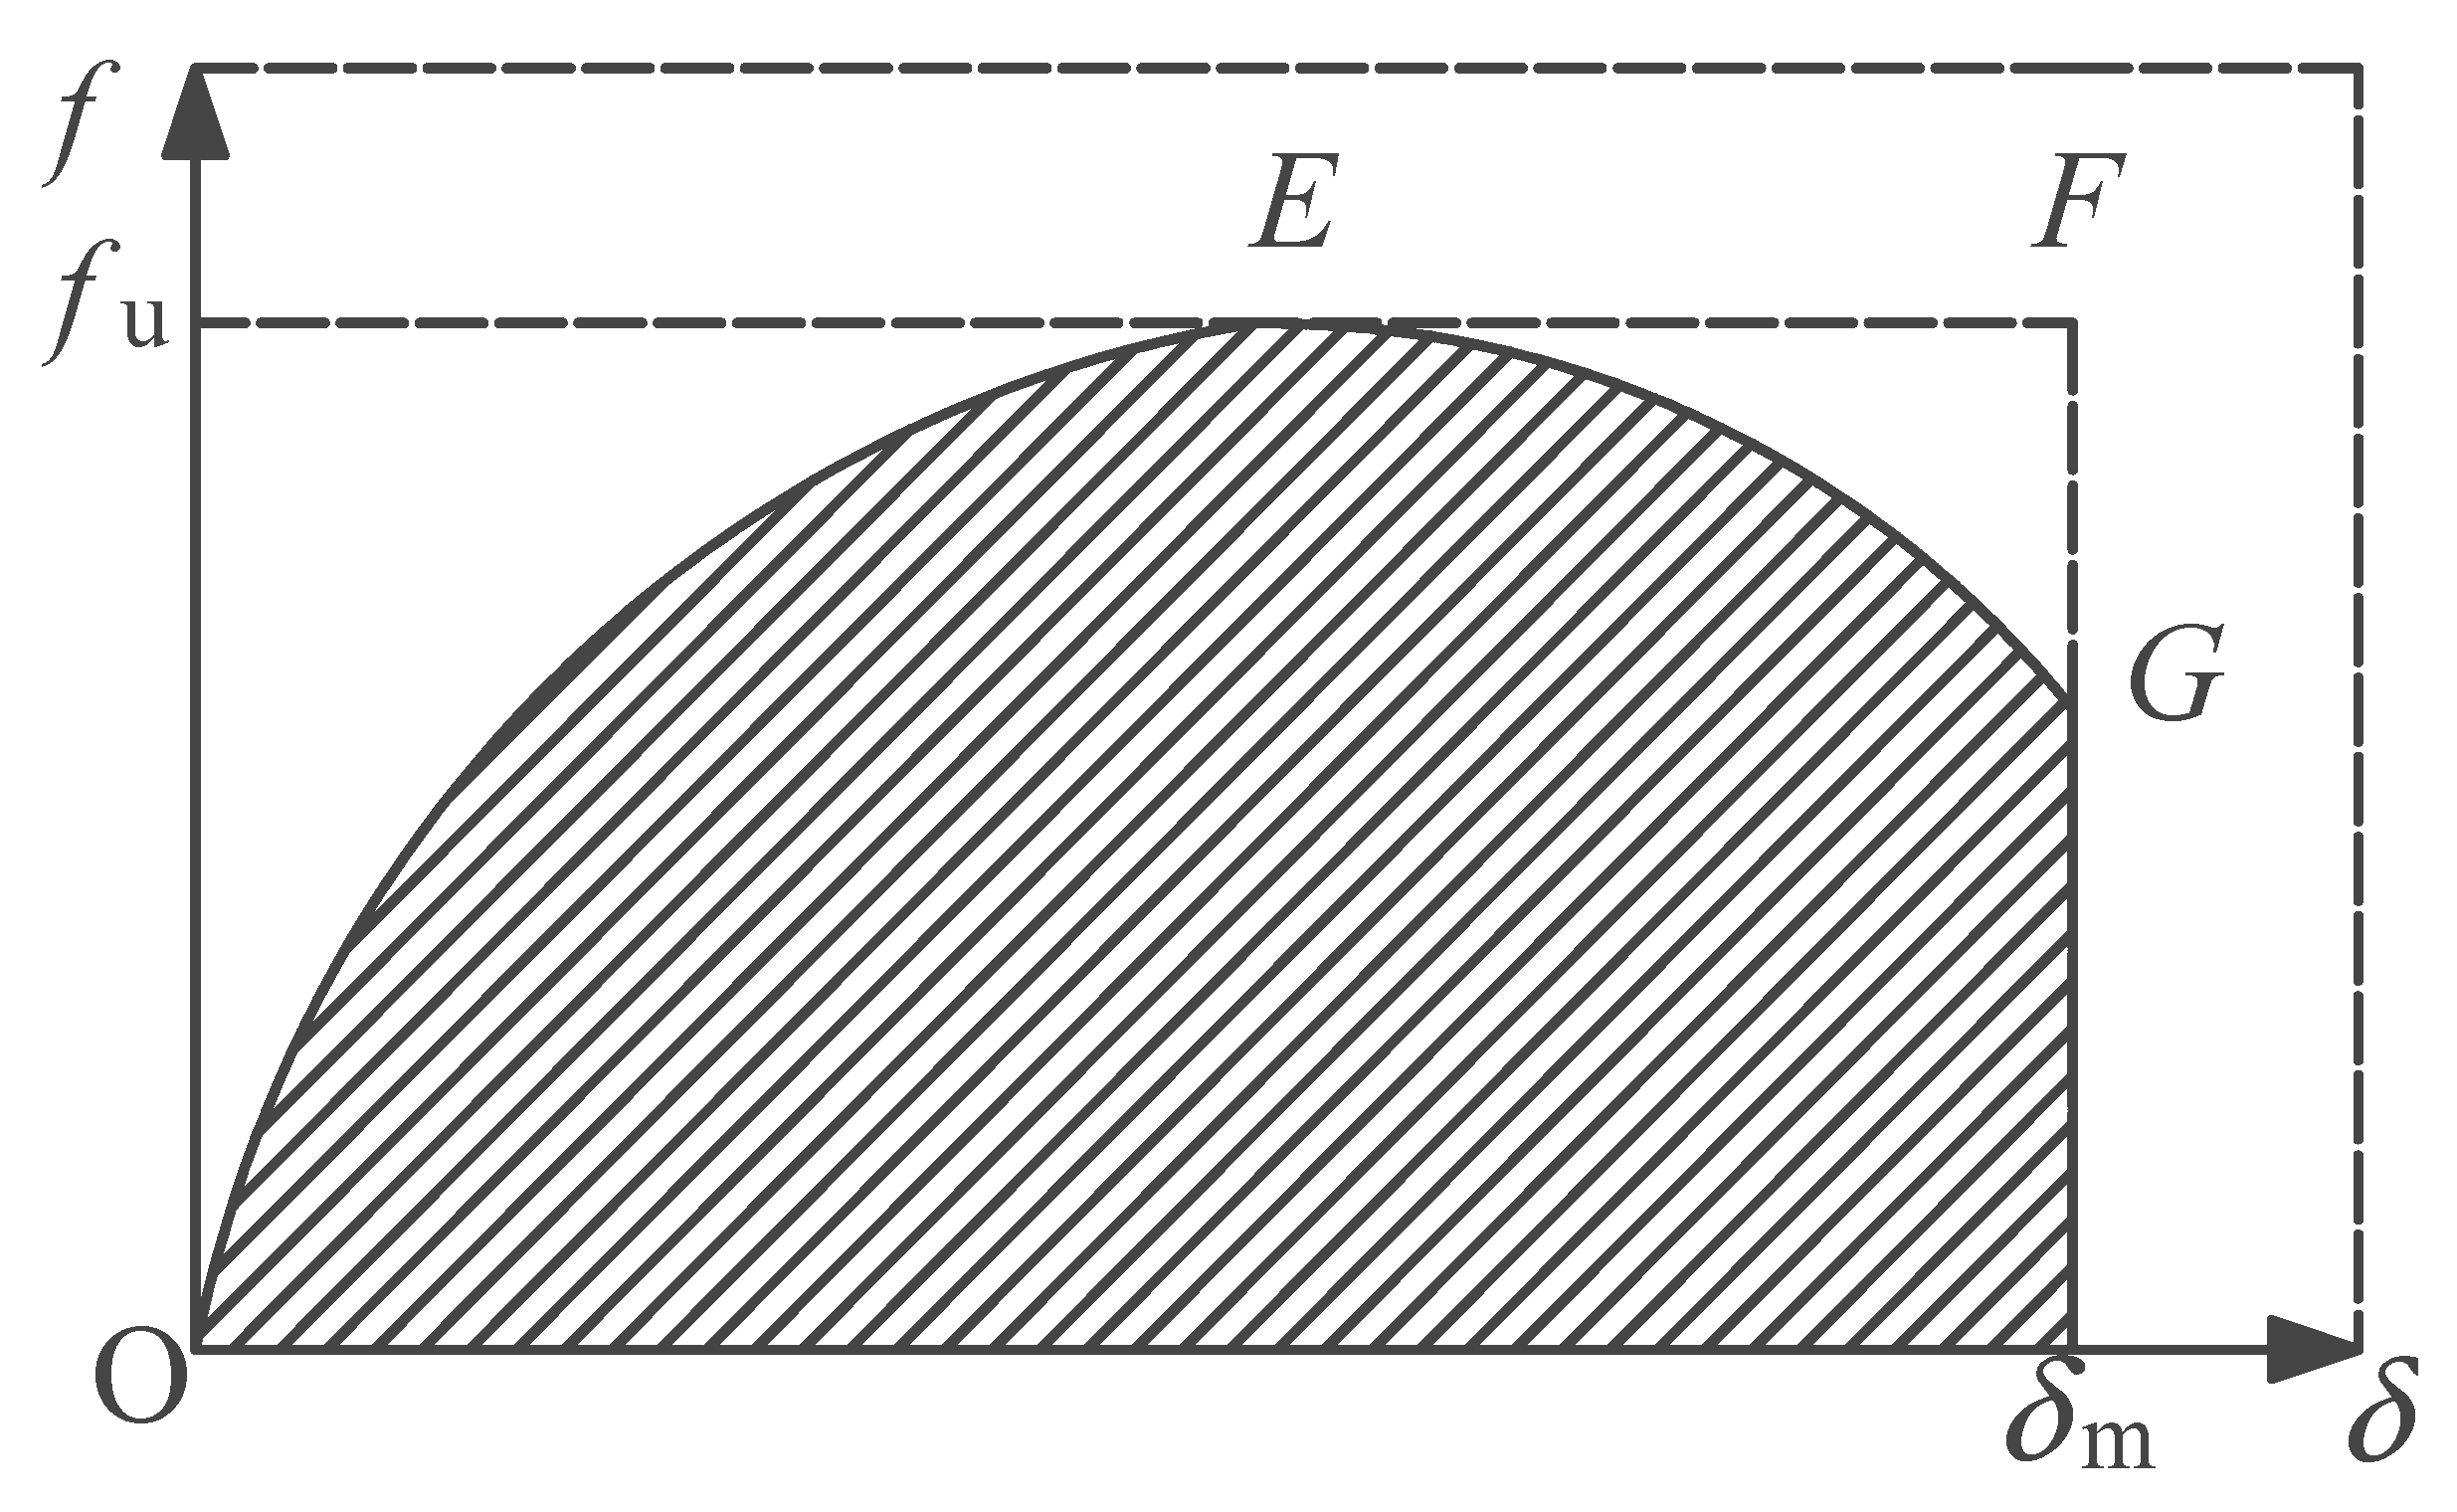
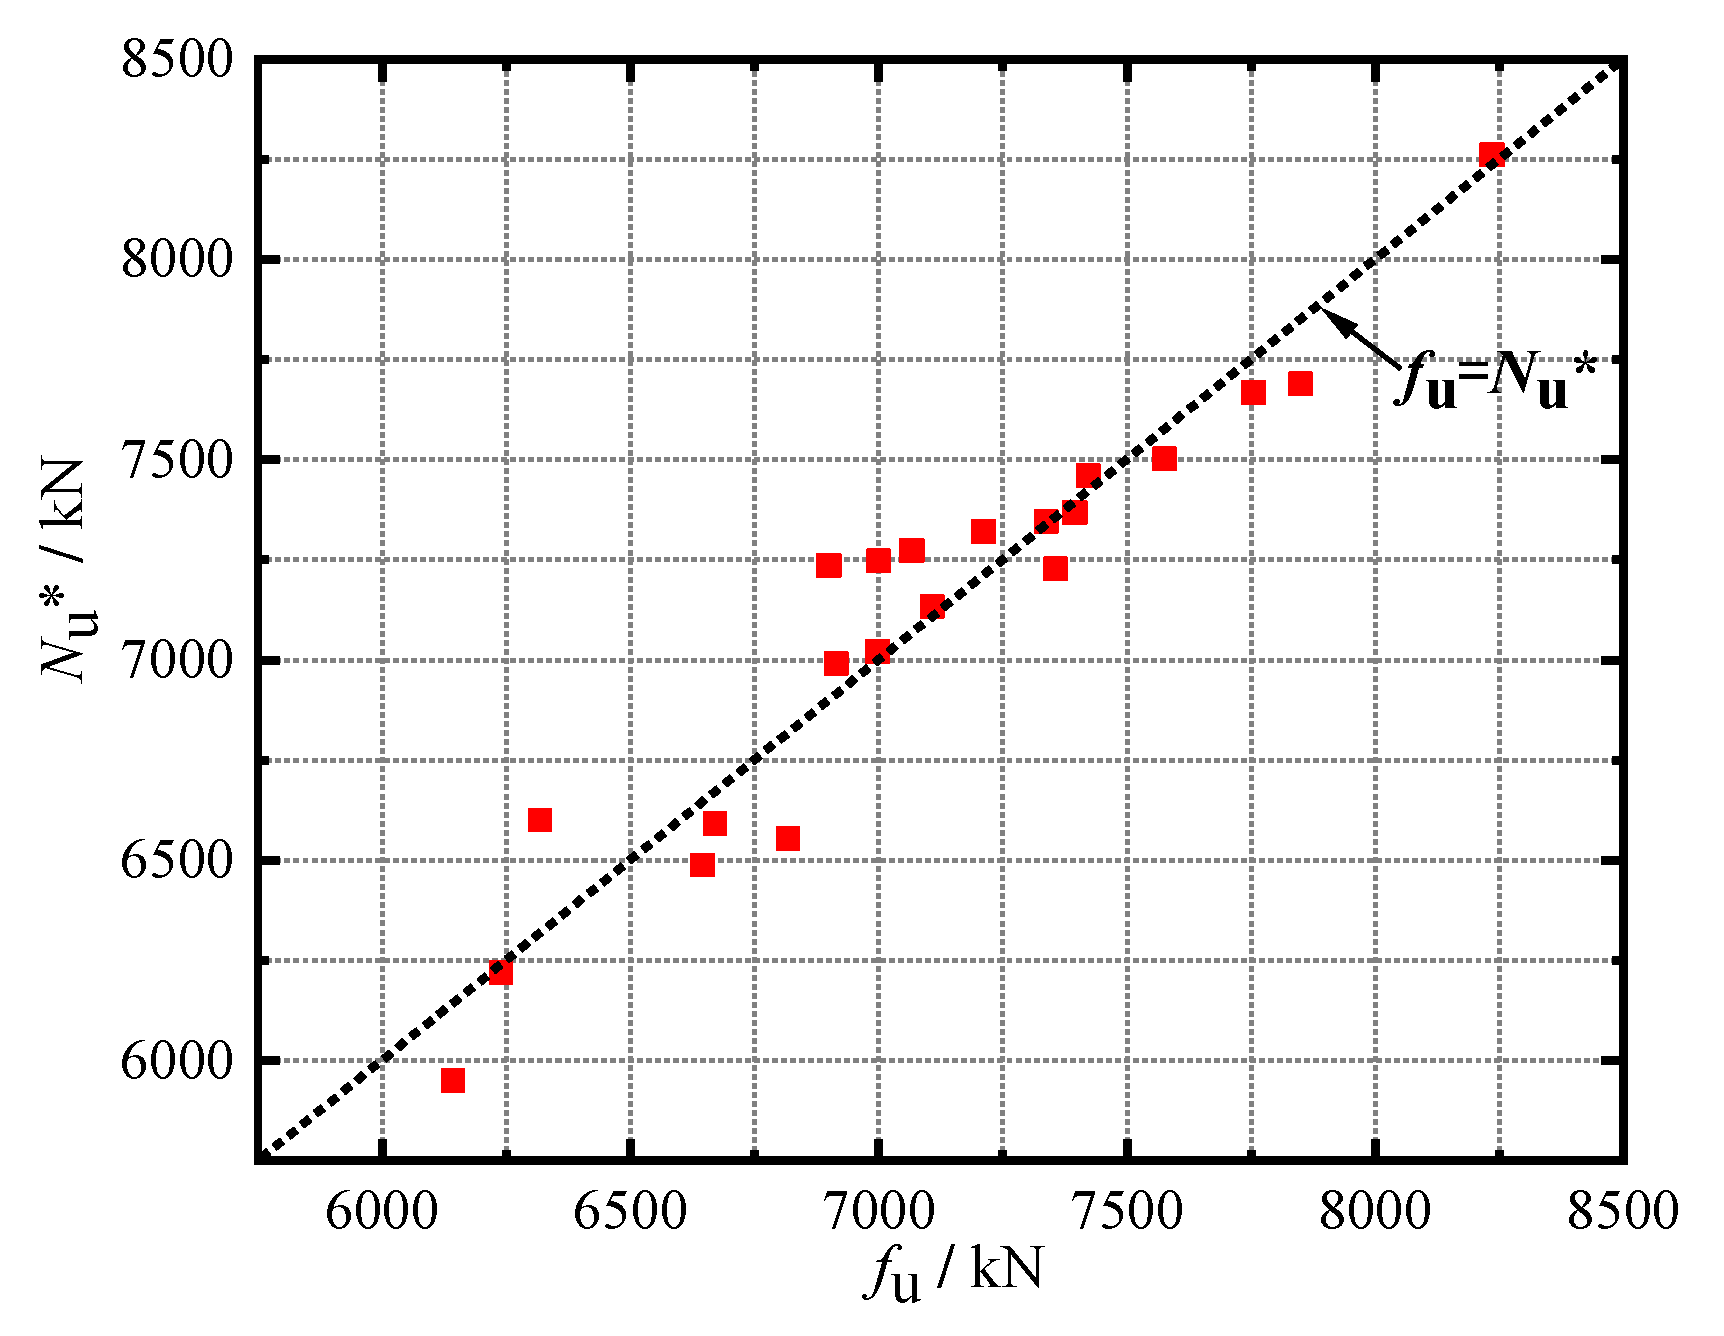
8. Theoretical Bearing Capacity of OGSFRCIN
9. Conclusions
Author Contributions
Funding
Data Availability Statement
Conflicts of Interest
References
- Al-Kodmany, K. The Sustainability of Tall Building Developments: A Conceptual Framework. Buildings 2018, 8, 7. [Google Scholar] [CrossRef] [Green Version]
- Elena, G. Development of high-rise buildings: Digitalization of life cycle management. E3S Web Conf. 2018, 33, 03063. [Google Scholar]
- Fang, X.D.; Han, X.L.; Wei, H.; Ji, J.; Huang, C.; Tang, J.M. Experimental study on plannar intersecting connections used in obliquely crossing mega lattice of the Guangzhou West Tower. J. Build. Struct. 2010, 31, 56–62. (In Chinese) [Google Scholar]
- Han, X.L.; Huang, C.; Fang, X.D.; Wei, H.; Ji, J.; Tang, J.M. Experimental study on spatial intersecting connections used in obliquely crossing mega lattice of the Guangzhou West Tower. J. Build. Struct. 2010, 31, 63–69. (In Chinese) [Google Scholar]
- Han, X.; Huang, C.; Ji, J.; Wu, J. Experimental and numerical investigation of the axial behavior of connection in cfst diagrid structures. Tsinghua Sci. Technol. 2008, 13, 108–113. [Google Scholar] [CrossRef]
- Guo, J.; Shi, Q.; Ma, G.; Cai, W.; Li, T.; Yang, R. Mechanical Behavior of Concrete-filled Steel Tubular Space Intersecting Nodes in High-rise Oblique Diagrid Tube Structures. KSCE J. Civ. Eng. 2022, 26, 4584–4602. [Google Scholar] [CrossRef]
- Zhou, W.; Zhang, J.; Cao, Z. Experiment and Analysis on X-Shaped Reinforced Concrete Joint in Diagrid Structures. ACI Struct. J. 2013, 110, 51684398. [Google Scholar] [CrossRef]
- Kim, Y.-J.; Kim, M.-H.; Jung, I.-Y.; Ju, Y.K.; Kim, S.-D. Experimental investigation of the cyclic behavior of nodes in diagrid structures. Eng. Struct. 2011, 33, 2134–2144. [Google Scholar] [CrossRef]
- Huang, C.; Han, X.L.; Wang, C.F.; Ji, J.; Li, W.Y. Parametric analysis and simplified calculating method for diagonal grid structural system. J. Build. Struct. 2010, 31, 70–77. (In Chinese) [Google Scholar]
- Huang, C.; Han, X.L.; Ji, J.; Xie, W.Q. Theoretical investigation into axial bearing capacity of planar intersecting connections of concrete-filled steel tube. J. South China Univ. Technol. 2010, 38, 128–134. (In Chinese) [Google Scholar]
- Wu, D.; Yang, T.; Xiong, Y.; Tesfamariam, S. Experimental assessment on aseismic capacity of a perimeter diagrid concrete core structure: Shake table tests. Measurement 2022, 203, 111925. [Google Scholar] [CrossRef]
- Song, S.; Zhang, C. Performance-based plastic design and seismic performance evaluation of twisted diagrids with shear links. Struct. Des. Tall Spéc. Build. 2022, 31, e1974. [Google Scholar] [CrossRef]
- Shi, Q.; Ying, Y.; Wang, B. Experimental investigation on the seismic performance of concrete-filled steel tubular joints in diagrid structures. Structures 2021, 31, 230–247. [Google Scholar] [CrossRef]
- Fu, Q.; Wang, X.; Dai, T. Research on Mechanical Behaviour of High-rise Diagonal Grid Tube Structure and Case study. IOP Conf. Ser. Mater. Sci. Eng. 2019, 603, 032026. [Google Scholar] [CrossRef]
- Azari-Dodaran, N.; Ahmadi, H. Static behavior of offshore two-planar tubular KT-joints under axial loading at fire-induced elevated temperatures. J. Ocean Eng. Sci. 2019, 4, 352–372. [Google Scholar] [CrossRef]
- Nassiraei, H. Static strength of tubular T/Y-joints reinforced with collar plates at fire induced elevated temperature. Mar. Struct. 2019, 67, 102635. [Google Scholar] [CrossRef]
- Gao, F.; Zhu, H.; Liang, H.; Tian, Y. Post-fire residual strength of steel tubular T-joint with concrete-filled chord. J. Constr. Steel Res. 2017, 139, 327–338. [Google Scholar] [CrossRef]
- Lie, S.; Li, T.; Shao, Y.; Vipin, S. Plastic collapse load prediction of cracked circular hollow section gap K-joints under in-plane bending. Mar. Struct. 2016, 50, 20–34. [Google Scholar] [CrossRef]
- Wang, B.; Shi, Q.; Cai, W. Seismic behavior and damage assessment of concrete-filled steel tube columns in diagrid structures. Struct. Des. Tall Spéc. Build. 2021, 31, e1904. [Google Scholar] [CrossRef]
- Jun, T.; Liang, G.W.; Sheng, R.B.; Hua, L.Z. Seismic Performance Research of High-Rise Diagrid Tube-Core Tube Structures. Adv. Mater. Res. 2010, 163–167, 2005–2012. [Google Scholar]
- Jun, T.; Liang, G.W.; Sheng, R.B.; Hua, L.Z.; Jun, D.C. Research on Seismic Performance Objectives of High-Rise Diagrid Tube Structures. Adv. Mater. Res. 2010, 163–167, 1100–1106. [Google Scholar]
- Karalar, M.; Özkılıç, Y.O.; Aksoylu, C.; Sabri, M.M.; Beskopylny, A.N.; Stel’Makh, S.A.; Shcherban, E.M. Flexural behavior of reinforced concrete beams using waste marble powder towards application of sustainable concrete. Front. Mater. 2022, 9, 1068791. [Google Scholar] [CrossRef]
- Çelik, A.İ.; Özkılıç, Y.O.; Zeybek, Ö.; Karalar, M.; Qaidi, S.; Ahmad, J.; Burduhos-Nergis, D.D.; Bejinariu, C. Mechanical Behavior of Crushed Waste Glass as Replacement of Aggregates. Materials 2022, 15, 8093. [Google Scholar] [CrossRef] [PubMed]
- Qaidi, S.; Najm, H.M.; Abed, S.M.; Özkılıç, Y.O.; Al Dughaishi, H.; Alosta, M.; Sabri, M.M.; Alkhatib, F.; Milad, A. Concrete Containing Waste Glass as an Environmentally Friendly Aggregate: A Review on Fresh and Mechanical Characteristics. Materials 2022, 15, 6222. [Google Scholar] [CrossRef] [PubMed]
- Karalar, M.; Bilir, T.; Çavuşlu, M.; Özkiliç, Y.O.; Sabri, M.M. Use of recycled coal bottom ash in reinforced concrete beams as replacement for aggregate. Front. Mater. 2022, 9, 1064604. [Google Scholar] [CrossRef]
- Zeybek, Ö.; Özkılıç, Y.O.; Karalar, M.; Çelik, A.İ.; Qaidi, S.; Ahmad, J.; Burduhos-Nergis, D.D.; Burduhos-Nergis, D.P. Influence of Replacing Cement with Waste Glass on Mechanical Properties of Concrete. Materials 2022, 15, 7513. [Google Scholar] [CrossRef] [PubMed]
- Maedeh, H.; Mehdi, D.; Elham, A. Three-dimensional multiscale simulations of recycled aggregate concrete employing energy homogenization and finite element approaches. Constr. Build. Mater. 2022, 328, 127110. [Google Scholar]
- Topçu, I.B.; Şengel, S. Properties of concretes produced with waste concrete aggregate. Cem. Concr. Res. 2004, 34, 1307–1312. [Google Scholar] [CrossRef]
- Li, J.; Guo, M.Q. The Technical and Economic Analysis about Recycled Concrete. Adv. Mater. Res. 2011, 374–377, 1614–1618. [Google Scholar] [CrossRef]
- Eguchi, K.; Teranishi, K.; Nakagome, A.; Kishimoto, H.; Shinozaki, K.; Narikawa, M. Application of recycled coarse aggregate by mixture to concrete construction. Constr. Build. Mater. 2007, 21, 1542–1551. [Google Scholar] [CrossRef]
- Butler, L.; West, J.; Tighe, S. The effect of recycled concrete aggregate properties on the bond strength between RCA concrete and steel reinforcement. Cem. Concr. Res. 2011, 41, 1037–1049. [Google Scholar] [CrossRef]
- Mas, B.; Cladera, A.; del Olmo, T.; Pitarch, F. Influence of the amount of mixed recycled aggregates on the properties of concrete for non-structural use. Constr. Build. Mater. 2012, 27, 612–622. [Google Scholar] [CrossRef]
- Dong, C.; Zhang, Q.; Chen, C.; Jiang, T.; Guo, Z.; Liu, Y.; Lin, S. Fresh and hardened properties of recycled plastic fiber reinforced self-compacting concrete made with recycled concrete aggregate and fly ash, slag, silica fume. J. Build. Eng. 2022, 62, 105384. [Google Scholar] [CrossRef]
- Bai, G.; Liu, B. Nonlinear finite element analysis of bond-slip performance of recycled aggregate concrete filled circular steel tube. J. Adhes. Sci. Technol. 2019, 33, 1294–1319. [Google Scholar] [CrossRef] [Green Version]
- Yu, F.; Fang, Y.; Zhang, Y.; Xu, L.; Bai, R. Mechanical behavior of self-stressing steel slag aggregate concrete filled steel tubular stub columns. Struct. Concr. 2020, 21, 1597–1611. [Google Scholar] [CrossRef]
- Zheng, Y.; He, D.; Yan, G.; Mbanda, E. Axial compressive behaviour of stainless steel tube-confined steel-reinforced recycled concrete stub columns. J. Constr. Steel Res. 2022, 199, 107597. [Google Scholar] [CrossRef]
- Zhou, J.; Zhao, L.; Wang, Y.; Zhao, Q. Research on Axial Compression Performance of Waste Fiber Recycled Concrete Column. IOP Conf. Ser. Earth Environ. Sci. 2020, 455, 012089. [Google Scholar] [CrossRef]
- Nasir, A.M.; Waqas, A.; Kaffayatullah, K.; Ayaz, A. Steel Fiber-Reinforced Concrete: A Systematic Review of the Research Progress and Knowledge Mapping. Materials 2022, 15, 6155. [Google Scholar]
- Xu, J.X.; Xiao, J.Z.; Luo, S.R.; Zhang, Q.T. Research progress and prospect of fiber-recycled concrete. Ind. Constr. 2022, 52, 10–17+31. (In Chinese) [Google Scholar]
- Mihai, I.C.; Jefferson, A.D.; Lyons, P. A plastic-damage constitutive model for the finite element analysis of fibre reinforced concrete. Eng. Fract. Mech. 2016, 159, 35–62. [Google Scholar] [CrossRef] [Green Version]
- Wu, K.; Qian, S.; Zheng, H.; Zhou, Y.; Zhu, R. Energy dissipation and damage on the interface of steel and steel fiber-reinforced concrete composite column. Struct. Des. Tall Spéc. Build. 2022, 31, 1984. [Google Scholar] [CrossRef]
- Su, Q. Strengths of Recycled Concrete Added with Steel Fiber. Arch. Civ. Eng. 2020, 66, 693–703. [Google Scholar] [CrossRef]
- Zhou, J.H.; Kang, T.B.; Wang, F.C.; Dong, W. Experimental study on fracture properties of Waste fiber recycled concrete. MATEC Web Conf. 2016, 63, 03015. [Google Scholar] [CrossRef]
- Zhang, P.; Wang, C.; Gao, Z.; Wang, F. A review on fracture properties of steel fiber reinforced concrete. J. Build. Eng. 2023, 67. [Google Scholar] [CrossRef]
- Huang, C.; Han, X.-L.; Ji, J.; Tang, J.-M. Behavior of concrete-filled steel tubular planar intersecting connections under axial compression, Part 1: Experimental study. Eng. Struct. 2010, 32, 60–68. [Google Scholar] [CrossRef]
- Qiu, Z.X.; Huang, J.H.; Xie, S.K.; Liu, Z.Y. Application of Shell Element in Finite Element Analysis. Die Mould Technol. 2003, 9–11+15. (In Chinese) [Google Scholar]
- Zhang, X.G.; Chen, Z.P.; Xue, J.Y.; Su, Y.Y. Test and Finite Element Analysis of Seismic Performance for Recycled Aggregate Concrete Filled Circular Steel Tube Column. J. Basic Sci. Eng. 2016, 24, 582–594. (In Chinese) [Google Scholar]
- Yang, Y.-F.; Han, L.-H. Experimental behaviour of recycled aggregate concrete filled steel tubular columns. J. Constr. Steel Res. 2006, 62, 1310–1324. [Google Scholar] [CrossRef]
- Tian, Y. Research on the Compressive Properties of RRACFSTSC and STCRRACSC. Master’s Thesis, Guangzhou University, Guangzhou, China, 2020. (In Chinese). [Google Scholar]
- Wang, F.C.; Zhao, J.; Liu, J.; Chen, J.; Yin, L.L.; Zhu, Y.H. Mechanical Properties of New Type Grouting Sleeves Considering Effect of Steel Bar Eccentricity. J. Univ. Jinan 2022, 36, 549–559. (In Chinese) [Google Scholar]
- Jinjun, X.; Zongping, C.; Jianyang, X.; Yisheng, S.U. Failure mechanism of interface bond behavior between circular steel tube and recycled aggregate concrete by push-out test. J. Build. Struct. 2013, 34, 148–157. (In Chinese) [Google Scholar]
- Zhang, X.G.; Zhou, G.Q.; Fan, Y.H.; Gao, X.; Leng, F.G. Axial compressive property of circular steel tubular stub column filled with basalt-fiber reinforced recycled-concrete. Acta Mater. Compos. Sin. 2023, 40, 369–382. (In Chinese) [Google Scholar]
- Xu, Y.W.; Yao, J.; Li, Z.X. Cyclic axial compression tests on concrete-filled elliptical steel tubular stub columns. J. Harbin Eng. Univ. 2020, 41, 635–642. (In Chinese) [Google Scholar]
- Zhao, Z.Q.; Zhao, J.H.; Deng, Y.J. Experimental study on axial compression performance of steel fiber recycled concrete filled square steel tube short columns. Ind. Constr. 2018, 48, 168–174. (In Chinese) [Google Scholar]
- Huang, C. Research on Compressive Behavior of Intersecting Connection of Concrete Filled Steel Tubular Diagrid Structure. Ph.D. Thesis, South China University of Technology, Guangzhou, China, 2010. (In Chinese). [Google Scholar]


| df (mm) | ld (mm) | Length–Diameter Ratio | Density (g/cm2) | fst (MPa) | Est (MPa) |
|---|---|---|---|---|---|
| 18 | 0.55 | 37.73 | 7.8 | 4500 | 200 |
| Steel Type | Model Number | /Mpa | /Mpa | Ultimate Strength fu/MPa |
|---|---|---|---|---|
| Outer steel pipe | 20 # | 2.06 × 10⁵ | 271.25 | 448.75 |
| Elliptic connecting plate | 20 # | 2.06 × 10⁵ | 271.25 | 448.75 |
| Backing plate | - | 2.00 × 10¹⁰ | - | - |
| Parameter Name | Oblique Angle | Thickness of Reinforcing Ring/mm | Thickness of Connecting Plate/mm | Aggregate Replacement Rate/% | Steel Fiber Content/% | Strength of Concrete/MPa |
|---|---|---|---|---|---|---|
| Standard group | 35° | 14 | 28 | 70 | 1.0 | 60 |
| Change group | 50° | 00 | 05 | 00 | 0.0 | 30 |
| 70° | 05 | 10 | 30 | 0.5 | 80 | |
| 90° | 10 | 20 | 50 | 1.5 | 100 | |
| 100 | 2.0 |
| Control Parameters | Name of Specimen | fu/kN | /mm | /mm | /Mpa | /Mpa | |||
|---|---|---|---|---|---|---|---|---|---|
| Standard group | A35-H14-L28-R70-r1.0-C60 | 7236.01375 | 6.809 | 2.24449 | 319.4 | 63.38 | 1.173 | 0.8293 | 3.8203 |
| Oblique angle | A50-H14-L28-R70-r1.0-C60 | 6991.72583 | 5.747 | 16.355 | 446.1 | 84.07 | 1.133 | 0.8378 | 4.3533 |
| A70-H14-L28-R70-r1.0-C60 | 7247.85478 | 6.253 | 38.9845 | 448.8 | 70.81 | 1.175 | 0.8232 | 4.0039 | |
| A90-H14-L28-R70-r1.0-C60 | 6553.98520 | 5.738 | 1.04889 | 321.3 | 70.14 | 1.062 | 0.8877 | 4.3684 | |
| Thickness of reinforcing ring | A35-H00-L28-R70-r1.0-C60 | 7227.14603 | 6.541 | 7.65638 | 328.3 | 85.90 | 1.172 | 0.8371 | 3.8247 |
| A35-H05-L28-R70-r1.0-C60 | 7320.86941 | 7.100 | 7.29164 | 318.4 | 89.58 | 1.1867 | 0.8324 | 3.5197 | |
| A35-H10-L28-R70-r1.0-C60 | 7273.08419 | 6.807 | 3.9857 | 331.5 | 86.78 | 1.179 | 0.8416 | 3.6749 | |
| Thickness of connecting plate | A35-H14-L05-R70-r1.0-C60 | 5948.96577 | 17.862 | 5.09543 | 448.8 | 117.5 | 0.964 | 0.8905 | 1.3867 |
| A35-H14-L10-R70-r1.0-C60 | 6600.43058 | 6.265 | 1.26429 | 447.7 | 92.39 | 1.070 | 0.8803 | 3.9914 | |
| A35-H14-L20-R70-r1.0-C60 | 6592.34037 | 13.216 | 2.3313 | 448.1 | 121.3 | 1.069 | 0.8828 | 1.9044 | |
| Aggregate replacement rate | A35-H14-L28-R00-r1.0-C60 | 7689.63622 | 7.359 | 0.42633 | 328.48 | 103.1 | 1.2465 | 0.8573 | 3.3921 |
| A35-H14-L28-R30-r1.0-C60 | 7502.58422 | 7.360 | 4.09687 | 327.2 | 94.80 | 1.216 | 0.8487 | 3.5256 | |
| A35-H14-L28-R50-r1.0-C60 | 7369.37741 | 6.806 | 3.77469 | 327.6 | 87.22 | 1.195 | 0.8445 | 3.6682 | |
| A35-H14-L28-R100-r1.0-C60 | 6488.53992 | 10.620 | 2.15318 | 309.6 | 62.33 | 1.052 | 0.8396 | 2.3512 | |
| Steel fiber content | A35-H14-L28-R70-r0.0-C60 | 7021.99553 | 6.780 | 3.38474 | 326.0 | 80.23 | 1.138 | 0.8405 | 3.6687 |
| A35-H14-L28-R70-r0.5-C60 | 7132.26716 | 6.805 | 5.84078 | 325.9 | 83.66 | 1.156 | 0.8388 | 3.6680 | |
| A35-H14-L28-R70-r1.5-C60 | 7345.427196 | 6.814 | 5.92158 | 325.4 | 90.18 | 1.191 | 0.8385 | 3.6681 | |
| A35-H14-L28-R70-r2.0-C60 | 7460.76856 | 6.820 | 4.24676 | 324.5 | 93.68 | 1.209 | 0.8368 | 3.6683 | |
| Strength of concrete | A35-H14-L28-R70-r1.0-C30 | 6219.89703 | 6.535 | 1.19423 | 317.4 | 58.46 | 1.300 | 0.8514 | 3.8274 |
| A35-H14-L28-R70-r1.0-C80 | 7668.49790 | 6.794 | 9.46725 | 321.2 | 110.3 | 1.081 | 0.8123 | 3.6800 | |
| A35-H14-L28-R70-r1.0-C100 | 8261.81744 | 8.096 | 4.4975 | 337.5 | 151.3 | 1.031 | 0.8358 | 3.0878 | |
| Comparison group | A35-H14-L28-R30-r2.0-C60 | 7699.87340 | 13.081 | 5.5950 | 330.2 | 108.1 | 1.248 | 0.8413 | 3.440 |
| A35-H14-L28-R00-r0.0-C60 | 7810.63980 | 14.347 | 4.4840 | 302.6 | 120.8 | 1.266 | 0.8668 | 3.485 |
Disclaimer/Publisher’s Note: The statements, opinions and data contained in all publications are solely those of the individual author(s) and contributor(s) and not of MDPI and/or the editor(s). MDPI and/or the editor(s) disclaim responsibility for any injury to people or property resulting from any ideas, methods, instructions or products referred to in the content. |
© 2023 by the authors. Licensee MDPI, Basel, Switzerland. This article is an open access article distributed under the terms and conditions of the Creative Commons Attribution (CC BY) license (https://creativecommons.org/licenses/by/4.0/).
Share and Cite
Zhao, J.; Wang, F.; Zhu, Y.; Yang, B. Mechanical Properties of Steel Fiber-Reinforced, Recycled, Concrete-Filled Intersecting Nodes in an Oblique Grid. Buildings 2023, 13, 935. https://doi.org/10.3390/buildings13040935
Zhao J, Wang F, Zhu Y, Yang B. Mechanical Properties of Steel Fiber-Reinforced, Recycled, Concrete-Filled Intersecting Nodes in an Oblique Grid. Buildings. 2023; 13(4):935. https://doi.org/10.3390/buildings13040935
Chicago/Turabian StyleZhao, Jun, Feicheng Wang, Yinhong Zhu, and Bai Yang. 2023. "Mechanical Properties of Steel Fiber-Reinforced, Recycled, Concrete-Filled Intersecting Nodes in an Oblique Grid" Buildings 13, no. 4: 935. https://doi.org/10.3390/buildings13040935