Abstract
In construction Industries, superior fresh and hardened concrete qualities play a significant role in which self-compacting concrete (SCC) is widely introduced. On the other hand, considering the depletion of river sand, manufactured sand (M-sand), created by crushing rock deposits, has been recognized as viable. However, still, there is a lack of understanding of the strength aspect of SCC with M-sand replacement along with admixtures such as Alccofine and silica fume. Therefore, experimental investigations are conducted in SCC by partially and completely replacing river sand with M-sand. Furthermore, to reduce the negative impacts of cement, such as energy consumption and environmental pollution, 10% and 12% pozzolanic materials were added, such as silica fumes and alccofine. Moreover, to examine the impacts on rheological and mechanical properties, EFNARC guidelines were used and measured the compressive strength, impact resistance, bond strength, and flexural and splitting tensile strengths. The test results indicate that incorporating the M-sand as a full replacement in the mix increased the compressive strength by 6.82% for M50 grades of concrete compared to reference SCC after a 28-day curing period. Microstructural analyses such as SEM (Scanning Electron Microscope), EDS (Energy-Dispersive Spectroscopy), XRD (X-ray diffraction), and FTIR (Fourier Transform Infrared Spectroscopy) techniques were also used to study the hydration phase of the M-sand SCC mix when compared to the conventional SCC mix.
1. Introduction
Concrete as a building material has many uses as the construction industry develops and grows. Concrete needs sufficient vibrational compaction to release trapped air and create a denser, more homogeneous mix [1]. Among the various kinds of concrete, Self-Compacting Concrete (SCC) has made excellent advancements in construction industries [2,3]. As a result of SCC and its widespread acceptance around the globe, new avenues for building various civil engineering structures have been created [4]. The SCC method of placing concrete has significantly impacted the concrete placement and construction process [5]. It is undoubtedly the most significant advancement in concrete technology in recent years [6]. Although the SCC relative contribution of aggregates is relatively lower than this substance, Normally Vibrated Concrete (NVC) remains a significant component of SCC and significantly affects both the properties of freshly formed concrete and hardened concrete [7]. Without using any outside assistance, it accomplishes compaction through its self-weight. Congested reinforcements and the whole formwork are also filled in with this concrete [8]. High workability, filling ability, the ability to segregate, and resistance to bleeding of the concrete matrix constitute the superior qualities of SCC [9,10]. By improving the composition of the finer content, SCC can achieve this rheological property [11]. However, considering the aspect of natural raw materials such as river sand, which has been exploited further day by day, has brought a new era of concern of replacement either via locally available materials or the reuse of the waste material. Numerous studies in the literature have encountered the replacement of fine aggregate, such as rice husk ash [12,13,14], coconut shell aggregate [15,16,17], and oil palm shell [18,19] replacement. For instance, Shettima et al. [20] investigated the influence of iron ore tailing as a fine aggregate and concluded the durability and carbonation properties in concrete. Modani and Vyawahare et al. [21] used Bagasse Ash as the suitability of volume replacement with natural sand to show its potentiality in concrete for its strength and durability characteristics. Al Jabri et al. [22] investigated the effect of copper slag as a fine aggregate replacement in high-strength concrete to improve the workability and consistency of the concrete matrix. Though many outcomes have resulted from using these materials as fine aggregate, they were neither degradable nor reusable. Manufactured Sand (M-sand) is primarily produced during the crushing of rock in a quarry, leaving an enormous amount discarded worldwide, which is considered the main origin of the idea of replacing natural river sand [23]. The literature suggested by Gardner et al. [24], Chen et al., and Shen et al. [25] confronted the usage of M-sand in concrete as q fine aggregate. However, limited studies have been carried out on Self-Compacting Concrete (SCC) as a replacement.
In SCC, a Supplementary Cementitious Material (SCM) is used to improve its strength, durability, and workability and reduce costs. Despite this, it uses a lower ratio of water to binder (w/b) and daintiness of mineral admixtures [26]. The commonly used SCM is silica fume, Ground Granulated Blast Furnace Slag (GGBS), Fly ash, metakaolin, etc. All these SCMs make the compaction process of SCC simpler and easy to handle. However, considering the prospective point of fresh ability, flowability, and stability, pozzolanic materials need to be finer to react with cement to produce void-free hydration products. Alccofine is one such ultra-fine pozzolanic material incorporated in the SCC to analyze its performance [27].
Therefore, the paper presents the experimental and microstructural investigation of the development of SCC by replacing river sand with M-sand using SCM such as silica fume and Alccofine. The study evolves the outcomes of rheological properties by conducting a slump flow test, V funnel test, and L box Test. The mechanical properties such as compressive strength, split tensile strength, flexural strength test, impact resistance, and bond properties are examined. Moreover, the study looks into the effect of hydration of products through Scanning electron microscopy (SEM), X-ray Diffraction (XRD), Energy-Dispersive Spectroscopy (EDX), and Fourier Transform Infrared Spectroscopy (FTIR).
2. Research Significance
Self-compacting concrete is becoming increasingly necessary with the advancements in concrete technology when considering the aspect of vibration techniques, which are not possible in different sectors. Therefore, to carry out an extensive study on the flowability, filling, passing ability, and segregation in concrete structures, an extensive experimental study is conducted using manufactured sand as a fine aggregate replacement in different proportions with a pozzolanic combination of alccofine and silica fume.
3. Experimental Investigation
3.1. Materials
Ordinary Portland Cement (OPC) 53 grade was used as a binder with a specific gravity of 3.13 in accordance with IS 12269: 2013 [28], fine aggregate with natural river sand below 4.75 mm in size with a specific gravity of 2.68 was used according to IS 383:2016 [29], and M-sand was collected from the locally available quarry with a specific gravity 2.76. The mineral admixtures alccofine and micro silica, with a specific gravity of 2.86 and 2.25, respectively, were used in this study. A low-calcium silicate called alccofine was added to the SCC mix to improve the workability properties by combining micro silica with the Ca(OH)2 production during the cement hydration process, enhancing the cementitious C-S-H gel and strengthening the cementitious C-S-H gel the mixes. In addition, coarse aggregate with a specific gravity of 2.68 that complies with IS 383: 2016 [29] in sizes ranging from 10 mm to 12.5 mm was used. According to BS 5075-1:1985, BS: EN 934-2, and ASTM C494, the Conplast SP430 admixture was used [30,31,32]. Conplast SP430 is a water reducer composed of specific polymers of sulphonated naphthalene free of chloride. It immediately dissolves in water as a brown solution. The superplasticizer had a specific gravity of 1.18 at 25 °C. Table 1 and Table 2 show the physical and chemical characteristics of the superplasticizer.

Table 1.
The physical properties of cementitious materials.
Table 2.
The chemical properties of cementitious materials.
Particle Size Distribution
The particle size distribution (PSD) curves of M-sand in relation to river sand are shown in Figure 1. The particles in river sand range in size from 0.3 mm to 2 mm, and the gradation of the distribution is more uniform. The particle sizes of M-sand exhibit a well-graded distribution and range from 0.08 mm to 5 mm. According to the ASTM standard, the sand size should range from 0.075 mm to 4.75 mm. River sand has slightly coarser particles than M-sand, as shown by the PSD curves. River sand, which has a size range of 2 mm to 4.75 mm, has a less than 3% coarser fraction compared to M-sand [33]. The fine fraction of river sand is also low, with 1% of the particles being smaller than 0.1 mm, compared to 7.5% for M-sand. Its well-graded particle size distribution contributes positively to the M-sand having good compaction and high strength.
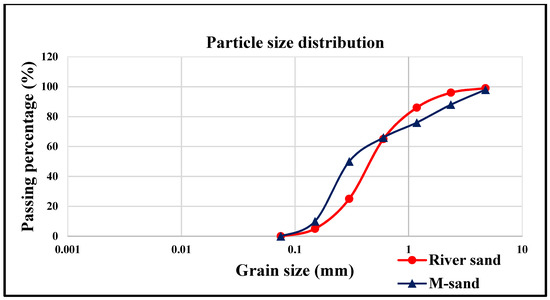
Figure 1.
River sand and M-sand particle size distribution curves.
3.2. Mix Proportions
Five concrete mixes were prepared to evaluate the influence of M-sand in SCC for fresh properties and durability properties. One mix was the control concrete and the other four mixes were developed using M-sand in the following ratios: 25, 50, 75, and 100%. Furthermore, Table 3 includes the mixture ID for each SCC mix along with the mix proportion.
Table 3.
Specifications of all SCC mix ratios of different mixes in kg/m3.
3.3. Rheological Properties
SCC has superior advantages in terms of passing capacity, filling capacity, and resistance to segregation, as stated by several authors [3,13,15,16]. These rheological properties of workability were performed using M50 grade concrete and various M-sand proportions. According to EFNARC guidelines, the properties were observed using the slump flow diameter test, T500 slump time, V funnel time, and L-box blocking ratio.
3.4. Hardened Properties
According to Indian standards IS 516-1959 [34], concrete’s compressive strength, split tensile strength, and flexural strength were measured at 3, 7, and 28 days. ACI 544-2R [35] was used to test the impact strength of disc specimens measuring 152 mm in diameter and 63.5 mm in length at 3, 7, and 28 days. According to ASTM C 234 [36], pull-out tests were performed on the bond specimens. For this study, cube specimens with dimensions of 100 mm × 100 mm × 100 mm were cast. Twisted rods with 10 and 12 mm diameters were employed for the pull-out test.
3.5. Microstructural Characteristics
M-sand influenced the SCC of cured specimens for microstructural study using SEM, EDS, XRD, and an FTIR test. The addition of the mineral admixture, water–cement ratio, hydration period, and cement type used in concrete manufacturing all impact the concrete structure. Self-compacting concrete mixtures’ hydrated phases were identified using microstructure analyses. The samples were collected from the tested specimens after 28 days of curing. The small pieces were extracted from the core of the specimens by cracking [37]. The scanning electron microscope MINI-SEM SNE-3200 M was used to analyze the SEM pictures using energy-dispersive X-rays. SEM techniques revealed cement-hydrated material formation, distribution, and air voids. EDS was used to identify the elements that were present in the composite materials. An XRD Panalytical apparatus was used to identify minerals and crystalline aspects in mixtures. The details were collected at intervals of 10° for a 2θ angle with a range between 0° and 100°. It interprets the obtained peaks (International Crystal Structure Database) using the X-pert high score plus program. To ascertain the molecular bonding groups in concrete samples, FTIR analysis was performed using Bruker Alpha-T equipment with a wavelength range of 400 to 4000 cm−1. To make pellets for analysis, 300 milligrams of KBr powder were combined with 1 milligram of the sample powder.
4. Results and Discussion
4.1. Rheological Properties
As a result of the mix proportions of the self-compacting concrete, the slump flow, T500, L box, and V funnel tests were conducted within 15 min after mixing.
4.1.1. Slump Flow and T500 Test
The SCC flow capacity was analyzed using slump and T500 slump flow tests. Slump flow and T500 variations for SCC mixes are shown in Figure 2. Adding alccofine and micro silica in all proportions produced good deformation and did not alter the characteristics of self-compacting concrete. This could result from adding the M-sand to the mixture, which increased the flow capacity. Our observations indicated that slump flow diameters range between 661 and 780 mm, meeting the guidelines of the EFNARC requirements (650 to 800 mm) and falling into the SF2 category (660 to 750 mm) [38]. It was found that mixes such as SCC, SCCMS25, SCCMS50, SCCMS75, and SCCMS100 exhibited a notable increase compared to other mixes because these mixes have more adhesive properties. Around the edge of the slumped material, there were no visible indications of bleeding water. In addition to measuring the slump flow diameter, T500 tests were performed to determine viscosity and flowability. Our observations showed that the time duration was approximately 4 and 4.8 s, which is within the appropriate limits for the T500 test of 2 to 5 s. The SCC mixture became more miscible as the M-sand content rises. In agreement, the viscosity and flowability increased with increasing time. From a perception viewpoint, it is evident that adding M-sand causes the mix viscosity to increase significantly while still complying with EFNARC standards [38].
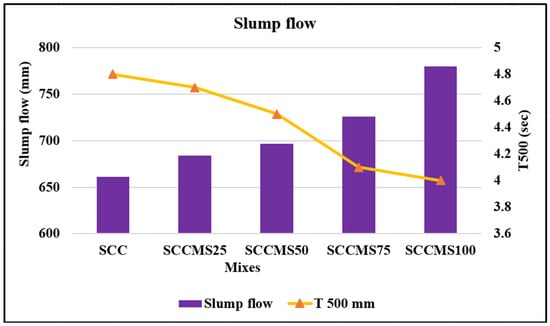
Figure 2.
Slump flow of all mixes.
4.1.2. V-Funnel Test
The filling capacity of SCC was investigated in this study using a V-funnel test. The examination also measured viscosity. All cases agreed well with the EFNARC limits, with the duration for SCC to pass along the V funnel falling between 7 and 12 s (8–12 s) [38]. In addition to the higher concrete viscosity, a longer V-funnel duration indicates a reduced filling capacity for SCC concrete. As shown in Figure 3., the sieve segregation resistance test evaluates the workable SCC resistance to segregation. According to the findings, alccofine and micro silica added to SCC improve its filling capacity and resistance to segregation.
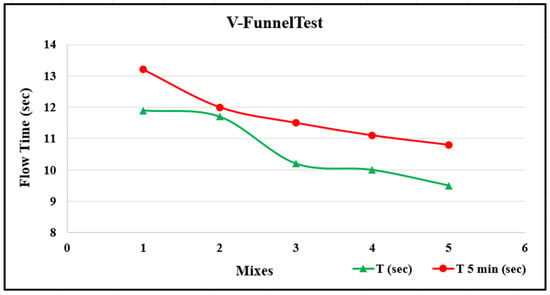
Figure 3.
Flow time of all mixes.
4.1.3. L-Box Test
The L-box test was administered to find the passing capacity of fresh SCC. This test determines whether the concrete can pass through dense, crowded reinforcement without segregation or blocking. The blocking ratio (BR) is used to represent the results. Higher BRs indicate greater possibility and workability. For each mix, the BR difference is highlighted in Figure 4. According to the observations, the BR decreases as the total binder content (518 kg/m3) increases and further decreases due to the M-sand. The L-box test BR results, with a limiting value of 0.8–1.0 and a range of 0.82–0.94, comply with EFNARC standards. There was never any blockage of coarse aggregate behind the bars, as confirmed by visual inspection. As a result, it is evident that incorporating M-sand into SCC in various proportions results in better rheological performance and complies with EFNARC recommendations [38].
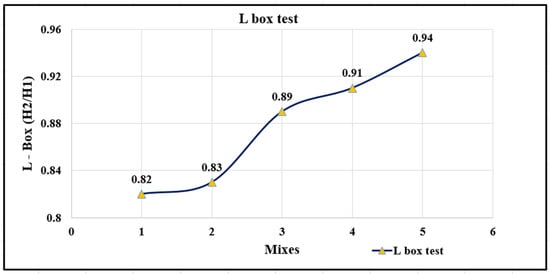
Figure 4.
Results of L-box test of all mixes.
4.2. Mechanical Performance of SCC
The impact of M-sand on SCC is explained in this report, along with the compressive, splitting tensile, flexural, impact resistance, and bond strength.
4.2.1. Compressive Strength
The tests were performed according to ASTM C39 and IS 516-2018 [34,39]. M-sand was used in percentages of 0, 25, 50, 75, and 100% by replacing natural river sand in 100 × 100 × 100 mm cube specimens. Three cubes were tested in nominal mean curing times of 3, 7, and 28 days. The specimen was tested on the compression testing machine with a 2000 kN load capacity. To measure the compressive strength, tests were performed on each replacement. The results of the compression test are shown in Figure 5. In the early stages, all mixtures demonstrated a remarkable increase in compressive strength. This is due to the addition of the mineral admixtures alccofine and silica fume, which fill the capillary pores in the concrete, enhancing the properties of the concrete [40]. According to Figure 5, the 28-day compressive strength differs significantly between conventional SCC and SCC with the M-sand replacement. Conventional SCC was recorded with a strength of 52.67 N/mm2, while SCCMS100 was recorded with a strength of 56.26 N/mm2. The strength increment was found to be 0.303%, 1.496%, 5.829, and 6.821 % when SCC was replaced with 25%, 50%, 75%, and 100%. The complete replacement of M-sand with river sand adversely affected the strength increment up to 6.82%, showing the interlocking effect between the fine and coarse particles ensuring its angular shape and gradation. A similar trend was observed in Ding et al. [41], where the effect of M-sand played a vital role in enhancing the concrete strength regarding its long-term effect. Similarly, Zimar et al. [42] reported the same trend of an increase in the compressive strength of concrete by nearly 10.9% when full replacement with M-sand was considered.
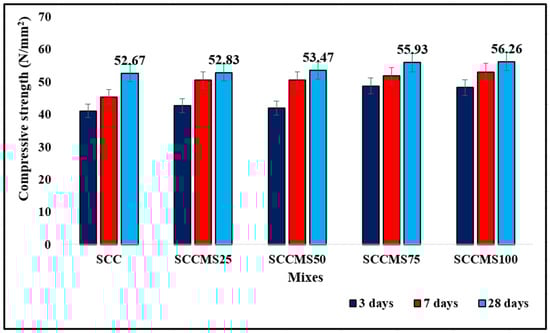
Figure 5.
Compressive strength of all mixes.
4.2.2. Split Tensile Strength
A splitting tensile strength test was performed on cylinders 100 mm in diameter and 200 mm in length according to ASTM C 496 and IS 5816-2018 [43,44]. To test the split tensile strength, the cylinders were cured for 3, 7, and 28 days. A packing strip was placed vertically and horizontally on the load plate to even out the stress distribution on the sample during testing. To measure the splitting tensile strength, the load was applied diametrically until the specimen split. The split tensile strength test outcomes are shown in Figure 6. The strength of the SCC mix at 28 days is significantly similar to that of SCCMS25, SCCMS50, SCCMS75, and SCCMS100. Split tensile strength also demonstrated greater strength for all the mixes when compared with conventional SCC. Pure packing of admixtures with M-sand resulted in sufficient ettringite and CSH formation, leading to strength enhancement during the initial curing period and better performance [45]. The tensile strength of SCC is increased by the addition of alccofine and silica fume as SCMs. As a result of replacing M-sand with concrete, the tensile strength is higher than that of the SCC in the range of 0.315%, 2.167%, 5.296%, and 8.668%. The splitting tensile strength of SCCMS100 increased by 4.43 N/mm2 compared to SCC with 3.16 N/mm2, which is nearly 8.66%. It was discovered that the split tensile strength values for both concrete strength increases are almost 10% of the compressive strength values. This demonstrates that the splitting tensile strength of concrete is also increased when M-sand is used in place of river sand. The same was reported by Magudeaswaran et al. [46], where the compressive strength increased by nearly 30%, and this sudden increase was due to the effect of pozzolans such as silica fume and fly ash.
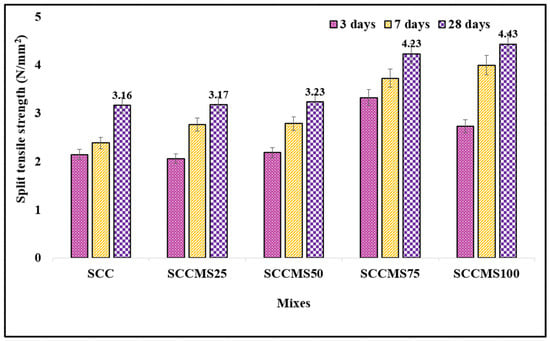
Figure 6.
Split tensile strength of all mixes.
4.2.3. Flexural Strength
As per ASTM C78-84 and IS 516-2018, to test the flexural strength with respect to the three-point bending test, specimens with standard dimensions of the prism of 100 × 100 × 500 mm were used [34,47]. The failure load and point of fracture were recorded after the loading was performed gradually until the fracture. Pure bending theory is applicable because the fracture occurred in the middle third of all tested specimens. The findings of the flexural test are displayed in Figure 7. A similar trend can be seen in the influence of M-sand on the flexural strength of SCC. At 28 days of curing, all the series of SCC mixtures improved in flexural strength when 100% of river sand was substituted with M-sand. Flexural strength for SCC at 28 days is significantly comparable to that for the mixes SCCMS25, SCCMS50, SCCMS75, and SCCMS100. The flexural strength of SCCMS100 is 6.67 N/mm2 at 28 days and is higher by 11.7% in comparison with the SCC mix. For all the mixes used in this study, the typical range for flexural strength of concrete is 10% to 15% of compressive strength resulting in the same conclusion as that of split tensile strength.
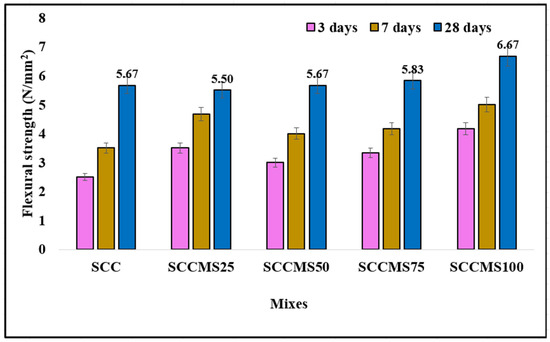
Figure 7.
Flexural strength of different mixes.
4.2.4. Impact Resistance
To assess the impact resistance of mixes, the procedure advised by ACI committee 544.1R-18 was used [48]. The specimen used for this test had dimensions of 63.5 mm in depth and 152.4 mm in diameter. During the impact tests, the number of blows each sample needed to crack for the first time and then for the last time was counted. Figure 8 depicts the impact resistance test samples. In Figure 9, the resistance of impact typically increased with the strength of concrete, for the initial crack and fail. However, it appears that in normal concrete there is a maximum strength further than that, in which that enhancement in strength decreases the impact strength both at the initial crack and at fail. The compressive strength for the SCC series followed the same trend as impact energy. In the M50 grade of SCC, the impact energy increase caused by the M-sand is more noticeable. In this study, SCCMS100’a compressive strength of 56.26 N/mm2 required 96–99 blows to fail, whereas the literature indicates that the required number of blows of SCC with compressive strength of approximately 52.67 N/mm2 is in the range of 54–59. The higher bulk density and finer particles of the M-sand, as well as its high impact resistance, may be held responsible for this rise. Based on the results, it was evident that both alccofine and silica fume enhance strength.
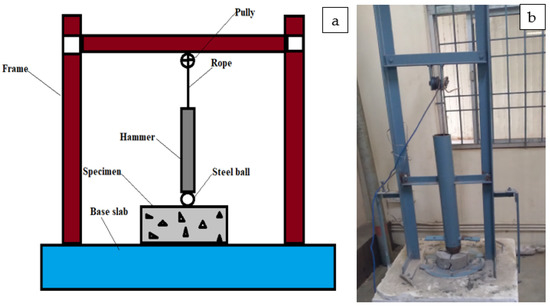
Figure 8.
Impact test on disk: (a) Schematic diagram; (b) test setup.

Figure 9.
Impact resistance at initial crack.
4.2.5. Bond Strength
In general, bonding in concrete refers to the adhesion between reinforcement and the surrounding concrete. Due to this adhesion, reinforced concrete can function as a single composite structure and transfer loads well. For each of the mixtures used by ASTM C 234 [36], pull-out tests were investigated on the bond samples. An embedded reinforcement bar was tested for bond strength between reinforcement and concrete under a pull-out load. This resistance was a crucial component of RC structures. For this study, cube specimens with dimensions of 100 mm × 100 mm × 100 mm were cast. The test setup as shown in Figure 10. Twisted rods with a diameter of 10 and 12 mm were both employed for the pull-out test. In the specimen, the deformed bars had a firm grip on the concrete along their entire length. This illustrates how the bond strength was significantly increased by the deformed bar’s exterior outcrop [49]. The bond strength test outcomes are depicted in Figure 11. The bond strength decreases with decreasing diameter of the bar, indicating a relationship between diameter and bond strength; however, bond strength does not seem to be related to different crack widths at the beginning [50]. Based on the applied load, bar diameter, and embedding length, the bond strength was expressed as a function [49]. Many factors contributed to bond strength, including the curing conditions, concrete compressive strength, and length [50].
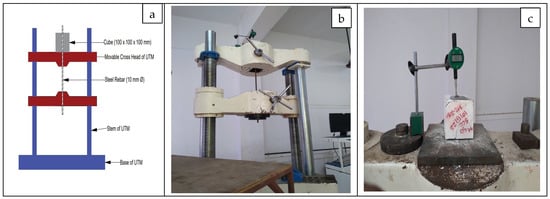
Figure 10.
Pull out test on cube: (a) Schematic diagram; (b) test setup; (c) dial gauge setup.
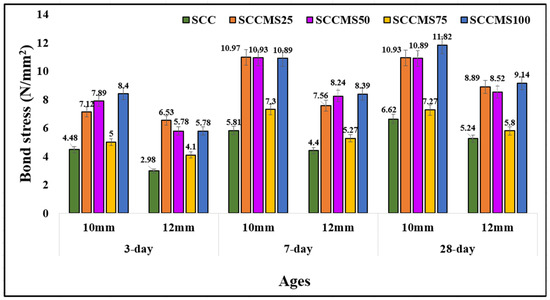
Figure 11.
Bond strength at 28 days of curing.
4.3. Microstructural Characterization
The impact of M-sand on SCC is explained in this report, along with the SEM, EDS, XRD, and FTIR.
4.3.1. Scanning Electron Microscopy Analyses (SEM)
The microstructure of mineral admixtures or materials has only recently been the subject of research on cement mortar. In these studies, SEM morphology and an EDS investigation were used to examine the properties of a self-compacting concrete mix, and the results should be correlated with the hardened concrete created by the various combinations. SEM analyses were conducted on the following samples: River sand, M-sand, SCC, SCCMS25, SCCMS50, SCCMS75, and SCCMS100, as shown in Figure 12, Figure 13, Figure 14, Figure 15, Figure 16, Figure 17 and Figure 18. To perform the SEM analysis, specimens were cut into cubes from the mechanical performance. For this reason, it was crucial to separate a piece of the mix of the appropriate size and introduce it simultaneously into the equipment chamber. Each sample, when selected, contained a minimum of one coarse aggregate particle. The observed closed microstructures are consistent with the high strength of concrete. The sample hydration products have received the majority of attention in the morphological study. The analysis of the sample growth of the hydration process in the concrete mix was used to examine the development of concrete strength. The smooth surface texture of River Sand can be observed in Figure 12, whereas in Figure 13, a rough surface texture can be observed in M-sand, making it easier to work within concrete. The growth of the hydration process in the concrete mix was used to analyze the samples and showed the concrete strength development. As shown in Figure 14, Figure 15, Figure 16, Figure 17 and Figure 18, 28 days of concrete curing revealed many voids. The calcium silica hydrate gel and the needle-like structure known as ettringite, which filled in the cracks and voids in the composite, were hydrated by adding M-sand to the mixture. The image of the SCCMS100 mix that was photographed and is shown in Figure 14, Figure 15 and Figure 16 serves as evidence for this. In contrast, the voids and cracks in Figure 18 suggest poor interlocking between the particles, which leads to better water absorption than in other mixtures. As was already mentioned, SCCMS100 combines the best strength characteristics. Assuming that the formation of C-S-H gel was what led to the development of strength characteristics, it was found that SCCMS100 offered the best performance.
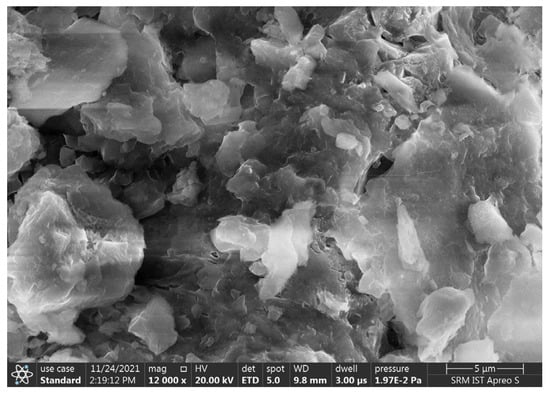
Figure 12.
SEM image of River sand.
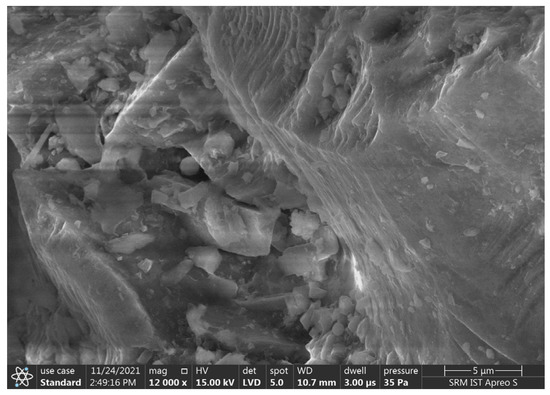
Figure 13.
SEM image of M-sand.
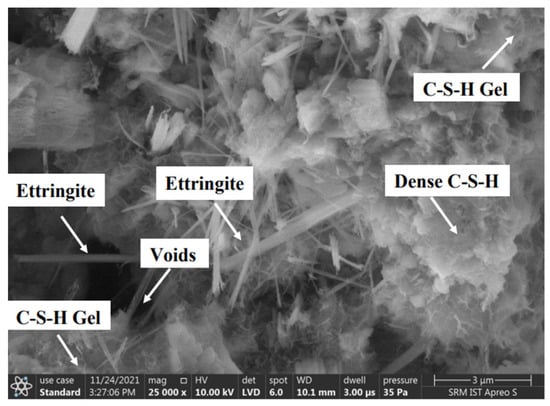
Figure 14.
SEM image of SCC.
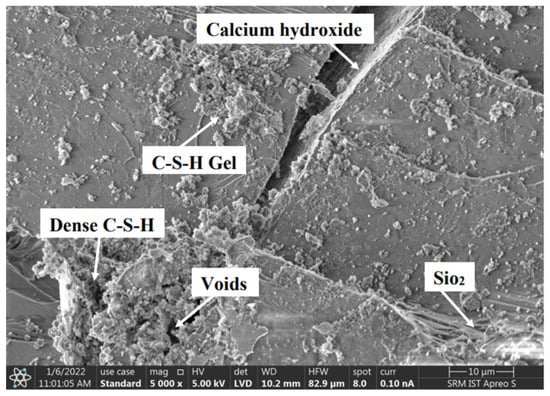
Figure 15.
SEM image of SCCMS25.
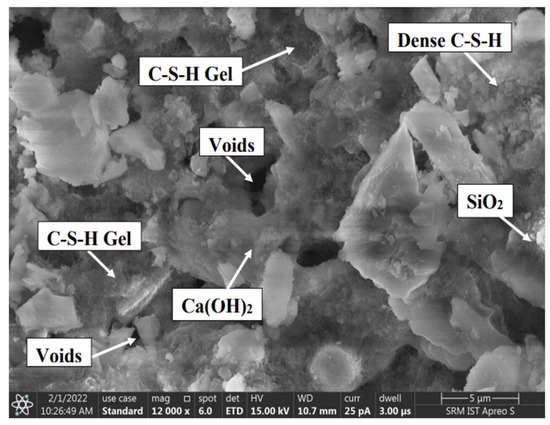
Figure 16.
SEM image of SCCMS50.
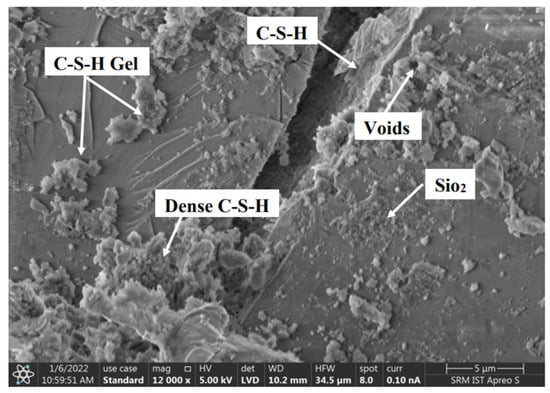
Figure 17.
SEM image of SCCMS75.
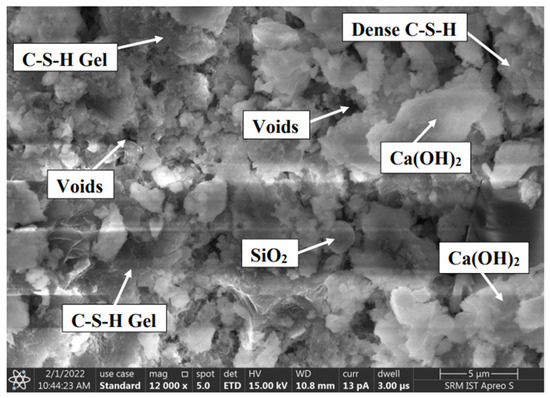
Figure 18.
SEM image of SCCMS100.
4.3.2. Energy-Dispersive X-ray Spectroscopy (EDX)
EDX is used to characterize materials for analytical purposes. The elemental composition was determined through EDX analyses. EDX analyses were conducted on samples of river sand, M-sand, SCC, SCCMS25, SCCMS50, SCCMS75, and SCCMS100 as shown in Figure 19, Figure 20, Figure 21, Figure 22, Figure 23, Figure 24 and Figure 25, respectively. It is possible to see the energy spectrum (a histogram plot of the number of counts concerning the X-ray energy) of each analysis period of X-rays simultaneously using the EDX detector system. There is information in the spectrum that is both semi-qualitative and semi-quantitative. If the calcium to silica (Ca/Si) proportion is low, it is usually associated with a more significant creation of C-S-H gel and vice versa. Numerous research studies have demonstrated that a reduction in the (Ca/Si) proportion increases C-S-H gels and may improve their mechanical performance, which is related to the incredible compressive strength observed in sample measurements. To identify an element, a peak in the spectrum, its energy level, must be located in a specific area; this area is proportional to how many atoms of the element can be found within that area [51]. Additionally, X-rays can be emitted if the electron beam is slowed by atomic nuclei present in the specimen. Radiation from these X-rays can be seen below the peaks in the spectrum [52]. In general, river sand is a chemically inactive material, so this study will not focus on the impact of river sand and M-sand chemical components of concrete production, except in some exceptional cases. Instead, we discuss some of the most significant differences between M-sand and river sand, as well as the influences each has on the other. The EDX of river sand and M-sand is represented in Figure 19 and Figure 20. The river sand retains moisture, but it is generally unavailable unless the M-sand is washed in water. Improvements in strength characteristics were noted, which may be related to the utilization of micro silica in the manufacturing of SCC. When the calcium–silicon ratio is lower than usual, the C-S-H gel is more likely to form. All alccofine and micro silica blended mixtures have a high Ca/Si value in the range of 1.5 to 2, which indicates a well-hydrated C-S-H gel, suggesting the usage of M-sand in concrete as a partial or full replacement could be effective and efficient.
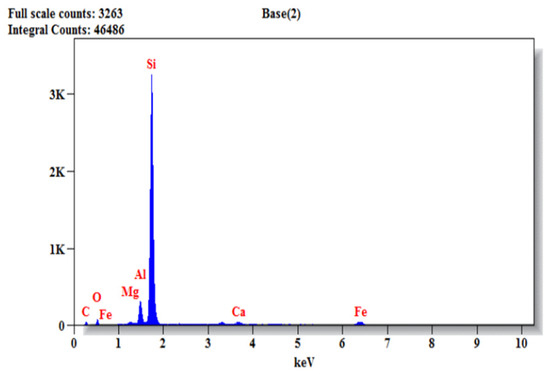
Figure 19.
EDS image of River sand.
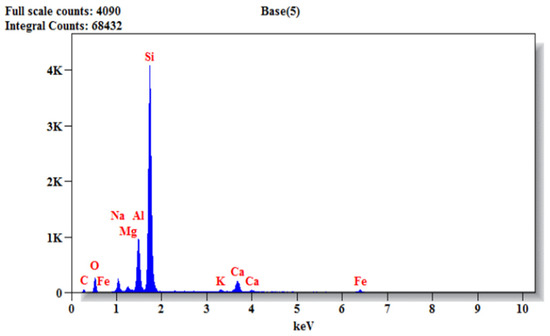
Figure 20.
EDS image of M-sand.
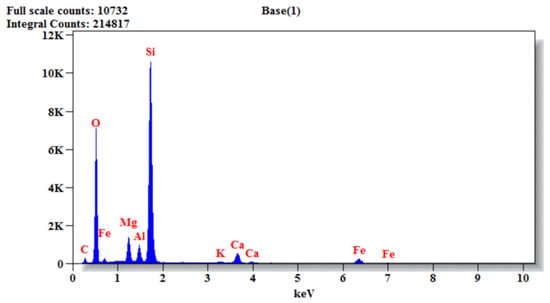
Figure 21.
EDS image of SCC.
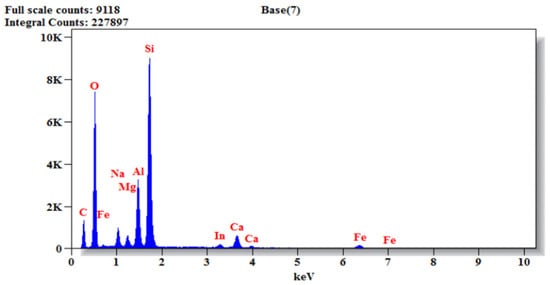
Figure 22.
EDS image of SCCMS25.
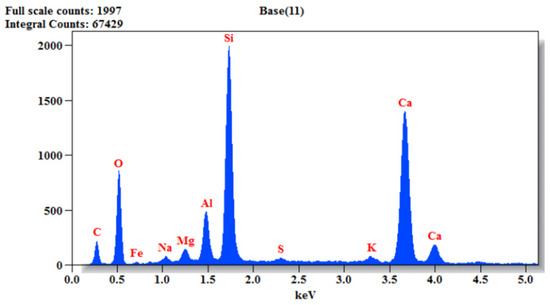
Figure 23.
EDS image of SCCMS50.
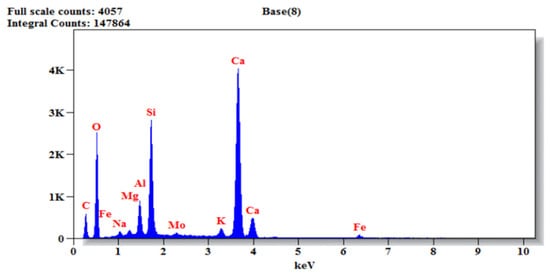
Figure 24.
EDS image of SCCMS75.
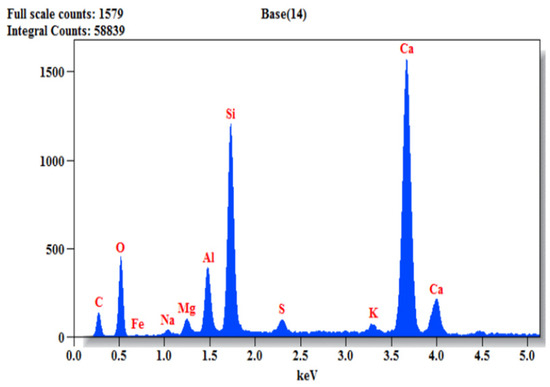
Figure 25.
EDS image of SCCMS100.
4.3.3. X-ray Diffraction (XRD)
XRD was conducted on samples of river sand, M-sand, SCC, SCCMS25, SCCMS50, SCCMS75, and SCCMS100, as shown in Figure 26, Figure 27, Figure 28, Figure 29, Figure 30, Figure 31 and Figure 32, respectively. The following visible minerals are quartz (SiO2), CSH gel (Ca6H2O13Si3), calcite (CaCO3), ettringite (Ca6Al2 (SO4)3(OH)2), and calcium hydroxide (Ca(OH)2). Comparatively, some necessary literature studies examined the quantitative interpretations of various compounds [45]. According to the XRD analyses, the formation of C-S-H at its peak occurs when Alccofine and silica fume are incorporated into cementitious material [53]. Alccofine and Micro silica have been shown to increase the reaction between C-H and SiO2 to form a gel, increasing the SCC strength and binding properties [54]. This phase primarily represents the presence of silica-rich binder materials such as OPC, micro silica, alccofine, and sand [55]. As the CSH gel fills the microcracks and pores, the presence of M-sand may lead to improved ITZ characteristics [56]. C-S-H (60–80 nm), CaCO3 (25–30 nm), and Ca(OH)2 (65–85 nm) were found to have the highest intensity. It has been revealed that the concentrations of all three compounds can be altered by adding mineral admixtures and the aggregate nature. From 500 to 2000 counts, 100 to 500 counts, and 200 to 700 counts, the concentrations of CSH, CaCO3, and Ca(OH)2 were all tested in a wide range. There was a correlation between the amount of M-sand in the sample and the intensity of the peaks for CaCO3 and Ca(OH)2. Alccofine and micro silica have been added to the M-sand mix, which has improved the compressive strength performance. The detection of C-S-H gel appears to be qualitatively difficult due to its amorphous nature, as an extremely high peak intensity was observed. The C-S-H gel peaks have been discovered to overlap in all of the experiment results. This was shown in the XRD patterns after curing for 28 days in the SCC mixes with M-sand as a replacement for fine aggregate. Analyses of XRD graphs for SCC mixes without M-sand were performed in a similar pattern [57]. The introduction of M-sand has resulted in a noticeable change in the intensity of all SCC mixes. There was good agreement between the results of XRD with all SCC mixes and the behavior discovered in the preceding section. Due to the portlandite crystal structure, its presence in the concrete matrix reduces pore volume and increases strength. Ettringite is produced when the calcium sulphate and calcium element present in the OPC respond. In addition, SCCMS100 mixes were found to have the highest peak microcline intensity compared to the SCC mix. A higher concentration of CSH gel occurs when M-sand is added to self-compacting concrete mixes, enhancing their efficiency over the reference SCC mix.
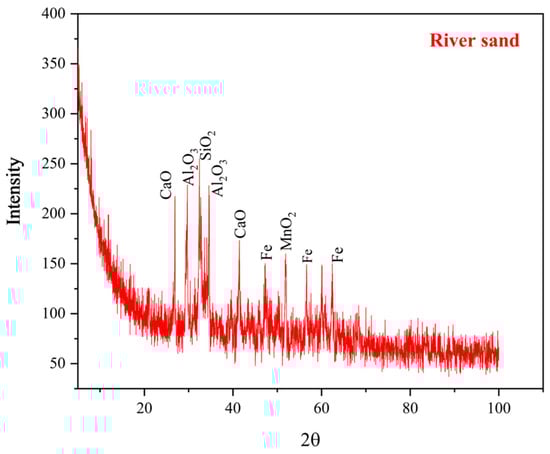
Figure 26.
XRD pattern of River sand.
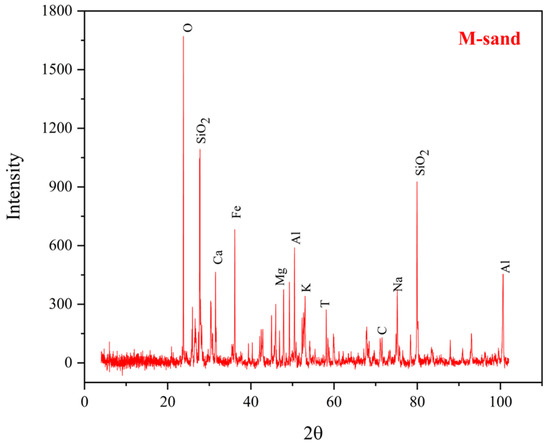
Figure 27.
XRD pattern of M-sand.
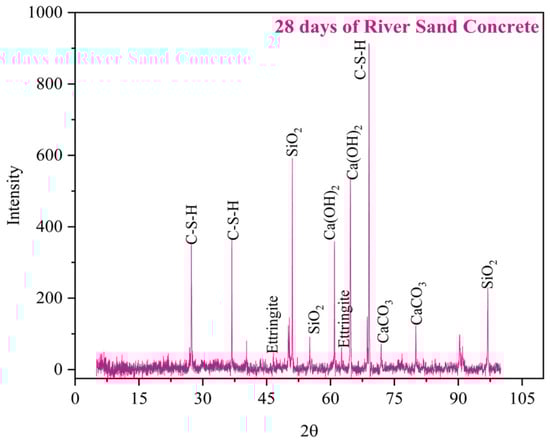
Figure 28.
XRD pattern of SCC.
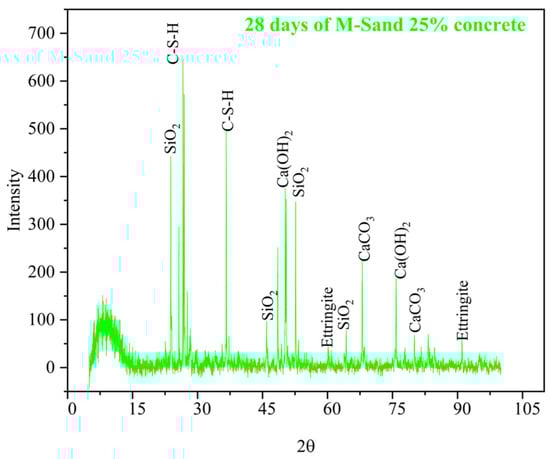
Figure 29.
XRD pattern of SCCMS25.
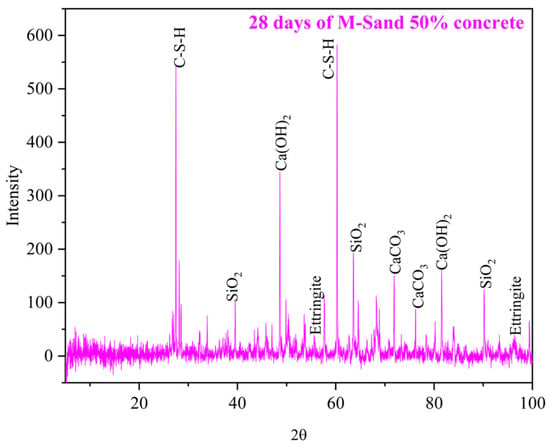
Figure 30.
XRD pattern of SCCMS50.
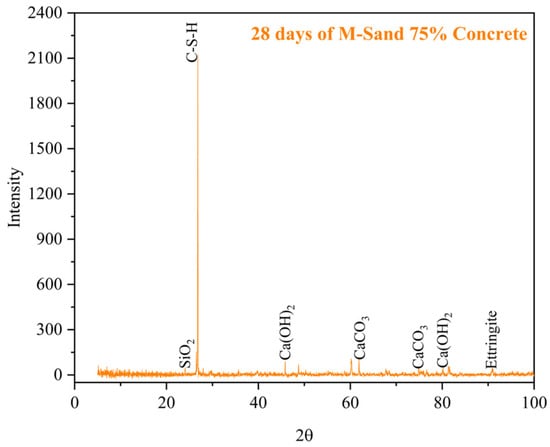
Figure 31.
XRD pattern of SCCMS75.
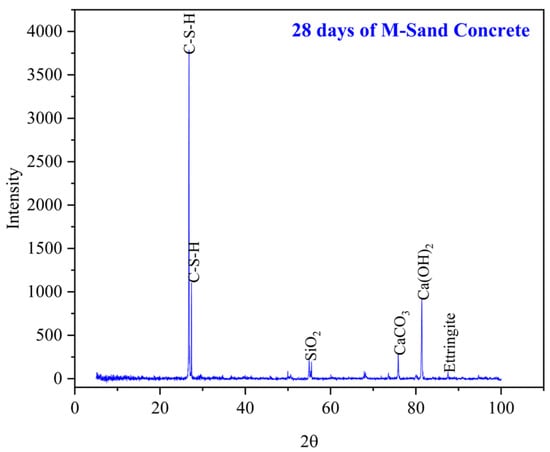
Figure 32.
XRD pattern of SCCMS100.
4.3.4. Fourier Transform Infrared Spectroscopy (FTIR)
FTIR indicated the existence of the concrete containing molecular groups by identifying bands of absorption at different wavelengths [17]. FTIR was conducted on samples of river sand, M-sand, SCC, SCCMS25, SCCMS50, SCCMS75, and SCCMS100, as shown in Figure 33, Figure 34, Figure 35, Figure 36, Figure 37, Figure 38 and Figure 39, respectively. Quartz (SiO2) has been found to have absorbance bands with wave numbers between 500 and 650 cm−1 and 1024 cm−1. River sand and micro silica particles may have contributed to the appearance of quartz bands in this study [54]. A group of Alccofine particles is responsible for the absorbance bands in the 1020–1750 cm−1 range. Calcium carbonates (CaCO3) can be observed by the absorption bands at 534 cm−1 and 1022 cm−1. Water molecule groups are responsible for the banding around the wave numbers 2000 cm−1 and 3244 cm−1. It is possible to attribute the absorbance bands around 3646 cm−1 to the Portlandite Ca(OH)2 as an O-H bond. The bands of portlandite were found to be 3059, 3280, 3628, 3428, and 3244 cm−1 for River sand concrete and M-sand (25%, 50%, 75%, and 100%) mixtures after the completion of 28 days of curing. To indicate the length of a bond or the amount of portlandite consumed, the bands move to lower wave numbers. As a result of this shift in bands to the lower side, it can be concluded that portlandite has been consumed in this pozzolanic reaction [9]. The Si-O bond or C-S-H can be attributed to the absorbance bands of 679 cm−1 and 1020 cm−1. River sand concrete and M-sand (25%, 50%, 75%, and 100%) mixtures had C-S-H bands of 1044, 1024, 1024, 1028, and 1022 cm−1 after 28 days of curing. Alccofine and the micro silica blended control mixture (River sand concrete) have marginally lower and higher C-S-H wave numbers, respectively. At 28 days, the length of the Si-O bonds in the control mixture decreased, and the length of the mix SCCMS50 mixture increased. The lower mechanical performance is caused by a decrease in the length of the Si-O bond and vice versa. In addition, the alccofine and micro silica blended mixtures showed less shifting in the C-S-H gel wave number [17]. Finally, FTIR analyses showed that M-sand particles do not affect the hydration products that are formed. Moreover, the evidence points in this direction.
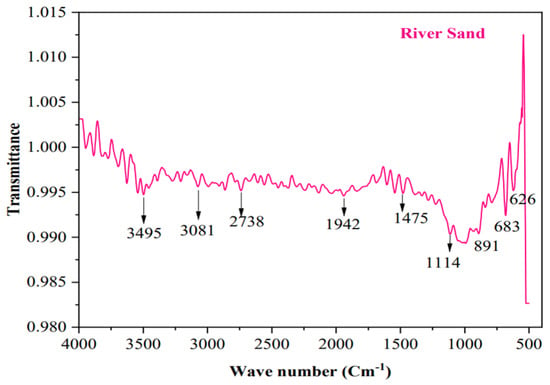
Figure 33.
FTIR pattern of River sand.
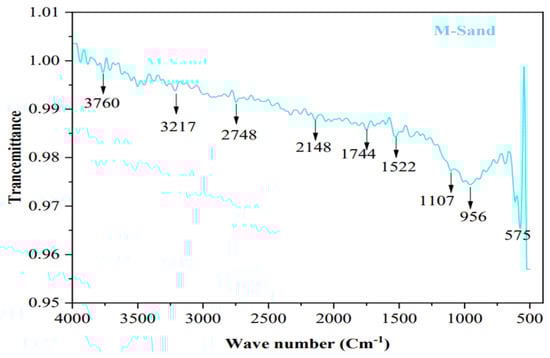
Figure 34.
FTIR pattern of M-sand.
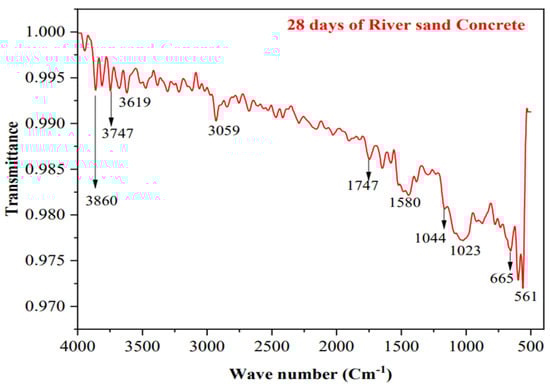
Figure 35.
FTIR pattern of SCC.
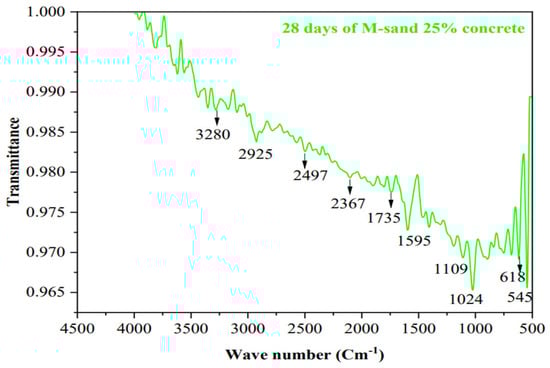
Figure 36.
FTIR pattern of SCCMS25.
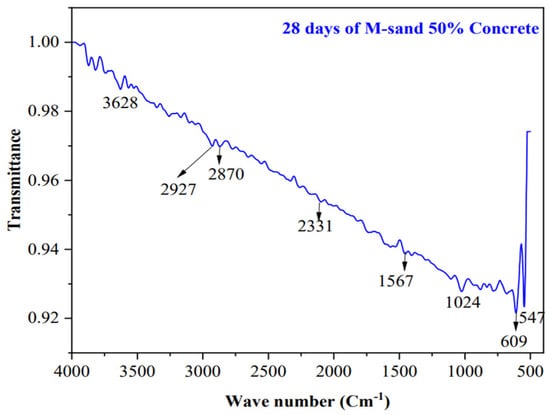
Figure 37.
FTIR pattern of SCCMS50.
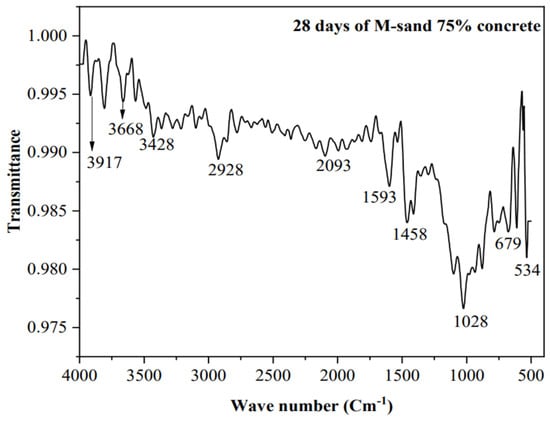
Figure 38.
FTIR pattern of SCCMS75.
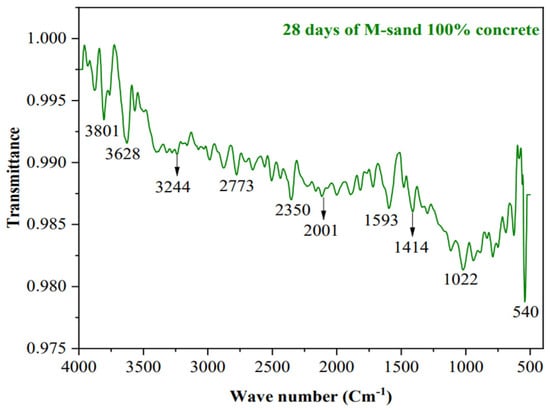
Figure 39.
FTIR pattern of SCCMS100.
5. Conclusions
Experimental investigations were conducted to investigate the effect of M-sand on self-compacting concrete. Based on the experimental results, the following conclusions are evident.
By substituting M-sand, SCC has increased passing and filling capacities in all proportions. There is no indication of bleeding or ingredient segregation based on the fresh property tests. In spite of this, the slump flow, T500, V-funnel, and L-box tests all showed better results than before and met the EFNARC guidelines.
SCC made with alccofine and silica fume containing 100% M-sand showed improved mechanical properties, including compressive strength, flexural strength, split tensile strength, impact strength, and bond strength. For M50 grades of SCC, 100% M-sand increased the compressive strength by 6.82% compared to the reference SCC after 28 days. A similar pattern is observed in the split and flexural strength tests.
From the microstructural analysis, it was confirmed visually that SCC blends are mechanically effective when M-sand is incorporated. Conventional SCC mixes generate more micro cracks and void spaces than M-sand-replaced SCC. From the EDS results, the M-sand-replaced mix has a lower Ca/Si ratio than the conventional SCC mix, showing that a similar hydration process is carried over, suggesting M-sand to be an effective replacement for fine aggregate.
XRD analysis can offer insightful information about the mineral admixture of SCC with M-sand, where the performance is enhanced by the addition of alccofine and silica fume resulting in higher peaks when compared with conventional SCC. Therefore, from the overall investigation, it can be concluded that the implementation of M-sand as a fine aggregate replacement in SCC along with mineral admixtures such as Alccofine and Silica fume is feasible to introduce in structural concrete, particularly considering the concern of alternative fine aggregate material for the consumption and extraction of natural raw sources such as river sand.
Author Contributions
Conceptualization, methodology, and writing—original draft preparation, D.S.; validation, editing, supervision, and data curation, S.P.C.; formal analysis and supervision, P.T.R. All authors have read and agreed to the published version of the manuscript.
Funding
This research received no external funding.
Institutional Review Board Statement
Not applicable.
Informed Consent Statement
Not applicable.
Data Availability Statement
Not applicable.
Acknowledgments
I would like to thank the SRM concrete technology laboratory, central instrumentation facility, and NRC, Kattankulathur, for providing the microstructure characterization equipment, which the authors greatly acknowledge.
Conflicts of Interest
The authors declare no conflict of interest.
References
- Gnanaraj, S.C.; Chokkalingam, R.B.; Thankam, G.L.; Pothinathan, S. Durability properties of self-compacting concrete developed with fly ash and ultra fine natural steatite powder. J. Mater. Res. Technol. 2021, 13, 431–439. [Google Scholar] [CrossRef]
- Martins, M.A.; Barros, R.M.; da Silva, L.R.R.; dos Santos, V.C.; Lintz, R.C.; Gachet, L.A.; Melo, M.d.L.; Martinez, C.B. Durability indicators of high-strength self-compacting concrete with marble and granite wastes and waste foundry exhaust sand using electrochemical tests. Constr. Build. Mater. 2021, 317, 125907. [Google Scholar] [CrossRef]
- Irico, S.; Qvaeschning, D.; Mutke, S.; Deuse, T.; Gastaldi, D.; Canonico, F. Durability of high performance self-compacting concrete with granulometrically optimized slag cement. Constr. Build. Mater. 2021, 298, 123836. [Google Scholar] [CrossRef]
- Tufail, R.F.; Naeem, M.H.; Ahmad, J.; Waheed, H.; Majdi, A.; Farooq, D.; Maqsoom, A.; Butt, F. Evaluation of the fresh and mechanical properties of nano-engineered self compacting concrete containing graphite nano/micro platelets. Case Stud. Constr. Mater. 2022, 17, e01165. [Google Scholar] [CrossRef]
- Hasnain, M.H.; Javed, U.; Ali, A.; Zafar, M.S. Eco-friendly utilization of rice husk ash and bagasse ash blend as partial sand replacement in self-compacting concrete. Constr. Build. Mater. 2021, 273, 121753. [Google Scholar] [CrossRef]
- Ortega-López, V.; Faleschini, F.; Pellegrino, C.; Revilla-Cuesta, V.; Manso, J.M. Validation of slag-binder fiber-reinforced self-compacting concrete with slag aggregate under field conditions: Durability and real strength development. Constr. Build. Mater. 2022, 320, 126280. [Google Scholar] [CrossRef]
- Kapoor, K.; Singh, S.P.; Singh, B. Evaluating the durability properties of self compacting concrete made with coarse and fine recycled concrete aggregates. Eur. J. Environ. Civ. Eng. 2018, 24, 2383–2399. [Google Scholar] [CrossRef]
- Jain, A.; Choudhary, S.; Gupta, R.; Chaudhary, S.; Gautam, L. Effect of granite industry waste addition on durability properties of fly ash blended self-compacting concrete. Constr. Build. Mater. 2022, 340, 127727. [Google Scholar] [CrossRef]
- Choudhary, R.; Gupta, R.; Nagar, R. Impact on fresh, mechanical, and microstructural properties of high strength self-compacting concrete by marble cutting slurry waste, fly ash, and silica fume. Constr. Build. Mater. 2020, 239, 117888. [Google Scholar] [CrossRef]
- Liu, H.; Duan, G.; Wang, F.; Zhang, J.; Zhou, Y.; Feng, Y. Investigation on mechanical behaviors of Self-compacting con-crete. Constr. Build. Mater. 2022, 346, 128421. [Google Scholar] [CrossRef]
- Ramesh, B.; Gokulnath, V.; Krishnan, S.V. Detailed study of M-sand on the flexural properties of M-25 Grade Polypropylene Fibre reinforced self compacting concrete. Mater. Today Proc. 2020, 22, 1092–1096. [Google Scholar] [CrossRef]
- Ameri, F.; Shoaei, P.; Bahrami, N.; Vaezi, M.; Ozbakkaloglu, T. Optimum rice husk ash content and bacterial concentration in self-compacting concrete. Constr. Build. Mater. 2019, 222, 796–813. [Google Scholar] [CrossRef]
- Le, H.T.; Ludwig, H.-M. Effect of rice husk ash and other mineral admixtures on properties of self-compacting high performance concrete. Mater. Des. 2016, 89, 156–166. [Google Scholar] [CrossRef]
- Sathurshan, M.; Yapa, I.; Thamboo, J.; Jeyakaran, T.; Navaratnam, S.; Siddique, R.; Zhang, J. Untreated rice husk ash incorporated high strength self-compacting concrete: Properties and environmental impact assessments. Environ. Chall. 2021, 2, 100015. [Google Scholar] [CrossRef]
- Vijina, V.V.; Varghese, A.; Angitha, N.; Aswathy, S.; Mohan, K.; Shighil, C. Study on Self Compacting Concrete by Partial Replacement of Coarse Aggregate with Crushed Coconut Shell. Int. J. Res. Advent Technol. 2015, 6, 10–11. [Google Scholar] [CrossRef]
- Adebakin, I.H.; Gunasekaran, K.; Annadurai, R. Mechanical properties of self-compacting coconut shell concrete blended with fly ash. Asian J. Civ. Eng. 2019, 20, 113–124. [Google Scholar] [CrossRef]
- Kumar, V.P.; Gunasekaran, K.; Shyamala, T. Characterization Study on Coconut Shell Concrete with Partial Replacement of Cement by GGBS; Elsevier Ltd.: Amsterdam, The Netherlands, 2019; Volume 26. [Google Scholar] [CrossRef]
- Ting, T.; Rahman, M.; Lau, H. Lightweight Self-compacting Concrete Incorporating Oil Palm Shell. IOP Conf. Ser. Mater. Sci. Eng. 2019, 495, 012096. [Google Scholar] [CrossRef]
- Prayuda, H.; Saleh, F.; Maulana, T.I.; Monika, F. Fresh and mechanical properties of self-compacting concrete with coarse aggregate replacement using Waste of Oil Palm Shell. IOP Conf. Ser. Mater. Sci. Eng. 2018, 352, 012028. [Google Scholar] [CrossRef]
- Shettima, A.U.; Hussin, M.W.; Ahmad, Y.; Mirza, J. Evaluation of iron ore tailings as replacement for fine aggregate in concrete. Constr. Build. Mater. 2016, 120, 72–79. [Google Scholar] [CrossRef]
- Modani, P.O.; Vyawahare, M. Utilization of Bagasse Ash as a Partial Replacement of Fine Aggregate in Concrete. Procedia Eng. 2013, 51, 25–29. [Google Scholar] [CrossRef]
- Al-Jabri, K.S.; Hisada, M.; Al-Saidy, A.H.; Al-Oraimi, S. Performance of high strength concrete made with copper slag as a fine aggregate. Constr. Build. Mater. 2009, 23, 2132–2140. [Google Scholar] [CrossRef]
- Kavya, A.; Rao, A.V. Experimental investigation on mechanical properties of concrete with M-sand. Mater. Today Proc. 2020, 33, 663–667. [Google Scholar] [CrossRef]
- Pilegis, M.; Gardner, D.; Lark, R. An Investigation into the Use of Manufactured Sand as a 100% Replacement for Fine Aggregate in Concrete. Materials 2016, 9, 440. [Google Scholar] [CrossRef] [PubMed]
- Cheng, H.; Chen, P.; Rong, X.; Cao, S.; Zhao, W. Effect of steel fibre and manufactured sand on mechanical properties of alkali-activated slag green cementitious material after high temperature. Case Stud. Constr. Mater. 2023, 18, e01919. [Google Scholar] [CrossRef]
- Rojo-López, G.; González-Fonteboa, B.; Martínez-Abella, F.; González-Taboada, I. Rheology, durability, and mechanical performance of sustainable self-compacting concrete with metakaolin and limestone filler. Case Stud. Constr. Mater. 2022, 17, e01143. [Google Scholar] [CrossRef]
- Venkat, G.N.; Chandramouli, K.; Ahmed, E.; NagendraBabu, V. Comparative study on mechanical properties and quality of concrete by part replacement of cement with silica fume, metakaolin and GGBS by using M−Sand as fine aggregate. Mater. Today Proc. 2020, 43, 1874–1878. [Google Scholar] [CrossRef]
- IS 12269; IS (Indian Standard). Ordinary Portland Cement, 53 Grade—Specification. Bureau of Indian Standards: Delhi, Indian, 2013; Volume 6, pp. 141–142.
- IS:383; Specification for Coarse and Fine Aggregates from Natural Sources for Concrete. Bureau of Indian Standards: Delhi, Indian, 1970; pp. 1–24.
- BS 8110-1:1997; Structural Use of Concrete—Part 1: Code of Practice for Design and Construction. British Standards Institution: London, UK, 1997; p. 168.
- ASTM C494; Standard Specification for Chemical Admixtures for Concrete. ASTM: West Conshohocken, PA, USA, 2005; pp. 5–7.
- BS EN 12350-8:2010; BSI Standards Publication Testing Fresh Concrete. British Standards Institution: London, UK, 2010; p. 18.
- Kalirajan, S.; Vishnuram, B.G. Development of Self Compacting Concrete Using Manufactured Sand. Artic. Int. J. Earth Sci. Eng. 2014, 7, 987–992. Available online: www.cafetinnova.org (accessed on 23 March 2023).
- IS 516; Method of Tests for Strength of Concrete. Bureau of Indian Standards: Delhi, Indian, 1959; pp. 1–30.
- ACI Report 544.1R-96; Report on Fiber Reinforced Concrete. American Concrete Institute: Farmington Hills, MI, USA, 2002.
- ASTM-C234; Standard Test Method for Comparing Concretes on the Basis of the Bond Developed with Reinforcing Steel. American Concrete Institute: Farmington Hills, MI, USA, 1991.
- Krishnaraj, L.; Ravichandran, P. Investigation on grinding impact of fly ash particles and its characterization analysis in cement mortar composites. Ain Shams Eng. J. 2019, 10, 267–274. [Google Scholar] [CrossRef]
- BS EN 12350-8; Testing Fresh Concrete-Part 8: Self Compacting Concrete-Slump Flow Test. British Standards Institution: London, UK, 2010; pp. 5–8. Available online: https://www.en-standard.eu/din-en-12350-2-testing-fresh-concrete-part-2-slump-test/%0Ahttps://bsol.bsigroup.com/Home (accessed on 23 March 2023).
- ASTM C39-01; Standard Test Method for Compressive Strength of Cylindrical Concrete Specimens 1. American Concrete Institute: Farmington Hills, MI, USA, 2003; Volume i, pp. 1–5. [CrossRef]
- Beretka, J.; Marroccoli, M.; Sherman, N.; Valenti, G. The influence of C4A3 content and WS ratio on the performance of calcium sulfoaluminate-based cements. Cem. Concr. Res. 1996, 26, 1673–1681. [Google Scholar] [CrossRef]
- Ding, X.; Li, C.; Xu, Y.; Li, F.; Zhao, S. Experimental study on long-term compressive strength of concrete with manufactured sand. Constr. Build. Mater. 2016, 108, 67–73. [Google Scholar] [CrossRef]
- Zimar, Z.; Samarawickrama, G.K.P.N.; Karunarathna, W.S.D.; Jayakody, S. Effect of Manufactured Sand as a Replacement for Fine Aggregates in Concrete. In Proceedings of the 8th International Conference on Structural Engineering and Construction Management, Kandy, Sri Lanka, 7 December 2017; pp. 1–6. [Google Scholar]
- ASTM C496/C496M−17; Standard Test Method for Splitting Tensile Strength of Cylindrical Concrete Specimens ASTM C-496. American Concrete Institute: Farmington Hills, MI, USA, 2011; pp. 1–5. Available online: https://webstore.ansi.org/standards/astm/astmc496c496m17 (accessed on 23 March 2023).
- IS 5816-1999; Indian Standard Splitting Tensile Strength of Concrete-Method of Test. Bureau of Indian Standards: Delhi, Indian, 1999; pp. 1–14.
- Ganga, V.; Selvan, S.S. Influence of expansive cement on rheological, strength performance and morphological characteristics of self-compacting concrete. Constr. Build. Mater. 2022, 368, 130407. [Google Scholar] [CrossRef]
- Magudeaswaran, P.; Eswaramoorthi, P. High Performance Concrete Using M Sand. Asian J. Res. Soc. Sci. Humanit. 2016, 6, 372–386. [Google Scholar] [CrossRef]
- Test, C.C.; Drilled, T.; Concrete, C. Standard Test Method for Flexural Strength of Concrete (Using Simple Beam with Third-Point Loading). Hand 2010, C78-02, 1–4. [Google Scholar]
- Seabrook, P.T.; Balck, L.F.; Bawa, K.S.; Bortz, S.A.; Chynoweth, G.L.; Crom, T.R.; Litvin, A. State-Of-The-Art Report on Fiber Reinforced Shotcrete. Concr. Int. 1984, 6, 15–27. [Google Scholar]
- Gunasekaran, K.; Kumar, P.; Lakshmipathy, M. Mechanical and bond properties of coconut shell concrete. Constr. Build. Mater. 2011, 25, 92–98. [Google Scholar] [CrossRef]
- Faye, P.N.; Ye, Y.; Diao, B. Bond Effects between Concrete and Steel Bar Using Different Diameter Bars and Different Initial Crack Width. Adv. Civ. Eng. 2017, 2017, 8205081. [Google Scholar] [CrossRef]
- Gupta, N.; Siddique, R. Strength and micro-structural properties of self-compacting concrete incorporating copper slag. Constr. Build. Mater. 2019, 224, 894–908. [Google Scholar] [CrossRef]
- Singh, G.; Siddique, R. Strength properties and micro-structural analysis of self-compacting concrete made with iron slag as partial replacement of fine aggregates. Constr. Build. Mater. 2016, 127, 144–152. [Google Scholar] [CrossRef]
- Singh, N.; Singh, S.P. Validation of carbonation behavior of self compacting concrete made with recycled aggregates using microstructural and crystallization investigations. Eur. J. Environ. Civ. Eng. 2020, 24, 2187–2210. [Google Scholar] [CrossRef]
- Chander, S.P.; Manivel, S.; Gunasekaran, K.; Jothiswaran, A. An experimental investigation of partial replacement of cement using micro silica and fly ash in production of coconut shell concrete. Int. J. Civ. Eng. Technol. 2017, 8, 1851–1859. [Google Scholar]
- Vidyadhara, V.; Saurabh, B.; Ranganath, R.V. Impact of pond ash as fine aggregate on mechanical and microstructural properties of geopolymer concrete. Mag. Civ. Eng. 2022, 113, 11305. [Google Scholar] [CrossRef]
- Siddique, S.; Shrivastava, S.; Chaudhary, S. Influence of Ceramic Waste as Fine Aggregate in Concrete: Pozzolanic, XRD, FT-IR, and NMR Investigations. J. Mater. Civ. Eng. 2018, 30, 04018227. [Google Scholar] [CrossRef]
- Nagaratnam, B.H.; Mannan, M.A.; Rahman, M.E.; Mirasa, A.K.; Richardson, A.; Nabinejad, O. Strength and microstructural characteristics of palm oil fuel ash and fly ash as binary and ternary blends in Self-Compacting concrete. Constr. Build. Mater. 2019, 202, 103–120. [Google Scholar] [CrossRef]


Disclaimer/Publisher’s Note: The statements, opinions and data contained in all publications are solely those of the individual author(s) and contributor(s) and not of MDPI and/or the editor(s). MDPI and/or the editor(s) disclaim responsibility for any injury to people or property resulting from any ideas, methods, instructions or products referred to in the content. |
© 2023 by the authors. Licensee MDPI, Basel, Switzerland. This article is an open access article distributed under the terms and conditions of the Creative Commons Attribution (CC BY) license (https://creativecommons.org/licenses/by/4.0/).