Abstract
At the beginning of 2020, the COVID-19 contagious virus swept, which caused a lot of disturbances in all countries worldwide. The Egyptian government declared an emergency and placed the country under lockdown. Preventive measures such as social distancing, sterilization, mask wear, frequent temperature checks, offering COVID-19-related training, and encouraging work-from-home initiatives, among other precautions, have been implemented. Such precautionary measures affected the construction production rate. This research used a questionnaire and face-to-face interviews to solicit the opinion of construction industry professionals and experts on tier-one construction companies on the impact of this pandemic on construction production rate. A quantitative analysis has been done in this study using IBM SPSS Statistics 26© to determine the most important effective factors of the production rate of the construction industry, mainly in Egypt. Also, this study illustrates an Artificial Neural Networks (ANNs) model to predict the project’s cost and production rate at construction for the actual status in Egypt at the peak of COVID-19. The model does not only present the actual case but can also predict the most important and influential factors of the construction industry mainly in Egypt, at the peak of the virus, and can be used in other similar crises as a lesson learned which no study covered this area at the previous works. Finally, the results and the validation study of the proposed ANN model in the research show and present the actual status of production rate in the construction sector, mainly in Egypt (case study), and also predict the production rates of the construction sector at the future crisis.
1. Introduction
The construction industry represents an important part of many nations’ economies, about 13% of GDP [1] (Araya & Sierra, 2021). This industry was highly disrupted when COVID-19 began in 2020 and spread worldwide. There was no vaccine for this disease, so some responses have been taken to prevent the spreading of the infection, including on-site precautions such as social distancing, sterilization, and wearing masks. These precautions are wearing coveralls, goggles, face shields, gloves, and head covers, using personal hygiene, installing thermal scanners or handheld temperature monitors at the construction sites and factories entry points, and quarantining consignment crates with different facilities like in-house laundry. Unfortunately, this crisis happened suddenly; no previous studies or research dealt with a similar case. Different construction firms and organizations directly publish individual statistics and data about each case and how they dealt with this pandemic. This research collects many factors that affect the production rate from previous studies, questionnaires, and face-to-face interviews, mainly during the pandemic.
About eleven factors were expressed as the most important after a quantitative analysis using IBM SPSS Statistics 26©. Then, an Artificial Neural Networks (ANNs) model is developed for the most important factors to predict the production rate and project cost. The main aim of this research is to study the impact of COVID-19 on the production rate by developing an artificial neural networks (ANNs) model which simulates and predicts the most important and influential factors of the construction industry, mainly in Egypt, to evaluate the performance of this branch at the peak of the virus. Also, the developed ANN model can be used as a lesson learned in similar crises. No study covered this area in the previous works. To achieve the research objective, the research is divided into a literature review to illustrate what happened during this period in the construction sector in different countries worldwide. Then, the research methodology is introduced to explain step by step what will be presented in the research. After that, the data collected by the questionnaire, interviews, and analysis by IBM SPSS Statistics 26© deal with the essential factors only. Then, these factors are predicted and validated by the most accurate and eligible method—ANN. Finally, the limitations of the research and conclusions are illustrated.
So, the main idea of this research is to create a prediction model using ANN to study the behavior and response of the production rate of the construction sector at the peak of COVID-19.
2. Literature Review
To decrease the spreading of the virus during the pandemic, many managers and decision-makers decided to have laborers working remotely via different technology and some sites. On the other hand, governments issued new rules about the lockdown and working times to control the spread of the virus and reduce losses. On the other hand, Personal Protective Equipment (PPE) may be a profitable investment because all employees can work at the same time, lowering long-term operating costs and increasing the output rate [2] (Jain et al., 2020). On another side, other jobs during this period related to the new rules of the government’s designers worked remotely from home at different times to achieve their production rates before the virus. Different precautions have been taken for the construction workers, like social distancing and wearing the required PPE [3] (Bsisu, 2020). Others add a prioritizing of important works with the previous precautions and work was done to boost productivity. Construction companies also developed daily/weekly checklists to ensure adherence to the guidelines [4] (McGovern, 2020). Construction output in the UK dropped by 5.9% in March 2020, which was the worst drop since the financial crisis. However, infrastructure projects outside urban areas had a less significant drop in output and a faster return to work [5] (MACE, 2020). The housing projects were affected more than other sectors as most contractors and clients stopped work for at least a month, driven by a drop in demand for house sales from buyers who could no longer visit properties. Construction companies could survive the immediate impact of COVID-19 by relying on goverment assistance. In April 2020, the direct impact of the lockdown in the UK reduced output by up to 90% across construction and infrastructure projects, but the true challenge will be the long-term impact of reduced sustained production [5] (MACE, 2020). Another study by Alkhalouf (2020) [6] focused on the impact of COVID-19 on the materials supply chain and labor productivity in construction site building projects. This study utilised a real-life construction project at the peak of the pandemic in April 2020. The data collected includes interviews with project managers and progress meeting minutes. Results reveal that COVID-19 affected the progress of construction in two ways. The first way is a delay resulting from the shutdown of the manufacturing facilities and suppliers that state officials deemed nonessential. The second way is labor disruptions resulting from restrictions on gatherings and absenteeism of workers who were either sick with COVID-19 or who were avoiding construction sites and preferred to stay at home in response to state officials’ recommendations. The study suggested that contractors should request compensable time extensions as they establish the basis for a legitimate claim that will modify the contract time and total cost. In the UK, Working remotely is becoming more widespread in companies with higher educated and better-paid people. It is predicted to boost employee efficiency, increase output, decrease expenses, and shorten project completion times even after the pandemic [7] (Bartik et al., 2020). Productivity assessment of industries suitable for remote work shows fewer productivity losses [8] (Dingel and Neiman 2020). Jallow et al. (2020) [9] stated that improvements for the infrastructure sector in the UK had been taken to keep productivity while adhering to the COVID-19 lockout restrictions. According to the findings, the lockdown is a hard method to manage projects. However, technology techniques such as video chatting and online meetings are found to be effective in team communications. In major buildings and infrastructure projects, the cost of low productivity is very large. Management, technological, labor, and external factors were evaluated based on their impact on construction productivity. Planning and scheduling, material availability, and material storage are the top three factors affecting the construction production rate [10] (Dixit & Sharma, 2020). Bloom et al. (2020) [11] measured both labor productivity and total factor productivity (TFP) quarterly between the second quarter of 2020 to the second quarter of 2021 and provided medium-term projections for 2022. According to the findings, COVID-19 reduces TFP by up to 5% in the fourth quarter of 2020, dropping to 1% in the medium run. Because hours worked fall faster, the effects of COVID-19 on the hourly labor production rate are expected to be less negative than on TFP. Based on the review of the literature, the negative impacts of the COVID-19 crisis have increased significantly on the construction industry, and delivering building and construction services during these exceptional times has become a difficult challenge. It had an impact on the production rate of construction projects. As such, the main aim of this research is to study the impact of COVID-19 on the production rate by developing an artificial neural networks (ANNs) model which predicts the most important and influential factors of the construction industry in Egypt, to evaluate the performance of this branch at the peak of the virus. Also, the developed ANN model can be used in similar crises as a lesson learned for the same crisis in the future, and no previous studies mentioned these points.
3. Methodology
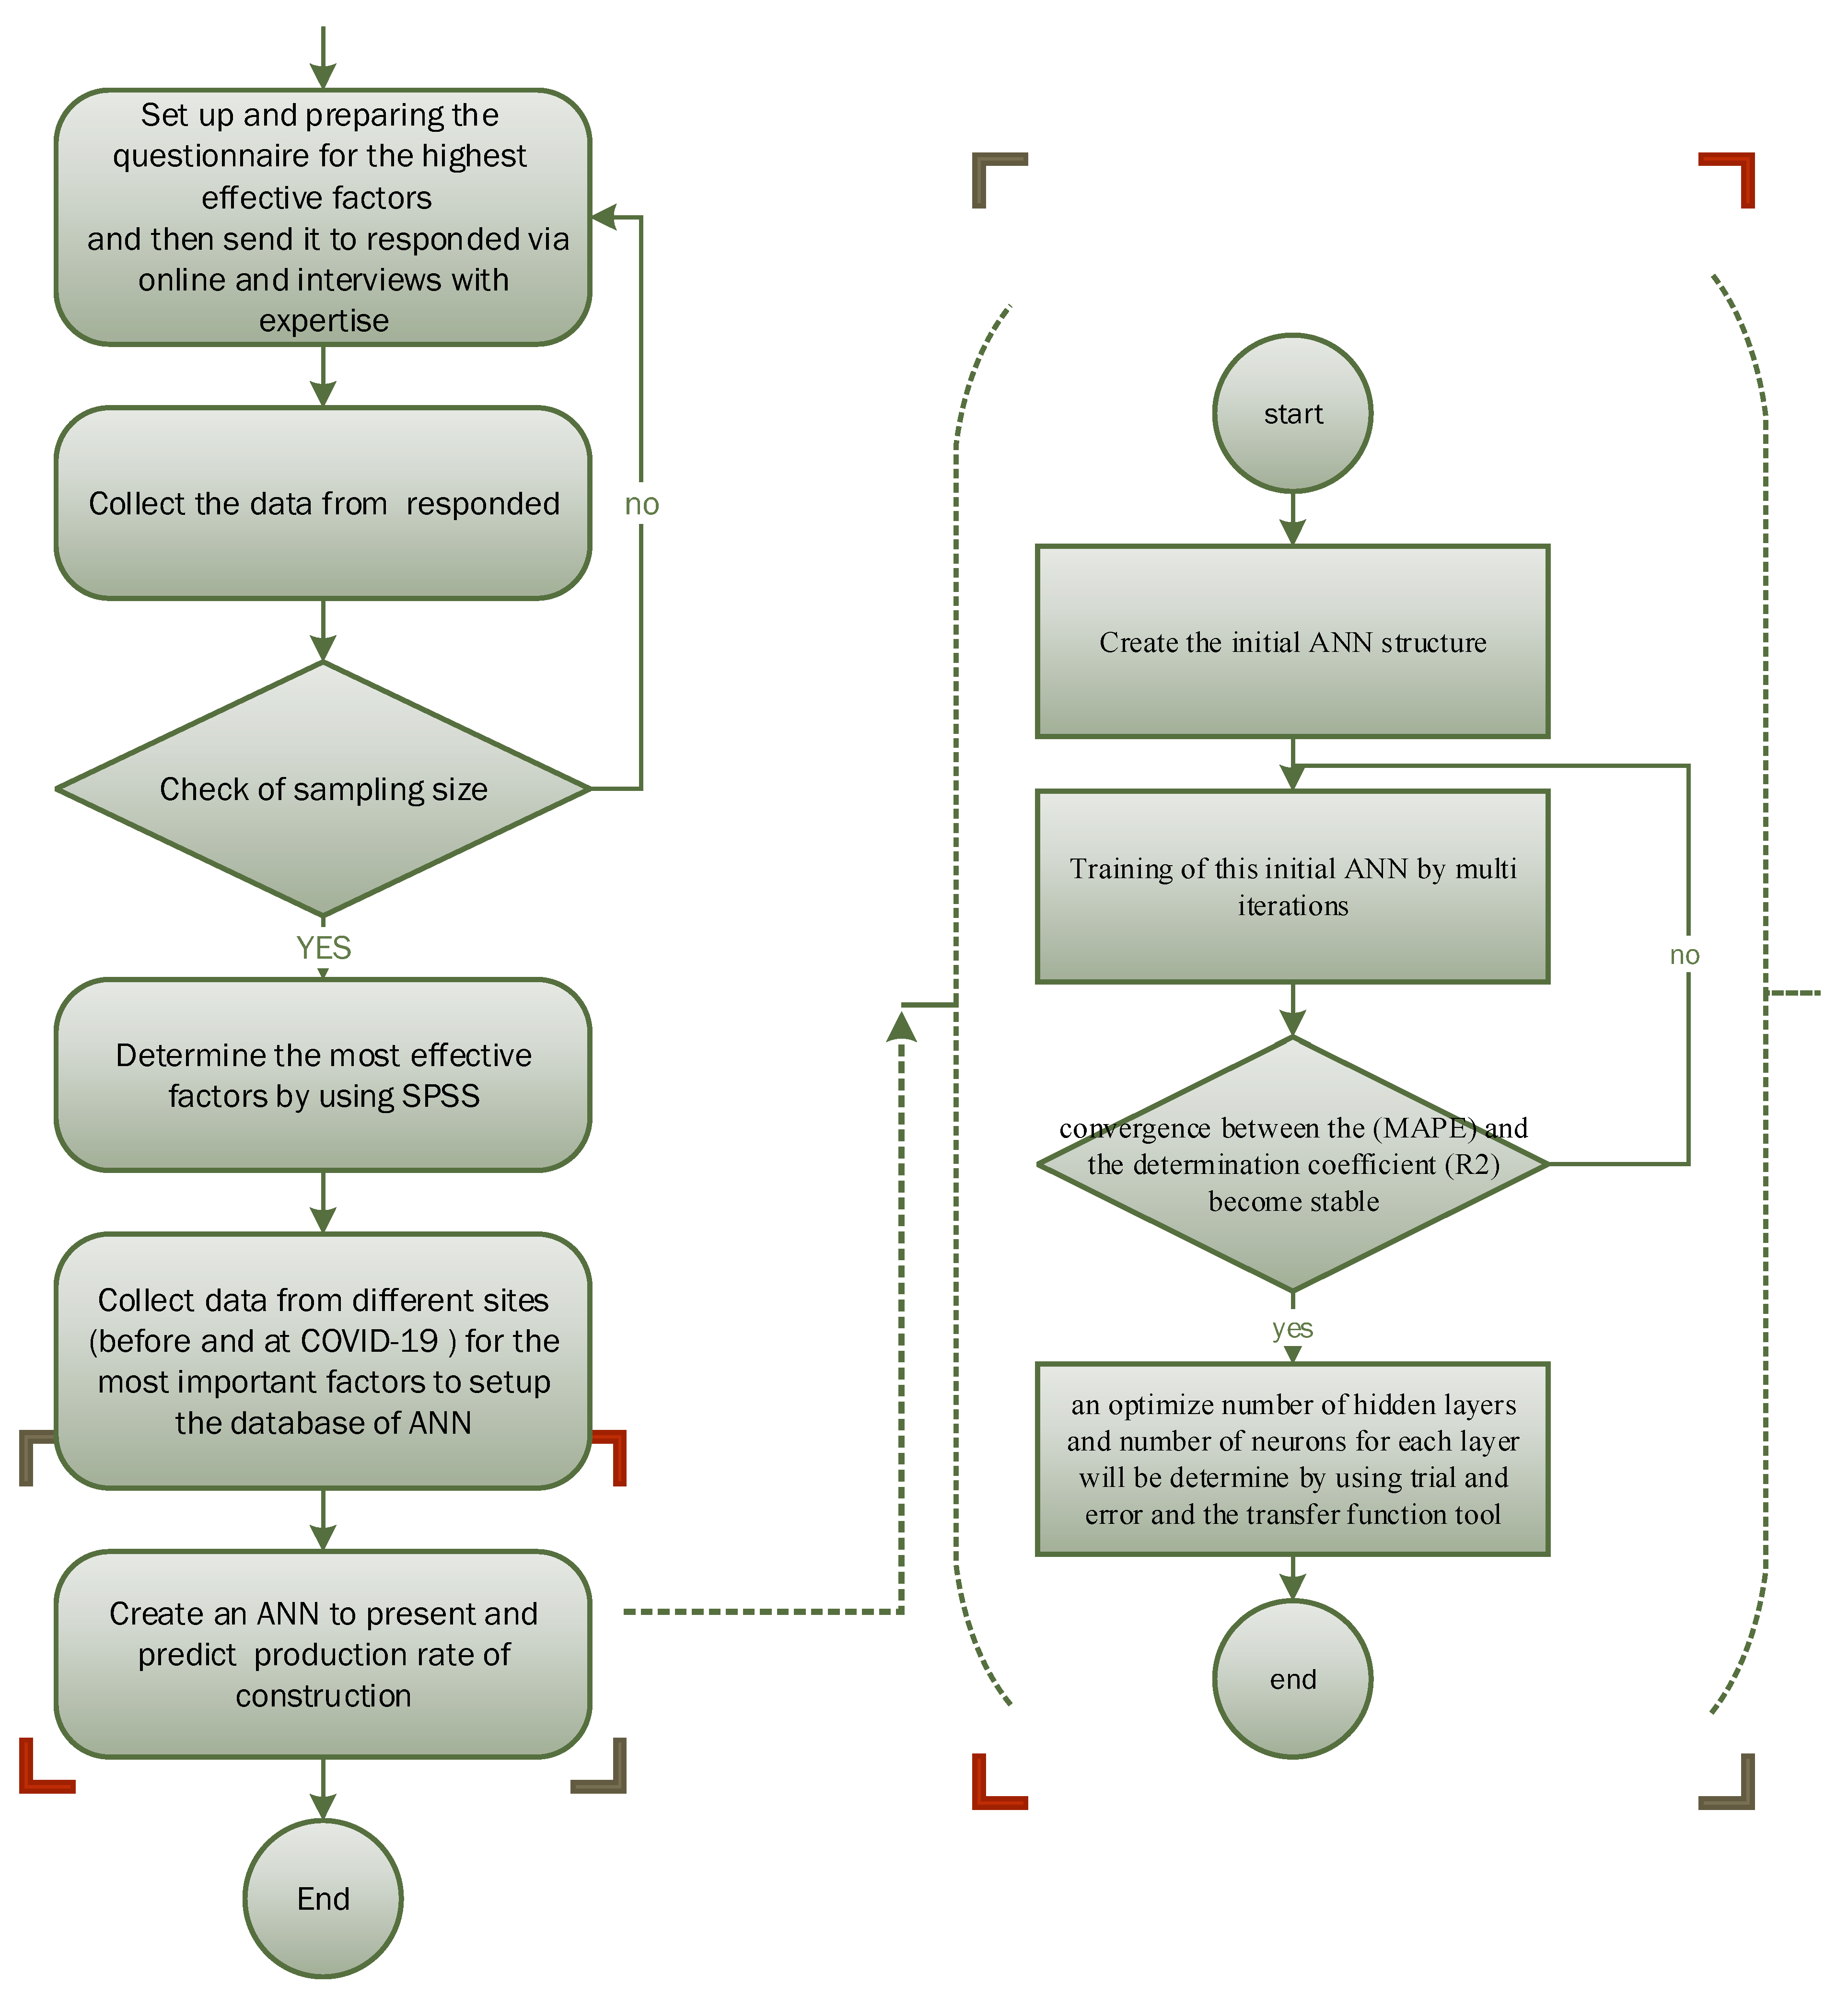
To achieve the goals of this research, six main steps are followed, as shown in Figure 1. Step one is to prepare the questionnaire for the highest effective factors collected from the previous works and then send it to respond online and interviews with experts (Appendix A shows the IRB of the experts). Step two: Collect data from responses, then go to the next step. Step three: check of sampling size of the data collected. If the answers and responses satisfy the required number, go to the next step, and if not, back to the predecessor step. The fourth step: is data analysis and determining the most effective factors using IBM SPSS Statistics 26. Fifth step: after prioritizing the factors and determining the most important, collect data from different sites (before and during COVID-19) to set up the database of ANN. The sixth step, create an ANN to predict the production rate of construction. This step goes throw four other sub-steps, as shown in Figure 1. The first sub-step: create the initial ANN structure, determine the activation function, number of hidden layers, and its neurons for each layer with the learning method. The second sub-step is the training of this initial ANN by multi-iterations. The third one is checking if the convergence between the Mean Absolute Percentage Error (MAPE) and the determination coefficient (R2) becomes stable, then going to the next sub-step and, if not, back to the last sub-step. Finally, an optimum number of hidden layers and several neurons for each layer will be determined by using trial and error and the transfer function tool.
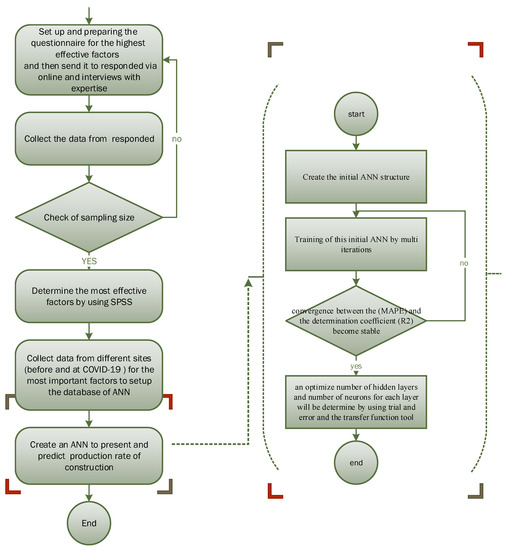
Figure 1.
Flowchart and Methodology of the Research.
4. Factors Affecting Construction Production Rate and Questionnaire Survey
Many factors that affect the production rate were collected from previous studies, questionnaires, and face-to-face interviews, mainly during the pandemic. After more than one round of discussion and data analysis (as Delphi technique) with experts (which the Institutional Review Board (IRB) is attached at the end of the research), about 34 factors appeared as a final list of factors, inserted at the questionnaire survey as shown at Table 1. First, the hierarchical breakdown structure for the effective factors is divided into main categories. Then each package or category is divided into six subcategories which are (1) Human/labor, (2) Management, (3) Technical and technological, (4) Logistics, (5) Financial, and (6) External, as shown in the table below. Based on that, the questionnaire was created to cover all these factors under the main categories’ subcategories of Google form. Therefore, the questionnaire is divided as follows:

Table 1.
Factors affecting the rate of production.
The first part includes the respondent’s general personal information, such as name, job title, academic degree, organization, and years of experience. The second part includes general information about the current project: the name of the project and the company for the respondent. The third part is the main part of the questionnaire, which presents the effective factors mentioned before. The questionnaire is designed to determine the impact of each factor on a Likert scale ranging from one to five. Where one means very low impact, and five means very high impact. The Fourth part asks about the percentage of cost increases the concurrent projects due to the COVID-19 crisis. The final part talks about the response to findings during these periods to enhance the construction production rate to achieve the production rate the COVID-19.
The survey targeted specialized participants in the construction sector, like directors, senior managers, managers, and senior engineers. The output of this step is prioritizing the collected factors and determining the degree of importance for each one related to the construction sector in Egypt. The main goal of this step is to select the most important factors that affect the production rate and the impact of COVID-19 on the cost and production rate of projects. According to the Egyptian Federation for Construction and Building Contractors (EFCBC), there were 258 tier-one enterprises in Egypt, including 142 tier-one companies in Cairo. The study focused on -one of the truth auction enterprises in the New Administrative Capital in Cairo. So, the sample size targeted for this study which represents this was calculated based on Equations (1) and (2) [12] (Cochran, 1963):
where n = the required sample size, n’ = the first estimate of sample size, N = the population size, P = the proportion of the characteristic being measured in the target population, q = (1 − p), and e = standard error of the sample. As per applying Equations (1) and (2), the sample size was calculated as 91. The questionnaire is answered and collected online using Google Forms, emails, and LinkedIn, where the survey is distributed to a sample of 300 individuals. The response rate for the questionnaires obtained was 153 replies, which is more than the calculated sample size. The survey’s respondents are participants in the construction industry in Egypt.
n = n’/(1 + ((n’ − 1)/N)
n’ = (Z2 ∗ P ∗ q)/(e2)
5. Data Collection and Analysis
After collecting the questionnaire responses, reliability tests were performed to ensure accurate results to determine how homogeneous the extracted factors were and to measure the stability of the questionnaire. Then, the data were analyzed to identify the most important factors affecting the production rate of construction projects related to COVID-19 by calculating the relative important index (RII).
5.1. Reliability Analysis
Reliability tests were conducted to obtain accurate results and verify how homogeneous the extracted factors were. Cronbach’s alpha internal consistency factor (α) is used to perform the internal consistency test. The consistency factor (α) is expressed as a number between 0 and 1, with a higher value indicating greater factor reliability. The range of acceptable alpha values is 0.70 to 1 [13] (Tavakol & Dennick, 2011). Most values in the measuring procedure tend to be 1, and all affecting factors are regarded to have a high coefficient of reliability.
5.2. The Relative Importance Index (RII)
The RII is used to find the most important factors affecting the construction production rate using data from the survey mentioned before during COVID-19. The relevance of each factor is rated according to the participants’ opinions. The RII is calculated using Equation (3) [14] (Sambasivan & Soon, 2007). The importance level of a given factor is classified based on the values shown in Table 1 (Akadiri 2011). Table 2 shows only factors with RII ranges between 0.8 and 1 (ranked as high) are considered.
where: W: is the weight given to each question by the respondents, according to a Likert scale of one to five. A: is the highest weight for each item (5 on a 5-point Likert scale). N: is the total number of respondents. n1: number of respondents for very low impact, n2: number of respondents for low impact, n3: number of respondents for medium impact, n4: number of respondents for high impact, n5: number of respondents for very high impact.

Table 2.
RII classification.
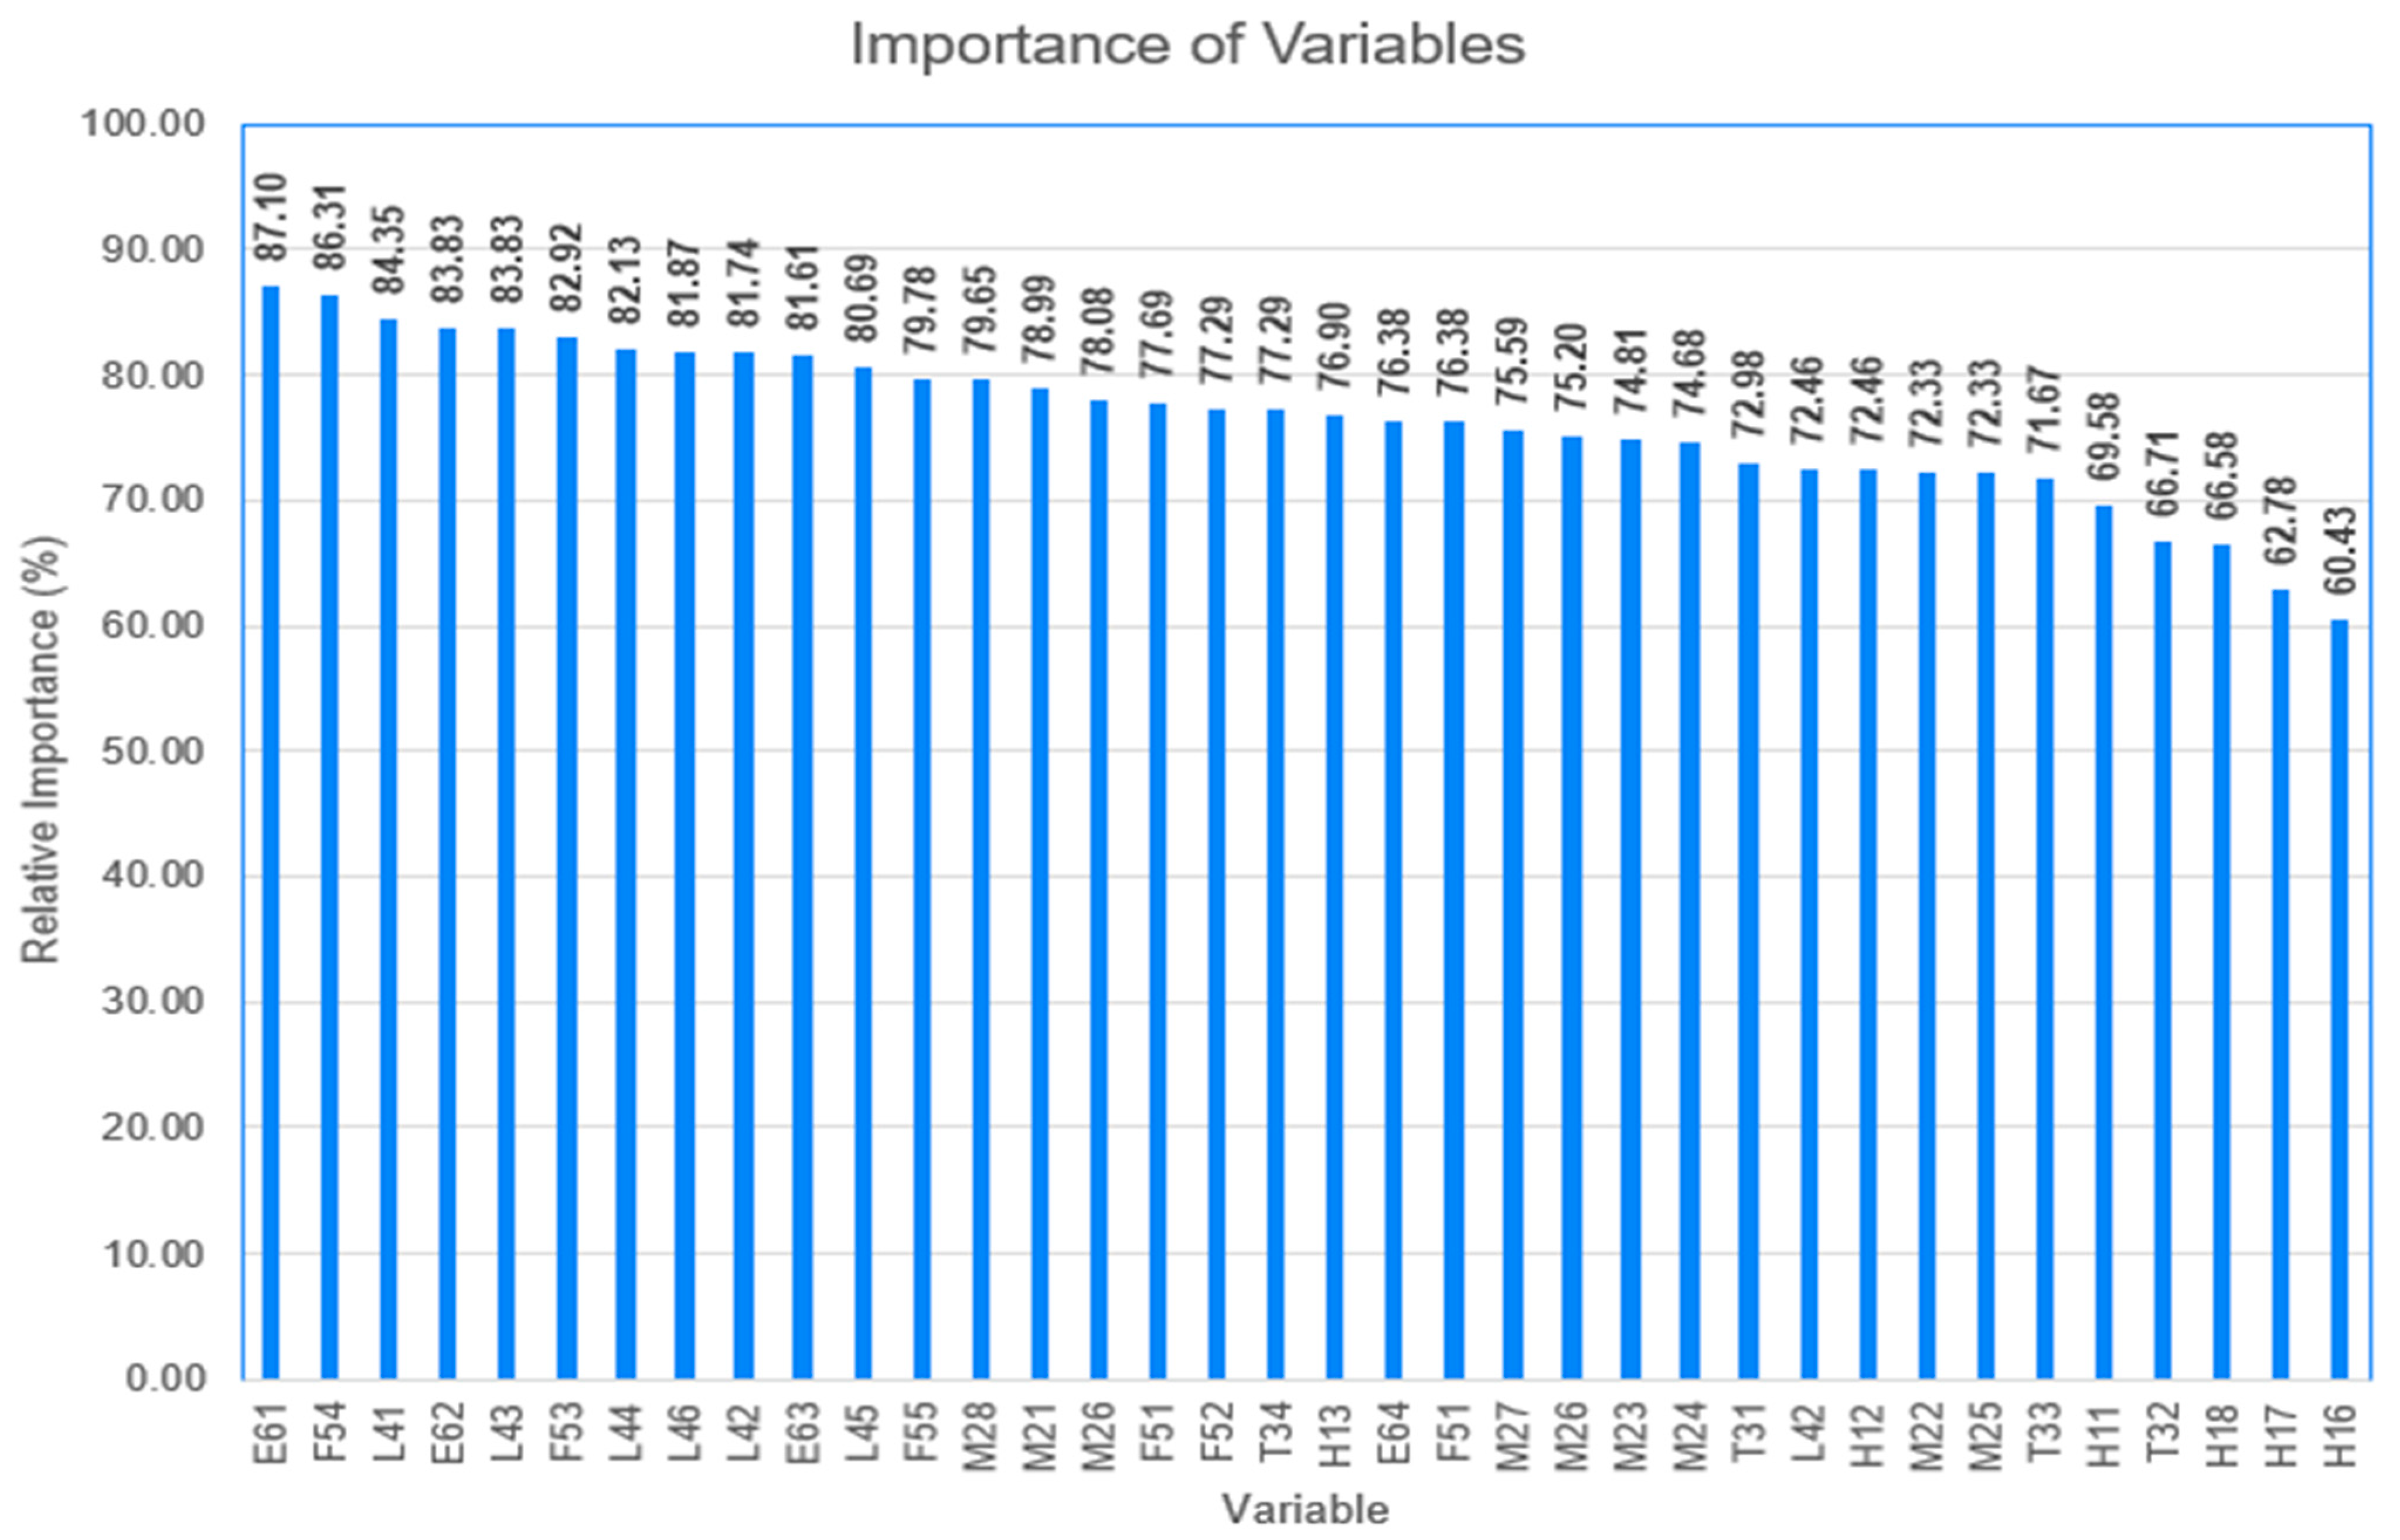
Then, the RII for the factors is calculated, as shown in Figure 2.
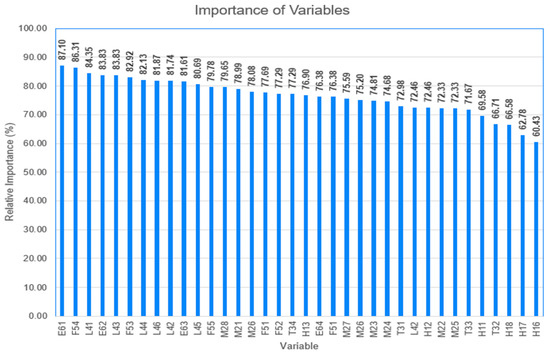
Figure 2.
The RII of the Factors’ Impact.
Figure 2 shows the RII of each factor regarding the time package. The factors with the highest impact on production rate are E61: Import and export, F54: Fluctuations and high prices, L41: Material delivery delays at the site during the COVID-19 pandemic, E62: Slow buying and selling, L43: Monopoly of materials due to closure, F53: low sales revenue and cash flow, L44: Finding alternate sources for difficult-to-import resources, L43: Monopoly of materials due to closure, L42: Labor, equipment, and materials unavailability, E63: Supply and demand on productivity during COVID-19 and L45: Finding alternative sources for the resources that are difficult to import.
Related to this analysis, eleven factors with RII ranked as high are collected, as discussed. Those eleven factors shown in Table 3 are considered the most important effective factors in the production rate at construction buildings.

Table 3.
The most important factors.
6. Artificial Neural Network
Artificial Neural Network (ANN) is a mathematical model that tries to simulate the structure and functionalities of biological neural networks. ANNs can solve complex real-life problems by processing information in their basic building blocks, artificial neurons, non-linear, distributed, parallel, and local. ANNs learn through experience rather than programming and by identifying patterns and relationships in data. Once the network is trained and tested, it can be given new input information to predict the output [15] (Agatonovic-Kustrin & Beresford, 2000). The basic ANN comprises input, output, and hidden layers. Each layer can have several nodes, and nodes from the input layer are connected to the nodes from the hidden layer. Also, nodes from the hidden layer are connected to the nodes from the output layer. Those connections represent weights between nodes [16], (Mirza Cilimkovic, 2015) [17]. This research developed many types of ANNs to select the best one that suits the current problem. The ANN types experimented with in this study were: feedforward neural network, perceptron neural network, general regression neural network, and feedforward backpropagation neural network. Based on the accuracy of developed models, the feedforward backpropagation neural network was the best one to solve this problem.
6.1. Data Collection and Analysis
The most important factors were sorted by using IBM SPSS Statistics 26. Then, another survey was done for tier-one companies in the new administrative capital in Cairo working at the peak time of COVID-19. Table 4 and Table 5 present a sample of data collected from these companies, mainly for production rate and cost for the most important factors which were determined before. The research uses this data as the database (collected from 153 responders) to develop an ANNs model to predict the production rate before and during COVID-19.

Table 4.
The most important factors are impacting the production rate (database sample).

Table 5.
The most important factor is the cost of the project’s database sample.
The input data is the most important factor, and output data is the production rate and project cost before and during COVID-19.
The learning (or training) process in a neural network is started by separating the data into three groups:
- Training dataset—The Neural Network can comprehend the weights between nodes thanks to this dataset, 70% of data used in the training process (107 Records).
- Validation dataset—The Neural Network’s performance is adjusted using this dataset, and 15% of data used the validation process (23 Records).
- Test dataset—The accuracy and error margin of the neural network is evaluated using this dataset, with 15% of data used testing process (23 Records).
Once the data is segmented into these three parts, Neural Network algorithms are applied to them for training the Neural Network. The process of facilitating training in a neural network is known as optimization, and the optimizer is the applied method.
6.2. Selecting the Proper Network Architecture
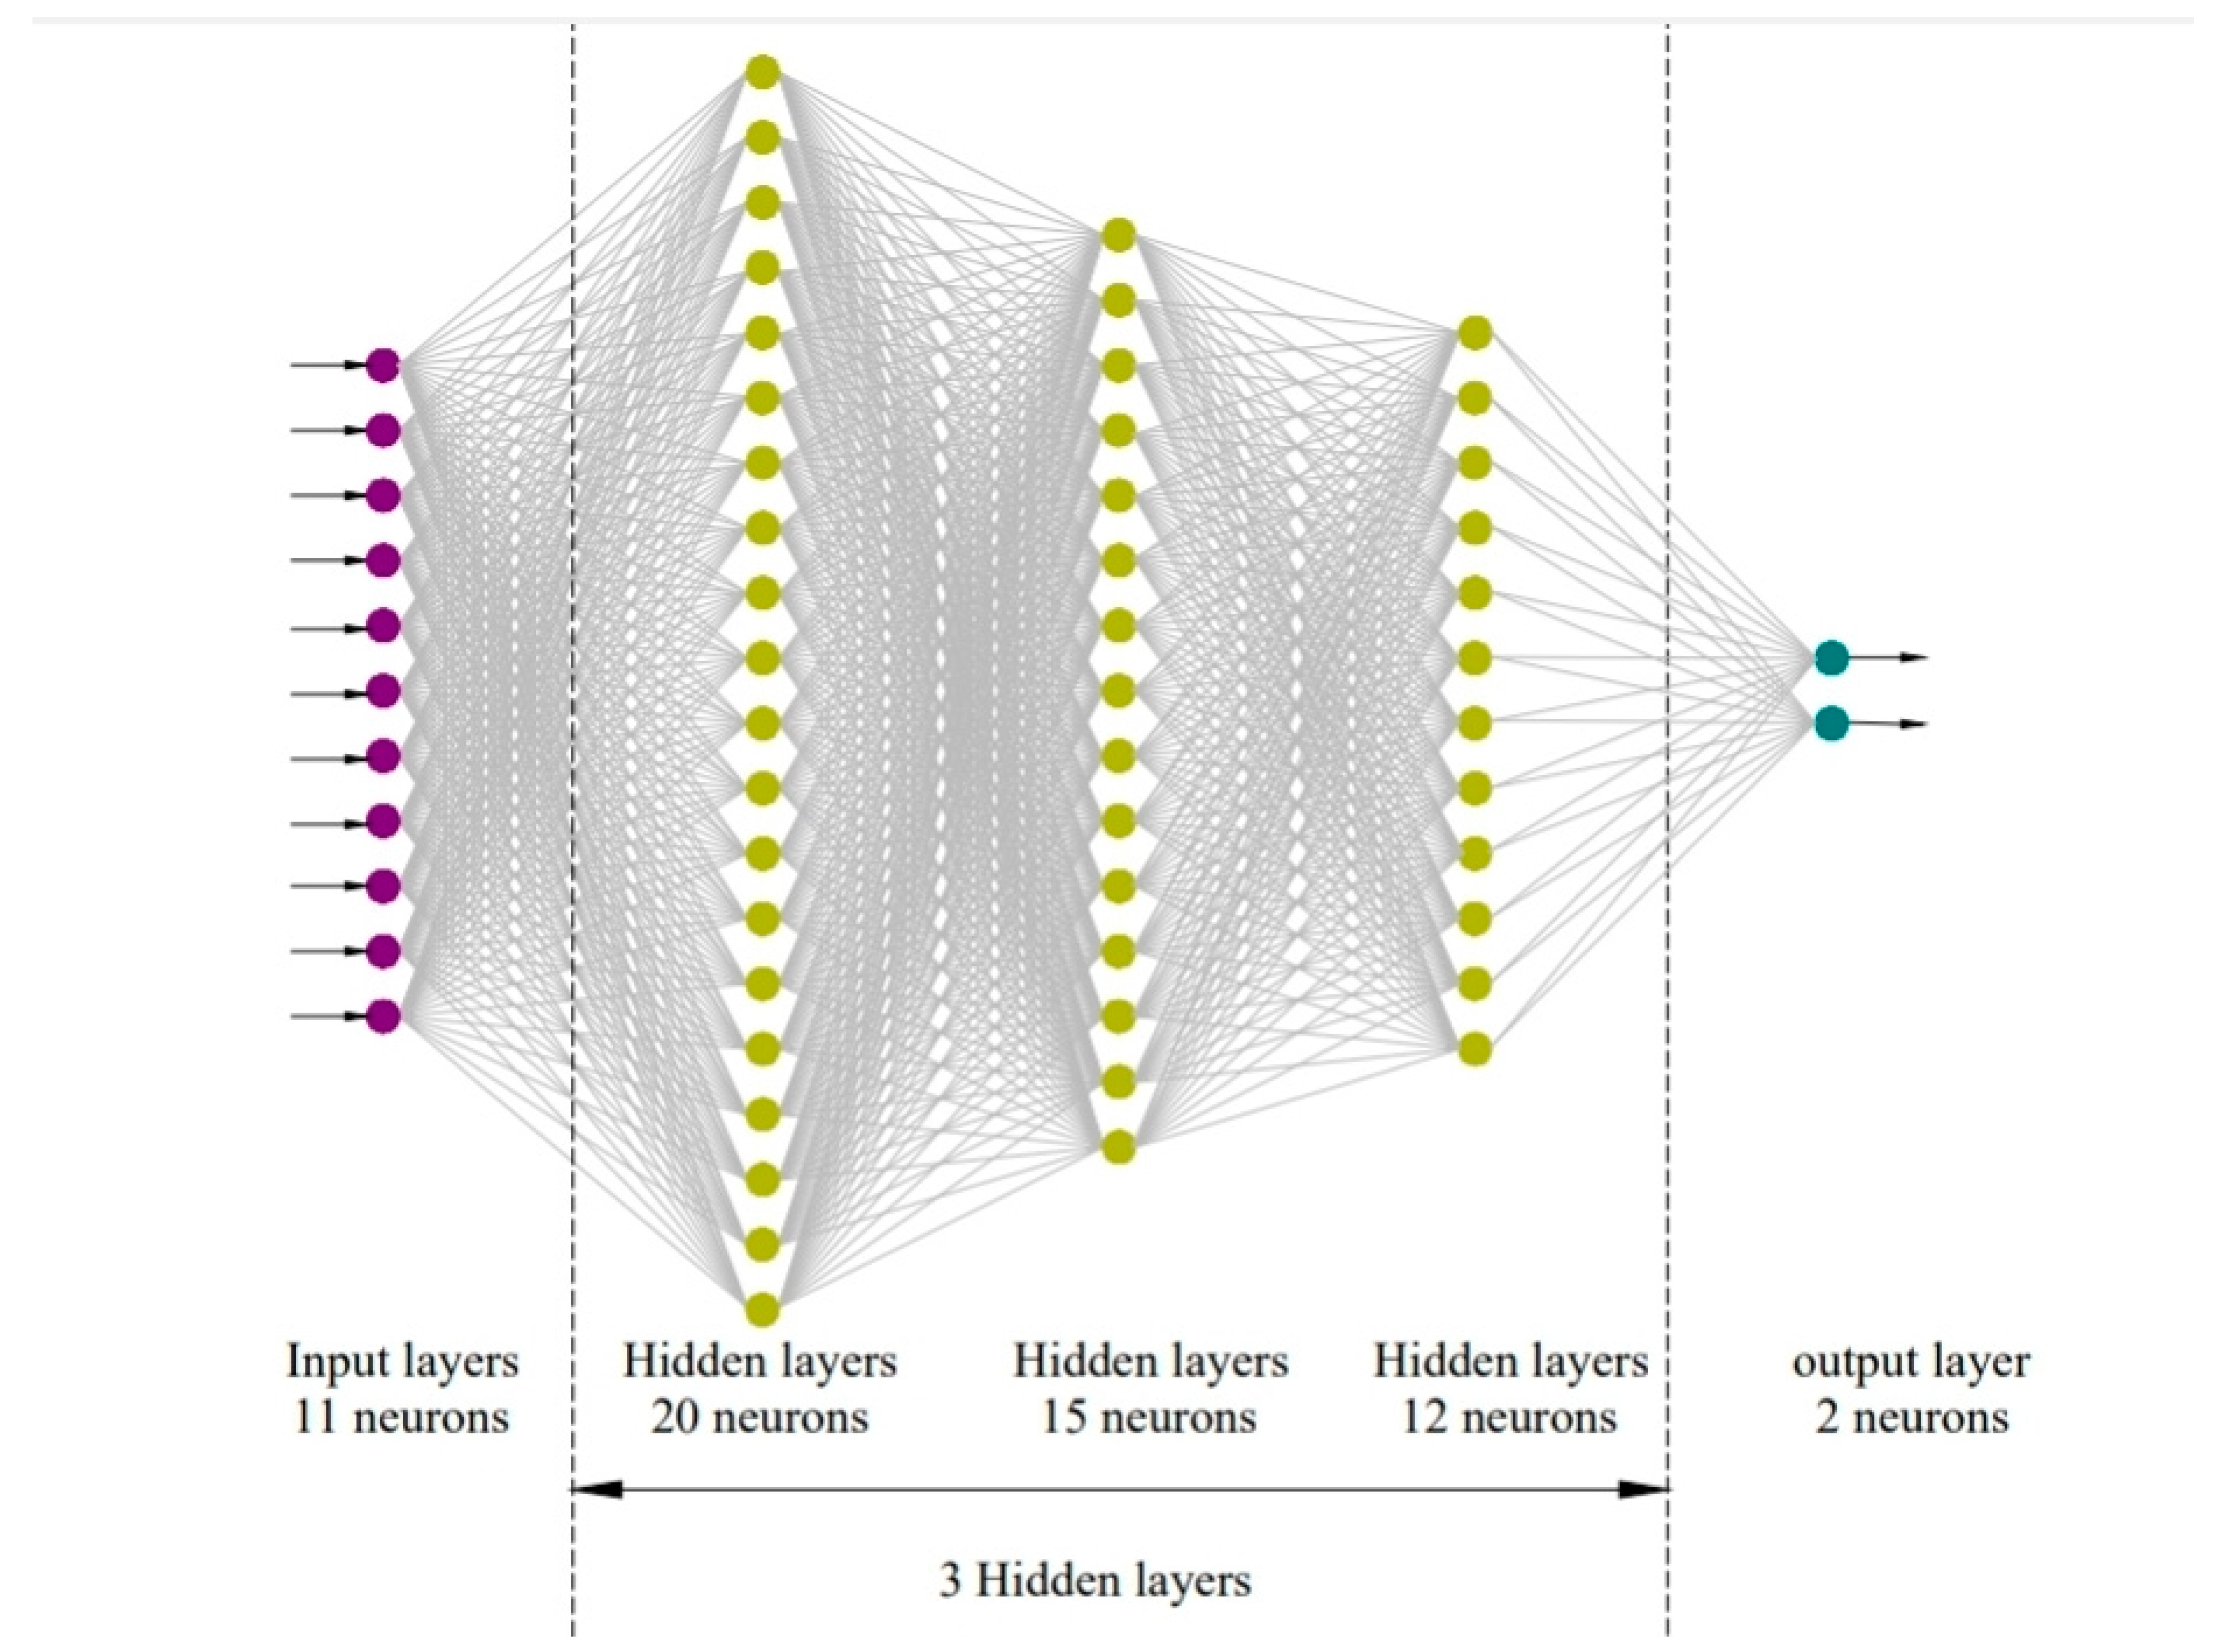
The default steps to create a suitable ANN for the production rate in the construction sector are: first: Create the initial ANN structure (determine the activation function, number of hidden layers, and its neurons for each layer with the method of learning). Secondly, training this initial ANN by multi-iterations until the convergence between the Mean Absolute Percentage Error (MAPE) and the determination coefficient (R2) becomes stable. Finally, an optimum number of hidden layers and a number of neurons for each layer will be determined by using the trial-and-error method and the transfer function tool. These steps are required because there is no specific rule to determine the suitable number of hidden layers and neurons. In this study, several structures are developed with two hidden layers, with 10, 11, 12, 13, 14, 14, 15, 16, 17, 18, 19, and 20 neurons: and three hidden layers with a random number of neurons for each layer. Table 6 shows the ANN model structure (20-15-12-1) with the least MAPE (2.4136%) and highest R2 (0.9845) selected. Then, the proposed ANN model structure consists of one input layer with eleven neurons, three hidden layers with twenty, fifteen, and twelve neurons, respectively, and one output layer with two neurons, as shown in Figure 3.

Table 6.
Experiments to determine the proper ANN architecture (to Production Rate).
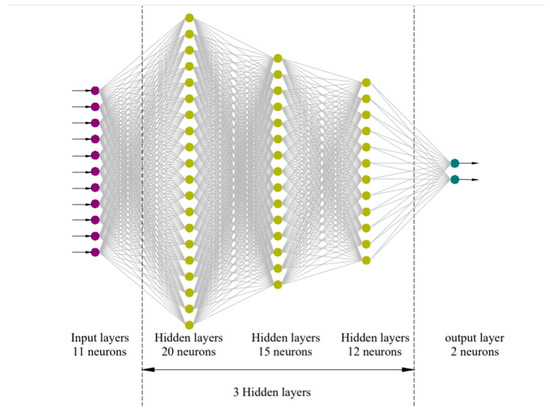
Figure 3.
Neural Network to production rate.
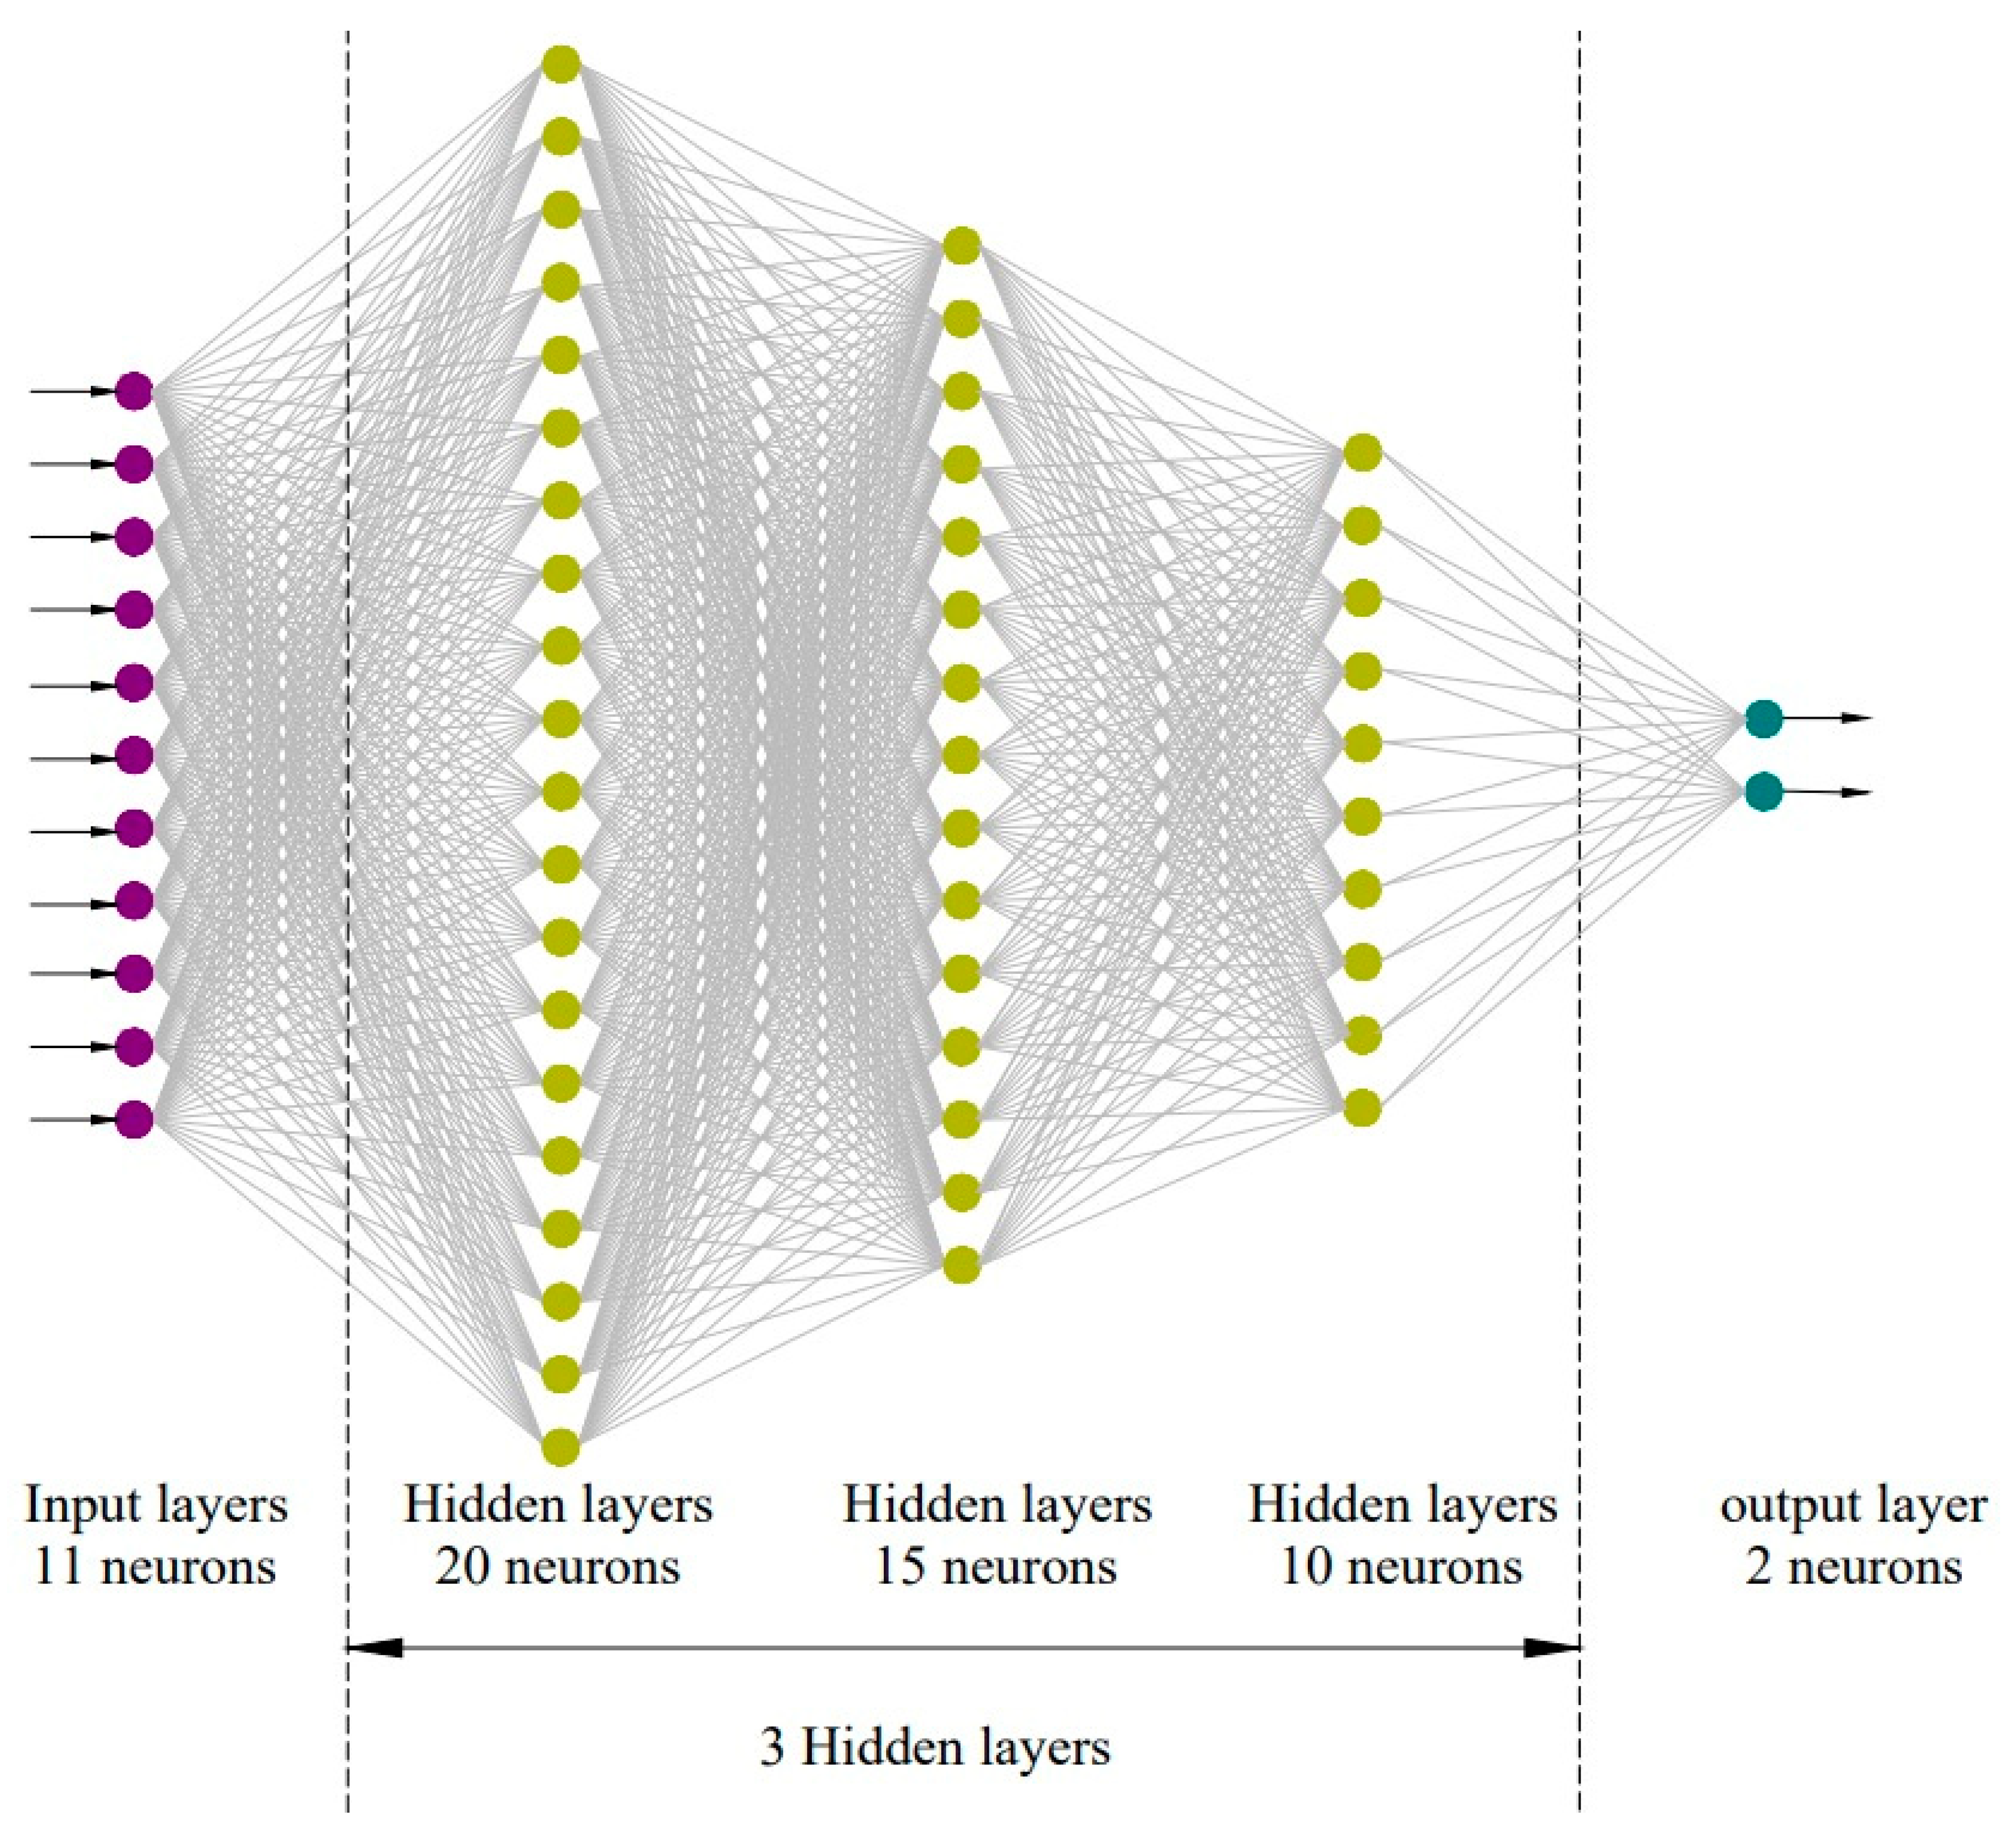
Similarly, from Table 7, the ANN model structure (20-15-10-1) with the least MAPE (1.3802%) and highest R2 (0.97474) is selected. Then, the proposed ANN model structure consists of one input layer with eleven neurons, three hidden layers with twenty, fifteen, and ten neurons, respectively, and one output layer with two neurons, as shown in Figure 4. The training was set to stop after 600 iterations (this study used the gradient descent stochastic algorithm, which uses a dataset for training with its iterative learning algorithm for updating the model. The batch size is a gradient descent hyperparameter that trains the training sample numbers before the model’s internal parameters are updated to work through the batch. The epoch number is again a gradient descent hyperparameter that defines the number of complete passes through datasets under training). Finally, the MAPE and R2 statistical measures are used to assess the performance of the ANN. While comparing the actual data to the predicted data based on the developed ANN model, we noticed that the actual and predicted data are almost the same, i.e., there is no significant variance between them. Hence, the coefficient of correlation (R2) is high, and the Mean Absolute Percentage Error (MAPE) is low due to the high accuracy.

Table 7.
Experiments to determine the Optimum ANN Architecture to cost of projects.
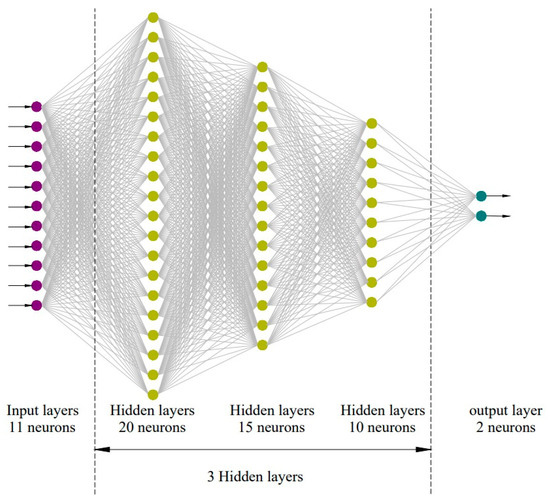
Figure 4.
Neural Network to cost projects.
As such, the developed ANNs models consist of one input layer with eleven neurons, one output layer with two neurons, and three hidden layers, as shown in Figure 3 and Figure 4, in which the definitions of the input layer, hidden layer, and output are as follow:
- The input layer is the initial data for the neural network.
- Hidden layers are the intermediate layer between the input and output layers and where all the computation is done.
- Finally, the output layer is the result of given inputs.
The summary of steps to create a suitable ANN for the production rate in the construction sector are as follows:
- 1-
- Create the initial ANN structure: at this step, the authors determine the activation function, the number of hidden layers, and its neurons for each layer with the learning method.
- 2-
- Training of this initial ANN by multi-iterations until the convergence between the Mean Absolute Percentage Error (MAPE) and the determination coefficient (R2) becomes stable.
- 3-
- Then an optimized number of hidden layers and a number of neurons for each layer will be determined using trial and error and the transfer function tool.
Finally, in this study, two ANN models were developed: the first was used to predict the production rate, and the second was used to predict the projects’ cost.
7. Results
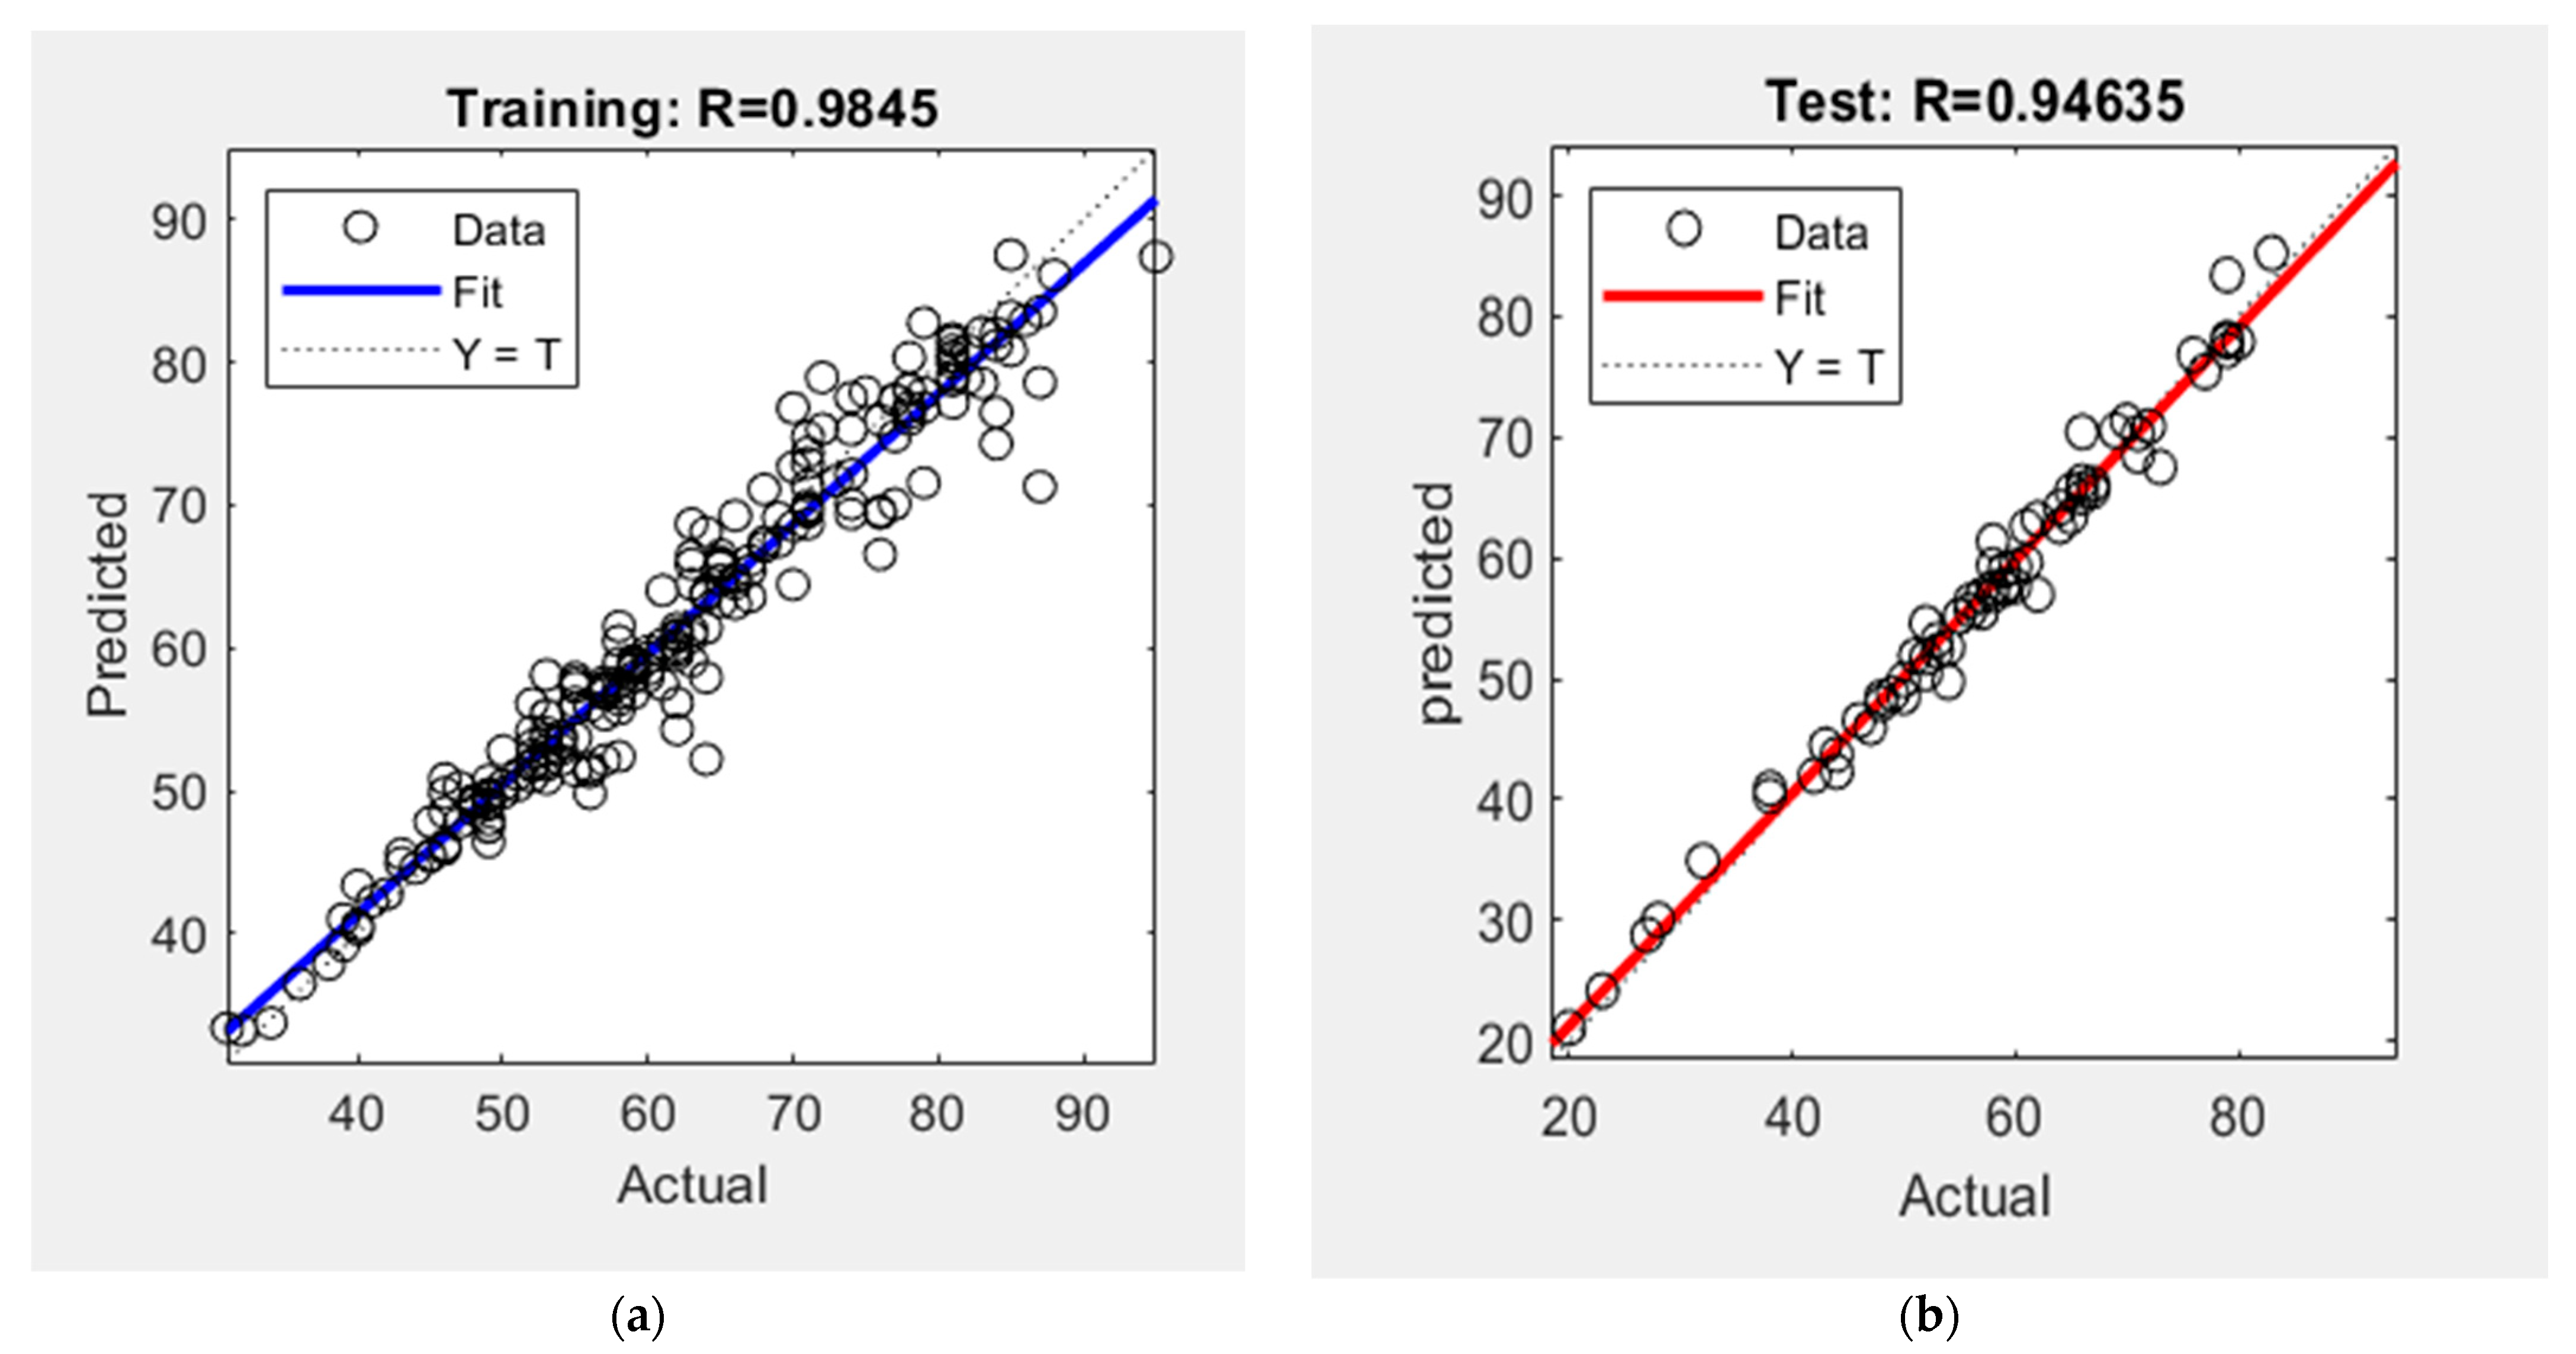
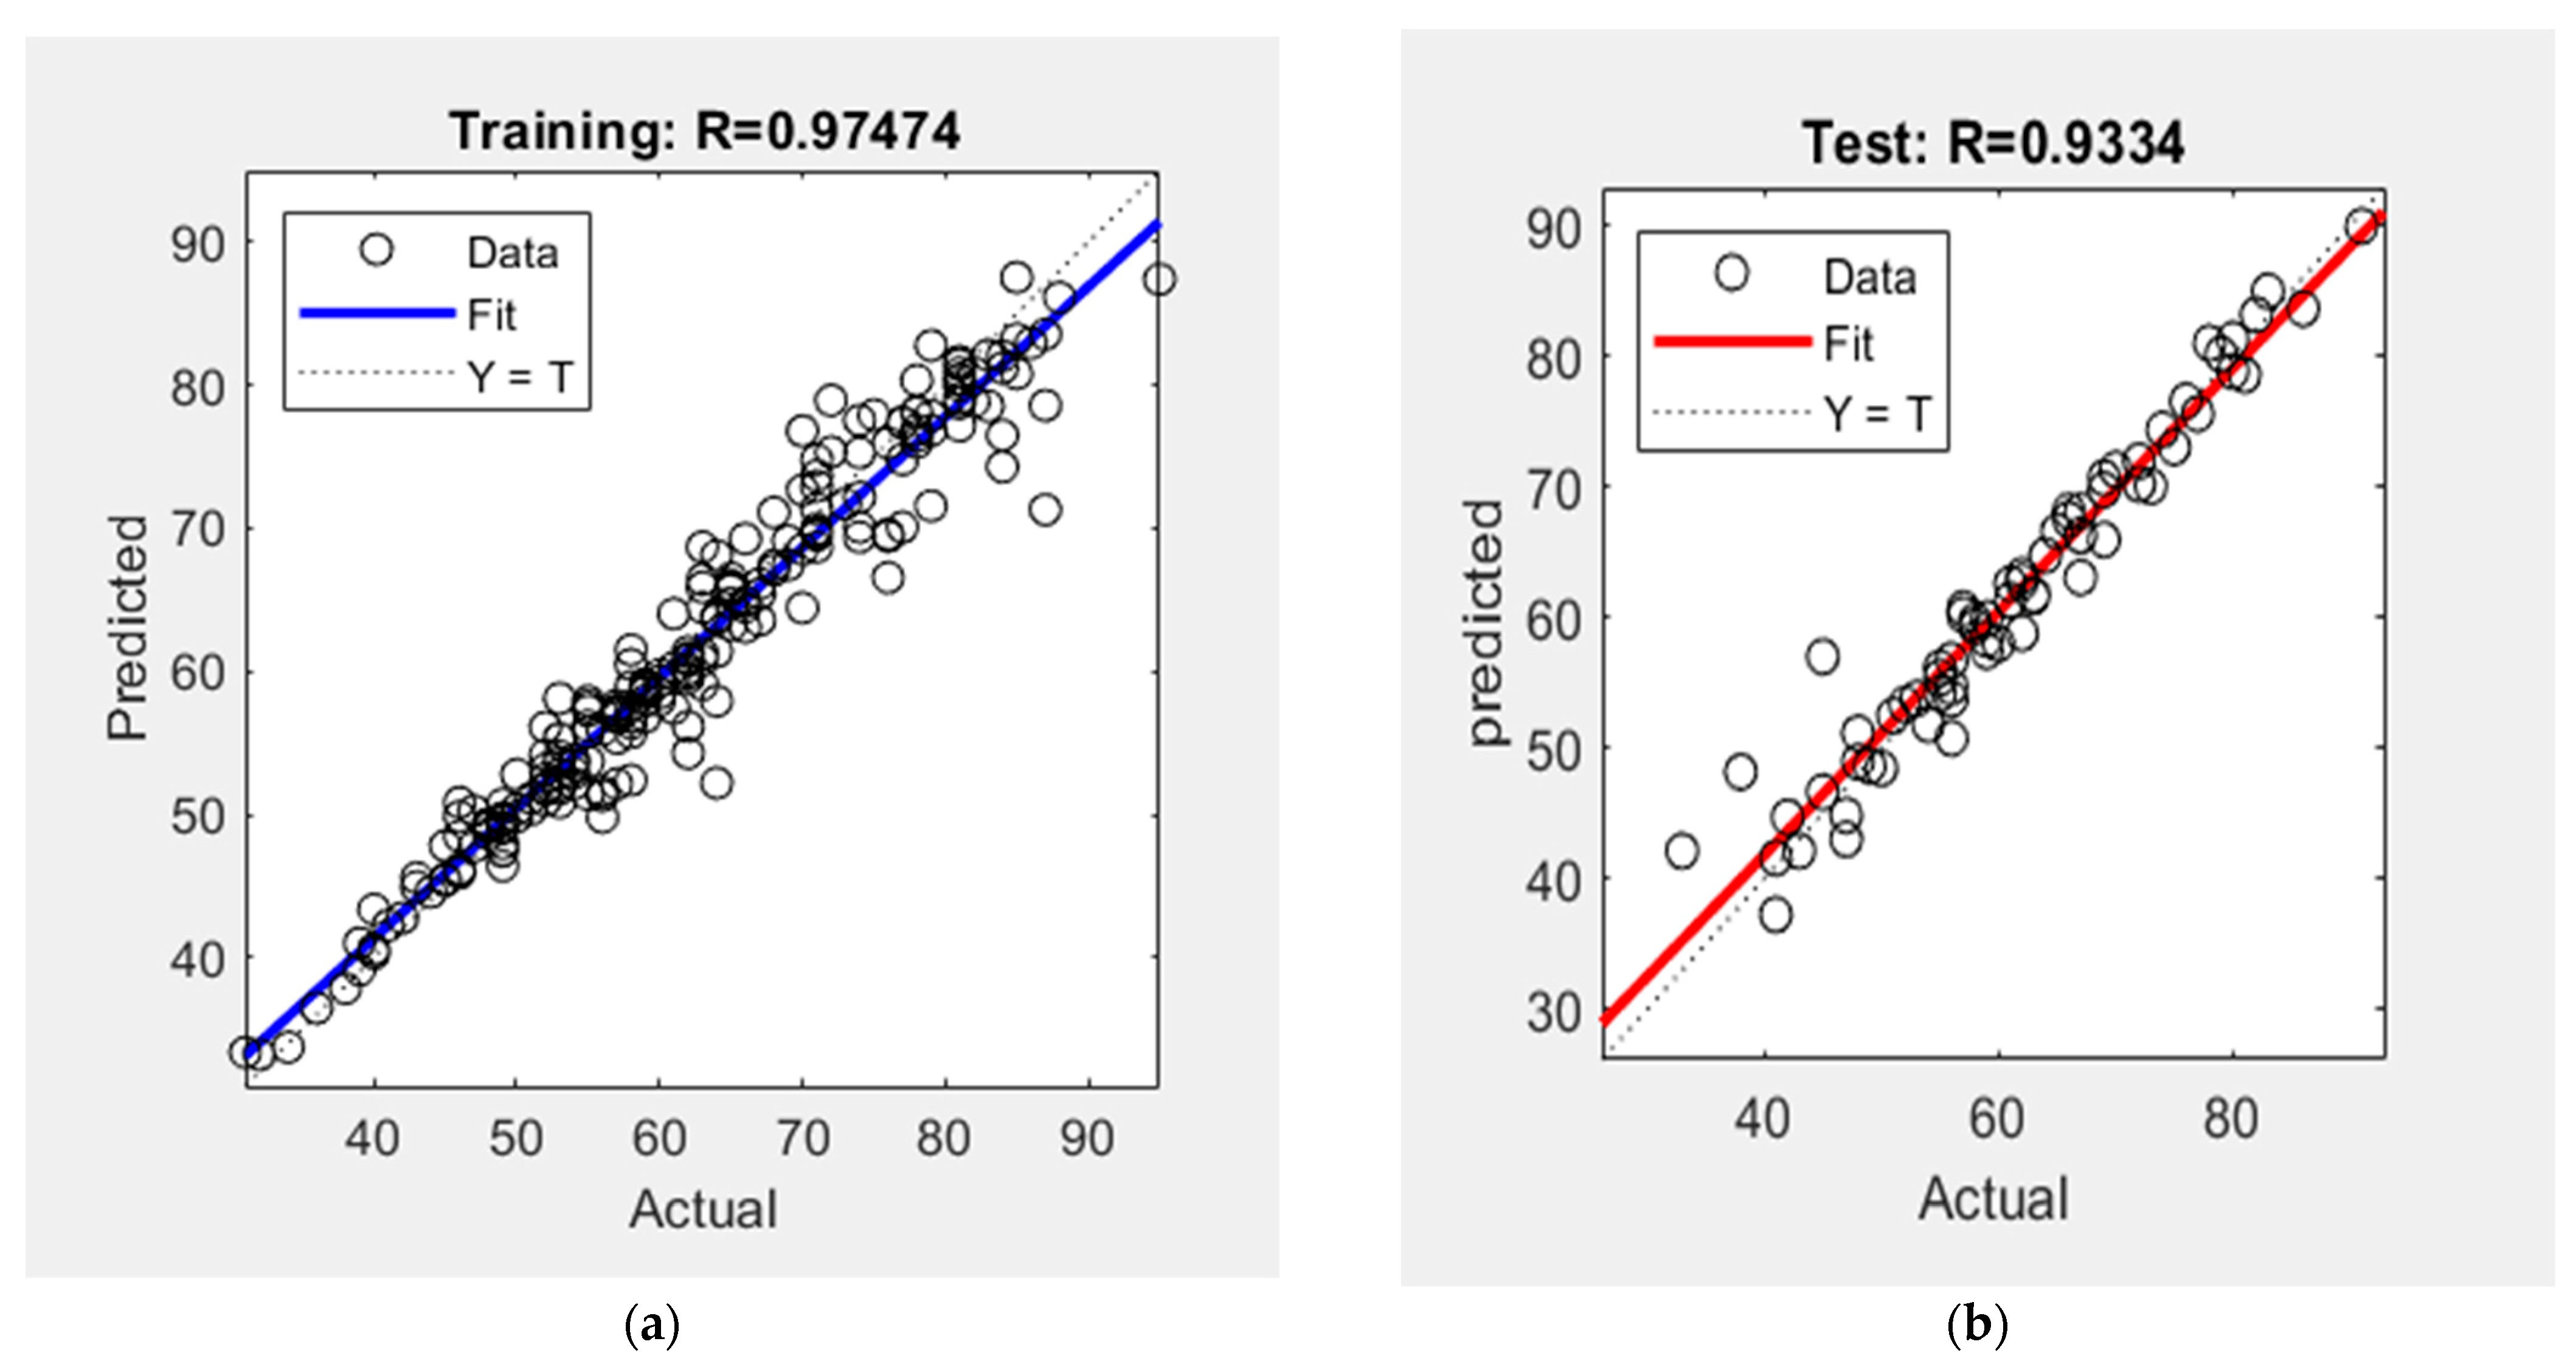
Figure 5 shows the predicted production rates. Figure 6 shows the expected cost of the projects. The ANNs show a high degree of success. The accuracy of this research was based on calculating the coefficient of correlation (R2).
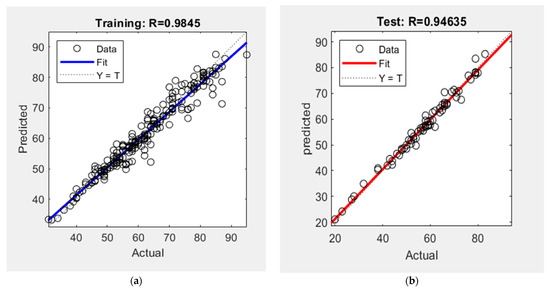
Figure 5.
Actual and predicted production rates. (a): Training (b): Testing.
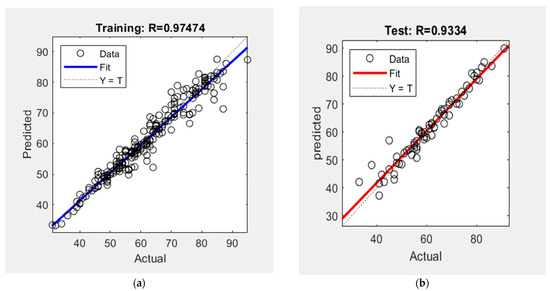
Figure 6.
Actual and predicted cost of the projects. (a) Training (b) Testing.
Figure 5a shows a comparison between actual and predicted values of production rate which illustrate a high coefficient of collocation, equal to 0.9845, in the validation process. Figure 5b compares actual and predicted values of the production rate of cost, which illustrate a high coefficient of collocation, equal to 0.94657, in the testing process.
Figure 6a compares actual and predicted values of the production rate of cost, which illustrate a high coefficient of collocation equal to 0.97474, in the validation process. Figure 6b compares actual and predicted values of the production rate of time, which illustrate a high coefficient of collocation, equal to 0.9334, in the testing process.
8. Validation of the Proposed Model (Case Study)
Validation was carried out to ensure the accuracy of COVID, which was inferred using ANNs. A Z-Tower building is considered to validate the proposed ANN model. It is located in El-Sheikh Zayed, October region, Cairo. It consists of a podium with six levels, four towers (towers 1 and 4 consist of 17 floors, also towers 2 and 3 consist of 19 floors), and Steel Bridge for connecting two towers with approximately 700ton steel. The land area is 38,000 m2, and the built-up area for the Podium and the towers is 197,000 m2, as shown in Figure 7.

Figure 7.
The actual and predicted cost of the projects.
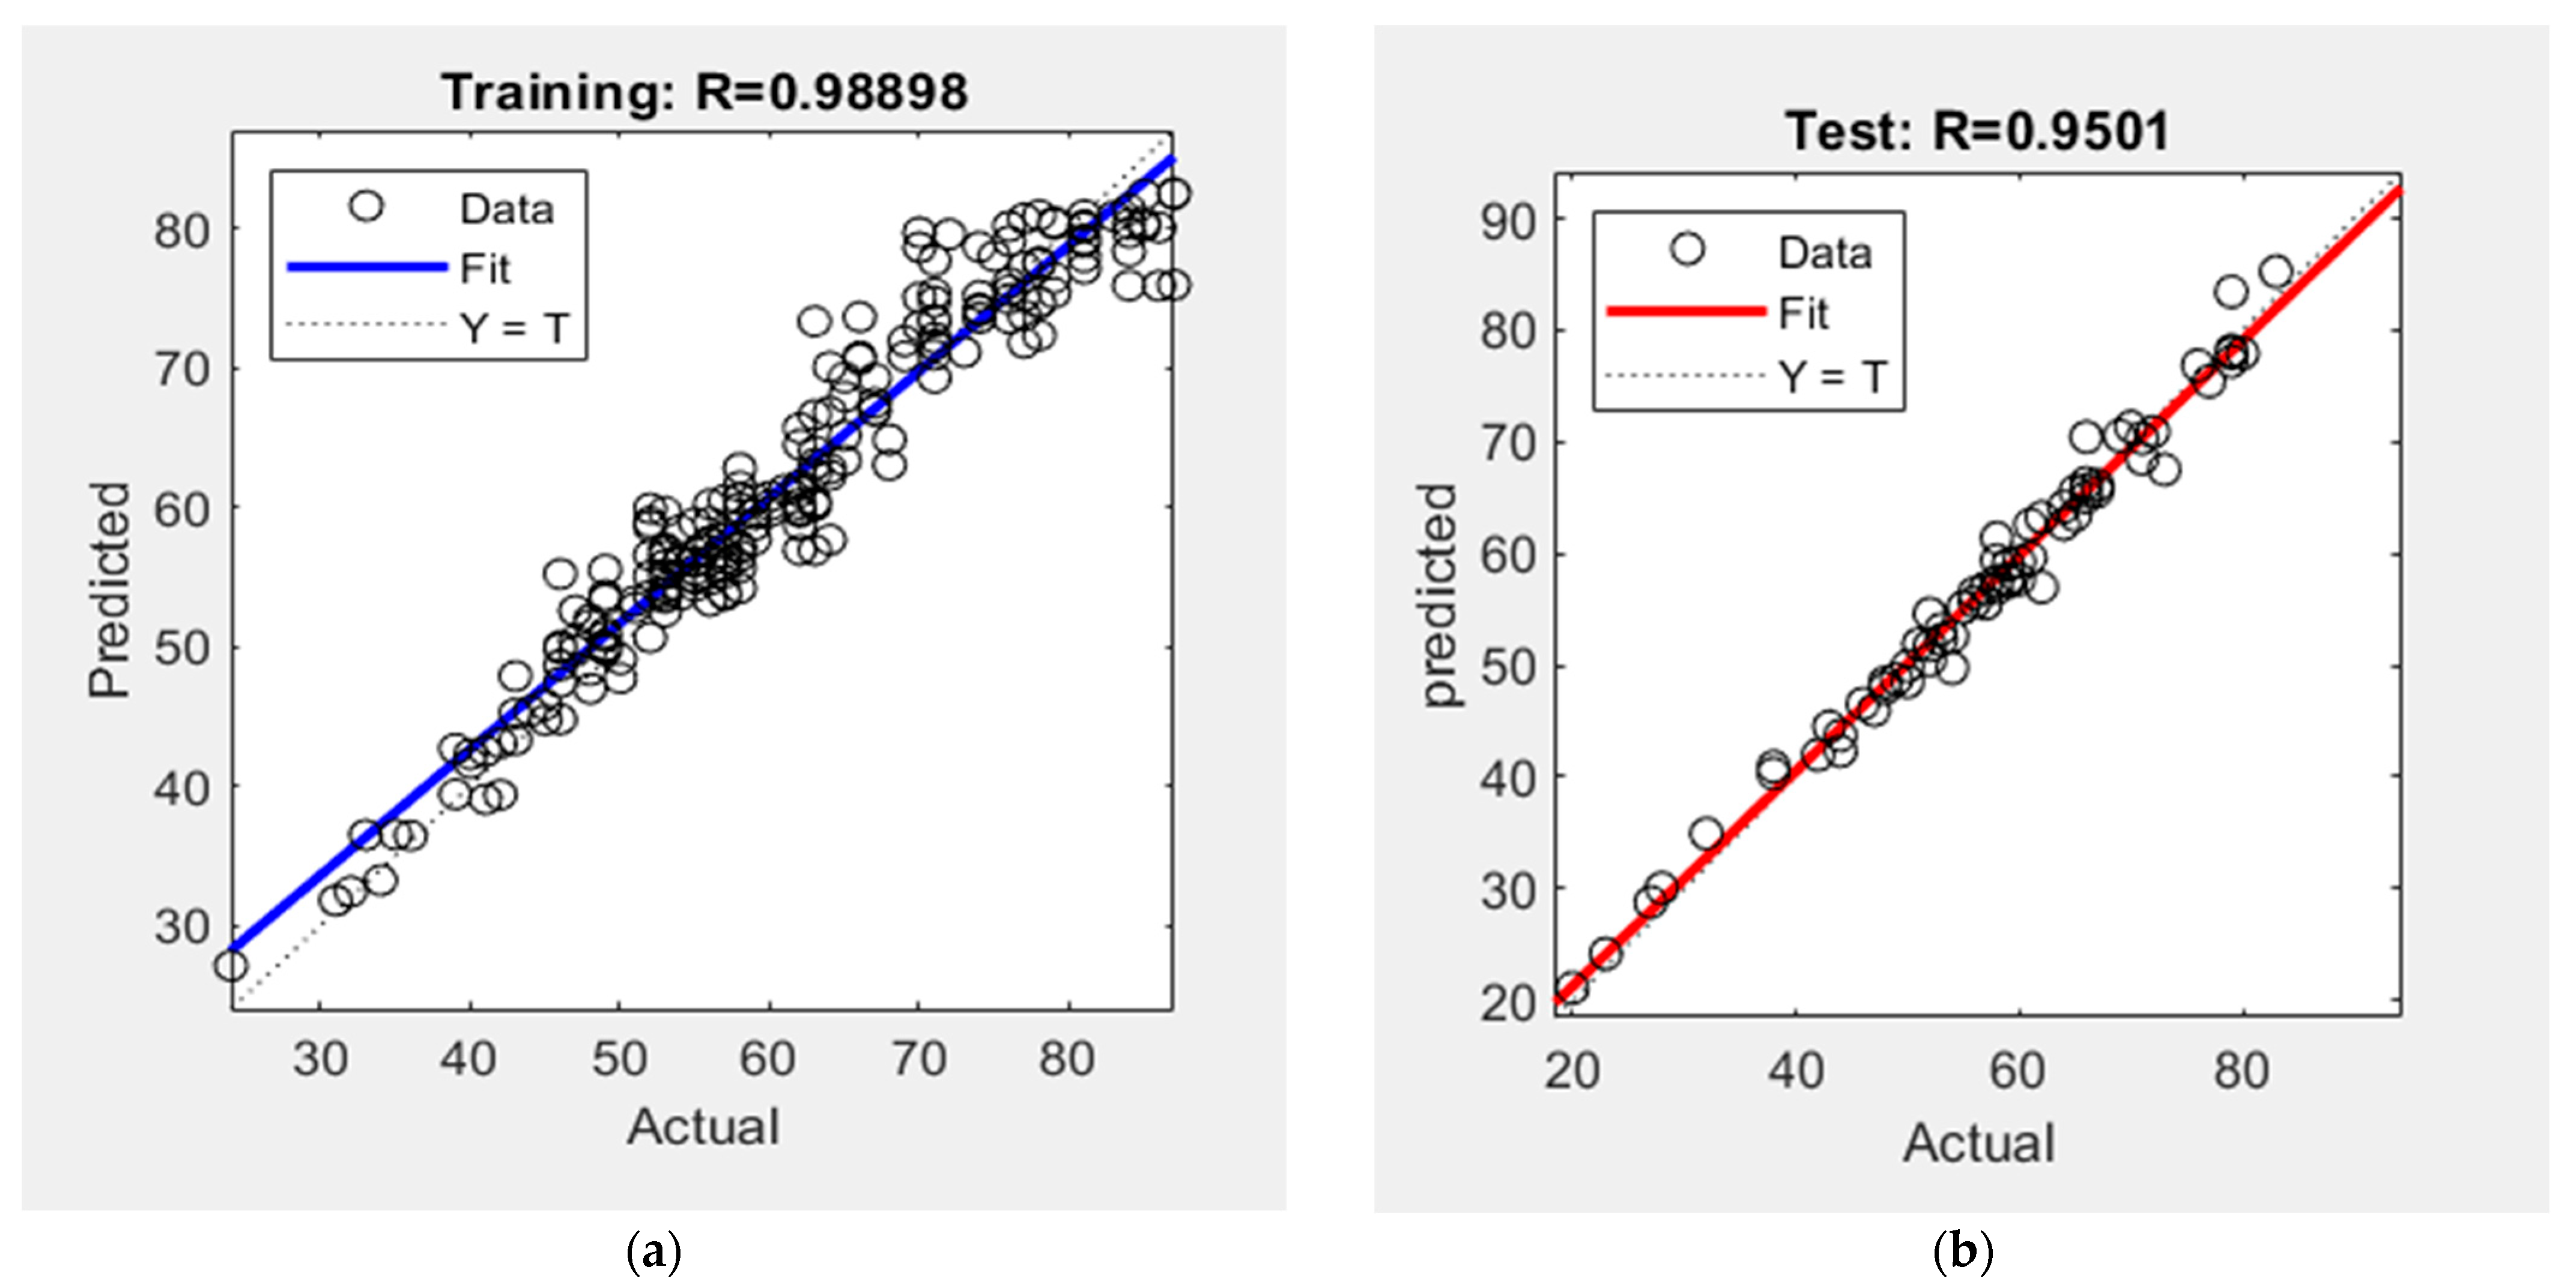
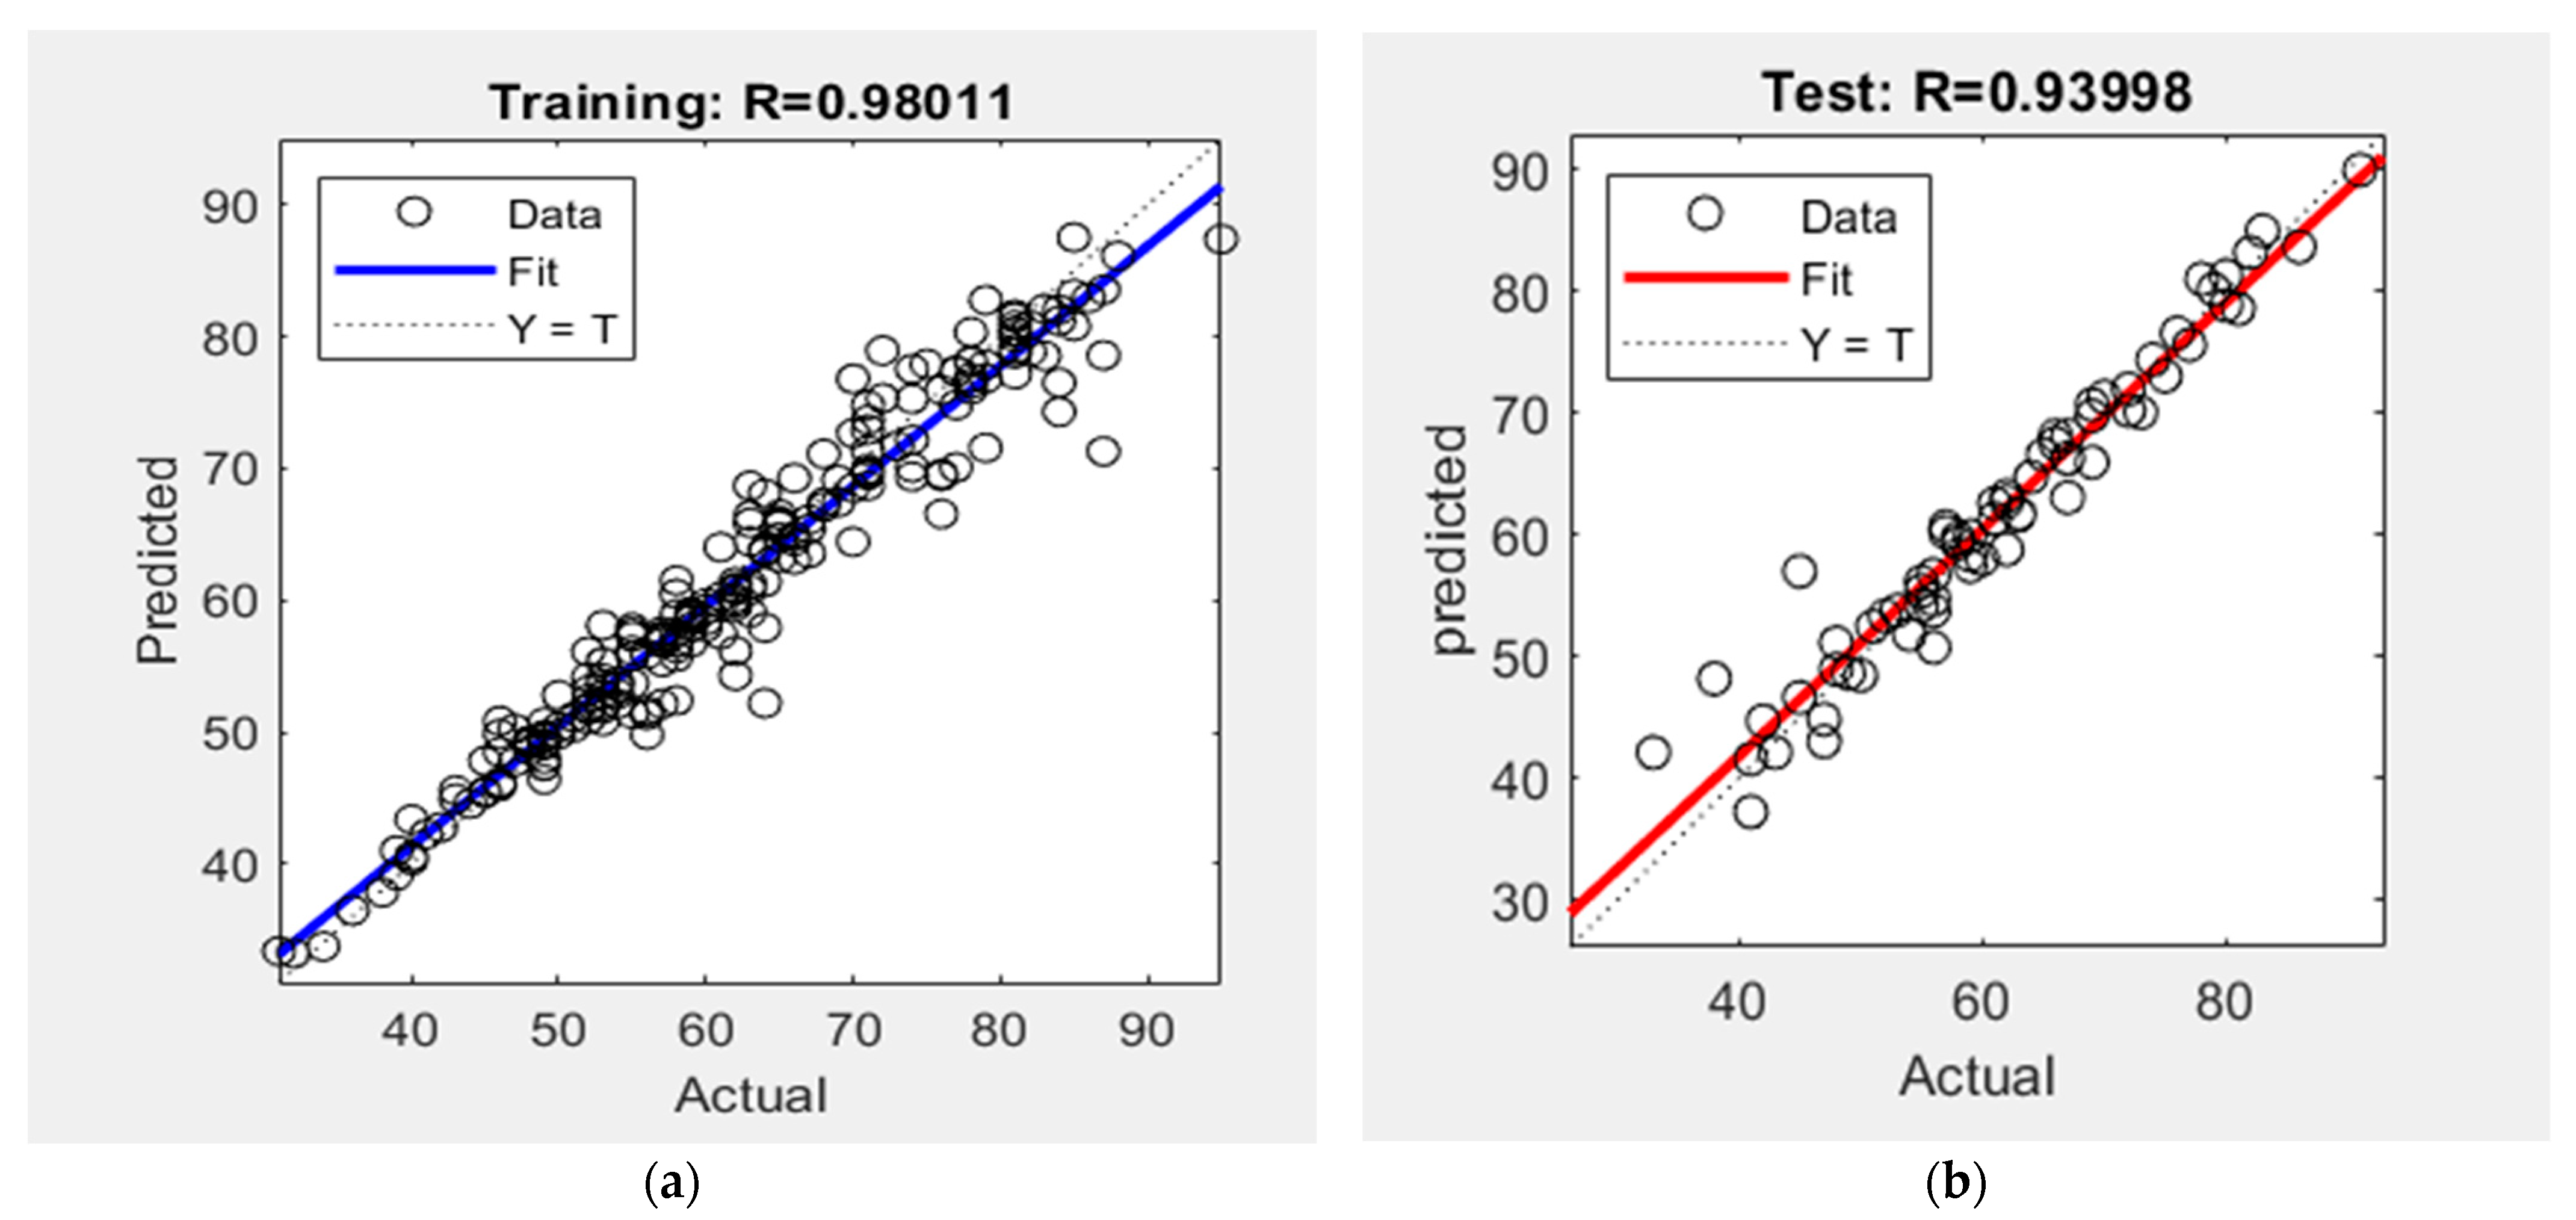
A database was constructed by collecting data from the project team mainly for the important factors mentioned above. The data were collected before and during the peak of COVID-19. The results acquired from the survey are compared to those received from the database. Figure 8 and Figure 9 show the results. The results acquired from the survey are compared to those received from the database. Figure 7 and Figure 8 show the results.
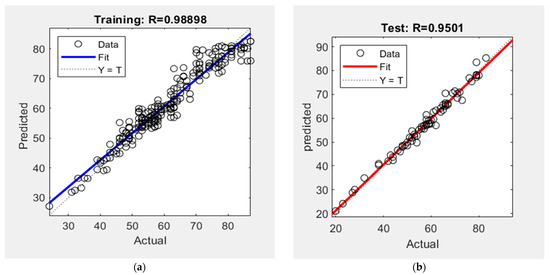
Figure 8.
The results were acquired from the validation of production rates. (a) Training (b) Testing.
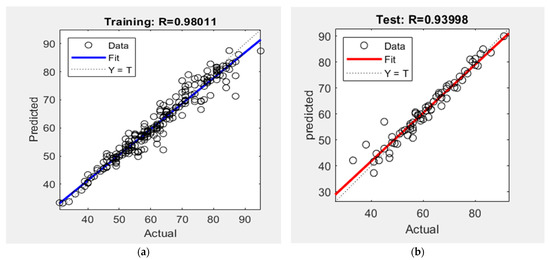
Figure 9.
The results were acquired from the validation of to cost of the projects. (a) Training (b) Testing.
The comparison resulted in a large convergence between them, showing the validity of the data that ANNs deduced. All of these results and validations by the ANN model predict the production rate of construction at the peak of COVID-19, which can be expressed as a database or learned lessons for the production rate of the construction sector of the same crisis in the future. Therefore, the proposed model is ready to simulate any construction project at the new administrative capital in Cairo or in the same environment to predict the project’s cost and production rate of construction related to setting some information of it. This information represents the basic characteristics of the project and its normal production rate. This will help the planners to expect the production rate of the project at the planning stage in the same pandemic or similar crisis or to be ready by plan B for any changes or similar problems.
9. Limitations of the Study
The complexity phase of the research is the phase of collecting data because of the different companies which dealt with the new administrative capital in Cairo. Size, privacy, competition, and different style and response of people who called expertise and responded and others affected the analysis phase and pushed the authors did the double effort to achieve the objectives of the research. The study targeted only the firms classified as tier one in Egypt and working in the same zone and environment. Also, the research dealt only with construction works and buildings but didn’t study other civil engineering projects. Finally, as it can inherit the learning capability from past experiences, one can easily predict that the impact of COVID-19 on the production rate of construction will be one of the pillars of enhancement and improvement of the work environment in construction sites and buildings.
10. Conclusions and Recommendations
This paper presents the Impact of COVID-19 on Construction production rates related to the case study in Egypt. The study identified eleven factors that highly impact the construction industry in Egypt at the peak of COVID-19. The first factor with the highest importance is the impact of import and export on the production rate during COVID-19 (E61). The lowest importance is the effect of using information technology with an abbreviation (T34).
The artificial neural network model structure (20-15-12-1) was developed, trained, and tested for the most important factors in predicting production rate. The structure is determined to be composed of one input layer having eleven neurons, three hidden layers composed of twenty, fifteen, and twelve neurons, and one output layer having two neurons. The best results were obtained with the lowest MAPE percentage of 2.4136% and the highest R2 value of 0.9845.
The artificial neural network model structure (20-15-10-1) was developed, trained, and tested for the most important factors to predict the cost of projects. The structure is determined to be composed of one input layer having eleven neurons, three hidden layers consisting of twenty, fifteen, and ten neurons, and one output layer having two neurons. The best results were obtained with the lowest MAPE percentage of 1.3802% and the highest R2 value of 0.97474. All of this information led the research to some main points as conclusions:
- The highest impact factor on the production rate during COVID-19 in this study is the impact of the import and export factor (E61).
- The proposed model by ANN simulates and predicts the production rate of construction with very accurate results.
- The proposed model can be used by planners to prepare plan B or to calculate the project’s cost and production rate of construction in the same pandemic or similar crisis.
- The study shows that the construction industry lacks the knowledge and training to deal with the same crisis.
11. Further Work
The work detailed in this study might be expanded to include the following:
- Improve the proposed model by adding an interface to be more user-friendly, clear, and simple.
- The study must be expanded by collecting data from other countries, the Middle East, Europe, and the United States.
- Replace the Artificial Neural Network (ANN) with Artificial Intelligence (AI) or any other smarter system to make the simulation and prediction of the problem smarter and easier.
Author Contributions
Conceptualization, E.E.; methodology, A.E.; software, D.H.A.; validation, D.H.A.; formal analysis, D.H.A.; investigation, D.H.A.; resources, I.M.M.; data curation, D.H.A.; writing—original draft preparation, D.H.A.; writing—review and editing, D.H.A.; visualization, A.E.; supervision, I.M.M.; project administration, A.E.; funding acquisition, All authors. All authors have read and agreed to the published version of the manuscript.
Funding
This research received no external funding.
Data Availability Statement
Not applicable.
Conflicts of Interest
The authors declare no conflict of interest.
Abbreviations
| ANN | An Artificial Neural Networks |
| PPE | Personal Protective Equipment |
| TFP | Total Factor Productivity |
| GDP | Gross Domestic Product |
| EFCBC | Egyptian Federation for Construction and Building Contractors |
| ROI | Return on investment |
| MAPE | Mean Absolute Percentage Error |
Appendix A
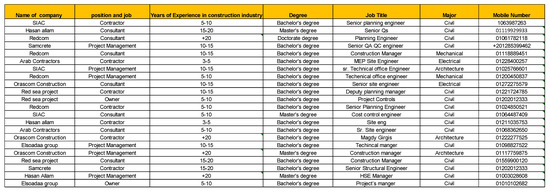
Figure A1.
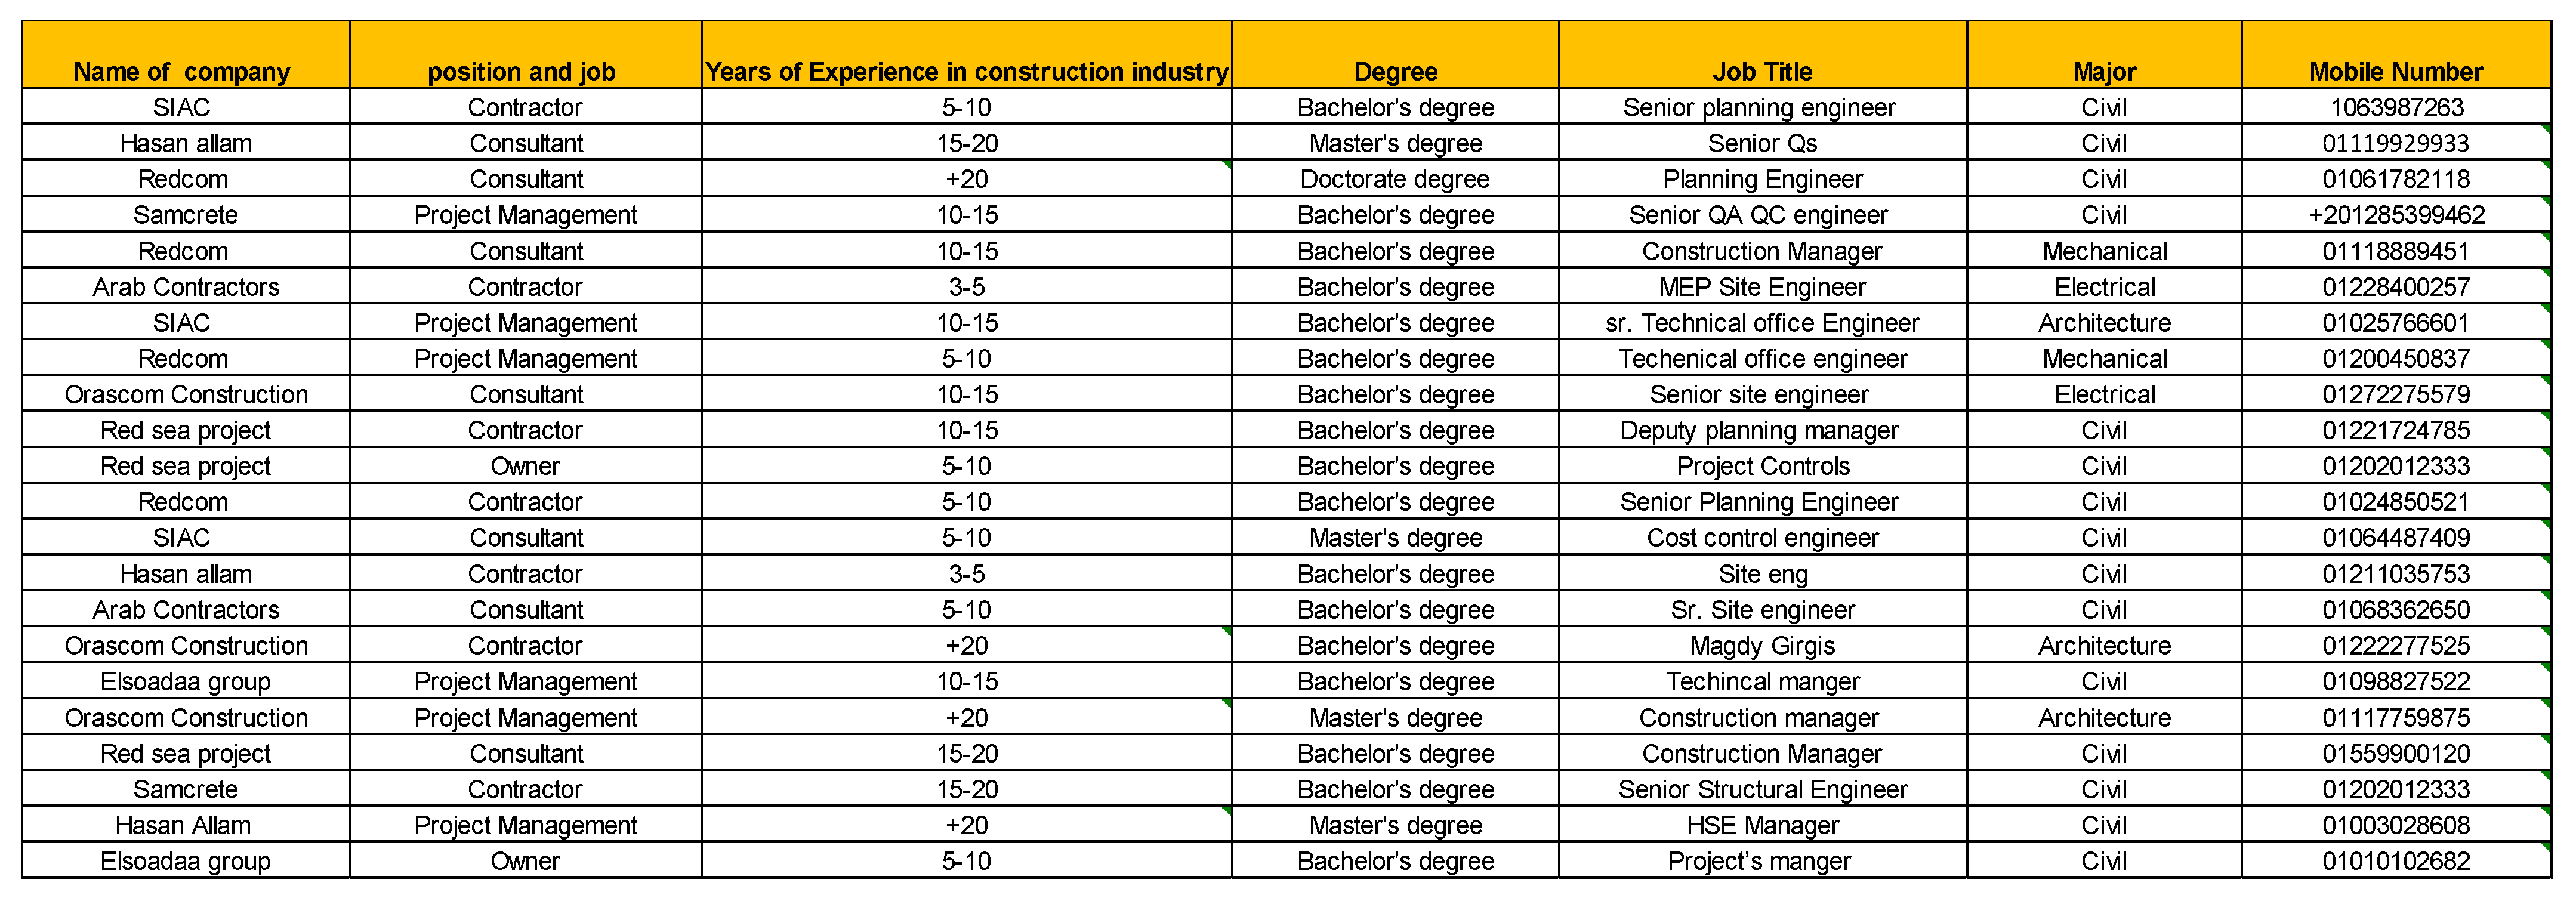
The Institutional Review Board (IRB) number.
Figure A1.
The Institutional Review Board (IRB) number.
References
- Araya, F.; Sierra, L. The influence between COVID-19 impacts and project stakeholders in Chilean construction projects. Sustainability 2021, 13, 82. [Google Scholar] [CrossRef]
- Jain, H.; Bharati, K.; Garg, A.; Das, S. Health Strategies that Could Boost Industrial Productivity in India Amidst the COVID-19 Crisis. J. Clin. Diagn. Res. 2020, 14, 1–5. [Google Scholar] [CrossRef]
- Bsisu, K.A.D. The impact of the COVID-19 pandemic on Jordanian civil engineers and the construction industry. Int. J. Eng. Res. Technol. 2020, 13, 828–830. [Google Scholar] [CrossRef]
- McGovern, J. COVID-19 A Client’s Perspective. Constructing Excellence Performance Measurement Group, June 2020. Available online: https://constructingexcellence.org.uk/productivity-under-covid19-event-output/ (accessed on 12 April 2023).
- MACE. How We Can Return to Pre-COVID-19 Output Levels and Increase Productivity. 2020. Available online: https://www.macegroup.com/-/media/mace-dotcom/files/perspectives/covid-19-reports/200520-navigating-a-new-world---output-and-productivity.pdf (accessed on 12 April 2023).
- Hala Alkhalouf, D.M.J.S. Impacts of COVID-19 on Construction. 2020. Available online: https://drum.lib.umd.edu/bitstream/handle/1903/26768/Alkhalouf_umd_0117N_21345.pdf?sequence=2 (accessed on 12 April 2023).
- Bartik, A.W.; Cullen, Z.B.; Glaeser, E.L.; Stanton, C.T. What Jobs Are Being Done at Home During the Covid-19 Crisis? NBER Working Paper Series. 2020. Available online: http://www.nber.org/papers/w27422.ack (accessed on 12 April 2023).
- Dingel, J.I.; Neiman, B. How many jobs can be done at home? J. Public Econ. 2020, 189, 104235. [Google Scholar] [CrossRef] [PubMed]
- Jallow, H.; Renukappa, S.; Suresh, S. The impact of the COVID-19 outbreak on the United Kingdom infrastructure sector. Smart Sustain. Built Environ. 2020, 10, 581–593. [Google Scholar] [CrossRef]
- Dixit, S.; Sharma, K. An Empirical Study of Major Factors Affecting Productivity of Construction Projects. In Lecture Notes in Civil Engineering; Springer: Singapore, 2020; Volume 61. [Google Scholar] [CrossRef]
- Bloom, N.; Bunn, P.; Mizen, P.; Smietanka, P.; Thwaites, G.; Thwaites, G. Staff Working Paper No. 900. The Impact of COVID-19 on Productivity Staff Working Paper No. 900. 2022, the First of July. Available online: https://www.bankofengland.co.uk/-/media/boe/files/working-paper/2020/the-impact-of-covid-19-on-productivity.pdf (accessed on 12 April 2023).
- Cochran. Some Empirical Evidence on the Outliers and the Non-Normal Distribution of Financial Ratios. J. Bus. Financ. Account. 1963, 14, 483–496. [Google Scholar] [CrossRef]
- Tavakol, M.; Dennick, R. Making sense of Cronbach’s alpha. Int. J. Med. Educ. 2011, 2, 53–55. [Google Scholar] [CrossRef] [PubMed]
- Sambasivan, M.; Soon, Y.W. Causes and effects of delays in the Malaysian construction industry. Int. J. Proj. Manag. 2007, 25, 517–526. [Google Scholar] [CrossRef]
- Agatonovic-Kustrin, S.; Beresford, R. Basic concepts of artificial neural network (ANN) modeling and its application in pharmaceutical research. J. Pharm. Biomed. Anal. 2000, 22, 717–727. [Google Scholar] [CrossRef] [PubMed]
- Nazari, J.; Ersoy, O.K. Implementation of Back-Propagation Neural Networks with MatLab. ECE Technical Reports. Paper 275. 1992. Available online: http://docs.lib.purdue.edu/ecetr/275 (accessed on 12 April 2023).
- Cilimkovic, M. Neural Networks and Back Propagation Algorithm. Inst. Technol. Blanchardstown Blanchardstown Road North Dublin 2015, 15, 3–7. [Google Scholar]
Disclaimer/Publisher’s Note: The statements, opinions and data contained in all publications are solely those of the individual author(s) and contributor(s) and not of MDPI and/or the editor(s). MDPI and/or the editor(s) disclaim responsibility for any injury to people or property resulting from any ideas, methods, instructions or products referred to in the content. |
© 2023 by the authors. Licensee MDPI, Basel, Switzerland. This article is an open access article distributed under the terms and conditions of the Creative Commons Attribution (CC BY) license (https://creativecommons.org/licenses/by/4.0/).

