Article

The Effect of Preload Loss on the Mechanical Properties of Grid Structure Connected with Bolted-Ball Joints

1
College of Civil Engineering, Tongji University, Shanghai 200092, China
2
Shanghai Tobacco Group Co., Ltd., Shanghai 200082, China
*
Authors to whom correspondence should be addressed.
Buildings 2023, 13(5), 1178; https://doi.org/10.3390/buildings13051178
Submission received: 20 February 2023 / Revised: 7 March 2023 / Accepted: 13 March 2023 / Published: 29 April 2023
(This article belongs to the Section Building Structures)

Abstract

:
Bolt-ball joints are widely adopted in grid structures due to their high installation accuracy and short construction period. Since the bolt is inside the joint, it is challenging to evaluate its health status from outside the structure. A finite-element plane-truss structure model, based on the actual grid structure, was constructed to investigate the influence of the rod’s preload on the overall stiffness and bearing capacity of the grid structure. Moreover, a model of the grid structure, with a bolt-ball joint connection, was constructed to analyze the influence of the preload loss in bolted-ball joints on the overall mechanical performance of the local members and structures. The results show that the release of preload on the outer web rod is less effective in terms of the overall stiffness and bearing capacity of the structure than on the inner web rod. The preload of the larger span direction rod plays an important role, and the preload of the upper chord has a greater impact, while the preload of the web rod and the upper chord in the smaller span direction has no significant effect on the normal stress in the surrounding rods.

1. Introduction

Large grid structures are commonly used in large industrial plants, large stadiums, and airport terminal halls due to their small cross-section, which is suitable for use in complex environments [1,2,3]. However, rods and joints experience damage over time and exposure to complex environments [4,5], resulting in the reduction of both the grid structure stiffness and bearing capacity. In addition, bolt-ball joints are widely used in grid structures due to their convenient installation, high installation accuracy and short construction period [2,3,6,7,8]. However, there are some shortcomings in the use of bolt-ball joints, such as false screwing, an insufficient screwing depth for high-strength bolts, and difficulties in detecting damage to internal bolts. Therefore, safe operation and structural damage detection after the completion of the grid structure present higher requirements and greater challenges.
At present, the damage detection of bolt-ball joints in structures mainly includes a visual inspection of cracks [9,10], sampling for bearing capacity detection [11,12], detection of steel pipe openings, and inspection by inserting an endoscope into a nut hole [13]. Piezoelectric sensing technology is widely used in structural detection as one of the nondestructive testing methods [14]. Lucena [15] combined numerical simulation and a time reversal signal as an experimental method to provide a useful tool for damage detection. Andrei [16] proved that the degree of structural damage affects the impedance of the component to a certain extent and that impedance monitoring technology has a better effect in detecting defects. Zhu [17] investigated the influence of the bending stiffness of bolt-ball joints on the ultimate bearing capacity of the grid. Xu [18] introduced several material models that can be used for the numerical modeling of damage evaluation.
The installation of bolt nodes in grid structures cannot be observed while the internal bolts are tightened. Therefore, there are many accidents with potential safety hazards, caused by the insufficient preload of high-strength bolts either during the construction stage or later service stage. Insufficient preload will lead to the collapse of the grid structure and thus causes a serious safety impact [19]. Sheikh [20] studied the influence of the bending stiffness of the bolt-ball joints on the ultimate bearing capacity of the grid. Wang [21] found that the ultimate load of the structure decreases with the decrease in the joint stiffness, and the bending stiffness shows a more pronounced effect than the torsional stiffness. Gomes [22] conducted failure tests on bolted joints with different preloads, showing that the increase in preload can increase the failure load and slip load of joints.
The existing literature shows that the stiffness of the joint has a specific impact on the overall bearing capacity of the structure. Therefore, it is necessary to study the effect of the bolt preload on the service performance of bolted joints. In this paper, the influence of insufficient preload on the mechanical performance of joints is studied, and the influence of varying preloads for single and multiple joints on the stiffness and bearing capacity of the whole structure is further explored. The influence of preload reduction on the whole grid structure and the surrounding rods was inferred from this. Finally, the effect of relaxing a small amount of bolt preload on the normal stress of the surrounding local bolt was studied.
The novelty of the study lies in identifying the critical role of preload on the web rods of plane-truss structures with a bolt-ball joint in the bending performance. The study also highlighted that in the actual grid structure with a bolt-ball joint connection, in addition to paying attention to the preload of the upper and lower chord rods in the direction of the large spans, it is equally important to closely monitor the preload of the lower chord rods in the direction of small spans. The preload in the web rods and the lower chord rods in the direction of small spans has little effect on the normal stress of the surrounding rods.
The study applied simplified modeling methods to analyze the effects of releasing the preload of a bolt-ball joint connection on the overall structure’s mechanical properties, which can guide practical engineering applications.

2. The Numerical Simulation of the Plane Grid with a Bolt-Ball Joint Connection

2.1. The Modeling of Plane Truss

The study uses the finite element analysis software Abaqus to construct the models. According to GB/T 16939-2016 [23], the M27 bolt is selected and is screwed into the bolt ball to a depth of 30 mm; the outer diameter of the sleeve is 45 mm, the inner diameter is 27 mm, and the depth is 40 mm. The wall thickness of the cone is 5 mm, and the width is 20 mm. The diameter of the bolt ball is 150 mm. The length of the upper and lower chord rods is 500 mm, and the length of the web rods is 865 mm. The inner radius of the steel tubes is 34 mm. The outer radius is 38 mm. The thickness is 4 mm. The density is 7850 kg/m3. The elastic modulus is 21 GPa. The Poisson ratio is 0.32. All the elements in the model use the Q345 steel bilinear model.
The plane truss is 3.5 m long and 1 m high, as shown in Figure 1. The bottom of both the left and right bolt-ball is constrained to six degrees of freedom. The load is applied on the upper chord rod g-joint in a concentrated manner, and the preloads of the symmetrical bolts are randomly released. The health preload is 400 kN.

2.2. The Preload Setting

The rough surface under varying levels of preload is simulated by establishing different numbers of grids. Before establishing the contact relationship, the different components are divided into networks, and the surface sets are generated by selecting different grids on the surface of the bolt ball and the surface of the sealing plate. The two generated surfaces of the bolt ball and the sealing plate are contacted to form a global random-void interface to simulate the effect of the rough surface. When defining the surface set, the grid is randomly selected to establish a contact surface that satisfies a specific random hole defect.
As the rod and the sealing plate are connected by welds in practical application, the rod is bound to the contact surface of the sealing plate during modeling. The friction shear stress is linearly proportional to the contact pressure. The friction coefficient of the contact surface is 0.05, and 0.3 at the thread [24]. The upper part of the bolt ball adopts a consolidated boundary. The mesh adopts the C3D8R element and has a size of 0.002 m and the contact surface between the bolt-ball-sleeve and sleeve-sealing plate adopts a 0.001 m refinement mesh. Threads of bolts and bolt balls are also densified with the 0.001 m mesh.
The relationship between the preload and contact area is shown in Table 1. The eight preload conditions are 2.5 kN, 5 kN, 7.5 kN, 10 kN, 12.5 kN, 15 kN, 17.5 kN and 20 kN. The table indicates that with an increase in bolt preload, the contact area between the surface of the bolt-ball-sleeve and the surface of the sleeve-sealing plate increases. The contact area has significant initial growth, then slowly tends to be stable, and finally stabilizes at about 330 mm2.

2.3. Discussion of Results

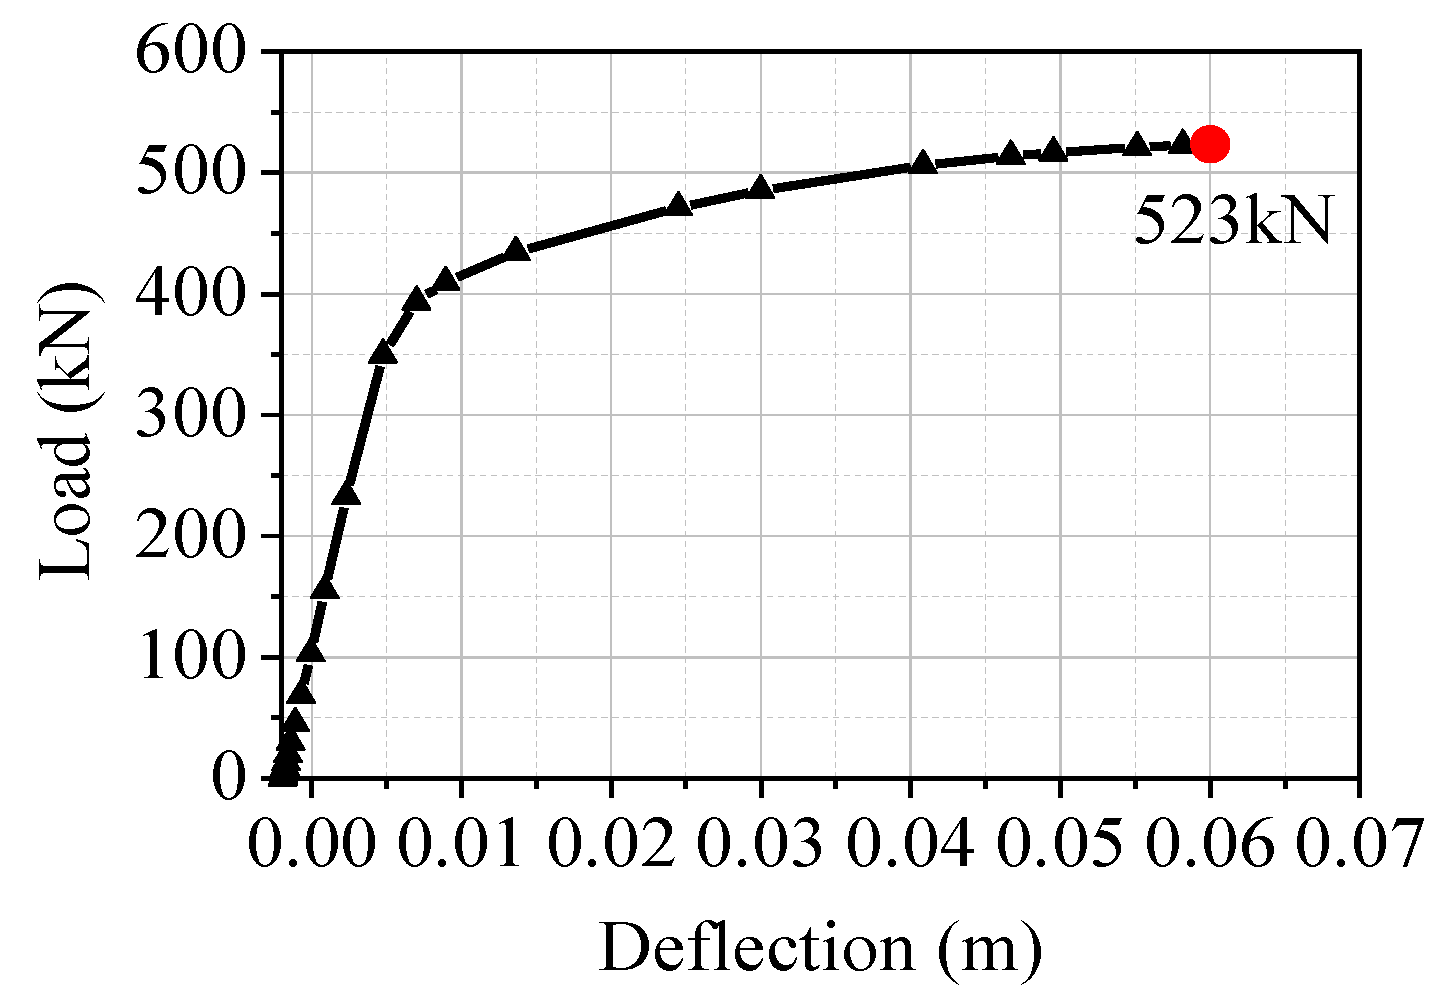
When all bolts are in a healthy preload state, the load-deflection curve of the structure is shown in Figure 2. The deflection is linear with the load before the load reaches 350 kN. After 350 kN, the stiffness becomes smaller, and the load increases slightly, but the deflection increases sharply.
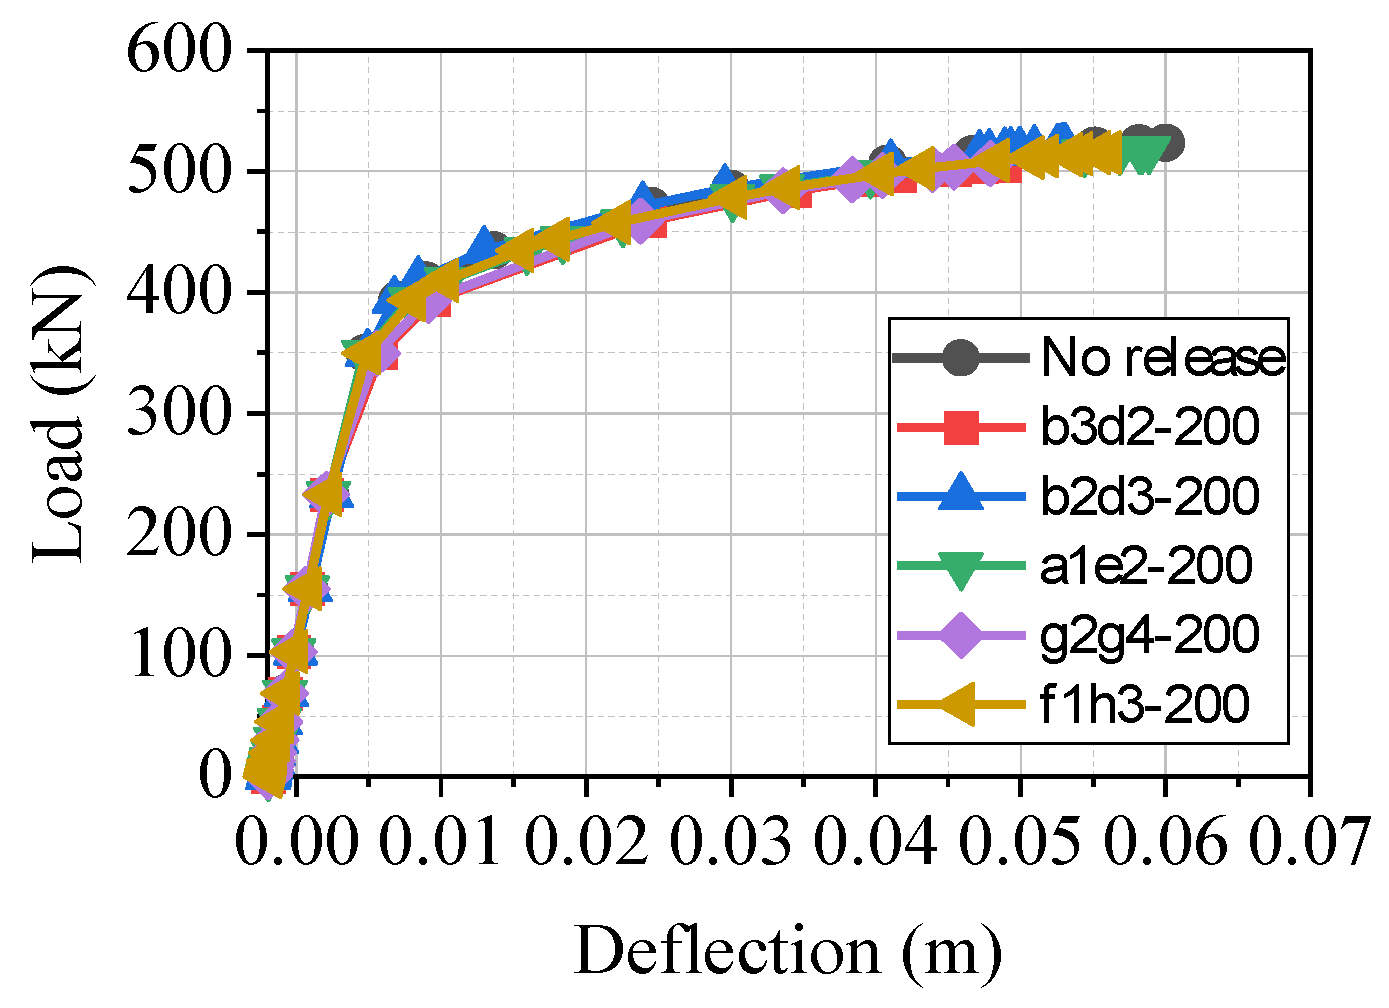
The load-deflection curve in Figure 3 illustrates the effects of releasing the preload of the bolts to 200 kN at any end on upper and lower chord rods. In the legend, “a2e1-200” indicates that the preload of the symmetrical bolts of a2 and e1 is released to 200 kN, and other labels follow the same convention.
The results show that releasing the upper and lower chord rods has a negligible influence on the stiffness and bearing capacity of the structure, except that releasing the c chord rod changes the initial deflection of the structure.
The deflection-load relationship when the web rod is released and not released is shown in Figure 4. The curves of releasing the preload of the symmetrical bolts b3&d2, g2&g4, a1&e2, and f1&h3 correspond one by one because they are the two ends of the same rod. The results show that releasing either end of a rod in a plane truss has little effect on the whole structure. The release of the outer web rod results in a decrease in both the stiffness and bearing capacity of the whole structure, while the release of the inner web rod is more effective. In a small range of rotation, the magnitude of the preload has a significant effect on the stiffness of the bolt-ball joint and the bearing capacity. The upper chord rod is mainly compressed and the lower chord rod is subjected to tension, while the middle oblique web rod bears the bending load.
To investigate the influence of an inclined web rod on the structural performance, the rods at both ends of the symmetrically inclined web rod are selected. They are tested with different levels of preloads, including no release, releasing to 300 kN, releasing to 200 kN, and releasing to 100 kN, as shown in Figure 5, for comparison. The results show that the release of the preload of the outer web rod is less effective on the overall stiffness and bearing capacity of the structure compared to that of the inner web rod. This is because the inner web rod is near the maximum deflection and maximum bending moment of the structure. Moreover, the support is a semi-rigid support (only the lower hemi-ball part is connected), and the rotation angle of the outer lower chord joint screw is greater than that of the inner joint screw.
The results and conclusions for the numerical simulation of the plane grid with a bolt-ball joint connection are shown in Table 2.

3. Numerical Simulation of a Grid with Bolt-Ball Joint Connection

3.1. Modeling of the Grid Structure

The finite element analysis software Abaqus is used for the modeling of the grid structure. The dimensions of the grid are approximately 108 m lateral and 48 m longitudinal. Preliminary simulation results indicated that the node with the largest deflection was located in the center of the grid, and the bearing web rod was under great stress. Therefore, a preload analysis is carried out for the five spans at the center of the whole grid and the section size of the web rod at the support is enlarged to enhance structural resistance.
The model of the grid structure is shown in Figure 6. In order to study the influence of an insufficient preload of bolted joints on the mechanical performance of the whole grid structure and the normal stress of the local members, the middle part of the grid model is simplified. A simplified model can greatly shorten the calculation time. All grids are replaced by three-dimensional line components, except the five inverted quadrangular pyramid grids in the transverse and longitudinal spans. Spherical joints were set at the middle support, and all elements are merged into a single entity.
The inverted quadrangular pyramid model in the middle span is shown in Figure 7. The diameters of upper and lower chord longitudinal rods are 114 mm, and 88.5 mm, and the wall thickness is 4 mm for all. The diameters of the transverse rods are all 180 mm, and the wall thickness is 10 mm. The diameters of the lower and upper chord rods are 220 mm and 200 mm, respectively.
All the elements in the model use the bilinear model. The upper and lower chord rods, cone heads, and sleeves use Q235 materials, and the web rods use Q345 materials. For material Q235, the yield strength is 235 MPa, the ultimate strength is 370 MPa, and the plastic strain is 0.06. For material Q345, the yield strength is 345 MPa, the ultimate strength is 470 MPa, and the plastic strain is 0.06. The bolt ball uses 45# steel. The yield strength of the bolt ball is 365 MPa and the ultimate strength is 660 MPa. The bolt uses 40Cr steel. The yield strength of the bolt is 430 MPa and the ultimate strength is 950 MPa. The elastic modulus is 207 GPa. The Poisson’s ratio is 0.3.
The first three analysis steps are used to apply the preload, and the last one is used to apply the load to the grid. According to JB/T 6040-2011 [25], 250 kN preload is required to tighten M22 grade bolts and M30 grade bolts need 400 kN, while M56 grade bolts need 1500 kN. The B31 element is selected for the beam element of the grid part, the C3D4 element for the bolt-ball element, and the C3D8R element for the remaining elements.
The XYZ displacement and rotation of all column nodes except for the inverted quadrangular pyramid are constrained, and the column layout is shown in Figure 6. A spherical node is created at the lower chord node of the middle span column and its six degrees of freedom on the lower surface are constrained.

3.2. Load Adding

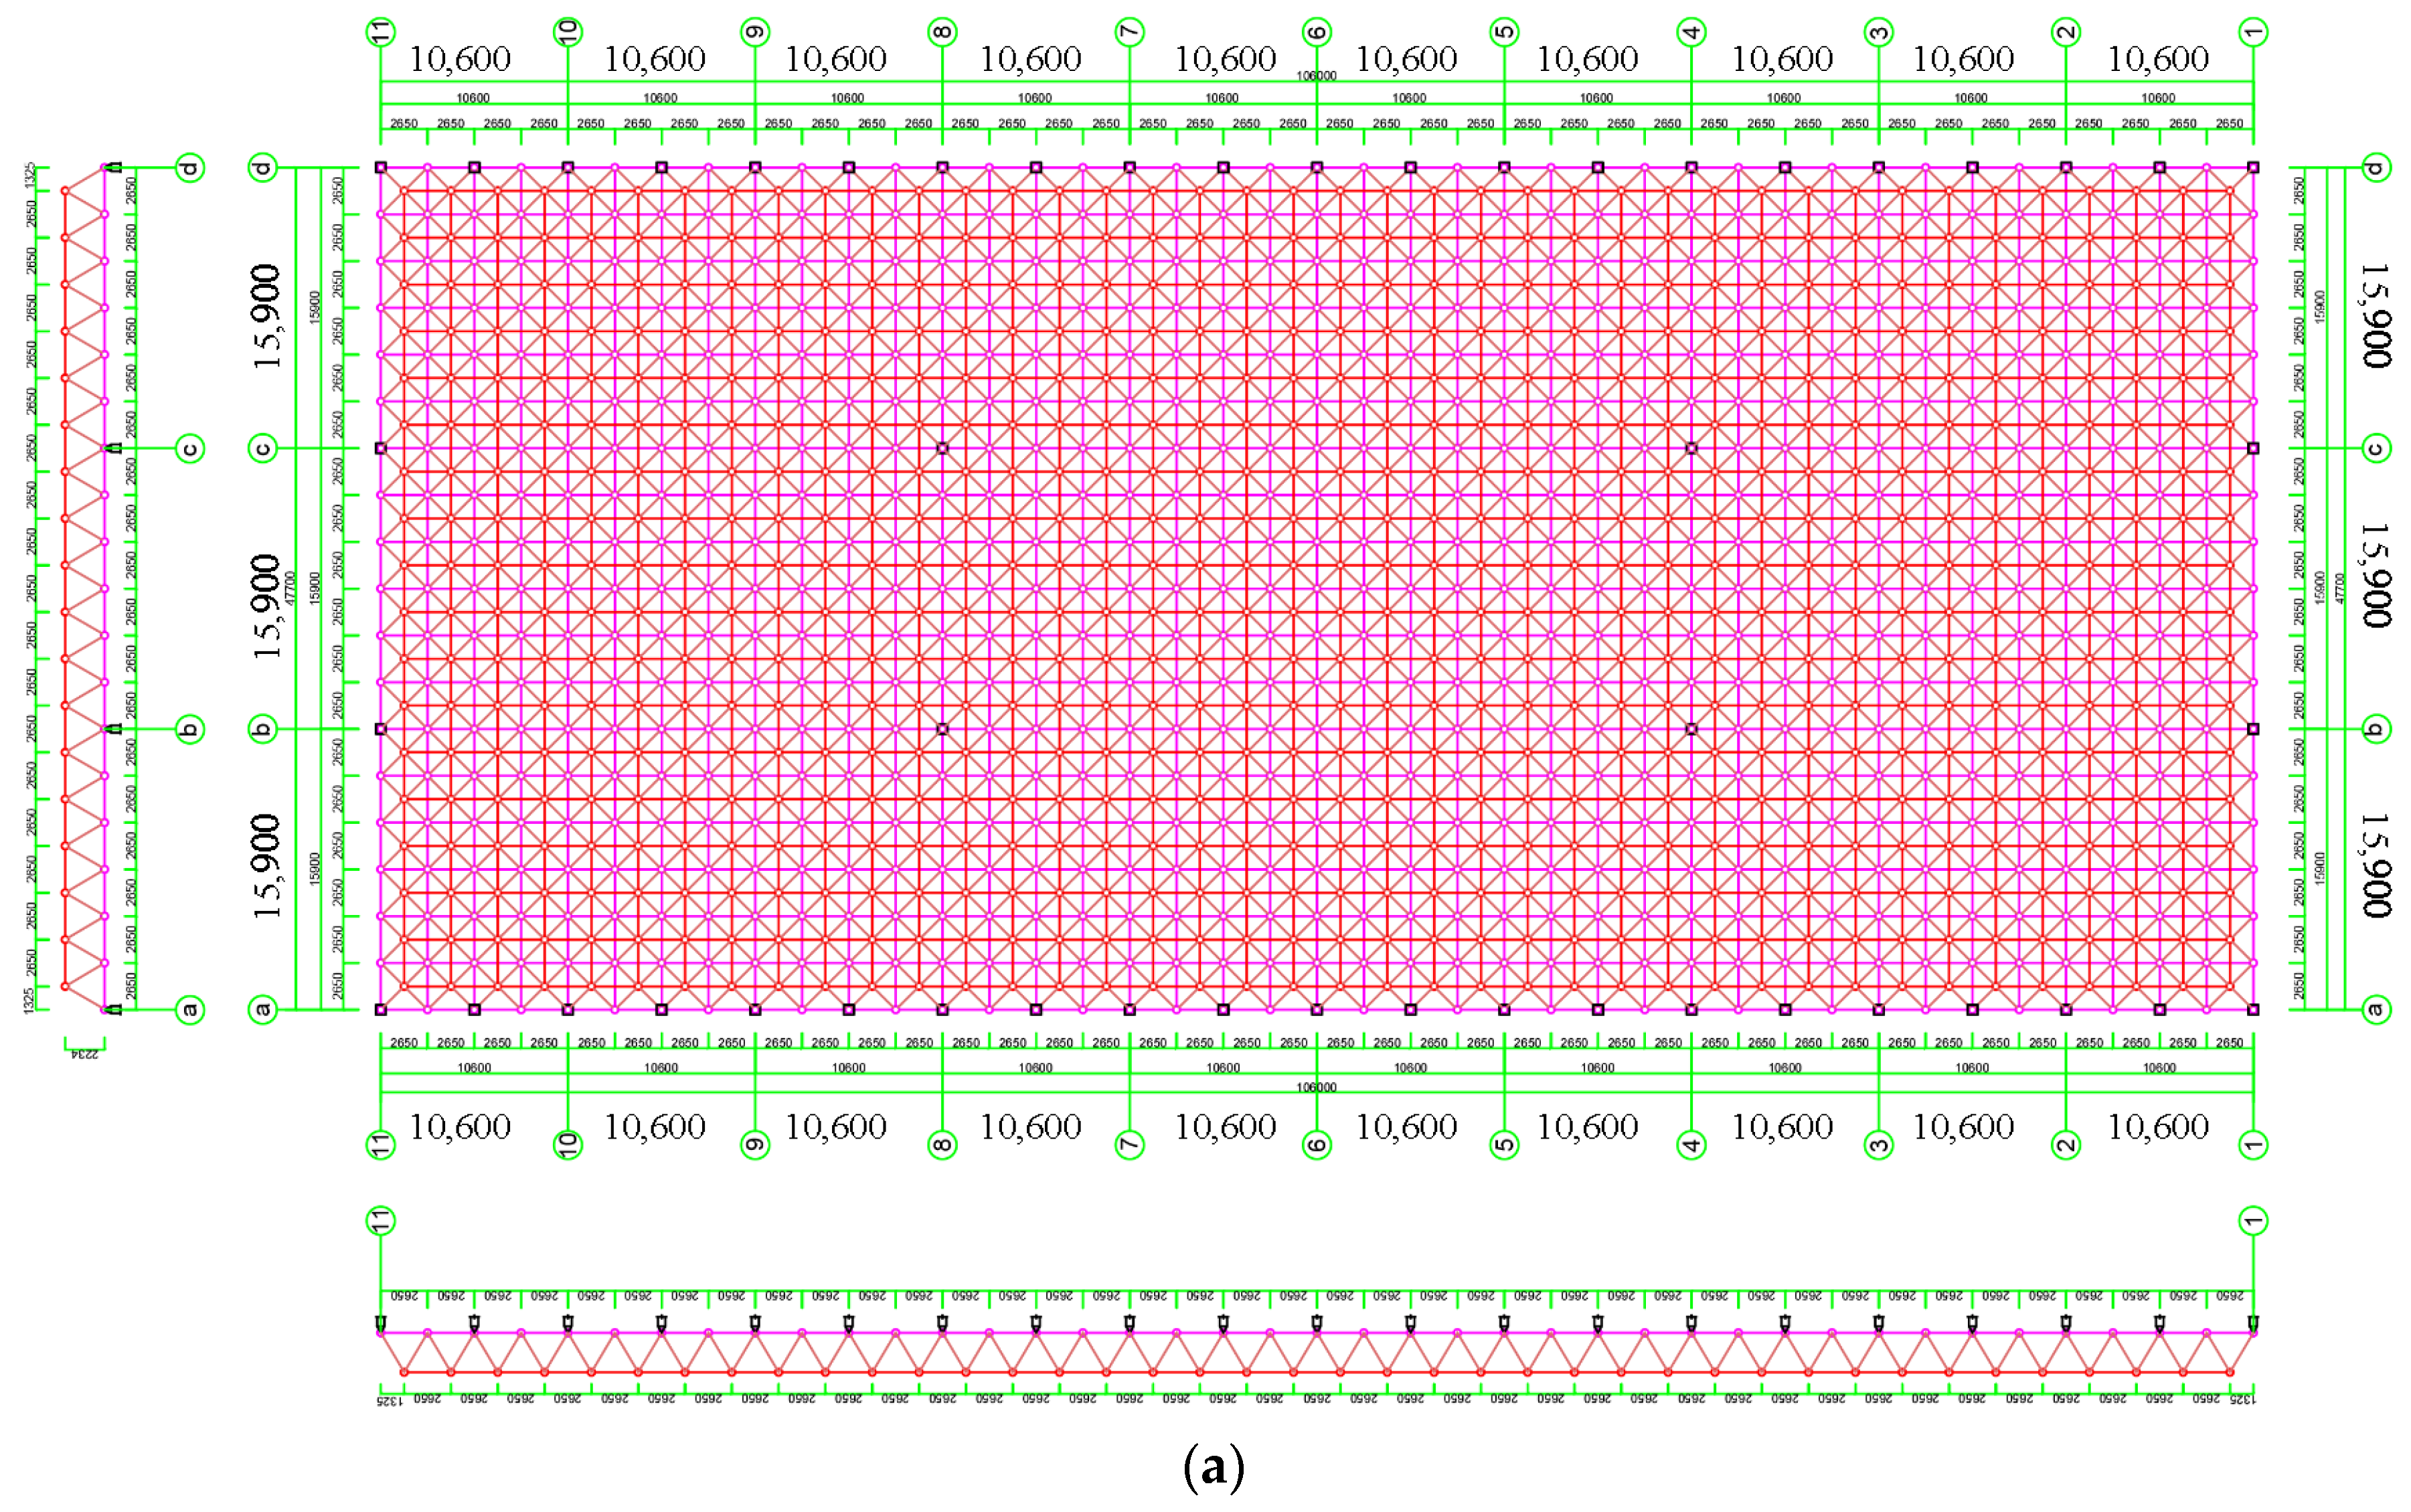
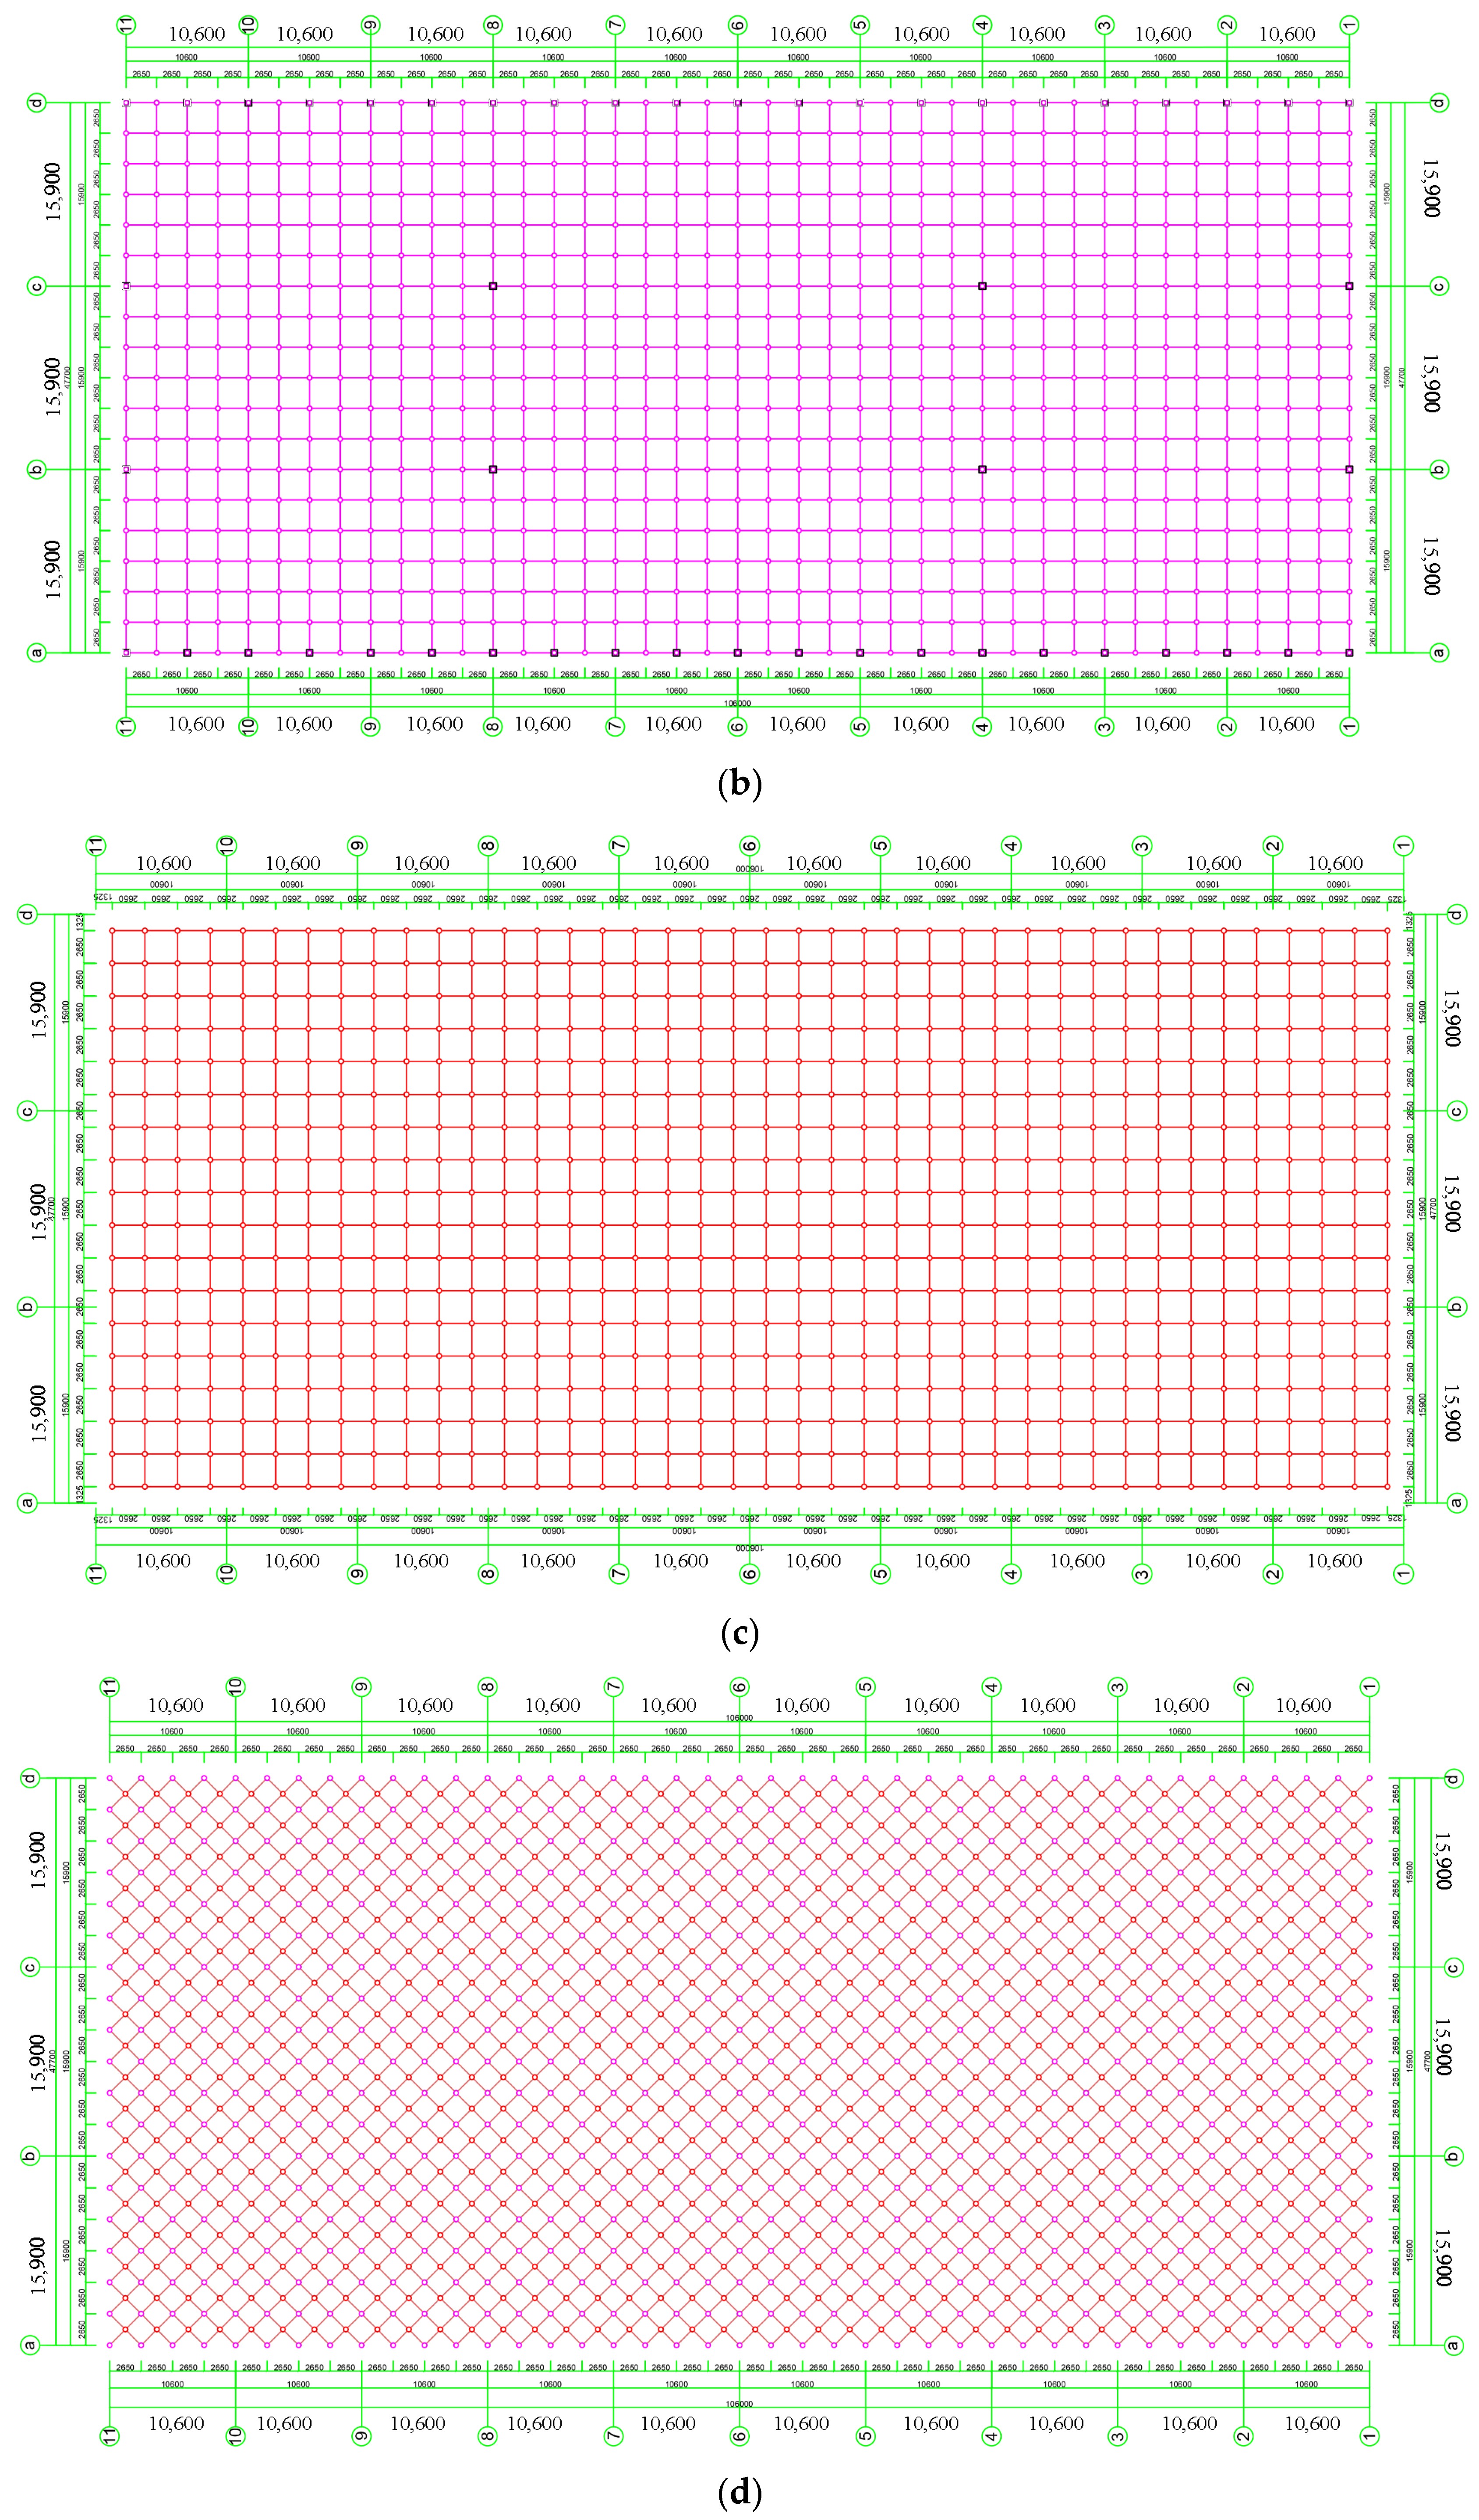
All the loads are applied to the corresponding bolt-ball joint in the form of concentrated forces when loading. The grid layout is shown in Figure 8. The model has a total length of 106,000 mm and a total width of 47,700 mm. The rods have a length of 2,650 mm. The structural upper chord is subjected to a roof-dead load of 0.3 kN/m2 and a roof-live load of 0.5 kN/m2, while the structural lower chord is subjected to a hanging dead load of 0.5 kN/m2 and a hanging live load of 1.5 kN/m2. According to the combination controlled by the variable load effect, the partial factor of the permanent load is 1.2, and the variable load partial factor generally sets to 1.4. In cases where the standard value is greater than 4 kN/m2, the live load partial factor should be 1.3.

3.3. Discussion of Results

According to GB 50017-2017 [26], when a large span space grid is used as a roof, the calculation formula of maximum allowable deflection [f] is as follows:
[ f ] = L 250
where L is the short span of the grid.
The maximum allowable deflection of the grid is 190.8 mm. The simulation results show that when the maximum deflection of the grid reaches 190.8 mm, the allowable bearing capacity of the grid is 20.66 kN. Per GB 50017-2017 [26], the design value of tensile, compressive, and bending strength for Q235 steel, with a thickness of less than 16 mm, is 215 MPa. The design value of tensile, compressive, and bending strength for Q345 steel, with a thickness of less than 16 mm, is 305 MPa.
The maximum normal stress of the lower chord rod under actual working conditions in all health conditions are CF (74.73 MPa), FI (74.89 MPa), LF (29.65 MPa), and FO (30.07 MPa). The normal stress of the upper chord and web rods are shown in Table 3 and Table 4, respectively.
To better determine the law of the force variation, the relationship between the center deflection and the load variation of the grid is further studied. The load-deflection curve of the joint in the lower chord at the maximum deflection of the grid during the first load analysis step is shown in Figure 9a, which is typically linear. Figure 9b is the upper chord load-deflection curve at the location where the deflection is the highest, where umax refers to the deflection at the location, which is 0.055. The upper and lower chords in the middle region enter the elastic-plastic stage with the increase in load, and the slope of the curve begins to decrease. When the upper chord joint load reaches 10 kN, the structure starts to experience an elastic-plastic change, and the mid-point deflection increases rapidly.
When the second load analysis step reached 6.88 kN, the rods around the web rod of the mid-span support entered the yield stage, as shown in Figure 10a. The yield rod continued to spread from the mid-span support to the surrounding area after the rod near the web rod had entered the yield stage. When the upper chord load reached 20 kN, the central upper chord rod also began to yield, and the yielding upper chord rod continued to spread around with the increase of the upper chord load. According to the structural stress cloud diagram, it can be concluded that the load-deflection curve was more gentle because more rods began to yield, resulting in the overall structure entering the elastic-plastic stage. Due to the increase in the section size and material properties of the web rod at the support, the upper chord rod near the web rod first reached ultimate strength at the end of the second analysis step, as shown in Figure 10b. The results show that the web rod at the support is the most unfavorable place for the grid.
To investigate the influence of the bolt preload of different rods on the overall structural stiffness, all upper-chord transverse and vertical rods, web rods, and lower-chord transverse and vertical rods are released, respectively. The results show that no matter how much the preload was reduced, the release of the bar made the stiffness of the overall structure change very slightly. For example, when the upper chord load was 40 kN, the deflection after release only increased in the millimeter range. Therefore, the preload release of the inverted quadrangular pyramid has no significant effect on the stiffness of the whole structure.
There are two main reasons why the loss of preload does not affect the whole grid. First, the bending moment of the inverted quadrangular pyramid in the middle five spans is low, which does not highlight the improvement of the bending stiffness by the preload. Second, for the whole grid, releasing the preload of only a few members has a minimal impact on the whole structure. Therefore, it is necessary to study the influence of relaxing a small number of bolt rods on the normal stress of the surrounding local rods.

3.4. The Analysis of the Local Rod Simulation Results

The bolt in the inverted pyramid in the middle of the grid structure is set with a preload loss. When the upper chord load is 40 kN, the variation of normal stress in the surrounding local members is observed, and the relationship between the relaxation degree and the variation of normal stress is inferred. d3 from the upper chord rod was selected for the different degrees of preload loss. The relationship between the maximum normal stress of the surrounding rod and the preload is shown in Table 5, Table 6 and Table 7. The percentages in the tables represent the comparison of the normal stress when the preload is released, to the normal stress when it is not released.
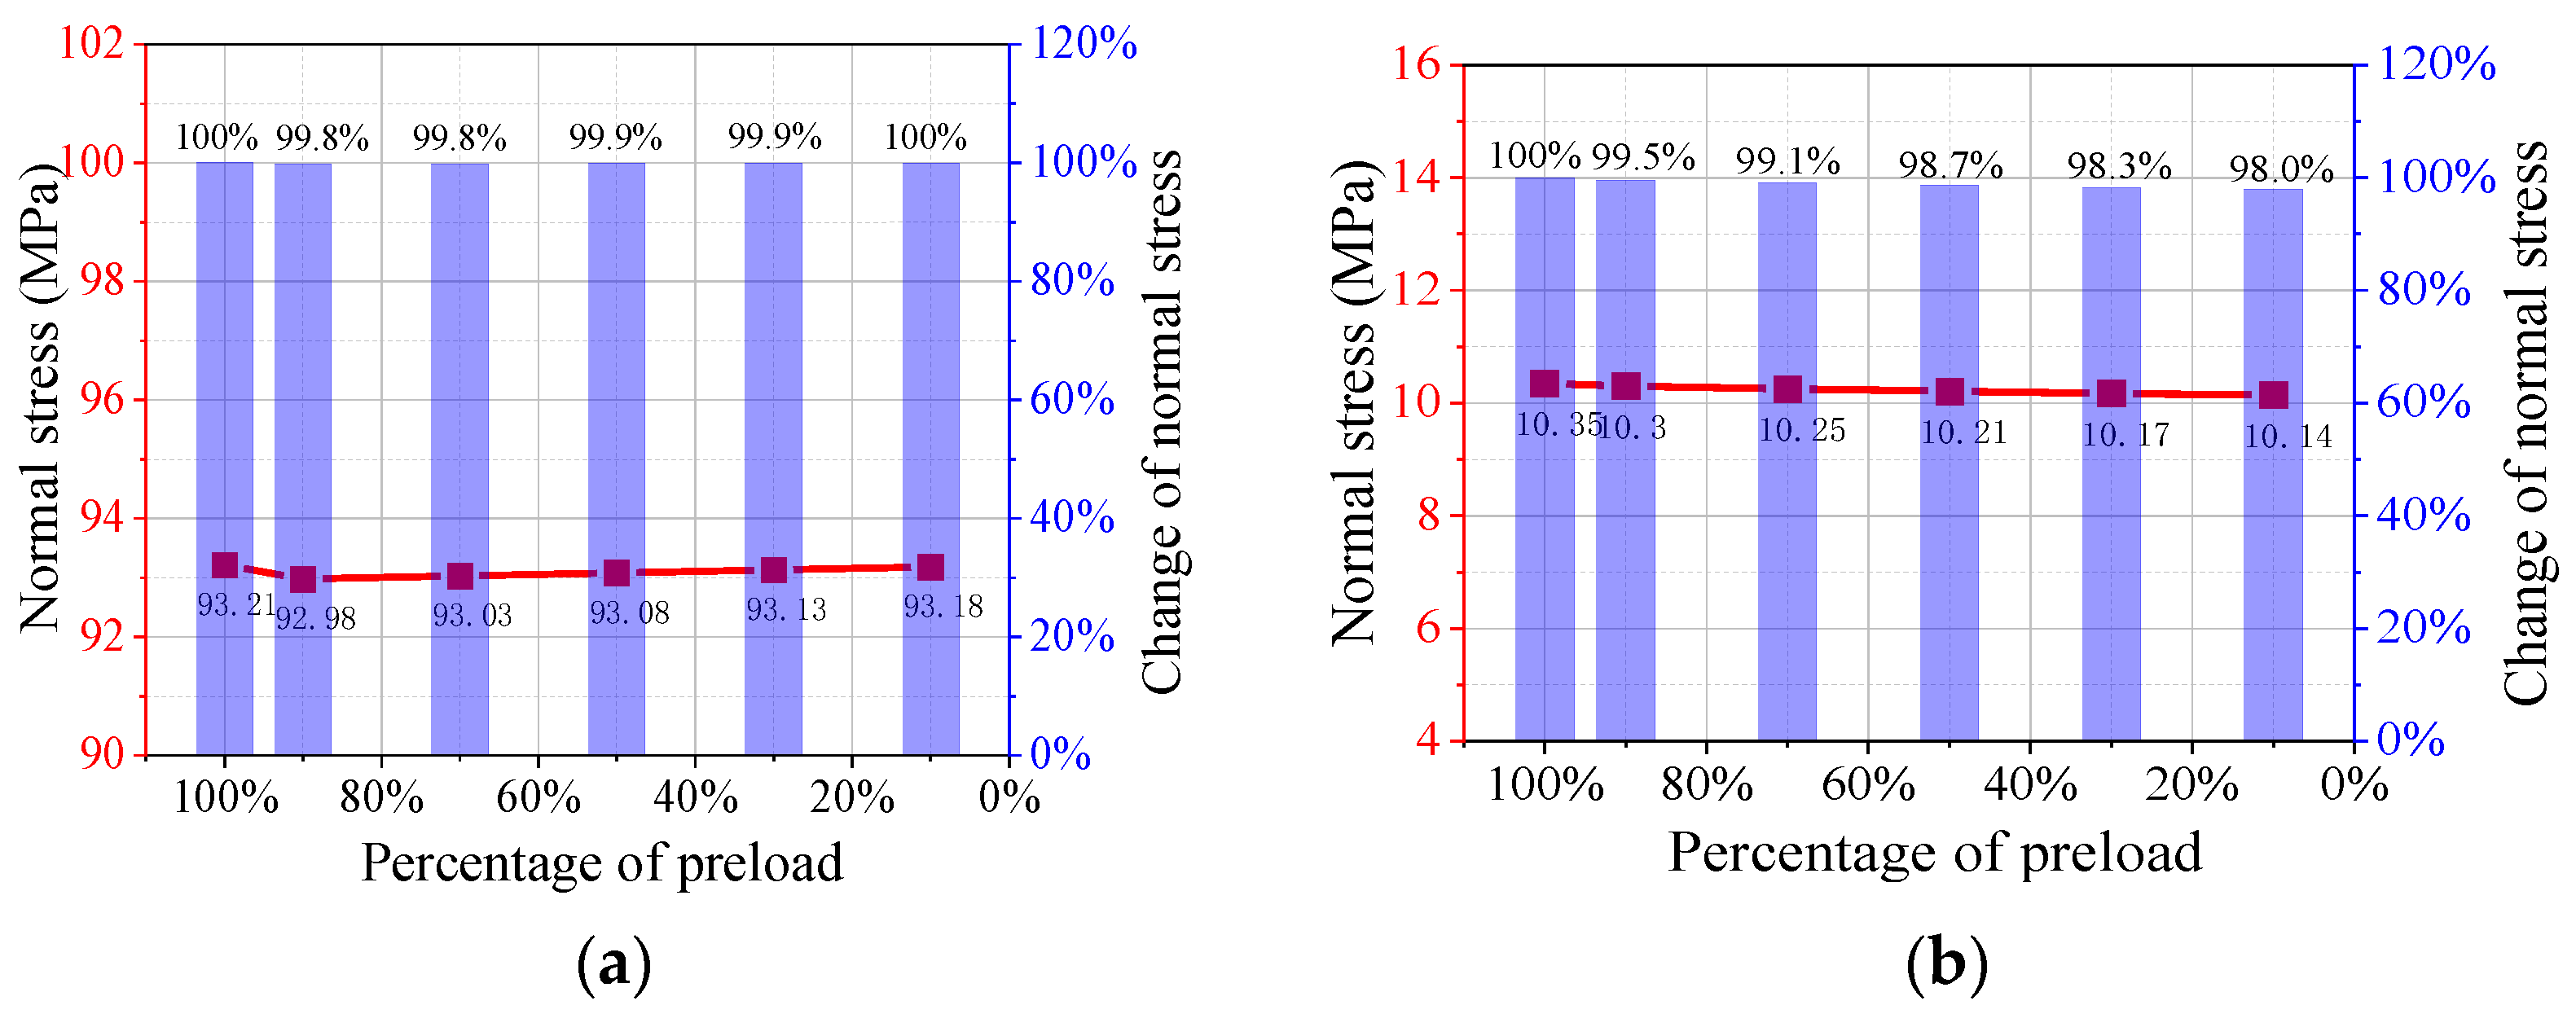
The rods with large changes were selected for analysis, as shown in Figure 11. The results show that the normal stress of upper chord rods (AD, DG, and GJ) in the same length direction can be increased obviously, by releasing the upper chord rod in the length direction. However, the normal stress of the upper chord in other length directions decreases, and the normal stress of the upper chord in the relaxation length direction increases gradually with the increase in the release degree.
Releasing the upper chord node also has a significant effect on the lower chord rod in the width direction. The normal stress of the LF rod in the width direction of the lower chord near the relaxation joint decreases obviously with the decrease in preload, while the normal stress of the rod in the width direction of the lower chord away from the relaxation joint increases slightly. The normal stress changes greatly for part of the web rods (FD, LM, LN, FE, and FH), and the trend is initially fast and then stable.
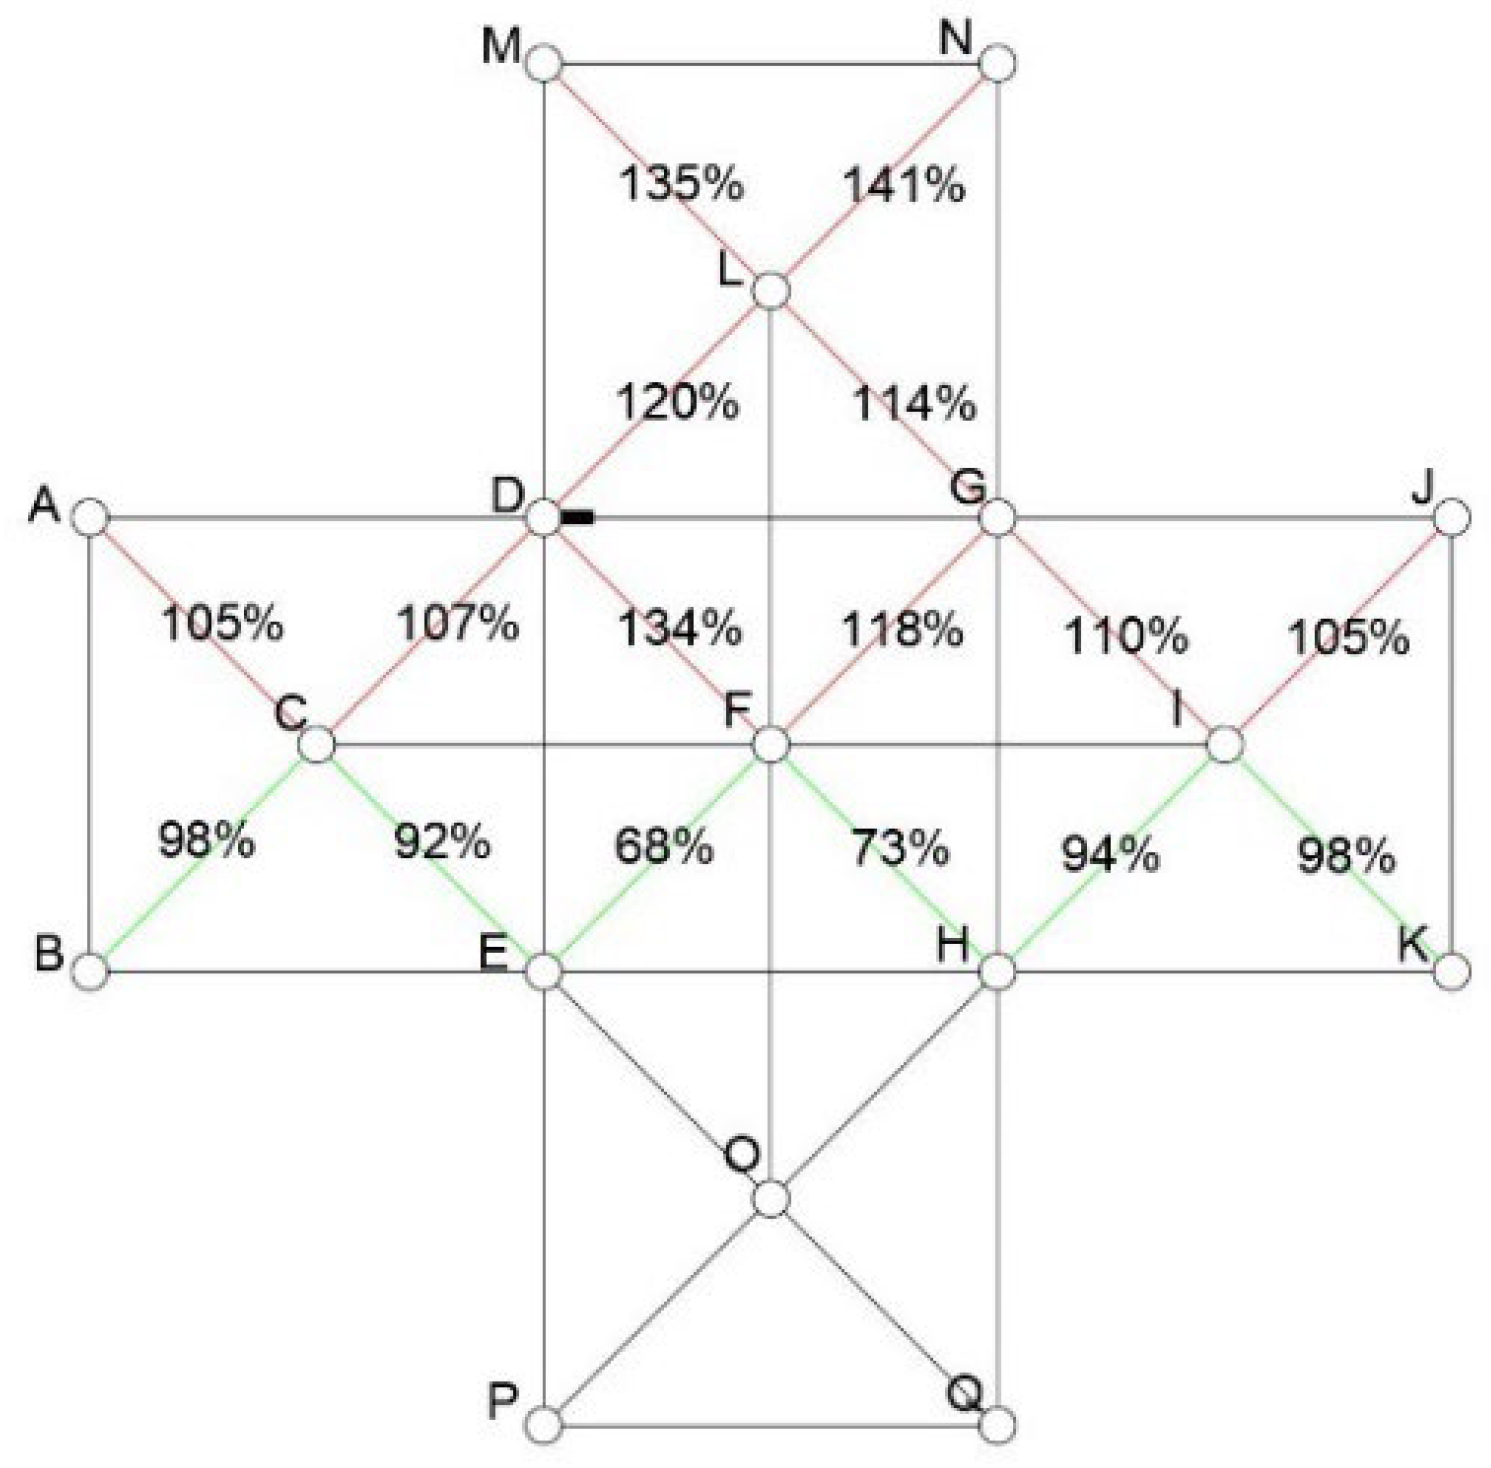
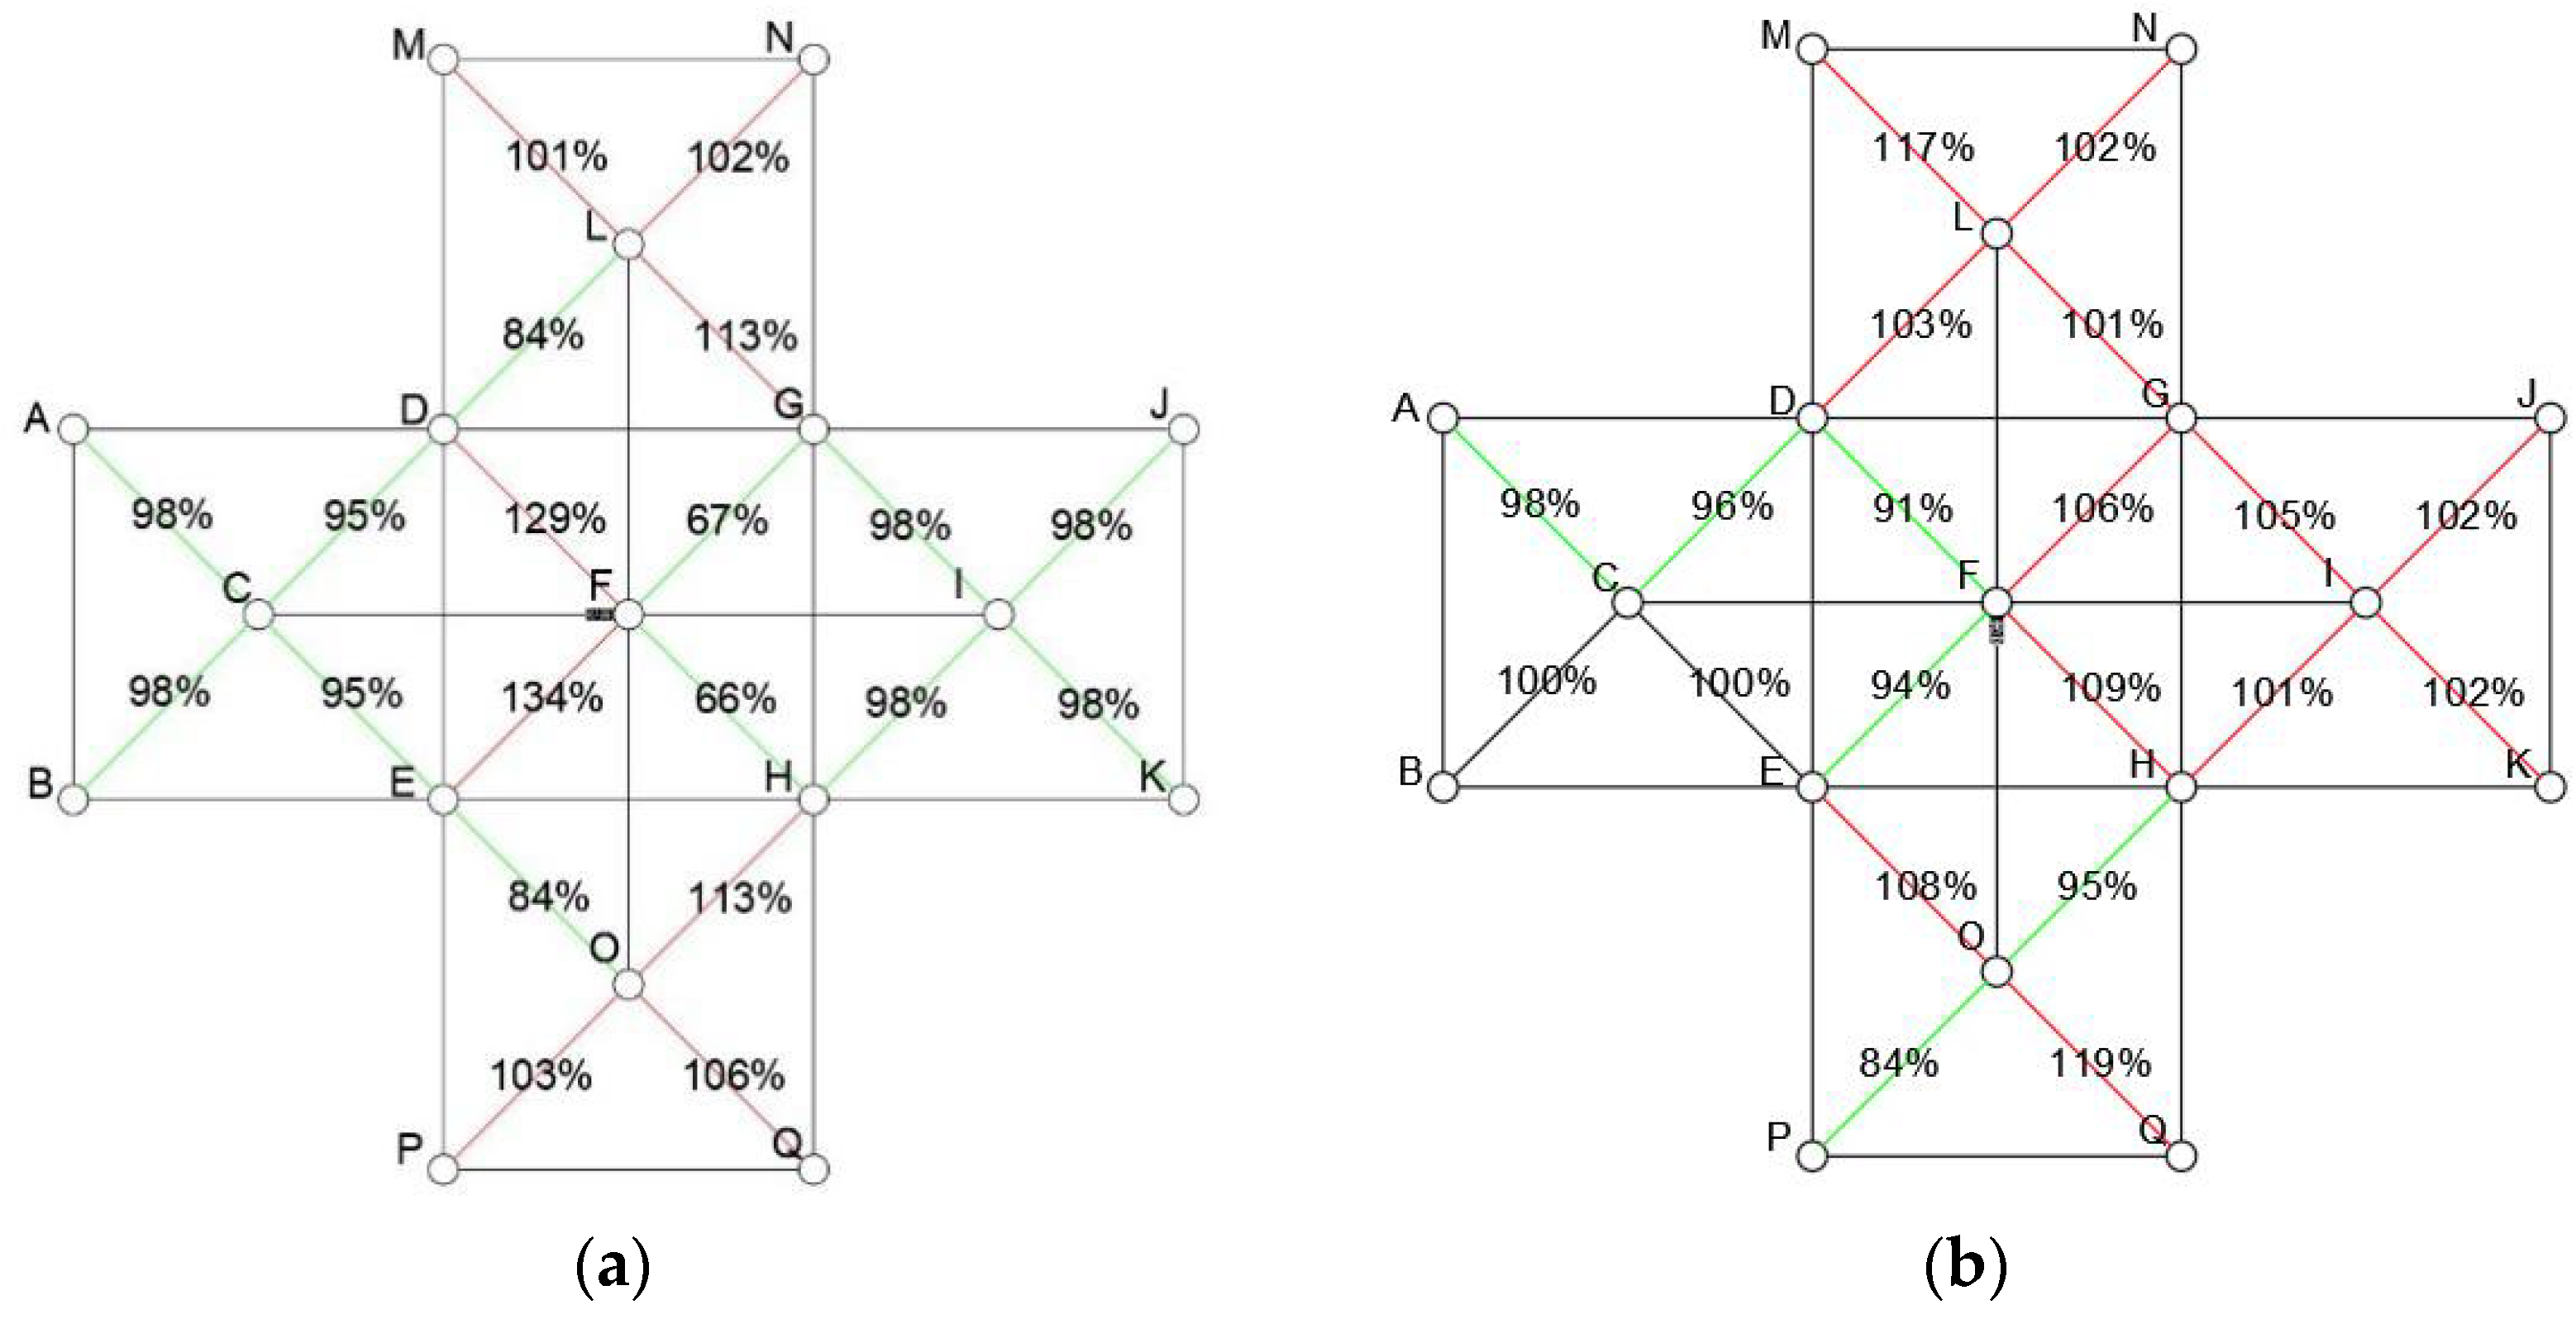
Figure 12 shows the variation in the normal stress of the web rod when the preload is 10% (red indicates that the normal stress increases and green indicates that the normal stress decreases). The results show that the normal stress of the upper part of the abdominal rod increases and the lower part decreases after the release of d3. The amplitude of the increase (decrease) of the normal stress decreases with the increase in the release rod distance.
The D joint sets the preload loss of the bolted joint in the width direction. As can be seen from Figure 13, the effect on the normal stress of other members is negligible. However, in the length direction, the influence of the rod preload on the normal stress of the local rod is significant. It can be speculated that the preload loss of the upper chord rods in multiple length directions in the whole structure will affect its overall stiffness and bearing capacity.
If the percentage of preload is 90–100%, web rods LM, LN, and FD will reach the yield stress first. The rods FG and LD will enter the yield stage when the percentage of preload is 70–90%. Moreover, rod LG will reach yield strength when the percentage of preload is less than 70%. The rod that reaches the yield stage should be replaced in time, and the node that releases the preload should be screwed to the preload in a healthy state after the end of the step.
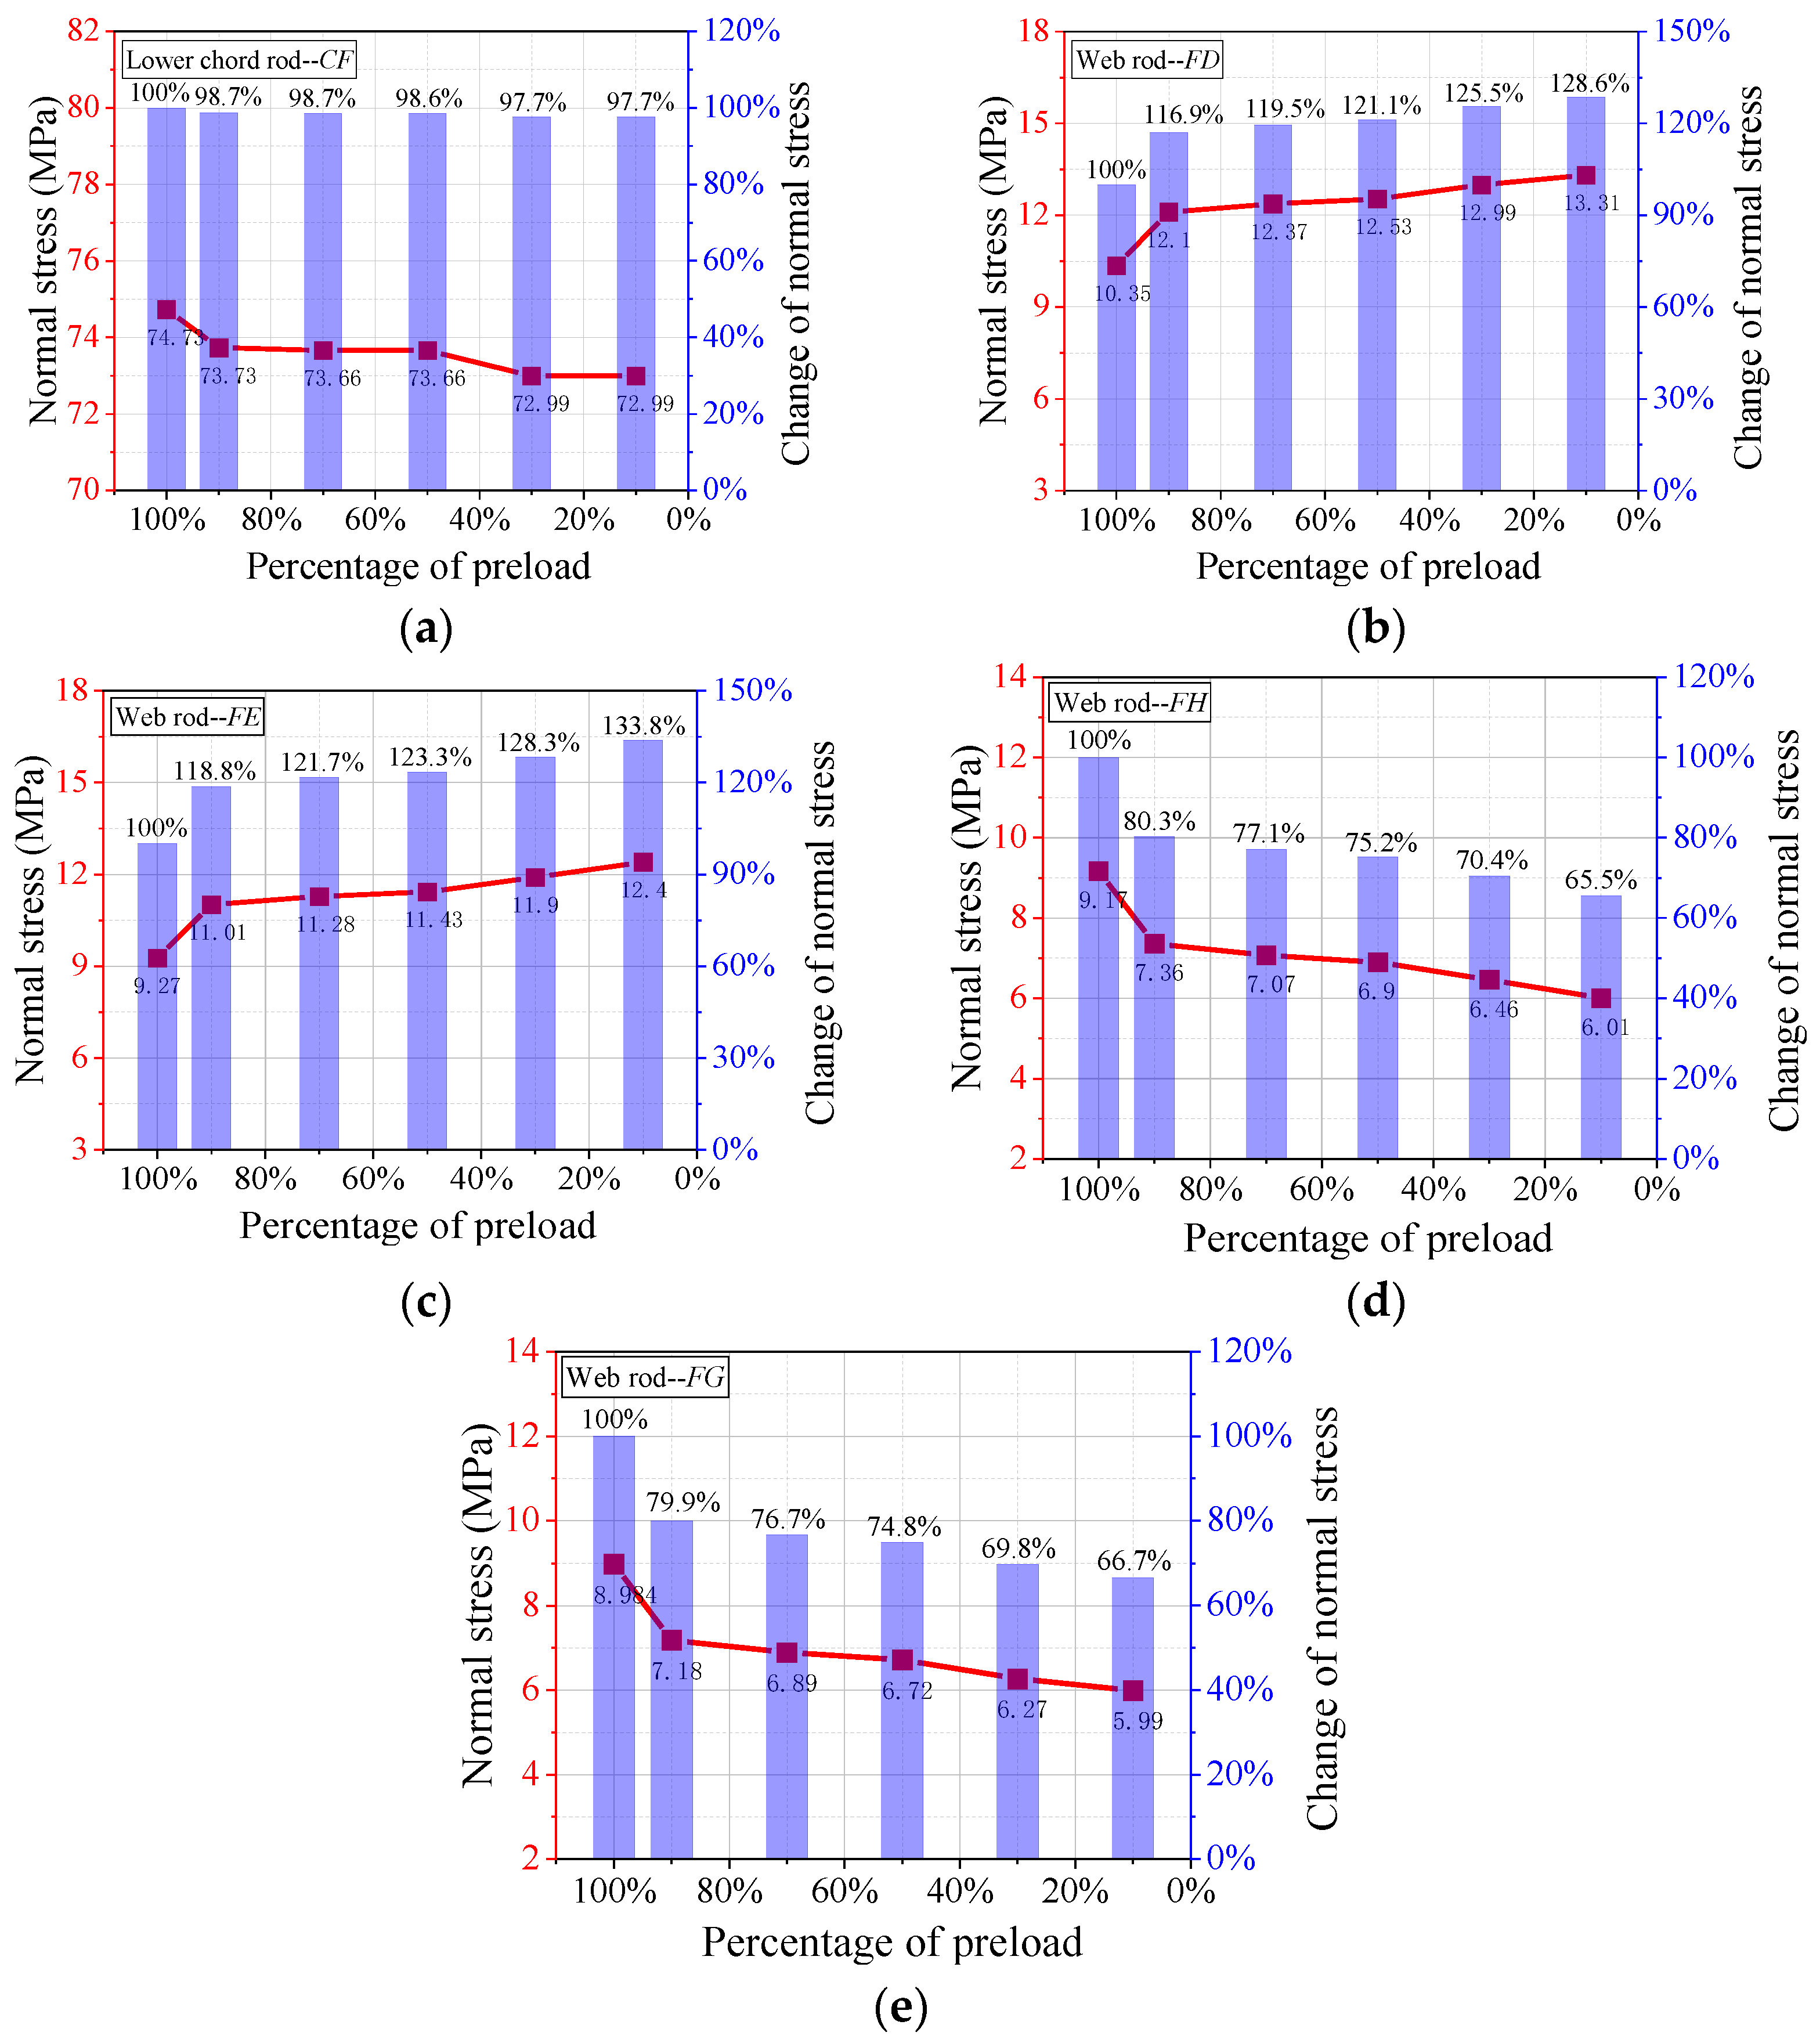
The rods with large changes were selected for analysis after releasing the preload of f1, as shown in Figure 14. The results show that the normal stress of the upper chord rods has no significant changes while that of the lower chord rods decreases with the decrease in preload. By releasing the normal stress of the upper chord in the length direction, the normal stress of FD and FE on the same side increases significantly. However, the normal stress of FH and FG on the other side decreases.
In the case of an insufficient preload at the end of the f1 rod, the FD and FE of the web rods will reach the yield stage if the preload is released. When the percentage of preload is less than 70%, rods LG and OH will also be at the yield edge. The rod that reaches the yield stage should also be replaced in time.
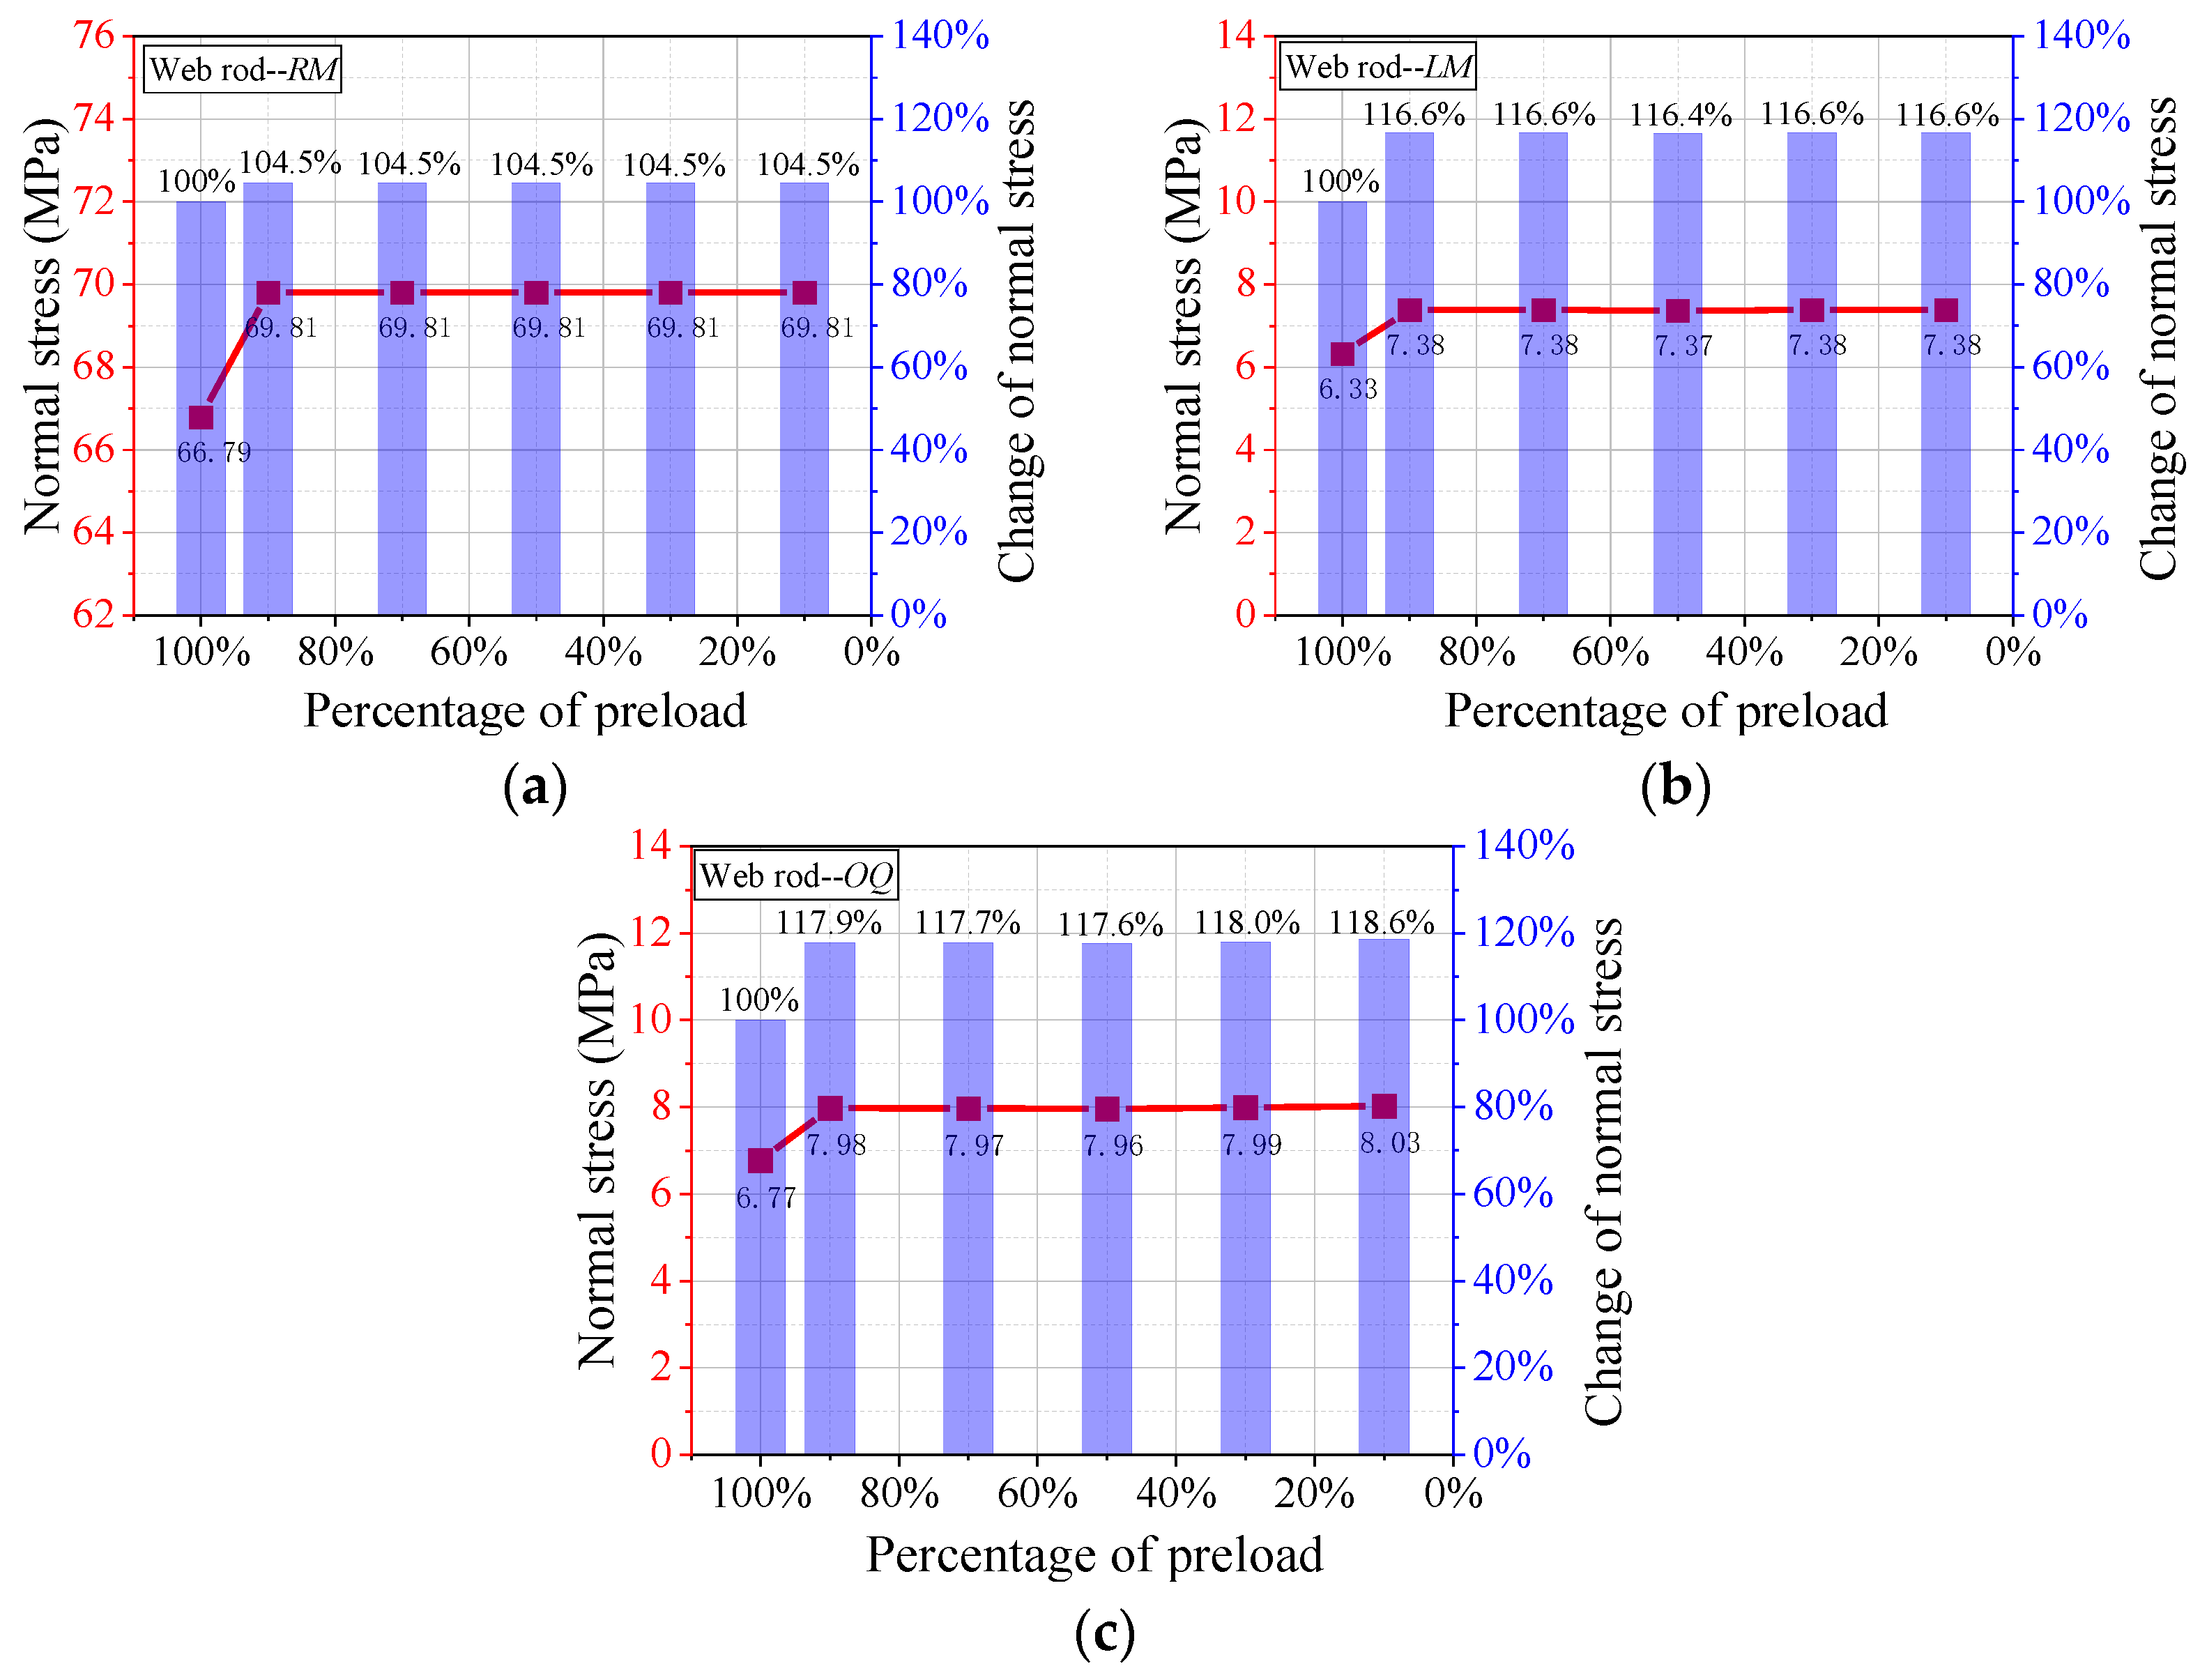
The release of the lower chord rod f2 has a great influence on the normal stress of the surrounding web rod, and both the increasing and decreasing trends are initially fast and then stable, as shown in Figure 15. Releasing the lower chord rod in the width direction has a certain influence on the normal stress of the distal upper chord rod. When the bolt percentage of preload is from 100% to 90%, the normal stress of the rod changes rapidly. From 90% to only 10%, the normal stress of the RM rod is unchanged, as shown in Figure 15a. Therefore, close attention should be paid to the initial stage of preload release because this stage has a rapid effect on the distal upper chord rod.
The effect of the normal stress on the surrounding web rod when the percentage of preload is 10% is shown in Figure 16. The normal stress of the web rods near the release chord significantly increases and the normal stress on the other side significantly decreases after releasing the f1 bolt. The normal stress of the web rod in the diagonal direction of the same width direction slightly increases, and the normal stress of the remaining web rods slightly decreases. The chord rod in the released width direction has little effect on the normal stress of its rod and other lower chord rods. The normal stress of the rods near the right side of f2 increases, and the normal stress of the lower rods decreases. The results show that the normal stress of the rods around the released rod changes greatly, while the rods away from the released rods have less influence.
For rod f2 with insufficient preload, rods LM and OQ should be replaced in time. When the end of the slack rod is the lower chord with a small span, the normal stress of the surrounding rods changes rapidly between 90% and 100%, and it has no significant change. Therefore, it is found that when the preload of the lower chord rod in the direction of the smaller span is reduced, all the web rods in the two spans around the node should be detected immediately, and the rods with excessive normal stress should be replaced in time. However, if the preload is reduced by the web rod and the upper chord rod in the smaller span direction, the preload can be screwed to the healthy state in time.
In the actual grid, the preload of bolt rods in the direction of the large span takes an important role and the preload of the upper chord has a greater influence. As the preload of a bolt rod decreases, the normal stress of the surrounding rods will change. However, if the string bolt in the width direction is not in the state of healthy preload, the normal stress of the surrounding rods will suddenly change. The preload of the web rod and upper chord rod with a small span has little effect on the normal stress of the surrounding rods. Therefore, it is necessary to pay attention to the preload of the lower chord rod in the smaller span direction.

4. Conclusions

In this paper, the pre-tightening force damage of the bolt-ball head connection grid is evaluated and analyzed. According to the modeling of a practical grid structure project, the bolt preload’s influence on the structure’s overall mechanical performance is revealed. The main conclusions are as follows:
1.
The release of the preload of the outer web rod is less effective on the overall stiffness and bearing capacity of the structure compared to that of the inner web rod. The release of the preload of the outer web rod results in a reduction of the overall stiffness and bearing capacity by 1.5% at most, while the release of the preload of the inner web rod results in a reduction of overall stiffness and bearing capacity by 5.4% at most.
2.
The magnitude of the preload significantly affects the stiffness of the bolt-ball joint and the bearing capacity in a small range of rotation.
3.
Relaxing the preload of an upper chord or a lower chord rod has little effect on the whole structure while relaxing the preload of a web rod will reduce the overall stiffness and bearing capacity by approximately 3% at most.
4.
The preload of the rod in the larger span direction plays an important role, however, the preload of the upper chord has a greater impact, while the preload of the web rod and the upper chord in the smaller span direction has no significant effect on the normal stress in the surrounding rods.
5.
The rod with a release preload has little effect on the overall deflection of the structure because the middle five inverted quadrangular pyramid grids are only a small part in comparison to the whole grid structure. Therefore, the influence of the preload release of more rods on the structure needs further research.
6.
The preload state of the lower chord in the width direction changes rapidly when it is 90–100%, and the normal stress of the surrounding rod does not change when it is less than 90%. Therefore, it is necessary to pay attention to the preload of the lower chord in the direction of a smaller span.
This paper did not conduct experimental research. In the future, an equivalent model can be manufactured based on the dimensions of the model elements used in the simulation. The experimental results can be compared with the simulation results to enhance the persuasiveness of the conclusions.

Author Contributions

Conceptualization, Y.Y., Z.P. and W.L.; software, Z.P., H.W. and W.L.; validation, W.L., J.S. and Z.G.; investigation, Y.Y., Z.P., H.W. and W.L.; data curation, W.L., J.S. and Z.G.; writing—original draft preparation, Y.Y., Z.P. and H.W.; writing—review and editing, Z.P., H.W. and W.L. All authors have read and agreed to the published version of the manuscript.

Funding

This research was funded by the National Natural Science Foundation of China (Grant No. 52078368 and 52038010).

Data Availability Statement

Data will be available upon request.

Conflicts of Interest

The authors declare no conflict of interest.

References

  1. Shang, H.; Ma, K.J.; Wei, Y.H.; Lu, Y. Experimental Studies on Shear Resistance Performances for the Shear key of H Shape Steel Spatial Grid Roofs. Lat. Am. J. Solids Struct. 2019, 16, 1–17. [Google Scholar] [CrossRef] [Green Version]
  2. Fan, Z.; Yang, S.; Luan, H. Research progress and practice of design of spatial structure joints. J. Build. Struct. 2011, 32, 1–15. [Google Scholar]
  3. Mousavi, A.A.; Zhang, C.; Masri, S.F.; Gholipour, G. Structural damage localization and quantification based on a CEEMDAN Hilbert transform neural network approach: A model steel truss bridge case study. Sensors 2020, 20, 1271. [Google Scholar] [CrossRef] [PubMed] [Green Version]
  4. Colombi, P. The ponding problem on flat steel roof grids. J. Constr. Steel Res. 2006, 62, 647–655. [Google Scholar] [CrossRef]
  5. Piroglu, F.; Ozakgul, K. Partial collapses experienced for a steel space truss roof structure induced by ice ponds. Eng. Fail. Anal. 2016, 60, 155–165. [Google Scholar] [CrossRef]
  6. Wu, Q.; Wang, H.; Qian, H.; Han, K.; Fan, F. Effect of insufficient screwing depth of bolt on mechanical behavior of bolt-ball joint and stability of single-layer reticulated shell. Eng. Struct. 2020, 213, 110590. [Google Scholar] [CrossRef]
  7. Wang, X.; Weng, K.; Liu, H.; Zhang, Y.; Chen, Z. Experimental study on the mechanical property of visual bolt-ball joint system. Adv. Struct. Eng. 2013, 16, 1749–1761. [Google Scholar] [CrossRef]
  8. Fan, F.; Ma, H.; Chen, G.; Shen, S. Experimental study of semi-rigid joint systems subjected to bending with and without axial force. J. Constr. Steel Res. 2012, 68, 126–137. [Google Scholar] [CrossRef]
  9. Yeum, C.; Dyke, S.J. Vision-based automated crack detection for bridge inspection. Comput. Aided Civ. Infrastruct. Eng. 2015, 30, 759–770. [Google Scholar] [CrossRef]
  10. Munawar, H.S.; Ullah, F.; Shahzad, D.; Heravi, A.; Qayyum, S.; Akram, J. Civil infrastructure damage and corrosion detection: An application of machine learning. Buildings 2022, 12, 156. [Google Scholar] [CrossRef]
  11. Thai, H.T. Machine learning for structural engineering: A state-of-the-art review. Structures 2022, 38, 448–491. [Google Scholar] [CrossRef]
  12. Sangirardi, M.; Altomare, V.; Santis, S.D.; Felice, G.d. Detecting damage evolution of masonry structures through computer-vision-based monitoring methods. Buildings 2022, 12, 831. [Google Scholar] [CrossRef]
  13. Lin, Y.; Nie, Z.; Ma, H. Structural damage detection with automatic feature-extraction through deep learning. Comput. Aided Civ. Infrastruct. Eng. 2017, 32, 1025–1046. [Google Scholar] [CrossRef]
  14. Xu, J.; Wang, S.; Bai, J.; Li, Y.; Quan, X. Study on durability and piezoresistivity of cement-based piezoelectric materials mixed with carbon fiber and iron tailings under salt-freezing erosion. Buildings 2022, 12, 1150. [Google Scholar] [CrossRef]
  15. Lucena, R.L.; Dos Santos, J. Structural health monitoring using time reversal and cracked rod spectral element. Mech. Syst. Signal Process. 2016, 79, 86–98. [Google Scholar] [CrossRef]
  16. Zagrai, A.; Giurgiutiu, V. Electro-mechanical impedance method for crack detection in thin plates. J. Intell. Mater. Syst. Struct. 2001, 12, 709–718. [Google Scholar] [CrossRef]
  17. Zhu, R.; Li, F.; Zhang, D.; Tao, J. Effect of joint stiffness on deformation of a novel hybrid frp-aluminum space truss system. J. Struct. Eng. 2019, 145, 04019123. [Google Scholar] [CrossRef]
  18. Xu, J.; Feng, D.; Mangalathu, S.; Jeon, J. Data-driven rapid damage evaluation for life-cycle seismic assessment of regional reinforced concrete bridges. Earthq. Eng. Struct. Dyn. 2022, 51, 2730–2751. [Google Scholar] [CrossRef]
  19. Saka, T.; Heki, K. The Effect of Joints on the Strength of Space Trusses. In Proceedings of the 3rd International Conference on Space Structure, Guildford, UK, 11–14 September 1984; pp. 417–422. [Google Scholar]
  20. Ei-sheikh, A.L. Numerical analysis of space trusses with flexible member-end joints. Int. J. Space Struct. 1992, 8, 189–197. [Google Scholar] [CrossRef]
  21. Wang, F.; Wang, X.; Zhang, W. Analysis of the influence of joint stiffness stability performance of single -layer reticulated shell. Steel Constr. 2015, 8, 43–45. [Google Scholar]
  22. Gomes, V.; Rodrigues, M.; Correia, J. Monotonic and fracture behaviours of bolted connections with distinct bolt preloads and surface treatments. Fract. Struct. Integr. 2019, 48, 304–317. [Google Scholar] [CrossRef]
  23. GB/T 16939-2016; High Strength Bolts for Joints of Space Grid Structures. China National Standardization Administration Committee: Beijing, China, 2016. (In Chinese)
  24. Dong, J. Monitoring The Connection State of Bolted Spherical Joint in Space Structures Based on Time Reversal Method; Qingdao University of Technology: Qingdao, China, 2019. [Google Scholar]
  25. JB/T 6040-2011; Construction Machinery. Test Methods of Tightening Torque for Bolts. China Tianjin Engineering Machinery Research Institute: Beijing, China, 2011. (In Chinese)
  26. GB 50017-2017; Design Standard for Steel Structures. Ministry of Housing and Urban-Rural Development of the People’s Republic of China: Beijing, China, 2017. (In Chinese)
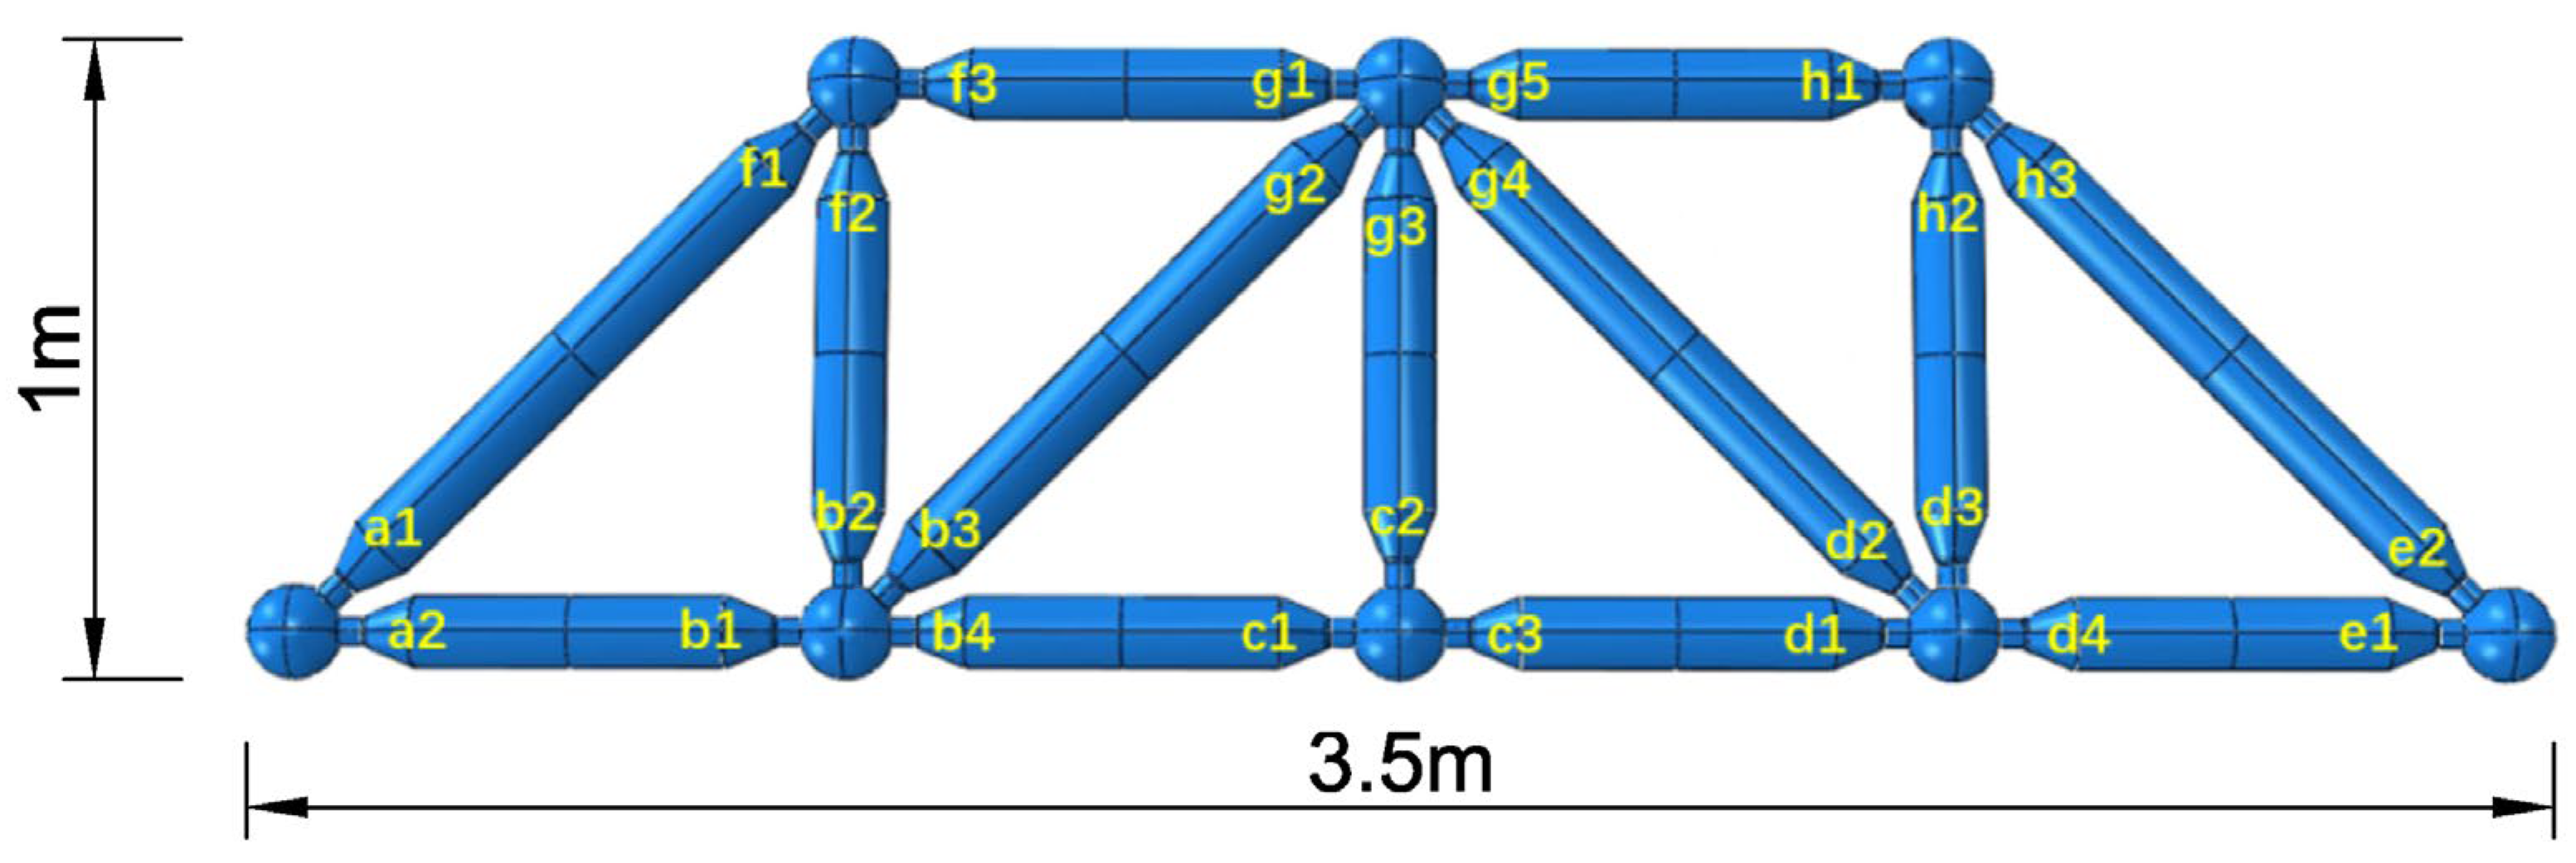
Figure 1. The plane truss model. (The combination of letters and numbers denotes bolts).
Buildings 13 01178 g001
Figure 2. The load-deflection curve of no release.
Buildings 13 01178 g002
Figure 3. The load-deflection curve of releasing the preload of bolts from different rods. (a) Releasing bolts from lower chord rods, (b) Releasing bolts from upper chord rods.
Buildings 13 01178 g003
Figure 4. The load-deflection curve of releasing the preload of bolts from web rods.
Buildings 13 01178 g004
Figure 5. Load-deflection curves under different preload conditions (releasing bolts from web rods). (a) Releasing bolts from inner web rods, (b) Releasing bolts from outer web rods.
Buildings 13 01178 g005
Figure 6. A model of the grid structure.
Buildings 13 01178 g006
Figure 7. The inverted quadrangular pyramid model. (The letters denote bolted-ball joints).
Buildings 13 01178 g007
Figure 8. The grid layout. (a) grid plane, (b) lower chord joints, (c) upper chord joints, (d) web rods.
Buildings 13 01178 g008aBuildings 13 01178 g008b
Figure 9. The load-deflection curve. (a) lower chord rod, (b) upper chord rod.
Buildings 13 01178 g009
Figure 10. The stress cloud diagram during the loading of the grid. (a) yield stage of the rod, (b) failure stage of the rod.
Buildings 13 01178 g010
Figure 11. The variation of normal stress after releasing d3. (a) upper chord AD, (b) upper chord DG, (c) upper chord GJ, (d) lower chord LF, (e) web rod FD, (f) web rod LM, (g) web rod LN, (h) web rod FE, (i) web rod FH.
Buildings 13 01178 g011
Figure 12. The normal stress variation of the web rods. 10% percentage of preload about d3. (The letters in the figure denote bolted-ball joints).
Buildings 13 01178 g012
Figure 13. The change of normal stress: (a) preload releasing of upper chord rod DE, (b) preload releasing of web rod DF.
Buildings 13 01178 g013
Figure 14. The variation of normal stress after releasing f1. (a) lower chord rod CF, (b) web rod FD, (c) web rod FE, (d) web rod FH, (e) web rod FG.
Buildings 13 01178 g014
Figure 15. The variation of normal stress after releasing f2. (a) web rod RM, (b) web rod LM, (c) web rod OQ.
Buildings 13 01178 g015
Figure 16. The normal stress variation of the web rod. (a) 10% percentage of preload about rod f1, (b) 10% percentage of preload about rod f2. (The letters in the figure denote bolted-ball joints).
Buildings 13 01178 g016
Table 1. The quantitative relationship between the contact area and preload.
Load (kN)Bolt Ball (mm2)Sealing Plate (mm2)
2.5197.6167.5
5258.0237.0
7.5293.1270.3
10313.6293.6
12.5323.8306.3
15326.7319.4
17.5328.7324.1
20330.6328.6
Table 2. The results and conclusions for the numerical simulation of a plane grid with a bolt-ball joint connection.
SituationEffectConclusions
Releasing upper and lower chord rodsNo significant effect1. In this plane truss, the upper chord rods are mainly under compression and the lower chord rods are mainly under tension, while the web rods in the middle bear the bending resistance.
2. Releasing the outer web rods has less significant effect compared to releasing the inner web rods.
Releasing outer web rodsReduces overall stiffness and capacity
Releasing inner web rodsReduces overall stiffness and capacity, with a more significant impact
Table 3. The maximum normal stress of each upper chord rod (Unit: MPa).
RodsADDGGJBEEHHKMNPQ
Normal stress−63.13−67.49−63.43−64.09−68.32−63.99−66.79−68.96
RodsABMDDEEPNGGHHQJK
Normal stress−102.10−108.60−93.21−113.50−109.20−93.25−110.50−102.40
Table 4. The maximum normal stress of the web rod (Unit: MPa).
RodsCACDCBCEFDFEFHFGIGIH
Normal stress41.78−29.3340.98−29.4710.359.279.178.98−28.33−29.33
RodsIJIKLMLNLDLGOEOHOPOQ
Normal stress41.0940.866.33−6.5915.5215.6215.7816.18−7.586.77
Table 5. The maximum normal stress of the upper chord rods when releasing d3 (Unit: MPa).
Percentage of PreloadADDGGJBEEHHKMNPQ
ABMDDEEPNGGHHQJK
100%−63.13−67.49−63.43−64.09−68.32−63.99−66.79−68.96
−102.10−108.60−93.21−113.50−109.20−93.25−110.50−102.40
90%−64.10−69.84−64.94−63.97−67.82−63.74−66.35−68.87
102%103%102%100%99%100%99%100%
−101.80−107.90−93.53−113.20−108.90−92.47−110.2−102.00
100%99%100%100%100%99%100%100%
70%−65.01−70.91−65.88−63.80−67.44−63.56−66.04−68.78
103%105%104%100%99%99%99%100%
−101.90−108.00−93.24−113.20−108.80−92.26−110.20−102.10
100%99%100%100%100%99%100%100%
50%−65.53−72.08−66.15−63.75−67.32−63.51−65.95−68.76
104%107%104%99%99%99%99%100%
−102.00−108.20−92.87−113.20−108.80−92.27−110.20−102.10
100%100%100%100%100%99%100%100%
30%−65.59−72.18−66.29−63.74−67.26−63.48−65.90−68.75
104%107%105%100%98%99%99%100%
−102.00−108.20−92.91−113.20−108.80−92.26−110.20−102.10
100%100%100%100%100%100%100%100%
10%−65.62−72.24−66.42−63.74−67.21−63.45−65.86−68.74
104%107%105%99%98%99%99%100%
−102.10−108.20−93.06−113.20−108.80−92.24−110.20−102.10
100%100%100%100%100%99%100%100%
Table 6. The maximum normal stress of the web rods when releasing d3 (Unit: MPa).
Percentage of PreloadCACDCBCEFDFEFHFGIGIH
IJIKLMLNLDLGOEOHOPOQ
100%41.78−29.3340.98−29.4710.359.279.178.99−28.33−29.33
41.0940.866.326−6.5915.5215.6215.7816.18−7.586.77
90%42.77−30.01−40.63−28.3112.257.8858.1269.63−29.64−28.56
102%102%99%96%118%85%89%107%105%97%
41.9940.62−7.23−7.9517.1116.7615.7416.24−7.616.84
102%99%114%121%110%107%100%100%100%101%
70%43.5−31.1440.43−27.6512.86.947.2010.26−30.6−27.92
104%106%99%94%124%75%79%114%108%95%
42.7540.33−8.05−8.6517.6917.3515.7516.26−7.646.82
104%99%127%131%114%111%100%100%101%101%
50%43.65−30.9440.32−27.4613.516.636.9710.38−30.94−27.73
105%106%98%93%131%72%76%116%109%95%
42.9840.25−8.25−9.03818.2117.5415.7716.26−7.656.82
105%99%130%137%117%112%100%101%101%101%
30%43.78−31.1340.31−27.3313.656.466.8210.47−31.07−27.63
105%106%98%93%132%70%74%117%110%94%
43.0940.21−8.39−9.15718.3417.6415.7616.27−7.656.82
105%98%133%139%118%113%100%101%101%100%
10%43.93−31.3140.32−27.1713.866.276.7010.56−31.18−27.56
105%107%98%92%134%68%73%118%110%94%
43.1940.17−8.53−9.2918.5417.7515.7516.29−7.656.83
105%98%135%141%120%114%100%101%101%101%
Table 7. The maximum normal stress of the lower chord rods when releasing d3 (Unit: MPa).
Percentage of PreloadCFFILFFO
100%74.7374.8929.6530.07
90%74.7274.9926.9630.29
100%100%91%101%
70%74.7975.0625.1030.57
100%100%85%102%
50%74.7575.1124.4830.66
100%100%83%102%
30%74.7675.1224.1830.72
100%100%82%102%
10%74.7675.1223.8630.78
100%100%81%102%
Disclaimer/Publisher’s Note: The statements, opinions and data contained in all publications are solely those of the individual author(s) and contributor(s) and not of MDPI and/or the editor(s). MDPI and/or the editor(s) disclaim responsibility for any injury to people or property resulting from any ideas, methods, instructions or products referred to in the content.