Article

An Analytical Algorithm for Determining Optimal Thin-Walled Hollow Pier Configuration with Sunlight Temperature Differences

1
School of Transportation, Civil Engineering & Architecture, Foshan University, Foshan 528225, China
2
School of Civil Engineering, Central South University, Changsha 410075, China
3
State Key Laboratory of Internet of Things for Smart City, Department of Civil and Environmental Engineering, University of Macau, Macau SAR 999078, China
4
Shanghai Municipal Engineering Design Institute (Group) Co., Ltd., Xi’an Branch, Xi’an 710075, China
*
Author to whom correspondence should be addressed.
Buildings 2023, 13(5), 1208; https://doi.org/10.3390/buildings13051208
Submission received: 11 April 2023 / Revised: 27 April 2023 / Accepted: 30 April 2023 / Published: 2 May 2023

Abstract

:
Formulas for computing the line shape of a thin-walled hollow pier body based on structural characteristics and measured sunlight temperature difference are derived using an analytical algorithm. In a case study of the No. 5 pier of a newly constructed continuous beam bridge on a mountainous expressway of Guizhou Province in China, the pier top’s displacement calculated by the analytical algorithm, currently accepted code, and a FEM program were each compared to its measured values. Furthermore, the effects of sunlight temperature difference, pier height, and wall thickness on the line shape of the pier body were explored, and the results show that the calculation values from these formulas were closer to the measured values than the currently accepted code, with a maximum error of 0.507 mm, demonstrating that the formulas have a more dependable result, higher precision, and more specific applicability. Thus, the algorithm provides a better method for the line shape calculation and construction control of thin-walled hollow piers because it can accurately account for sunlight temperature differences and pier height.

Graphical Abstract

1. Introduction

For thin-walled hollow high-piers in the state of the construction stage, any change in sunlight temperature leads to an uneven temperature field on a pier that typically presents with a nonlinear distribution [1,2]. This can lead to a large nonlinear temperature difference in the pier structure that can cause structural deformation, the temperature difference is affected by atmospheric temperature, sunlight radiation, section position, and other factors [3,4,5]. With the recent development of highway construction in China, the amount of high-pier bridge construction has been correspondingly increasing, and the height of piers has also been gradually increasing. However, it is common that pier top displacements exceed the allowable value (25 mm, H/3000, and ≤30 mm (H is pier height)) during the bridge construction stage [6]. The optimal configuration is that the linear of the pier after construction has no offset, and the offset value is 0 mm. In construction, when the linear offset of pier meets the requirements of the design specification, it can also be accepted. Nonlinear temperature changes not only affect a pier’s alignment but also produce a large eccentric bending moment at the bottom of the pier that affects the bearing capacity of the pier [7,8,9]. Hence, studies of the effects of sunlight temperature differences on the alignment of such high piers [10,11,12,13] are urgently needed.
The research on the effect of temperature on concrete structures began in the 1950s, when scholars from various countries initially studied the temperature field of concrete structures through a series of theoretical analyses and a large number of field experiments and successfully obtained some temperature field distribution laws for concrete structures [14,15,16,17,18,19,20]. However, the research on the effect of a sunlight temperature difference mostly focused on the superstructure of the constructed bridge [21,22,23,24,25,26,27,28,29] rather than the substructure under construction [30,31,32,33]. Research on the influence of sunlight temperature differences on the shape of thin-walled hollow piers under construction was even more scant. In recent years, though, with the wide application of hollow, thin-walled high piers in engineering, people have begun to pay more and more attention to the effects of temperature in their analyses of bridge substructures, especially high the piers [34,35].
Based on the theory of sunlight temperature distribution, Zhang [30] analyzed the temperature effect of a double-limbed rectangular hollow pier under a sunlight temperature load using the secondary development function of ANSYS and analyzed the influence of section shape on the pier’s temperature field. Dai [31] et al. used the generalized Pareto distribution and Centennial return period additive model to analyze the temperature–time change in the direction of pier thickness and predicted the most extreme temperature values during the return period, although they did so without experimental verification. Similarly, Liu [32] analyzed the influence of sunlight radiation and air temperature on thin-walled hollow piers in high-altitude areas according specifically focusing on low temperatures, the large temperature differences between day and night, and stronger solar radiation at higher altitudes. To study of the effects of sunlight temperature differences on the shape of thin-walled hollow piers, Lin [33] analyzed the effect of temperature with both three-cavity sections and double-limb sections. The results showed that the displacement of the pier top caused by the sunlight temperature difference was closely related to the change in air temperature, and the lateral displacement of the pier top was the largest when the external temperature was the highest. Likewise, Bi [3] established a three-dimensional simulation model of a thin-walled hollow pier using ANSYS software and analyzed the displacement of the pier top under the fabrication constraints. Based on ANSYS analysis and railway specification formula [36], Tang [37] calculated the top displacement of a thin-walled hollow high pier under the action of sunlight temperature difference, and then put forward an active control method for high pier body alignment.
However, there are still few studies on the effects of sunlight temperature differences on the substructure of bridges under construction, and research results on the effects of sunlight temperature differences on the alignment of high piers are still scarce. The only useful references have come in the Chinese Code TB 10052-1997 railway flexible pier bridge technical specifications [36] for the calculation formula of pier top displacement, or from the use of finite element software. However, the displacement calculation formula in the railway code is meant for railway flexible piers, and it has a long history of successful applicability, whereas the thin-walled hollow structure commonly used in high pier structures is not well suited for that formula as it fails to reflect the piers’ structural characteristics.
To solve the above-mentioned disadvantages, the finite element methods are used to tackle the problem of optimal high pier construction including modeling, boundary condition simulation, calculation, and result analysis, and an optimal high pier construction configuration is obtained in this study. Additionally, the field environment is complex and ever-changing, so that question of how best to simulate the real-world situation of these structures is also difficult. Therefore, this article uses the function integral method together with the equivalent linearization method to derive an analytical formula for thin-walled hollow pier top displacement caused by sunlight temperature differences according to this type of pier’s particular structural characteristics. Furthermore, it takes the No.5 thin-walled hollow high pier under construction of a continuous beam bridge in the mountainous area of Guizhou Province in China as a field example and use monitored temperature effects to compare the analytical formula to existing finite element calculations. These comparison results show that the analytical calculation formula has very high precision and thus can provide a new means for better taking sunlight temperature differences into account. Using the above formula and pre-bias method, it can provide a method for the linear construction control of the hollow pier.

2. Derivation of the Analytical Formula

2.1. Fundamental Assumptions

Consider a theoretical thin-walled hollow pier. It is assumed that the temperature distribution along the height direction of the pier is uniform, and the temperature distribution difference caused by local changes is ignored. The concrete materials are assumed to be homogeneous and isotropic, in line with the law of elastic deformation before cracks occur, and the Bernoulli plane deformation assumption is also applied. Deformation loads are thus calculated as unidirectional temperature loads and then superimposed to form the basis for multidirectional temperature load calculations.

2.2. Derivation

At present, the research on the influence of sunlight temperature differences on the alignment of bridge piers usually begins from the one-dimensional problem. First, the temperature field effects in the one-dimensional direction of the structural plane are analyzed, as shown in Figure 1, and then the temperature field effects in another dimension are analyzed. The total offset value is then obtained using a coupling calculation, and this analysis method has achieved the expected results in several practical engineering projects [31,32]. Referring to the relevant literature and specifications [37], under the action of a sunlight temperature difference between the AB-side and the CD-side, as shown in Figure 1, the temperature gradient pattern of box piers along the wall thickness is distributed exponentially [38] as follows:
T x = T 0 e a x
where T x is the temperature difference between the calculation point and the back surface (°C); T 0 is the temperature difference between the front and back of the pier (°C); a is the exponential coefficient, generally taken to be 7; and x is the distance from the calculated point to the heated surface (m).
Figure 1 shows the deformation of the thin-walled hollow pier cross-section using a sunlight temperature difference diagram. The right side of the deformation diagram can be expressed in the X direction along the bridge but can also be expressed in the Y direction transverse bridge. Under the action of the nonlinear temperature gradient from sunlight, the longitudinal (transverse) fiber on the cross-section of the bridge pier swells and shrinks, and in the free state the free deformation curve of the fiber is similar to the shape of the sunlight temperature gradient curve (an exponential curve), as shown in Figure 1. However, since the longitudinal (transverse) fiber deformation on the cross-section needs to maintain the straight-line distribution assumed by the plane cross-section, the actual cross-section line shape is given by line 2 in Figure 1, and the self-constrained deformation between the longitudinal (transverse) fibers of the cross-section are shown as the shaded line in the figure. Since there is a free end, the thermally induced stresses should be 0 in the vertical direction of the pier.
Figure 1 shows that the self-constrained temperature stress in the cross-section is proportional to the free strain of the fiber and that the strain difference is retained after plane deformation. The calculation is as follows:
ε = α T 0 e a x
T x = T 1 T 1 T n x d
ε = α T x
ε 0 ( x ) = ε ε = α T 0 e a x T 1 + T 1 T n x d
σ 0 ( x ) = E ε 0 ( x ) = E α T 0 e a x T 1 + T 1 T n x d
In the above formulas: α is the material linear expansion coefficient ( α = 1.0 × 10⁻⁵/°C); d is the width of a single pier; ε is the free strain of the fiber; ε is the actual deformation of the section; T 1 is the surface temperature of the sunny side when the section is deformed in the plane (°C); T n is the surface temperature of the dorsal side when the section experiences planar deformation (°C); T 0 is the temperature difference between the front and back of the pier (°C); T x is the equivalent temperature at the position x when the cross-section is plane deformed (°C); ε 0 ( x ) is the strain difference between fiber-free expansion and section plane deformation (°C); σ 0 ( x ) is self-constrained temperature stress; and E is the elastic modulus of concrete (MPa).
When the temperature field is stable, the deformation of the structure is related to the linear expansion coefficient of the material. In a typical pier structure, the volume of the steel bars is only 1% to 2% of the total volume of the structure, so the thermal conductivity of the pier structure is mostly affected by the thermal conductivity of the concrete. Therefore, α takes 1.0 × 10⁻⁵/°C. During construction the pier during construction is a statically determinate structure, so the temperature stress caused by sunlight temperature difference is only temperature self-stress σ0(x). According to the principle of temperature stress self-balance on a section, when the bar is in a free state, the bending moment on the section is M = 0 , i.e., 0 d σ 0 x d 2 x h 0 d x = 0 . From this formula, it can be obtained:
h T 0 1 a 2 e a d + d e a d 2 a + d 2 a 1 a 2 1 12 T 1 T n d 2 h 0 T 0 1 a 2 e a d δ + d 2 δ e a d δ 2 a + d 2 δ e a δ 2 a e a δ a 2 + h 0 1 12 d T 1 T n d 2 δ 3 = 0                  
The temperature gradient η along the wall thickness can be obtained from Equation (7) by equivalent linearization of the actual temperature difference curve:
η = T 1 T n d = 6 T 0 a h d 3 a h 0 d 0 3 h d 2 a d + 1 e a d 1 + 2 h 0 d 0 2 a d 0 + 1 e a d 0 1 + 2 e a δ
where d is the longitudinal width of the pier section; h is the transverse width of the pier section; d 0 is the longitudinal width of the hollow part of the pier section; h 0 is the transverse length of the hollow section of the pier; and δ is thin-walled hollow high pier wall thickness. The rotation angle for the pier micro-segment d y is given by α η d y , so pier top displacement Δ S can be expressed as:
Δ S = 0 H α η y d y
Now, it assumes that A = h × d and A 0 = h 0 × d 0 so that when d is constant, η changes with the temperature difference. Substituting Formula (8) into Formula (9), thus gives:
Δ S = α η H Δ H 2 = 3 α H Δ H A T 0 2 a d + 1 e a d 1 + 2 a h d 3 a h 0 d 0 3 3 α H Δ H A 0 T 0 e a δ 2 a d 0 + 1 e a d 0 1 + 2 a h d 3 a h 0 d 0 3
where H is the vertical length of the pier (m), and Δ H is the distance from pier center to pier top (m). Since e a δ is small, on the order of 10−3 to 10−6, the second term of the molecule is much smaller than the first term, and it can be ignored here. Thus,
Δ S = 3 α H Δ H d h T 0 2 a d + 1 e a d 1 + 2 a h d 3 a h 0 d 0 3
If the sunlight temperature differences are different for n different sections of the pier, the pier needs to be divided formally into these n sections to calculate the displacement of the pier top caused by the sunlight temperature difference in each section Δ S i [39] as follows:
Δ S i = 3 α H i Δ H i d i h i T i 2 a d i + 1 e a d i 1 + 2 a h i d i 3 a h i 0 d i 0 3
where Δ S i is the free displacement of section i in the sunlight (m); α is the material linear expansion coefficient ( α = 1.0 × 10⁻⁵/°C); H i is the length of segment i (m); Δ H i is the distance from the center of section i to the pier top (m); d i is the width of the pier along the bridge in section i (m); h i is the transverse width of pier i (m); T i is the temperature difference between the sunny side and the back-sun side along the bridge in section i (°C); d i 0 is the longitudinal width of the hollow part of the pier body in section i (m); h i 0 is the transverse width of the hollow part of the pier body in section i (m); and n is the calculated number of segments. Superimposing the pier top displacement caused by each segment, the total pier top displacement is thus:
Δ S = i = 1 n Δ S i = i = 1 n 3 α H i Δ H i d i h i T i 2 a d i + 1 e a d i 1 + 2 a h i d i 3 a h i 0 d i 0 3
The above analytical formula applies to both the calculation of pier top displacement along the bridge and the calculation of pier top displacement across the bridge under the measured sunlight temperature difference. When calculating the transverse displacement of the pier top, it is only necessary to exchange the position of the along-bridge parameter d i ( d i 0 ) and the transverse bridge parameter h i ( h i 0 ) in Formula (13). Furthermore, after calculating the longitudinal and transverse displacements of the pier top, the total displacement S of the pier top can be obtained by coupling these two displacements [40,41].
S = Δ S l o n g i t u d i n a l 2 + Δ S t r a n s v e r s e 2
where Δ S l o n g i t u d i n a l and Δ S t r a n s v e r s e are the displacement of the pier top along the bridge direction and transverse bridge directions, respectively.

3. Engineering Profile and Case Study Selection

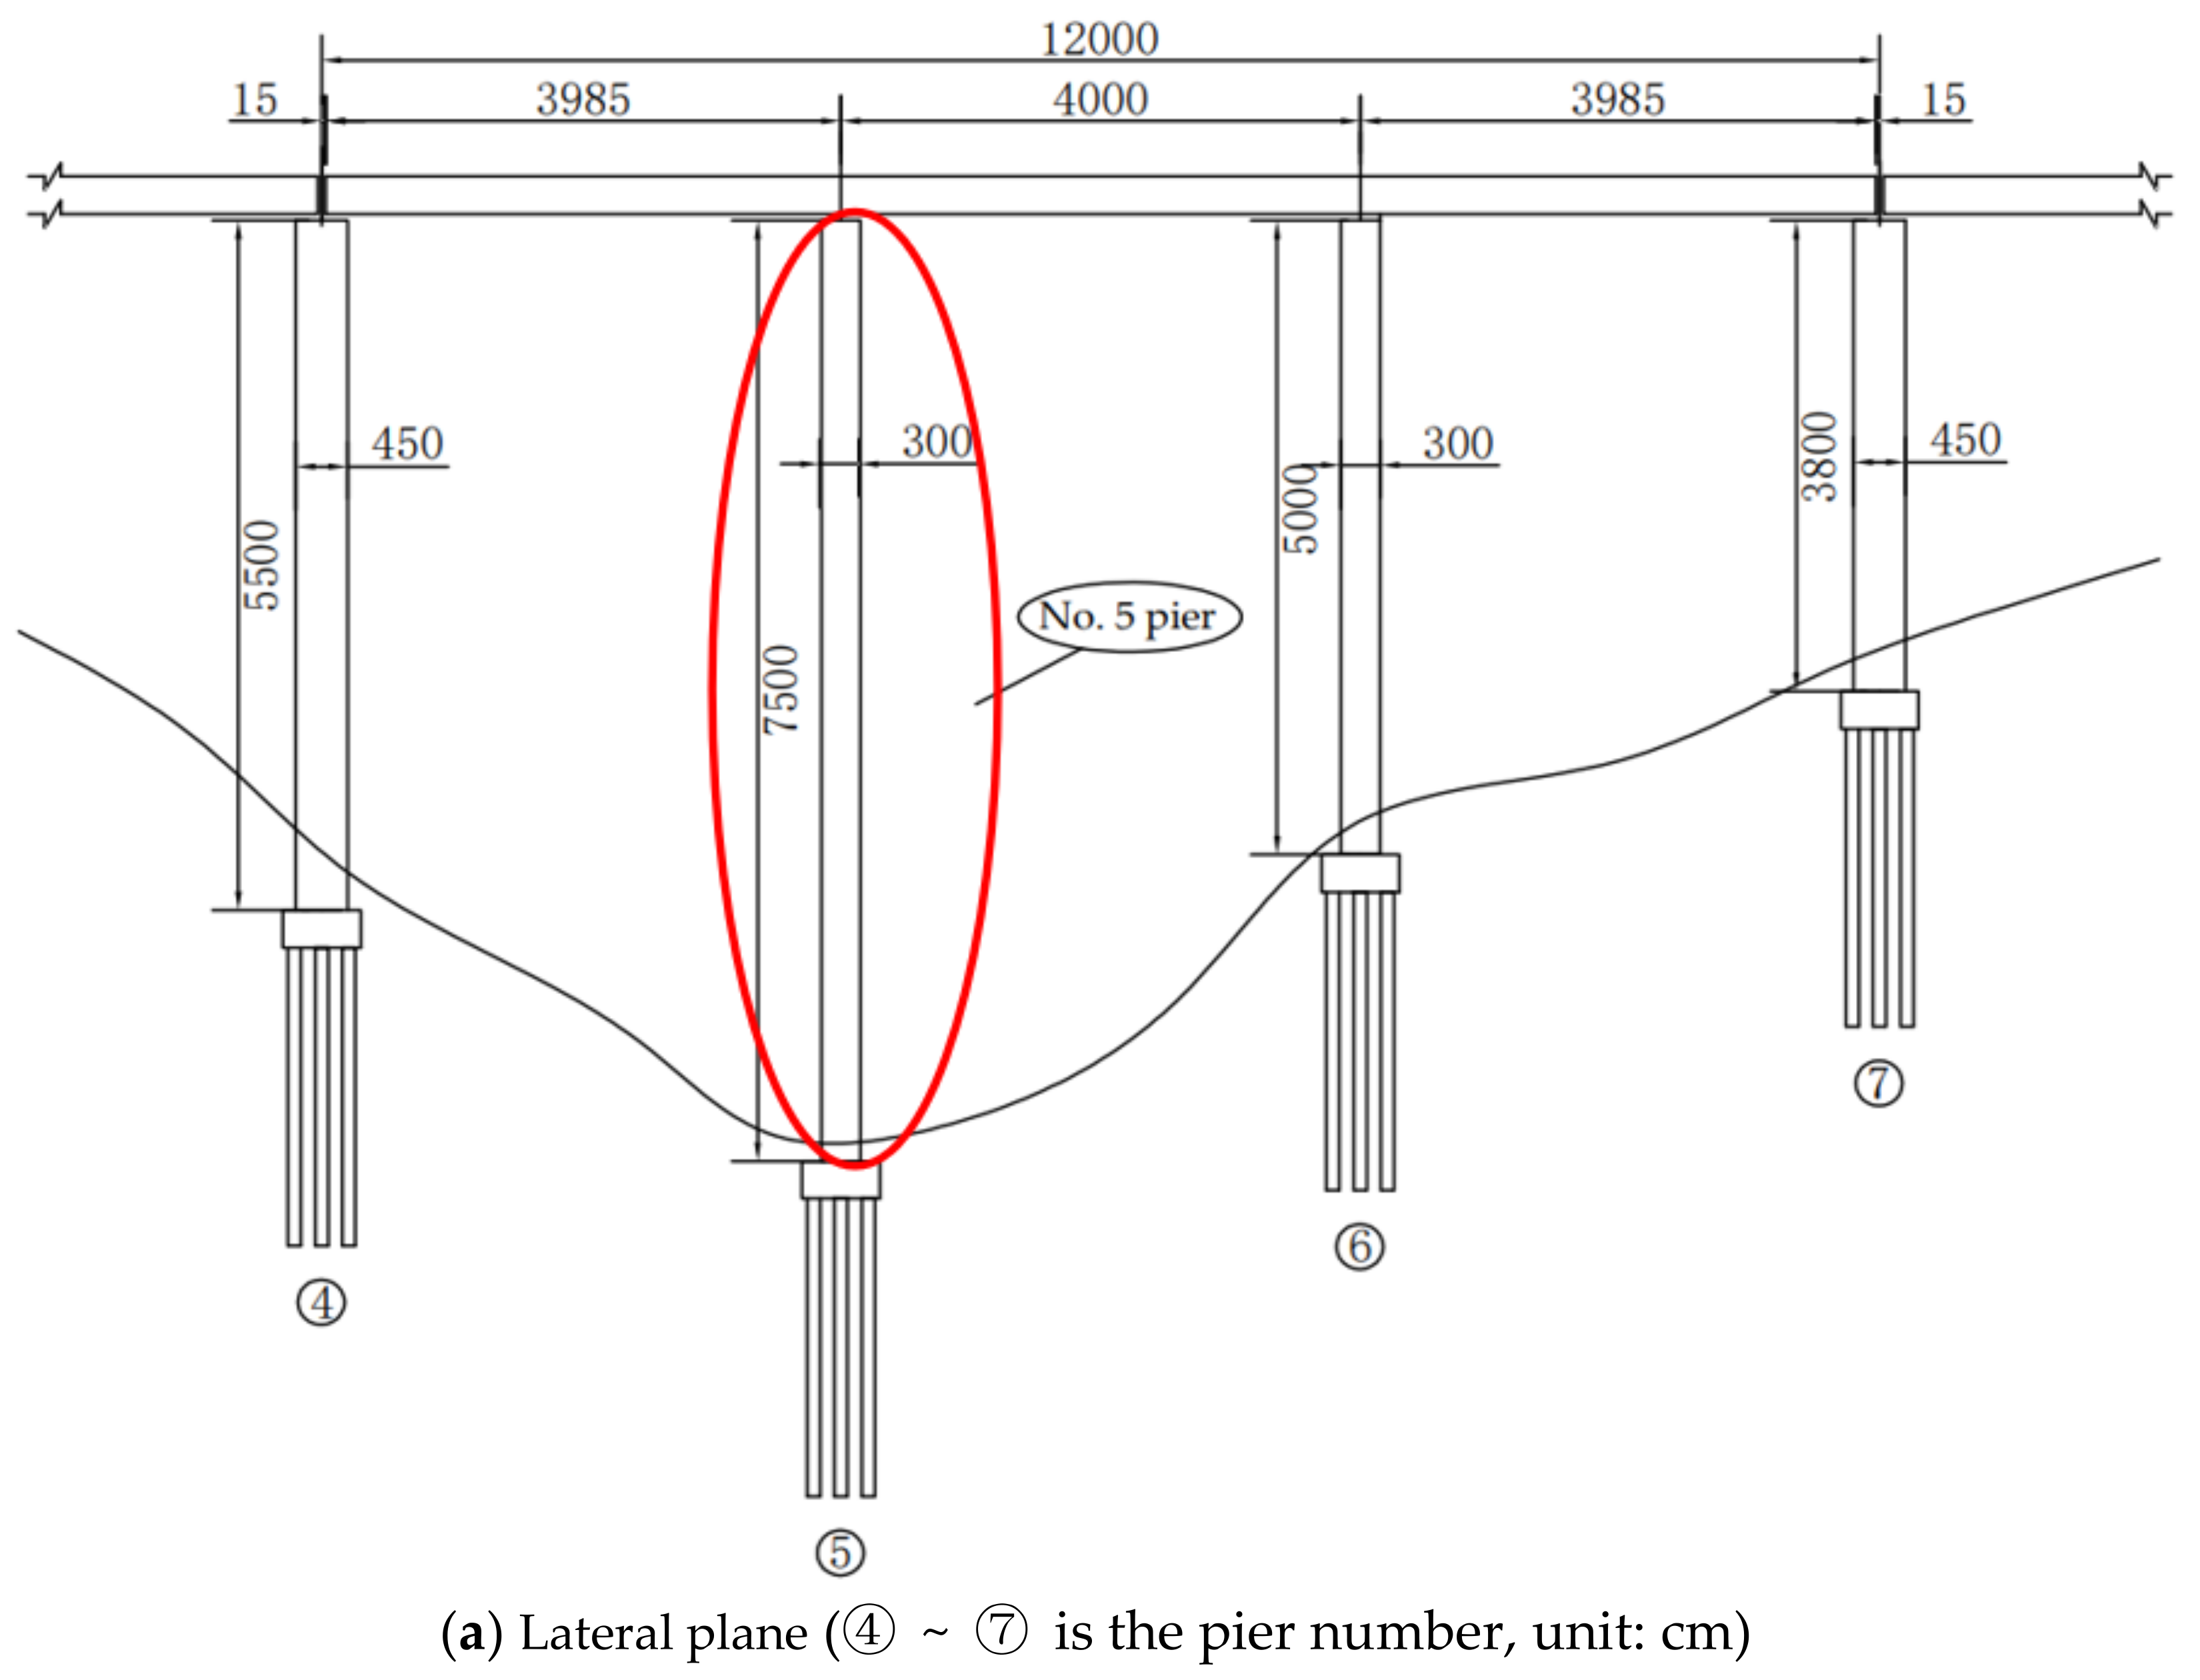
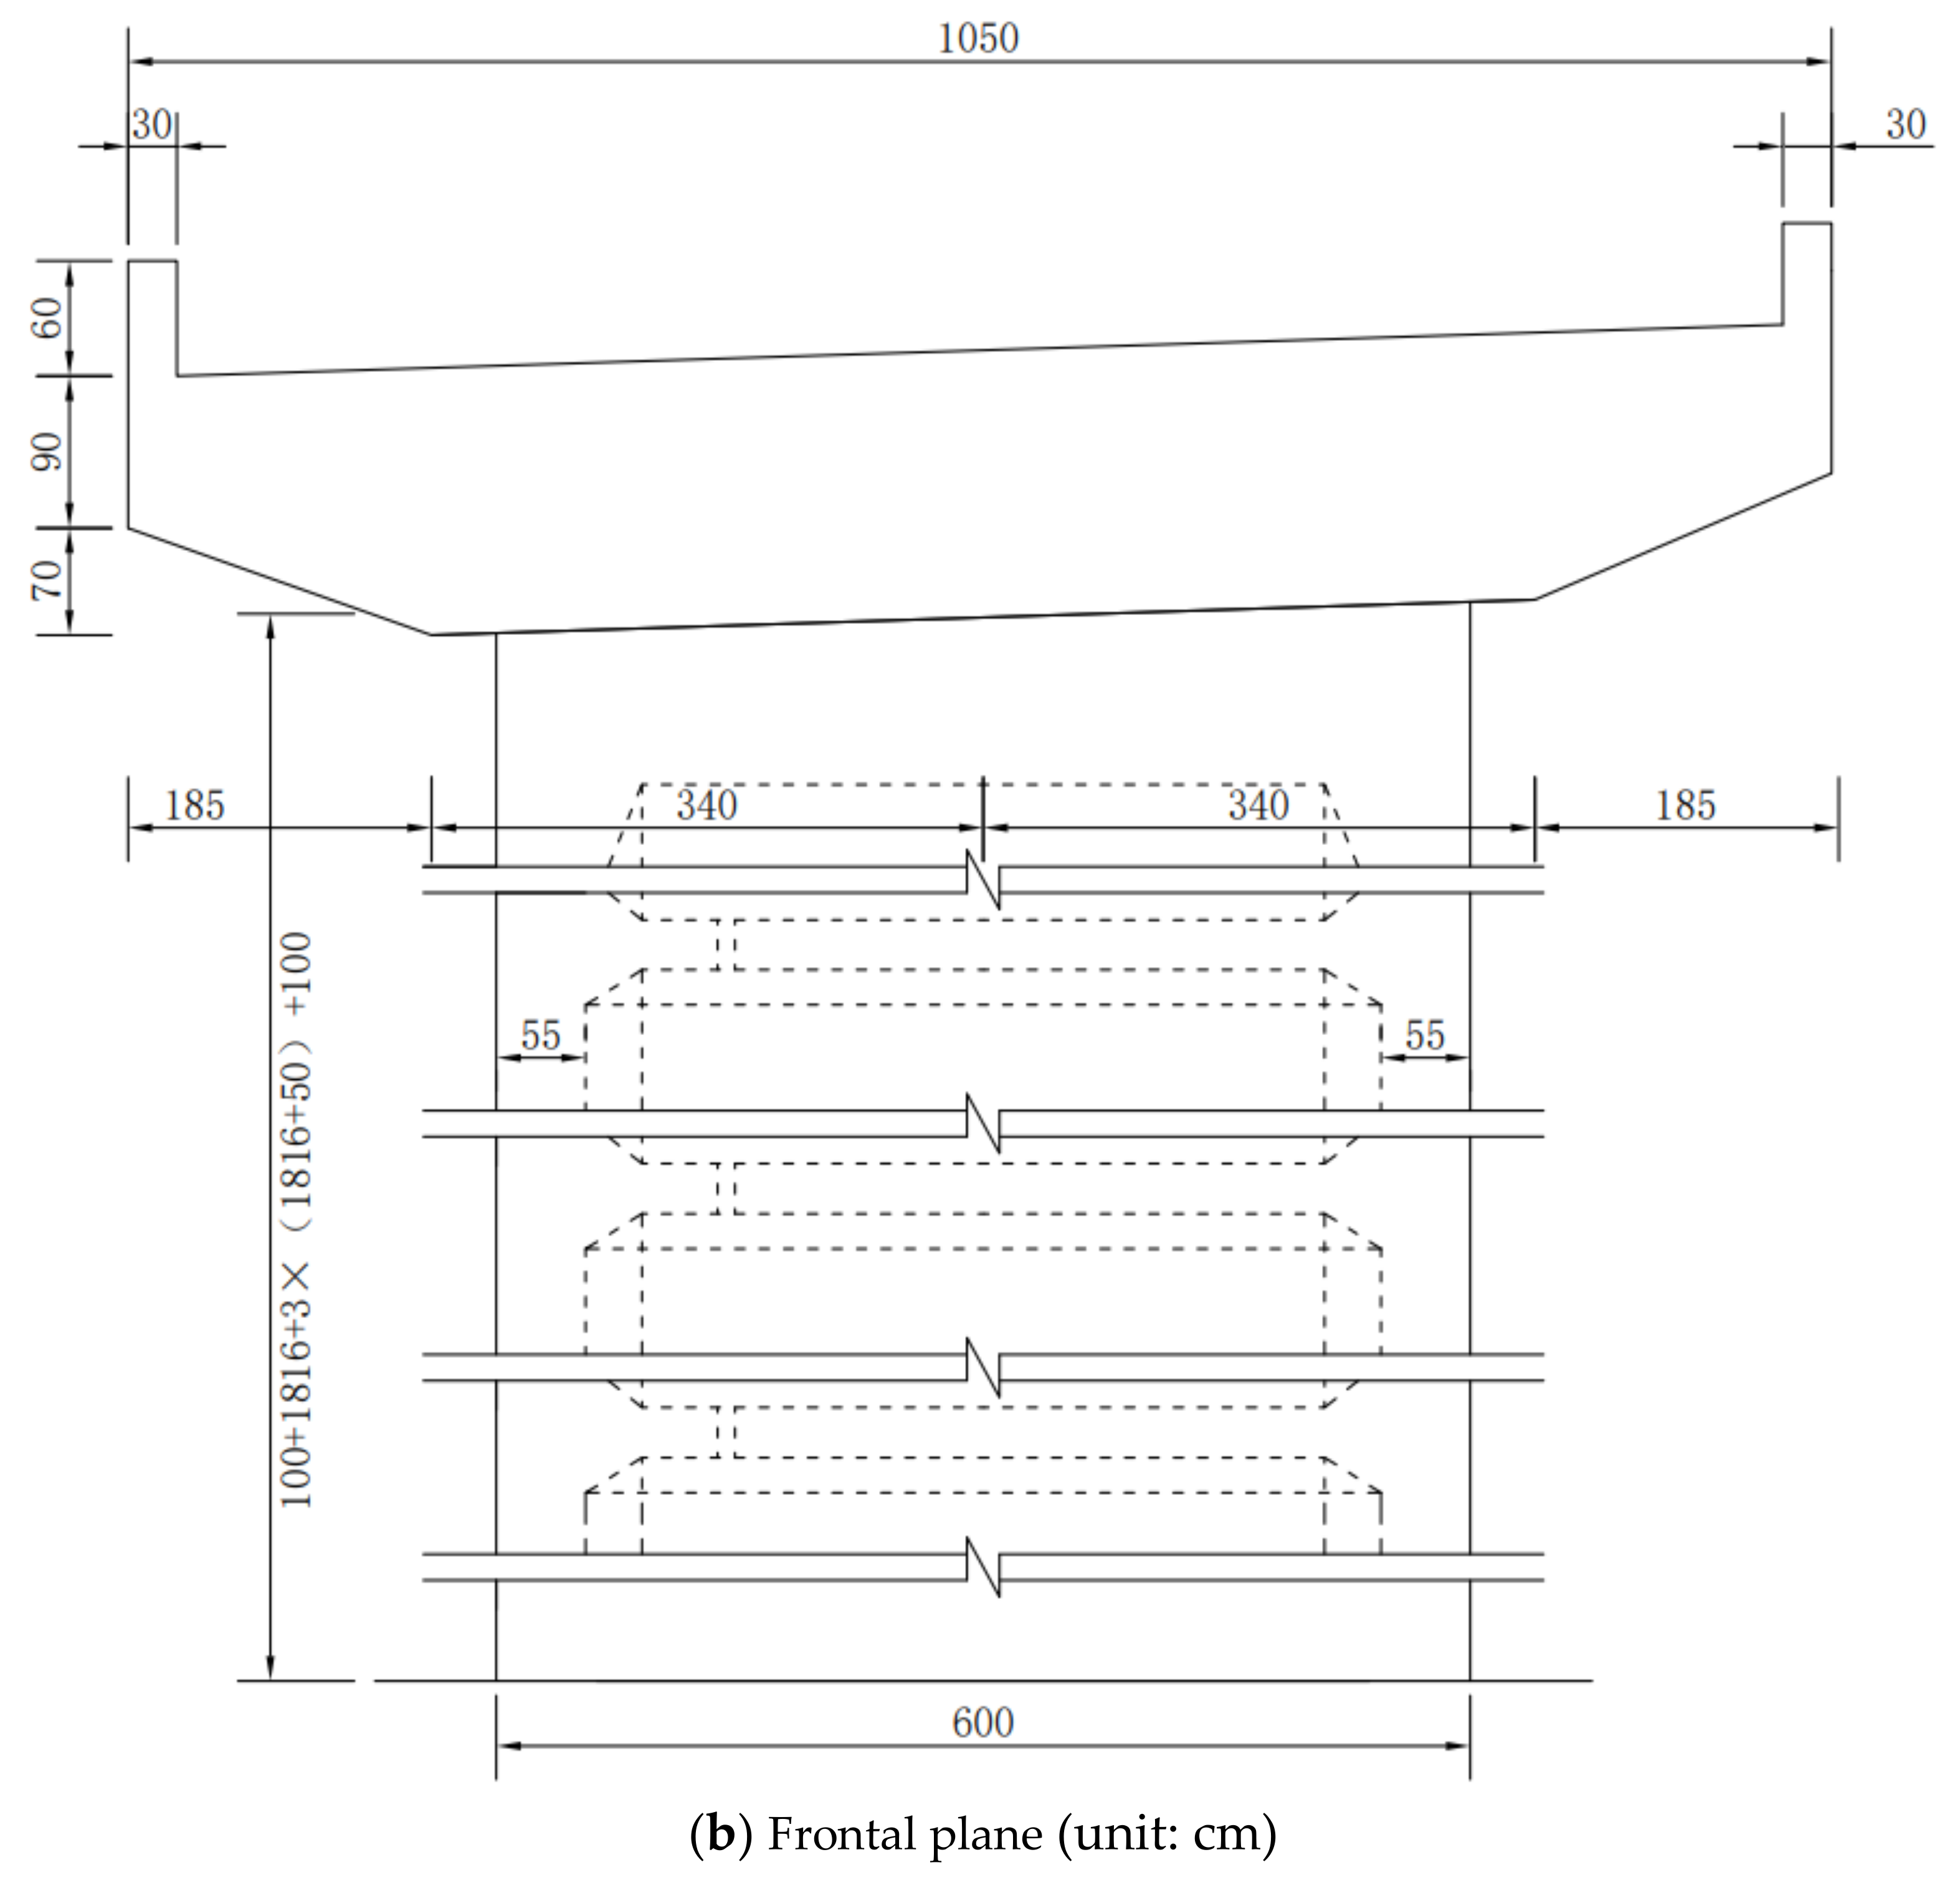
3.1. Engineering Profile

For the Case study, taking a newly constructed continuous beam bridge on a mountainous expressway of Guizhou Province in China with a span arrangement of (3 × 40 + 3 × 40 + 3 × 40) m as an example, and whose superstructure uses a prestressed concrete (post-tensioned) continuous beam. The substructure abutment is U-shaped, and the No. 4 and No. 6 piers have a rectangular solid pier construction. The No. 5 pier, however, is a rectangular thin-walled hollow pier, and the rest of the piers are double-limbed cylindrical solid piers whose abutments pile foundations.
The No. 5 pier is 75 m high, making it the highest pier of this bridge, and the areas 1 m from the upper and lower ends of the No. 5 pier are a solid section, with the others being thin-walled hollow equal sections. Each section size is 3 m (along the bridge direction) × 6 m (transverse bridge direction), and the wall thickness is 0.55 m, as shown in Figure 2. A diaphragm plate with a thickness of 0.5 m is also set every 18.15 m in the vertical direction of the pier A generalized construction diagram of this pier is shown in Figure 2.

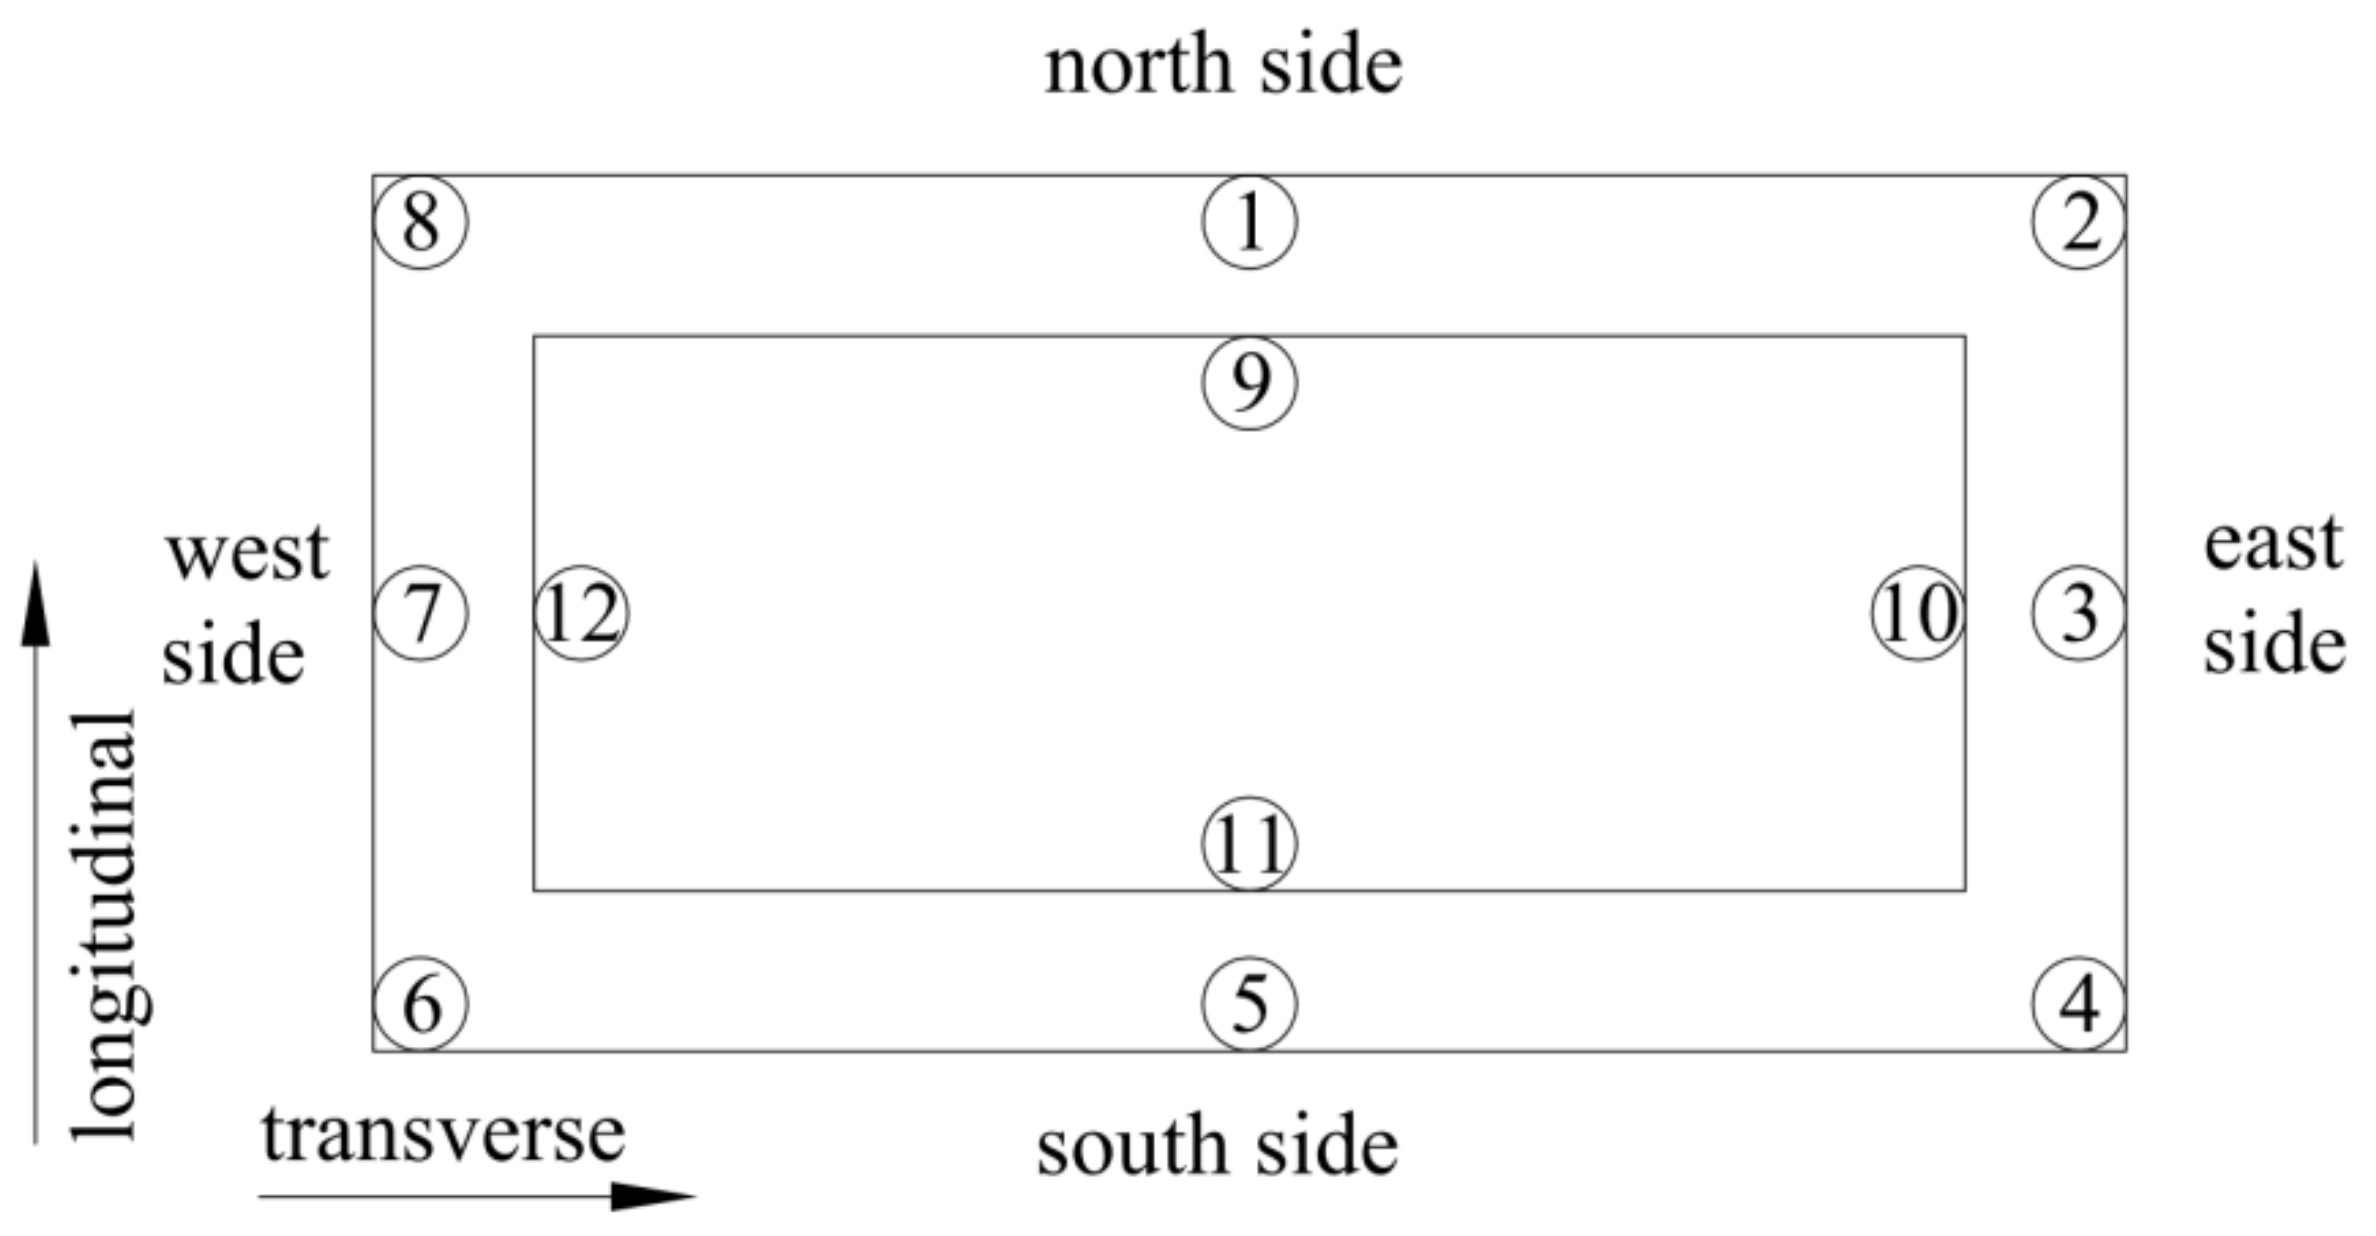
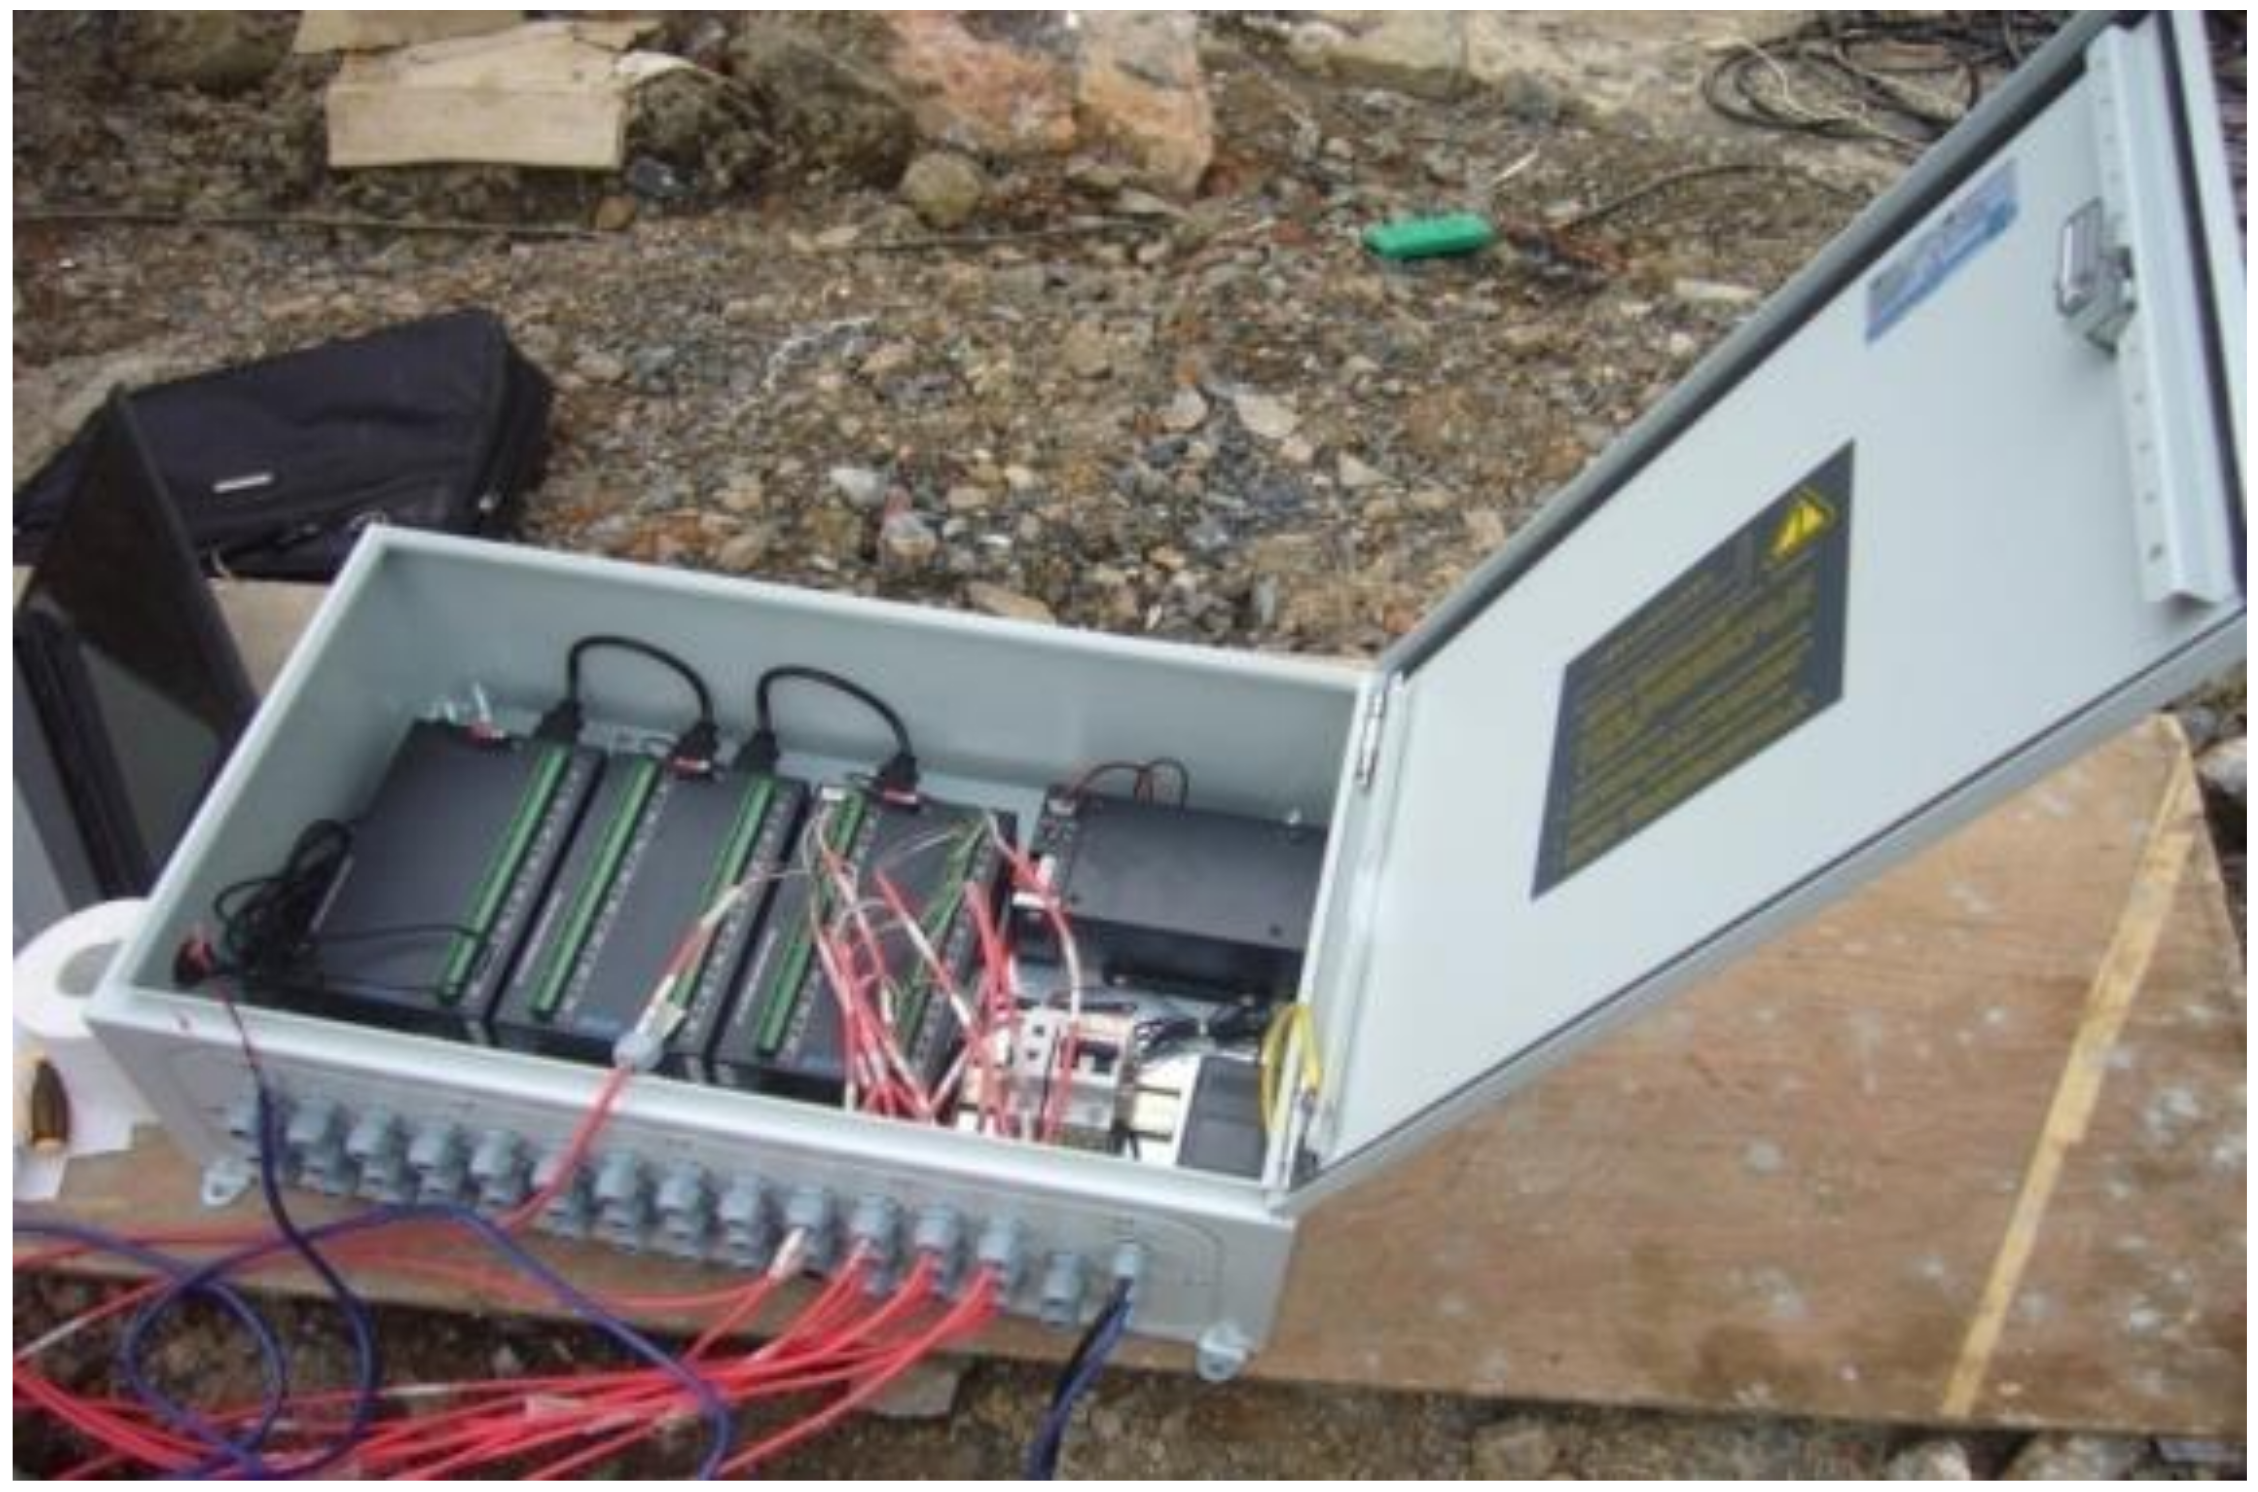
3.2. Temperature Monitoring Scheme

To analyze the sunlight temperature effect on the No. 5 pier, embedded thermometers were placed in its vertical 1/4, 1/2, and 3/4 sections. The layout scheme is shown in Figure 3. When pier construction height is low, the influence of sunlight temperature difference is small, so the thermometer measuring points were arranged starting from the vertical 1/4 section. Externally embedded thermometers were placed close to the outer side, and internally embedded thermometers were placed close to the inner side.
Figure 3 shows the layout of the measuring points at the vertical 1/4 section of the No. 5 pier, and the vertical 1/2 and 3/4 section measuring points were arranged in the same manner. The middle measuring point on the north side was the starting point, and clockwise from the outside to the inside, these were numbered 13 to 24 and 25 to 36, respectively. When installed, embedded thermometer is close to the inner or outer side of the pier, each thermometer was first fixed on the steel bar of the pier body, and then buried in the concrete after moisture and mechanical damage prevention steps were taken. In addition, a signal cable of embedded thermometer needed to be drawn out of the concrete’s surface.
The specific test instrument was an embedded thermometer (model: BGK-3700-0.2) provided by Geokon Instruments (Beijing) Co., Ltd. As shown in Figure 4, the core component of embedded thermometer adopts semiconductor thermistor sensor, and the measurement range was −30 °C ~ +70 °C, with a test accuracy of 0.2 °C. This instrument included a BGK-MICRO-40 automatic data acquisition instrument provided by Geokon Instruments (Beijing) Co., Ltd., and the supporting BGK-Logger software system was based on the WINDOWS working platform, which can read, save, and process the measurement data quickly and conveniently, as shown in Figure 5. The acquisition device also supported wireless transmission. The thermometer’s data signal was sent using BGK-187V3 professional cable transmission because this type of cable has superior waterproof performance, good data signal stability, and high precision.

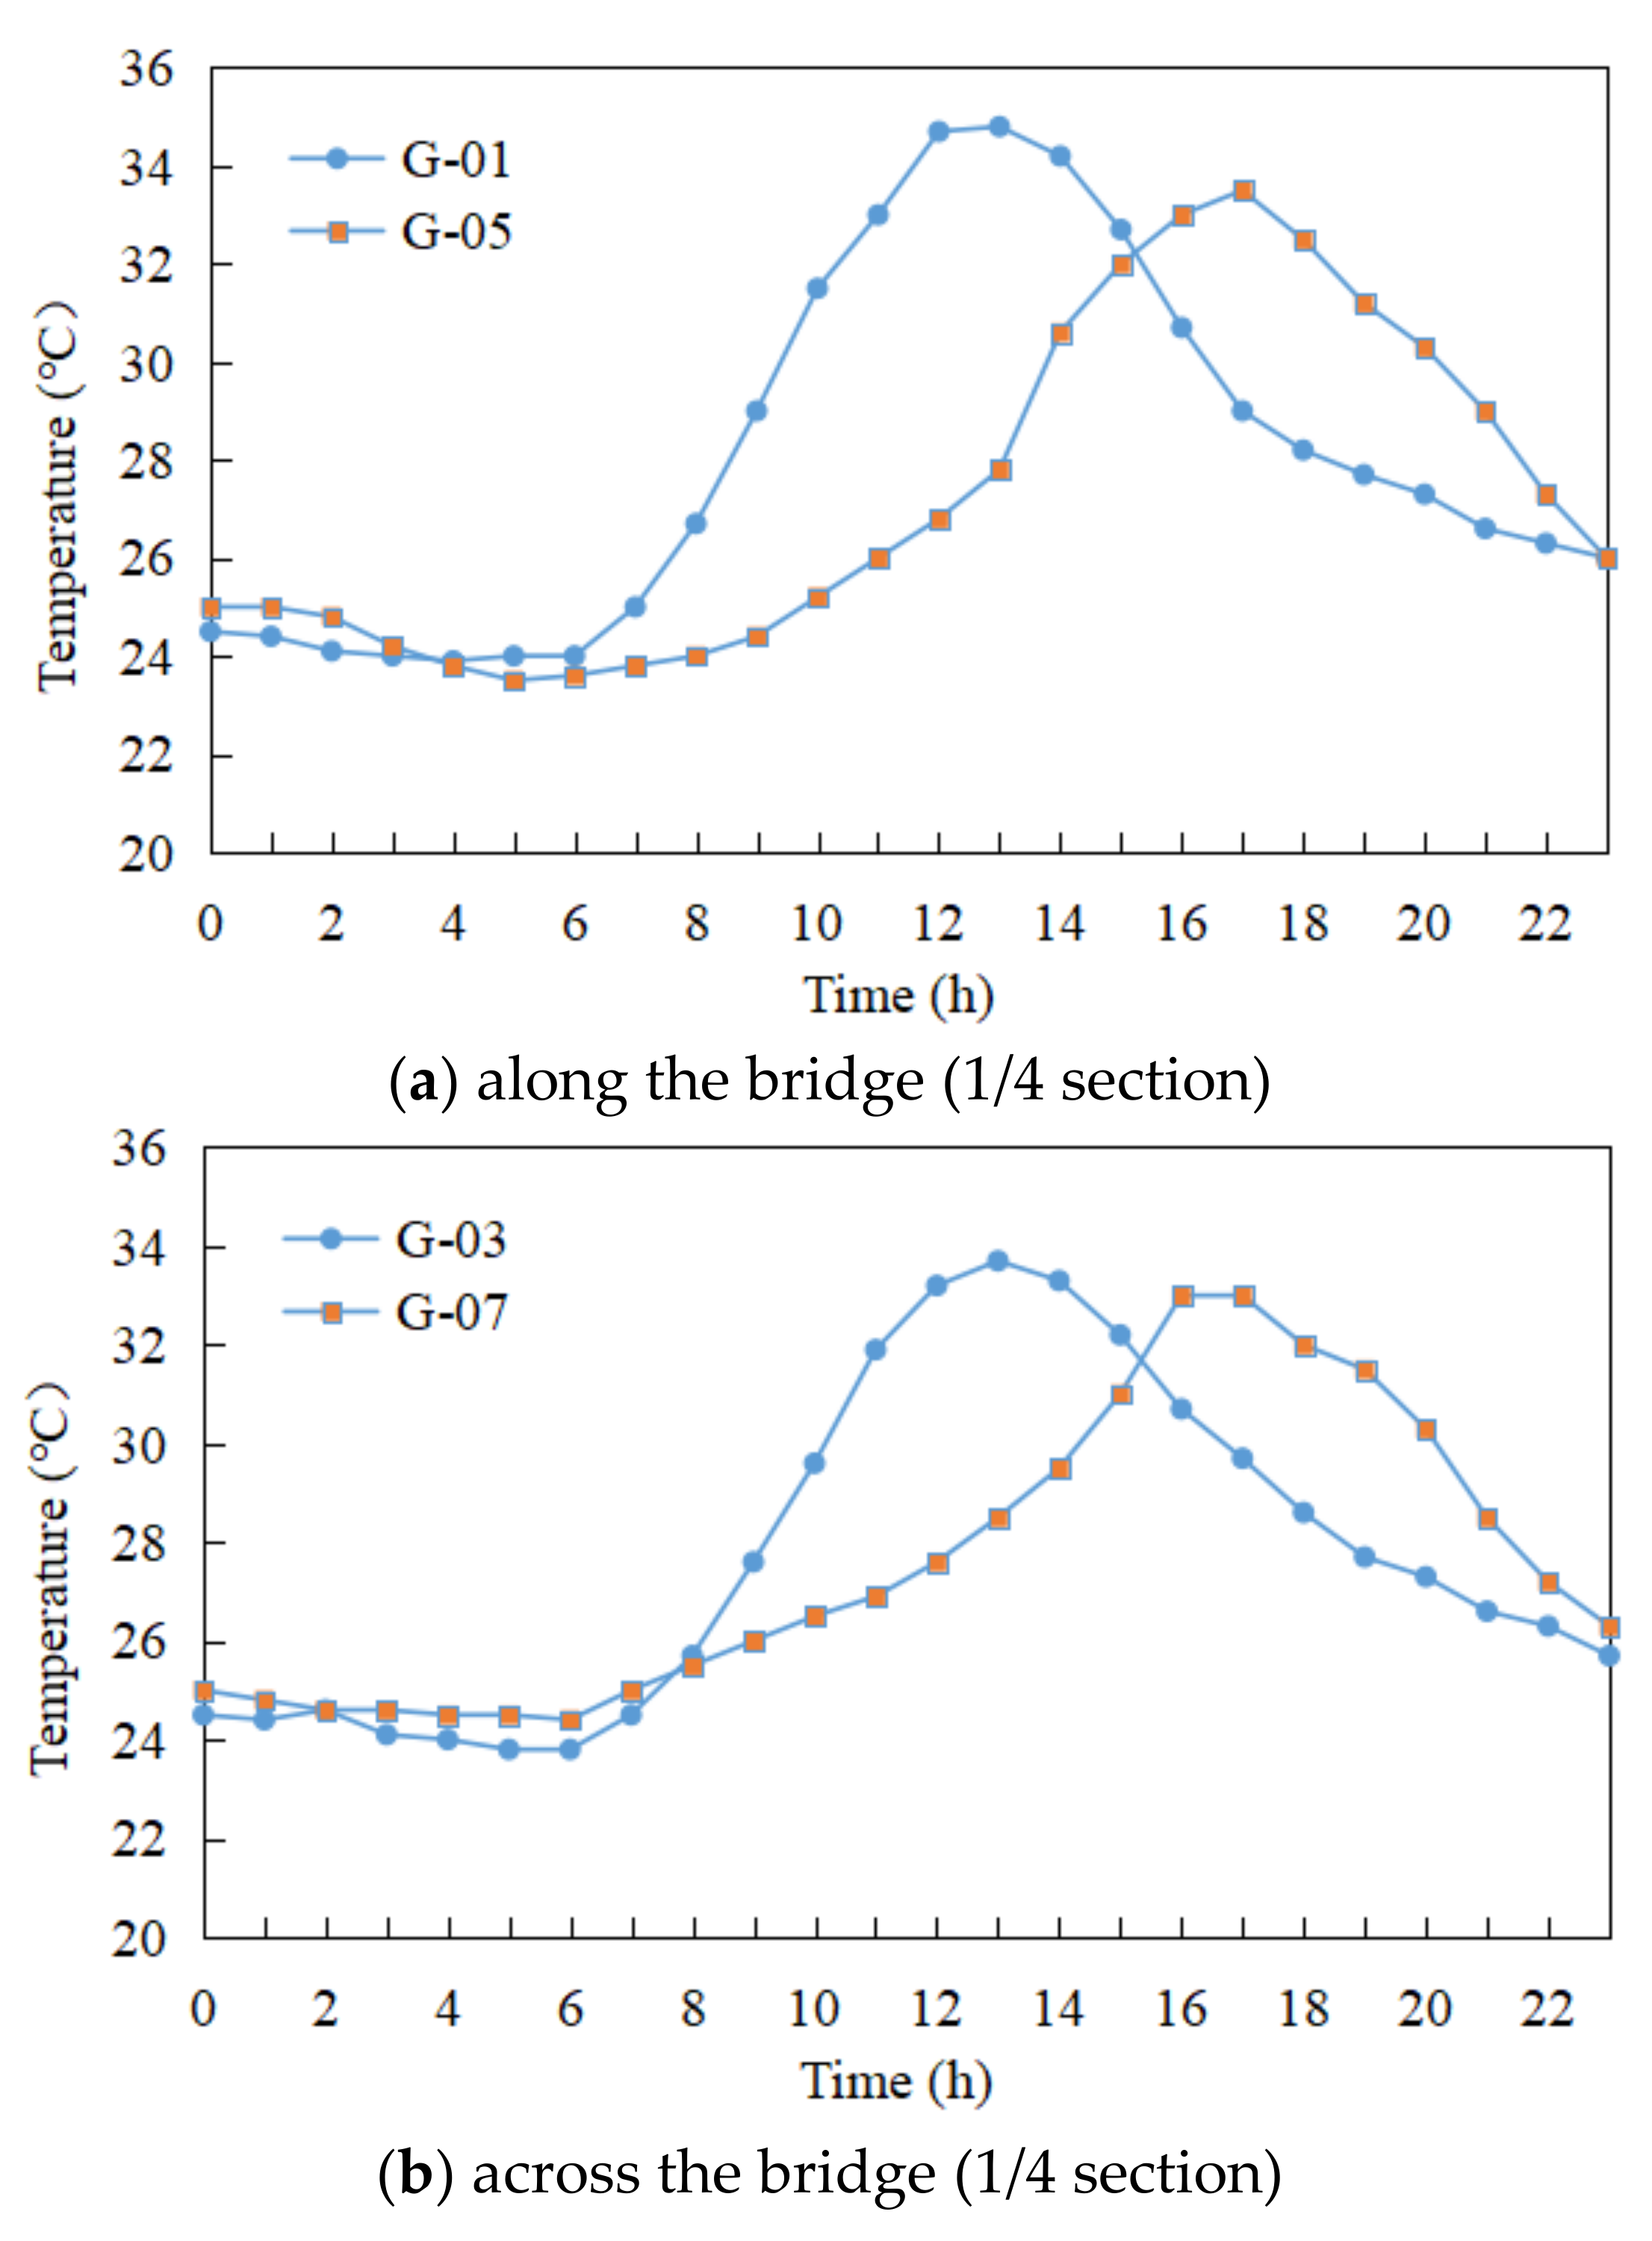
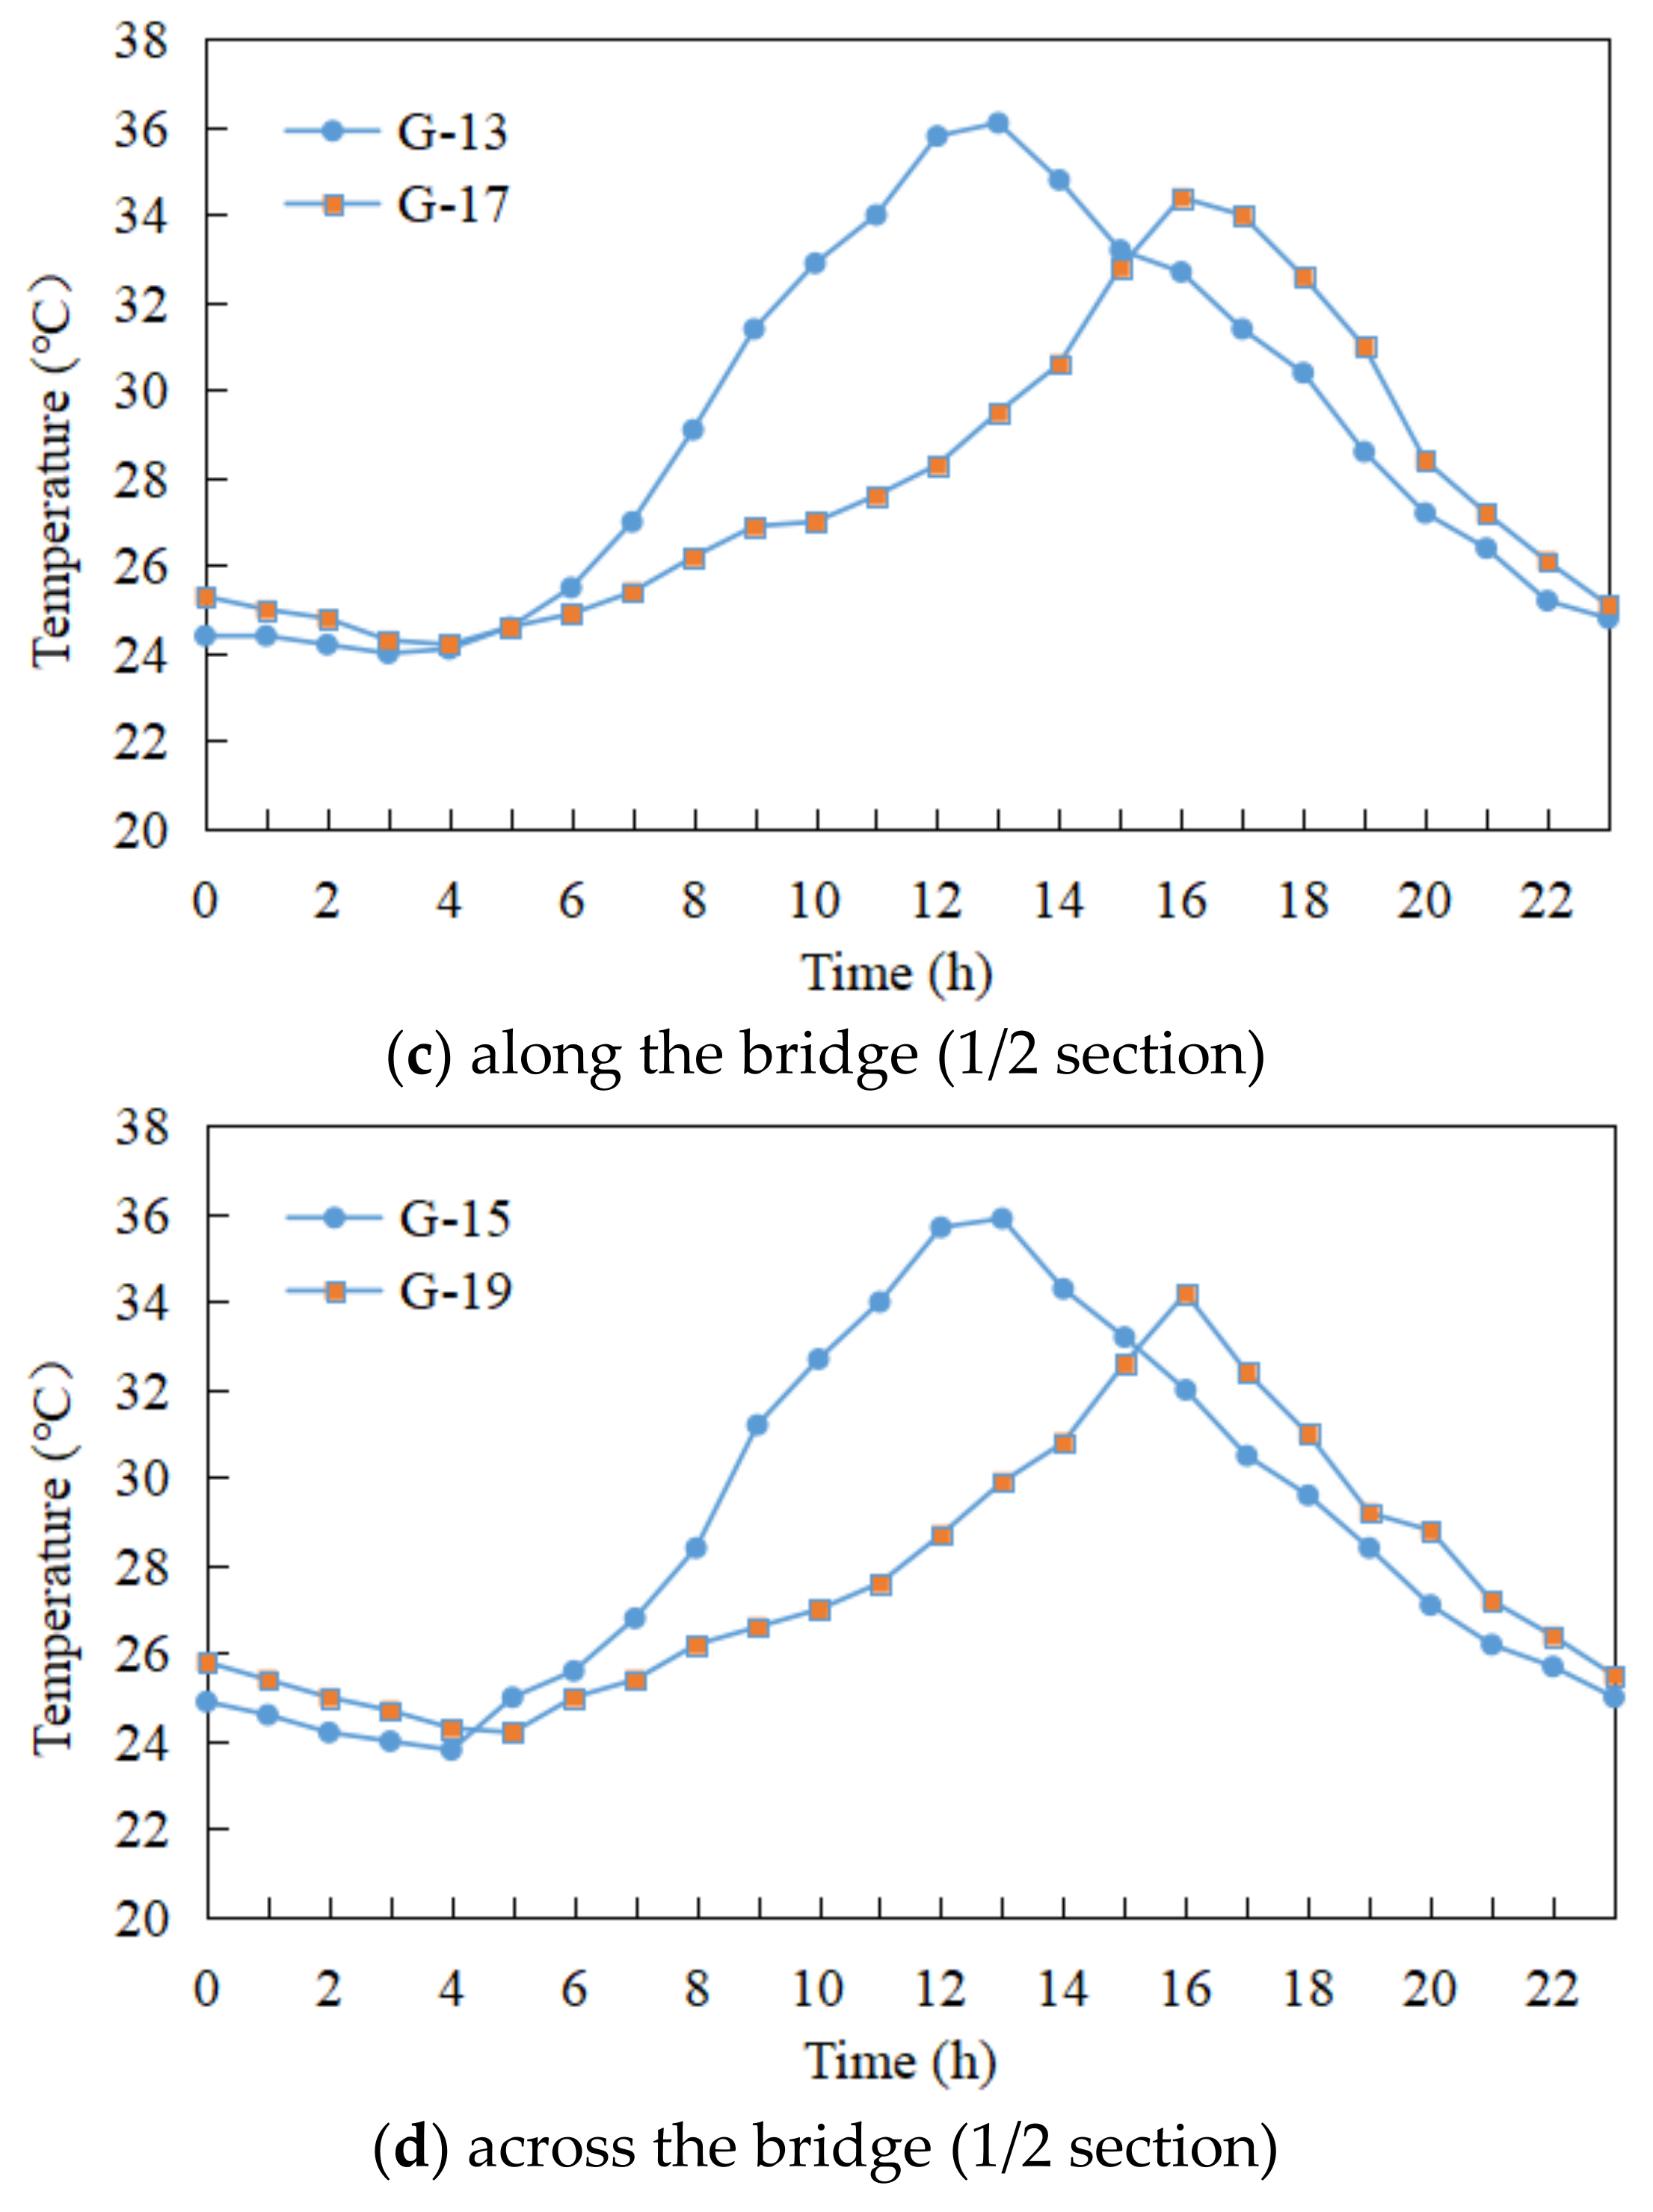
3.3. Temperature Field Analysis of the Pier Section

Nearly three months of on-site temperature testing from the time the thermometers were installed in May, 2019 until the construction of the piers was completed in July, 2019. During the hot summer months, a large amount of temperature data were collected. To select the appropriate calculation parameters for the sunlight temperature differences, the temperature field changes of the pier section on a sunny day in May, June, and July were selected for analysis: May 16 (when the pier had been constructed to the 1/2 cross-section), June 16 (when the pier had been constructed to the 3/4 cross-section), and July 15 (when the pier had been completed). The three selected time points all reflect the period immediately after the completion of pier construction and maintenance, and the temperature of these measuring points is influenced almost entirely by sunlight. Temperature changes at each measuring point on the vertical 1/4 section of the pier on May 16 are shown in Figure 6.
From the above figures, it was considered that the temperature changes at the measuring points at similar positions on the pier in the longitudinal and transverse directions (both positive and negative sides) were the same. From early morning to about 7 a.m., the temperature of each side measuring point cools. In the morning, the east side and the north side were located on the positive side, and the temperature of the measuring points increased rapidly, however. By 13:00, the highest temperatures were 29.2 and 29 °C, respectively, before these sides came under shadow and began to cool. The measuring points on the west side and the south side were located in shadow in the morning, and thus they were subject to a similar (the peak temperatures were both slightly lower than the other two sides) yet time-shifted cycle compared to the east and north sides. At about noon, the temperature difference between the two sides of the pier along the bridge and across the bridge reached their maxima, which were 6 °C (along the bridge) and 5 °C (across the bridge), respectively. On June 16, the pier had been constructed to the vertical 3/4 section. The temperature changes in each measuring point of the vertical 1/4 section and 1/2 section of the pier on June 16 are listed below.
As shown in Figure 7, the temperature changes at the measuring points at the 1/4 cross-section and the 1/2 cross-section of the pier were the same at similar positions both along and across the bridge (both positive and negative sides). However, the maximum temperatures at each site in Figure 7 were higher than that in Figure 6 because the average daily temperature in June was higher than in May. In June, the sunlight time became longer as well. Starting at 6 a.m., the sides of the pier were already in a state of warming. The temperature rose until noon, at which point the highest temperature was reached, and the temperature at the measuring points began to trend downward. At about noon on the same day, the temperature differences between the two sides of the 1/2 section in the longitudinal and transverse directions were the largest, at 7.5 °C and 7 °C, respectively. On July 15, the pier had been completed, the temperature changes in each measuring point of the vertical 1/4 section, 1/2 section, and 3/4 section of the pier on July 15 are listed below. For brevity, only the temperature changes in along the bridge on the vertical 1/4 section and 1/2 section are listed.
Figure 8 shows that the temperature changes at the measuring points at similar positions of each section of the pier along both the bridge direction and the transverse bridge direction (both on the positive and negative side) were roughly the similar. In the morning, the temperature of the measuring point on the positive side of the 3/4 section rose rapidly and reached its highest temperature of 40.5 °C (north side) and 41 °C (east side) at 12:00 and 13:00, respectively. In the afternoon, the two sides came under shade, and the temperature of the measuring point cooled until 0:00 at night. The temperature of the 3/4 section of the pier was higher than the other sections as well, at up to 41 °C, but this was mainly due to the fact that July had much hotter weather than June or May as well as an earlier sunrise and higher sunlight intensity. Moreover, the higher the height of the pier section, the longer the sunlight radiation time. At about 12:00, the temperature difference between the two sides of the pier in both the longitudinal and transverse directions reached their maxima, which were 8.5 °C and 7 °C, respectively.

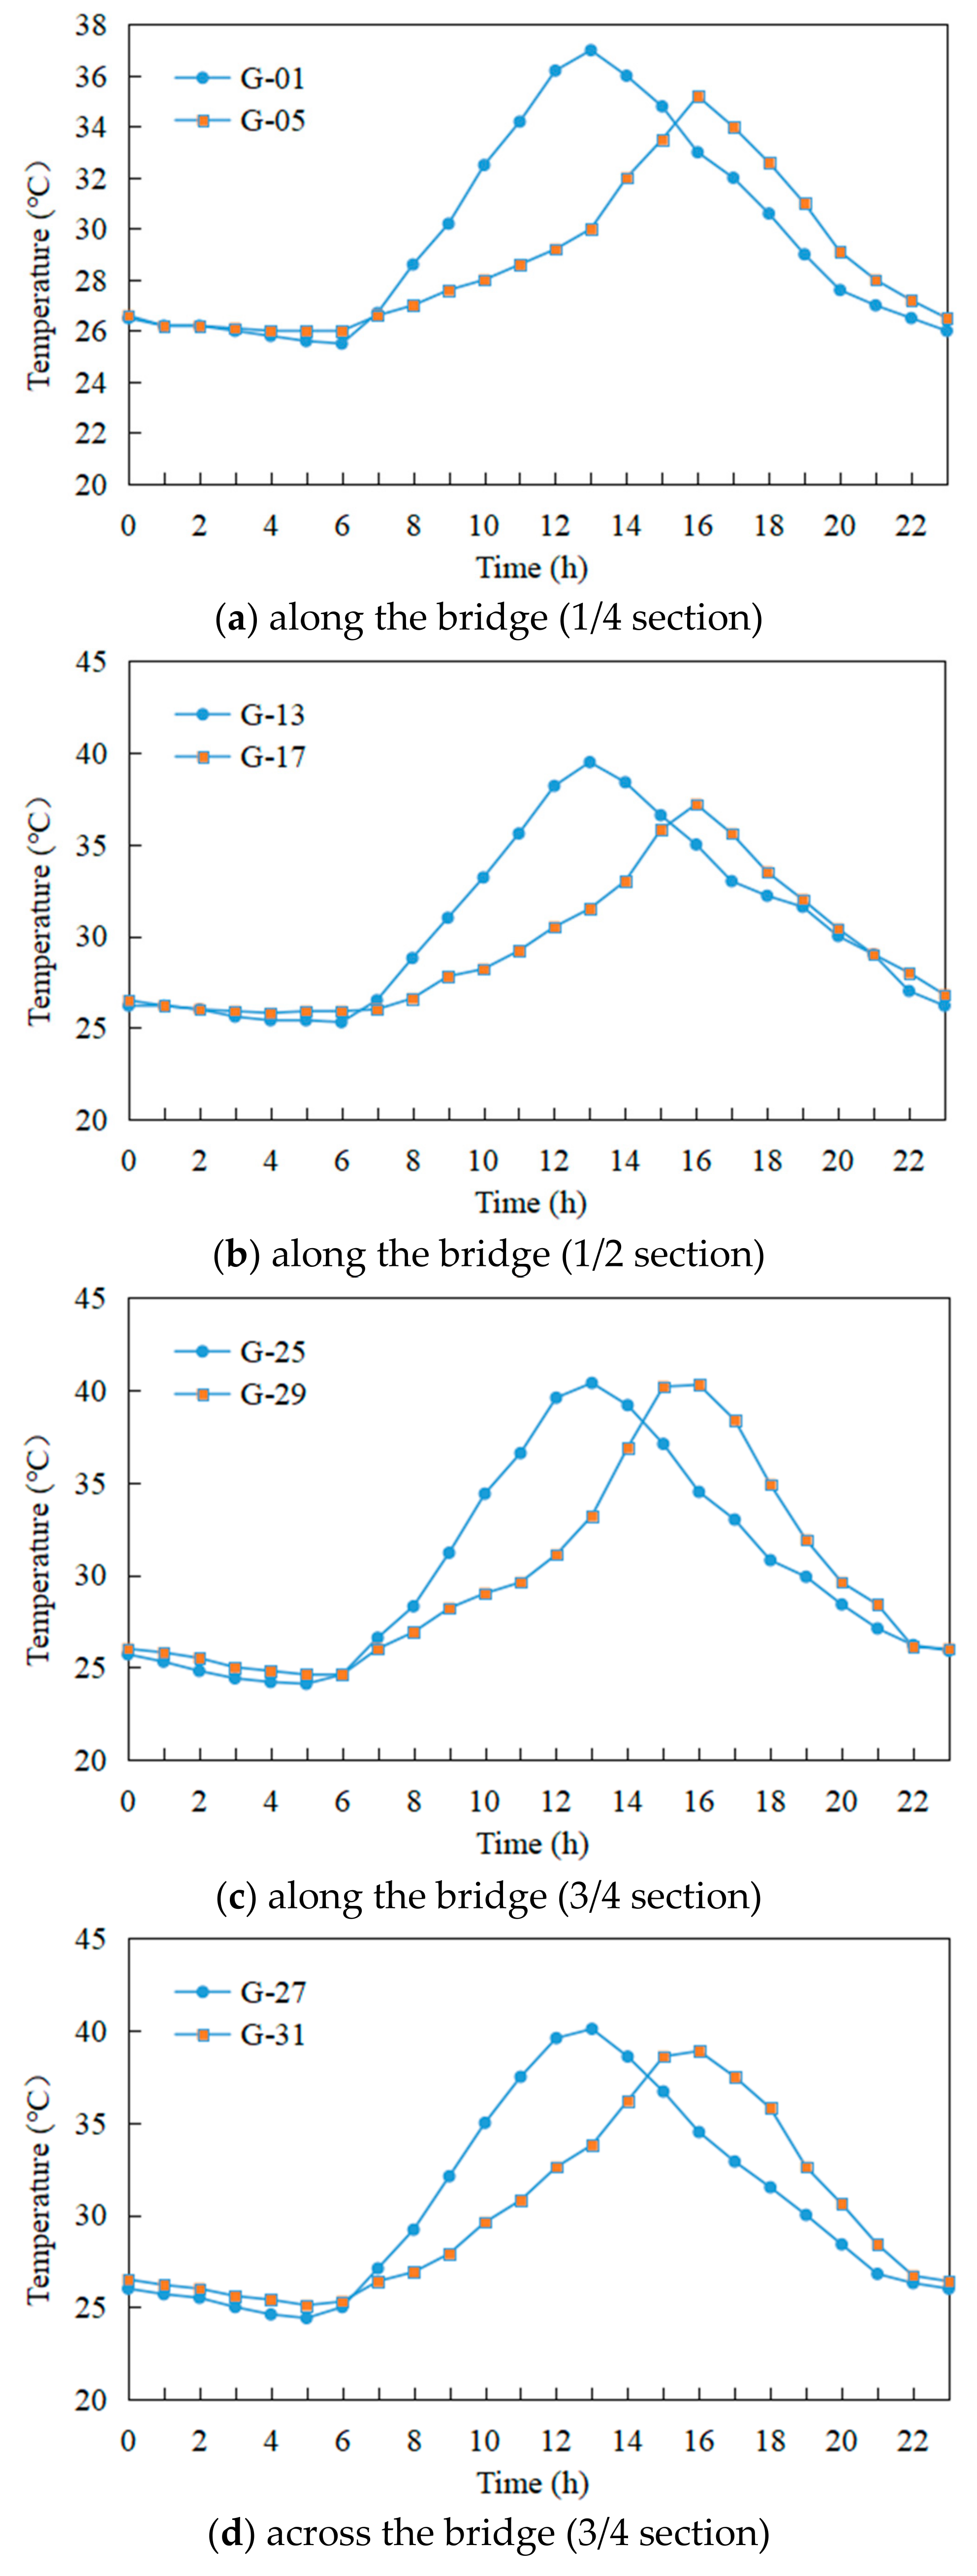
3.4. Selection of Calculation Conditions for Sunlight Temperature Differences

Since the transverse moment of inertia of the thin-walled hollow pier is larger than that along the bridge, the temperature difference along the bridge is more likely to cause linear deviation of the pier. Thus, the temperature condition of the maximum temperature difference along the bridge is selected for calculation.
Condition 1: On May 16, the sunny, maximum temperature difference between the front and back sides occurred at noon along the vertical 1/4 section of the pier. At this time, the external temperature of the north side along the bridge was 29 °C, the external temperature of the south side was 23 °C, the temperature difference was 6 °C, and the No. 5 pier of the bridge had been constructed to the vertical 1/2 section height. As shown in Table 1.
Condition 2: On June 16, the sunny, maximum temperature difference between the front and back sides again occurred at noon along the vertical 1/2 section of the pier. At this time, the external temperature of the north side along the bridge was 34.5 °C, the external temperature of the south side was 27 °C, the temperature difference was 7.5 °C, and the No. 5 pier of the bridge had been constructed to the vertical 3/4 section height. The maximum temperature difference conditions of 1/4 section and 1/2 section along the bridge are shown in Table 1.
Condition 3: On July 15, the sunny, maximum temperature difference between the front and back sides also occurred at noon along the vertical 3/4 section of the pier. At this time, the external temperature of the north side along the bridge was 40.5 °C, the external temperature of the south side was 32 °C, the temperature difference was 8.5 °C, and the No. 5 pier of the bridge had been completed. The maximum temperature difference conditions of each section along the bridge are shown in Table 1.
Since the No. 5 pier is located in a valley, the wind speed was small, and the duration of exposure to direct sunlight of each part of the pier is different. Thus, the lower the pier section height, the smaller the temperature difference.

4. Basic Theory and Finite Element Methods in Temperature Effect Research

4.1. Basic Theory of Temperature Effect Research

Beginning with a homogeneous isotropic material, a micro-element is shown in Figure 9.
In the Figure 9, dx, dy, and dz are the length of the three coordinate directions of the micro-element; qx is the heat flow into the micro-element, qx + dx is the heat flux of the derived micro-element.
According to the law of conservation of energy to analyze the thermal energy balance of the micro-element. The difference between heat entering and leaving the micro-element for a change dt in time is equal to the heat of the heat source and the thermodynamic energy, as shown in Figure 9. The heat conduction equation can be expressed as [42]:
T t = λ 2 T x 2 + 2 T y 2 + 2 T z 2 + θ t
where λ is the thermal conductivity coefficient (m2/h); θ is adiabatic heating (°C); T is the temperature (°C); and t is time (h).
If there is no internal heat source, the above formula becomes
T t = λ 2 T x 2 + 2 T y 2 + 2 T z 2
When T t = 0 , there is a steady temperature field, and the field is unsteady otherwise. In addition, there exists a unique solution to the above equation for every set of initial conditions for the temperature problem.

4.2. Finite Element Methods

In ANSYS thermal analysis software, five kinds of thermal loads (boundary conditions) can be directly applied to solid or element models, namely constant temperature, heat flux, convection, and heat generation rate. There are three main means of heat exchange between bridge piers and the external environment: solar radiation, radiation heat transfer, and convection heat transfer. Compared to solar radiation and convection heat transfer, radiation heat transfer has little effect on the temperature distribution of the structure and can be ignored. Thus, only the temperature effect caused by solar radiation and convective heat transfer are analyzed, so that the final thermal load applied to the boundary nodes of the pier finite element model is the combination of the external comprehensive temperature and the comprehensive heat transfer coefficient [42]. The comprehensive temperature is the sum of air temperature and solar radiation equivalent temperature. it can be calculated as follows:
T s a = T α + a t I / h
where T s a is the combined temperature (°C); T α is the measured external temperature (°C) of the bridge pier; I is the solar radiation intensity (W/m2), (refer to the Chinese national standard Specifications for design of heating ventilation and air conditioning for details [43]); h is the comprehensive heat exchange coefficient (W/(m2·°C)), which is the sum of the convective heat exchange coefficient h c and radiative heat exchange coefficient h r ; and a t is the absorption rate, generally taken to be 0.65 [37]. Since the heat radiation exchange coefficient is negligible compared to the convective heat exchange coefficient, the overall heat exchange coefficient can be taken as the convective heat transfer coefficient hc, which is given by: hc = 5.6 + 4.0 v, where v is wind speed (m/s).

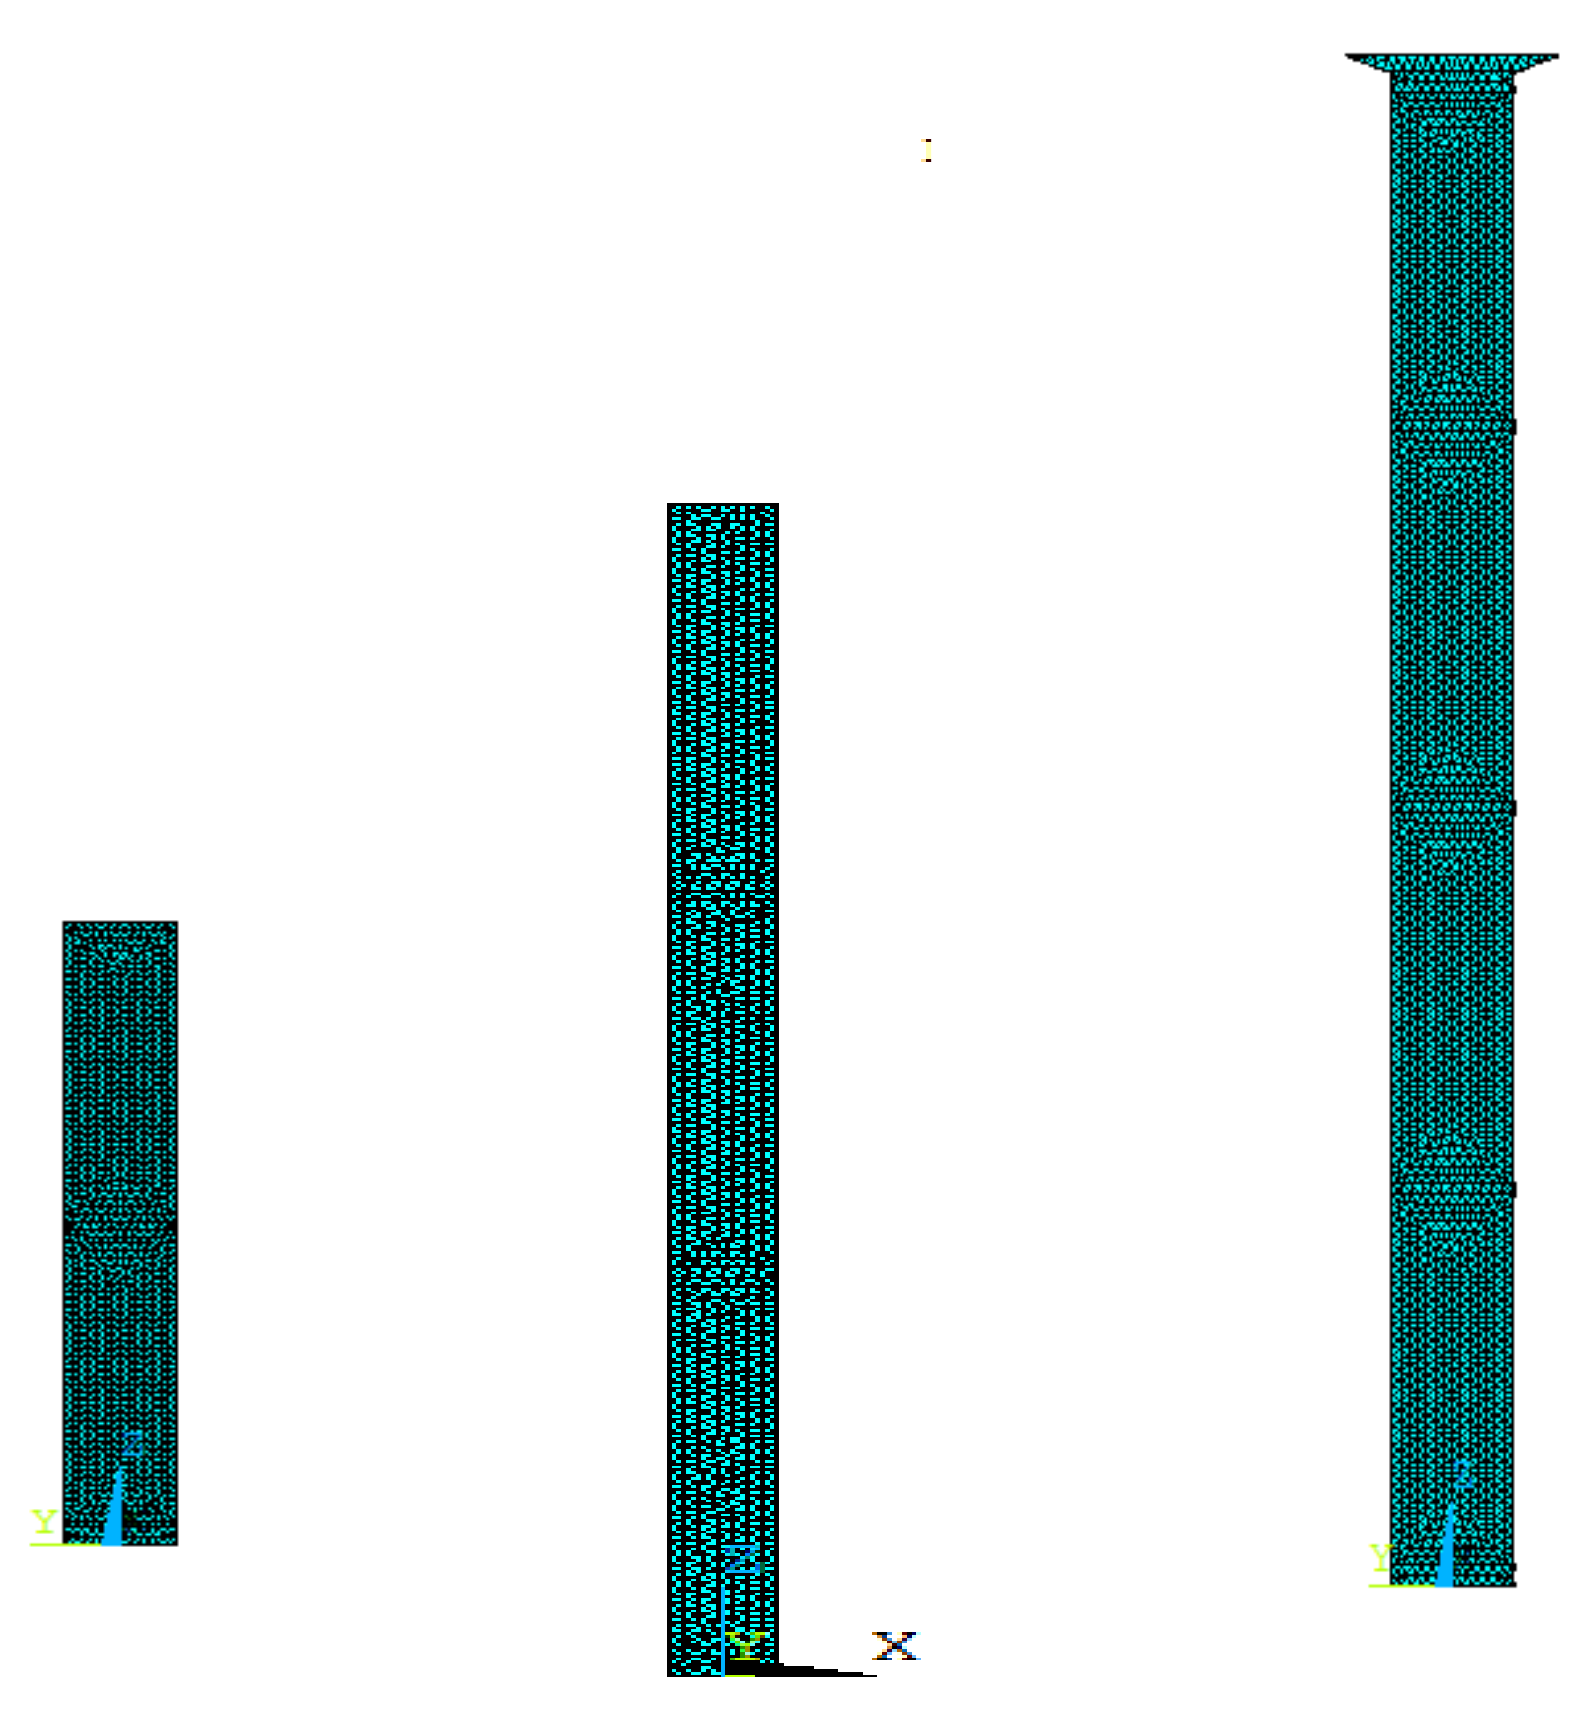
4.3. A finite Element Model of the No. 5 Pier

Both the three-dimensional solid finite element method and the space bar finite element method can be used in the finite element analysis of the displacement of the pier top under the action of sunlight temperature difference of the No. 5 pier. The space bar finite element method is also called the space truss displacement method and is suitable for the calculation of grid structures. Although it is simple to model and fast to calculate, the error is slightly larger than that of the former because the model is not as fine as the three-dimensional solid finite element model [44]. For this reason, the more accurate solid finite element models are elected to study the pier according to theoretical construct.
First, the finite element analysis models of bridge piers under three working conditions were established by ANSYS finite element analysis software: finite element models of vertical 1/2 section height, vertical 3/4 section height, and bridge pier construction completion. The temperature field unit of the ANSYS finite element model was the SOLID87 three-dimensional solid thermal analysis unit, and the structural field unit was the SOLID187 three-dimensional solid structural analysis unit. When the thermal coupling analysis of the temperature field was carried out, the temperature load could only be applied to the thermal analysis unit SOLID87. After thermal analysis, conversion between the thermal unit SOLID87 and the structural unit SOLID187 was achieved through ANSYS interface operations and command streams in order to apply the structural stress load generated by thermal analysis and then complete the thermal coupling analysis of the structural temperature field. The three ANSYS finite element models of the No. 5 pier are shown in Figure 10.

5. Comparative Analysis of Algorithm Results

According to the measured meteorological data during the construction of the No. 5 pier, the average wind speed of the bridge site was 2.0 m/s. Measurement of the average wind speed is needed to calculate the comprehensive heat transfer coefficient. the reference temperature was set to 0 °C according to the relevant literature [45] in order to facilitate the application of temperature load in the ANSYS calculations. The deviation of the pier along the bridge caused by the sunlight temperature difference was more obvious than in any other direction, so the deviation of the pier top along the bridge in this direction is selected for calculation and analysis.

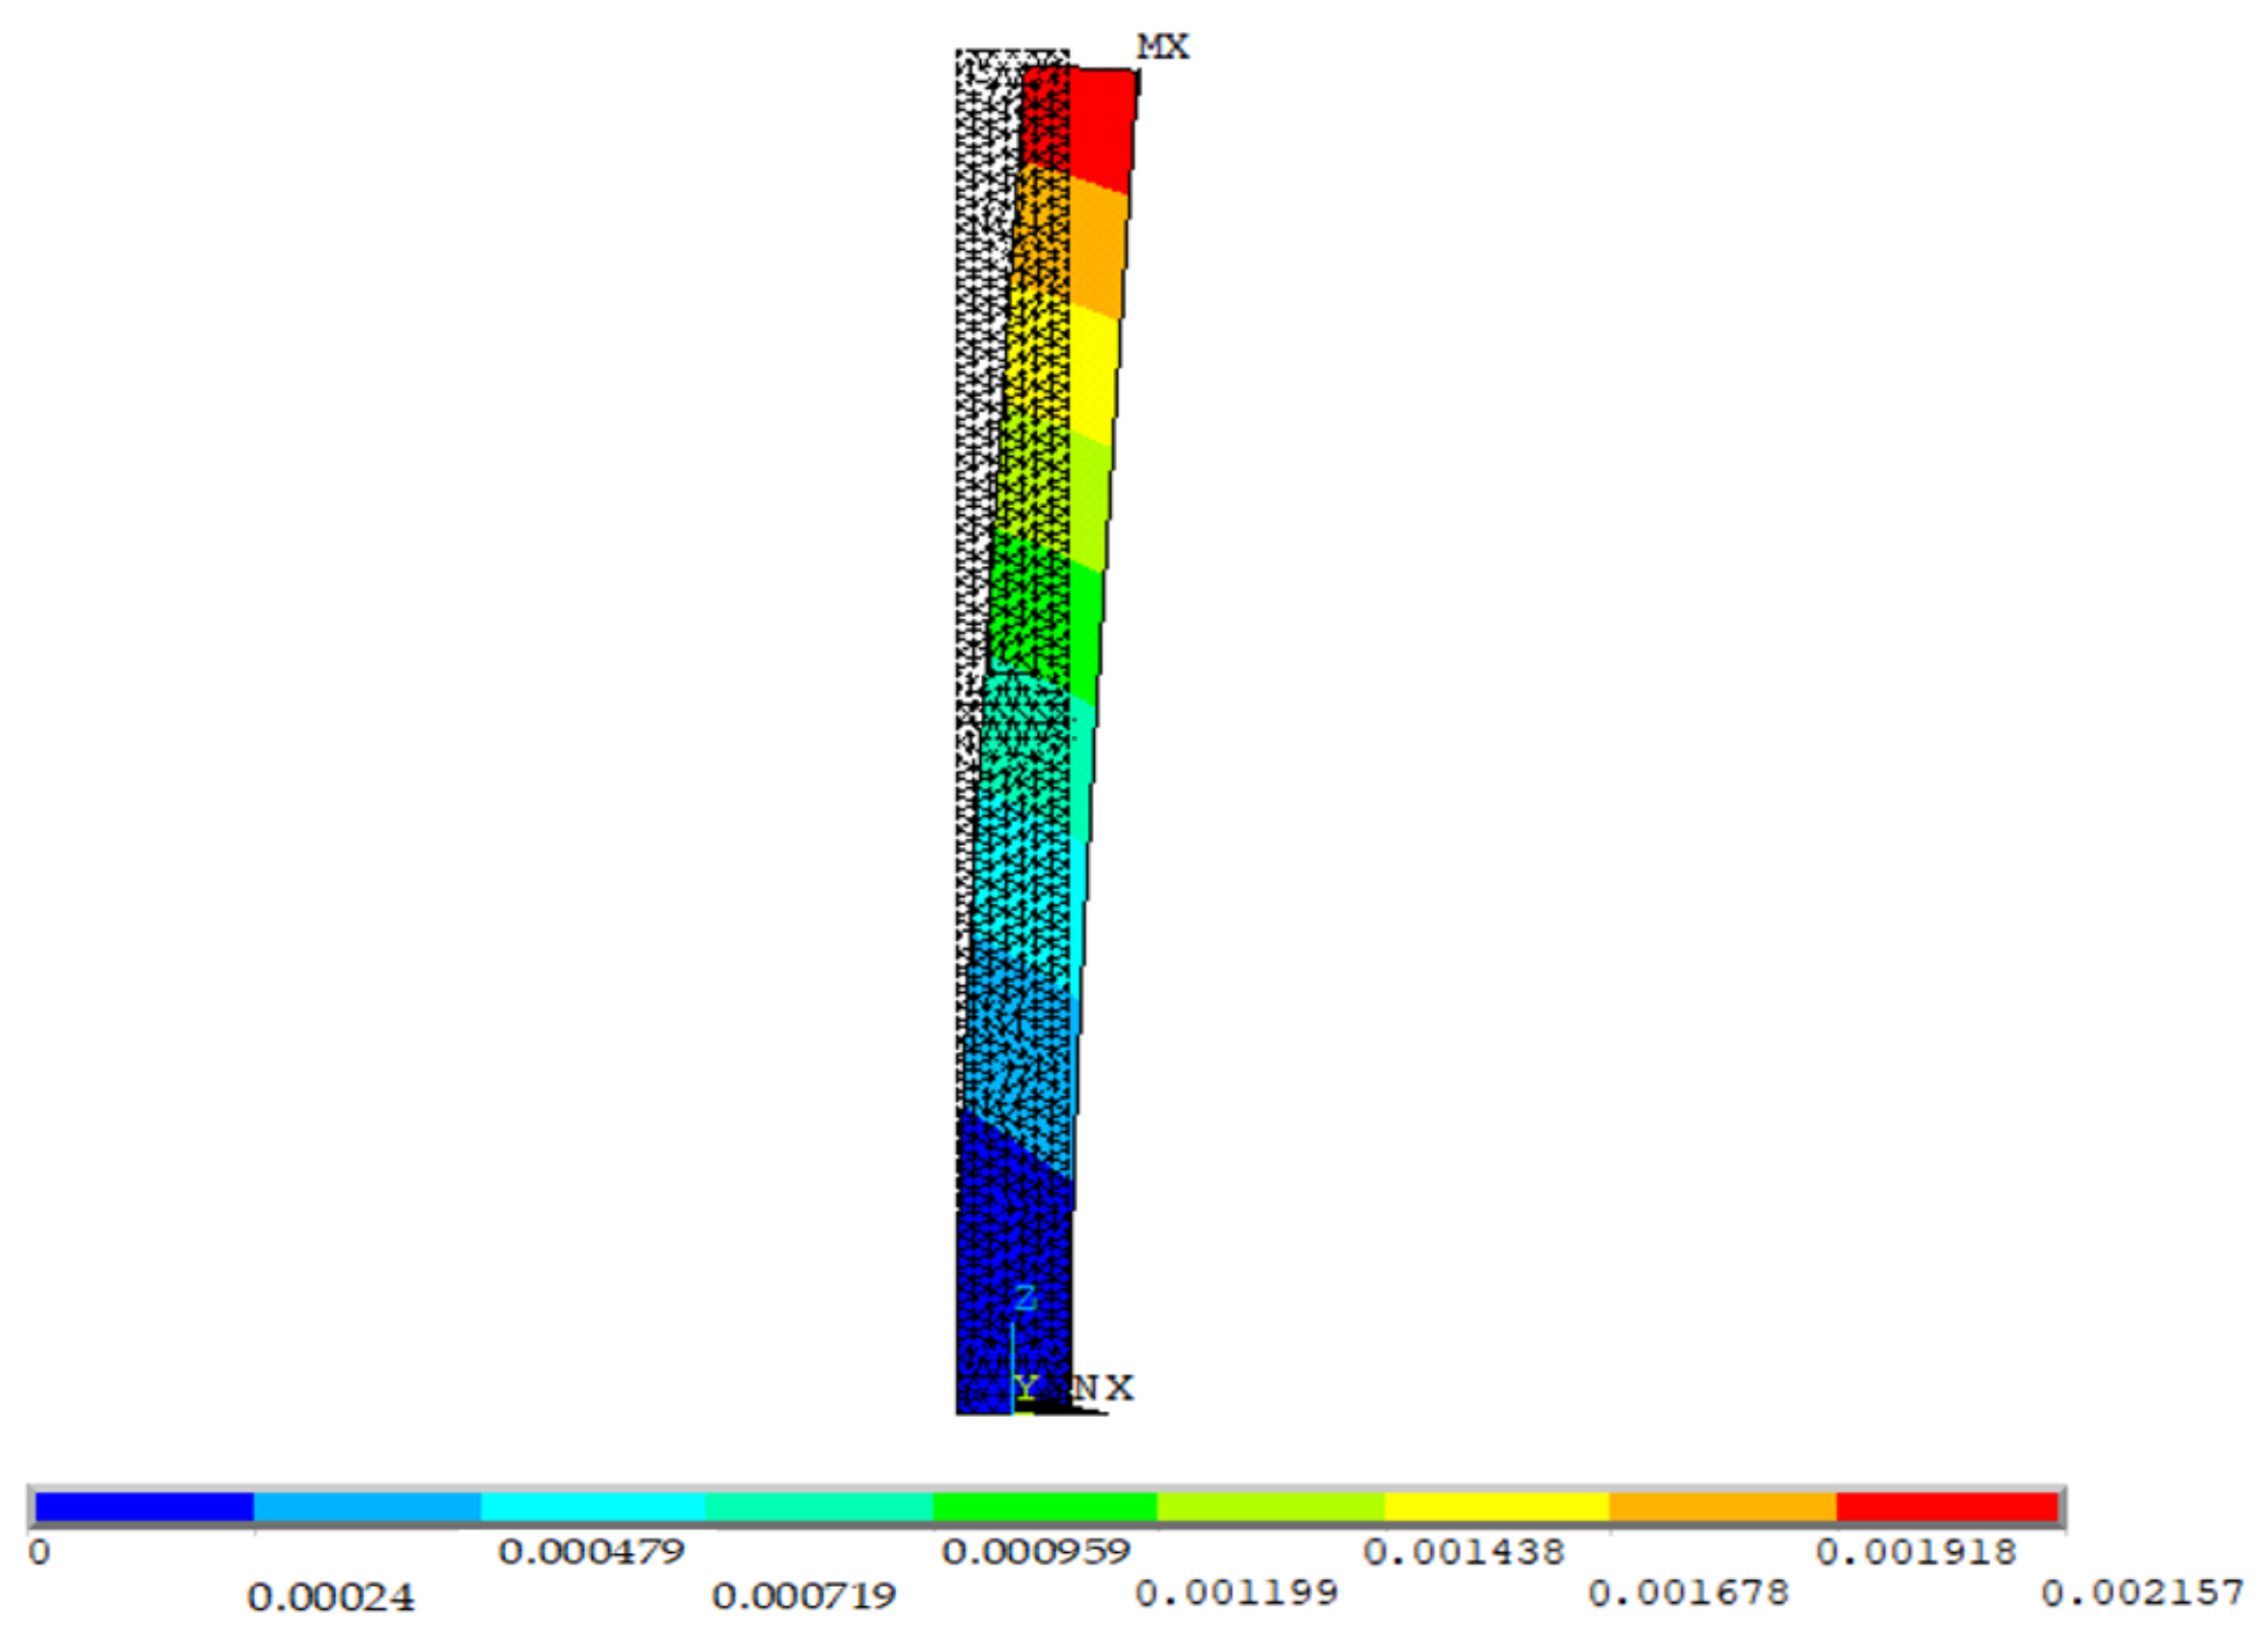
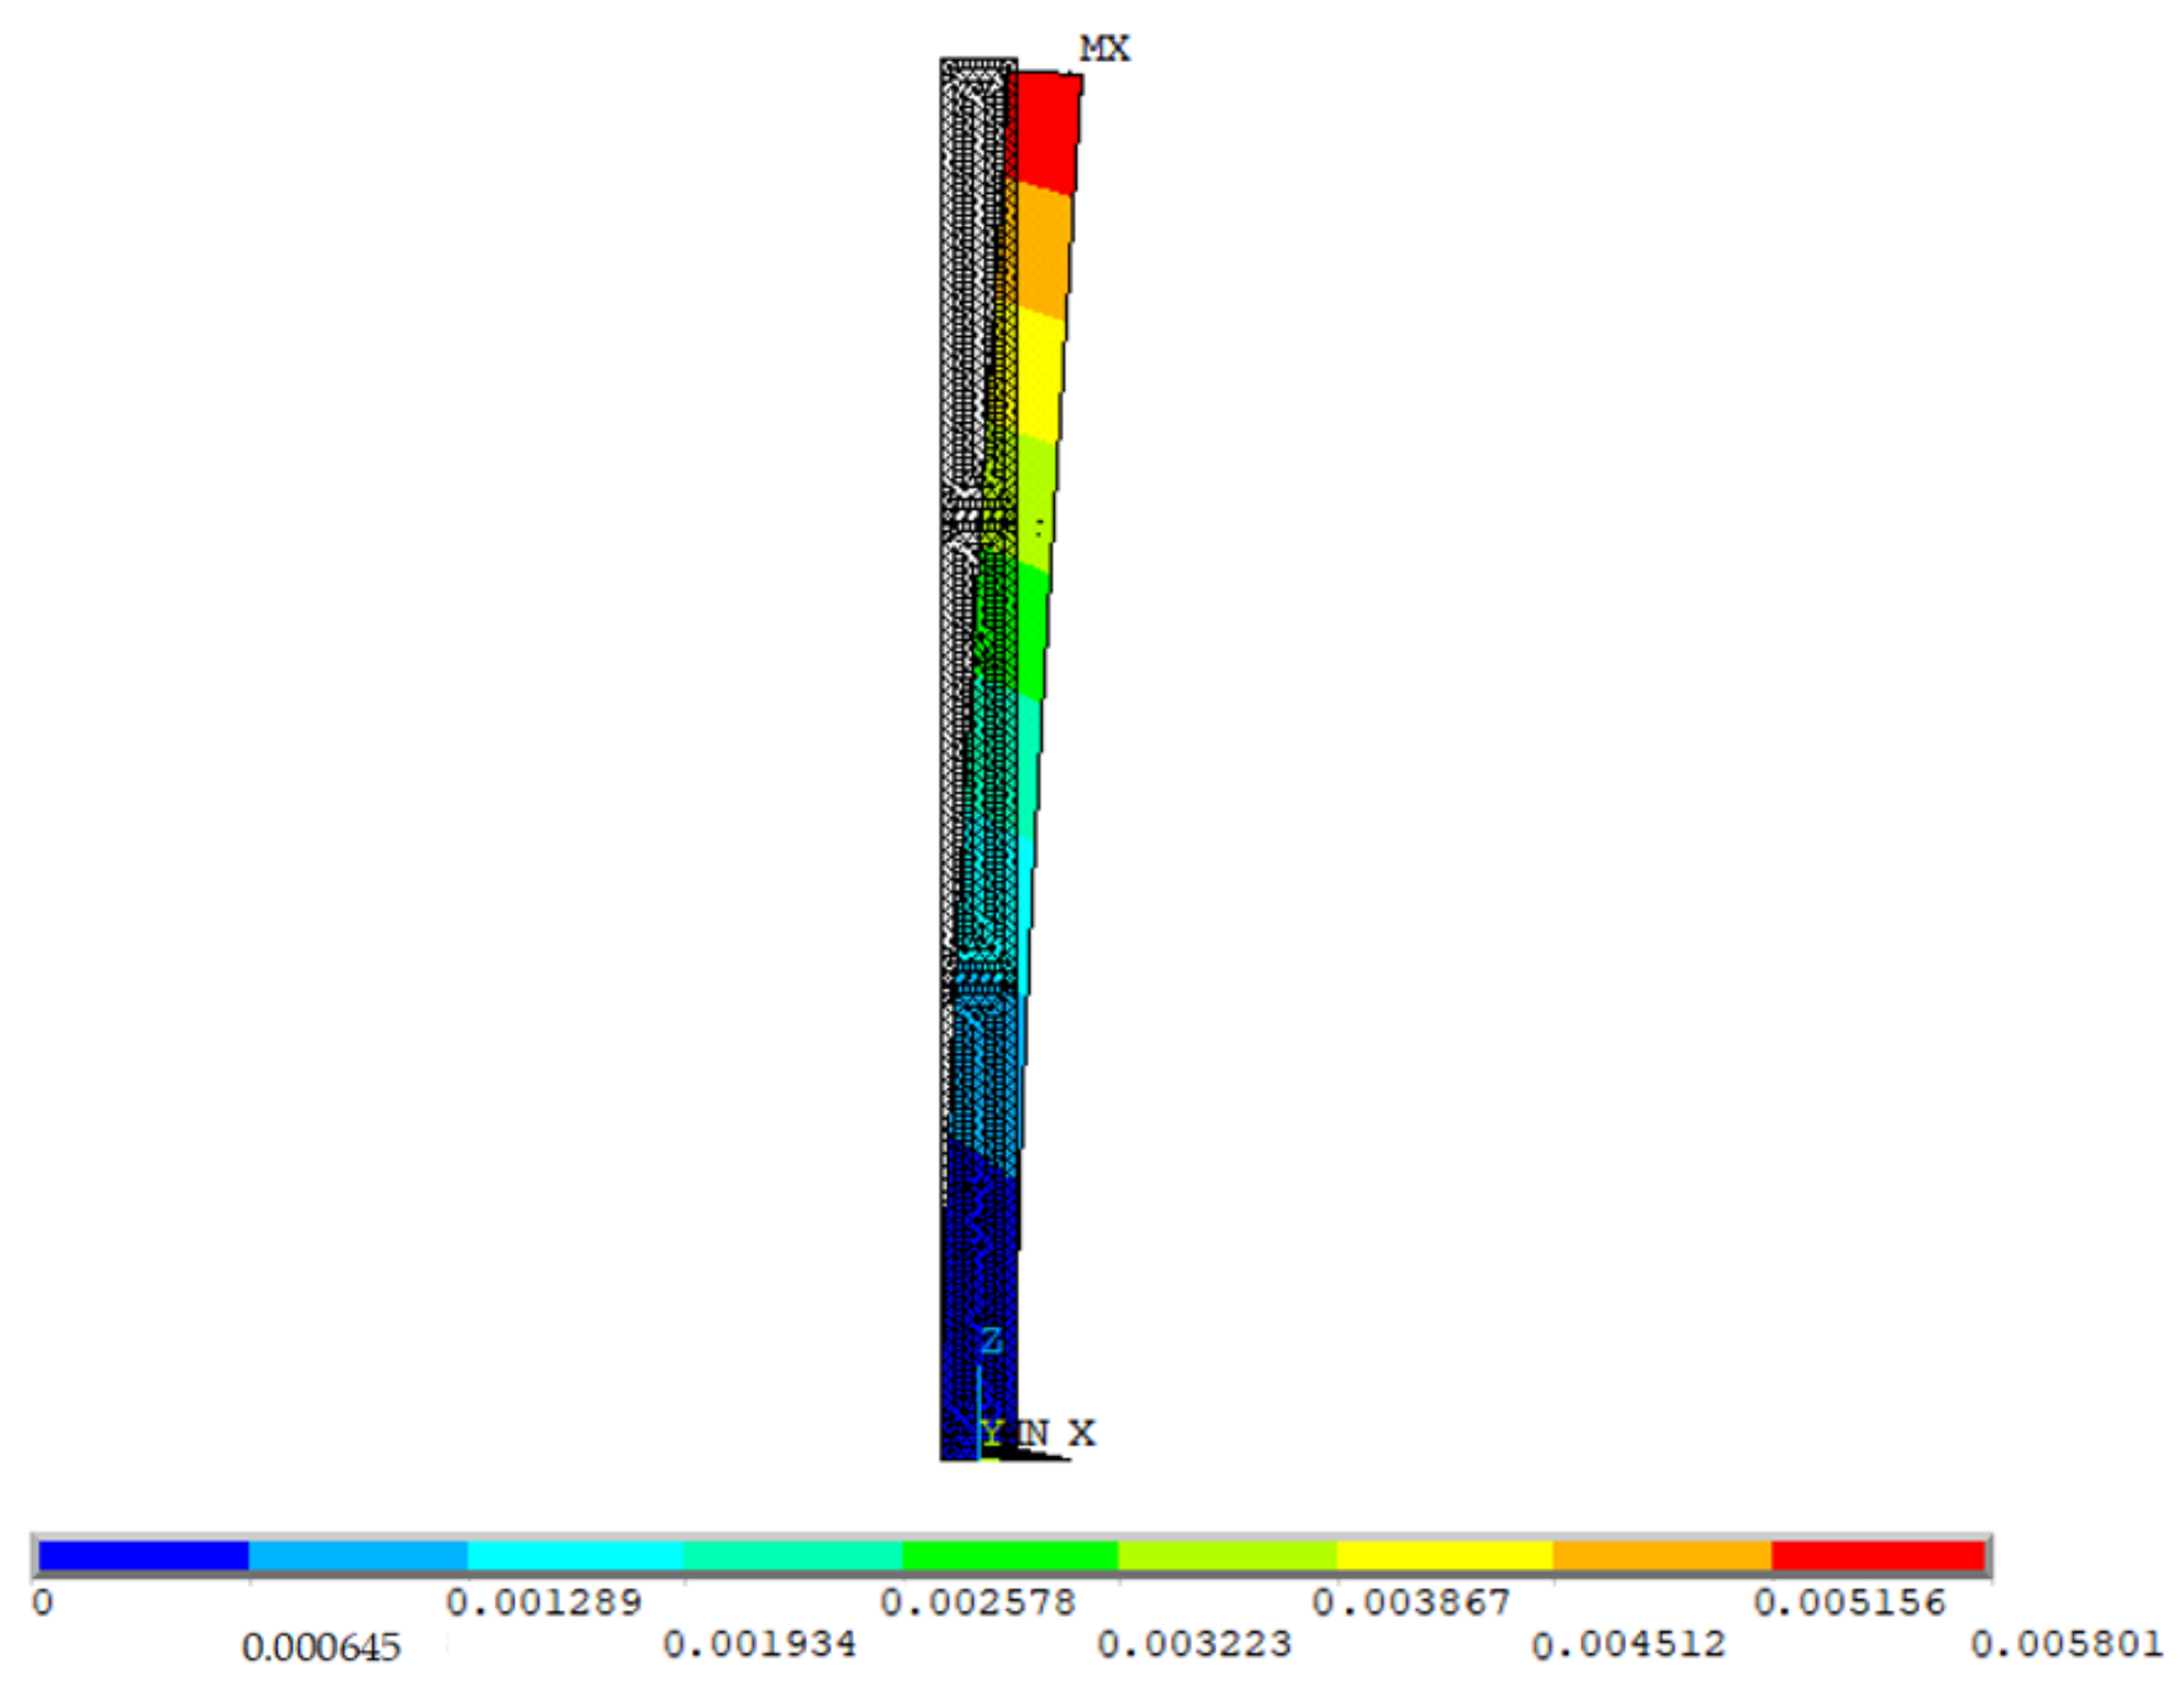
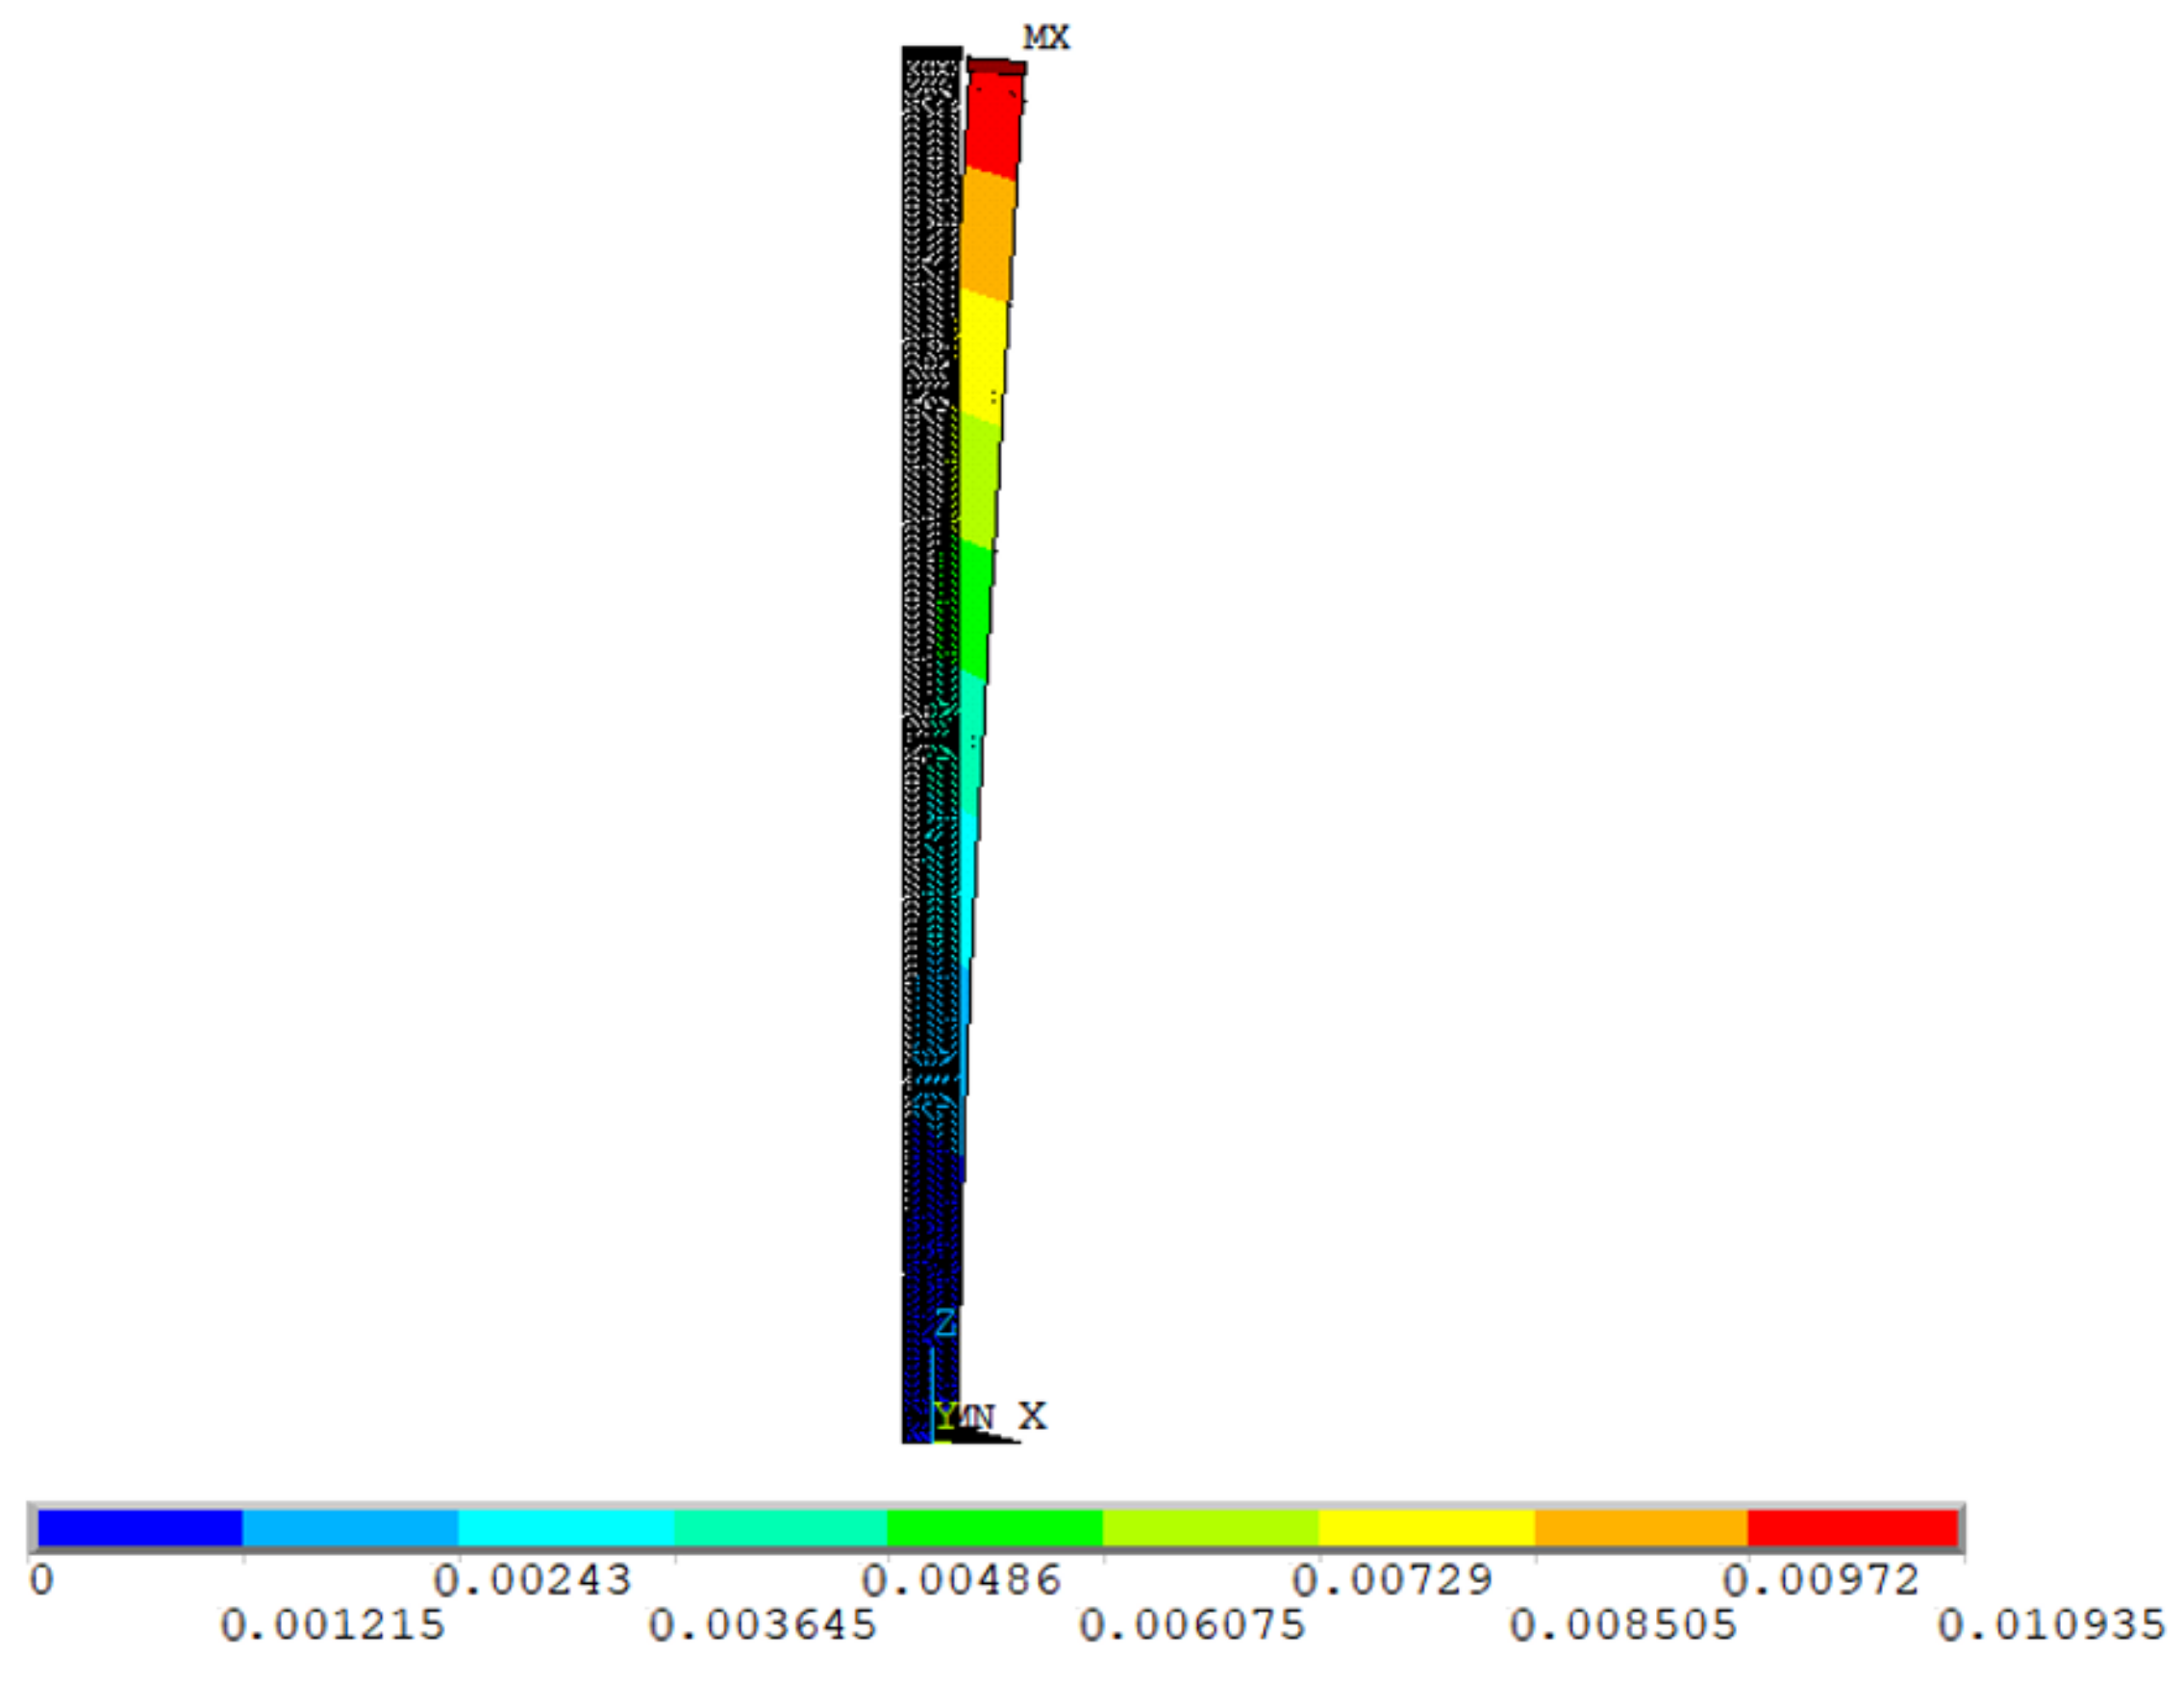
5.1. Finite Element Calculated Values

The displacement calculation under the action of a temperature field was carried out by ANSYS, and the displacement of the pier top of the No. 5 pier three sunlight temperature difference conditions was 2.157 mm (Condition 1), 5.801 mm (Condition 2), and 10.935 mm (Condition 3). As shown in Figure 11, Figure 12 and Figure 13.

5.2. Analytic Algorithm Results

The data from Section 3.4 were used to inform analytical calculations of the pier top displacement under a sunlight temperature difference effect along the bridge direction. The results are given in Table 2.

5.3. Specification Calculation Results

Referring to the Chinese national standard TB10052-1997 Technical specifications for flexible pier railway bridges, Article 2.3.6 [15,36], the formula for pier top displacement caused by sunlight temperature differences along the bridge is:
Δ S = i = 1 n 6 α T i y i Δ y i ( a d i 2 ) a 2 d i 3
where, Δ S is the pier top displacement caused by sunlight (m); α is the linear expansion coefficient of concrete, taken to be 10−5 (1/°C); T i is the temperature difference between the sunny side and the back of the bridge pier (°C); a is the coefficient, taken to be 7 (1/m); n is the number of segments; Δ y i is the length of each calculated segment (m); y i is the distance from the center of segment i to the top of the pier (m); d i is the width of section i of the pier along the bridge (m). The results for the calculated pier top displacement along the bridge under three sunlight temperature difference conditions are given in Table 3.

5.4. Comparative Analysis

The analytic algorithm calculation values, standard calculation values, finite element calculation values, and field-measured pier top displacement values for the No. 5 pier under all three sunlight temperature difference conditions are now compared. To measure the actual displacement in the field, the TC1800 high-precision total station from Leica, Germany was used, which has a minimum angle measurement accuracy of 1″ and a minimum reading of 0.01 mm. The comparison results are shown in Table 4.
It can be seen from the table that the four groups of results were generally close, but the calculation results of the analytical algorithm were closer to the measured values of the pier than of the railway specification, and the maximum difference was only 0.507 mm. This shows that the calculation results of the analytical algorithm are reliable and have considerable accuracy.
The measured value of the pier top displacement was larger than the calculated value from the analytical algorithm, however, because the measured pier top offset was not only affected by the sunlight temperature difference but also by wind load and other factors. Under each of the three kinds of sunlight temperature difference conditions, the finite element calculation value was also consistent with the measured value of the pier top, and the maximum difference was 0.679 mm. The finite element calculated values were slightly smaller than the measured values because the ANSYS finite element method only considered the sunlight temperature load.
Among the three calculation methods, the difference between the calculated value from the Chinese reference and the measured value of the pier top was the largest, up to 2.857 mm (Condition 3). This is mainly because the reference is somewhat outdated, and it is mainly aimed at the calculation of the displacement of pier tops of flexible railway piers under sunlight temperature differences. its applicability is not directly transferrable to a thin-walled hollow pier.

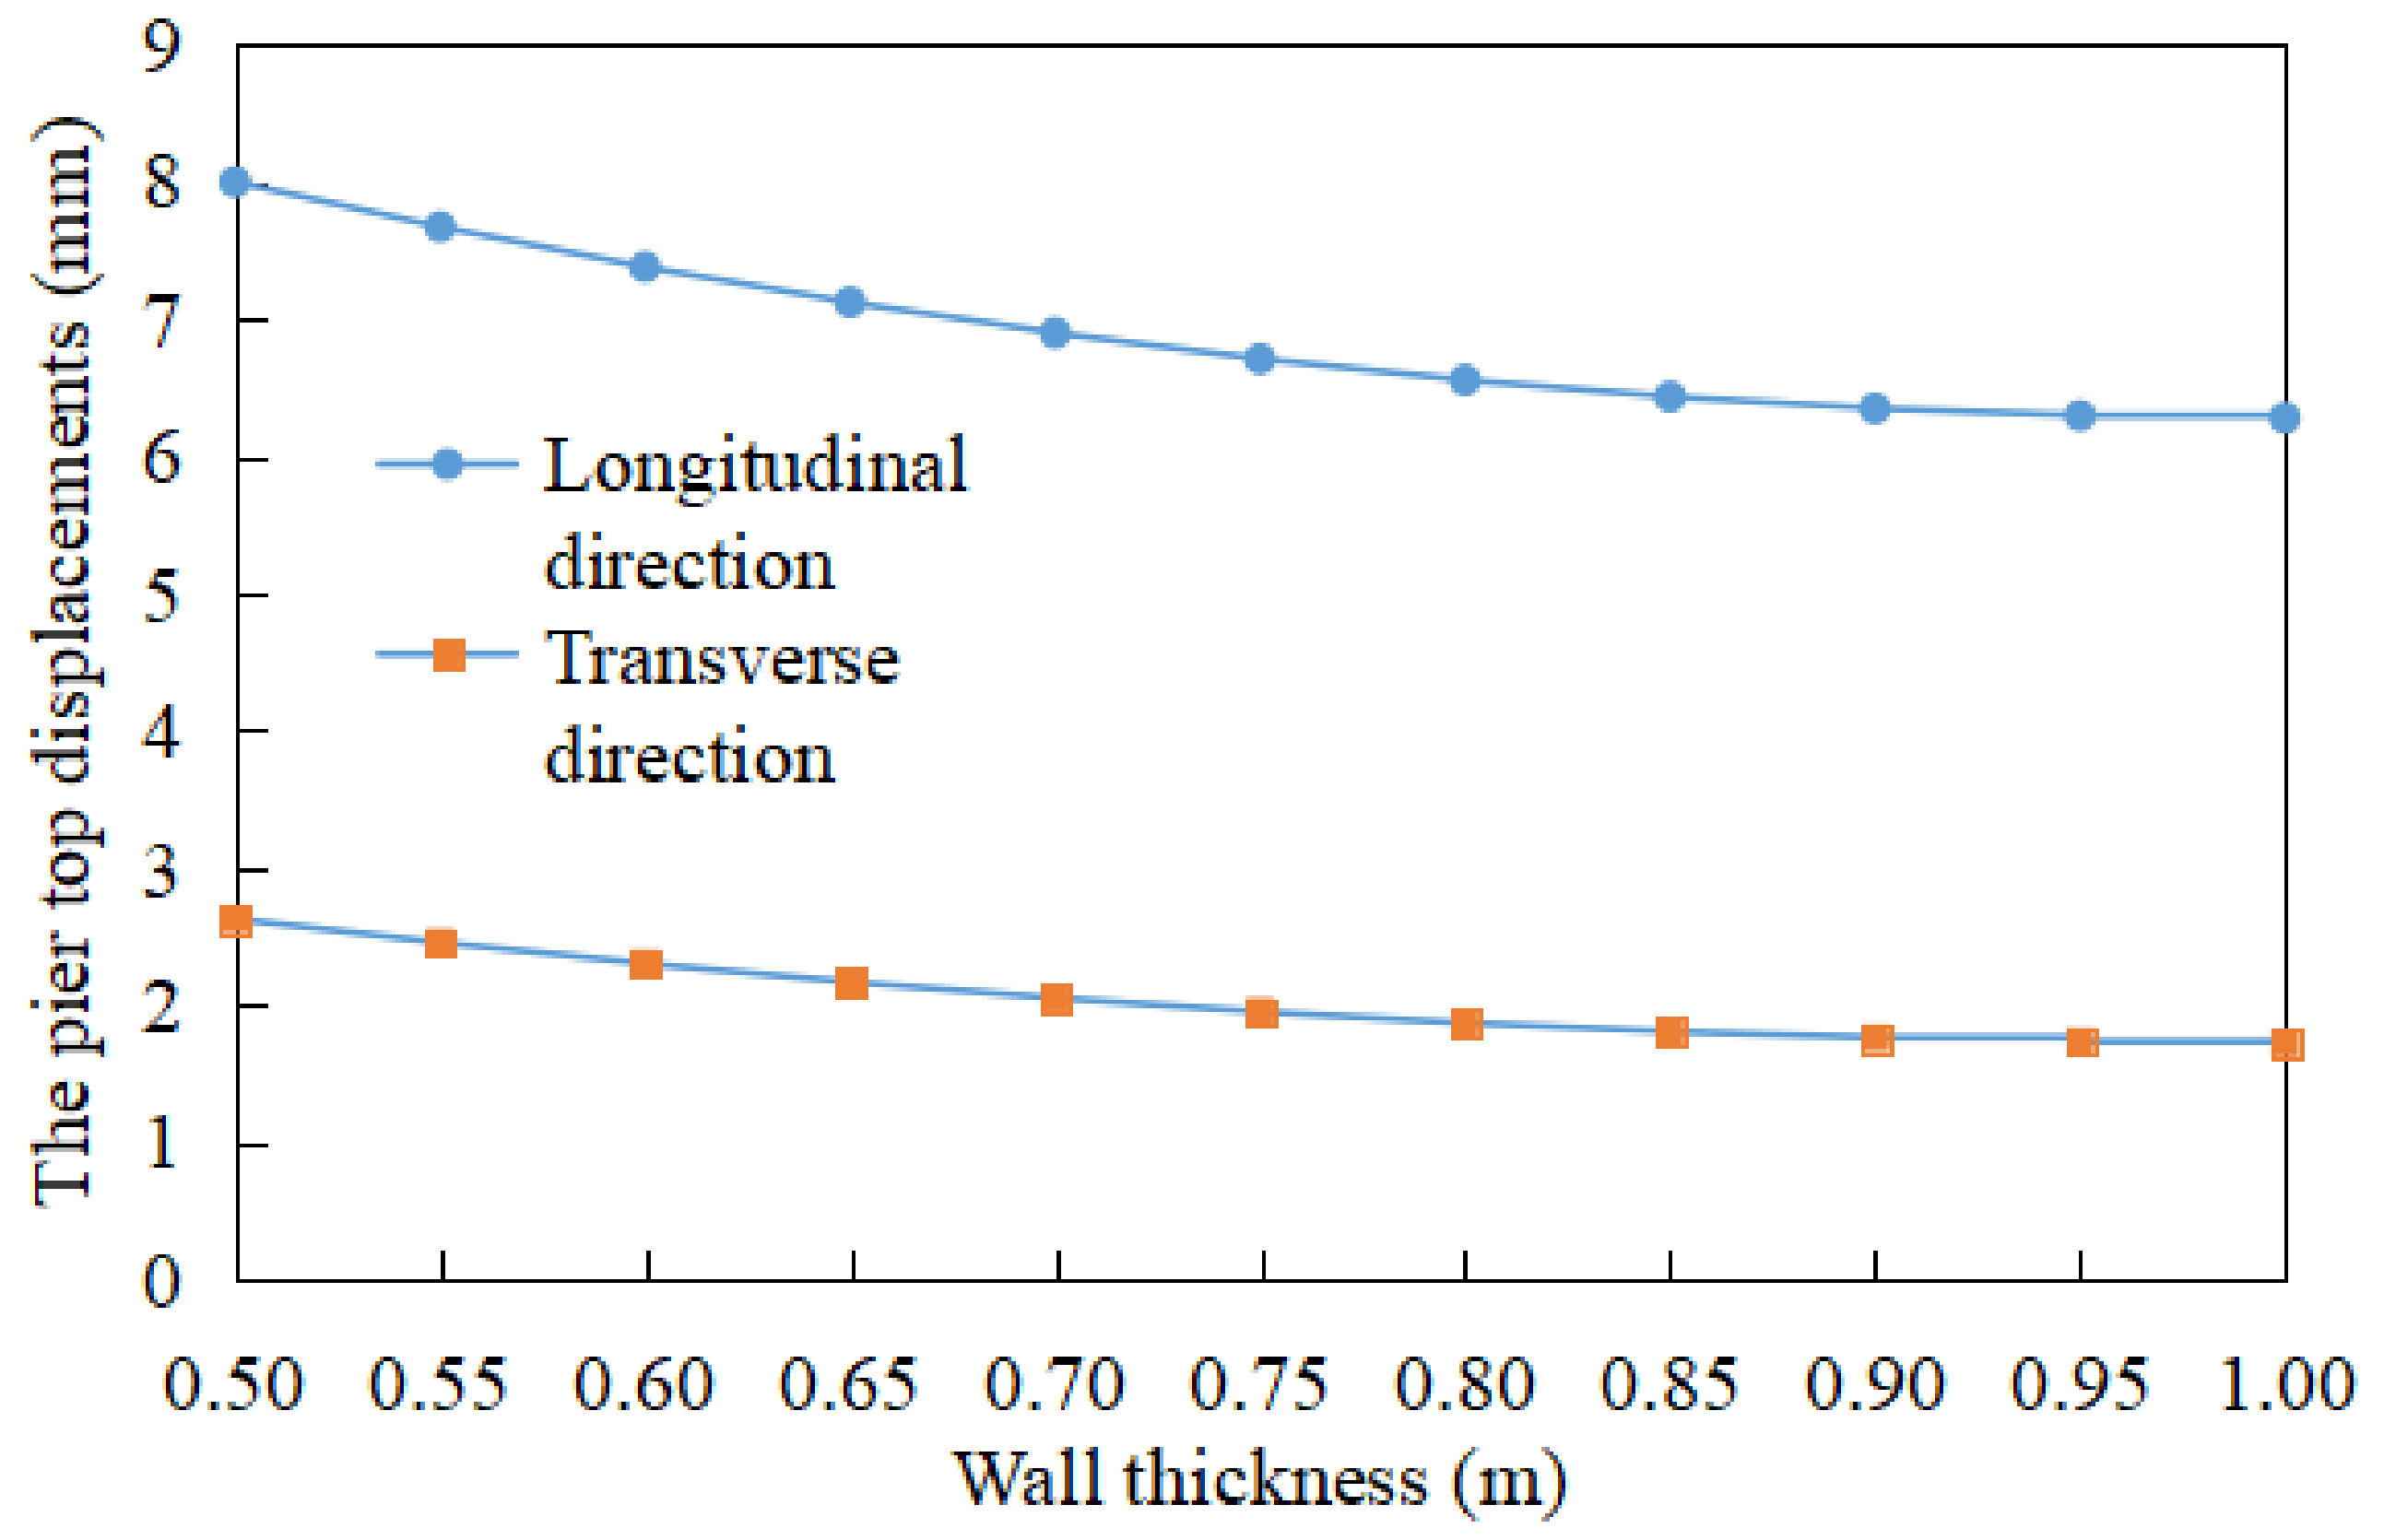
5.5. Parametric Analysis

The No.5 pier of the Bridge is located in a V-shaped valley area, and due to the influence of this topography, the sunlight temperature difference was not very large. However, this is not the case in many different regions across China, and the linear changes in piers in these regions can also be quite different from those of the case study. Figure 14 shows the displacement results of the pier top calculated by analytical algorithm under different sunlight temperature difference conditions for the No.5 pier. It is assumed that the pier had been constructed to a height of 75 m at this time and that the pier consisted of only one segment. The remaining parameters were unchanged.
As Figure 14 shows, with an increase in sunlight temperature difference, the displacement of the pier top along and across the bridge also gradually increases. Specifically, when the sunlight temperature difference is 10 °C, the longitudinal bridge is 15.289 mm and the transverse bridge is 4.868 mm. Furthermore, the greater the temperature difference, the greater the displacement of the pier top, and the greater the displacement along the bridge compared to across the bridge. This is because the thin-walled hollow pier section transverse moment of inertia is larger than that along the bridge.
Figure 15 presents a graph of the changes in displacement for different pier heights. Because this graph is only for the height of the pier, it is assumed that the temperature difference between the longitudinal and transverse directions of the bridge was 5 °C and that the pier only consisted of one section. The other parameters remained unchanged. From the figure we see that the greater the height of the thin-walled hollow pier, the greater the offset of the pier top for a given sunlight temperature difference. Furthermore, the greater the sunlight temperature difference and pier height, the more significant the influence the sunlight temperature difference on pier alignment.
Figure 16 shows the displacements of the pier top when the wall thickness of the pier changes. If the wall thickness is too small, it affects structural safety, so the minimum wall thickness was set to be 0.5 m. Assuming the temperature difference of the pier to be 5 °C and that the pier only consisted of one segment, as above, other parameters remain unchanged. It can be seen from the Figure 16 that the offset of the pier top decreases with an increase in pier wall thickness, but when the wall thickness reaches 0.75 m, the offset of the pier top does not change much with further increases. This shows that for thin-walled hollow piers, increasing wall thickness has little significance after a point in limiting the displacement of the pier top.

6. Conclusions

Based on the structural characteristics of thin-walled hollow concrete piers, an analytical formula for the displacement of pier top caused by sunshine temperature difference was derived. The calculated values from this analytical formula are compared with the reference calculation values, finite element calculation values, and field measured values and analyzed the influence of sunlight temperature difference, pier height, and wall thickness on pier alignment. The conclusions are enumerated below.
(1)
The analytical calculation formula derived in this paper has quite a high accuracy and thus can provide a new means to calculate and control the alignment of thin-walled hollow piers.
(2)
The analytical formula is more suitable for the linear calculation of thin-walled hollow piers under the influence of sunlight temperature differences than the formula in the current Chinese railway code. The formula has more specificity to its application, and was also closer to the measured values than the reference formula, with a maximum difference of only 0.507 mm.
(3)
The temperature difference due to sunlight has a great influence on the alignment of thin-walled hollow piers, and the greater the temperature difference and height, the more significant the influence on the alignment. When the temperature difference was 10 °C, the displacement of the pier top (75 m high) along the bridge was 1.5 cm. However, increasing pier wall thickness did not significantly limit the pier top displacement.

Author Contributions

Writing—original draft preparation, Investigation, L.A. and P.C.; Formal analysis, L.A. and P.Y.; Supervision, Project administration, D.L. and P.Y.; Writing, Review & editing, L.A. and P.Y.; Conceptualization, Funding acquisition, D.L. All authors have read and agreed to the published version of the manuscript.

Funding

This project received funding from the National Natural Science Foundation of China (51378504) and the Joint Fund for Basic Research of High Speed Railways of China (U1334203).

Data Availability Statement

Not applicable.

Acknowledgments

The authors thank AiMi Academic Services (www.aimieditor.com) for English language editing and review services, accessed on 24 March 2023.

Conflicts of Interest

The authors declare no conflict of interest.

References

  1. Hu, A.-Q.; Ren, D.-H. Effect of concrete hollow pier wall thickness on the temperature difference distribution of sunlight. J. Shijiazhuang Tiedao Univ. 2021, 34, 21–27. [Google Scholar]
  2. Yuan, P.; Cai, C.S.; Li, D.; Xu, G.; Li, C. A novel method for determining the spatial responses of a cable-stayed bridge with four cable-planes. Eng. Struct. 2019, 180, 223–233. [Google Scholar] [CrossRef]
  3. Bi, Z.-G.; Yan, X.-J.; Yu, Y.-J.; Liang, B. Analysis of temperature field and temperature effect of the thin-walled hollow high pier. Henan Sci. 2022, 40, 46–53. [Google Scholar]
  4. Zhou, L.-Y.; Liu, Z. Investigation of the bucking behavior of thin-walled hollow concrete piers. Struct. Concr. 2020, 22, 1363–1377. [Google Scholar]
  5. Tayeh, B.; Marijana, H.-N.; Magdy, Y.-R.-R.; Radwa, D.-A.-H. Behavior of Ultra-High-Performance concrete with Hybrid synthetic fiber waste exposed to elevated temperatures. Buildings 2023, 13, 129. [Google Scholar] [CrossRef]
  6. JTG F80/1-2017; Inspection and Evaluation Quality Standards for Highway Engineering-Section 1 Civil Engineering. China communications press Co., Ltd.: Beijing, China, 2017.
  7. Zheng, G.; Gu, X.-Y.; Zhang, T.-Q.; Sun, J.-B.; Zheng, W.-H. Random forest method-based prediction and control of bridge pier displacements during construction of two overlapped EPBM tunnels. Eur. J. Environ. Civ. Eng. 2022, 26, 2273–2293. [Google Scholar] [CrossRef]
  8. Suman, R.; Ikwulono, D.-U.; Andrew, D.-S. Reliability assessment and sensitivity analysis of vehicle impacted reinforced concrete circular bridge piers. Structures 2022, 37, 600–612. [Google Scholar]
  9. Shim, C.-S.; Dang, S.-N.; Park, S. Three-Dimensional information delivery for design and construction of prefabricated bridge piers. Struct. Eng. Int. 2018, 28, 6–12. [Google Scholar] [CrossRef]
  10. Editorial Department of China Journal of Highway and Transport. Review on China’s Bridge Engineering Research: 2021. China J. Highw. Transp. 2021, 34, 1–97. [Google Scholar]
  11. Liu, Y.-J.; Liu, J.; Zhang, N. Review on solar thermal actions of bridge structures. China Civ. Eng. J. 2019, 52, 59–78. [Google Scholar]
  12. Sun, Z.-G.; Wang, D.-S.; Wang, T.; Wu, S.-W.; Guo, X. Investigation on seismic behavior of bridge piers with thin-walled rectangular hollow section using quasi-static cyclic tests. Eng. Struct. 2019, 200, 109708. [Google Scholar] [CrossRef]
  13. Chen, H.-H.; Xu, B.; Liu, Q.; Gu, J.-F. Study on failure performance of the thin-walled steel-reinforced concrete pier under low cyclic loading. Buildings 2022, 12, 1412. [Google Scholar] [CrossRef]
  14. Choi, S.; Won, M.-C. Thermal strain and drying shrinkage of concrete structures in the field. ACI Mater. J. 2010, 107, 498–507. [Google Scholar]
  15. Rodriguez, L.-E.; Barr, P.-J.; Halling, M.-W. Temperature effects on a box-girder integral-abutment bridge. J. Perform. Constr. Facil. 2014, 28, 583–591. [Google Scholar] [CrossRef]
  16. Li, Y.; He, S.-H.; Liu, P. Effect of solar temperature field on a sea-crossing cable-stayed bridge tower. Adv. Struct. Eng. 2019, 22, 1867–1877. [Google Scholar] [CrossRef]
  17. Suzuki, J.; Ohba, Y.; Uchikawa, Y.; Hoshikawa, K.; Kimura, K. Monitoring temperatures on a real box-girder bridge and energy budget analysis for basic information on bridge cooling and surface freezing. J. Bridge Eng. 2014, 12, 45–52. [Google Scholar] [CrossRef]
  18. Zhao, J.-T.; Cui, C.-Y.; Zhang, P.; Wang, K.-P.; Zhao, M. Parameter sensitivity analysis of the seismic response of a piled wharf structure. Buildings 2023, 13, 349. [Google Scholar] [CrossRef]
  19. Tang, Z.-Z.; Xue, H.-Y.; Liu, H.; Zhang, W. Prediction of ultralow cycle fatigue damage of thin-walled steel bridge piers. Adv. Steel Constr. 2021, 17, 403–411. [Google Scholar]
  20. Jelena, P.; Nina, S.; Radenko, P. Damage assessment of road bridge caused by extreme streamflow in Montenegro: Reconstruction and structural upgrading. Buildings 2022, 12, 810. [Google Scholar]
  21. Hagedorn, R.; Marti-Vargas, J.R.; Dang, C.N.; Hale, W.M.; Floyd, R.W. Temperature gradients in bridge concrete I-girders under a heat wave. J. Bridge Eng. 2019, 24, 04019077. [Google Scholar] [CrossRef]
  22. Lawson, L.; Ryan, K.L.; Buckle, I.G. Bridge temperature profiles revisited: Thermal analyses based on recent meteorological data from Nevada. J. Bridge Eng. 2020, 25, 11–24. [Google Scholar] [CrossRef]
  23. Abid, S.R.; Taysi, N.; Ozakça, M. Experimental analysis of temperature gradients in the concrete box–girders. Constr. Build. Mater. 2016, 106, 523–532. [Google Scholar] [CrossRef]
  24. Abid, S.R.; Taysi, N.; Ozakça, M.; Xue, J.; Briseghella, B. Finite element thermomechanical analysis concrete box-girders. Structures 2021, 33, 2424–2444. [Google Scholar] [CrossRef]
  25. Deng, Y.; Li, A.; Liu, Y.; Chen, S. Investigation of temperature actions on flat steel box girders of long-span bridges with temperature monitoring data. Adv. Struct. Eng. 2018, 21, 2099–2113. [Google Scholar] [CrossRef]
  26. Tao, T.; Wang, H.; Zhu, Q.; Zou, Z.; Li, J.; Wang, L. Long-term temperature field of the steel-box girder of a long-span bridge: Measurement and simulation. Eng. Struct. 2021, 236, 111924. [Google Scholar] [CrossRef]
  27. Sheng, X.-W.; Zheng, Y.-H.; Zheng, W.-Q.; Zhu, Z.-H. Vertical temperature gradient model of concrete box girders based on real-time shadow technology. J. South. China Univ. Technol. 2020, 48, 40–47. [Google Scholar]
  28. Wang, Z.-W.; Zhang, W.-M.; Zhang, Y.-F.; Liu, Z. Temperature prediction of flat steel box girders of Long-Span bridges utilizing in situ environmental parameters and machine learning. J. Bridge Eng. 2022, 27, 04022004. [Google Scholar] [CrossRef]
  29. Phuong, H.-H.; Hoang, N.-P. Kriging Metamodel-based seismic fragility analysis of single-bent reinforced concrete highway bridge. Buildings 2021, 11, 238. [Google Scholar]
  30. Zhang, Y.-B.; Cai, T.-T.; Liu, Y. Effects analysis of the cross-sectional shape on the double-limb thin-walled piers temperature field. J. Railw. Eng. Soc. 2015, 198, 41–45. [Google Scholar]
  31. Dai, G.-L.; Tang, Y.; Liang, J.-B. Study of temperature load extreme value of a bridge pier base on generalized pares to distribution. Bridge Constr. 2017, 47, 48–53. [Google Scholar]
  32. Liu, C.-C.; Huang, Y.-J.; Zhang, G.-S.; Liu, W.-H.; Liu, C.; Zhang, Y.-S. Sunshine temperature effect of the thin-wall hollow high pier in high altitude area. J. China Foreign Highw. 2021, 41, 76–79. [Google Scholar]
  33. Lin, G.-T.; Su, B. Numerical analysis of sunshine temperature effect on a super high pier of mountain bridge. J. Civ. Eng. Manag. 2018, 35, 112–116. [Google Scholar]
  34. Andrei, K.; Ivar, T. Computationally efficient method for steel colum bucking in fire. Buidings 2023, 13, 407. [Google Scholar]
  35. Faham, T.; Zhang, L.-D.; Park, S.-W.; Sepasgozar, S. Numerically evaluation of FRP-Strengthened members under dynamic impact loading. Buildings 2021, 11, 14. [Google Scholar]
  36. TB10052-97; Technical Specification for Flexible Pier Railway Bridge. China railway publishing house Co., Ltd.: Beijing, China, 1997.
  37. Tang, Y. Active Control of Verticality of Thin-Wall High Pier Based on the Measured Temperature Field; Harbin Institute of Technology: Harbin, China, 2017. [Google Scholar]
  38. Liu, X.F. Analysis of Thermal Stress Force Concrete Structure; China Communications Press: Beijing, China, 1991. [Google Scholar]
  39. Tang, F.; Li, D.-J.; An, L.-P. Research of solar radiation influence on pier’s line shape and alignment monitoring of high-pier bridge. J. Railw. Sci. Eng. 2016, 13, 1970–1976. [Google Scholar]
  40. Yuan, P.; Dong, Y. High-efficient decoupling method for coupling systems with multiple subdomains and time steps. Mech. Syst. Signal. Process. 2022, 163, 15. [Google Scholar] [CrossRef]
  41. Yuan, P.; Li, D.-J.; Cai, C.-S.; Xu, G.-J. A Novel Decoupling Dynamic Method with Third-order Accuracy and Controllable Dissipation. Comput. Struct. 2021, 249, 44–56. [Google Scholar] [CrossRef]
  42. Wang, R.F.; Chen, G.R. Temperature Field and Thermal Stress; Science Press: Beijing, China, 2005. [Google Scholar]
  43. GB50019 2003; Specifications for design of heating ventilation and air conditioning. China nonferrous metal industry’s foreign engineering and construction Co., Ltd.: Beijing, China, 2003.
  44. Zhang, Z.-M.; Sun, C.; Vahid, J. Structural damage identification of off shore wind turbines:A two-step strategy via FE model updating. Struct. Control. Health Monit. 2021, 29, 1–21. [Google Scholar]
  45. Song, M.-M.; Silas, C.; Babak, M.; Eric, M.-H. Joint parameter-input estimation for virtual sensing on an offshore platform using output-only measurements. Renew. Energy 2023, 202, 1032–1045. [Google Scholar] [CrossRef]
Figure 1. Deformation of the pier section under a sunlight temperature difference.
Buildings 13 01208 g001
Figure 2. Pier No. 5 structural design drawing (frontal plane) (unit: cm).
Buildings 13 01208 g002aBuildings 13 01208 g002b
Figure 3. The arrangement of measuring points on the pier No. 5’s vertical 1/4 cross-section(①–⑫ is the number of the measuring points).
Buildings 13 01208 g003
Figure 4. An embedded thermometer.
Buildings 13 01208 g004
Figure 5. The BGK-MICRO-40 automatic data acquisition instrument.
Buildings 13 01208 g005
Figure 6. Temperature changes at each measuring point at the 1/4 section of the pier on May 16.
Buildings 13 01208 g006
Figure 7. Temperature changes at each measuring point at the 1/4 section and the 1/2 section of the pier on June 16.
Buildings 13 01208 g007aBuildings 13 01208 g007b
Figure 8. Temperature changes at each measuring point at 1/4 section, 1/2 section, and 3/4 section of the pier on July 15.
Buildings 13 01208 g008
Figure 9. Microunit thermal conductivity schematic.
Buildings 13 01208 g009
Figure 10. The finite element models of the No. 5 pier.
Buildings 13 01208 g010
Figure 11. The calculated longitudinal displacement result for the top of the No. 5 pier under Condition 1 (unit: m).
Buildings 13 01208 g011
Figure 12. The calculated longitudinal displacement result for the top of the No. 5 pier under Condition 2 (unit: m).
Buildings 13 01208 g012
Figure 13. The calculated longitudinal displacement result for the top of the No. 5 pier under Condition 3 (unit: m).
Buildings 13 01208 g013
Figure 14. The pier top displacements caused by different temperature differences.
Buildings 13 01208 g014
Figure 15. The pier top displacement caused by different pier heights.
Buildings 13 01208 g015
Figure 16. The pier top displacements caused by different pier wall thicknesses.
Buildings 13 01208 g016
Table 1. The measured temperatures of the pier on each side in the longitudinal direction (unit: °C).
ConditionLocationNorthsideSouthsideTemperature Difference
Condition 11/4 section29236
Condition 21/4 section33267
1/2 section34.5277.5
Condition 31/4 section37307
1/2 section39.531.58
3/4 section40.5328.5
Table 2. The pier top calculated displacement results from the analytical algorithm (unit: mm).
ConditionLocationLongitudinal Direction
Condition 1total2.293
Condition 20 ~ 1/2 segment5.351
1/2 ~ 3/4 segment0.717
total6.068
Condition 30 ~ 1/2 segment8.027
1/2 ~ 3/4 segment2.293
3/4 ~ top segment0.807
total11.127
Table 3. The pier top calculated displacements from the Chinese reference formula (unit: mm).
ConditionLocationLongitudinal Direction
Condition 1total3.635
Condition 20 ~ 1/2 segment6.946
1/2 ~ 3/4 segment1.136
total8.082
Condition 30 ~ 1/2 segment9.756
1/2 ~ 3/4 segment3.18
1/2 ~ top segment1.281
total14.217
Table 4. The results comparison of the pier top displacement calculations in the longitudinal direction (unit: mm).
Calculated ValuesCondition 1Condition 2Condition 3
analytical algorithm2.2936.06811.127
railway code3.6358.08214.217
finite element2.1575.80110.935
measured value2.86.4811.36
analysis-measured0.5070.4120.233
code-measured0.8351.6022.857
digital-measured0.6430.6790.425
Disclaimer/Publisher’s Note: The statements, opinions and data contained in all publications are solely those of the individual author(s) and contributor(s) and not of MDPI and/or the editor(s). MDPI and/or the editor(s) disclaim responsibility for any injury to people or property resulting from any ideas, methods, instructions or products referred to in the content.

