Article

Hot Water Generation for Domestic Use in Residential Buildings via PCM Integrated U-Tube Based Solar Thermal Collector: A 4-E Analysis

1
School of Energy Management, Shri Mata Vaishno Devi University, Katra 182320, India
2
School of Mechanical Engineering, Shri Mata Vaishno Devi University, Katra 182320, India
3
Research Centre for Nano-Materials and Energy Technology (RCNMET), School of Engineering and Technology, Sunway University, No. 5, Jalan Universiti, Bandar Sunway, Petaling Jaya 47500, Selangor Darul Ehsan, Malaysia
4
Center for Transdisciplinary Research (CFTR), Saveetha Institute of Medical and Technical Sciences, Saveetha University, Chennai 602105, India
5
Department of Metallurgical and Material Engineering, Karadeniz Technical University, 61080 Trabzon, Turkey
6
Center of Research Excellence in Renewable Energy (CORERE), King Fahd University of Petroleum & Minerals, Dhahran 4000, Saudi Arabia
*
Author to whom correspondence should be addressed.
Buildings 2023, 13(5), 1212; https://doi.org/10.3390/buildings13051212
Submission received: 28 March 2023 / Revised: 17 April 2023 / Accepted: 20 April 2023 / Published: 4 May 2023

Abstract

:
In recent years, building energy consumption has increased every day due to population growth and an increased human desire for a healthy and pleasant lifestyle, and this is responsible for a crisis of energy shortages worldwide. Therefore, use of solar water heating (SWH) systems in buildings for hot water demand is the prime need of the hour to maintain sustainability. The novelty of this work was in developing a phase change material (stearic acid)-filled U-tube based evacuated tube solar collector (collector A). In addition, another collector B, left without energy storage material, was considered a reference unit for comparing the energy and exergy outputs. The study’s main aim was to examine the energy, exergy, enviro- and exergoeconomic analysis of newly developed water heating systems. The findings of study revealed that the maximum daily energy outputs of collector A were found to be 85.86% (simultaneous mode) and 84.27% (midday charging mode) at a high mass flow rate (0.5 LPM), and exergy outputs were 19.41% and 21.35%, respectively, at a low flow rate. The thermal output of collector A was higher than that of collector B. The per liter cost of hot water produced from collector A with PCMs was found to be INR 0.1261 and INR 0.1276, respectively, under both modes, which is less compared with the electric geyser (0.325 INR). The levelized energy cost, net present worth, and the payback time of the developed collector A obtained were 4.61 INR/kWh, INR 49710, and 4.49 years (simultaneous), and 4.67 INR/kWh, INR 48130, and 4.64 years (mid-day charging), respectively. Furthermore, the amount of CO2 mitigation from the energy and exergy perspective for collector A was found to be 24.30 and 23.76 tCO2/lifetime and 5.31, 5.58 tCO2/lifetime, respectively.

1. Introduction

In recent years, building energy consumption has increased every day due to population growth and an increased human desire for a healthy and pleasant lifestyle, and this is responsible for a crisis of energy shortages worldwide. The building construction segment accounts for nearly one-third of global CO2 emissions and energy consumption. In addition, nearly one-third of materials are consumed in buildings and produce waste [1,2]. A significant amount of energy consumed in buildings is needed for water heating applications, especially in cold climatic conditions. Nobody now denies the necessity to minimize energy consumption in buildings, seeking better energy output and more integration of renewable sources of energy and, eventually, making our buildings sustainable due to the significance of energy consumption in buildings [3,4]. Therefore, the installation of solar thermal collectors (FPCs and ETCs) that are primarily focused on hot water production applications in buildings is a priority. Their installation can be a successful move toward the goal of net-zero and sustainable buildings (see Figure 1) [5,6].
The progressive development of solar thermal collectors (STCs) provides a significant amount of domestic hot water, which varies as per the climatic zones and type of collectors. Flat plate collectors are the most common devices with wide options in design modifications, but vacuum tube collectors have a high thermal performance and temperature range due to vacuum insulation. Therefore, vacuum tube collectors around the world are more preferred or being installed in residential buildings for hot water needs. Generally, residential water heating systems use storage tanks with thermal stratification to improve energy efficiency [7,8].

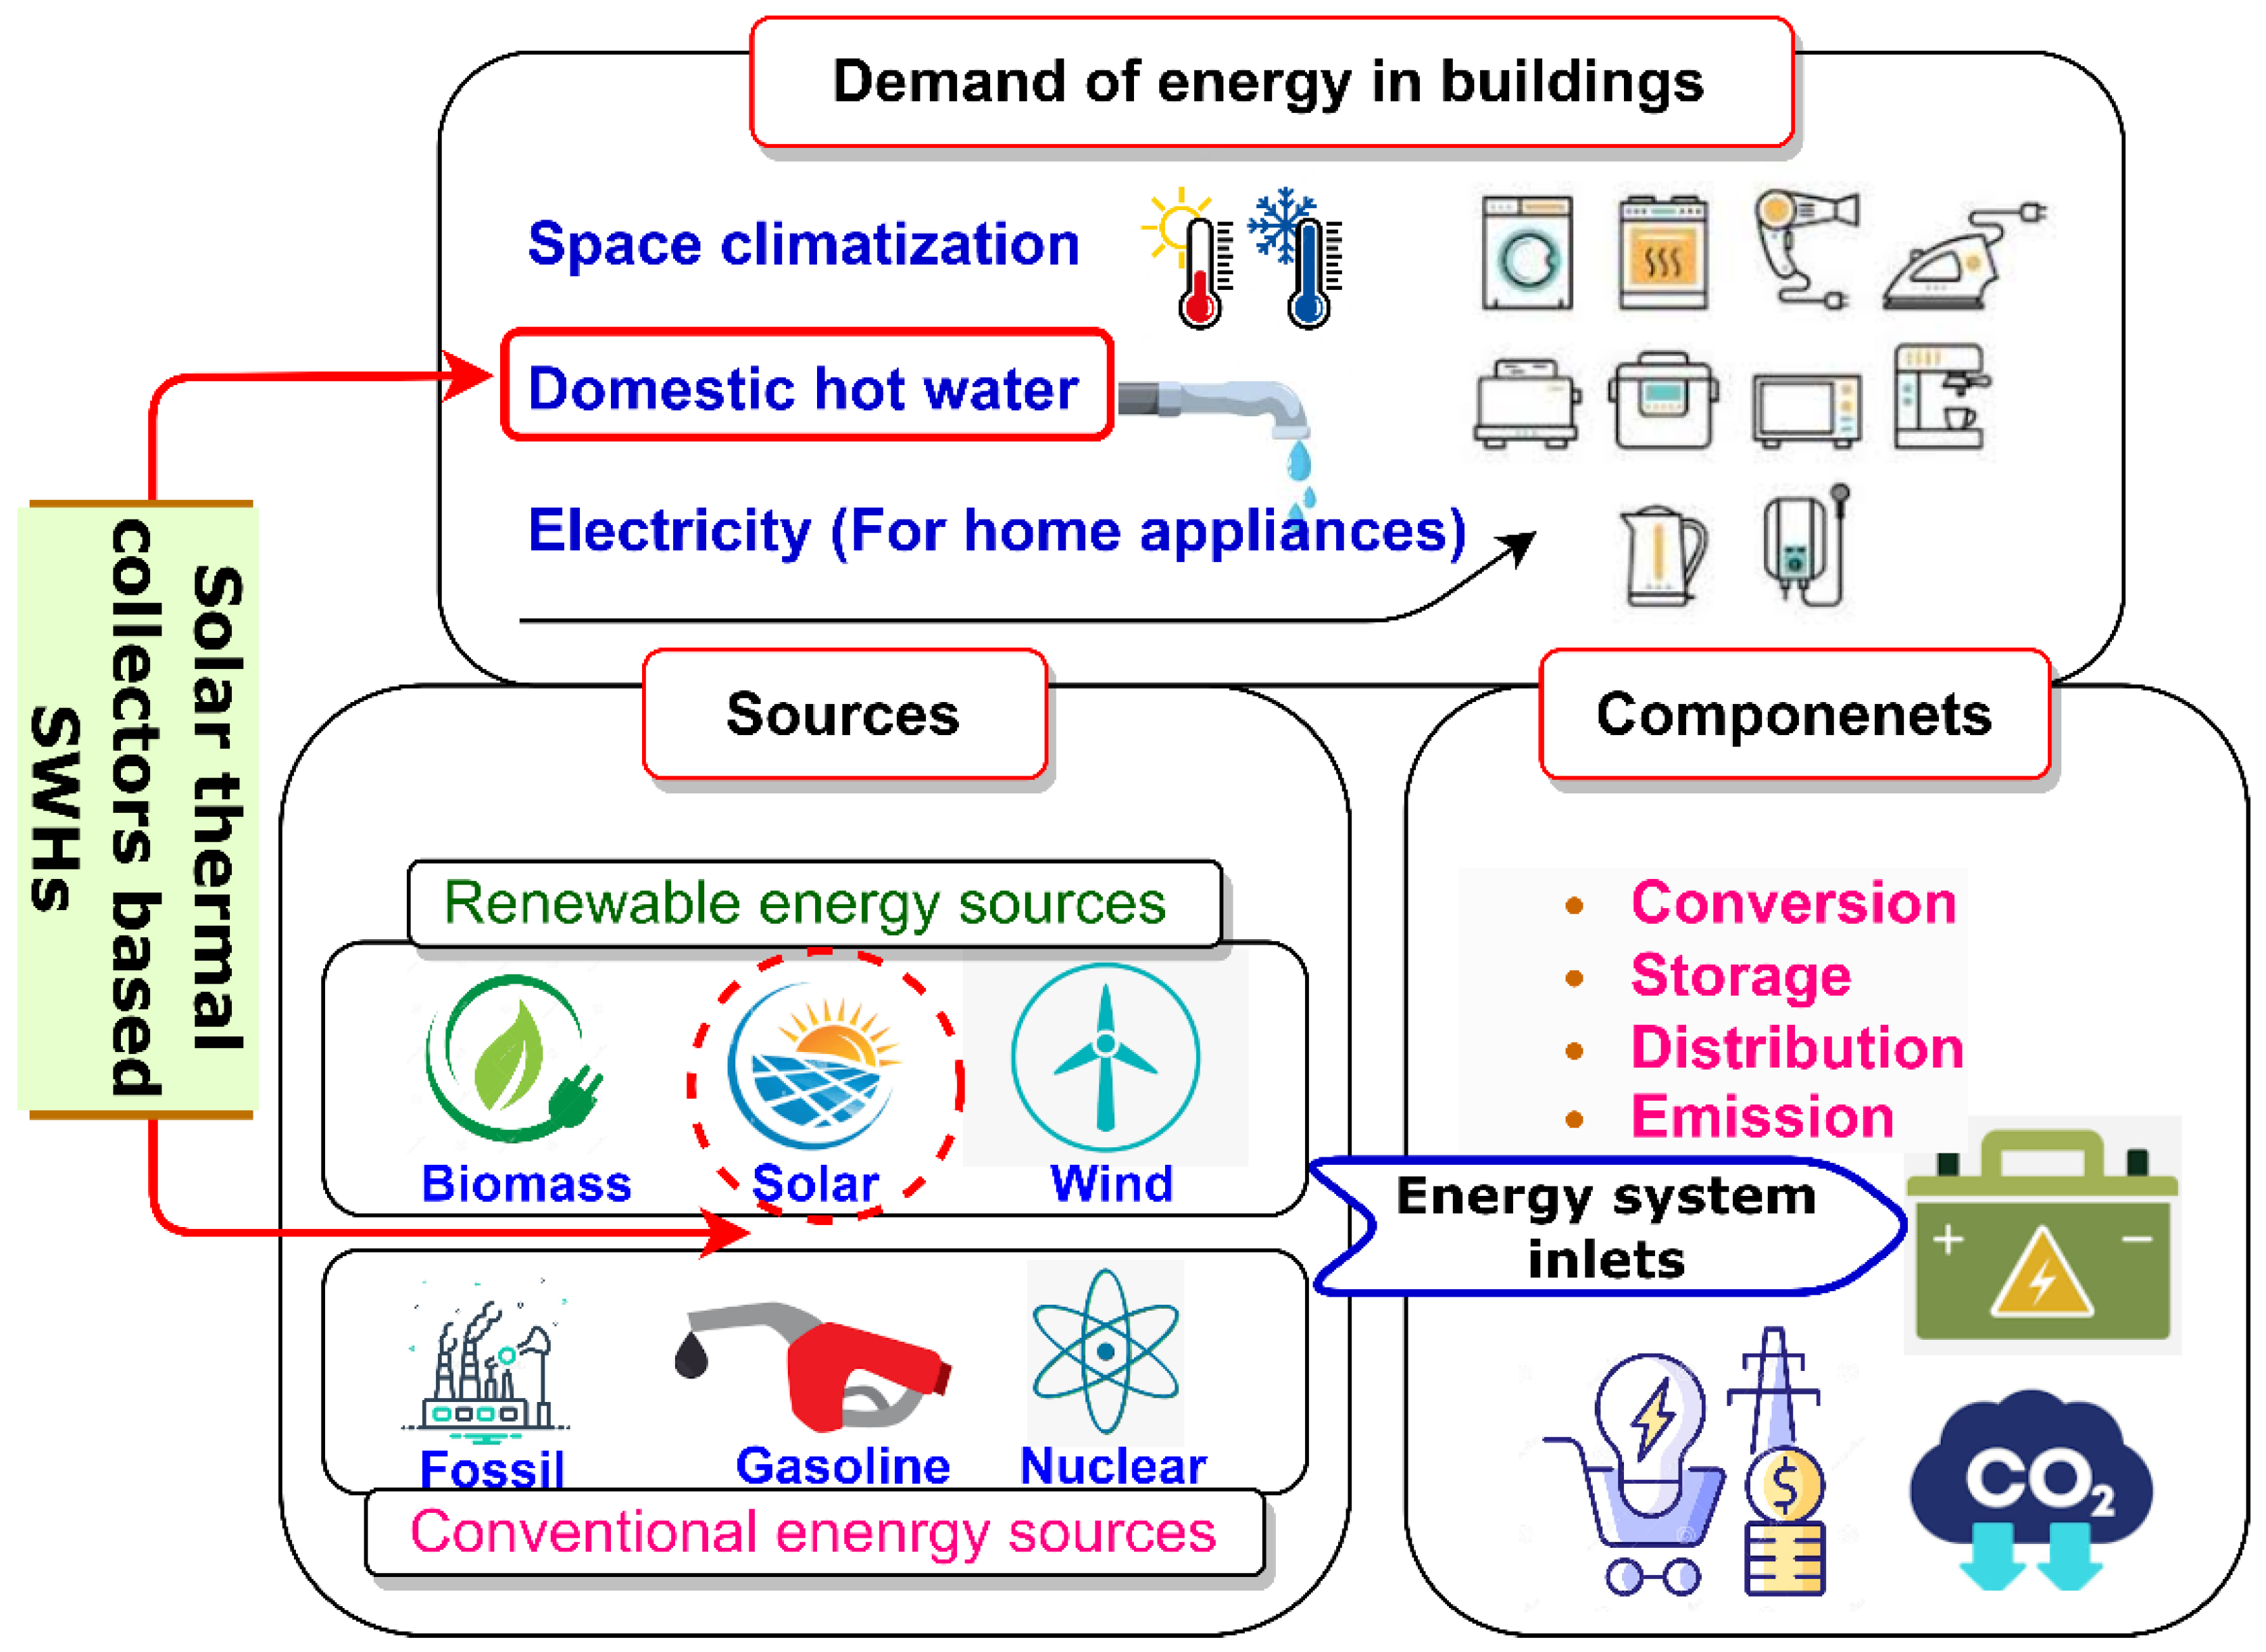
1.1. Hot Water Consumption in Buildings

The consumption profile for domestic hot water is complex and has changed significantly over time. The most important factors in the different studies were discovered to be the graphical location, weather, occupant number, occupant behavior towards hot water usage, lifestyle, and social and economic conditions. Daily and hourly hot water consumption profiles by households are not similar in all countries [9] Figure 2A shows the consumption of hot water per household and person in different composite climatic conditions (country-wise), and Figure 2B shows the consumption of hot water on an hourly basis per household for different seasons.
Researchers are growing concerned about solar water heating (SWH) systems due to several nations’ and international agencies’ long-term planning of low-carbon energy. Various studies were conducted with the purpose of analyzing the impact of PCM integration with SWH systems instead of using it as a separate storage unit. Chopra et al. [11] evaluated the 4E analysis of the HP-ETC based SWH system for Jammu’s diverse climate. The system was planned and constructed for a family of six occupants. The experiments were conducted at six fluid flow rates. The max. average energy and exergy outputs were 72% and 5.2% at 20 LPH, and 55% and 1.25% at 60 LPH, respectively. At 20 and 60 LPH, the max. and min. average outlet temperatures were determined to be 76.4 and 45 °C, respectively. The per liter price of hot water at the specified temperature was determined to be 0.12 INR/L, compared with 0.40 and 0.26 INR/L for electric and gas geysers, respectively. The payback period for the SWH was four years, which was a much shorter time frame. Naghavi et al. [12] evaluated the thermal output of the PCM-filled heat pipe based ETC. They used paraffin wax as the PCM. They found that the proposed system’s thermal output fluctuates by 8% as a result of varying environmental circumstances. They also observed that the mass flow rate significantly influenced the overall system performance. In addition, the use of fins with a heat pipe overcame the problem of the PCM’s poor conductivity and prevented the heat pipe from overheating. Xue [13] examined the output of a water-in-glass ET-SWH combined with PCMs and found it to be superior to the performance of a traditional type with a comparable collector area. Abokersh et al. [14] applied PCM using a similar technique while additionally adding aluminum fins to the inner and outer surfaces of the glass absorber and U-tube. They observed that, despite the fact that adding an aluminum fin increased heat retention capacity, it reduced efficiency by 14% compared with a system filled with only PCM and no aluminum fin. O’Neil and Sobhansarbandi [15] compared the heating efficiency of a U-tube ETSC to that of a heat pipe based ETSC that is commercially available. The ETSC based on the U-pipe obtained a 31 °C higher peak water temperature than the ETSC based on the heat pipe. It will result in a 13% increase in thermal output in the absence of storage medium. The finned U-tube-based ETSC with PCM yielded water tank peak temperatures of 47 °C and 38.7 °C, while the heat pipe based ETSC yielded peak water temps of 60 °C and 36.7 °C, respectively. The maximum temperatures for fin and tank water for the U-tube based ETSC with nanofluid were 63.9 and 43.3 °C, respectively. Li et al. [16] analyzed the heat produced by a PCM integrated ETC based on U-tubes. U-type ETCs with fin-filled PCMs increase the amount of time hot water is supplied and decrease the maximum exit temperature of the HTF. When the PCM melting temperature reached 323 K, the peak HTF output temperature dropped by 7.4 K, the PCM liquid percentage was high, and the ETC’s thermal and storage efficiencies were 50.72% and 19.20%, respectively.
PCM adds an extra 160 min to the delivery duration of hot water over 308 K. Researchers found that adding fins to PCM loaded with ETC increased overall performance. Huang et al. [17] analyzed the heat produced by a novel vacuum tube collector loaded with PCM. Radial metal fins were attached to the U-tube to increase efficiency via high heat transmission. The U-tube’s PCM was paraffin. The findings showed that, when PCM was added to the ETC, the water temperature was higher at night than without a PCM system. Not only that, but a higher output flow rate resulted in cooler water. The thermal output of U-tube finned direct flow collectors with and without PCM was compared by Essa et al. [18]. It was the first time a collector used PCM (paraffin wax). The PCM’s energy storage advantage was realized at low flow rates, allowing for a full phase variation. When the complete phase changed, the system performed at its best. The 0.25 LPM (0.81 m2 aperture area) PCM ETC system with integrated energy storage was 21.9% more efficient than a standard collector. Because of a phase shift that occurs in the PCM between its absorbing and releasing modes, this enhancement was possible.

1.2. Research Gaps and Objective of the Study

Latent heat storage is crucial for heating and cooling systems. The main aim of heat storage with solar water heaters is to overcome the issue of fluctuations in the demand and supply of hot water, which is a common issue in solar thermal systems due to the fluctuating nature of solar energy. The main function of phase change materials (PCMs) is to absorb and release thermal energy at a constant temperature (isothermal), which significantly reduces the additional space requirement. As per the literature, it was observed that various modifications in designs and integration of latent heat storage materials with ETSC had been carried out in previous studies. Undoubtedly, integration of energy storage materials offers various merits, such as improving thermal performance and supply of hot water for an extended period. Still, a few gaps have not been addressed in the previous studies.
Nowadays, monetary savings and increasing the energy efficiency of SWH systems used in residential buildings are both clear objectives of researchers, and researchers have discussed the thermal performance of SWH systems only from an energy and exergy perspective. Nobody has discussed the thermal output of stearic acid (PCM) filled with U-tube based ETSCs from enviro- and exergoeconomic perspectives, which are dynamic factors for the growth of energy storage based SWH systems. This work is novel in examining the energy, exergy, enviro- and exergoeconomic analysis of newly designed U-tube based ETSCs with and without PCMs, which are operated under dual modes (simultaneous and midday charging) at three mass flow rates. In addition, economic and environmental analysis makes it clear whether using PCMs with an ETC based SWH system is financially and environmentally viable for commercial utility, because, for any solar thermal system, it is important to analyze sustainability’s economic and environmental aspects.

2. Selection and Addition of PCM with Proposed ETC-SWH

A phase change material is a “latent” heat storage substance that melts or solidifies (phase transition) isothermally. By dissolving their chemical bonds endothermically during the solid-to-liquid phase change, PCMs store thermal energy as latent heat, which releases exothermically during cooling back to the solid. It is crucial to evaluate many essential factors to select PCMs to be employed as energy storage materials in SWH systems for water heating applications in buildings [19]. The selection of an appropriate PCM relies on several recommendations. However, PCMs must exhibit thermo–physical, kinetic, chemical, technological, and economic characteristics. These include an adequate melting temperature range, high specific heat, low-density fluctuation during phase transition, chemical stability, nontoxicity, and cost. Previous studies mainly employed paraffin wax as latent heat storage, although its lower thermal conductivity influences the heat transfer phenomenon. The current research uses stearic acid (K = 0.32–0.34 W/m K) as a PCM due to its superior thermophysical properties over paraffin wax. Stearic acid has the following thermophysical properties: melting temperature (Tm = 60 °C), latent heat (191 kJ/kg), density (1.08–1.17 gm/cm3), and specific heat (2–2.45 kJ/kg K) [20]. In this experimental study, the PCM was filled inside the annular gap of the evacuated tube between the U-tube and the absorber surface to act as a latent heat storage (LHS) medium. The 75% volume (2.3 kg) of the total capacity of the evacuated tube was then immediately filled with liquified PCM using a beaker. Figure 3 shows the design analysis and PCM integration with ETSC.
Chopra et al. [21,22] evaluated stearic acid for 0–1500 heat cycles. Spectroscopy and differential scanning calorimetry were used to analyze both samples. DSC analysis was performed at 40–85 °C. Stearic acid was chemically analyzed using Fourier transform infrared spectroscopy. The thermogravimetric analysis determined the heat stability of cycled and uncycled PCM samples. After the following characterization tests, they found that both 0 and 1500 cycled stearic acid samples were thermally degraded at 297 °C and 291 °C, respectively. X-ray diffraction analysis employed Cu (K = 1.5406) powder diffraction meters. DSC analysis of stearic acid samples’ 0th and 1500th cycles was completed to evaluate latent heat storage capacity. After 1500 cycles, the stearic acid sample melted at 67.10 °C and froze at 65.74 °C. Stearic acid’s melting and freezing latent heat capacities were 228.65 and 233.87 J/g, respectively, after 1500 cycles, compared with 244.21 and 244.14 J/g, respectively, at 0 cycles. After 1500 cycles, stearic acid’s melting temperature remained 0.2 °C and its latent heat storage capacity declined to 6.37%. These results reveal that stearic acid provides reliable latent heat energy storage life for solar thermal applications.

3. Experimental Setup and Methodology

This experiment mainly assessed the 4E analysis of a newly designed U-tube based ETSC with and without PCM used for constant hot water supply in buildings. Therefore, the study underwent three tests (Test 1 to Test 3) for composite climatic conditions of Jammu, India. The test setup was installed at the Shri Mata Vaishno Devi University, Katra rooftop at the optimized position (45°) to capture the maximum solar radiation during the daytime. All the data were recorded from 8:00 a.m. to 9:00 p.m. Furthermore, the total amount of hot water produced during the night was measured and stored in the insulated tank.

3.1. Test Setup

Figure 4 depicts a schematic with photographs of the proposed experimental design. The test setup had two collectors, A and B. Collector B was used as a reference collector without phase change material. In contrast, collector A was integrated with PCM and operated under dual modes (simultaneous and midday charging modes). Newly designed collector’s thermal performance and other economic/environmental output parameters were compared with collector B. The system comprised two insulated storage tanks for collecting the exit hot water. The inlet water was flowed to both collectors from a large tank (1000 L capacity). Two separate rotameters equipped with each collector were used to determine the mass flow rate of the water. The water was circulated in the system and collected in the storage tanks. Each collector had a 0.49 m2 heat-collecting surface. A solar power meter measured the global solar radiation that fell on the aperture area. Table 1 displays the specific structural features and materials of the U-tube based ET-SWH.
In the test setup, 12 resistance temperature detector (RTD) sensors were used to measure the temperature at defined locations (see Figure 4). Three RTD sensors were installed in an evacuated tube of collector A, and two RTD sensors were placed inside an evacuated tube of collector B to measure the temperature of latent heat storage material and air. The digital data logging device Masibus 85x++ linked with the RTD sensors. Where five-minute difference temperature data were recorded and saved, a digital solar power meter monitored the solar energy from 8:00 a.m. to 6:00 p.m. every 30 min. Rockwool was used for insulating the header portion of the U-tube based ETSC to reduce the heat losses at the top.

3.2. Research Methodology

The experimental procedure adopted for this study is discussed in detail in this subsequent section. Before starting the experiment, ensure all the connections are working correctly. The experiments were performed on two U-tube based evacuated tube solar collectors A and B, with three mass flow rates (0.167, 0.34, and 0.5 LPM) under the composite climatic conditions of Jammu, India. The experiment was run from 8:00 a.m. to 9:00 p.m. for all three test days.
Each test was performed for a specific mass flow rate. First, uncover both collectors at 8:00 a.m. sharp; the absorber surface captures the solar energy fall on both collectors. The evacuated glass tube consists of a metal absorber with a selective coating having low thermal conductivity and high absorptivity. The low emissivity of the selective coating reduces the amount of heat lost from the absorber surface by radiation. It allows the absorber to maintain the higher temperature and transfer more heat to the water flowing through the U-tube. In collector A, the PCM filled inside the tubes absorbs a part of the solar energy, and the remaining is transferred to the U-tube for heating the water. In collector B, the total amount of solar energy absorbed by the absorber surface is transferred to heat the working fluid. Collector A was tested under dual operation modes (simultaneous and midday charging modes). In simultaneous mode, the system was operated from early morning, 8:00 a.m., and inlet water was supplied to the collector in parallel for heating. In midday charging mode, collector A with PCM was uncovered from 8:00 a.m. for complete charging of the PCM. The input water was supplied to a collector at 12:00 a.m. for heating. The reference collector B was operated from 8:00 a.m. to 6:00 p.m. The thermal performance and economic/environmental outputs of the reference collector were compared with collector A with PCM. The same procedure was repeated for the other two mass flow rates (see Figure 5).

4. Thermodynamic Analysis of U-Tube Based ETSC

4.1. Energy Analysis

The energy study of any solar thermal system is conducted with the help of the 1st law of thermodynamics to analyze its energy efficiency. The irreversibility of the processes was not considered during the energy analysis.
For an open system moving between states 1 and 2, the steady-state flow energy equation is written as
Q ˙ W ˙ = m ˙ o ψ o + V o 2 2 + g λ o m ˙ i ψ i + V i 2 2 + g λ i
The SFEE can be simplified by eliminating the change in kinetic and potential energy changes. In addition, there is no work produced by the system [23]:
Q ˙ = m ˙ o ψ o m ˙ i ψ i
Therefore, the useful amount of heat absorbed by the water can be calculated by the below given expression:
Q ˙ u = m ˙ H T F × C H T F × T o , H T F T i , H T F
The total useful amount of heat gained by the water for a time strap can be calculated by the equation:
Q u = t = 0 k Q ˙ u × τ = m ˙ H T F × C H T F t = 0 k T o , H T F T i , H T F × τ
The instantaneous solar energy fall on the area of the collector can be evaluated as
Q ˙ i = I G × A a p e r t u r e
The total incident solar energy for a full day can be obtained from the given expression:
Q i = t = 0 k I G × A a p e r t u r e × τ
The solar thermal collector’s overall energy efficiency is the ratio of total usable heat gained by water to the overall solar energy fall on the collector per day. The daily energy efficiency (DEE) of the collector can be represented as:
η D E E = m ˙ H T F × C H T F A a p e r t u r e × t = 0 k T o , H T F T i , H T F I G
Both solar collectors, collector A with PCM and collector B without PCM, are operated under the same ecological conditions. Therefore, the energy enhancement ratio (EER) can be calculated as [24]:
E E R = Q u ( A ) Q u ( B ) Q u ( A )

4.2. Exergy Analysis

Exergy analysis is an analytical method based on the second law of thermodynamics that provides an alternative and informative way of logically and meaningfully evaluating and comparing processes and systems.
The inlet exergy ( E x ˙ i ) and outlet exergy ( E x ˙ o ) of the newly designed solar collectors (A and B) can be calculated as [25]:
E x ˙ i = m ˙ H T F × C H T F T i , H T F T a t m × 1 + l n T i , H T F T a t m
E x ˙ o = m ˙ H T F × C H T F T o , H T F T a t m × 1 + l n T o , H T F T a t m
The exergy loss ( E x ˙ l o s s ) from the collectors A and B from the absorber surface to atmospheric air can be obtained as [22]:
E x ˙ l o s s = U l o s s × A a p e r t u r e T a b s o r b e r T a t m T a t m × l n T H T F T a t m
The amount of incident exergy ( E x ˙ i n c ) can be written as [26]:
E x ˙ i n c = I G × A a p e r t u r e × 1 + 1 3 T a t m T s u n 4 4 3 T a t m T s u n
Therefore, the overall exergy output of the newly developed SWH systems (collector A and collector B) is the ratio of gain of exergy to the total fall exergy input, and it is expressed as:
η D E X E = m ˙ H T F × C H T F × T o , H T F T i , H T F T a t m × l n T o , H T F T i , H T F I G × A a p e r t u r e × 1 + 1 3 T a t m T s u n 4 4 3 T a t m T s u n

4.3. Numerical Models for the Generation of Energy and Exergy

The energy and exergy generation models were developed by considering the effect of these parameters: energy and exergy efficiency, solar radiation, and degradation in thermal output of newly developed collectors A and B for time. The prediction of energy and exergy from both collectors throughout the year can be obtained by the equations [27]
Q u , E G Y = 365 × I G × A a p e r t u r e × η D E E × τ × 1 d R n
Q u , E X G Y = 365 × I G × A a p e r t u r e × η D E X E × τ × 1 d R n

4.4. Economic and Environmental Analysis

The existing SWH system faced the main issues of low thermal performance and inability to produce hot water in off-sunshine/nighttime. Therefore, the main aim of this study was to overcome these two issues with existing systems by integrating the thermal energy storage unit. However, although the integration of stearic acid as a PCM with SWH increases the energy efficiency of existing systems, it is not enough to determine their economic viability and commercial applicability. Therefore, it is also required to analyze the economic analysis of the stearic acid (PCM) integrated SWH system. Therefore, a detailed economic analysis of the newly developed SWH system has been conducted, and its results compared with a conventional SWH system of the same configuration.
The levelized cost of water heating (LCWH) is an important parameter of economic study, as it measures collector A and collector B based on their prices. It provides the economic viability of a newly developed SWH system. It shows the cost of hot water production per kg by SWH. The following equations can be used for the economic analysis of SWH systems [28,29]:
L C W H = n = 0 N 1 C n 1 + i n n = 0 N 1 E o n 1 + i n
where i is known as the rate of interest, which can be calculated as:
i = E Q R R R i + i m × D E R
Whereas the total price of solar collectors in a particular year can be calculated by using the given expression
C n = I E o n = 0 + L C n + O M n + T a n
The initial expenditure on SWH can be calculated by using the following mathematical expression:
I E o = C o × 1 D E R
In the above-written equation, the loan cost for a particular financial year can be calculated as:
L C n = C o n = 0 × D E R × 1 N + N n N × i m
The net present value (NPV) is the difference between the present value of cash inflows and outflows over a certain lifespan of solar thermal collectors. SWH’s profitability is examined using NPV in capital costing and investment planning. The net present value (NPV) of the newly designed collectors A and B can be calculated using the following equations [27]:
N P V = n = 0 N 1 C F n 1 + i n C 0
The profitability index (Pr)n represents the NPV of the funded project compared with the total initial cost. It indicates the discounted per cent return of the initially invested price, and a number greater than zero means a profit in investment. Mathematically, it can be written as [29,30]:
P r n = n = 0 N 1 C F n 1 + i n C 0 C 0
The payback period represents a return on investment for time after recovering the total expenditure cost on the newly developed SWH system. It is mainly used to guess the economic sustainability of capital assets. Moreover, the payback period of the developed system must be less than the total lifespan of the solar collector. The following mathematical expression calculates the payback period considering the recovery on investment and overall useful thermal energy gain from the developed collector [8]:
P B p = C 0 A R n C n
The enviroeconomic analysis based on CO2 emission has been discussed in this section. The newly developed evacuated tube solar collector working on solar energy, which is clean, reduces CO2 emissions. The thermal power plant emits almost 980 gCO2 to generate one unit (kWh) of electricity. The amount of CO2 emissions increases to 2 kg of Co2/kWh. Therefore, saving on CO2 emissions ( β e , C O 2 ) can be calculated as [23]:
β e , C O 2 = C O 2 × N × Q u , E G Y 1000
β e x , C O 2 = C O 2 × N × Q u , E X G Y 1000

4.5. Experimental Error Analysis

To determine the accuracy of recorded data, the error analysis of measurements is investigated. A substantial amount, in general, cannot be described clearly but depends on parameters that can be assessed directly and are referred to as errors [31]. This study determines how errors related to each computed variable influence the measured amount value. It can be written as:
U z = i δ Y δ X i 2 U x i 2
For example, the temperature sensors ±1 °C, solar power meter ±1.5%, and rotameter ±2% of the standard deviation. The error in exergy and energy outputs at different mass flow rates for both collectors A and B is presented in Table 2.

5. Results and Discussion

The thermal output, and economic and environmental results of both collectors A and B operated under dual modes are discussed in this section. The experiments were conducted at three mass flow rates (0.167, 0.34, and 0.50 LPM) for composite climatic conditions of Jammu, India. Each experiment was performed on a separate day.

5.1. Effect of Low Mass Flow Rate (0.167 LPM) on Various Parameters

Figure 6a–d shows the changes in solar radiation, ambient temperature, and inlet and outlet water temperatures in Test 1 for collectors A and B under simultaneous and midday charging modes. Figure 6a shows that solar radiation gradually increased from 8:00 a.m. to the afternoon (12:00 a.m.–1:00 p.m.) with minimum fluctuations. The maximum solar intensity was obtained as 1053 and 1061 W/m2 for both simultaneous and midday charging modes, respectively, in Test 1. After that, the solar radiation slowly decreased with small fluctuations due to changes in weather conditions. The fluctuation in solar intensity was found to be minimal during both days for Test 1. Therefore, the energy and exergy outputs of the proposed collectors A and B can be easily compared for Test 1 under both modes. The ambient temperature variation was observed to be 25–31 °C and 28–33 °C for both collectors at 0.167 LPM under simultaneous and midday charging modes, respectively. The temperature change with respect to time increased during the day and decreased in the evening hours. The maximum ambient temperature varied between 3 and 5 °C for Test 1 under both modes. From Figure 6b, it was found that the maximum outlet water temperature from collector B without storage reached 73.28 °C at 12:40 p.m. After that, it underway a decrement due to a drop in solar radiation till 6:00 p.m. evening. The average outlet and inlet water temperatures of collector B operated under simultaneous mode were 56.10 °C and 32.6 °C, respectively. The average temperature change between collector B’s inlet and outlet water was 23.52 °C.
Moreover, the maximum outlet water temperature from collector A with storage operated under simultaneous mode reached 64 °C at 2:40 p.m. After that it started decreasing (see Figure 6c). Due to the PCM integration, fluctuations in hot water output were minimized, and its supply was extended for few more hours because of thermal energy storage. The average outlet and inlet water temperatures of collector A were 51.30 °C and 32.11 °C, respectively, with a temperature difference of 19.19 °C.
Furthermore, from Figure 6d, it was observed that the maximum outlet water temperature of collector A with storage operated under midday charging mode reached 82.68 °C at 12:15 p.m. because of the complete charging of the PCM filled inside the evacuated tubes of a collector. After that, the outer water temperature of collector A with PCM linearly decreased until 9:00 p.m. The average outlet and inlet water temperatures of collector A operated under midday charging mode were 58.08 °C and 34.96 °C, respectively, with a temperature difference of 23.11 °C. The constant hot water obtained from collector A with storage is mainly utilized in medium-temperature household applications in residential buildings.

5.2. Effect of Medium Mass Flow Rate (0.34 LPM) on Various Parameters

Figure 7a–d shows the change in solar radiation, ambient temperature, and outlet and inlet water temperatures of both collector A and B when operated in Test 2 (0.34 LPM) under simultaneous and midday charging modes.
Test 2 was conducted on clear sunny days with minimum solar intensity changes. For both days, the solar intensity rose gradually from 8:00 a.m. to 12:35 a.m. and touched its maximum peaks of 1058 W/m2 (12:30 p.m.) and 1060 W/m2 (12:15 p.m.), respectively. After 12:35 p.m., solar intensity steadily decreased to its lowest (6:00 p.m.). In the late noon hours, there were slight variations in solar intensity due to changes in environmental conditions. Figure 7a shows the ambient temperature variation. The ambient temperature was 24–32 °C for simultaneous mode and 27–33 °C for midday charging mode for collector A.
It is observed from Figure 7b that the maximum outlet water temperature obtained was 66 °C at 12:40 p.m. After that, it dropped over time with slight variations. The reference collector’s average daily outlet and inlet water temperatures were 52.53 °C and 34.70 °C, respectively, with a temperature change of 18.20 °C. The maximum outlet temperature of collector A with PCM operated under simultaneous mode at 0.34 LPM reached 56.5 °C at 3:10 p.m., and the daily average outlet/inlet water temperatures were recorded as 47.05 °C and 32.60 °C, respectively, with a temperature difference of 14.46 °C (see Figure 7c).
Furthermore, Figure 7d shows that collector A’s maximum outlet water temperature with PCM operated under midday charging mode was 75 °C at 12:15 p.m. After that, the temperature of hot water started decreasing linearly till 9:00 p.m. The average daily outlet and inlet water temperatures of collector A with PCM were 50.01 °C and 31.65 °C, respectively.

5.3. Effect of High Mass Flow Rate (0.5 LPM) on Various Parameters

The variation of solar intensity, ambient temperature, outlet and inlet water temperatures of both collectors A and B operated under simultaneous and midday charging modes during the increased mass flow rate of water from 0.34 LPM to 0.5 LPM for Test 3 is shown in Figure 8a–d.
Similar to Test 1, Test 3 shows the change in solar intensity and ambient temperature. Solar radiation for both days increased linearly with minor fluctuations and reached maximum values of 1045 W/m2 at 12:30 p.m. and 1028 W/m2 at 12:45 p.m., respectively. The ambient temperature was 25–32 °C for simultaneous mode and 27–33 °C for midday charging mode. The variation in solar radiation and ambient temperature was less, which means that Test 3 operated under clear sunny days for both modes. It was ideal for comparing the thermal output of both collectors for a fixed mass flow rate.
At this specific flow rate, collector B without storage attained the maximum temperature of 56 °C (1:10 p.m.). The average outlet and inlet water temperatures of collector B were recorded as 46.93 °C and 35.22 °C, respectively, with a temperature difference of 11.70 °C. Collector B with PCM operated under simultaneous mode attained a maximum temperature of 51.10 °C at 2:20 p.m. (see Figure 8c). Its outlet and inlet water temperatures were recorded as 44.59 °C and 32.18 °C, respectively.
Similarly, Figure 8d shows that the maximum outlet temperature of collector A with PCM operated under midday charging mode was 70 °C at 2:15 p.m. After that, the hot water temperature dropped linearly till late evening. Its average outlet and inlet water temperatures were recorded as 47.64 °C and 33.15 °C, respectively. Thus, it can be revealed that the reference system reached the outlet’s maximal temperature before collector A with PCM for simultaneous mode. This was because the PCM filled inside the tubes of collector A required a certain amount of time to charge. The maximum change in water temperature between the outlet and inlet of both collectors was maximum at a low flow rate. This occurred because the contact period was decreased between the U-tube and the flowing fluid. At this flow rate, the temperature difference between the input and exit of collector A with PCM was more than 5 °C until 9:00 p.m. on the same day. Still, the reference system delivered water with this temperature difference until 6:00 p.m. Therefore, collector A with PCM supplied hot water at this temperature differential for about 3 h more than the reference system. The key need for SWH systems used in buildings for daily household usage, i.e., cleaning, bathing and washing, is to ensure a constant hot water supply during overcast and night periods. This is made feasible by installing a larger-than-necessary collector and storing the extra hot water in a storage tank. However, this raises the initial cost as well as the heat loss from the storage tank. Therefore, the PCM integrated U-tube based ETSCs developed in this research provide hot water in rainy/cloudy or off-sunshine periods and improve the system’s performance. In contrast, the reference system (collector B) cannot provide hot water at these times.

5.4. Effect of Mass Flow Rates on the Temperature of Air and PCM Inside the Tubes of Collectors

Figure 9a–c depicts the fluctuation of internal air temperature and phase change material temperature for collectors A and B operated under simultaneous and midday charging modes at different runs (Test 1 to Test 3). The air temperature inside the tube for collector B from 8:00 a.m. to 12:00 p.m. for three test days under a simultaneous mode of operation varied between 50 °C and 120 °C for all test days at 0.167, 0.34 and 0.50 LPM, respectively.
The average temperature of the PCM loaded within the evacuated tubes of collector-A fluctuated with time for different mass flow rates when operated in simultaneous and midday charging modes. The melting temperature of the chosen PCM (stearic acid) is 57–60 °C [32,33]. From Figure 9a–c, it is observed that the temperature of the PCM inside the U-tube heat exchanger approached the melting point after two hours, from 8:00 a.m., and the PCM begins to melt (charge) from solid to liquid. The thermal energy absorbed by the PCM is affected by the mass flow rate of a working fluid. The charging period of PCM began early in the morning (sunrise) and continued until the temperature of the PCM reached a steady value. The stability period of the PCM temperature was attained between 12:30 p.m. and 03:00 p.m. for all mass flow rates in simultaneous mode. PCM charging was high at the low flow rate compared with medium and high flow rates. During the steady PCM temperature phase, the working fluid directly absorbed the quantity of solar energy. It was discovered that the discharge process for all flow rates began after the stable phase and lasted until the complete heat absorbed by the PCM was released. Similar results were reported by Mellouli et al. [34].
Figure 9a–c illustrates the average PCM temperature within the tubes of collector A with PCM at varied water mass flow rates in midday charging mode. In this mode, the PCM within the tubes of collector A absorbed all solar energy hitting the surface area. From 8:00 a.m. until 12:00 a.m., the PCM was charged entirely; after that, the cold water flowed via collector A to operate under midday charging mode. The average PCM temperature inside the tube of collector A reached 131 °C, 125 °C, and 119 °C between 11:45 a.m. and 12:00 a.m. at respective mass flow rates of 0.167, 0.34, and 0.50 LPM, respectively. Midday charging mode increased collector A heat transfer losses. However, all flow rates had higher outlet water temperatures than simultaneous mode had.

5.5. Effect of Mass Flow Rates on the Temperature of Stored Water in Both Collectors

Figure 10a–c shows stored water temperature fluctuation over time of collectors A and B operated under dual modes. Both collectors A and B’s outlet hot water was kept in two well-insulated tanks to reduce nighttime heat loss. The researchers employed 50 mm rock wool to insulate both tanks. The collector B’s stored water temperature fluctuation over time for all three mass flow rates was 35–60 °C. The stored water temperature fluctuated during the day due to changes in the outlet hot water. After 6:00 p.m., the stored water temperature of collector B stabilized and declined due to tank thermal energy loss. At 6:00 a.m., after 22 h of operation, collector B’s insulated tank water temperature was 49.7 °C, 45.7 °C, and 41.5 °C for 0.167, 0.34, and 0.50 LPM, respectively. The water temperature profiles in storage tanks varied between 38 and 53 °C with regard to time for collector A operating in simultaneous mode on all test days (Tests 1–3). At a low flow rate (0.167 LPM), the stored water temperature was the highest compared with other flow rates, but heat loss from the storage tank to the environment was also considerable. On each day of the tests, the water temperature in the storage tank grew linearly, peaked, and then decreased until the following day at 6:00 a.m. Water stored in collector A’s insulated tank (at 6:00 a.m., 22 h after the start of operation) was 46 °C, 44 °C, and 41.7 °C for the respective mass flow rates during the simultaneous mode of operation.
In midday charging mode, collector A with PCM operation (flow of water) began at 12:00 a.m. and continued until PCM heat was released. The water temperature was highest at the beginning of the process. The temporal variation of the stored water temperature profiles was insignificant on all test days. At 6:00 a.m., 18 h after the operation, the water temperature was 49.5 °C, 45 °C, and 42.1 °C for mass flow rates at 0.167, 0.34, and 0.50 LPM, respectively. On all test days, it was noticed that the stored water temperature for both collectors exceeded 40 °C, making it suitable for domestic hot water applications.

5.6. Effect of Mass Flow Rates on Average Daily Energy and Exergy Output of Both Collectors

Figure 11a–c reveals the daily energy and exergy outputs of both collectors A and B operated under simultaneous and midday charging modes for different test runs (Test 1–Test 3). For collector B without PCM, it was found that both useful and incident energy quantities were 6.97, 8.81, and 9.31 MJ, and 11.69, 12.68, and 12.40 MJ for respective mass flow rates of 0.167, 0.34, and 0.50 LPM. In addition, collector B’s daily energy and exergy outputs were 59.62%, 69.40%, and 75.08%, and 18.52%, 16.12%, and 14.43%, respectively. Table 3 shows the thermal performance parameters of both collectors A and B at different flow rates under simultaneous and midday charging modes.
Collector A with PCM operated under simultaneous mode had the useful energy outputs of 8.44, 10.10, and 10.65 MJ for respective mass flow rates. The input energy valuesremained the same as for conventional collector B. The daily energy and exergy outputs of collector A with PCM operated under simultaneous mode were 72.15%, 79.64%, and 85.86%, and 19.41%, 17.40%, and 15.48% at 0.167, 0.34, and 0.50 LPM, respectively. Similarly, collector A with PCM was operated under midday charging mode and then used, and incident energy outputs were 8.82, 9.31, and 10.39 MJ, and 12.42, 12.04, and 12.33 MJ for their respective mass flow rates. The daily energy and exergy outputs of collector A with PCM under midday charging mode were 70.97%, 77.35%, and 84.27%, and 21.35%, 17.83%, and 16.06%, respectively. Therefore, from the results, it was summarized that the PCM-filled collector A operated under simultaneous mode produces more useful energy for all test days compared with the midday charging mode and collector B (without PCM). It generally happens because, in collector A operated under midday charging mode, the thermal losses are more and system operating hours are less than the simultaneous mode. The results show that the energy and exergy efficiencies enhancement ratio improve collector A’s energy gain over collector B. Consequently, regardless of the flow rates used, collector A with PCM operated under simultaneous mode is more efficient regarding usable energy and exergy outputs than the reference system. In addition, collector A, with PCM outputs of useable energy and exergy, continued long after the sun had set.

5.7. Effect on Economic, Enviro- and Exergoeconomic Outputs with and without Use of PCM

In this section, the economic, enviro- and exergoeconomic analysis results are discussed in detail. The current study’s economic analysis was conducted using the input parameters based on India’s market economic survey (see Table 4). This section evaluates the annual cost of hot water production, cost per liter of hot water, and payback time of both collectors operated under dual modes at different flow rates. In addition, economic factors determined for the electric geyser (EG) are compared with these values. The proposed systems are anticipated to be in operation for 15 years, and the collector’s useable energy production will decrease by 1% each year.
Figure 12a depicts the variation of bank loan cost, operation and maintenance cost, auxiliary energy, and ETC-SWH annual cost over the years for collector B. It has been found that the loan cost decreases for years because of decreasing interest amounts. It was calculated that the interest amount would be highest in the first year (INR 1871) and lowest in the fifteenth year (INR 882). Notably, 90% of the total investment is taken from the bank with an interest rate and other terms and conditions. In comparison, the investor invests the remaining amount. The O&M cost increases with the number of years because this is the function of the inflation rate [35]. It has been found that approximately INR 3057 will be required for the O&M of the proposed SWH system after 15 years. In comparison, the auxiliary energy cost is the fuel cost for running the SWH system during cloudy/rainy days. This cost also increases with the years due to inflation in electricity prices, which is assumed to be 5%, as depicted in Table 4.
Thus, due to increasing O&M and auxiliary energy costs, SWH annual costs increase with the passage of years. Approximately INR 45,999 must be paid after 15 years of working on the proposed conventional SWH system to accomplish the heat requirement. From Figure 12b, it is noticed that the revenue is the advantage gained from implementing the proposed conventional SWH system above EG. The income is growing over time due to the continually rising yearly fuel cost of electricity. It has been discovered that, by using a suggested conventional SWH system instead of an EG, over INR 65,720 can be saved after 15 years of operation. The cost per liter (CPL) of both the water heating systems collector B and EG increases over time due to increased electricity costs. The CPL for collector B was found to be 0.1314 INR/L on average and 0.325 INR/L for EG. According to the input economic parameters assessed, the levelized energy cost (LEC), net present worth (NPW), and payback time (PBT) were determined to be 4.82 INR/kWh, 41,290 INR, and 5.05 years, respectively, for collector B without PCM. Similar to conventional collector B, the variation of the loan cost, O&M cost, auxiliary energy, and ETC-SWH annual cost of collector A with PCM operated under simultaneous and midday charging modes are presented in Figure 13a and Figure 14a. It was calculated that the interest amount would be highest in the first year (INR 2010 for simultaneous mode and INR 2011 for midday charging mode) and lowest in the fifteenth year (INR 948 for both modes). It has been found that approximately INR 3284 and INR 3286 will be required for the O&M of collector A with PCM operated under simultaneous and midday charging modes after 15 years. The annual costs of collector A with PCM increase over years. INR 51,230 and INR 50,683 must be paid after 15 years of working on the proposed system under simultaneous and midday charging modes to accomplish the heat requirement.
Figure 13b and Figure 14b show that collector A’s revenue with PCM was INR 78,615 and INR 76,252 when operated under simultaneous and midday charging modes, respectively. The cost per liter of hot water generation by the PCM integrated collector A was INR 0.1261 and INR 0.1276 under dual modes, whereas the CPL of EG was found to be INR 0.325. The levelized energy cost (LEC), net present value (NPW), and the payback time (PBT) for collector A with PCM under simultaneous and midday charging modes were calculated to be 4.61 and 4.67 INR/kWh, INR 49,710 and INR 48,130 and 4.49 and 4.64 years, and INR 41,290, respectively, based on the input economic factors evaluated. The values of these criteria indicate that deploying the suggested solar collector system is highly profitable economically.
Figure 15 depicts the quantity of CO2 mitigation by the proposed SWH system for electric geysers to reduce carbon dioxide emissions into the atmosphere for various tests. The amount of CO2 mitigation by the developed SWH system was calculated to be 20.88, 24.30, and 23.76 tCO2/lifetime for a conventional collector, collector A with PCM (simultaneous mode), and collector A with PCM (midday charging mode), respectively, based on useable energy output. Conversely, it was determined that the suggested system mitigates 4.95, 5.31, and 5.58 tCO2/lifetime for a conventional collector, collector A with PCM (simultaneous mode), and collector A with PCM (midday charging mode), respectively, based on useable exergy output. These calculations demonstrate that the suggested system is advantageous in terms of energy and exergetic efficiency and economics, and reduces CO2 emissions into the atmosphere.
The proposed SWH system’s energoeconomic, exergoeconomic, and economic characteristics are calculated and compared with EG and presented in Table 5, Table 6 and Table 7 for conventional collector, and collector A with PCM operated under simultaneous and midday charging modes, and also shows the impact of operating life and bank interest rates on these variables. These numbers have been derived from typical daily hot water outputs, usable energy, and exergy gain. It has been found that the uniform yearly cost rises with an increase in the bank interest rate; hence the CPL value of the suggested system grows for a given lifespan. However, the change in interest rate has zero impact on the CPL price of electric geysers. There is also a rise in the average yearly cost and CPL value of the developed SWH systems and EG as the expected lifetime of the system is extended. The energoeconomic and exergoeconomic benefits decline as the standard cost per year rises. From an energoeconomic, exergoeconomic, and economic vantage point, it can be said that the suggested arrangement is preferable in residential water heating applications [36].

6. Conclusions and Future Recommendations

6.1. Conclusions

This experimental work performed a comprehensive 4E analysis of newly designed U-tube based ETSCs with and without PCM at three flow rates under the composite climate of Jammu, India. In this study, stearic acid was selected as the PCM from deep literature analysis and filled inside the evacuated tubes of collector A, while collector B was left empty without PCM, and was known as the reference collector. Integrating PCM with a collector eliminates the need for additional space/arrangement for energy storage material and provides constant hot water during cloudy or nighttime conditions with increased thermal performance. It will also reduce the carbon footprint compared with EG. The conclusions have been made from the experimental investigation:
  • Integrating copper fin with U-tube of collector A would increase the heat transfer rate between the U-tube and phase change material;
  • The energy and exergy outputs of collector A, operated under dual modes, were higher than collector B;
  • The maximum energy efficiency of collector A was 85.86% (simultaneous mode) and 84.27% (midday charging mode), whereas for collector B it was 75.08% at 0.5 LPM. In contrast, the exergy efficiencies were found to be 19.41% and 21.35% for collector A, and 18.52% for collector B at a low flow rate (0.167 LPM) for the same modes;
  • The energy enhancement ratio of collector A was obtained in the 14.35–21.01% range compared with collector B. In contrast, the exergy enhancement ratio of collector A was obtained in the range of 7.2–15.25% compared with collector B;
  • The CPL of collector A was found to be INR 0.1261 for simultaneous mode and INR 0.1276 for midday charging mode, which is much less than the CPL of EG (INR 0.325);
  • The levelized energy cost, net present worth, and the payback time of collector A were found to be 4.61 INR/kWh, INR 49710, and 4.49 years (S), and 4.67 INR/kWh, INR 48130, and 4.64 years (M), respectively;
  • The amount of CO2 mitigation from the energy and exergy perspectives for collector A was 24.30 for simultaneous mode, 23.76 tCO2/lifetime for midday charging mode, and 5.31 and 5.58 tCO2/lifetime for the same modes, respectively.

6.2. Future Recommendations

Optimization and experimental investigations using nano-enhanced PCMs are advised for future system improvement. To develop more effective finned storage systems, scientists will need to consider the PCMs’ cycle performance, long-term stability, and overall environmental impact. Additionally, the heat transmission model of PCMs should be studied in the future with various PCM kinds, porous materials, PCM filling ratio, and seasonal changes taken into account.

Author Contributions

S.K.P.: writing—original draft, investigation, methodology, acquisition of data, review and editing, V.V.T.: writing, reviewing and editing, supervision, K.C.: methodology, writing, review and editing, A.K.P.: formal analysis, reviewing and editing, A.S.: writing- reviewing and editing. All authors have read and agreed to the published version of the manuscript.

Funding

This work was supported by Shri Mata Vaishno Devi University, Katra (J&K) through the Research Project with Unique ID as RP-141 (Japan International Cooperation Agency Project for AUN/SEED-NET and University of Malaya Malaysia).

Data Availability Statement

Data should be made available on request.

Conflicts of Interest

The authors declare that they have no known competing financial interests or personal relationships that could have appeared to influence the work reported in this paper.

Nomenclature

A a p e r t u r e Aperture area of the collector (m2) β e n , C O 2 Saving on CO2 emission from energy
C H T F Specific heat of working fluid (J/kg·K) β e x , C O 2 Saving on CO2 emission from exergy
C F n Cash flow cost (INR) I E o Initial expenditure cost (INR)
C o Initial cost (INR) V i and V o Velocity at inlet and outlet (m/s)
D E R Debt–equity ratio ψ i and ψ o Energy function at inlet and outlet
d R Depreciation rate (%) L C n Loan cost for a particular financial year
E x i Exergy at the inlet (J)
E x o Exergy at the outlet (J)
E x l o s s Exergy loss (J)
E x i n c Exergy incident on aperture area (J)
I G Incident solar radiation (W/m2)
Q u ˙ Useful amount of heat (J)
Q u , E X G Y Useful exergy from predicted model
Q u , E G Y Useful energy from predicted model
m H T F ˙ Mass flow rate of working fluid (LPM)
P B P Payback period (years)
i Interest (%)
iR Reverse interest rate (%)
n Number of years
T i , H T F Working fluid inlet temperature (°C)
T o , H T F Working fluid outlet temperature (°C)
T a t m Atmospheric temperature (°C)
τ Time strap (sec)
T s u n Temperature of sun (°C)
U l o s s Overall heat transfer loss
η D E E Daily energy efficiency (%)
η D E X E Daily exergy efficiency (%)

Abbreviations

CFD—Computational fluid dynamics
HTF—Heat transfer fluid
INR—Indian rupees
LCWH—Levelized cost of water heating
NPV—Net present worth
EER—Efficiency enhancement ratio
LHS—Latent heat storage
SWH—Solar water heater
ETC—Evacuated tube collector
ETSC—Evacuated tube solar collector
FPC—Flat plate collector
PCM—Phase change material
TES—Thermal energy storage

References

  1. Soares, N.; Costa, J.J.; Gaspar, A.R.; Santos, P. Review of passive PCM latent heat thermal energy storage systems towards buildings’ energy efficiency. Energy Build. 2013, 59, 82–103. [Google Scholar] [CrossRef]
  2. Yao, S.; Yang, L.; Shi, S.; Zhou, Y.; Long, M.; Zhang, W.; Cai, S.; Huang, C.; Liu, T.; Zou, B. A Two-in-One Annealing Enables Dopant Free Block Copolymer Based Organic Solar Cells with over 16% Efficiency. Chin. J. Chem. 2023, 41, 672–678. [Google Scholar] [CrossRef]
  3. Souayfane, F.; Fardoun, F.; Biwole, P.-H. Phase change materials (PCM) for cooling applications in buildings: A review. Energy Build. 2016, 129, 396–431. [Google Scholar] [CrossRef]
  4. Fan, R.; Li, Y.; Bu, T.; Sun, K.; Zhou, Y.; Shi, J.; Zhang, X. Comparative study of solar hot air heating systems with phase change materials in plateau areas. Energy Build. 2020, 224, 110265. [Google Scholar] [CrossRef]
  5. Aoul, K.T.; Hasan, A.; Riaz, H. Solar water heating systems for different buildings under a hot climate; parametric optimization and economic analysis. Sustain. Build. 2018, 3, 3. [Google Scholar] [CrossRef]
  6. Chopra, K.; Tyagi, V.; Pathak, A.K.; Pandey, A.; Sari, A. Experimental performance evaluation of a novel designed phase change material integrated manifold heat pipe evacuated tube solar collector system. Energy Convers. Manag. 2019, 198, 111896. [Google Scholar] [CrossRef]
  7. Pathak, S.K.; Tyagi, V.; Chopra, K.; Sharma, R.K. Recent development in thermal performance of solar water heating (SWH) systems. Mater. Today Proc. 2022, 63, 778–785. [Google Scholar] [CrossRef]
  8. Pathak, S.K.; Tyagi, V.; Chopra, K.; Rejikumar, R.; Pandey, A. Integration of emerging PCMs and nano-enhanced PCMs with different solar water heating systems for sustainable energy future: A systematic review. Sol. Energy Mater. Sol. Cells 2023, 254, 112237. [Google Scholar] [CrossRef]
  9. Baneshi, M.; Bahreini, S.A. Impacts of hot water consumption pattern on optimum sizing and techno-economic aspects of residential hybrid solar water heating systems. Sustain. Energy Technol. Assess. 2018, 30, 139–149. [Google Scholar] [CrossRef]
  10. Fuentes, E.; Arce, L.; Salom, J. A review of domestic hot water consumption profiles for application in systems and buildings energy performance analysis. Renew. Sustain. Energy Rev. 2018, 81, 1530–1547. [Google Scholar] [CrossRef]
  11. Chopra, K.; Tyagi, V.V.; Pandey, A.K. Thermodynamic and techno-economic analysis of heat pipe ETC water heating system for Indian composite climate. J. Therm. Anal. Calorim. 2019, 139, 1395–1407. [Google Scholar] [CrossRef]
  12. Naghavi, M.; Ong, K.; Badruddin, I.; Mehrali, M.; Metselaar, H. Thermal performance of a compact design heat pipe solar collector with latent heat storage in charging/discharging modes. Energy 2017, 127, 101–115. [Google Scholar] [CrossRef]
  13. Xue, H.S. Experimental investigation of a domestic solar water heater with solar collector coupled phase-change energy storage. Renew. Energy 2016, 86, 257–261. [Google Scholar] [CrossRef]
  14. Abokersh, M.H.; El-Morsi, M.; Sharaf, O.; Abdelrahman, W. On-demand operation of a compact solar water heater based on U-pipe evacuated tube solar collector combined with phase change material. Sol. Energy 2017, 155, 1130–1147. [Google Scholar] [CrossRef]
  15. O’neil, T.J.; Sobhansarbandi, S. Thermal performance investigation of energy storage based U-pipe evacuated tube solar collector: An experimental study. Sustain. Energy Technol. Assess. 2022, 52, 102146. [Google Scholar] [CrossRef]
  16. Li, Y.; Liang, X.; Song, W.; Li, T.; Wang, D.; Liu, Y. Optimization and thermal performance of U-type evacuated tube solar collector filled with phase change material. Energy Rep. 2022, 8, 6126–6138. [Google Scholar] [CrossRef]
  17. Huang, K.; Feng, G.; Zhang, J. Experimental and numerical study on phase change material floor in solar water heating system with a new design. Sol. Energy 2014, 105, 126–138. [Google Scholar] [CrossRef]
  18. Essa, M.A.; Asal, M.; Saleh, M.A.; Shaltout, R. A comparative study of the performance of a novel helical direct flow U-Tube evacuated tube collector. Renew. Energy 2020, 163, 2068–2080. [Google Scholar] [CrossRef]
  19. Nemati, H.; Souriaee, V.; Habibi, M.; Vafai, K. Design and Taguchi-based optimization of the latent heat thermal storage in the form of structured porous-coated pipe. Energy 2023, 263, 125947. [Google Scholar] [CrossRef]
  20. Ao, C.; Yan, S.; Zhao, S.; Hu, W.; Zhao, L.; Wu, Y. Stearic acid/expanded graphite composite phase change material with high thermal conductivity for thermal energy storage. Energy Rep. 2022, 8, 4834–4843. [Google Scholar] [CrossRef]
  21. Chopra, K.; Pathak, A.K.; Tyagi, V.; Pandey, A.; Anand, S.; Sari, A. Thermal performance of phase change material integrated heat pipe evacuated tube solar collector system: An experimental assessment. Energy Convers. Manag. 2019, 203, 112205. [Google Scholar] [CrossRef]
  22. Chopra, K.; Tyagi, V.; Pandey, A.; Popli, S.; Singh, G.; Sharma, R.; Sari, A. Effect of simultaneous & consecutive melting/solidification of phase change material on domestic solar water heating system. Renew. Energy 2022, 188, 329–348. [Google Scholar] [CrossRef]
  23. Pathak, S.K.; Tyagi, V.; Chopra, K.; Kalidasan, B.; Pandey, A.; Goel, V.; Saxena, A.; Ma, Z. Energy, exergy, economic and environmental analyses of solar air heating systems with and without thermal energy storage for sustainable development: A systematic review. J. Energy Storage 2023, 59, 106521. [Google Scholar] [CrossRef]
  24. Essa, M.A.; Rofaiel, I.Y.; Ahmed, M.A. Experimental and Theoretical Analysis for the Performance of Evacuated Tube Collector Integrated with Helical Finned Heat Pipes using PCM Energy Storage. Energy 2020, 206, 118166. [Google Scholar] [CrossRef]
  25. Pandey, A.; Laghari, I.A.; Kumar, R.R.; Chopra, K.; Samykano, M.; Abusorrah, A.M.; Sharma, K.; Tyagi, V. Energy, exergy, exergoeconomic and enviroeconomic (4-E) assessment of solar water heater with/without phase change material for building and other applications: A comprehensive review. Sustain. Energy Technol. Assess. 2021, 45, 101139. [Google Scholar] [CrossRef]
  26. Petela, R. Exergy of undiluted thermal radiation. Sol. Energy 2003, 74, 469–488. [Google Scholar] [CrossRef]
  27. Chopra, K.; Tyagi, V.; Pathak, S.K.; Tripathi, P.A.; Sharma, R.; Singh, G.; Pandey, A. Thermal and chemical reliability of paraffin wax and its impact on thermal performance and economic analysis of solar water heater. Energy Sustain. Dev. 2023, 73, 39–53. [Google Scholar] [CrossRef]
  28. Rezvani, S.; Bahri, P.; Urmee, T.; Baverstock, G.; Moore, A. Techno-economic and reliability assessment of solar water heaters in Australia based on Monte Carlo analysis. Renew. Energy 2017, 105, 774–785. [Google Scholar] [CrossRef]
  29. Tewari, K.; Dev, R. Exergy, Environmental and Economic Analysis of Modified Domestic Solar Water Heater with Glass-to-Glass PV Module; Elsevier Ltd.: Amsterdam, The Netherlands, 2019; Volume 170. [Google Scholar] [CrossRef]
  30. Hossain, M.S.; Pandey, A.K.; Tunio, M.A.; Selvaraj, J.; Hoque, K.E.; Rahim, N.A. Thermal and economic analysis of low-cost modified flat-plate solar water heater with parallel two-side serpentine flow. J. Therm. Anal. Calorim. 2015, 123, 793–806. [Google Scholar] [CrossRef]
  31. Abo-Elfadl, S.; Yousef, M.S.; Hassan, H. Energy, exergy, and enviroeconomic assessment of double and single pass solar air heaters having a new design absorber. Process. Saf. Environ. Prot. 2020, 149, 451–464. [Google Scholar] [CrossRef]
  32. Alwaeli, A.H.A.; Kazem, H.A.; Chaichan, M.T.; Sopian, K. Experimental investigation of using nano-PCM/nanofluid on a photovoltaic thermal system (PVT): Technical and economic study. Therm. Sci. Eng. Prog. 2019, 11, 213–230. [Google Scholar] [CrossRef]
  33. Murali, G.; Mayilsamy, K.; Arjunan, T.V. An Experimental Study of PCM-Incorporated Thermosyphon Solar Water Heating System. Int. J. Green Energy 2014, 12, 978–986. [Google Scholar] [CrossRef]
  34. Mellouli, S.; Alqahtani, T.; Algarni, S. Parametric Analysis of a Solar Water Heater Integrated with PCM for Load Shifting. Energies 2022, 15, 8741. [Google Scholar] [CrossRef]
  35. Azari, P.; Lavasani, A.M.; Rahbar, N.; Yazdi, M.E. Performance enhancement of a solar still using a V-groove solar air collector—Experimental study with energy, exergy, enviroeconomic, and exergoeconomic analysis. Environ. Sci. Pollut. Res. 2021, 28, 65525–65548. [Google Scholar] [CrossRef] [PubMed]
  36. Pawar, V.R.; Sobhansarbandi, S. Heat transfer enhancement of a PCM-porous metal based heat pipe evacuated tube solar collector: An experimental study. Sol. Energy 2023, 251, 106–118. [Google Scholar] [CrossRef]
Figure 1. Promotion of solar collectors in the various energy schemes in buildings.
Buildings 13 01212 g001
Figure 2. (A) Hot water uses per home and person in different countries (B) Domestic hot water use pattern per household in different seasons [10].
Buildings 13 01212 g002
Figure 3. Schematic arrangement of the designed PCM integrated ETSC.
Buildings 13 01212 g003
Figure 4. Schematic arrangement of the experimental test ring (collector A and collector B).
Buildings 13 01212 g004
Figure 5. A flow chart of processes involved in the experimental procedure of the current study.
Buildings 13 01212 g005
Figure 6. (a) Variation of solar radiation and ambient temperature for both modes in Test 1 and variation of outlet and inlet water temperature, (b) for collector B without PCM, (c) for collector A with PCM under simultaneous mode, and (d) for a collector with PCM under midday charging mode.
Buildings 13 01212 g006
Figure 7. (a) Variation of solar intensity and ambient temperature for both collectors under dual modes and change in outlet and inlet water temperatures, (b) for collector B without PCM, (c) for collector A with PCM under simultaneous mode, and (d) for collector A with PCM under midday charging mode for Test 2.
Buildings 13 01212 g007
Figure 8. (a) Variation of solar intensity and ambient temperature for both simultaneous and midday charging modes in Test 3 and variation of outlet and inlet water temperature, (b) for reference collector B without PCM, (c) for collector A with PCM under simultaneous mode, and (d) for collector A with PCM under midday charging mode for Test 3.
Buildings 13 01212 g008
Figure 9. Variation of air and PCM temperature inside the evacuated tubes of both collectors at (a) 0.167 LPM, (b) 0.34 LPM, and (c) 0.5 LPM mass flow rates under simultaneous and midday charging modes.
Buildings 13 01212 g009
Figure 10. Variation of stored water temperature into the insulated tank for both collectors at (a) 0.167 LPM, (b) 0.34 LPM, and (c) 0.5 LPM mass flow rates under simultaneous and midday charging modes.
Buildings 13 01212 g010
Figure 11. Average daily energy and exergy outputs (a) for collector B without PCM under simultaneous mode and (b,c) for collector A with PCM under simultaneous and midday charging modes.
Buildings 13 01212 g011
Figure 12. (a) Variation of the loan cost, O&M cost, auxiliary energy and ETC-SWH annual cost, and (b) CPL of EG and collector B with generated revenue and annual fuel cost.
Buildings 13 01212 g012
Figure 13. (a) Variation of loan cost, O&M cost, auxiliary energy, and ETC-SWH annual cost, and (b) CPL of EG and collector A operated under simultaneous mode with generated revenue and annual fuel cost.
Buildings 13 01212 g013
Figure 14. (a) Variation of loan cost, O&M cost, auxiliary energy, and ETC-SWH annual cost, and (b) CPL of EG and collector A operated under midday charging mode with generated revenue and annual fuel cost.
Buildings 13 01212 g014
Figure 15. CO2 mitigation from energetic and exergetic outputs of both collectors A and B.
Buildings 13 01212 g015
Table 1. Detailed specifications of the test setup components.
ComponentPropertiesValue
Evacuated tubeOuter/inner diameters58 mm and 47 mm
Thickness of tube1800 mm
Length of tube1800 m
Specific heat980 (J/kg K)
Thermal conductivity1.14 (W/m K)
Transmissivity0.92
Absorber coatingThickness of coating0.1 mm
Three target ALN/SS/CuAbsorptivity0.92
Emissivity0.08
Heat exchangerLength of tube1700 mm
(U-tube of copper)Outer/inner dia. of tube8 mm and 7.5 mm
Fin materialCopper
Fin thickness0.5 mm
Fin length1600 mm
Thermal conductivity385 W/m K
Density of copper8830 kg/m3
CollectorAperture area0.490 m2
Table 2. Error analysis results in daily energy and exergy outputs of both collectors.
Type of SystemFlow Rate (LPM)Daily Energy Efficiency (%)Error (%)Daily Exergy Efficiency (%)Error (%)
Collector B (reference system)0.16759.62 ± 1.911.1318.52 ± 0.01131.13
0.3469.40 ± 2.181.5116.12 ± 0.01441.44
0.5075.08 ± 3.012.2614.43 ± 0.01971.97
Collector A with PCM
(simultaneous mode)
0.16772.15 ± 1.841.3219.41 ± 0.01221.21
0.3479.64 ± 2.441.9417.40 ± 0.01531.53
0.5085.75 ± 2.852.4515.48 ± 0.01931.93
Collector A with PCM
(midday charging mode)
0.16770.93 ± 1.511.0721.35 ± 0.01011.01
0.3477.86 ± 1.931.5117.83 ± 0.01431.43
0.5084.27 ± 2.422.0316.06 ± 0.01751.75
Table 3. Thermal output parameters of both collectors at different flow rates under simultaneous and midday charging modes.
Type of the CollectorMass Flow
Rate (LPM)
Daily Incident Energy (MJ)Daily Useful
Energy (MJ)
Daily Energy
Efficiency (%)
Daily Exergy
Efficiency (%)
Collector B without PCM (reference collector)0.16711.696.9759.6218.52
0.3412.688.8169.416.12
0.512.409.3175.0814.43
Collector A with PCM (simultaneous mode)0.16711.698.4472.1519.41
0.3412.6810.1079.6417.4
0.512.4010.6585.5615.48
Collector A with PCM (midday charging mode)0.16712.428.8270.9721.35
0.3412.049.3177.3517.83
0.512.3310.3984.2716.06
Table 4. Technical input parameters as per Indian market survey used in economic analysis.
Input Economic ParametersValue
Total aperture area (m2)0.49
Capital cost of collector per unit collector area (Rs/m2-aperture area)32,000
Total initial cost of solar collectors (Rs)15,810.6
Debt–equity ratio90%
Nominal interest rate8%
Debt term (years)15
Percentage of O&M cost 1.00%
Electricity price in first year (Rs/kWh)6.50
Inflation rate in electricity5.0%
Inflation rate4.5%
Rate of discount5.0%
Rate of degradation1.00%
Table 5. Energoeconomic and exergoeconomic variations with bank interest rate and life of the conventional collector without PCM.
N (Years)Interest RateUniform Annual Cost (INR)Energoeconomic Factor Based on Energy (kJ/INR)Exergoeconomic Factor Based on Energy (kJ/INR)
Proposed ETCEGProposed
ETC
EGProposed
ETC
EG
10630976604809.81379.76192.2890.17
73156794.67188.68
83216779.85185.16
12629596899847.58363.53201.2586.31
73019830.73197.25
83080814.28193.34
15628697373874.17340.16207.5680.76
72930855.97203.24
82992838.23199.03
Table 6. Energoeconomic, exergoeconomic, and economic variation with bank interest rate and life of the collector with PCM (simultaneous mode).
N (Years)Interest RateUniform Annual Cost (INR)Energoeconomic Factor Based on Energy (kJ/INR)Exergoeconomic Factor Based on Energy (kJ/INR)
Proposed ETCEGProposed
ETC
EGProposed ETCEG
10634377687849.28379.73184.7882.62
73501833.76181.40
83565818.79178.14
12632948030886.15363.51192.8079.09
73360868.75189.01
83426852.01185.37
15632088582909.91340.13197.9774.00
73275891.29193.92
83341873.69190.09
Table 7. Energoeconomic and exergoeconomic variation with bank interest rate and life of the collector with PCM (midday charging mode).
N (Years)Interest RateUniform Annual Cost (INR)Energoeconomic Factor Based on Energy (kJ/INR)Exergoeconomic Factor Based on Energy (kJ/INR)
Proposed ETCEGProposed
ETC
EGProposed
ETC
EG
10634057512837.88379.79196.3889.01
73470822.19192.70
83534807.30189.21
12632617848874.88363.53205.0585.20
73327857.52200.99
83392841.09197.14
15631728388899.43340.12210.8179.72
73238881.09206.51
83304863.49202.39
Disclaimer/Publisher’s Note: The statements, opinions and data contained in all publications are solely those of the individual author(s) and contributor(s) and not of MDPI and/or the editor(s). MDPI and/or the editor(s) disclaim responsibility for any injury to people or property resulting from any ideas, methods, instructions or products referred to in the content.

