Article

Influence of Fatigue Damage on Criticality Cell Ultimate Load Capacity of Steel–Concrete Composite Section

School of Civil Engineering, Central South University, Changsha 410075, China
*
Author to whom correspondence should be addressed.
Buildings 2023, 13(5), 1254; https://doi.org/10.3390/buildings13051254
Submission received: 7 April 2023 / Revised: 25 April 2023 / Accepted: 9 May 2023 / Published: 10 May 2023
(This article belongs to the Special Issue Advanced Materials and Novel Technique in Civil Engineering)

Abstract

:
In order to investigate the impact of fatigue damage on the ultimate load capacity of criticality cells in steel–concrete composite segments and to address the complex design challenges associated with bridge steel–concrete composite segments in practical engineering, this study designs two scaled criticality cell specimens with a scale ratio of 1:2 and performs ultimate load capacity tests after fatigue cyclic loading. By analyzing the stress distribution of each component and the force transmission ratio and combining the results from finite element model calculations, this study introduces the degree of structural fatigue damage and proposes a predictive model for the ultimate load capacity of steel–concrete composite segment criticality cells that is easy to apply. This model is compared with the finite element calculation results and experimental values, and the results are found to be in good agreement. Additionally, the number of shear connection members in the model is optimized based on the calculation results. The research findings indicate that the main failure mode of criticality cells is inclined compression failure. The strength of each part decreases in the following order: steel–concrete composite segment, steel structure segment, and concrete segment. Furthermore, fatigue damage has a significant impact on criticality cells. The optimized model exhibits similar stress performance and force transmission ratio to the original model and provides a reference for the design of practical engineering.

1. Introduction

In hybrid cable-stayed bridges, the connection between steel–concrete composite segments and steel box girders or concrete beams plays a critical role in force transmission [1,2,3,4,5,6]. Due to the significant differences in section shape and stiffness between steel girders and concrete beams, the connection between the two materials experiences unbalanced forces and uneven stiffness, leading to apparent stress concentration [7,8,9]. These challenges make it difficult to achieve a smooth transition of internal loads and deformations. Therefore, the mechanical performance of steel–concrete composite segments is vital for ensuring sufficient structural performance of hybrid cable-stayed bridges [10,11,12]. To verify the safety and rationality of the structure’s design, numerous experimental studies related to steel–concrete composite segments have been conducted by scholars [13,14,15].
In the early designs of steel–concrete composite segments, shear studs and U-shaped stiffeners were used to bond steel plates and concrete together [16,17]. However, this approach caused significant stress concentration, which adversely affected the fatigue life of the structure. The design of the composite segment was improved by incorporating a compressive plate and PBL shear connectors, as demonstrated in the Dusseldoff-Flehe Bridge in Germany [18] and the Tjorn Bridge in Sweden [19]. This design concept has been adopted in many bridge projects in China and Japan, such as the Duolun Bridge [18], the E’dong Bridge [20], and the Nujiang Bridge [21], to alleviate stress concentration and enhance the bond between steel and concrete.
Tian et al. [22] conducted fatigue tests on the steel–concrete composite section of the Chongqing Yangtze River Bridge, with 2 million cycles of fatigue loading. The authors did not observe any obvious damage or cracks on the specimens, and the static load and stress showed a linear trend after each stage of fatigue loading, indicating that the composite section has superior durability performance. Lu [23] also carried out fatigue tests on a spatial steel truss bridge and conducted relative sliding tests on the contact interface between the steel and concrete structures in the steel–concrete composite section. The results showed that the shear connectors played a crucial role in transmitting force. Xiao et al. [24,25] performed static and fatigue tests on the steel–concrete composite section of a spatial steel truss bridge. The results showed that bond failure occurred between the steel components and concrete, and the back pressure plate and shear connectors were critical force-transmitting components. Both components working together can significantly optimize the force transmission path and force ratio of the composite section. Yang [26] designed and conducted full-scale fatigue tests on the steel–concrete composite section, found that the stress at the bottom plate measuring point was generally greater than that at the top plate, and suggested that the fatigue performance of concrete has little reference value for the overall structure. Zhan [27] conducted a series of reduced-scale tests in three stages, including static, fatigue, and failure tests, on the steel–concrete composite section of the Dongping Bridge. The results showed that the main failure occurred at the connection interface between the steel plate and concrete, and the crack gradually developed with the increase in fatigue load cycles, but the overall trend tended to be stable, indicating that the bonding performance between the two gradually decreased but did not affect the fatigue performance of the overall structure. Zhou [6] conducted a validation fatigue test on the steel–concrete composite section of the Yongjiang Bridge during the design operation period of 2 million cycles. The authors did not observe any significant changes in the specimens. After adding 1 million cycles of fatigue loading, they found slight gaps at the bonding interface between the steel plate and concrete, and analysis showed that the force transmission between the steel structure and concrete mainly depended on the shear connectors.
Previous studies on the fatigue performance of high-speed railway steel–concrete composite segments are relatively scarce, and further research is needed to strengthen the investigation of the fatigue performance of high-speed railway composite segments. Currently, research on composite segments is limited to freight bridges with main spans less than 600 m. With the gradual development of large-span high-speed railway bridges, the requirements for main spans are continuously increasing. During the design phase, it is necessary to rigorously calculate and evaluate the ultimate load capacity of this type of large-span bridge during operation to ensure its safety and reliability. The impact of vehicle loads on high-speed railway composite segments cannot be ignored; therefore, research on fatigue damage is essential for evaluating the ultimate load capacity of the composite segments.
This study is based on a large-span high-speed railway composite beam cable-stayed bridge and the engineering example of the Yujiang Bridge. Using a 1:2 scale, a local model of the steel–concrete composite segment was designed. Two specimens that underwent fatigue testing were selected for axial static loading testing. The study focused on the impact of fatigue damage on the ultimate load capacity of the steel–concrete composite segment, providing design guidance for practical engineering.

2. Experiment

2.1. Specimen Parameters

The specimens were designed at a 1:2 scale based on the Yujiang Bridge, a cable-stayed bridge of a high-speed railway with low towers. The specific structure of the specimens is shown in Figure 1. To ensure that the internal forces were evenly transmitted from the steel beam to the rear compression plate, stiffeners were added to the steel beam section. In addition, to achieve better force transmission, two shear connection components, namely shear studs and PBL keys, were also designed in the specimen. In order to better simulate the force transmission state of the original bridge and consider the Saint-Venant effect, a 1 m-long concrete section and a 0.4 m-long steel beam section were added in the longitudinal direction of the composite segment. The relevant dimensions of the specimen are listed in Table 1. By considering different working conditions, the design fatigue loads of the key lattice frames were determined, and the specific combinations of working conditions are listed in Table 2. Since the shear force is relatively small compared to the axial force, the shear force effect was ignored in the design, and bending moments were applied to the specimens by adjusting the position of the loading point. As the specimens are mainly subjected to axial force, it is particularly important to study their axial load/performance and force transmission mechanism.

2.2. Arrangement of Monitoring Points

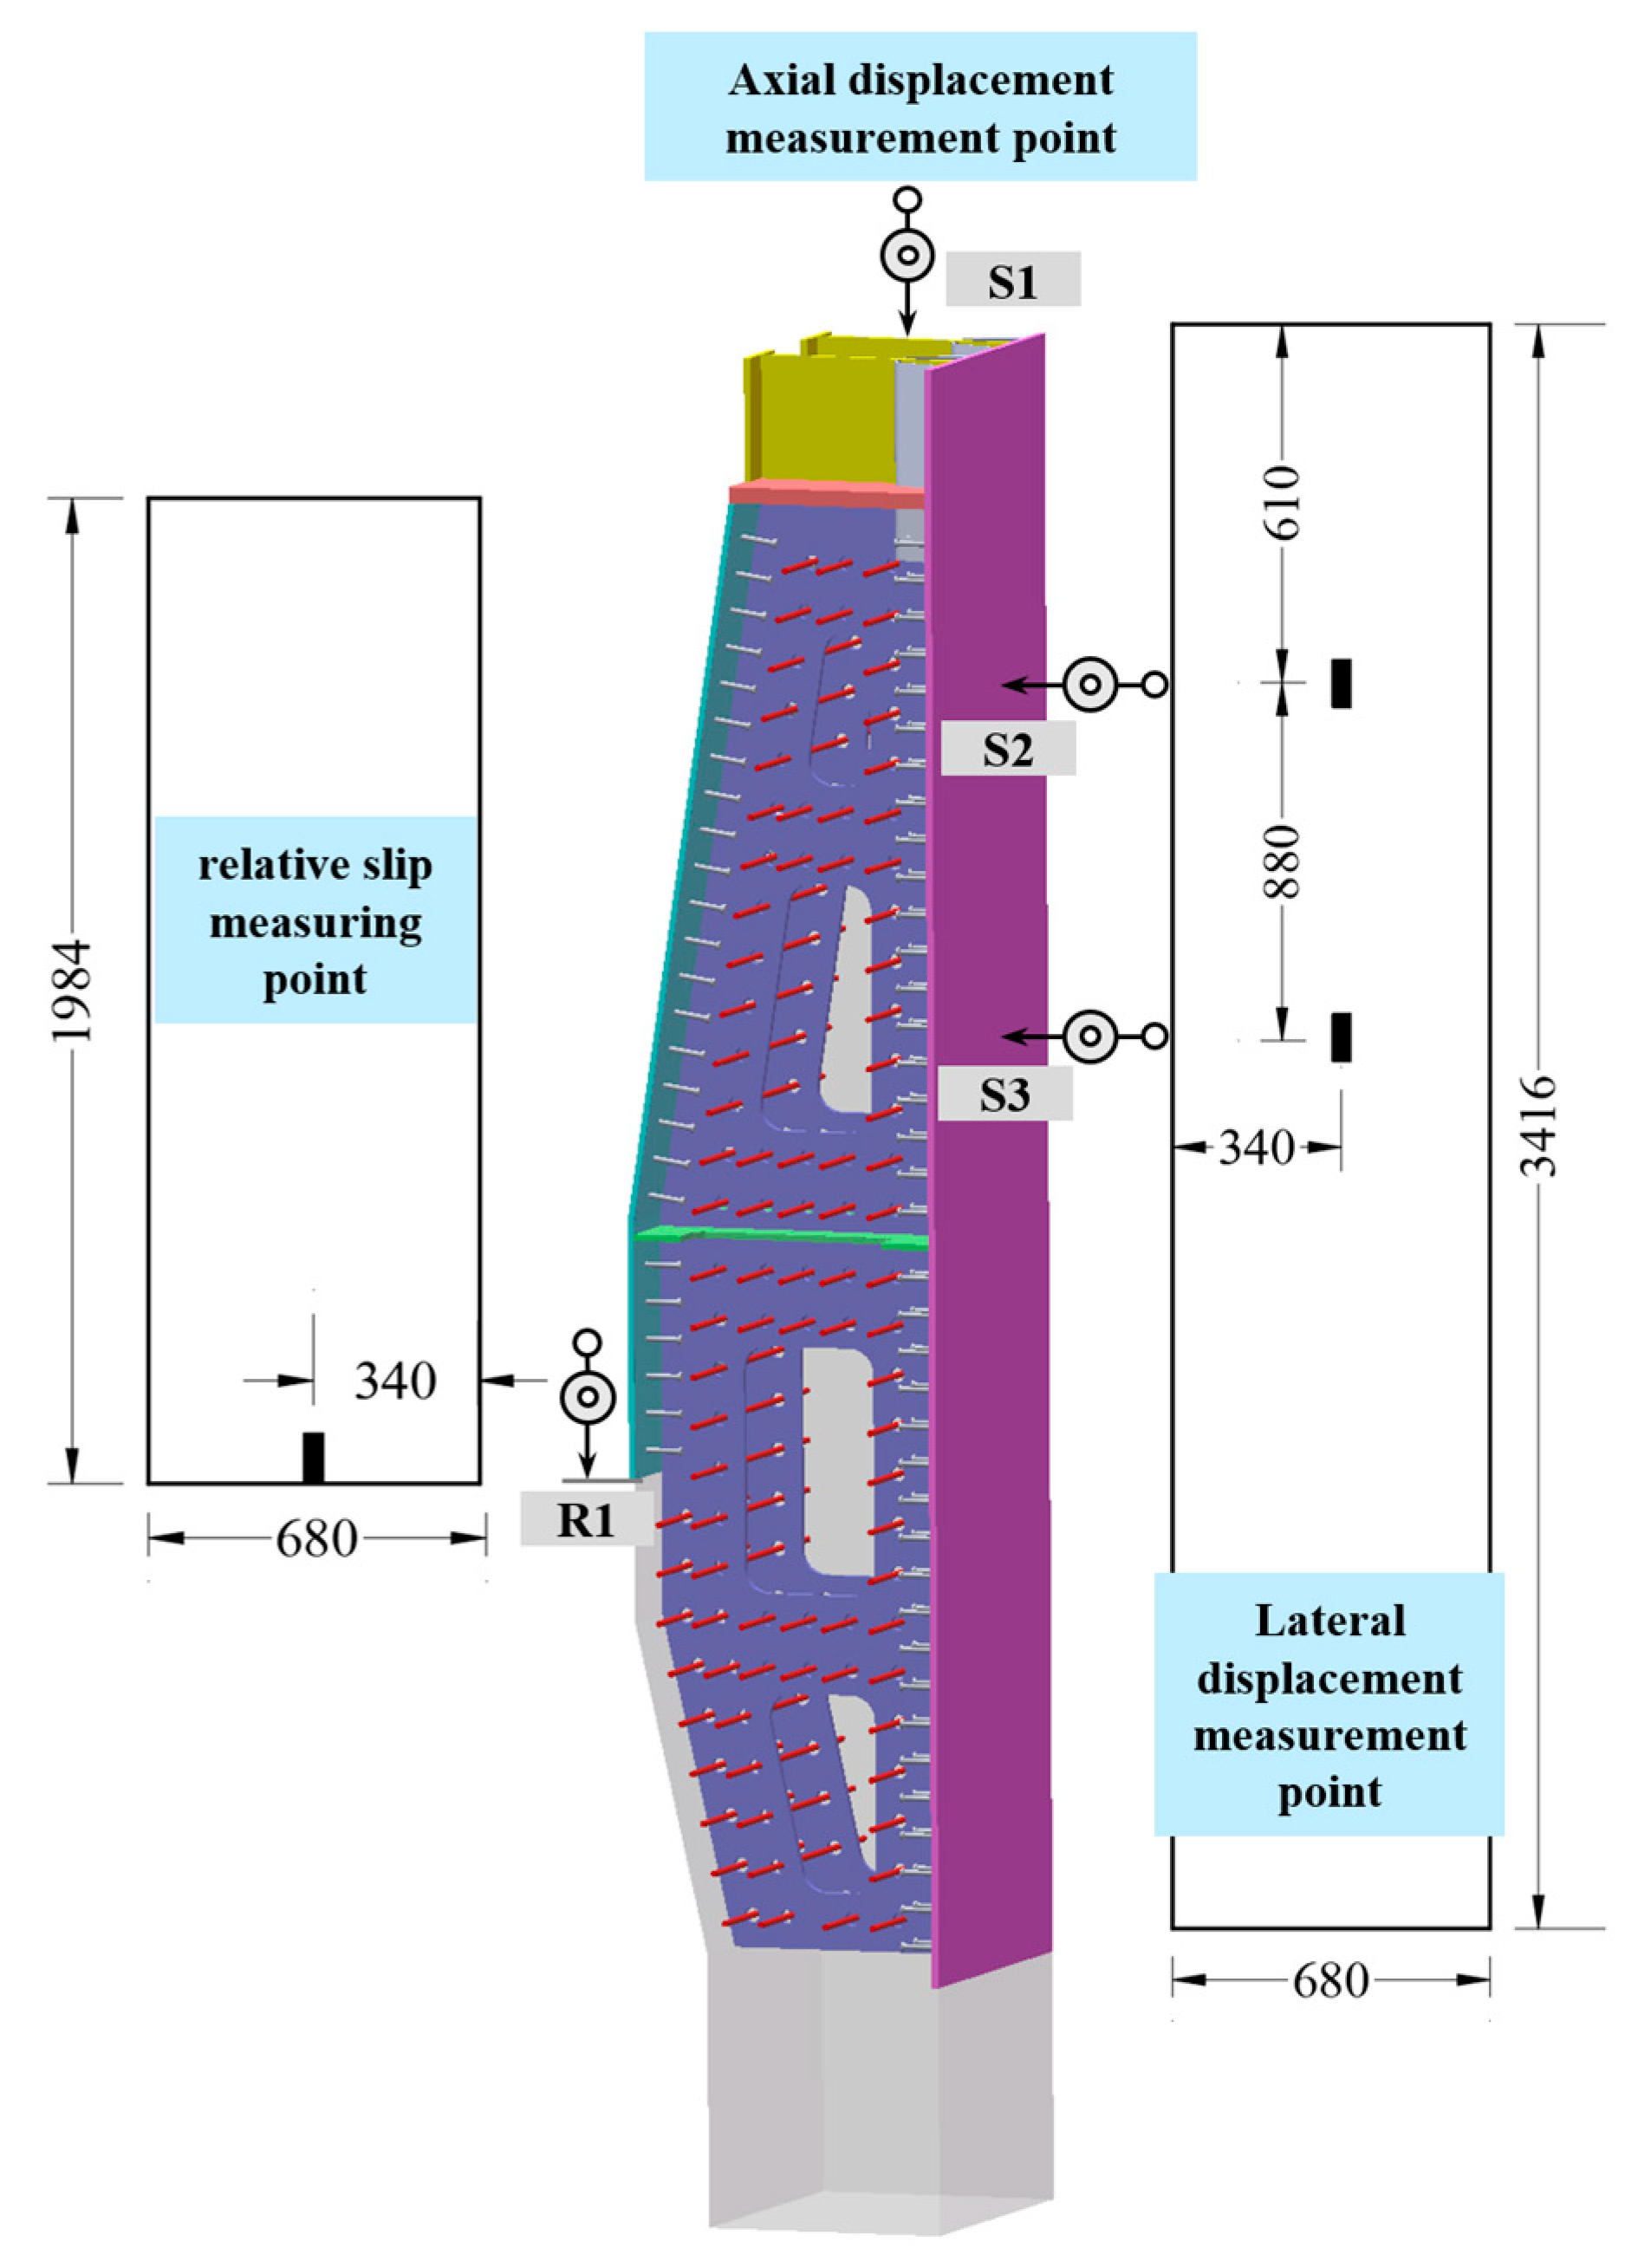
In this study, two test specimens (TP1 and TP2) were designed and fabricated with a fatigue loading frequency of 2 million and 2.5 million cycles, respectively. To investigate the effect of fatigue damage on the ultimate load capacity of the criticality cell, this study subjected the TP1 and TP2 specimens to 2.5 million and 2 million fatigue cycles, respectively, with a sinusoidal waveform and a lower limit of 40 kN, upper limit of 690 kN, and amplitude of 650 kN. Subsequently, static ultimate load capacity tests were conducted on TP1 and TP2. The results thereafter were all based on the static testing results. The main focus was to investigate the primary load transfer mechanism of the specimens in the longitudinal direction and the lateral stiffness degradation under fatigue damage. Based on the collected longitudinal displacement data, two displacement measurement points were arranged at the bottom of the specimen to explore the lateral stiffness, and relative slip measurement points were set at the top plate and concrete interface. The experiments were carried out using a 20,000 kN-class actuator for axial incremental loading, combining load and displacement control. Figure 2 illustrates the displacement measurement scheme and the actual test setup.

3. Results

3.1. Test Specimen Phenomenon and Failure Mode

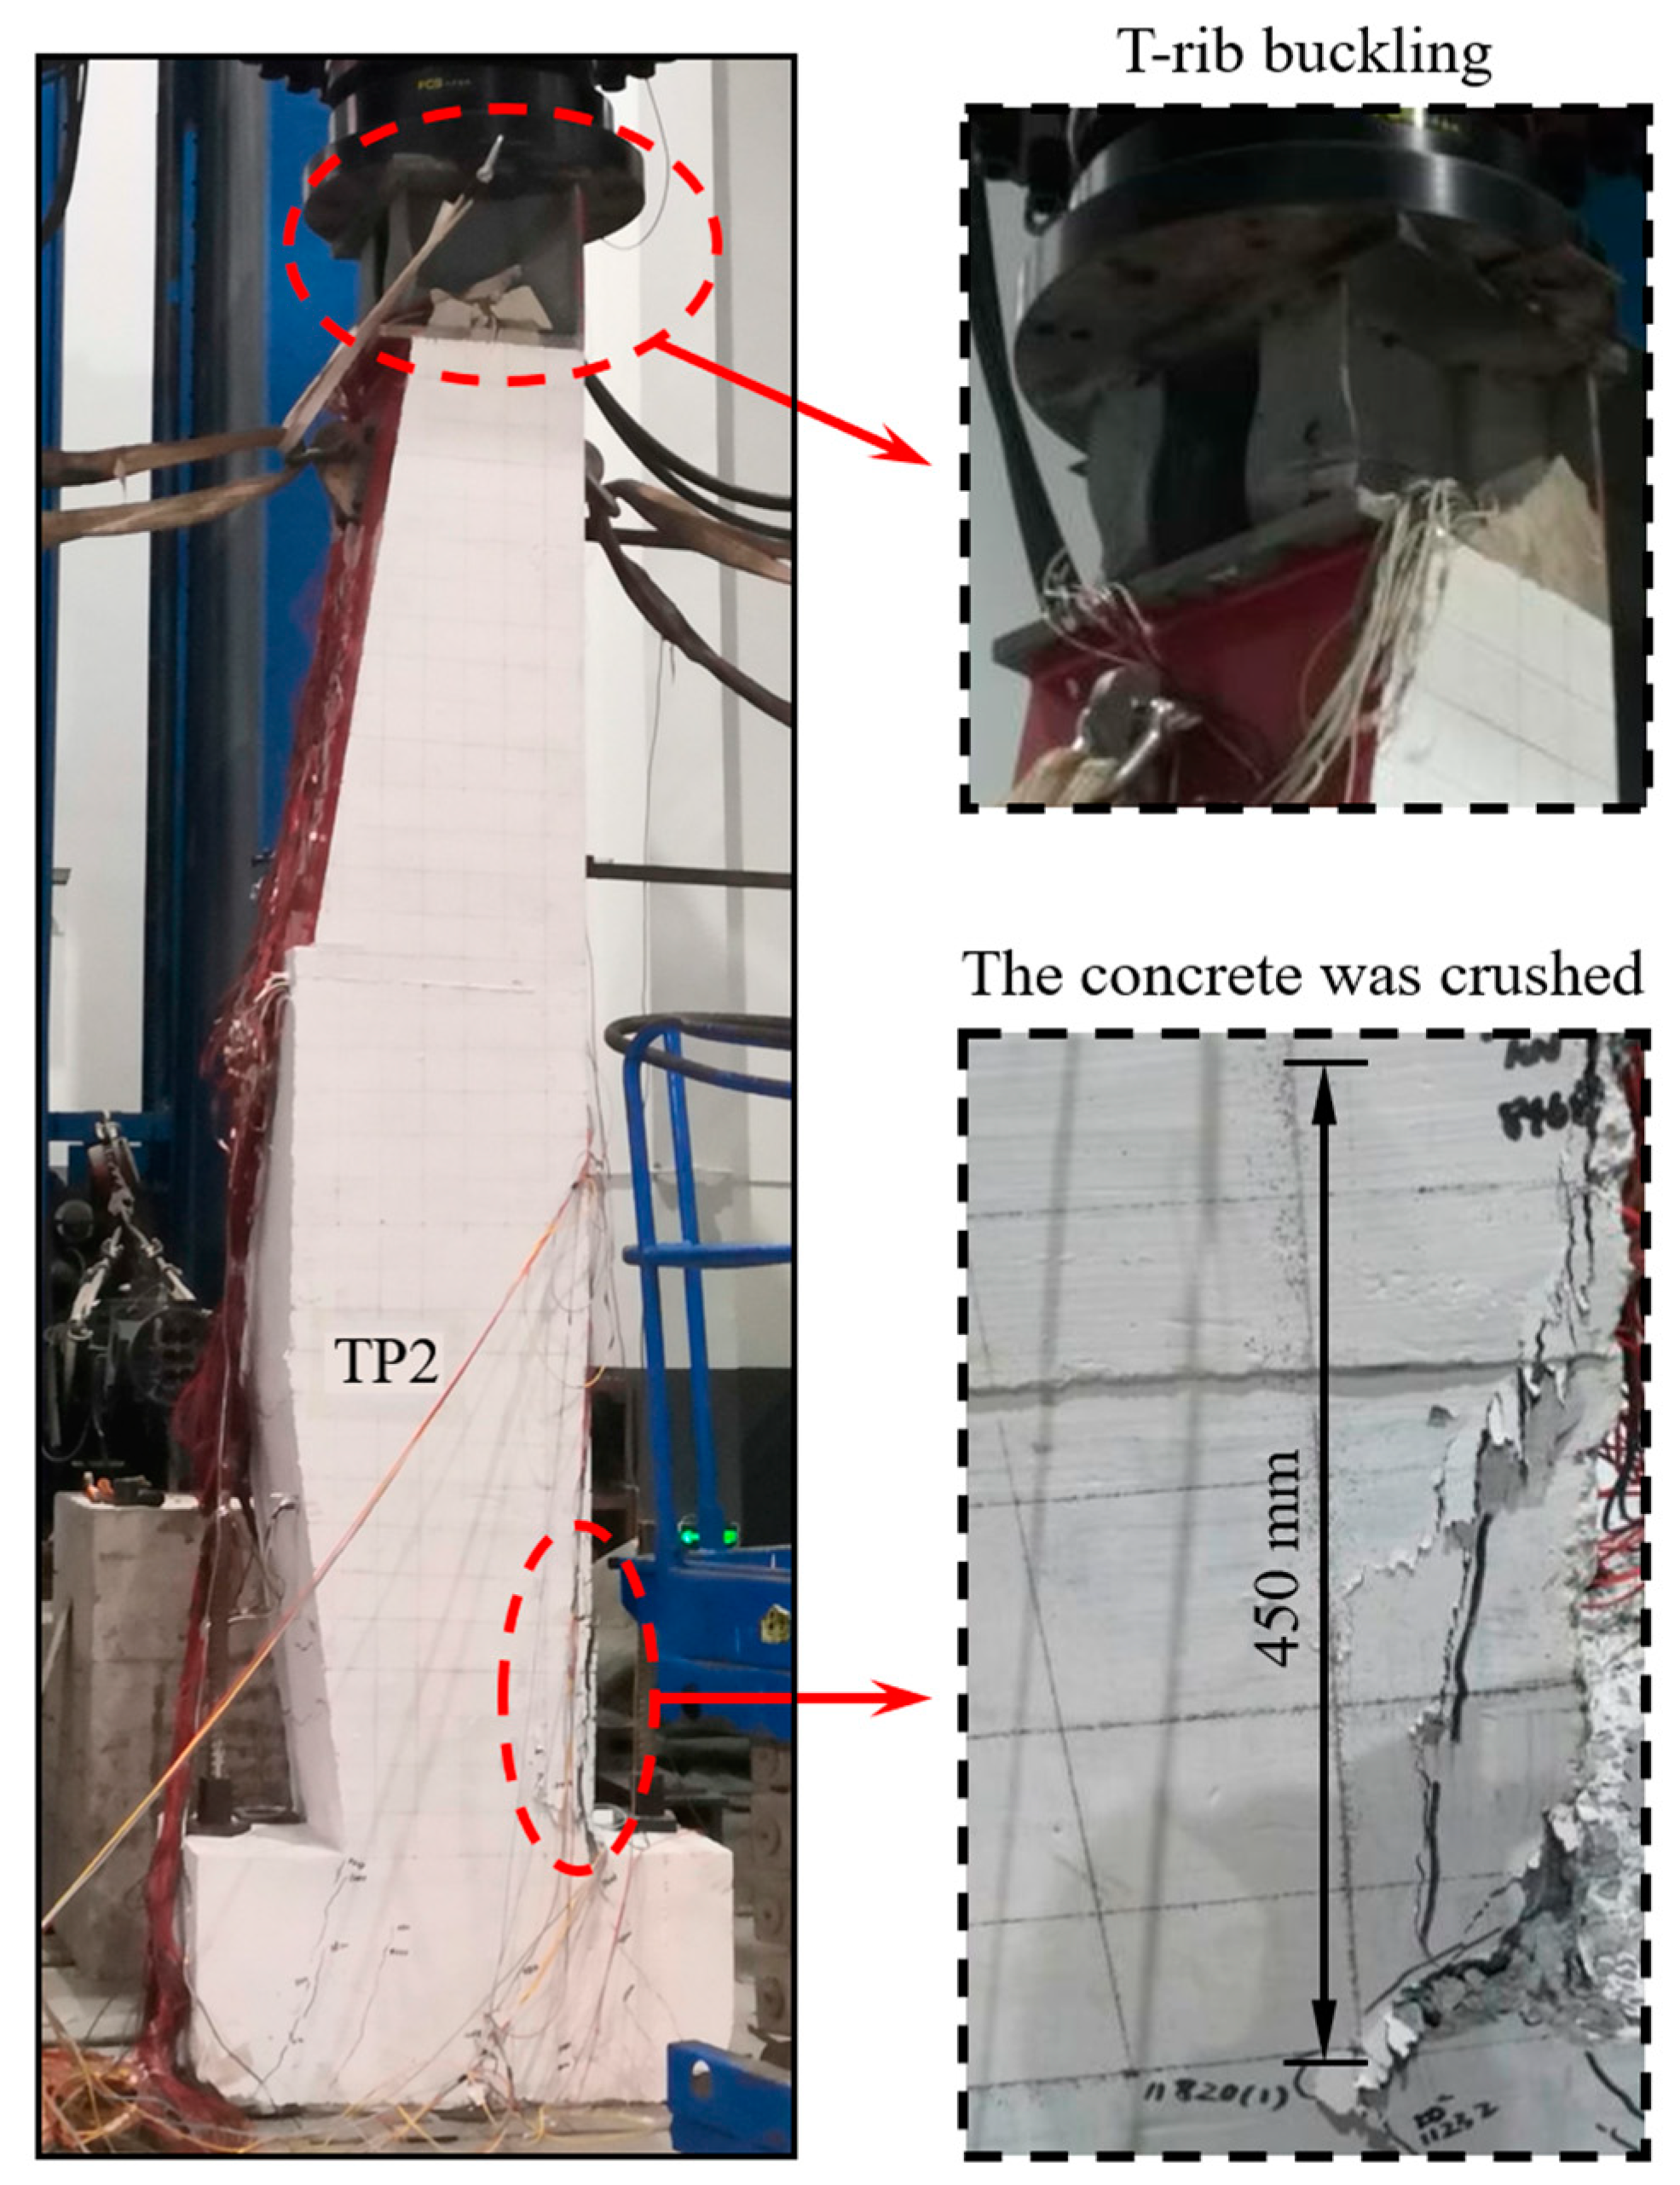
Under the action of axial force, both test specimens showed similar experimental phenomena and failed in the expected mode. The failure modes mainly included concrete cracking, rib buckling, and concrete crushing, as shown in Figure 3. The initial failure occurred at the intersection of the concrete and the bottom plate, with multiple fine cracks appearing. With the increasing load, the cracks gradually expanded until they finally penetrated through the concrete. At the same horizontal position on the other side of the concrete, a similar penetrating crack appeared. Continuing to load, the steel beam section of the specimen showed T-rib and rib buckling failure phenomena. After sustained loading, the specimen experienced a secondary failure, with the penetrating crack at the concrete and bottom plate interface rapidly expanding and the concrete eventually separating. The ultimate load capacity and failure modes of the specimen are detailed in Table 3.
Based on the failure of the specimens, it was found that the specimens exhibited typical eccentric compression failure. The analysis of the failure characteristics show that the concrete section had a through crack, resulting in a larger lateral displacement of the specimen, and the axial loading gradually became eccentric due to the uneven force, resulting in the buckling of the stiffeners in the steel beam section. Finally, the concrete section of the specimen experienced secondary failure, and the compressed side of the concrete was crushed, while the tensioned side of the concrete was torn apart, causing the specimen to lose load capacity completely. The specific failure mode shows that the weak point of the specimen is the concrete section, followed by the steel beam section, while the strength of the steel–concrete joint section is higher than both, so it is inferred that the failure strength of each part is, from high to low, the steel–concrete joint section, the steel structure section, and the concrete section, which meets the design requirements.

3.2. Axial Load–Displacement Curves

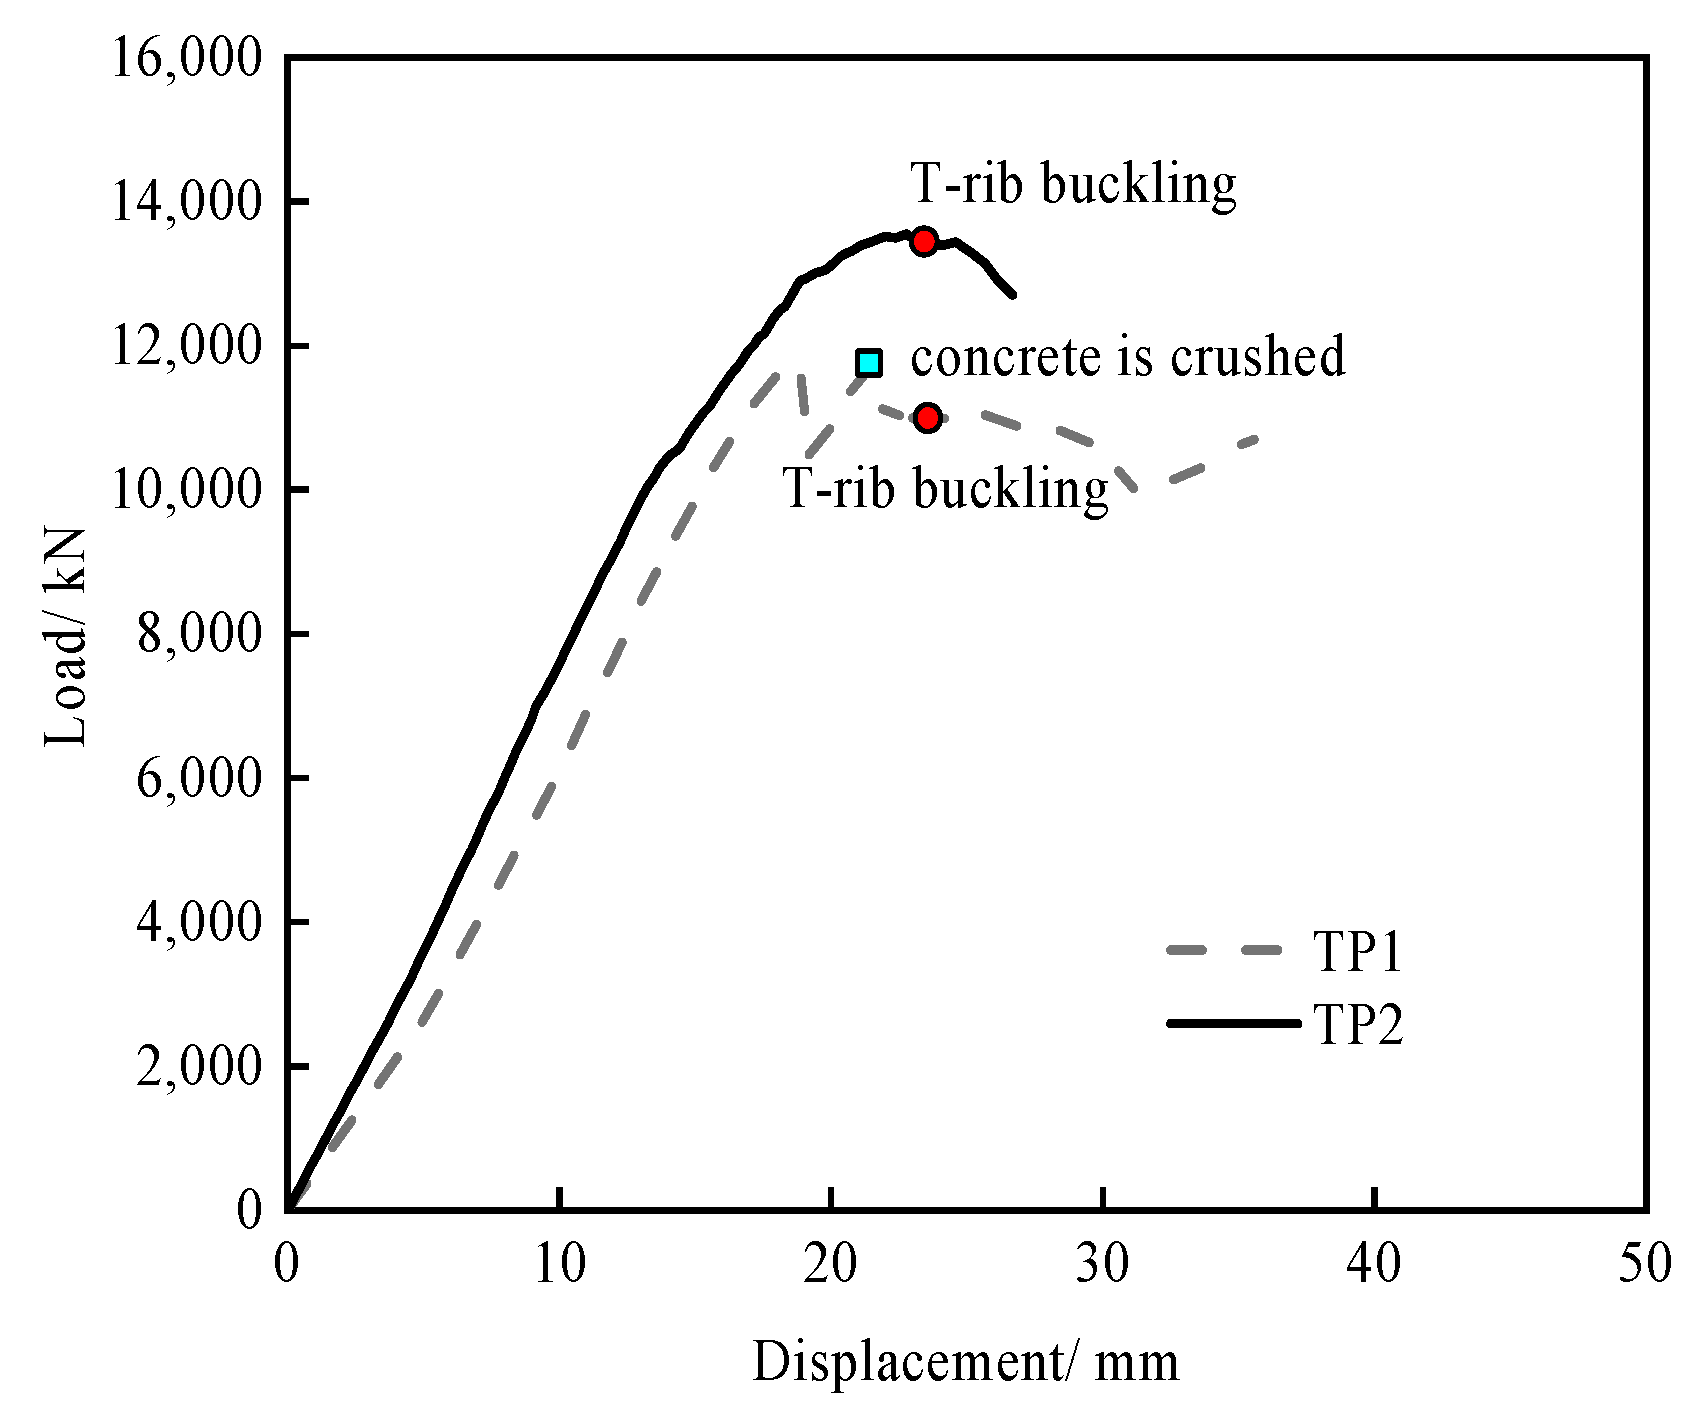
To compare the mechanical behavior of different specimens, the axial load–displacement curves of TP1 and TP2 during the loading process up to failure are presented in Figure 4, which directly shows the load-bearing condition of each component at failure. By observing the axial load–displacement curves of the specimens, it can be found that the displacement increment is relatively large in the early stage of loading, which is due to the mechanical clearance at the connection of the loading device. The change trends of the two curves are similar and can be divided into three stages: the elastic stage, elastic–plastic stage, and failure stage. TP1 had 500,000 more fatigue loading cycles than TP2, which is shown in the curve as TP1 having a larger peak load than TP2. This indicates that fatigue damage will to some extent reduce the ultimate load capacity of the critical grid of the steel–concrete joint. It was found that the specimens had good ultimate load capacity after 2.5 million cycles of fatigue loading and could still partially bear the load after failure, indicating that the failure mode of the steel–concrete joint was conservative and had a large safety margin. The results are in compliance with the design requirements.
The load–relative slip curves between the steel plate and concrete of the specimens are shown in Figure 5, which reflect the load capacity of the shear connectors. It is found that the load–relative slip curves of TP1 and TP2 are similar throughout the loading process, both in the elastic stage, and the maximum slip after the specimens’ failure is relatively small. This indicates that the synergy between the steel plate and concrete is good and the transfer of force through the shear connectors is reliable. The design of the steel–concrete joint compartment is reasonable.

3.3. Lateral Stiffness of the Cell

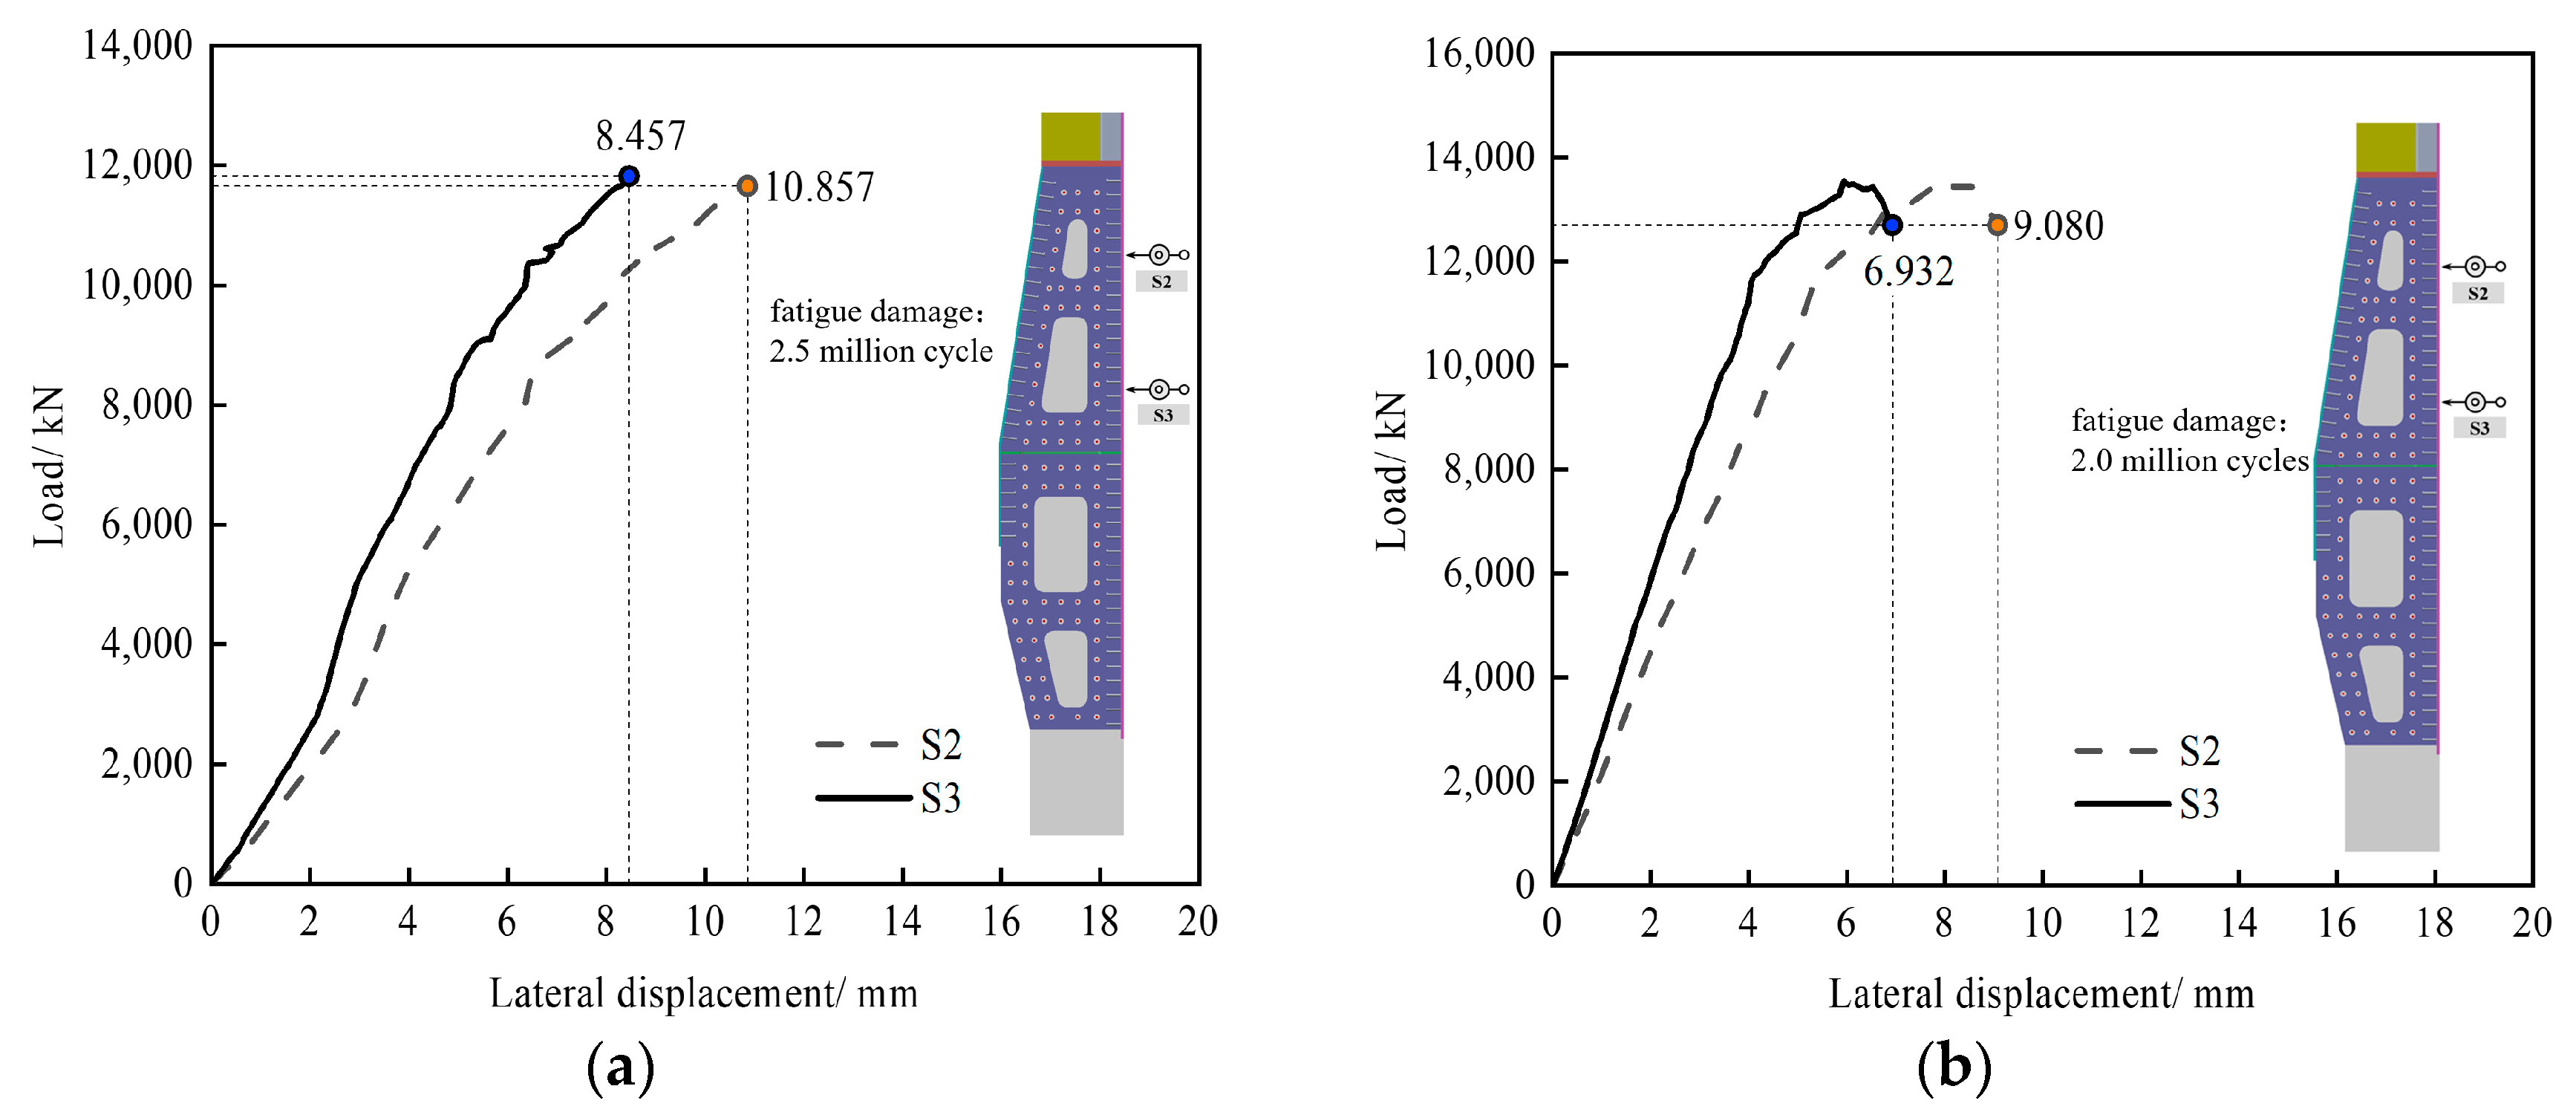
Due to the bending moment, in addition to axial deformation, the specimens also have lateral displacement. The load–lateral displacement curves of the specimens are shown in Figure 6, and the variation of lateral displacement can reflect the lateral stiffness of the structure. It is observed that the slope of the curve of each measuring point of the same specimen does not change much in the elastic stage, but the slope of TP1’s curve is smaller than that of TP2, and the maximum lateral displacement of TP1 when the specimen fails is also larger than that of TP2. This indicates that fatigue damage has a certain impact on the lateral stiffness of the structure, and fatigue damage will cause a certain degree of degradation in the lateral stiffness of the structure. At the critical structure failure, it was found that the lateral displacement growth rate of the two specimens increased because, at this time, local concrete was crushed, resulting in a decrease in the lateral stiffness of the specimen until the specimen could no longer continue to bear the load.

3.4. Grid Model Force Transmission Mechanism

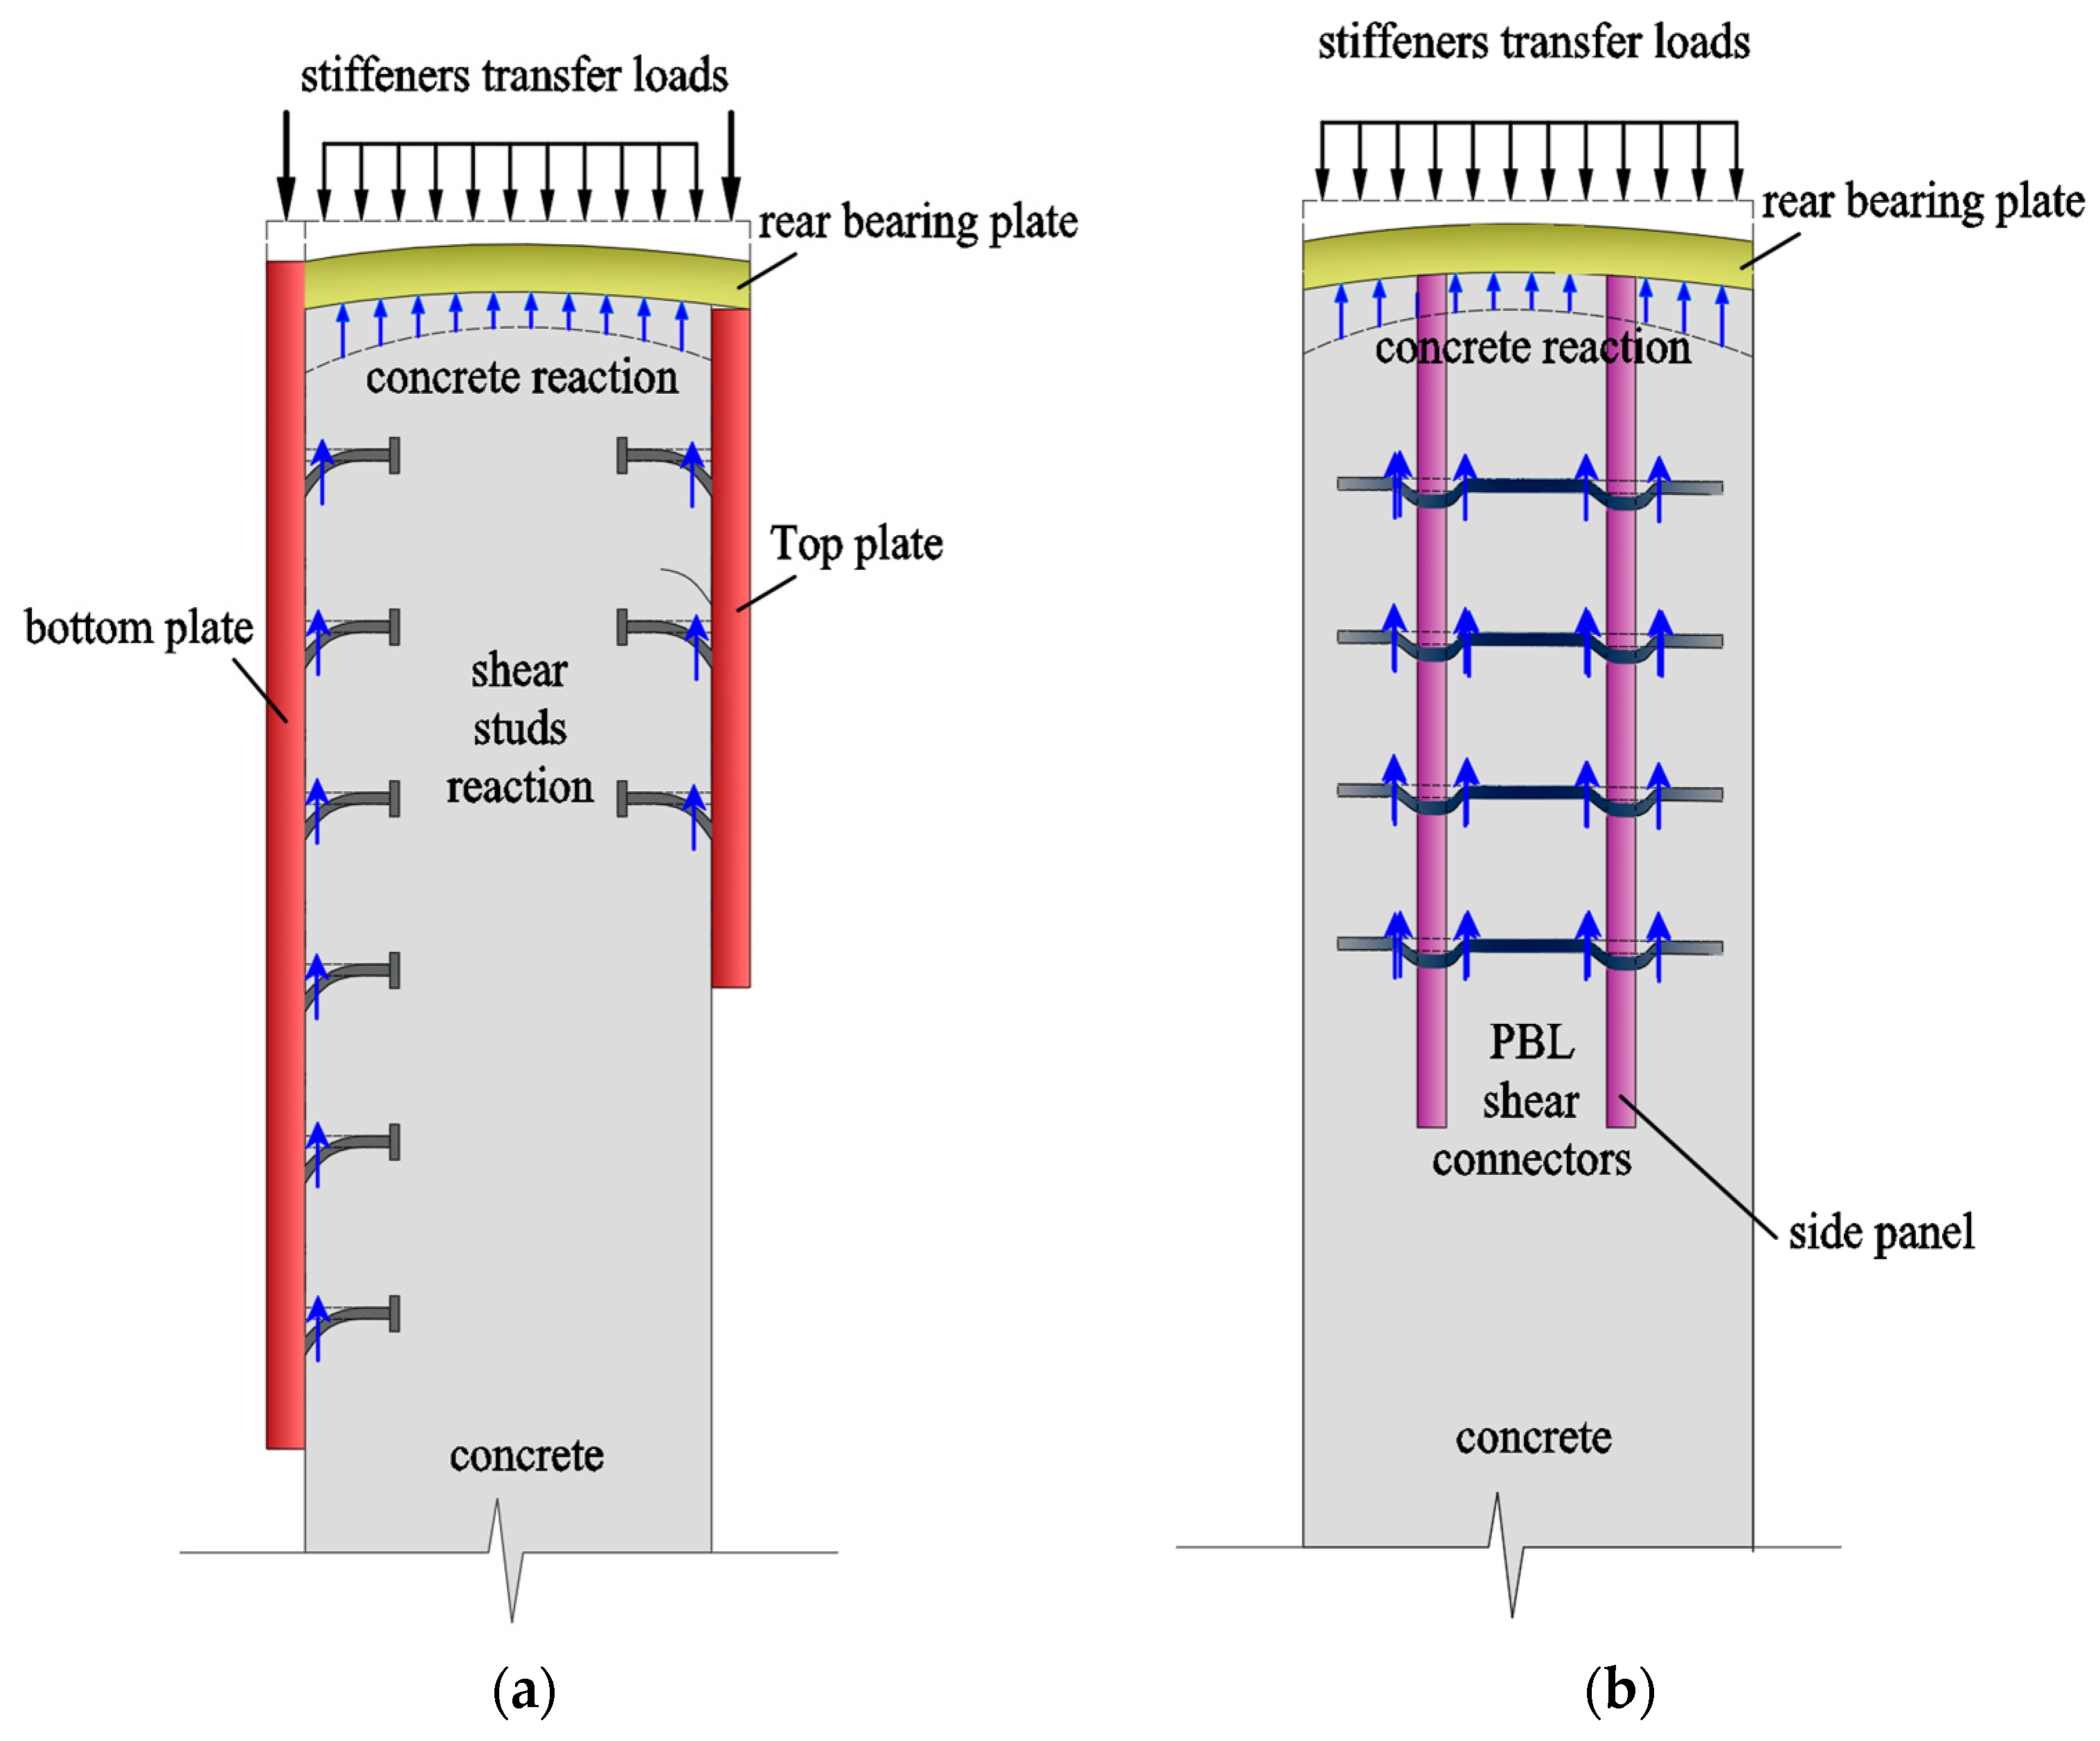
After analyzing the failure phenomena and related results of the experiment, the basic force transmission mechanism of the key compartments in the steel–concrete composite section was summarized, and the specific force transmission process between each component is detailed in Figure 7. The external load is first transmitted from the steel beam section to the rear compression plate through the stiffeners and then is transferred from the rear compression plate to the compartment side plate, bottom plate, top plate, and the concrete in the connection section that are in contact with it. The force on the compartment side plate is transmitted to the concrete by PBL shear keys, while those on the bottom and top plates are transmitted to the concrete by shear studs. Finally, the force on the concrete is transmitted to the concrete beam section.

3.5. Finite Element Analysis of the Cell Model

3.5.1. Finite Element Model

To further explore the mechanical properties of the structure, finite element analysis was performed. A three-dimensional nonlinear finite element model of the specimen was established using Abaqus software, as shown in Figure 8. Three-dimensional solid elements (C3D8R) were used to simulate the concrete, shear studs, steel plates, and PBL penetrated steel bars, while three-dimensional truss linear elements (T3D2) were used to simulate the reinforcement bars. The connection between each steel component was simulated by setting tied constraints. Surface-to-surface contact was used to simulate the interface between steel plates and concrete, with a frictionless tangential direction. The shear studs were embedded into the concrete using the embedded region constraint. The hole walls of the PBL perforated steel plate were tied to the concrete tenon inside the hole, and the penetrating steel bars inside the PBL perforated steel plate were embedded into the concrete tenon using the embedded region constraint.
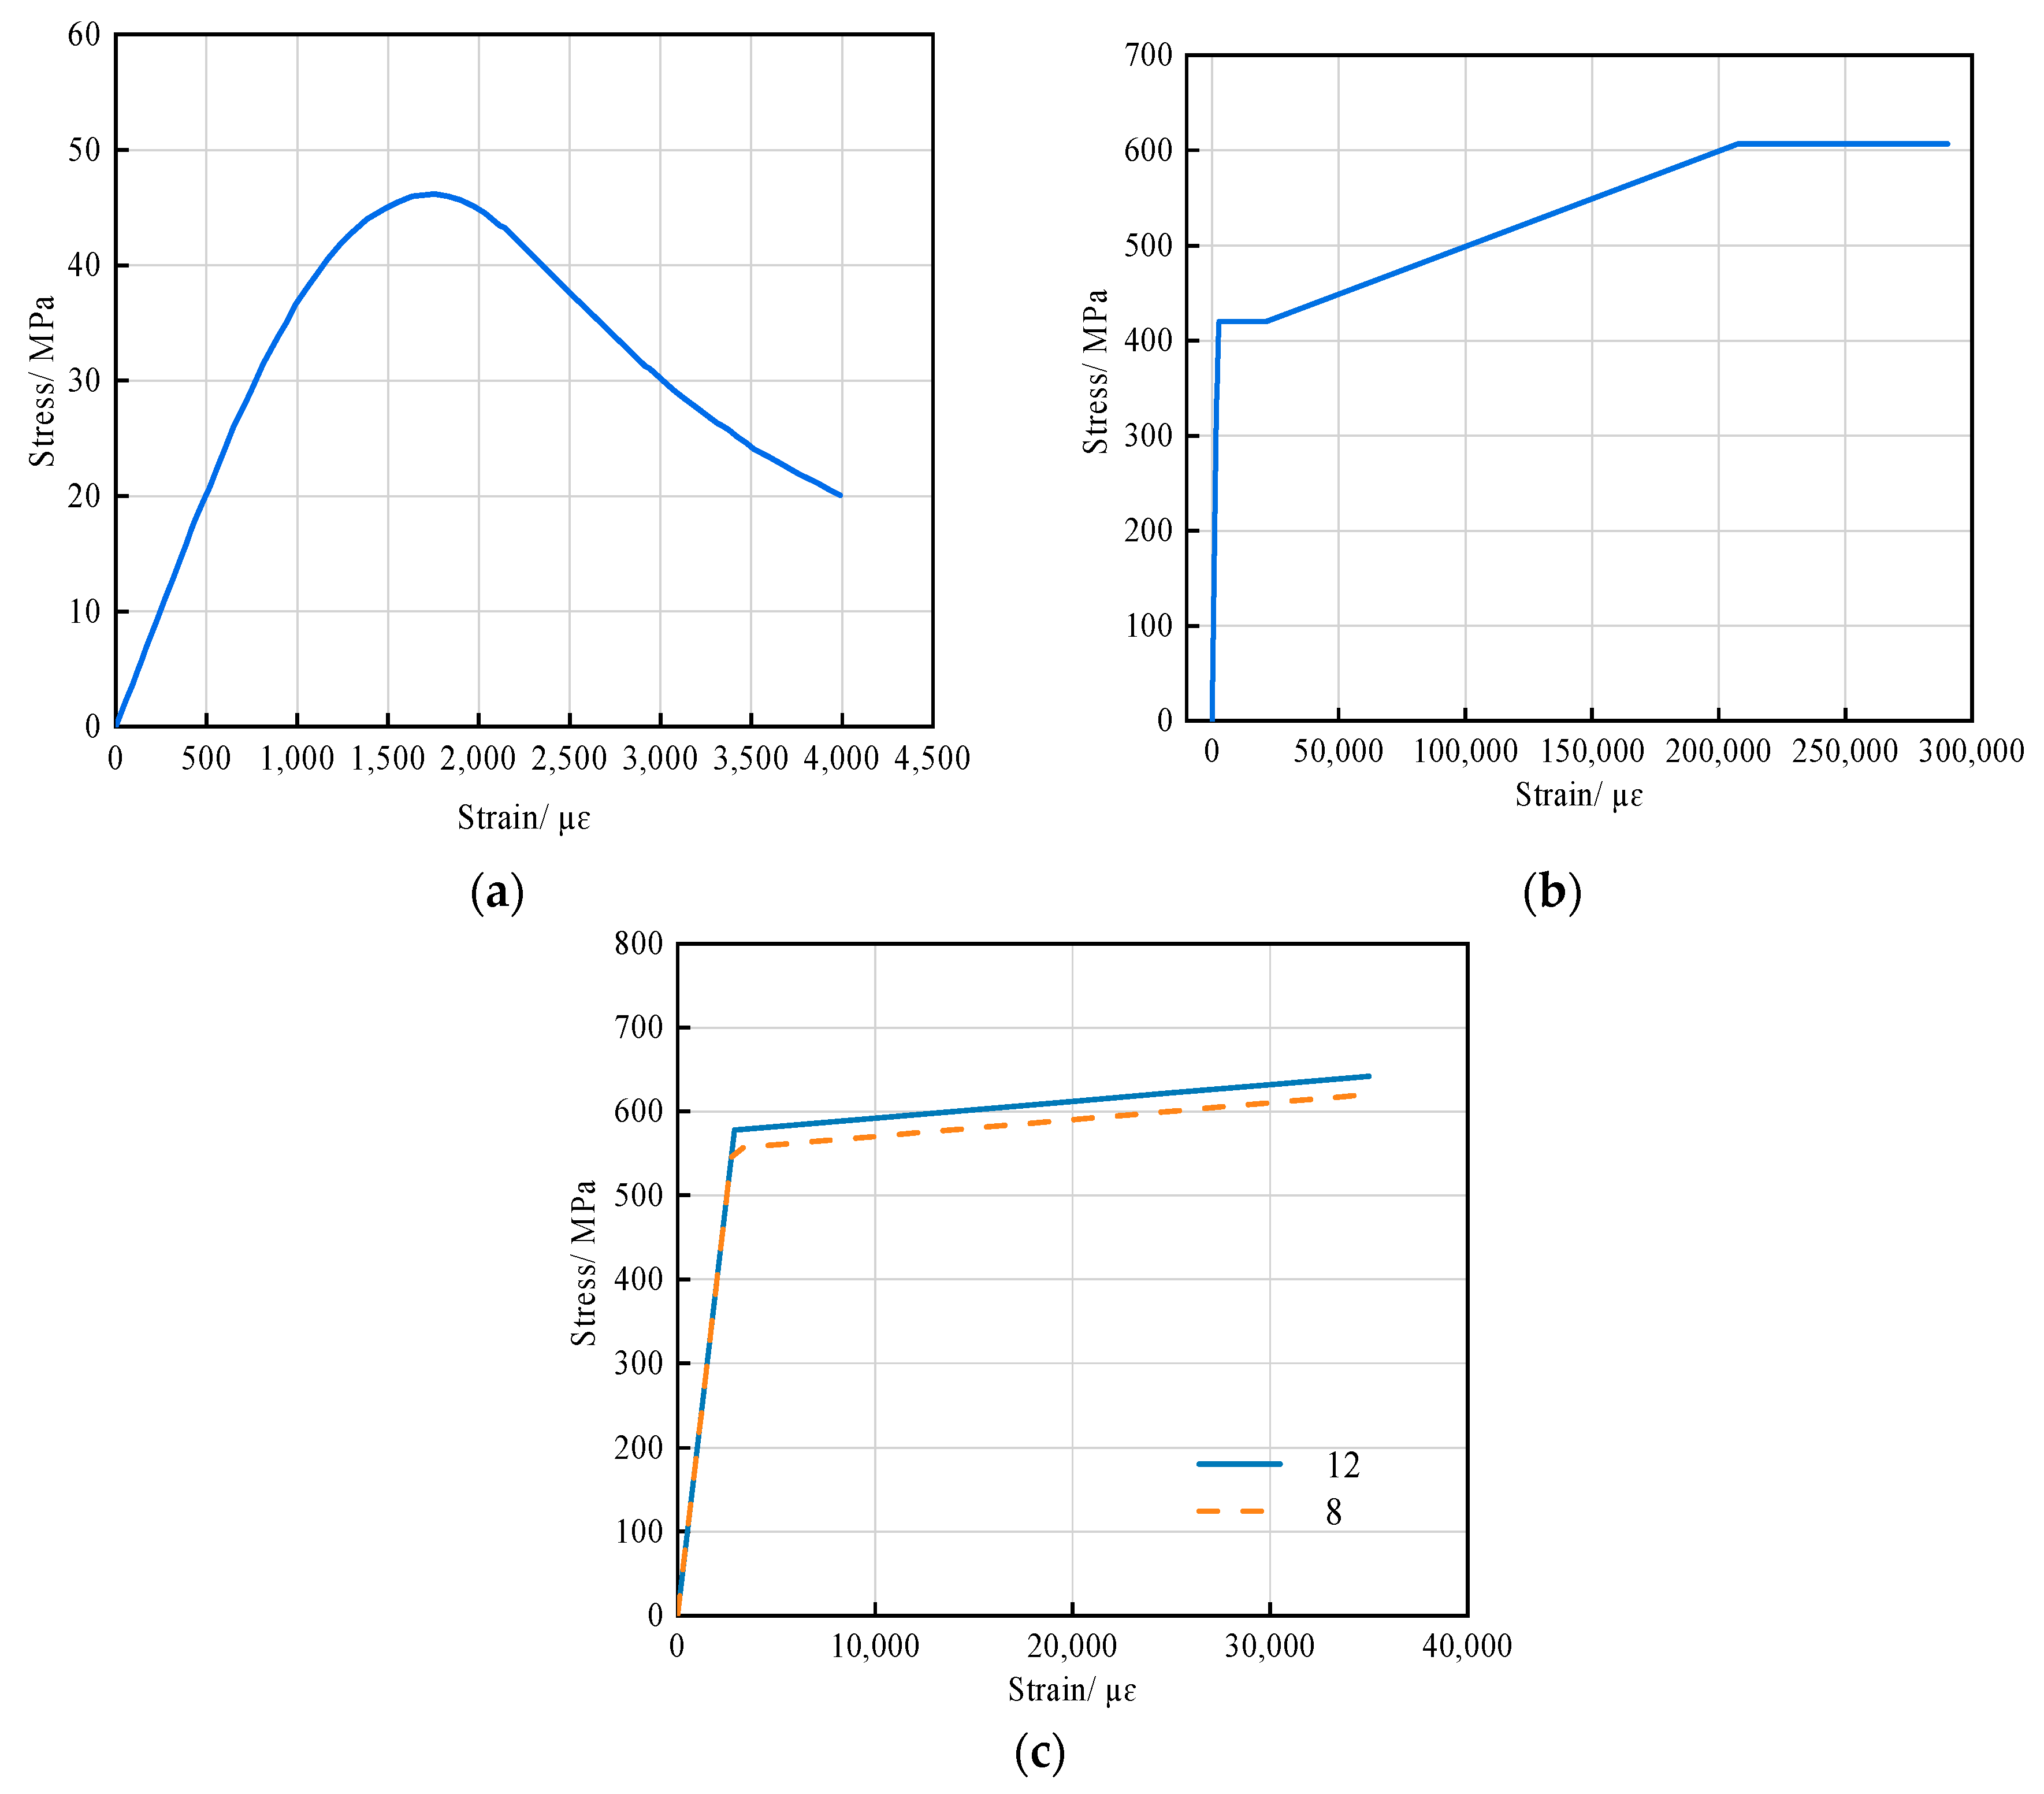
Figure 9 shows the material constitutive models used in the finite element model. The concrete constitutive model used was the concrete plastic damage model, which is in accordance with the current “Code for Design of Concrete Structures” (GB 50010-2010), as shown in Figure 9a. The von Mises constitutive model, which considers the strengthening stage after yielding, was selected for the steel material, as shown in Figure 9b.

3.5.2. Finite Element Model Validation

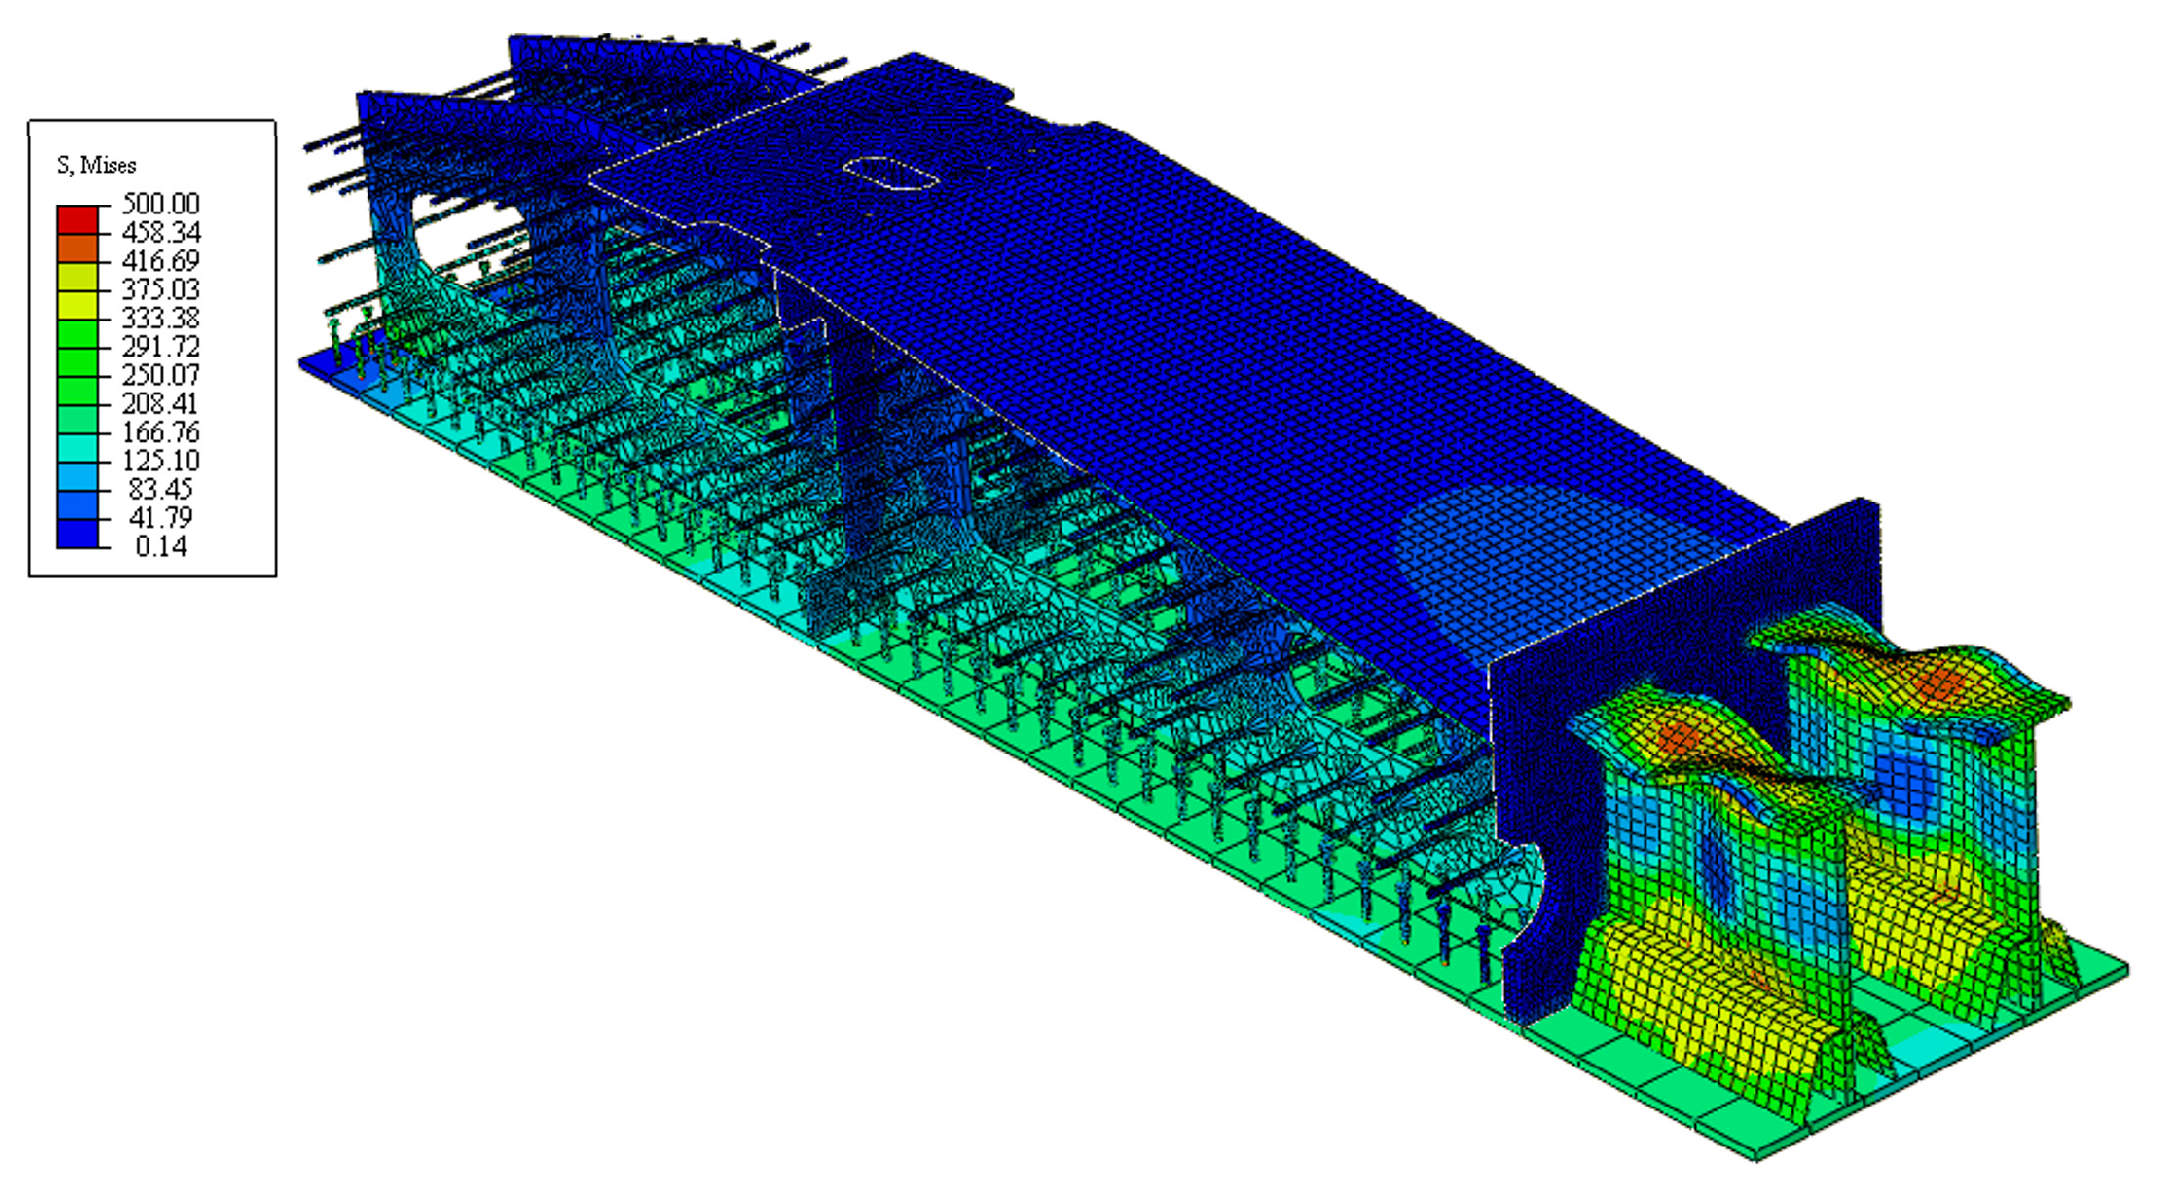
The finite element model calculation results indicate that the deformation trend of the overall model is similar to that of the experiment. As the axial load increases, the model gradually produces lateral displacement towards the bottom plate, and the ultimate failure mode is also inclined compression failure. The concrete stress at the section where the concrete beam segment becomes smaller reaches yield first, and as the load continues to increase, it is found that the stress at the stiffened steel beam section gradually reaches yield. This phenomenon is consistent with the failure mode of the experimental specimens. Figure 10 shows the buckling failure results of the stiffened panel in the finite element calculation model, indicating that the established finite element model is reliable.
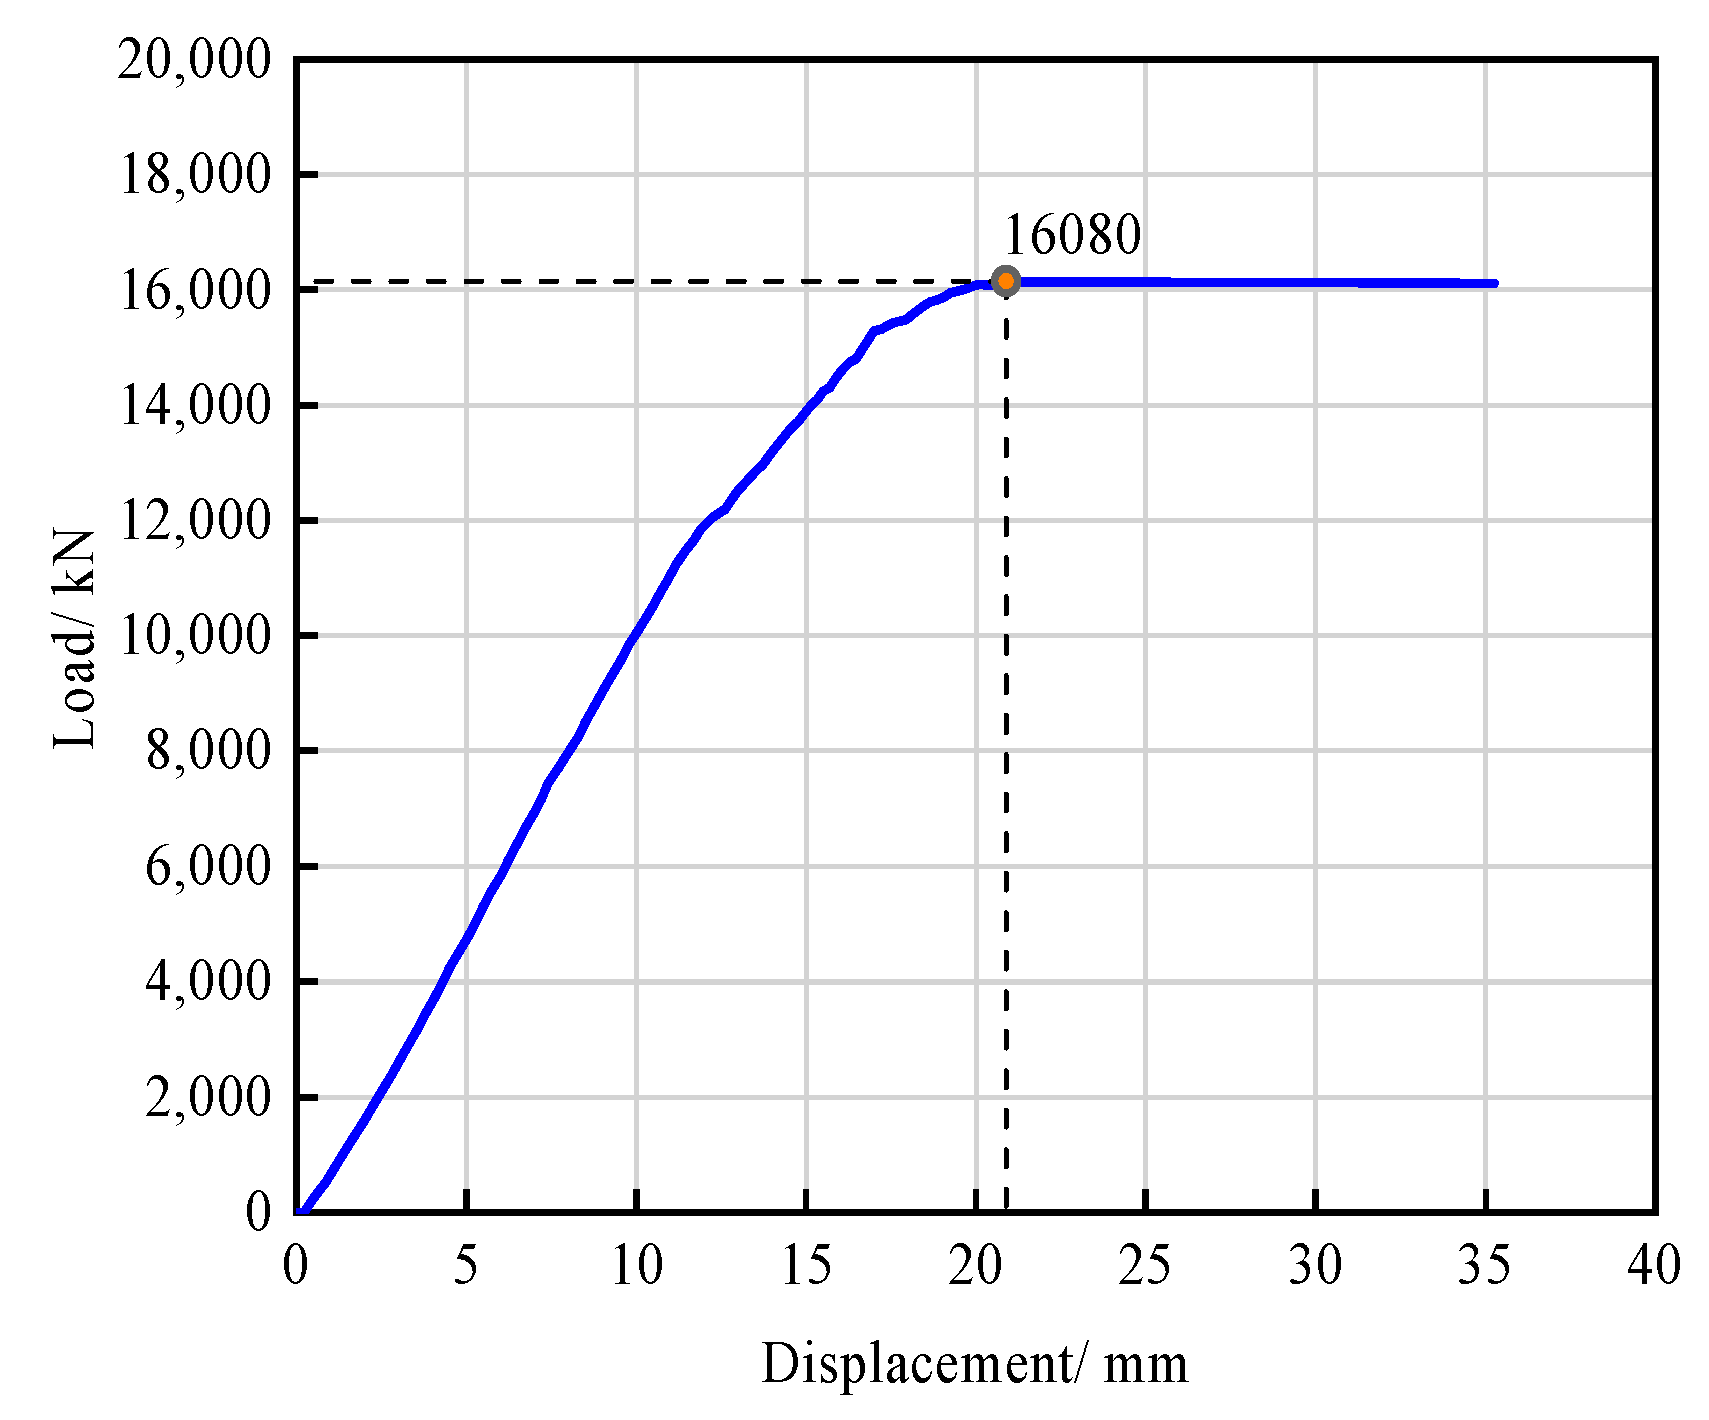
The finite element model calculated the ultimate load capacity of the steel–concrete jointed compartment to be approximately 16,080 kN, with the load–displacement curve plotted in Figure 11. As the load increased, the deformation trend of the model was similar to that of the experiment, and the process could be roughly divided into three stages: elastic, elastic–plastic, and failure stages.

3.5.3. Load Transfer Ratio of Grid Cells

By separately extracting the force situation of each key component in the finite element software and comparing it with the total axial force one by one, the force transmission ratio of each key component can be obtained. Based on the results of finite element analysis, the proportion of the total load carried by the compressive plate directly transmitting force in the grid cell of the steel–concrete joint section is 63.2%, while the load transmitted by all shear connectors accounts for 36.8% of the total load, of which the PBL shear connector group accounts for 16.2%, and the shear studs group accounts for 20.6%. The shear studs welded to the bottom plate bear the maximum axial shear load, while those welded to the top steel plate bear the minimum axial shear load. The load distribution ratio of each component in the grid cell is detailed in Table 4.

4. Prediction Model for Ultimate Load Capacity and Optimization Design

4.1. The Composition of the Ultimate Load Capacity of the Cell

According to the experimental phenomena in this paper and previous studies described [28], it is found that the failure modes of the grid structure can be mainly divided into three types, namely, the appearance of large cracks in concrete, the buckling of steel beam stiffeners, and the failure of shear connectors. Therefore, in order to calculate the ultimate load capacity of the overall grid structure, the main components of the grid structure’s ultimate load capacity were determined separately from the above three parts.

4.1.1. Concrete Section Ultimate Load Capacity

In the steel–concrete composite section model, external loads are only applied in the longitudinal bridge direction, and no external loads are applied in other directions. Moreover, because the design of the steel–concrete composite section is very complex in practical engineering, and its force points are not located at the center of the section, its ultimate load capacity can be simplified and considered as an eccentrically loaded column. The concrete section is variable in section, and the smallest cross-sectional area is selected as the weak section for calculation. The ultimate load capacity of the variable cross-section is greater than the calculated section, which can be used as a safety reserve. According to the “Code for Design of Concrete Structures” (GB50010-2010) (2015 edition) [29], the load capacity of an eccentrically loaded column can be calculated according to the following formula:
N α 1 f c b x + f y A s σ s A s σ p 0 f py A p σ p A p ,
N e α 1 f c b x h 0 x 2 + f y A s h 0 a s σ p 0 f py A p h 0 a p ,
e = e t + h 2 a ,
e t = e 0 + e a ,
In the formula, α 1 is the coefficient of concrete strength grade; fc is the design value of compressive strength of concrete; f y ,     f py are the design values of compressive strength for ordinary reinforcing steel and prestressed steel, respectively; A s ,     A s ,     A p ,     A p are the sectional areas of ordinary reinforcing steel and prestressed steel in the tensile and compressive zones, respectively; h0 is the effective height of the section; b is the width of the section; x is the height of the compressed zone of concrete; e is the distance between the axial pressure point and the combined force point of longitudinal tensile ordinary steel bars and tensile prestressed steel bars; σs and σp are the stresses of longitudinal ordinary steel bars and prestressed steel bars in tension or compression of the smaller edge; et is the initial eccentricity; a is the distance from the combined force point of longitudinal tensile ordinary steel bars and tensile prestressed steel bars to the near edge of the section; e0 is the eccentricity of the axial pressure to the centroid of the section; ea is the additional eccentricity.

4.1.2. Ultimate Load Capacity of Steel Beam Stiffeners

For the steel beam stiffener section, it was found in the experiments and finite element calculations that the section was subjected to both large axial compression and bending moment about its centroidal axis. Due to the offset of the loading point during the loading process, a certain bending moment was induced in the steel beam stiffener section. Although the stiffener mainly bears axial compression, the effect of bending moment cannot be ignored. Therefore, the stiffener was considered as a compressed–bent component to calculate its ultimate load capacity, which includes strength, overall stability, and local stability calculations. The overall stability calculation includes stability calculation within the bending moment plane and stability calculation outside the bending moment plane. According to “Code for Design of Steel Structures” (GB50017-2017) [30], the load capacity can be calculated by the following formula:
  • Sectional strength calculation
N A n ± M x γ y W ny f ,
In the equation, f represents the design values of the tensile, compressive, and flexural strength of steel; N is the design value of axial compressive force (N) at the same section; Mx are the design values of bending moments (N·mm) about the x-axis at the same section; γ y are the plastic development coefficients of the section; An is the net cross-sectional area (mm2) of the member; and Wn is the net section modulus (mm3) of the member.
2.
Stability calculation
Planar stability calculation:
N A n ± M x γ y W ny f ,
N Ex = π 2 E A / 1.1 λ x 2 ,
Out-of-plane stability calculation:
N φ y A f + η β tx M x φ b W 1 x f 1.0 ,
| N A f β mx M x φ x W 2 x 1 1.25 N N Ex f | 1.0 ,
The formula can be described as follows: φx is the stability coefficient of axially compressed members in the plane of bending; Mx is the maximum calculated bending moment design value within the section of the member (N·mm); W1x is the gross sectional modulus about the most compressed fiber within the plane of bending (mm3); φ y is the stability coefficient of axially compressed members out of the plane of bending; φ b is the overall stability coefficient of members subjected to uniform bending; η is the section factor; W2x is the gross sectional modulus at the unflanged end (mm3).
For cantilever members, the equivalent bending moment coefficient β mx should be adopted according to the following specifications:
β mx = 1 0.36 N / N cr ,
For members where the bending moment acts outside of the plane, with the cantilever section, the equivalent bending moment coefficient β tx is taken as 1.0. Considering the section strength and stability of the stiffeners, the minimum calculated load capacity is selected as the ultimate load capacity of the steel beam section with stiffeners.

4.1.3. Ultimate Load Capacity of Shear Connection

  • PBL Shear Connection
For the shear load capacity of a steel plate with holes and through reinforcement members, some foreign scholars have proposed their own calculation formulas based on experimental studies [31,32,33,34,35,36,37]. According to the test results, it can be observed that the slip between steel and concrete is very small, indicating that the shear connection between the steel–concrete bonding segments is reliable. Based on this, the following assumptions are proposed:
  • The bonding performance between concrete and each part is good;
  • The shear connection mainly bears the shear force and is subject to shear failure.
Based on the aforementioned assumptions, the ultimate load capacity of the PBL shear connection is determined using relevant formulas in material mechanics as follows:
Q u = A s τ   ,
Here, As is the cross-sectional area of the shear reinforcement and τ is the allowable shear stress of the shear reinforcement.
After substituting the relevant material parameters obtained from the experimental study into the aforementioned formula, a comparison was made with the finite element calculation results, as shown in Table 5.
From Table 5, it can be observed that the calculation results of Formula (11) are the closest to the results obtained in this study. This formula is relatively simple and can be computed quickly. Therefore, the ultimate load capacity calculation formula for a single PBL shear key in this model is Equation (11). Thus, the ultimate load capacity calculation formula for the PBL shear connection can be expressed as:
Q u = n · A s τ   ,
2.
Shear studs
The maximum load that can be sustained by shearing the nail before complete failure of the composite structure is known as the ultimate shear load capacity of the nailed connection. The ultimate shear load capacity of a nailed connection is not only related to the specifications and material characteristics of the shear studs themselves, but also to the grade and material properties of the concrete. The calculation formula for the shear load capacity of the shear connection in steel–concrete composite structures is given in the Chinese steel structure design code (GB50017-2003) [38]:
N V C = 0.43 A s E c f c 0.7 A s γ f u ,
In the equation, N V C represents the design shear load capacity of a single shear stud, As and f u represent the cross-sectional area and ultimate tensile load capacity of the shear stud, f c and E c represent the design compressive strength and elastic modulus of the concrete, and γ represents the ratio of the minimum tensile strength to yield strength of the shear stud.
Thus, the formula for the ultimate shear load capacity of a shear stud is as follows, where n is the number of shear studs:
N V C = n · 0.43 A s E c f c n · 0.7 A s γ f u ,

4.2. The Influence of Fatigue Damage on Ultimate Load Capacity

Based on the study of the ultimate load capacity test of specimens after fatigue damage, it was found that the influence of fatigue damage on the ultimate load capacity of the steel–concrete composite joint cannot be ignored. In order to comprehensively consider the influence of fatigue damage on the ultimate load capacity of the joint, a structural fatigue damage parameter R is introduced to explore and quantify the degree of the impact of fatigue damage on the joint.
Combined with relevant studies [39] on fatigue, it has been found that the fatigue damage of a structure is related to its material properties, structural parameters, and the number of fatigue cycles. Based on the established formulas for predicting the fatigue life of steel structures, shear connectors, and concrete and the relationship of the S-N curve, the N-R curve of the structure is proposed to follow a straight line segment, satisfying the following equation:
N = C · R m ,
R = F m a x / F c k ,
In the formula, m is the negative reciprocal slope of the N-R curve, which is generally related to the material properties; C is a constant related to the material; R is the structural fatigue damage parameter; F m a x is the allowable maximum ultimate load capacity considering fatigue damage; F c k is the allowable maximum ultimate load capacity without considering fatigue damage.
Both m and C are constants to be fitted. By simplifying Equation (15), the following equation is obtained:
l g N = l g C m · l g R ,
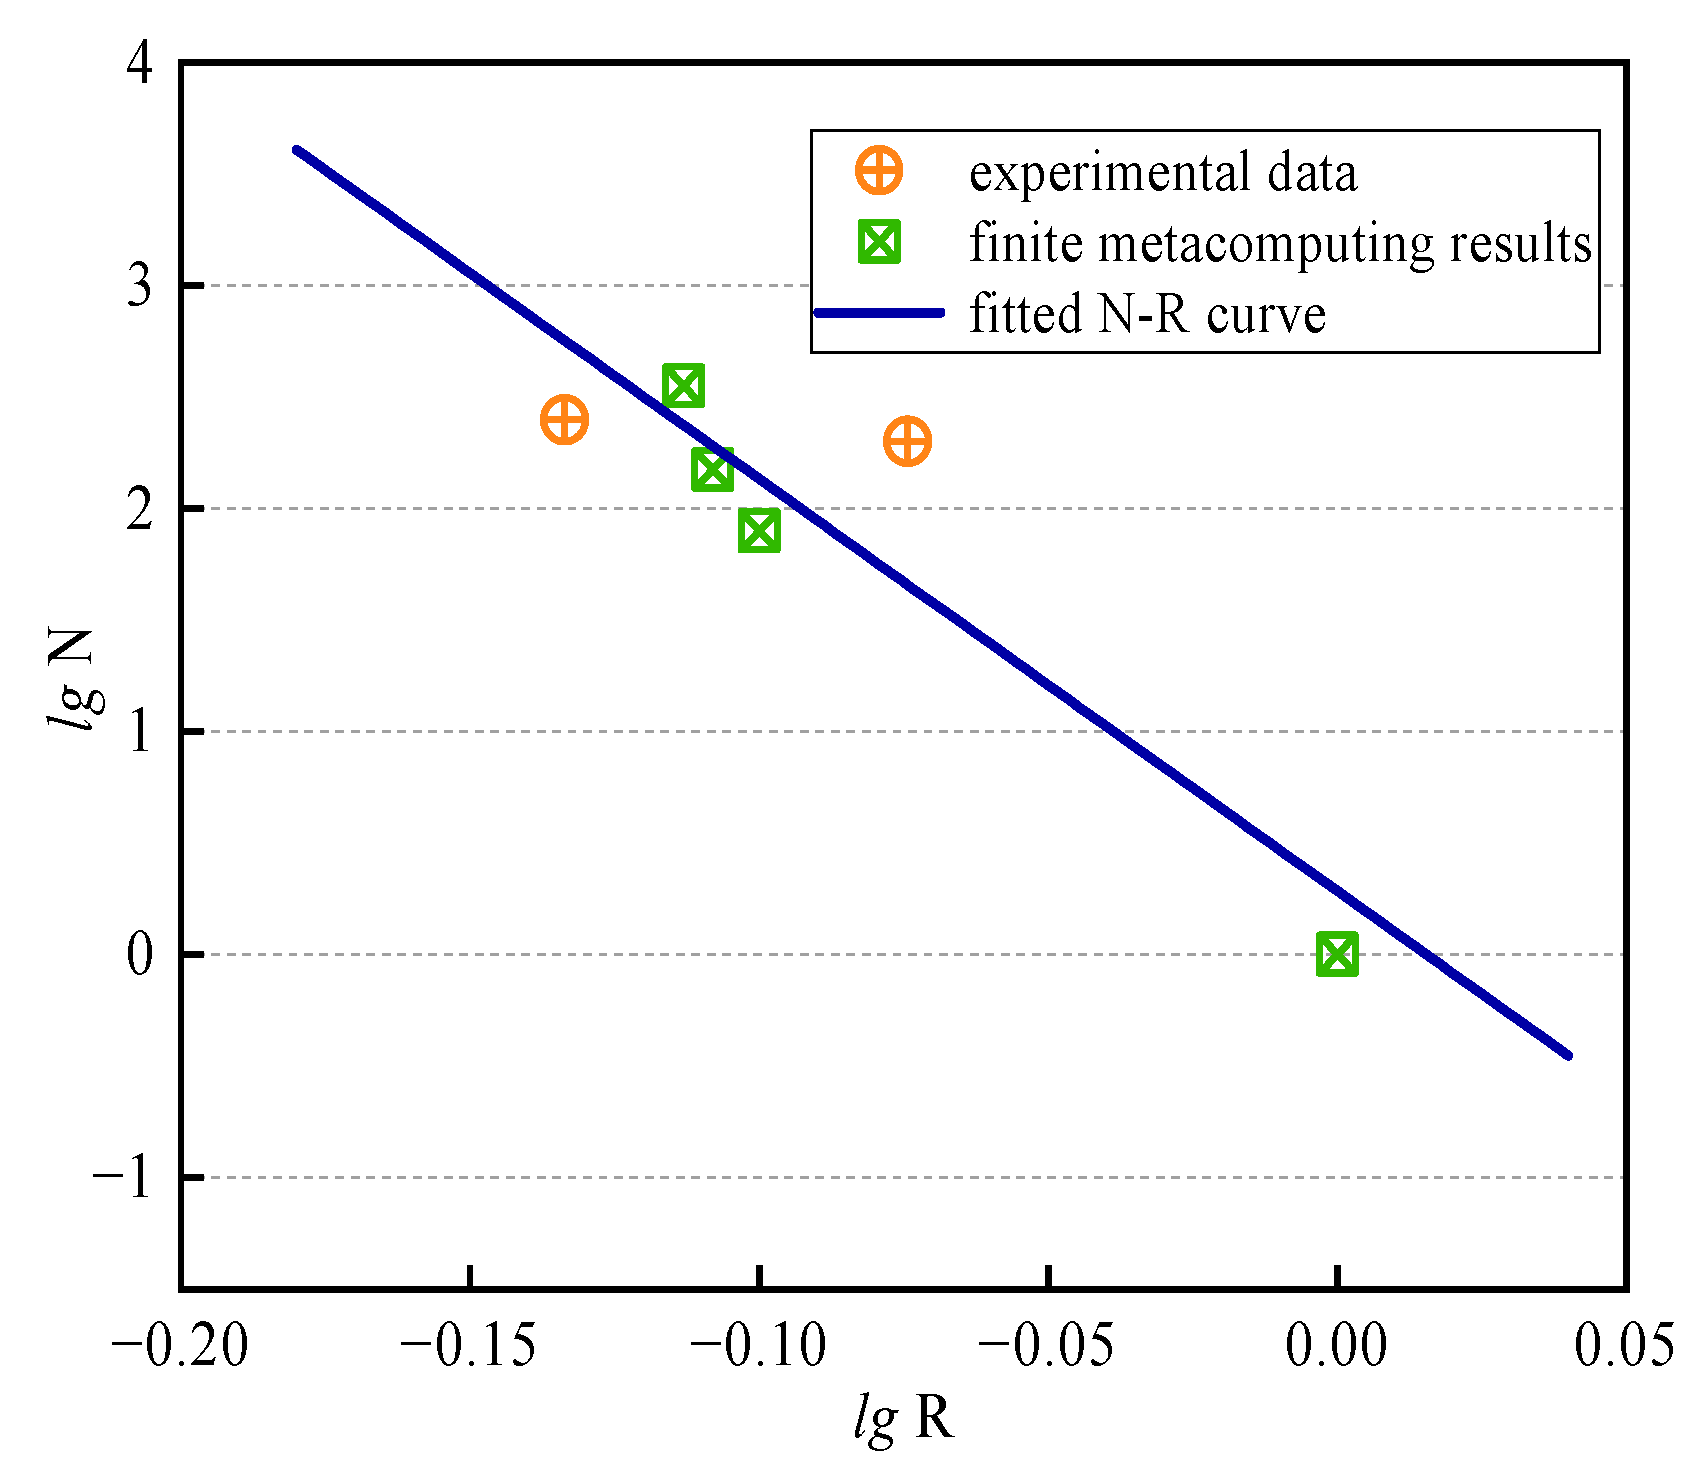
To obtain a more accurate curve fitting, the fatigue damage level was set to 0, 8.0 × 10⁴, 1.5 × 10⁵, and 3.5 × 10⁵ cycles, respectively, by combining the finite element model, and the ultimate load capacity of the grid cell model was calculated. Based on the ultimate load capacity of two specimens obtained from fatigue tests and the number of fatigue load cycles, the least squares method was used to regressively analyze the structural fatigue damage degree parameter (R) and the number of fatigue loading cycles (N) in Equation (17), without considering the influence of the experimental result discreteness. Based on the least squares method, the N-R curve fitted equation was lgN = 0.2853 − 18.4775lgR, where C = 1.929 and m = 18.4775. The fitted N-R curve is shown in Figure 12.
Based on the relevant data obtained from fatigue tests, a failure probability of 2.695% can be calculated. If the number of fatigue load cycles that the structure is subjected to is known, it is easy to predict the degree of fatigue damage using Equation (17). Introducing the fatigue damage parameter R into the formula for calculating the ultimate load capacity results in:
N = R · N ,
where   N   represents the ultimate load capacity of each component calculated in this study.

4.3. Prediction of Ultimate Load Capacity

To analyze the steel–concrete composite section, the concrete section, shear connectors, and steel beams with stiffeners are treated as independent components. After calculating their respective ultimate load capacities, the overall ultimate load capacity of the steel–concrete composite section is determined by distributing the loads according to the proportion of each component’s capacity. The minimum value obtained from these calculations is taken as the final ultimate load capacity, assuming that the connections between components are reliable. For the steel beam section and concrete beam section of the specimen, as both sections bear all the axial forces, there is no need to redistribute forces, and thus the ultimate load capacity prediction for this part of the failure mode does not require further calculations.
  • Ultimate Load Capacity Na of the Concrete Beam Section
By combining Equations (1) and (2), the ultimate load capacity of the concrete beam section Nc1 can be obtained. Since the concrete in the section bears all the axial forces, the calculated N c 1 is the ultimate load capacity Na of the local compartment determined by the concrete beam section:
N a = N c 1
2.
Determination of the Ultimate Load Capacity N b of the Shear Connection
The calculation load capacity Qu of the PBL shear key is determined according to Equation (11), and the ultimate load capacity N1 of the local chamber determined by the PBL shear key can be easily obtained according to the component force distribution ratio values in Table 4, that is:
N 1 = Q u / 0.162 ,
Similarly, the calculation of the load capacity N V C of shear studs is determined by Formula (12), and based on the distribution ratio values of component forces in Table 4, it is not difficult to determine the ultimate load capacity of the local compartment determined by shear studs, denoted as N2:
N 2 = { N V top C 0.053 ,   N V bottom C 0.153 } min ,
Therefore, the ultimate load capacity of the compartment determined by the shear connector is:
N b = N 1 , N 2 min ,
3.
Determination of the Ultimate Load Capacity N c of the Steel Beam Section with Stiffeners
By combining Equations (5), (6), (8) and (9), the ultimate load capacity of the steel beam section with stiffeners can be obtained as Ns. Since the stiffeners on the cross-section of the steel beam section bear all axial forces, Ns calculated by this method represents the ultimate load capacity of the local grid cell determined by the steel beam section, which is denoted as N c :
N c = N s ,
To determine the local ultimate load capacity of a grid foundation, compare the minimum value obtained from Equations (19), (22) and (23). This comparison involves selecting the smallest value among the three equations, which represents the limit state for the local grid foundation’s load capacity:
N = N a , N b , N c min ,

4.4. Model Validation Evaluation

To verify the accuracy of the prediction method proposed in this paper, relevant experimental parameters were used in the relevant calculation formulas. The comparison of the results obtained from the calculation formulas, finite element analysis, and experimental results is presented in Table 6.
The results show good agreement between the theoretical and experimental values of the ultimate load capacity at each node. The theoretical values are slightly smaller than the experimental values because the synergistic effects of each component in the composite structure were not considered in the theoretical calculations. Instead, they were treated as safety reserves for the steel–concrete joint segment, resulting in larger experimental values than the theoretical values. The first failure location and experimental results of different specimens were consistent. TP1, TP2, and the finite element method (FEM) all failed due to the compression failure of the concrete beam section. The differences among them lie in the degree of fatigue damage. The FEM results did not consider fatigue damage, while TP1 and TP2 considered fatigue damage of 2.5 and 2 million cycles, respectively. The trend of the calculation results is the ultimate bearing capacity of the structure gradually decreasing with the increase in fatigue load cycles. Overall, the error between the calculated and actual values is within 5.6%, indicating that the predicted model of the ultimate load capacity of the steel–concrete joint segment lattice structure under fatigue damage is reliable for this study and can provide ideas for relevant engineering design.

4.5. Regarding the Optimization Design

From the predicted data, there is ample safety reserve space for the shear connection components. Considering the complexity of the construction of the steel–concrete composite structure, the number of shear connection components directly affects the construction progress and efficiency of the entire steel–concrete joint segment. Considering the difficulties in practical engineering, the optimization design of the shear connection components of the local lattice chambers is aimed at reducing the difficulty of construction and shortening the construction period, while ensuring that the stress performance and force transmission mechanism of the entire steel–concrete joint segment lattice chamber do not change significantly.
Based on the stress characteristics of the entire lattice chamber model, it was found that the middle part was under greater stress, and stress concentration was likely to occur near the rear compression plate. Therefore, the optimization scheme retained the first four rows of shear studs near the rear compression plate and directly removed those distributed on both sides of the top plate of the lattice chamber. According to the force transmission path and transmission ratio of the lattice chamber, the shear studs near both sides of the concrete section at the bottom plate were removed, and only the shear studs in the middle part were retained to achieve the desired force transmission effect. For the PBL shear keys, which have a similar force transmission path as the shear studs in the vertical axis, the top PBL keys near the concrete section in the rear seven rows were removed to achieve the optimization goal. For the specific location map of the optimized shear connection components, please refer to Figure 13.
In order to confirm that the optimized model has minimal impact on force transmission mechanisms and overall force performance, we conducted modeling calculations on the optimized model. The study analyzed the influence of judicious reduction of the number of shear studs and PBL connection keys on the overall force performance and force transmission ratio, providing a foundation for practical engineering design and suggesting areas for improvement. The results of the optimized model were compared with the original model, as shown in detail in Figure 14.
The results indicate that there is no significant difference in the overall load performance between the two models in terms of load distribution and peak points. Both the optimized and original models have their maximum stress points located on the shear connectors near the rear compression plate. The overall stress state of both models shows higher stress at the bottom and lower stress at the top, with stress gradually increasing along the loading direction in the concrete section. In terms of force transmission ratio, there is little difference between the two models, and the force transmission paths are almost identical. For a detailed comparison of the force transmission ratios, please refer to Table 7.
From Table 7, it can be seen that due to the reduction in the number of shear connectors, the force transmission ratio of the optimized model has slightly decreased, while the force transmission ratio of the bearing plate has correspondingly increased slightly, but the degree of change is not significant. This indicates that the optimized model has similar performance to the original model in terms of force performance and force transmission ratio, demonstrating the reliability and applicability of the optimized model. It has been proven that the optimized model does not affect the force performance and force transmission ratio of the overall structure, effectively reducing the construction difficulty of the steel–concrete joint section and providing a reference basis for practical applications in related fields.

5. Conclusions

By loading the steel–concrete combined section grid chamber with different fatigue cyclic loads and using finite element simulation calculations, static tests were conducted to study the ultimate load capacity of the chamber under fatigue damage. After analyzing the test results, a prediction model for the ultimate load capacity was proposed. Finally, in order to make the construction of the chamber more convenient in practical engineering, an optimized design for the chamber was obtained. The following conclusions were drawn:
  • The study conducted an ultimate load test on the fatigue-damaged specimens TP1 and TP2, which revealed that the lattice chamber still had a relatively high load capacity even under fatigue damage, with a failure mode of biased pressure. It was inferred that the strength of each part of the steel–concrete joint section under failure decreased in the following order: steel–concrete joint section, steel structure section, and concrete section.
  • The results of the analysis showed that the relative slip amounts of the two specimens were small, indicating good synergy between the steel plate and concrete of the specimens, and the force transmission of the shear connection was reliable. The comparison of the lateral displacement of TP1 and TP2 showed that fatigue damage had some influence on the lateral stiffness of the lattice chamber. The study also summarized the force transmission mechanism of the lattice chamber of the steel–concrete joint section.
  • Finite element analysis calculations were performed on the lattice chamber of the steel–concrete joint section, and the results were compared with the experimental results. The failure mode of the model was found to be consistent with that of the experiment, and the force transmission ratios of each component were analyzed.
  • By considering the force transmission ratio of each component, the study established a prediction model for the ultimate load capacity of the local lattice chamber of the steel–concrete joint section, which incorporated the degree of structural fatigue damage. Comparison of the experimental results with the predicted values showed good agreement, providing ideas and references for related practical engineering designs.
  • The study also carried out an optimization design of the number of shear connection elements in the local lattice chamber. The comparison of the optimized model with the original model showed that both had similar force transmission ratios and performance, indicating that the optimized model was reliable and applicable and could provide references for practical engineering designs.

Author Contributions

H.W. critically reviewed the important knowledge content of the article, edited the subsequent version of the manuscript, and participated in the interpretation, editing, and review of the data. S.W. contributed to the conception and design of the study, processed all the data, analyzed and interpreted the data, completed the first draft of the manuscript, contributed to data collection and processing, as well as manuscript editing, and contributed to the analysis and interpretation of the results. All authors have read and agreed to the published version of the manuscript.

Funding

This work is supported by the Ministry of Railways Science and Technology Research and Development Program (2012G007-B).

Data Availability Statement

Not applicable.

Acknowledgments

The authors thank the Ministry of Railways Science and Technology Research and Development Program Project.

Conflicts of Interest

The authors declare no conflict of interest.

References

  1. He, S.; Mosallam, A.S.; Fang, Z.; Liu, L. Structural evaluation of steel–concrete joint with UHPC grout in single cable–plane hybrid cable-stayed bridges. J. Bridge Eng. 2019, 24, 04019022. [Google Scholar] [CrossRef]
  2. Kim, S.H.; Lee, C.G.; Kim, S.J.; Won, J.H. Experimental study on joint of spliced steel–PSC hybrid girder, part II: Full-scale test of spliced hybrid I-girder. Eng. Struct. 2011, 33, 2668–2682. [Google Scholar] [CrossRef]
  3. Zhang, D.L.; Bao, Y.W.; Gao, J.H.; Xiao, L.; Li, X.Z. Research on Load Transfer Mechanism of Steel-Concrete Joint Section of Hybrid Beam Cable-Stayed Bridge. In Advanced Materials Research; Trans Tech Publications, Ltd.: Stafa-Zurich, Switzerland, 2013. [Google Scholar]
  4. He, J.; Liu, Y.; Pei, B. Experimental study of the steel-concrete connection in hybrid cable-stayed bridges. J. Perform. Constr. Facil. 2014, 28, 559–570. [Google Scholar] [CrossRef]
  5. Liu, R.; Liu, Y. Analysis of auxiliary ribs in steel–concrete joint of hybrid girder. J. Constr. Steel Res. 2015, 112, 363–372. [Google Scholar] [CrossRef]
  6. Zhou, Y.; Pu, Q.H.; Shi, Z.; Gou, H.Y.; Yang, S.L. Experimental Study on Load Transfer and Fatigue Performance of Steel Concrete Composite Segment of Railway Hybrid Beam Cable-Stayed Bridge. J. Civ. Eng. 2015, 48, 77–83. [Google Scholar]
  7. Cheng, X.; Nie, X.; Fan, J. Structural performance and strength prediction of steel-to-concrete box girder deck transition zone of hybrid steel-concrete cable-stayed bridges. J. Bridge Eng. 2016, 21, 04016083. [Google Scholar] [CrossRef]
  8. He, S.; Fang, Z.; Mosallam, A.S. Push-out tests for perfobond strip connectors with UHPC grout in the joints of steel-concrete hybrid bridge girders. Eng. Struct. 2017, 135, 177–190. [Google Scholar] [CrossRef]
  9. Zhang, Q.; Jia, D.; Bao, Y.; Cheng, Z.; Bu, Y.; Li, Q. Analytical study on internal force transfer of perfobond rib shear connector group using a nonlinear spring model. J. Bridge Eng. 2017, 22, 04017081. [Google Scholar] [CrossRef]
  10. Zhang, Q.; Pei, S.; Cheng, Z.; Bao, Y.; Li, Q. Theoretical and experimental studies of the internal force transfer mechanism of perfobond rib shear connector group. J. Bridge Eng. 2017, 22, 04016112. [Google Scholar] [CrossRef]
  11. Zhang, Q.; Jia, D.; Bao, Y.; Cheng, Z.; Xiao, L.; Bu, Y. Internal force transfer effect-based fatigue damage evaluation for PBL shear connector groups. J. Constr. Steel Res. 2018, 148, 469–478. [Google Scholar] [CrossRef]
  12. Zhang, Q.; Jia, D.; Bao, Y.; Dong, S.; Cheng, Z.; Bu, Y. Flexural behavior of steel–concrete composite beams considering interlayer slip. J. Struct. Eng. 2019, 145, 04019084. [Google Scholar] [CrossRef]
  13. Liu, Y.; Zhang, Q.; Bao, Y.; Bu, Y. Static and fatigue push-out tests of short headed shear studs embedded in Engineered Cementitious Composites (ECC). Eng. Struct. 2019, 182, 29–38. [Google Scholar] [CrossRef]
  14. Liu, Y.; Zhang, Q.; Meng, W.; Bao, Y.; Bu, Y. Transverse fatigue behaviour of steel-UHPC composite deck with large-size U-ribs. Eng. Struct. 2019, 180, 388–399. [Google Scholar] [CrossRef]
  15. Pu, Q.; Yang, S.; Shi, Z.; Hong, Y.; Zhou, Y. Fatigue performance of an innovative steel–concrete joint in long-span railway hybrid box girder cable-stayed bridges. J. Bridge Eng. 2021, 26, 04020129. [Google Scholar] [CrossRef]
  16. Volke, E. The current pressure in the case of the Nordbrucke Mannheim-Ludwigshafen (Kurt-Schumacher bridge). Ger. Teil 1973, 1, 97–104. [Google Scholar]
  17. Virlogeux, M. The Normandie Bridge, France: A new record for cable-stayed bridges. Struct. Eng. Int. 1994, 4, 208–213. [Google Scholar] [CrossRef]
  18. Virlogeux, M. Recent evolution of cable-stayed bridges. Eng. Struct. 1999, 21, 737–755. [Google Scholar] [CrossRef]
  19. Ohlsson, S. Modal testing of the Tjorn Bridge. In Proceedings of the 4th International Modal Analysis Conference, Los Angeles, CA, USA, 3–6 February 1986. [Google Scholar]
  20. Yabuno, M.; Fujiwara, T.; Sumi, K.; Nose, T.; Suzuki, M. Design of Tatara bridge. IHI Eng. Rev. 2003, 36, 40–56. [Google Scholar]
  21. He, S.; Fang, Z.; Fang, Y.; Liu, M.; Liu, L.; Mosallam, A.S. Experimental study on perfobond strip connector in steel–concrete joints of hybrid bridges. J. Constr. Steel Res. 2016, 118, 169–179. [Google Scholar] [CrossRef]
  22. Tian, J.; Zheng, G.; Tang, G.; Chen, J. Experimental Study on Static Load and Fatigue of Steel Concrete Joint Model of Chongqing Shibanpo Yangtze River Bridge Double Track Bridge. Highw. Traffic Technol. 2007, 2, 113–117. [Google Scholar]
  23. Ru, K. Fatigue Performance Research and Experimental Scheme Design of the Combined Section of the Beam and Side Wall of a High-Speed Railway Spatial Rigid Frame Bridge. Ph.D. Thesis, Southwest Jiaotong University, Chengdu, China, 2011. [Google Scholar]
  24. Xiao, L.; Li, X.; Satellite; Su, X. Experimental Study on Fatigue Performance of Steel Concrete Composite Segment of Space Rigid Frame Structure. Eng. Mech. 2013, 30, 83–89. [Google Scholar]
  25. Li, X.; Xiao, L.; Su, X.; Wei, X. Mechanical properties of steel concrete composite segments of spatial rigid frame structures. J. Southwest Jiaotong Univ. 2012, 47, 907–914. [Google Scholar]
  26. Yang, S. Study on Fatigue Behavior of Steel Concrete Composite Section of Hybrid Beam Bridge. Ph.D. Thesis, Southwest Jiaotong University, Chengdu, China, 2012. [Google Scholar]
  27. Zhan, Y.; Zhao, R.; Mao, X.; Dong, B. Model test of steel concrete composite section of Dongping Bridge. Bridge Constr. 2011, 4, 20–24. [Google Scholar]
  28. Gu, Y.-W.; Nie, X.; Liu, Y.-F.; Duan, S.-K.; Fan, J.-S. Experimental and numerical study of steel-to-concrete joint section in hybrid cable-stayed bridges. J. Constr. Steel Res. 2021, 187, 106982. [Google Scholar] [CrossRef]
  29. GB50010-2010; Code for Design of Concrete Structures GB50010-2010 (2015 Edition). China Academy of Building Research: Beijing, China, 18 August 2010.
  30. GB 50017-2017; Steel Structure Design Standard: [S]. Domestic—National Standard. State Administration for Market Regulation CN-GB: Beijing, China, 12 December 2017.
  31. Zhang, Q.; Li, Q.; Tang, L. A three-dimensional nonlinear simulation analysis method for shear connectors. J. Southwest Jiaotong Univ. 2005, 40, 595–599. [Google Scholar]
  32. Hosaka, T.; MItsugi, K.; Hiragi, H.; Ushijima, H. Study on shear strength and design method of perfobond strip. Jpn. J. Struct. Eng. 2002, 48, 1265–1272. [Google Scholar]
  33. Nishiumi, K.; Okimoto, M. Shear strength of perfobond rib shear connector under the confinement. Doboku Gakkai Ronbunshu 1999, 1999, 193–203. [Google Scholar] [CrossRef]
  34. Zong, Z.; Che, H. Experimental study on static load and fatigue of shear connectors. J. Fuzhou Univ. Nat. Sci. Ed. 1999, 27, 61–66. [Google Scholar]
  35. Liu, Y.; Zhou, W.; Jiang, J. Experimental study on shear resistance of perforated plate connectors. Bridge Constr. 2006, 6, 1–4. [Google Scholar]
  36. Roberts, W.S.; Heywood, R.J. Development and testing of a new shear connector for steel concrete composite bridges. In Proceedings of the Fourth International Bridge Engineering Conference, San Francisco, CA, USA, 28–30 August 1995. [Google Scholar]
  37. Hu, J.; Hou, W.; Ye, M. Research on the influencing factors and calculation formulas for the load capacity of PBL shear keys. J. Railw. Sci. Eng. 2007, 4, 12–18. [Google Scholar]
  38. GB50017-2003; Code for Design of Steel Structures GB. Ministry of Construction of the People’s Republic of China: Beijing, China, 25 April 2003.
  39. Hobbacher, A. The IIW fatigue design recommendations-newly revised and expanded. Weld. World-Lond. 2007, 51, 243. [Google Scholar]
Figure 1. Key lattice frame structure extracted from the real bridge.
Buildings 13 01254 g001
Figure 2. Arrangement of displacement measurement point.
Buildings 13 01254 g002
Figure 3. Failure morphology of specimen TP2.
Buildings 13 01254 g003
Figure 4. Axial load–displacement curves of specimens.
Buildings 13 01254 g004
Figure 5. Load–relative slip curves of specimens: (a) TP1; (b) TP2.
Buildings 13 01254 g005
Figure 6. Load–lateral displacement curves of specimens: (a) TP1; (b) TP2.
Buildings 13 01254 g006
Figure 7. Force transmission mechanism of the key compartment in the steel–concrete joint section: (a) shear studs; (b) PBL shear keys.
Buildings 13 01254 g007
Figure 8. Grid division of cell model.
Buildings 13 01254 g008
Figure 9. Constitutive relationship of grid material: (a) concrete; (b) steel plate; (c) steel reinforcement.
Buildings 13 01254 g009
Figure 10. Grid finite element model of buckling failure of stiffened panels.
Buildings 13 01254 g010
Figure 11. Axial load–displacement curve of finite element model.
Buildings 13 01254 g011
Figure 12. N-R fitting curve for the cell.
Buildings 13 01254 g012
Figure 13. Location diagram of optimized shear connectors: (a) lateral view of the grid cell; (b) sectional view 1-1.
Buildings 13 01254 g013
Figure 14. Comparison of finite element analysis between the original and optimized models: (a) original model; (b) optimized model.
Buildings 13 01254 g014
Table 1. The material parameters of the specimens.
MembersMaterial TypesDimensions
(/mm)
Elastic Modulus
(/MPa)
Poisson’s Ratio
ConcreteC60-3.6 × 1040.2
Steel platesQ34512/16/32 (thickness)2.06 × 1050.3
Prestressed steel strands 1High-strength, low-relaxation15.2 (diameter)1.95 × 1050.3
PBL through barsHRB400122.06 × 1050.3
Shear studsML1510 (diameter)2.06 × 1050.3
1 The nominal tensile strength of prestressed steel strands used in the study was set at 1860 MPa, and the cross-sectional area was determined based on actual values.
Table 2. Various working conditions of steel–concrete combination interface in real bridge.
Operating ConditionsAxial Force
(/kN)
Shear Force (/kN)Bending Moment
(/kN·m)
Torsional Moment
(/kN·m)
Maximum positive bending moment−5.61 × 10⁴−5.71 × 1027.49 × 1043.63 × 102
Maximum negative bending moment−7.46 × 10⁴−4.37 × 10³−5.50 × 10⁴−1.31 × 10²
Maximum axial force−7.47 × 10⁴−4.22 × 10³−2.25 × 10⁴−1.32 × 10²
Table 3. Characteristics and modes of failure of the test specimen model.
Trial IDFatigue Damage Level
(/104 Cycles)
Ultimate Load
(/kN)
Failure ModeFailure Characteristics
TP125011,820Eccentric compressionConcrete exhibited penetrating cracks concrete was crushed, stiffeners buckled
TP220013,551Eccentric compressionConcrete exhibited penetrating cracks concrete was crushed, stiffeners buckled
Table 4. Load distribution ratio of individual members in grid structure.
ComponentForce Transmission Ratio
Back pressure plate63.2%
Shear studsBottom plate15.3%
Top plate5.3%
PBL shear keysLeft side8.1%
Right side8.1%
Table 5. Comparison of ultimate load capacity results of various types (kN).
Calculation FormulaReferenceUltimate Load CapacityRelative Error
Q u = 1.79 d 2 f c [36]148.70.936
Q u = 1.45 d 2 d s 2 f c + d s 2 f y 26.1 [32]146.40.906
Q u = 0.26 A c f c + 1.23 A s f y ,   A s f y / A c f c < 1.28
Q u = 1.83 A c f c ,   A s f y / A c f c 1.28
[33]59.80.221
Q u = α 1 β 1 A c E c f c + α 2 β 2 A tr f y [34]48.0 0.375
Q u = α A tr f y + β A tr f y + Y A c f c [37]66.8 0.130
Q u = A s τ   -80.8 0.051
Finite element calculation results-76.8-
Table 6. Comparison of ultimate load capacity results for grid foundations.
Ultimate Load CapacityCalculated Value (/kN)Experimental Value (/kN)Error (%)
NaNbNcN
TP111,166.2034,117.6611,864.1311,166.2011,8205.53
TP212,901.4839,118.0413,874.8212,901.4813,5514.79
Finite element15,190.5646,418.5816,820.2415,190.6516,0805.54
Table 7. Comparison of force transmission results between optimized model and the original model.
ModelRear Compression PlateShear StudsPBL Shear Keys
Original model63.2%20.6%16.2%
Optimization model65.8%18.2%15.4%
Variation2.6%2.4%0.8%
Disclaimer/Publisher’s Note: The statements, opinions and data contained in all publications are solely those of the individual author(s) and contributor(s) and not of MDPI and/or the editor(s). MDPI and/or the editor(s) disclaim responsibility for any injury to people or property resulting from any ideas, methods, instructions or products referred to in the content.