Article

Performance Evaluation of Polypropylene Fiber-Reinforced Pavement Quality Concrete Made with Waste Granite Powder

by
Palanisamy Murthi
1,*,
Velpula Lavanya
2,
Alireza Bahrami
3,* and
Kolandasamy Poongodi
2
1
Centre for Construction Methods and Materials, SR University, Warangal 506371, India
2
Department of Civil Engineering, SR University, Warangal 506371, India
3
Department of Building Engineering, Energy Systems and Sustainability Science, Faculty of Engineering and Sustainable Development, University of Gävle, 801 76 Gävle, Sweden
*
Authors to whom correspondence should be addressed.
Buildings 2023, 13(5), 1294; https://doi.org/10.3390/buildings13051294
Submission received: 15 April 2023 / Revised: 9 May 2023 / Accepted: 10 May 2023 / Published: 16 May 2023

Abstract

:
This research was conducted to evaluate the influence of waste granite powder (WGP) and polypropylene (PP) fibers on the performance of M35-grade pavement quality concrete (PQC). WGP was mixed in PQC as replacement for cement and was varied from 0% to 25%. The pozzolanic concert of WGP was examined by the strength activity index. The performance of PP fibers in PQC was assessed after the addition of fibers from 0.25% to 1.25% by volume of concrete. The mechanical properties of PQC were evaluated including the compressive strength, flexural strength, and various durability related properties such as the acid attack, absorption test, sorptivity test, and chloride penetration depth test. The results showed that PQC blended with WGP enhanced the strength slightly up to the replacement level of 15%. The addition of PP fibers rooted the reduction of the slump value; however, it improved the mechanical properties up to the presence of 0.5% PP fibers in PQC. The relationship between the compressive strength and flexural strength of WGP blended with PP fiber-reinforced PQC was established.

1. Introduction

In view of sustainability in construction, potential investigation reports are prevailing with various types of fine waste particles used as cement replacement materials in mortar and concrete with rich SiO2 content, such as fly ash [1], silica fume [2], rice husk ash (RHA) [1], ground granulated blast furnace slag [2], metakaolin [2], and bagasse ash (BA) [3]. The other industrial waste products with high SiO2 content are also considered as pozzolanic material in the recent periods such as glass powder (GLP) [4], limestone powder [1], marble powder [5], waste granite powder (WGP) [6], and dolomite powder (DP) [7].
Fine grounded powder, sourced from waste glass, was found as a cement replacement pozzolanic material [2]. Islam et al. [8] prepared cement mortar using micro-size GLP for the partial replacement of cement and resulted that the flow and workability of GLP-blended mortar increased. Based on the strength properties, a 20% replacement of cement by GLP was found to be optimum. Elaqra and Rustom [9] concluded that GLP contributes to the formation of more hydration products and develops a higher amount of the secondary hydration, and hence enhances the mechanical properties up to a 20% replacement level. The reduction of free lime precipitated during hydration due to the presence of GLP in the cement paste improves the pore structure and reduces the risk of alkali silica reactions in the cement paste [10]. However, the partial replacement of cement by GLP delays the hydration rate during the early period and also decreases the strength development in the early periods. In the later age, the strength properties were found to be higher thanks to the pozzolanic activity of GLP in the cement paste and concrete [8,9].
The other category of waste product sourced from the ceramic industry was also investigated by various researchers. Waste ceramic powder (WCP) blended with cement as a partial replacement material showed greater resistance to chloride penetration and enhanced electrical resistivity [11]. The improvement in micro-structural performance of the cement paste using WCP with a lower w/c ratio was achieved in a study carried out by Chen et al. [12]. There was no marginal difference in the setting time; however, the workability was noticed after the addition of 20% WCP to concrete. The addition of more than 20% WCP can cause the reduction of both fresh and hardened properties of concrete.
DP has been verified as a cement replacement material, and it can increase the hydration rate of cement, but it reduces the fluidity of the cement paste due to its high specific surface area, and 8% to 12% replacement of cement is recommended suitable, considering the pore structure characteristics and mechanical properties [13].
Kanmalai et al. [14] conducted an investigation on WGP as fine aggregate of ternary blended high-performance concrete and attained the compressive strength value of 47.35 MPa at 90 days, and further discovered a reduction in the strength after adding higher amounts of WGP. Chemically, WGP is rich in silica, and it can be used as a pozzolanic material in concrete [15,16]. However, it is allowed to treat WGP with bleaching techniques before blending to increase the chemical action [17]. The addition of 10% WGP instead of sand by weight increases the mechanical properties up to 30% compared with normal concrete [18,19]. The reduction of the workability was noticed after the substitution of 5% WGP and demonstrated minimum voids, which contributes to improving the durability properties [20]. The findings of the latest research on WGP are highlighted in Table 1.
WGP is a non-biodegradable waste generated in granite stone cutting and grinding processes [21,22]. In India, Telangana State has a high proportion of granite-cutting industry and a discharged abundant quantity of granite slurry. The slurry is dried and generates a very fine dry powder which causes lung diseases [23]. The collection of WGP from the industry in an organized manner can control the presence of silica in air and hence prevent the silicosis hazard [24]. From the previous findings, it was observed that WGP was mostly used as fine aggregate and only limited results are available for use as cementitious material. The studies on the impact of WGP in fiber-reinforced concrete are also limited.
With this background, the aim of this research is to evaluate the impact of WGP in fiber-reinforced pavement quality concrete (PQC). PQC is a special concrete and differs from normal concrete, which is the topmost portion of rigid pavement and is provided for most road construction works. PQC requires slightly higher cement content, and it is generally designed as higher-grade (M35 to M50) concrete using 32 mm size aggregate with a low slump value of less than 50 mm [25]. PQC makes the pavement a hard and durable surface, and it can withstand any traffic loading conditions [26,27]. In order to achieve the desired property of PQC, various mineral admixtures are added. The uniqueness of the current investigation is to examine the enhancement level of the compressive and flexural strengths properties of polypropylene (PP) fiber-reinforced PQC (PPFRPQC) after considering WGP as a cement replacement material. The consequence of this research is to offer awareness on the recycling of WGP in rigid pavement construction to contribute to the sustainability of concrete construction and reduce the consumption of natural resources. In this article, the pozzolanic performance of WGP was evaluated by the strength activity index (SAI) and the fundamental strength and durability properties were studied. The results were correlated to develop a new relationship between the compressive strength and flexural strength of PQC and compared with the code recommendation to validate the findings.
Table 1. Latest research findings.
R. No.Author (Year)Type of WasteNature of
Replacement in Concrete
Type of ConcreteFinding
[28]Prokopski et al. (2020)Granite dustPartial replacement of sand. “Portland cement—granite dust—sand” systemMedium-strength concreteWGP increased the average density of concrete and provided dense micro-structure, the water absorption was reduced by 32–38%, and the water penetration was decreased by 60–70%, when granite dust was added to the concrete mix. The strength was increased about 17 to 19% when compared with the control concrete.
[29]Jain et al. (2020)Granite powderPartial replacement of fine aggregateSelf-compacting concreteThe strength and durability properties were improved at up to 40% and 60% substitution levels of granite powder, respectively.
[30]Ahmed and Tobbala (2022)Granite dustPartial replacement of fine aggregate up to 60%Engineered cementitious composites (ECC)Greater mechanical properties were achieved, while the water absorption was reduced by 28.8% at 10% replacement level of granite dust.
[31]Shwetha et al. (2022)Granite wastePartial replacement of cementNormal-strength concreteThe mechanical properties were enhanced with w/c ratio of 0.45.
[32]Mohsen et al. (2022)Granite wastePartial replacement of cementNormal-grade concrete for structural applicationsUp to 45 °C, the substitution of 25% granite waste as the cement replacement caused a significant increase in the viscosity, yield stress, and strength properties.
[33]Lu et al. (2023)Granite powderPartial replacement of sandCement mortarThe substitution of granite powder as an inert material could promote the hydration of cement and decreased the porosity and water absorption.
[34]Kim et al. (2023)Granite wastePartial replacement of cement and fine aggregateCement mortar for masonry construction purposeThe workability was increased when a particle size of smaller than 0.15 mm was used as the cement replacement and mitigated the drying shrinkage. The coarse particles of larger than the fraction size of 0.15 mm as the replacement of fine aggregate could contribute to the strength development.
[35]Muñoz Pérez et al. (2023)Granite powderPartial replacement of sandNormal-strength concreteReduction of the slump was observed. The strength properties were increased thanks to the substitution of granite powder up to 20%.

2. Materials and Methods

2.1. Materials

2.1.1. Cement and Aggregates

The market-available ordinary Portland cement (OPC) based on IS: 269-2015 [36] was utilized in this investigation. The physical properties and chemical oxide compositions of OPC are listed in Table 2. The local available river sand was used and found as grading zone—II. The grading curve of sand is illustrated in Figure 1. 30–40 mm size granite coarse aggregate was employed in accordance with IRC: 44-2017 [37]. The physical properties of aggregates are mentioned in Table 3.

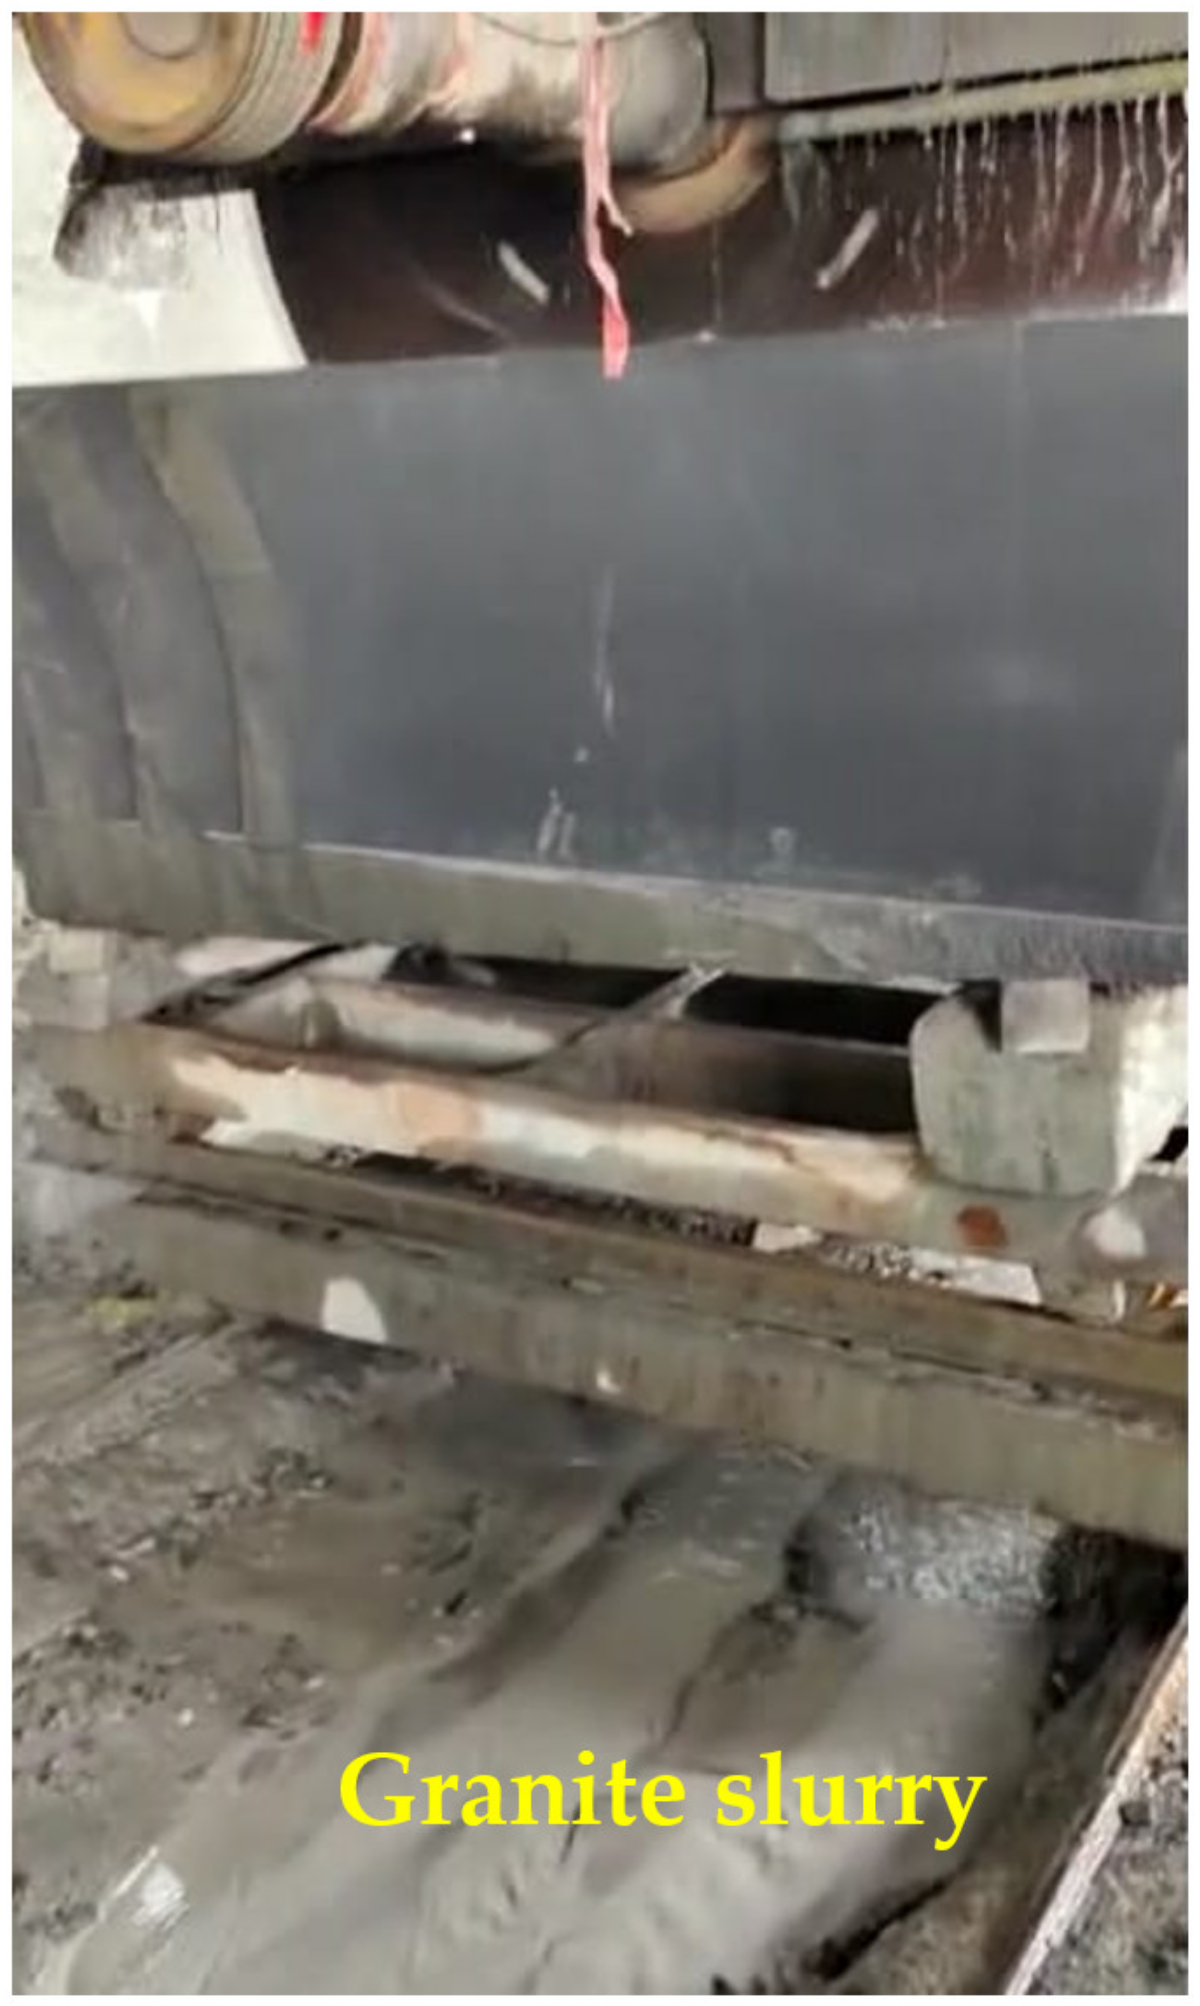
2.1.2. WGP Preparation

WGP, in the form of slurry, was sourced from the local granite cutting and polishing industry, as displayed in Figure 2. Then, slurry was placed in an oven for drying at 105 °C for 8 h. Afterward, WGP was separated by 90 micron-size sieve to obtain the suitable WGP for cement replacement purposes [38]. The WGP specimen containing 45 to 90 microns was selected for this investigation. The physical and chemical oxide compositions of WGP are reported in Table 2. The SiO2 content of WGP was more than 72% and hence was selected as pozzolanic material. The commercially available PP fiber was added to the concrete mix to make PPFRPQC.

2.2. Mix Proportioning

Two stages of concrete mixes were developed to evaluate the impact of PP fibers on the mechanical properties of PQC. In accordance with IRC: 44-2017 [37], the minimum grade of concrete for PQC is M35. Thus, M35-grade PQC was considered. Stage I was used to develop the WGP-blended control PQC specimen, and stage II was the development of the M35-grade fiber-reinforced PQC specimen. The IRC: 44-2017 [37] and IRC: 15-2011 [39] provisions were followed for achieving mix-proportioning with the targeted characteristic flexural strength of 4.5 MPa after a 28-day curing period. The minimum and maximum cement portions were selected as 350 kg/m3 and 425 kg/m3, respectively, based on IRC: 15-2011 [39]. The mix-proportioning of the control PQC specimens is presented in Table 4. After doing various trials, the OPC portion of M35-grade PQC without WGP was selected as 400 kg/m3. The WGP replacement levels of 5, 10, 15, 20, and 25% were chosen for finding the optimum dosage level in stage I. According to the replacement levels, PQC was designated suitably, as provided in Table 4. Mix-proportioning of the WGP-blended PPFRPQC specimens with the fiber contents of 0.25, 0.5, 0.75, 1.0, and 1.25% by weight of concrete in stage II is demonstrated in Table 5.

2.3. Methods

2.3.1. SAI

The pozzolanic nature of WGP was examined by SAI as per ASTM C311 [40]. SAI was obtained by calculating the ratio of the compressive strength of the WGP-blended mortar to the compressive strength of the control mortar. In order to test the SAI value of any natural pozzolanic materials, the cement content should be replaced by 20% pozzolanic material and the tested value of SAI for the pozzolanic material should not be less than 0.75 after 28-day curing and 0.85 for 90-day curing in accordance with ASTM C618 [41].

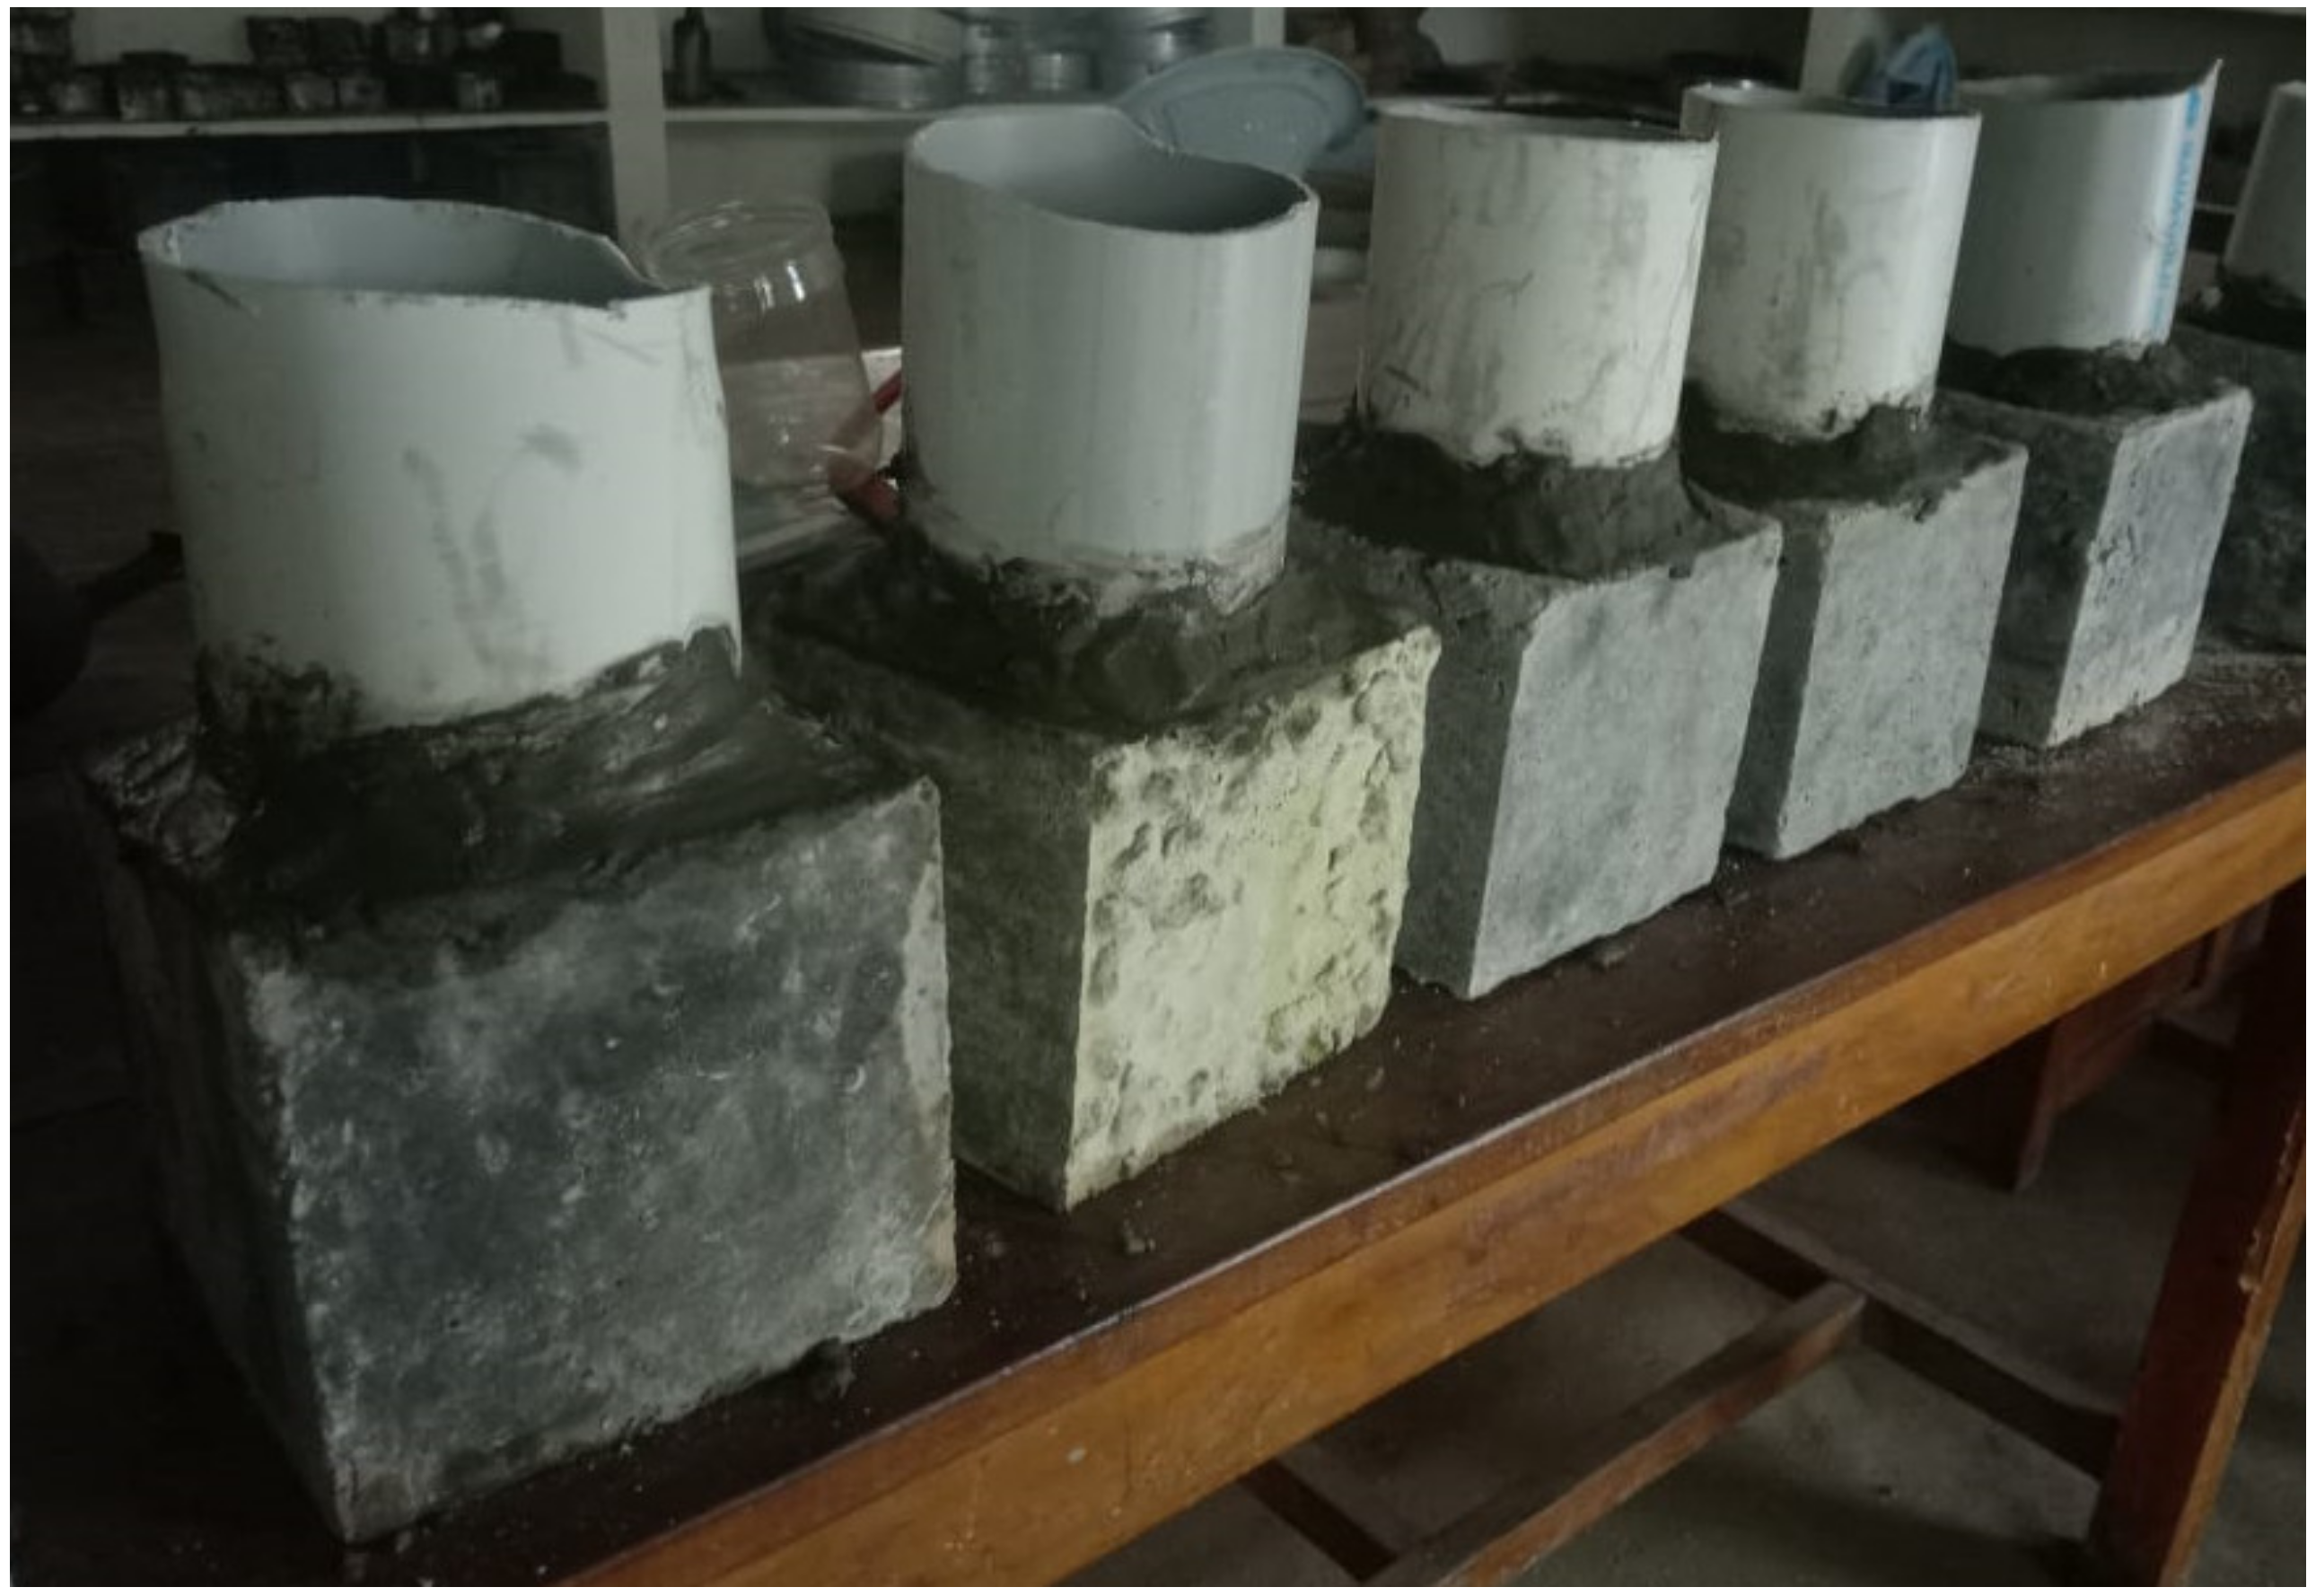
2.3.2. Fresh and Hardened Properties

The fresh PQC was assessed by the slump cone test based on IS: 1199-1959 [42] to investigate the workability. A 3000 kN loading capacity of the compression testing machine was utilized to determine the compressive strength of PQC following IS: 516-1959 [43]. The concrete cubes of 150 mm size were used and an average value of three specimens was taken as the compressive strength of PQC. The cubes were tested after 3 days, 7 days, and 28 days of curing. The concrete prism of 100 mm × 100 mm × 500 mm size was utilized to test the modulus of rupture according to IS: 516-1959 [43] in a four-point loading set-up.

2.3.3. Saturated Water Absorption

The PQC cubes of 150 mm size were employed for obtaining the saturated water absorption (SWA) performance of PQC on the basis of ASTM C642-06 [44]. The SWA test was conducted using cubes cured for 28 days and 90 days. The mass of fully dried cubes (Md) was measured before immersion in water and then the mass of the immersed specimens was measured (Ms). The process of measuring water-absorbed specimen was continued until the mass became constant, which indicated that the specimens were saturated. The SWA values of the PQC cubes were calculated by utilizing the equation below:
SWA = [ M s M d M d ]   ×   100
where
  • Ms = Mass of saturated cube specimen
  • Md = Mass of dry cube specimen

2.3.4. Sorptivity

The PQC cubes of 150 mm size were used to carry out the sorptivity investigation. The impermeability condition of all the four sides of the cubes was developed by applying epoxy resin coating. Then, the PQC cubes were immersed in a water bath over a stand of 5 mm height to allow capillary rise of water. The sorptivity constant was determined by the following equation [45]:
Sorptivity   coefficient   ( expressed   in   m / s 0.5 ) = ( q t )
where
  • q = Quantity of water raised per unit contact area
  • t = Exposure time

2.3.5. Acid Resistance

The performance of the WGP-blended PQC specimens under an acidic environment was studied by the visual assessment and strength reduction factor (SRF). The visual assessment was made by immersing the PQC cubes cured for 28 days and 90 days in a 5% H2SO4 solution for up to 28 days [46]. The reduction of the strength of the cubes due to the acid attack was evaluated after the immersion periods of 2, 4, 8, and 16 weeks. SRF was calculated by the equation below:
SRF = [ f w f a f w ]   ×   100
where
  • fw = Compressive strength of PQC cured in water
  • fa = Compressive strength of PQC immersed in acid

2.3.6. Chloride Penetration Depth

The PQC cubes of 150 mm size were employed to do the chloride penetration-depth tests. A PVC pond was prepared over the cube as shown in Figure 3 and filled with 3% by weight of the sodium chloride (NaCl) solution. The solution was changed every 10 days to maintain the constant chloride solution. After 9 cycles of exposure period, the chloride ion diffusion was determined by taking powdered specimens of concrete at every 5 mm depth from surface by the water-soluble method [47,48].

3. Results and Discussion

3.1. SAI

The control mortar mix was developed with a mix of 1:3 and water binder ratio of 0.5 according to the procedure given in ASTM C311 [40]. The compressive strength of the control mortar was found as 32.07 MPa and 47.35 MPa after the curing periods of 7 days and 28 days, respectively. The compressive strengths of the 20% WGP-blended cement mortar after 7 days and 28 days were calculated as 77.3% and 87.1%, respectively. The SAI values of 0.77 and 0.87 at 7 days and 28 days satisfied the ASTM C311 [40] provisions. SAI was determined as 0.92 at the 90-day curing period. The increase in SAI after 28 days was due to the formation of the secondary hydration products of WGP. The SAI values of the palm oil clinker powder were found in a study as 0.76 and 0.87 after 7 days and 28 days of curing, respectively [49]. RHA has an SAI value of 0.88 after 7 days of curing and 0.96 after 28 days of curing [50]. The SAI values of 10% and 20% replacements of WCP were obtained as 0.91 and 1.05, respectively, and were found suitable for replacing cement as pozzolanic material [11]. Similarly, the pozzolanic nature of GLP and DP was satisfactory due to the presence of SiO2 compounds [2,7]. The SAI values of other pozzolanic materials such as BA [51], bottom ash [52], and scoria and pumice [53] were determined by various investigations and found to satisfy the ASTM C311 [40] provisions. In accordance with ASTM C618 [41], the minimum requirement of silica + alumina + iron oxides content for natural pozzolana should be more than 70%. The sum of silica, alumina, and iron oxides was found as 85.53%, which is more than the threshold limit specified in ASTM C618 [41]. By considering the SAI results of WGP and its oxide compounds and in addition comparing them with various waste powders, WGP led to be as a suitable pozzolanic material in concrete.

3.2. Effect of WGP on Workability of Fresh PQC

The slump test and variations in the slump values of all PQC mixtures after the addition of WGP are depicted in Figure 4. The values mentioned in Figure 4b are the mean values of three trials of the tests. An insignificant decrease in the workability from 39 mm to 38 mm slump value was noticed up to 15% WGP in PQC mixtures, but the slump value started decreasing at a higher rate beyond the presence of 15% WGP by replacing cement. The decreasing slump value was due to the physical effect of WGP, which flew slower than the cement particles. The higher replacement of cement by WGP made the consistency of concrete sticky, causing the reduction of the slump value [18,19]. However, the slump value of PQC was specified in the range of 40 ± 10 mm for manual construction using the needle vibration [33].

3.3. Effect of WGP on Mechanical Properties of Hardened PQC

3.3.1. Compressive Strength

The impact of adding WGP to PQC as an alternate to cement was assessed by performing the compressive strength tests using 150 mm cube specimens. The compressive strengths of the WGP-blended PQC specimens were achieved after 7-, 28-, and 90-day curing periods. The compressive strength test and the results are presented in Figure 5. The compressive strength of PQC without WGP (0% WGP) was obtained as 40.37 MPa at 28 days and then it was marginally increased up to the range of 15% to 20% WGP content. The similar strength development trend was observed in cubes cured for 90 days. The strength of cubes cured for 28 days after adding 15% WGP was 9.8% higher than PQC without WGP. The reason for the increased strength is attributed to minimizing the loss of moisture in concrete during hydration, due to storing the moisture by absorption of WGP and supplying the absorbed water for further hydration process later. However, the water demand was developed by adding more than the threshold level of WGP; causing a reduction of hydration which led to a reduction in the strength. From Figure 5b, it was decided that the optimum level of replacing cement by WGP be restricted to 18%.

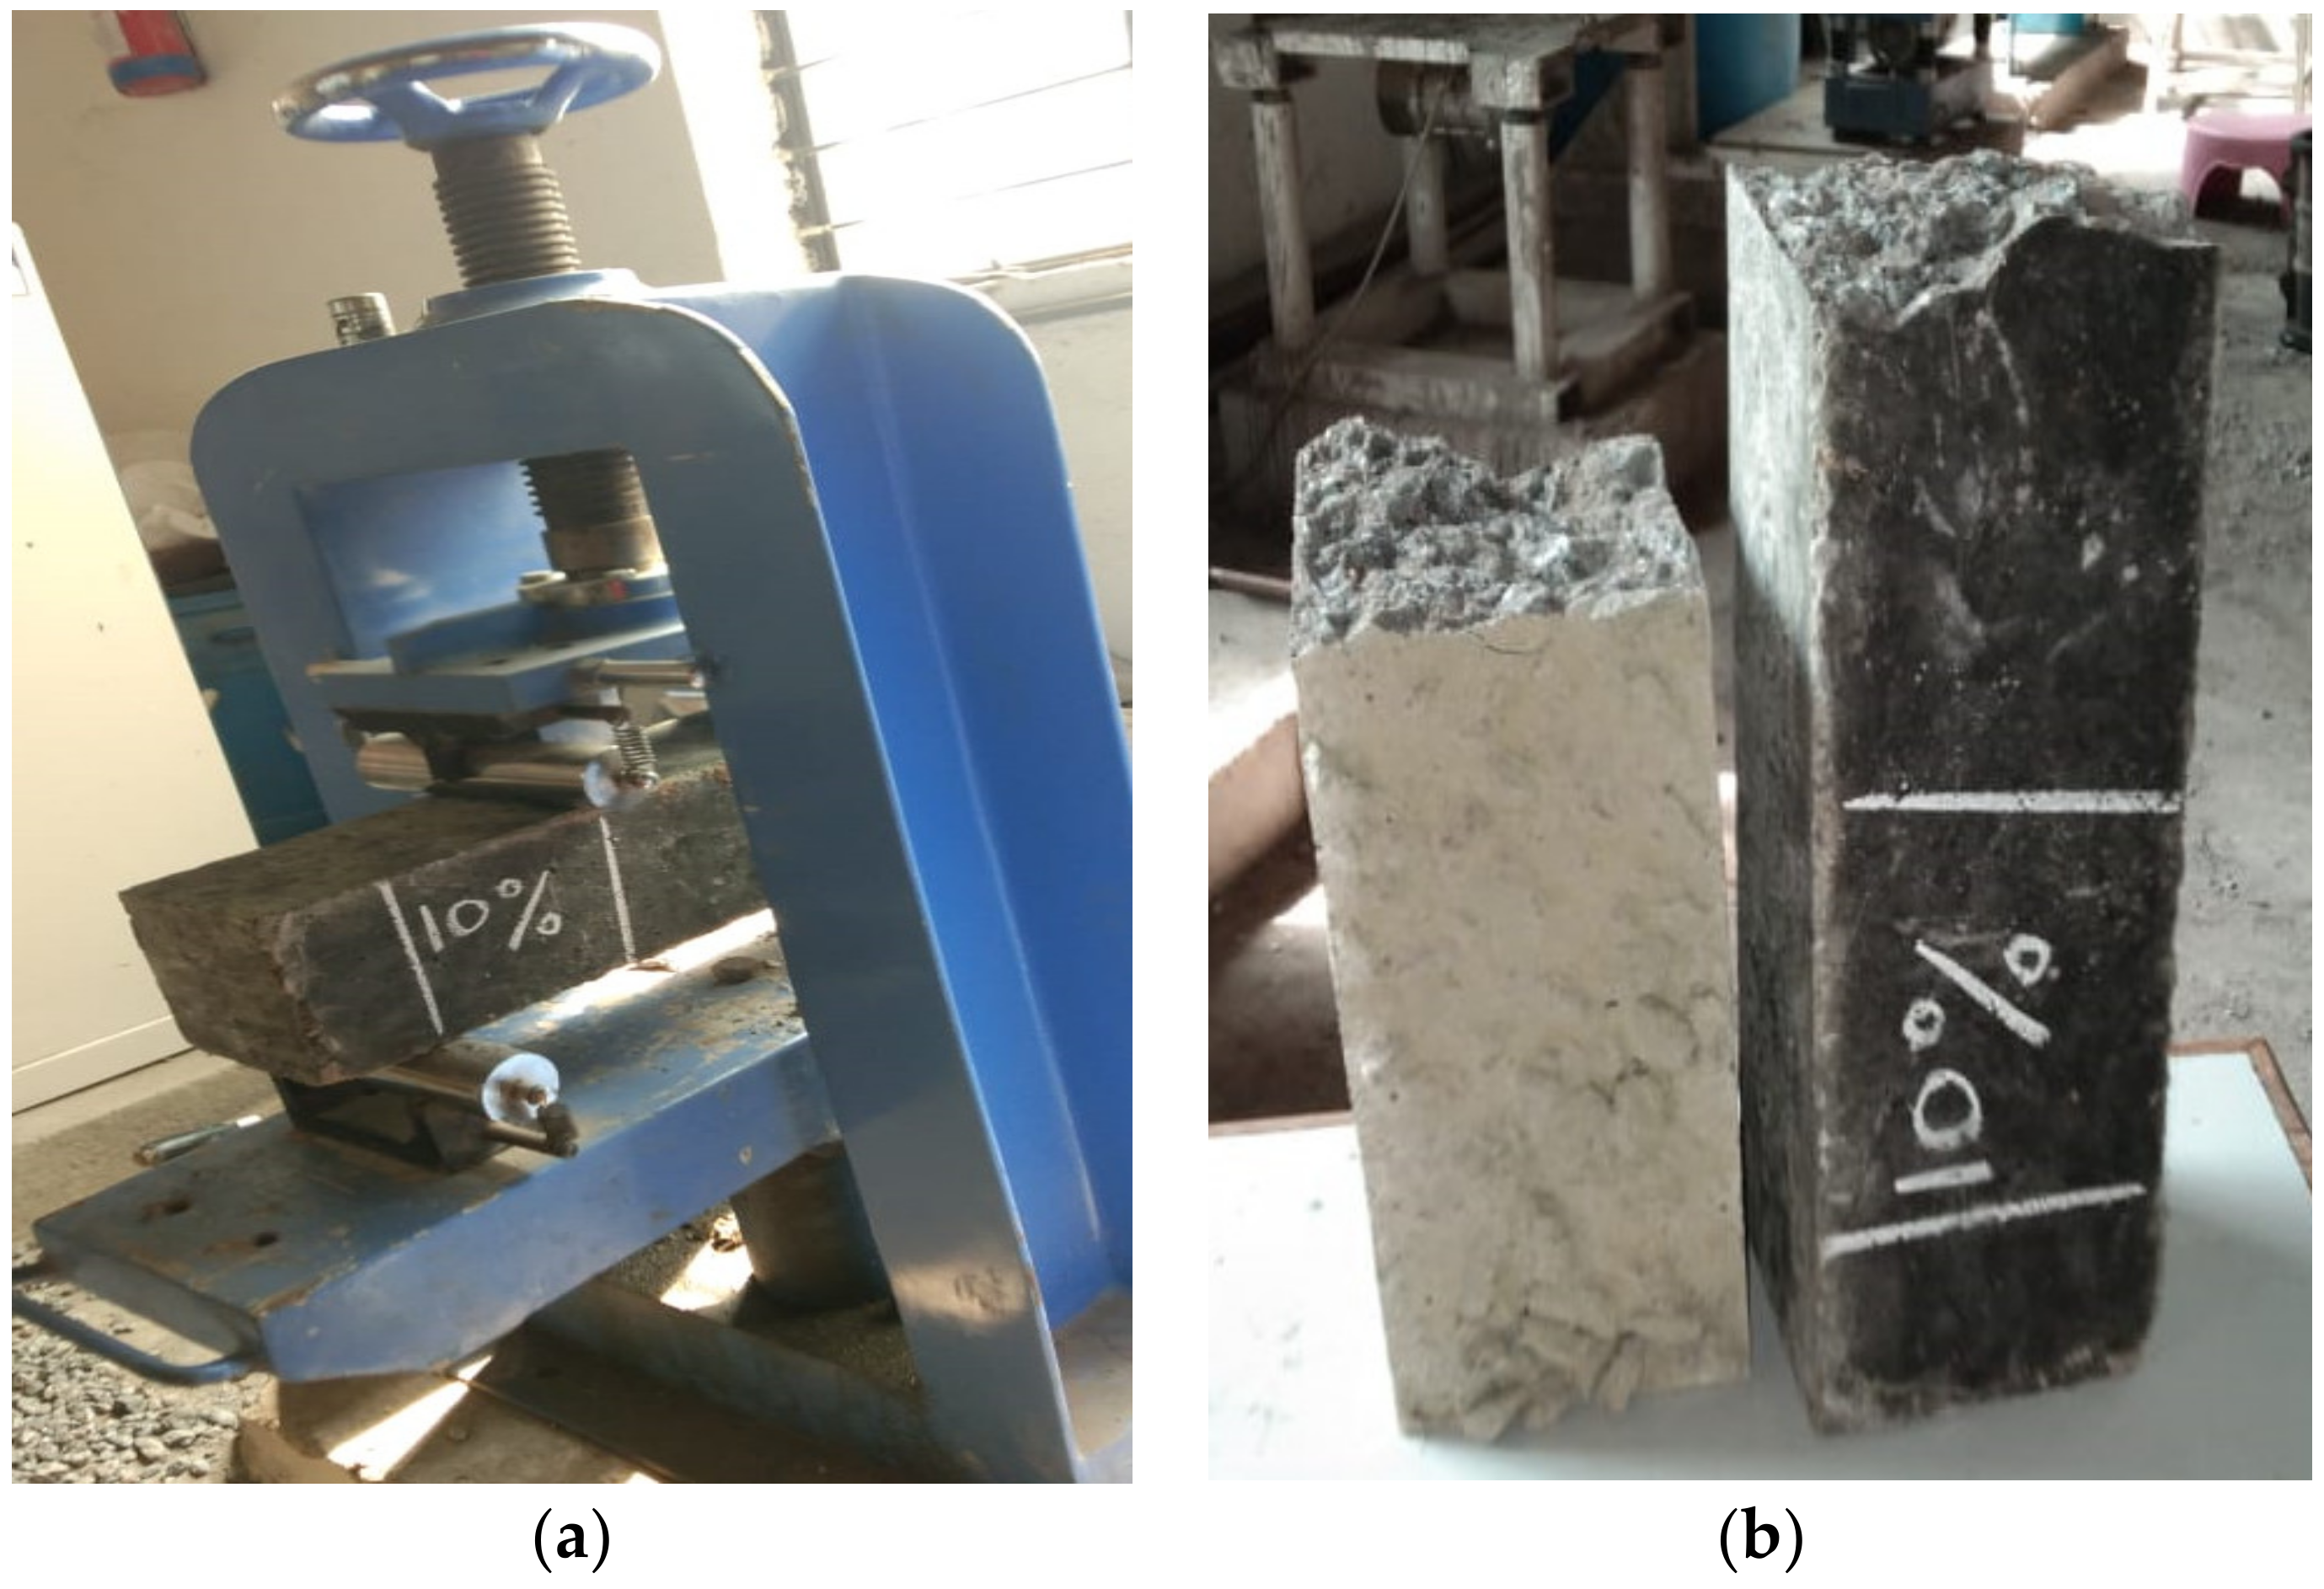
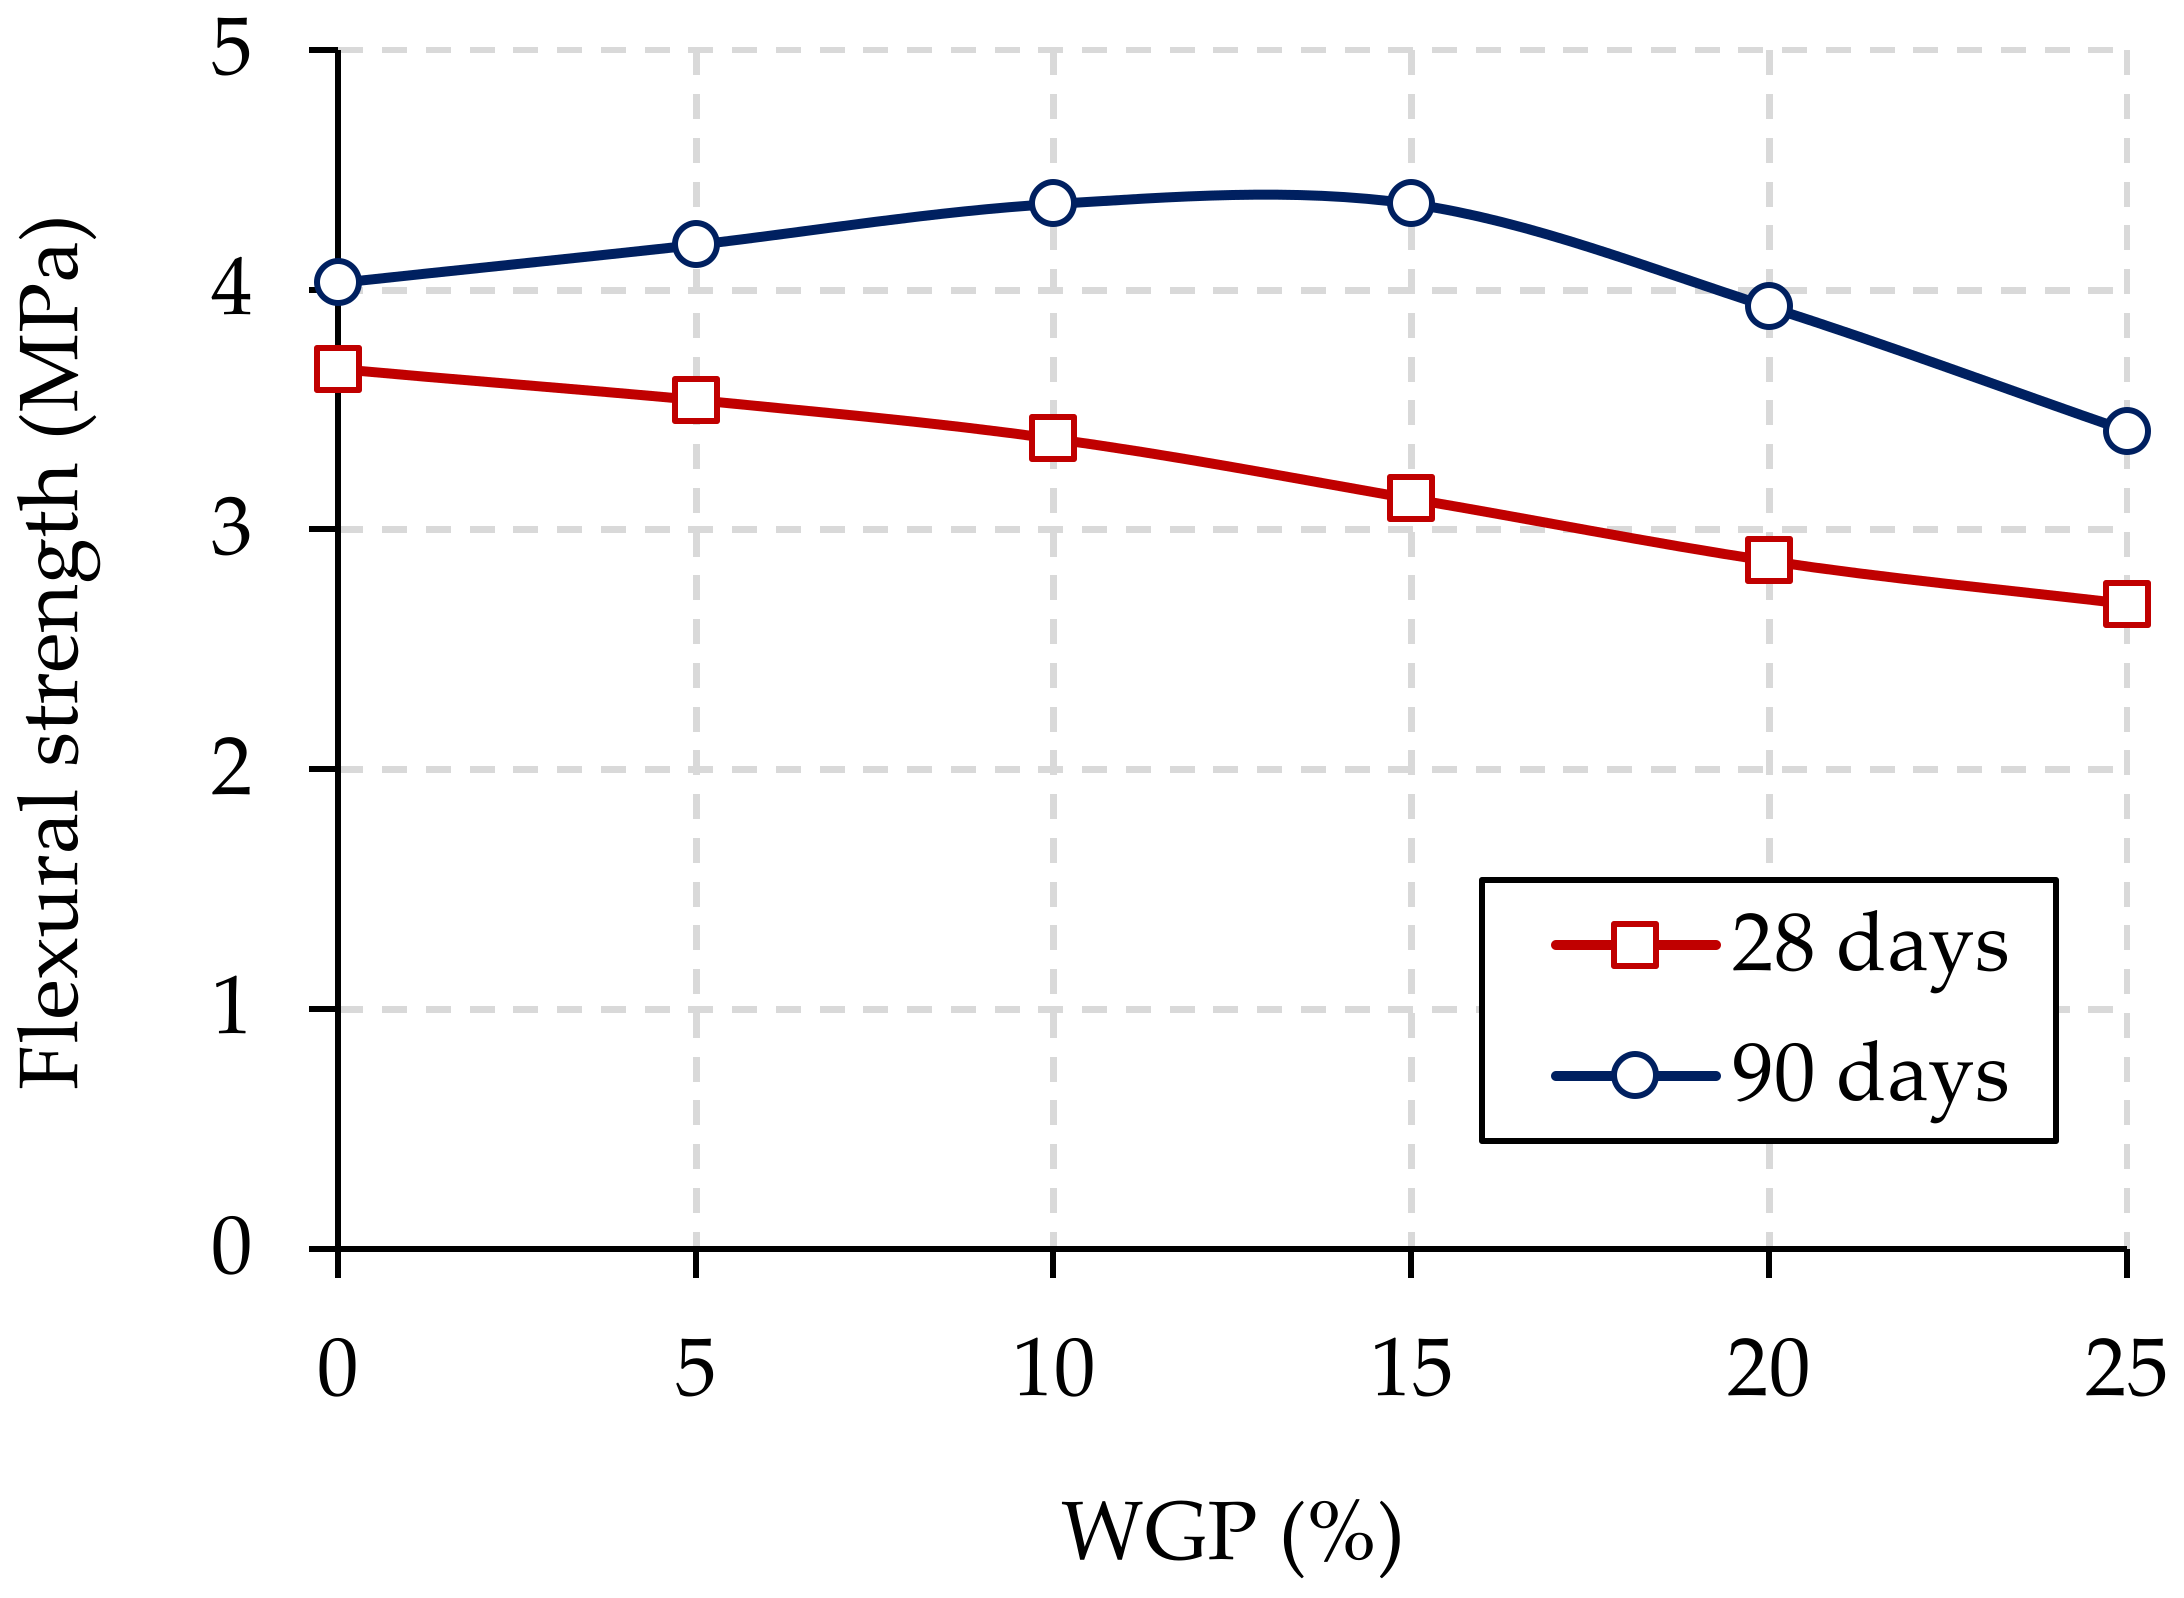
3.3.2. Flexural Strength (Modulus of Rupture)

The modulus of rupture testing and failure of the PQC prism specimens are illustrated in Figure 6. The flexural strengths of the WGP-blended PQC specimens were obtained after curing periods of 28 days and 90 days and the results are presented in Figure 7. The modulus of rupture of PQC without WGP (0% WGP) was 3.67 MPa at 28 days and gradually decreased while replacing OPC by WGP. The modulus of rupture of PQC without WGP at 90 days was found as 4.03 MPa. The modulus of rupture variations with respect to the substitution level of WGP at 90 days curing period deviated from the 28 days results owing to the formation of the secondary reaction products. The modulus of rupture of the specimens cured for 90 days after adding 15% WGP was increased by 8.2% more than the PQC specimen without WGP. However, the flexural strength was decreased after the addition of WGP by more than 15% due to increasing water demand, which led to a reduction in the flexural strength. It is obvious that the replacement level of WGP is restricted to 15% (Figure 7).

3.4. Effect of WGP on Durability Performance of PQC

3.4.1. Water Absorption
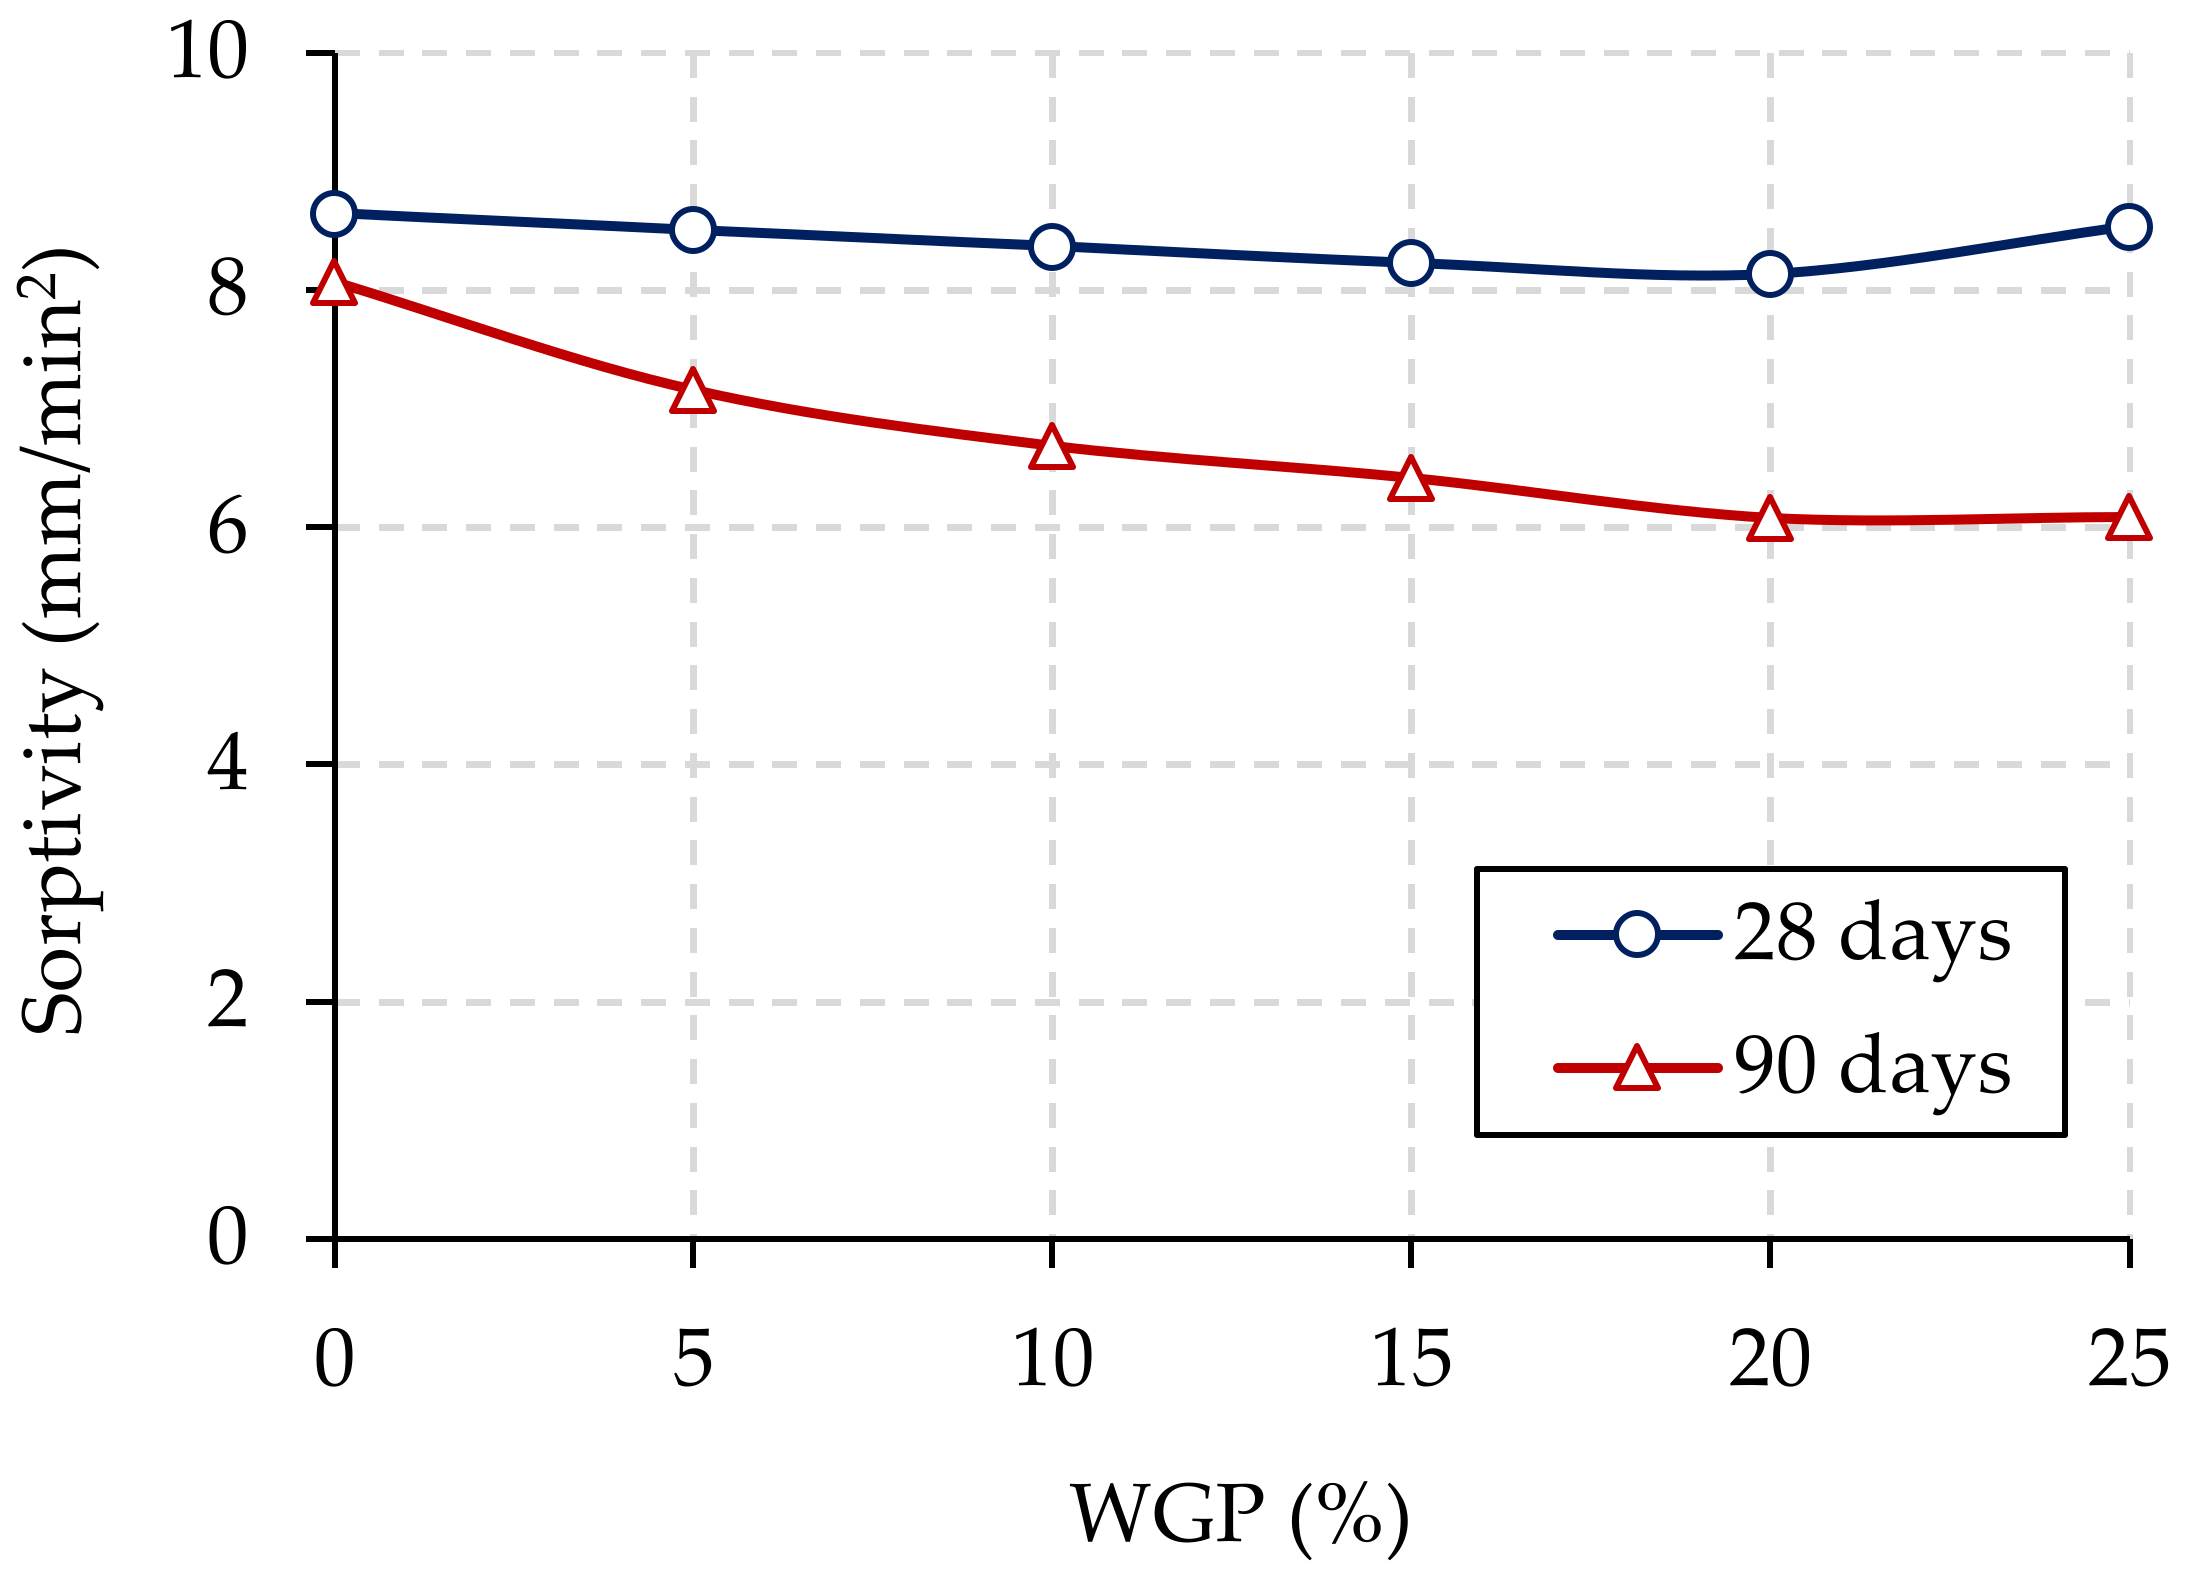
The absorption capacity of 150 mm cubes after the curing periods of 28 and 90 days were examined and determined by increasing the mass after 24 h immersion in water and expressed in percentage. From Figure 8, it is easy to understand the tendency of reducing the water absorption of PQC when cement was replaced by WGP up to 20%. The absorptions of PQC cured for 28 days and 90 days were measured as 4.03% and 3.67%, respectively, whereas the WGP dosage of 15% in PQC decreased the absorptions up to 3.47% and 3.07%, respectively. The reduction of water absorption was detected up to a 20% WGP level in both cubes cured for 28 days and 90 days, which was due to the pore filling nature of fine WGP in PQC. Interestingly, the absorption level started increasing beyond a 20% WGP dosage in the specimen cured for 28 days owing to the incomplete secondary reaction; in the specimen cured for 90 days a further decrease in absorption was witnessed because of the formation of dense concrete [54].

3.4.2. Sorptivity

Water permeation characteristics of PQC were measured by conducting the sorptivity tests for evaluating the durability performance of PQC, because reinforcement corrosion mainly depends on the moisture movement [45]. The results of the sorptivity tests are displayed in Figure 9. The sorptivity values of PQC cured for 28 days and 90 days were measured as 8.65 and 8.07 mm/min2, respectively. Once cement was replaced by WGP, the sorptivity value began to decrease up to a 20% replacement level owing to the formation of pore-free concrete in the specimen cured for 28 days and the formation of the secondary gel during the longer time of curing (90 days). The sorptivity value of the specimen cured for 28 days was found to be increasing at a 25% replacement level of WGP in PQC. Meanwhile, the sorptivity values of the WGP-blended PQC specimens cured for 90 days were sustained between 20% and 25% cement replacement by Chen et al. [54], where they examined the capillary absorption of WGP-blended self-compacting concrete and concluded that the improvement in the impermeability of concrete was achieved by incorporating 40% WGP as the sand replacement.

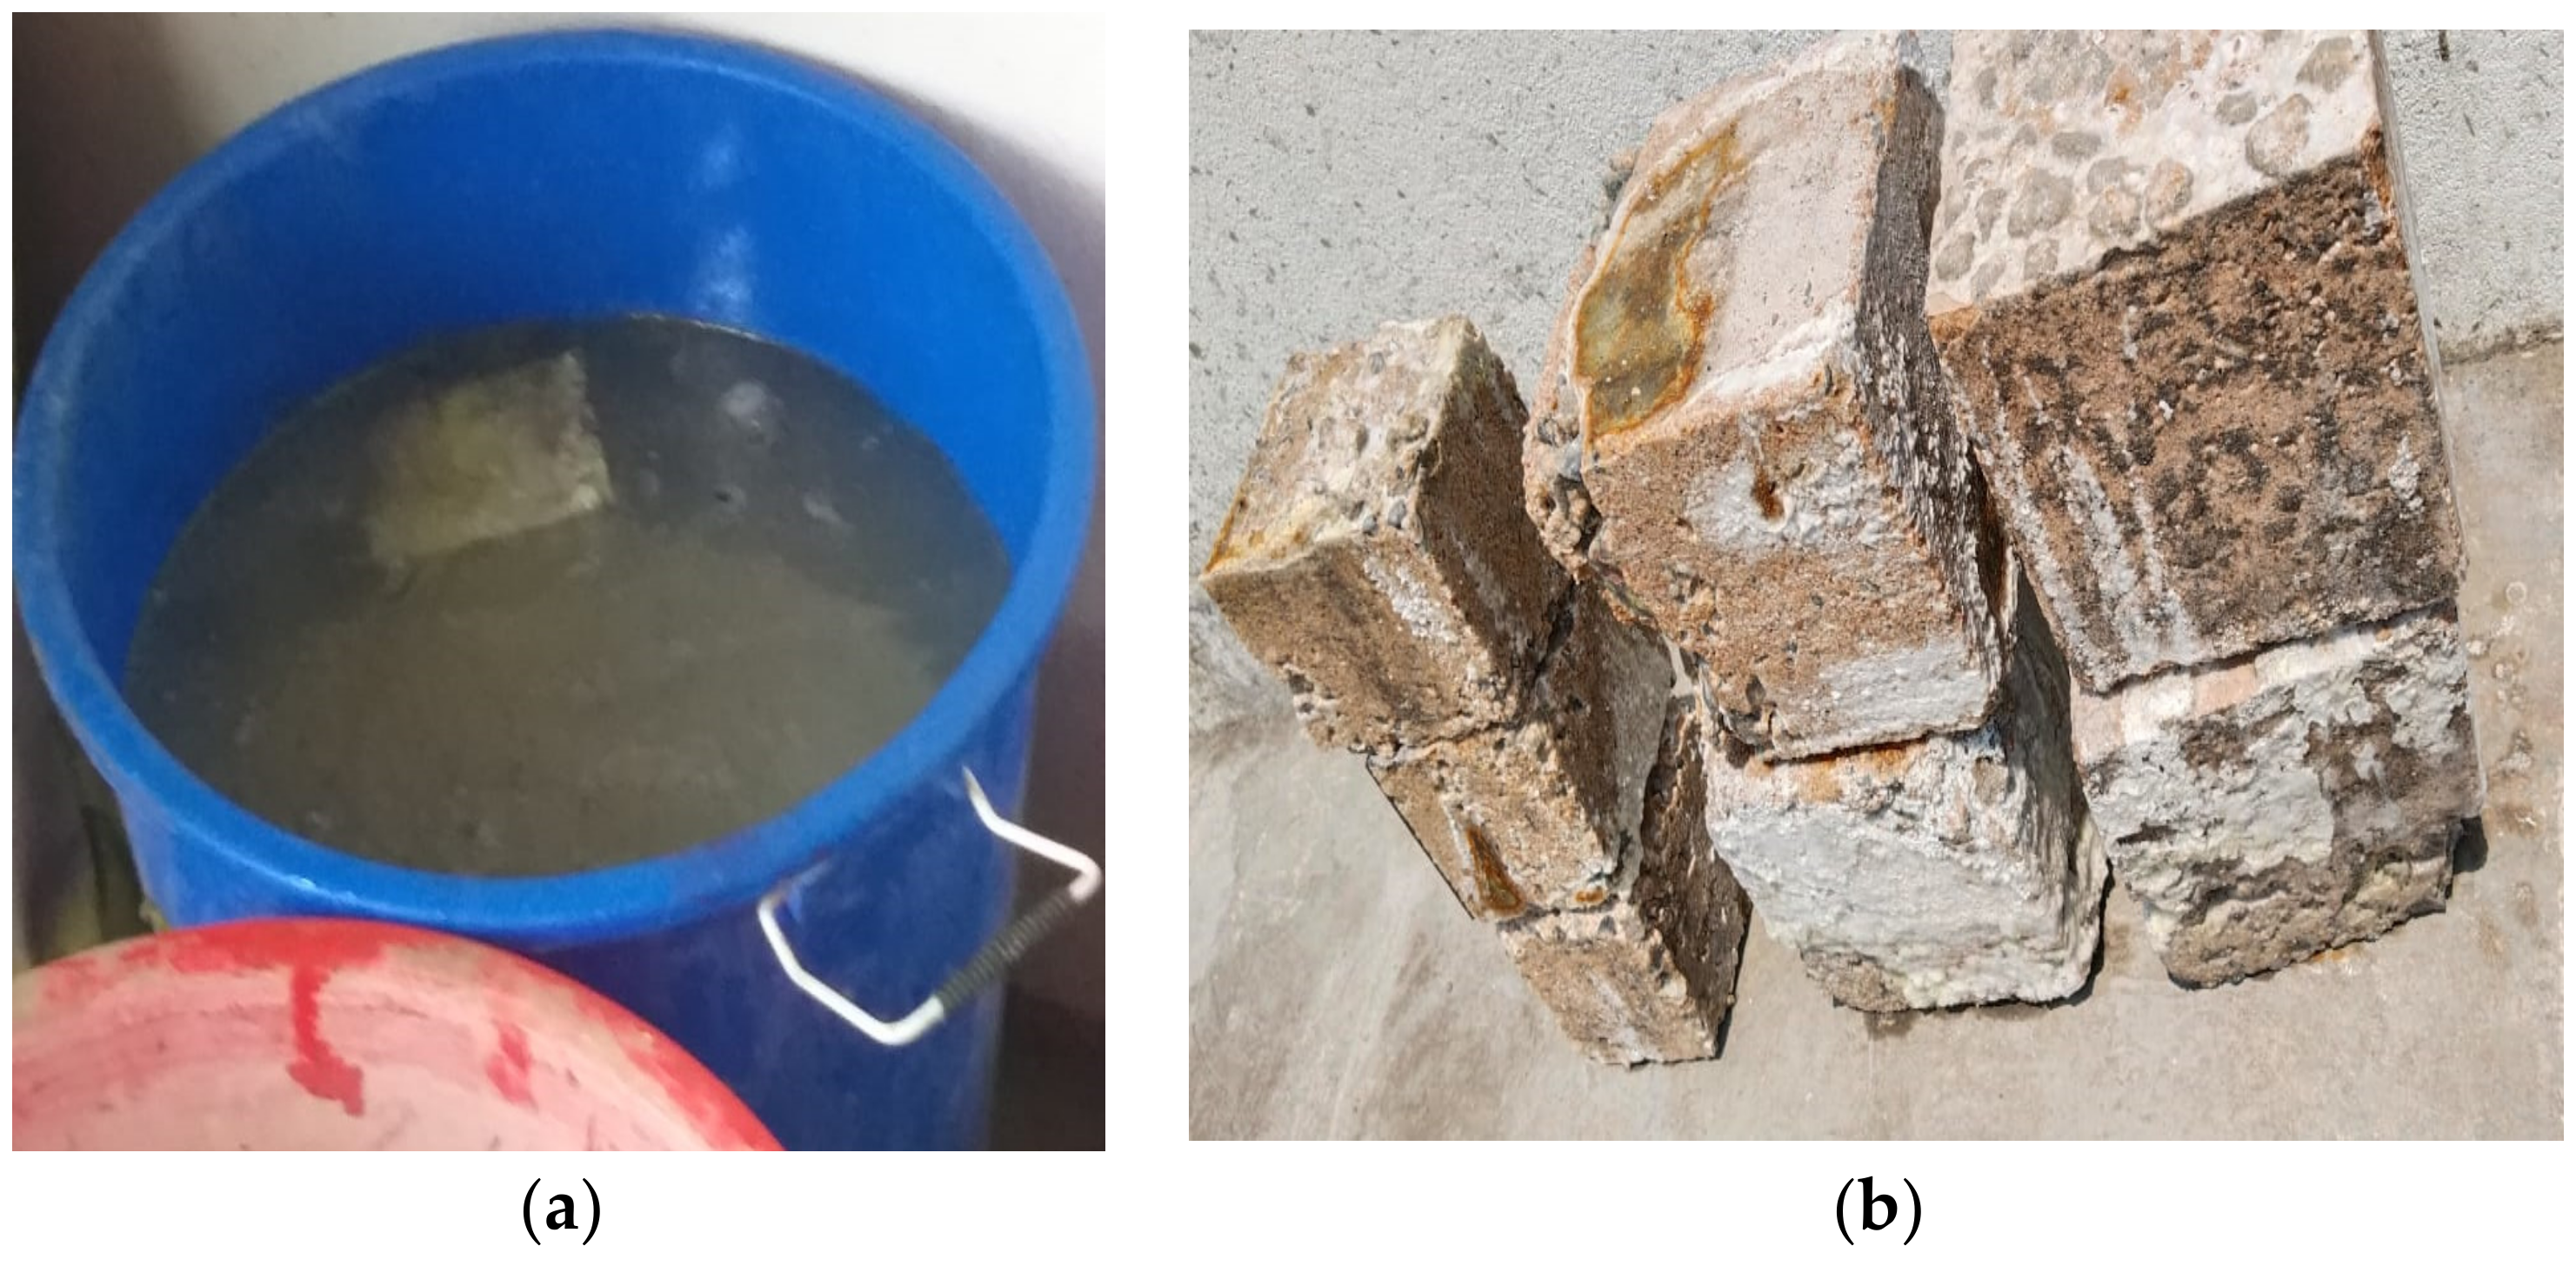
3.4.3. Concrete Deterioration Due to Acid Attack by Visual Assessment

The surface deterioration due to acidic environment causing the growth of decomposition into the inner portion of concrete has been explored [47]. The photographic observation of PQC surface after immersion in 5% H2SO4 solution is the method to understand the surface condition because of the acid attack. The impact of acid occurrence in the form of surface deterioration was evaluated on the basis of the performance scale followed by Murthi and Sivakumar [46]. The PQC cube specimens were checked before immersion into 5% H2SO4 acid solution, and it was observed that the edges were maintained without any disintegration. The surface conditions of PQC cubes after immersion in 5% H2SO4 are demonstrated in Figure 10. It was seen that the surface of the 0% WGP specimen was disintegrated which indicated severe surface deterioration [32]. The acidic solution diffused into the concrete mass through the pore structure and destroyed the cement gel binder, forming a layer of calcium sulphate hydrate (gypsum crystals) which reacted with C3A to form secondary ettringite. This secondary ettringite formation caused the expansion of concrete and disintegrated the concrete surface [55]. The concrete deterioration level of the 15% WGP specimen was found as very slight [46]. However, the cement replacement level of 25% WGP in PQC evidenced the surface deterioration level of 3–4 in the range of moderate to severe deterioration, with small surface cracks which implied the presence of higher micro-pores than in the 15% WGP dosage level due to the insufficient cement gel binder [56]. Min et al. [57] specified the surface disintegration by the acid attack using the color of the concrete surface: a grey surface clarified that the deterioration level was zero or very slight, and a yellow surface revealed that the surface deterioration was slight to moderate. However, the white surface uncovered that the surface disintegration was severe. The specimens of 15% WGP had a grey surface, which means that the surface was deteriorated very slightly. The whitish surface was observed in PQC without WGP, which indicates the severe deterioration of PQC due to the presence of calcium sulfate (CaSO4). However, the yellow surface observed in the 25% WGP-blended specimen showed that the degree of surface deterioration was moderate [55].

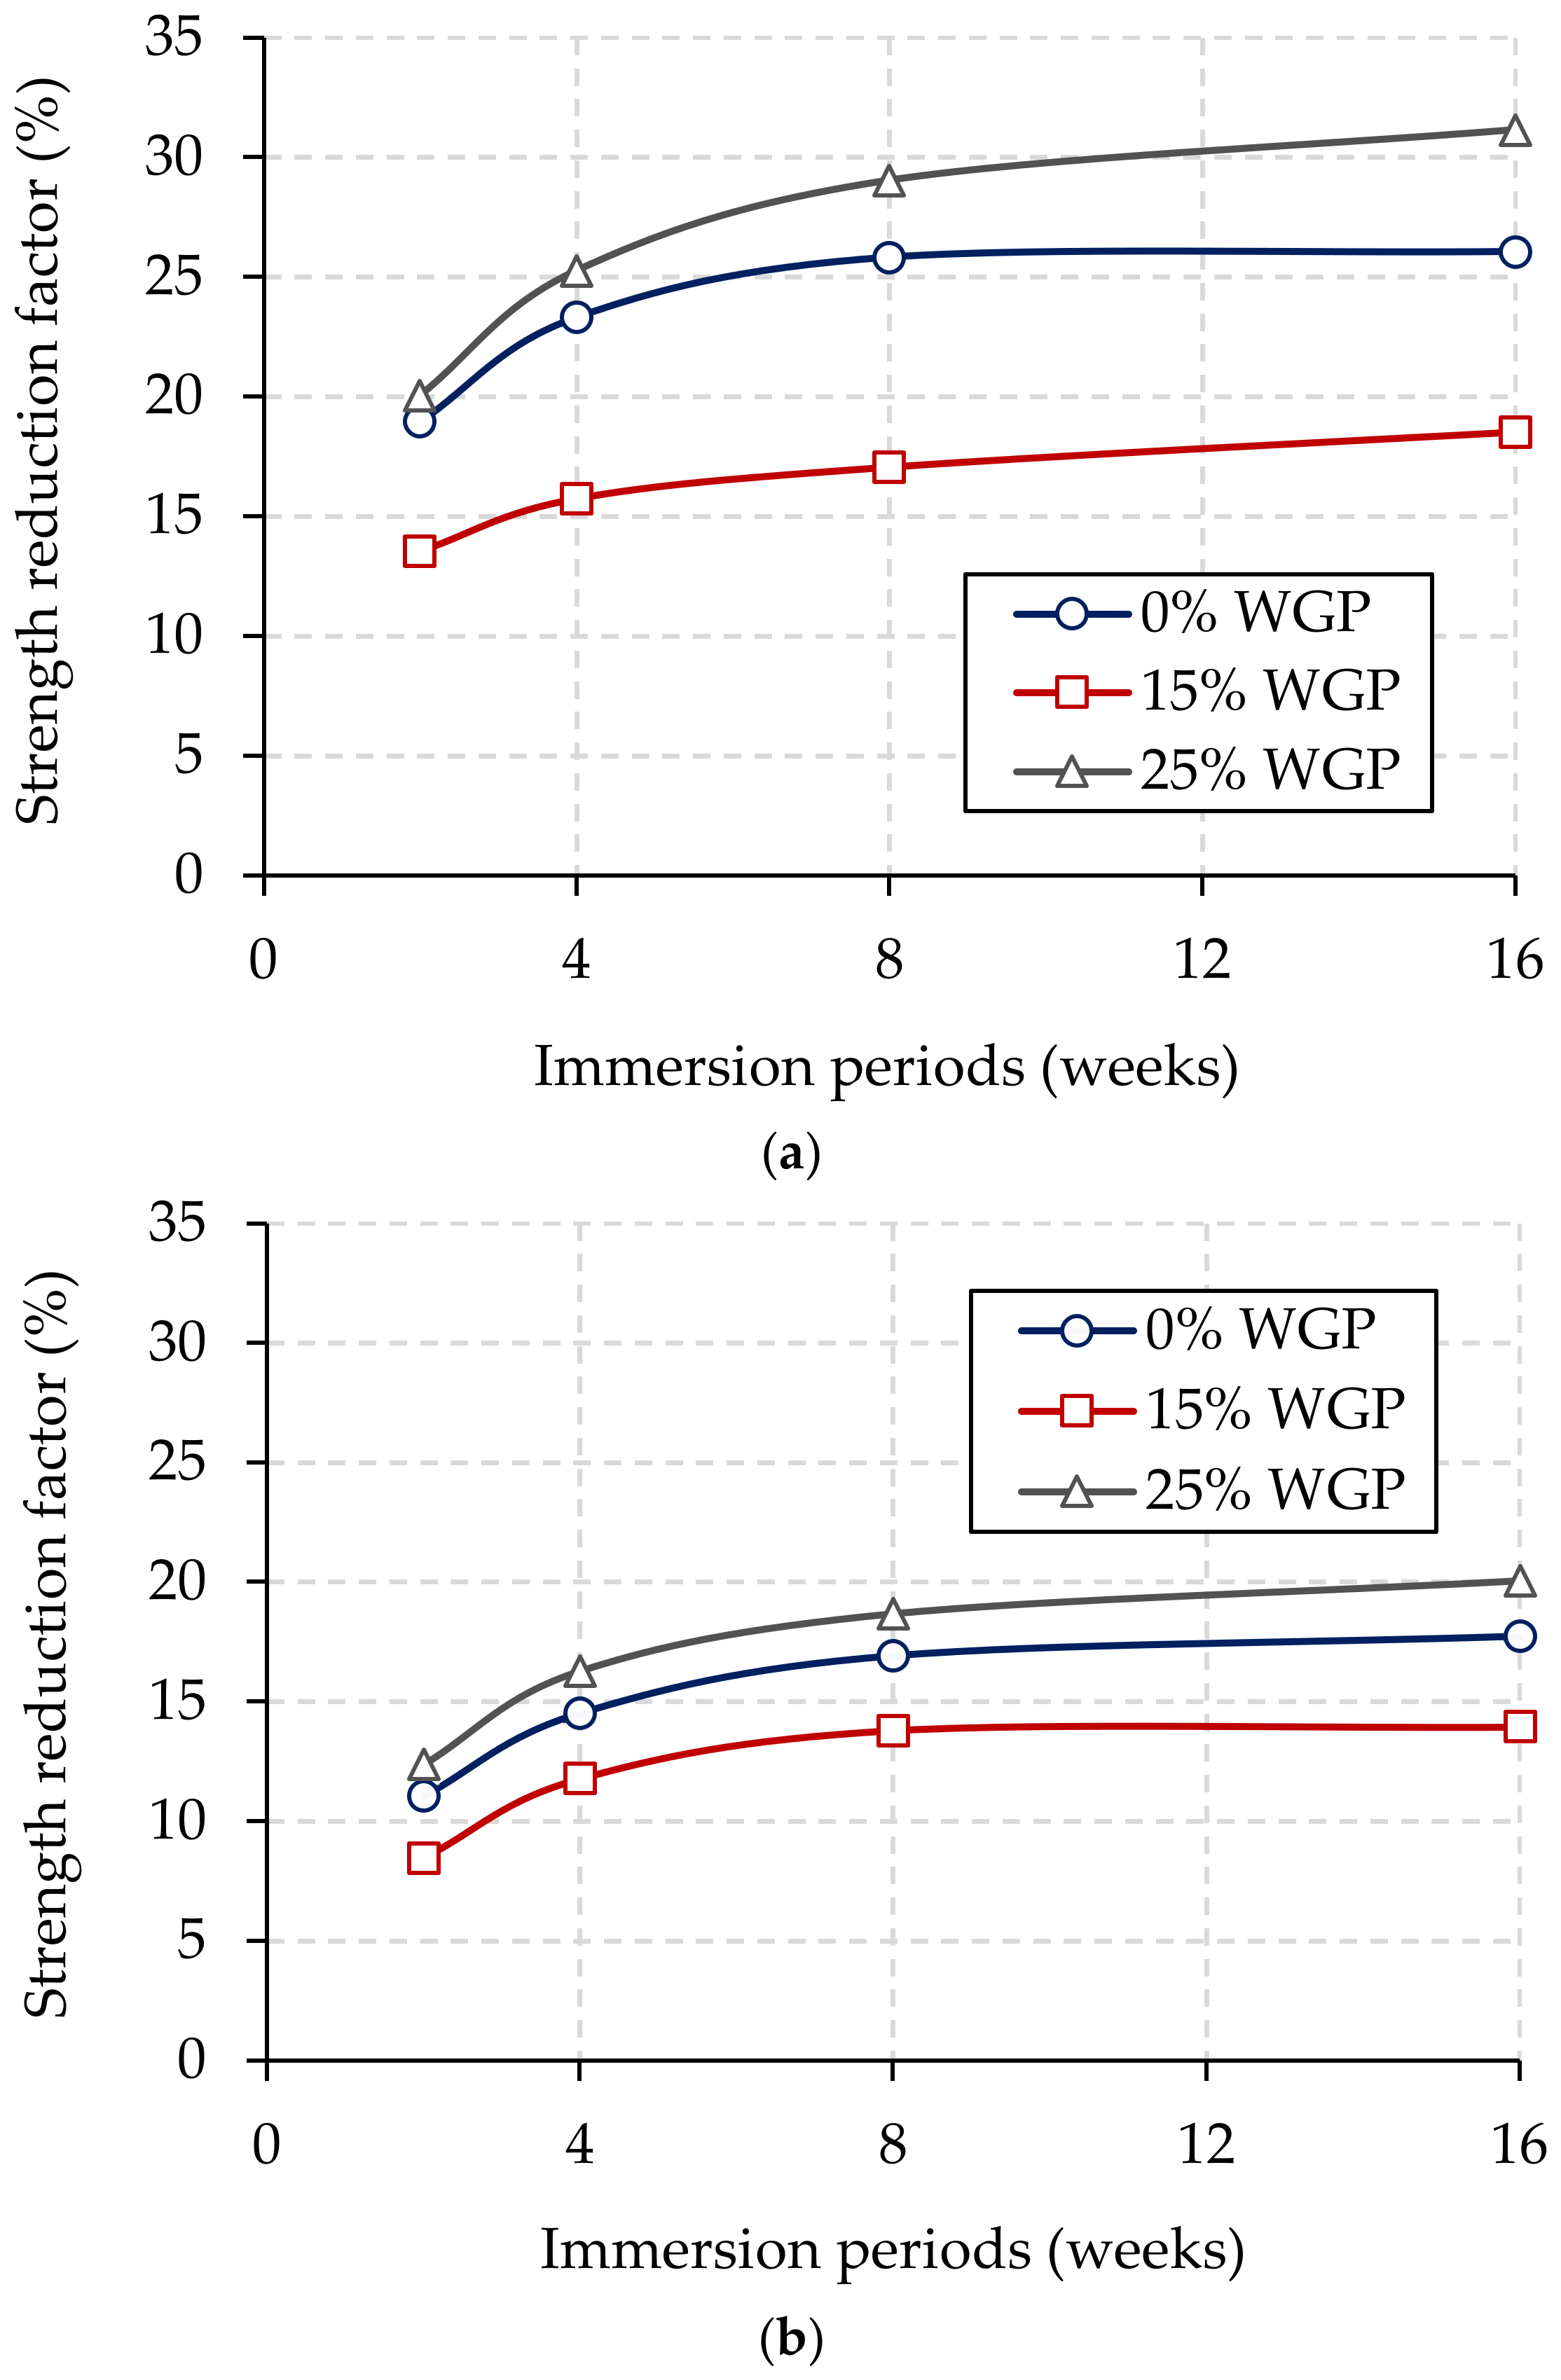
3.4.4. Concrete Deterioration Level Due to Acid Attack by SRF

Permeability properties cause severe problems in concrete which may affect the strength and durability performances. The ingress of acid solution is a major issue in concrete. In this research, the PQC specimens of 0% WGP, 15% WGP (optimum dosage), and 25% WGP levels were considered for achieving the acid attack level of PQC. The percentages of the strength reduction due to the acid attack of the WGP-blended PQC specimens are presented in Figure 11. The higher SRF was witnessed within the 4-week immersion period due to the higher movement of 5% H2SO4 solution. The optimum dosage level of 15% WGP evidenced the lowest SRF when compared with the PQC specimens of 0% WGP and higher dosage level (25%) of WGP. An insignificant rate of the strength reduction of the PQC specimens was seen in all the three-dosage levels of WGP after the immersion period of 8 weeks in 5% H2SO4 solution. However, SRF of the 25% WGP-blended PQC specimen cured for 28 days was affected 68% more than the 15% WGP-blended PQC specimen, while the PQC specimen without WGP cured for 28 days was affected 40% more than the 15% WGP-blended PQC specimen. The PQC specimens cured for 90 days were less affected when compared with those cured for 28 days, as depicted in Figure 11b, due to the formation of dense PQC and the increase of the impermeability of PQC. The presence of 15% WGP offered resistance against the permeability of acidic solution, which may be because of the reduction of pore structure during the initial period and the increase in the secondary reaction in the later period [46]. Kumar [56] found that the substitute of crushed rock dust instead of cement in concrete caused the gradual reduction of the strength due to the acid attack up to a 30% replacement of cement.

3.4.5. Chloride Penetration Depth

The chloride penetration profiles of the WGP-blended PQC specimens are illustrated in Figure 12. The PQC specimens of 0% WGP, 15% WGP, and 25% WGP levels were considered. As can be seen from Figure 12, the total chloride concentration at a 5 mm depth from the surface of the PQC specimens was in higher order, and gradually decreased up to 25 mm depth from the surface in all the tested specimens. The PQC specimens of 0% WGP indicated 6.8% of the chloride concentration in the specimens cured for 28 days, whilst the same specimens cured for 90 days evidenced 5.2% of the chloride concentration. The reduction in the chloride penetration in the specimens cured for 90 days demonstrated the formation of dense concrete due to the prolonged curing [47]. The addition of the optimum level of 15% WGP to the PQC mixes led to a modification of the pore structure of the concrete mass and caused the reduction of permeability into concrete. The reduction of pores could develop dense concrete and displayed lower chloride concentrations in all levels from the concrete surface. The chloride concentration was witnessed as lower than 1% at a 25 mm depth from the surface in both 28-day and 90-day curing of the PQC specimens with 15% WGP. On the other hand, the higher dosage (such as 25% WGP) revealed 1% chloride concentration more than the 15% WGP dosage level. The pore-filling effect of 15% WGP in PQC decreased the pore-size distribution and reduced the permeability properties of PQC.

3.5. Effect of PP Fibers in PQC

3.5.1. Slump Value of PPFRPQC Specimens

The fresh concrete properties of the PPFRPQC specimens were examined by the slump cone tests. The variations in the results are shown in Figure 13. The slump test result of the WGP-blended PQC specimen without fiber (0%) was found as 50 mm. A moderate reduction in the slump value was noticed while increasing the substitution level of the fiber content in PQC. The addition of 0.25% PP fibers reduced the slump value from 50 mm to 45 mm and the same trend was continued with the further addition of PP fibers. The slump value was decreased to 35 mm after the addition of 1.25% PP fibers to the WGP-blended PQC specimen. The slump test results were found within the predictable value of PQC as 35 ± 15 mm, as suggested by IRC: 15-2011 [39]. The reduction of the workability after the addition of PP fibers was observed in the PPFRPQC specimens and the reduction in the slump value mortar was continued after adding more PP fiber dosages to PQC. The reduction of mortar volume decreased the cohesiveness of fresh concrete owing to the increase of the surface area of concrete and caused the reduction of the workability of the PPFRPQC specimens.

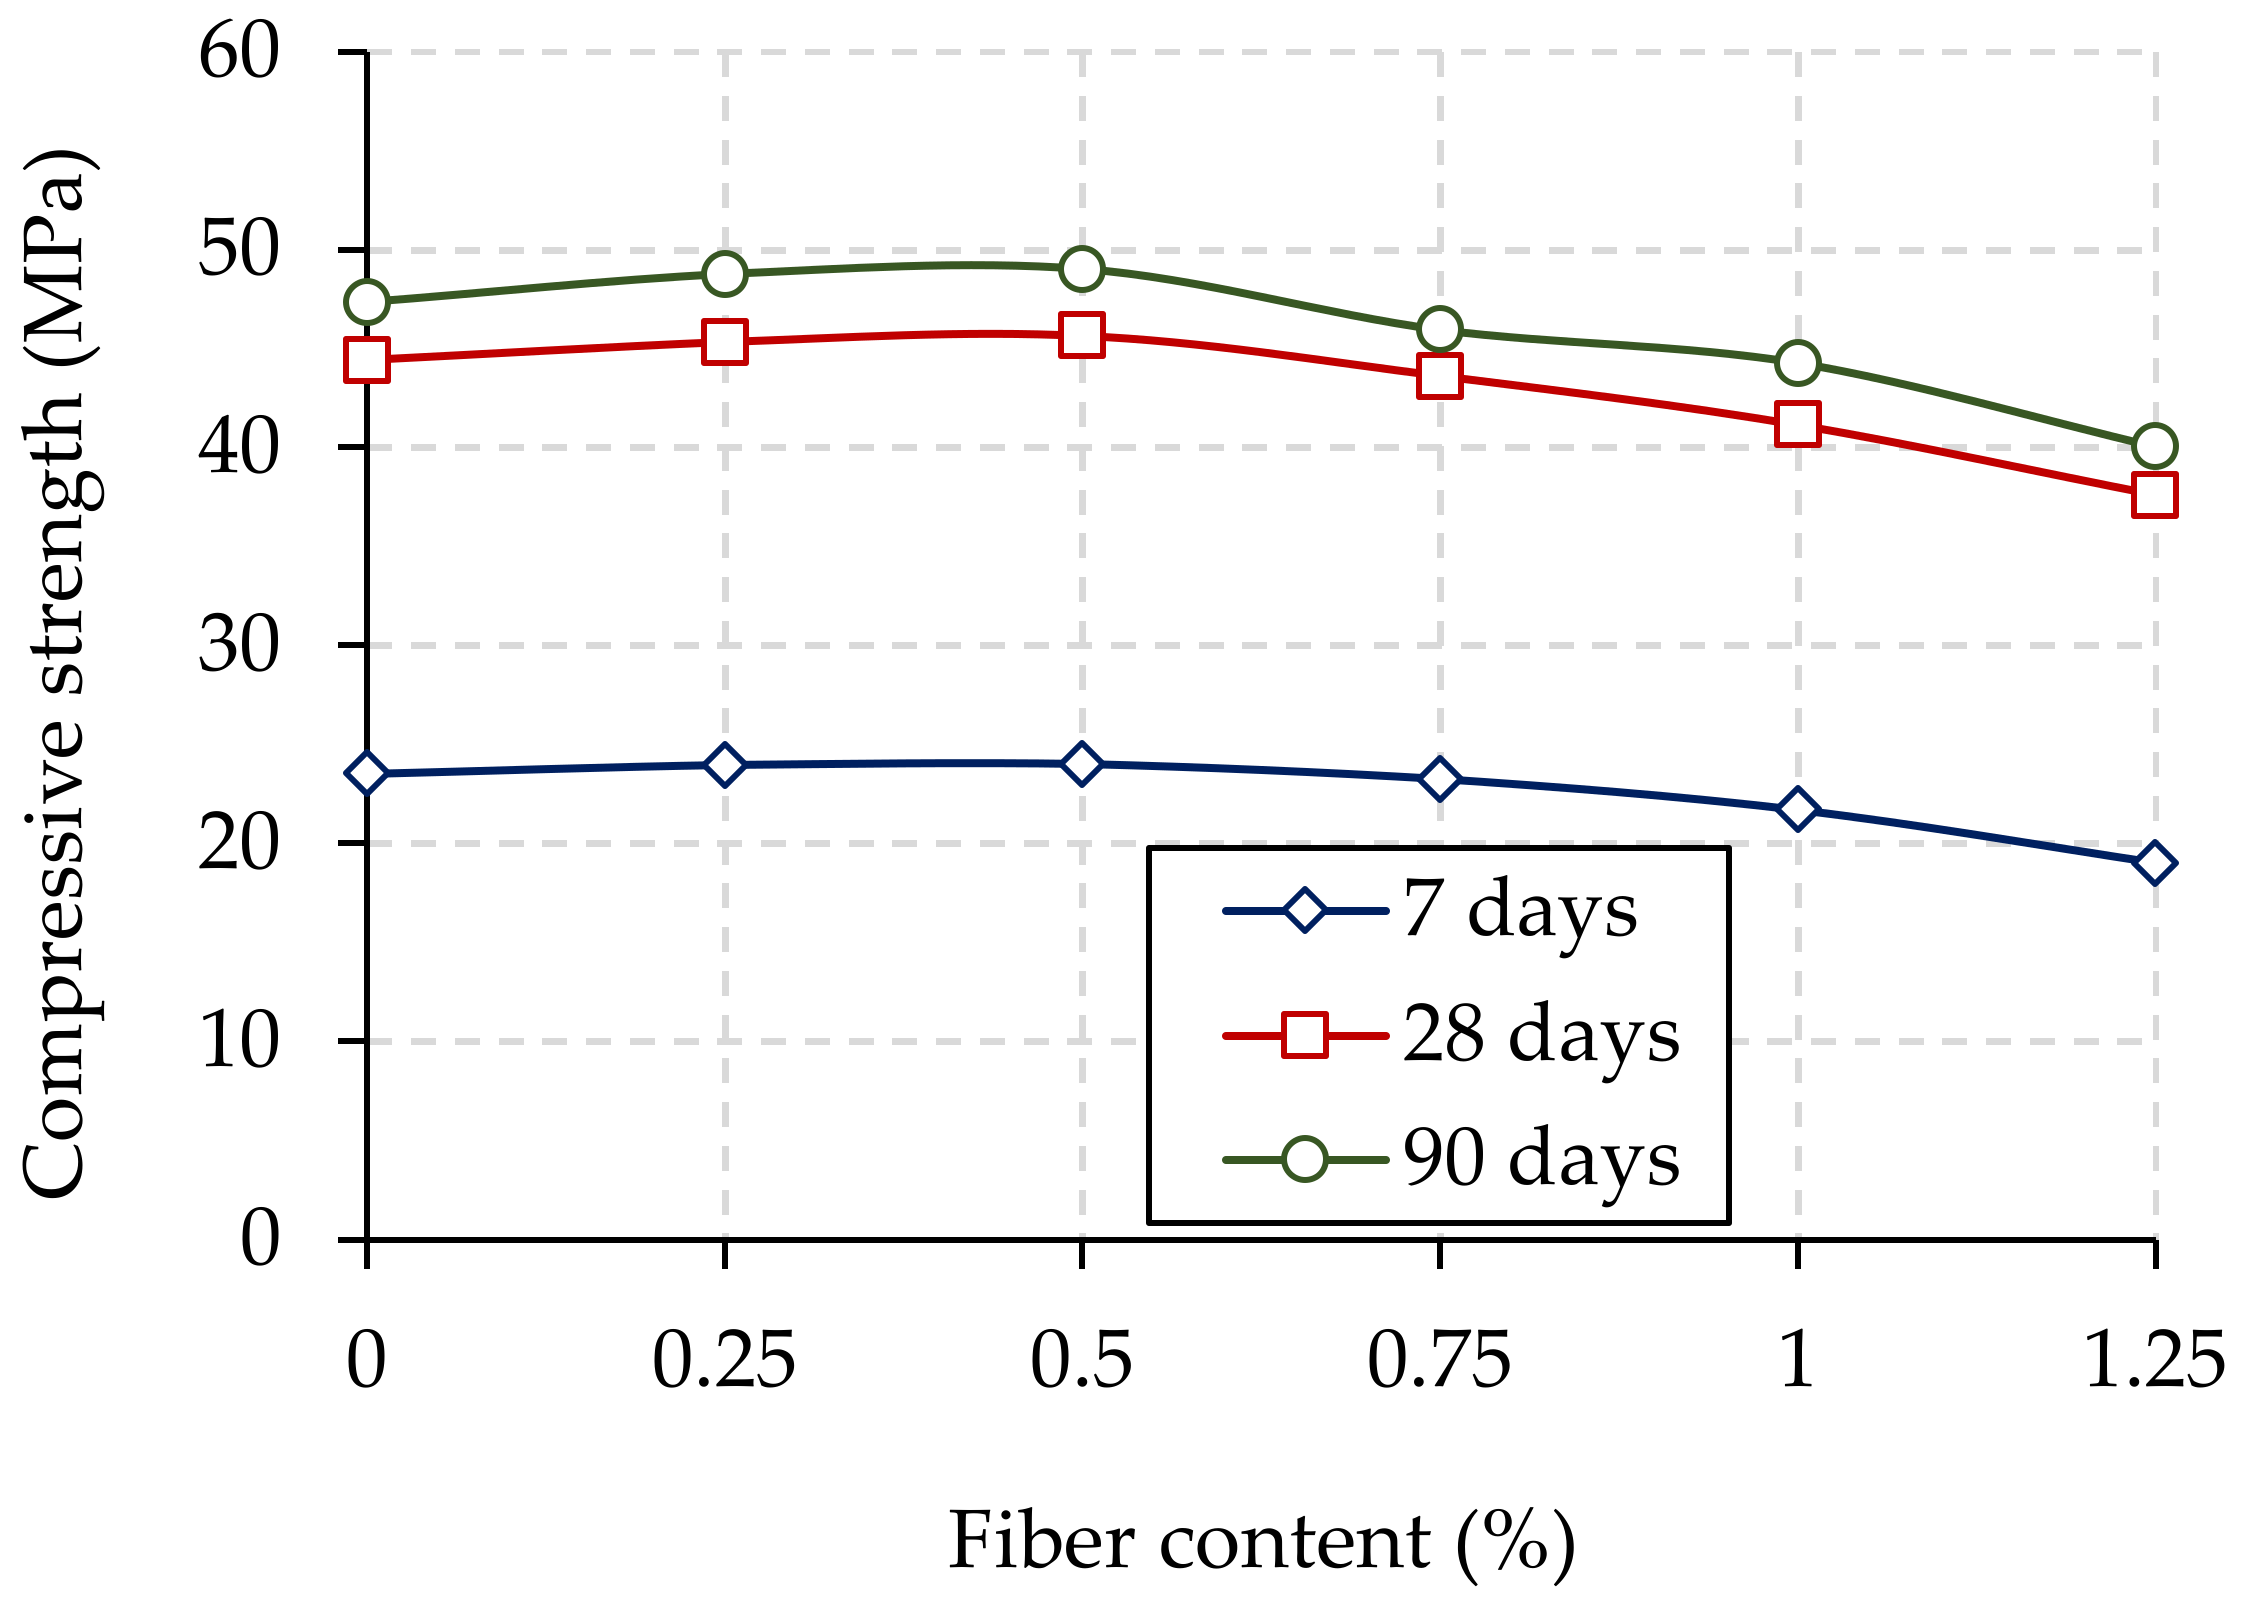
3.5.2. Compressive Strength of PPFRPQC Specimens

Strength variations of the WGP-blended PPFRPQC specimens against the compressive force after curing for 7, 28, and 90 days are depicted in Figure 14. The average compressive strength of the 15% WGP-blended PQC specimen, called control PQC, after 28 days of curing was 44.43 MPa. A growing fashion of the compressive strength was observed up to 0.5% PP fibers in PQC. The presence of 0.25% PP fibers in PQC improved the compressive strength of the specimens cured for 28 days and 90 days from 44.33 MPa to 45.33 MPa and 47.35 to 48.77 MPa, respectively. The insignificant increase in the compressive strength was between the additions of 0.25% and 0.5% PP fibers to PQC. The addition of more PP fibers caused a drop in the compressive strength of PQC owing to the reduction of paste in concrete [58,59]. Based on the results of Figure 14, the optimum dosage level of PP fibers was decided as 0.5% by weight of PQC.

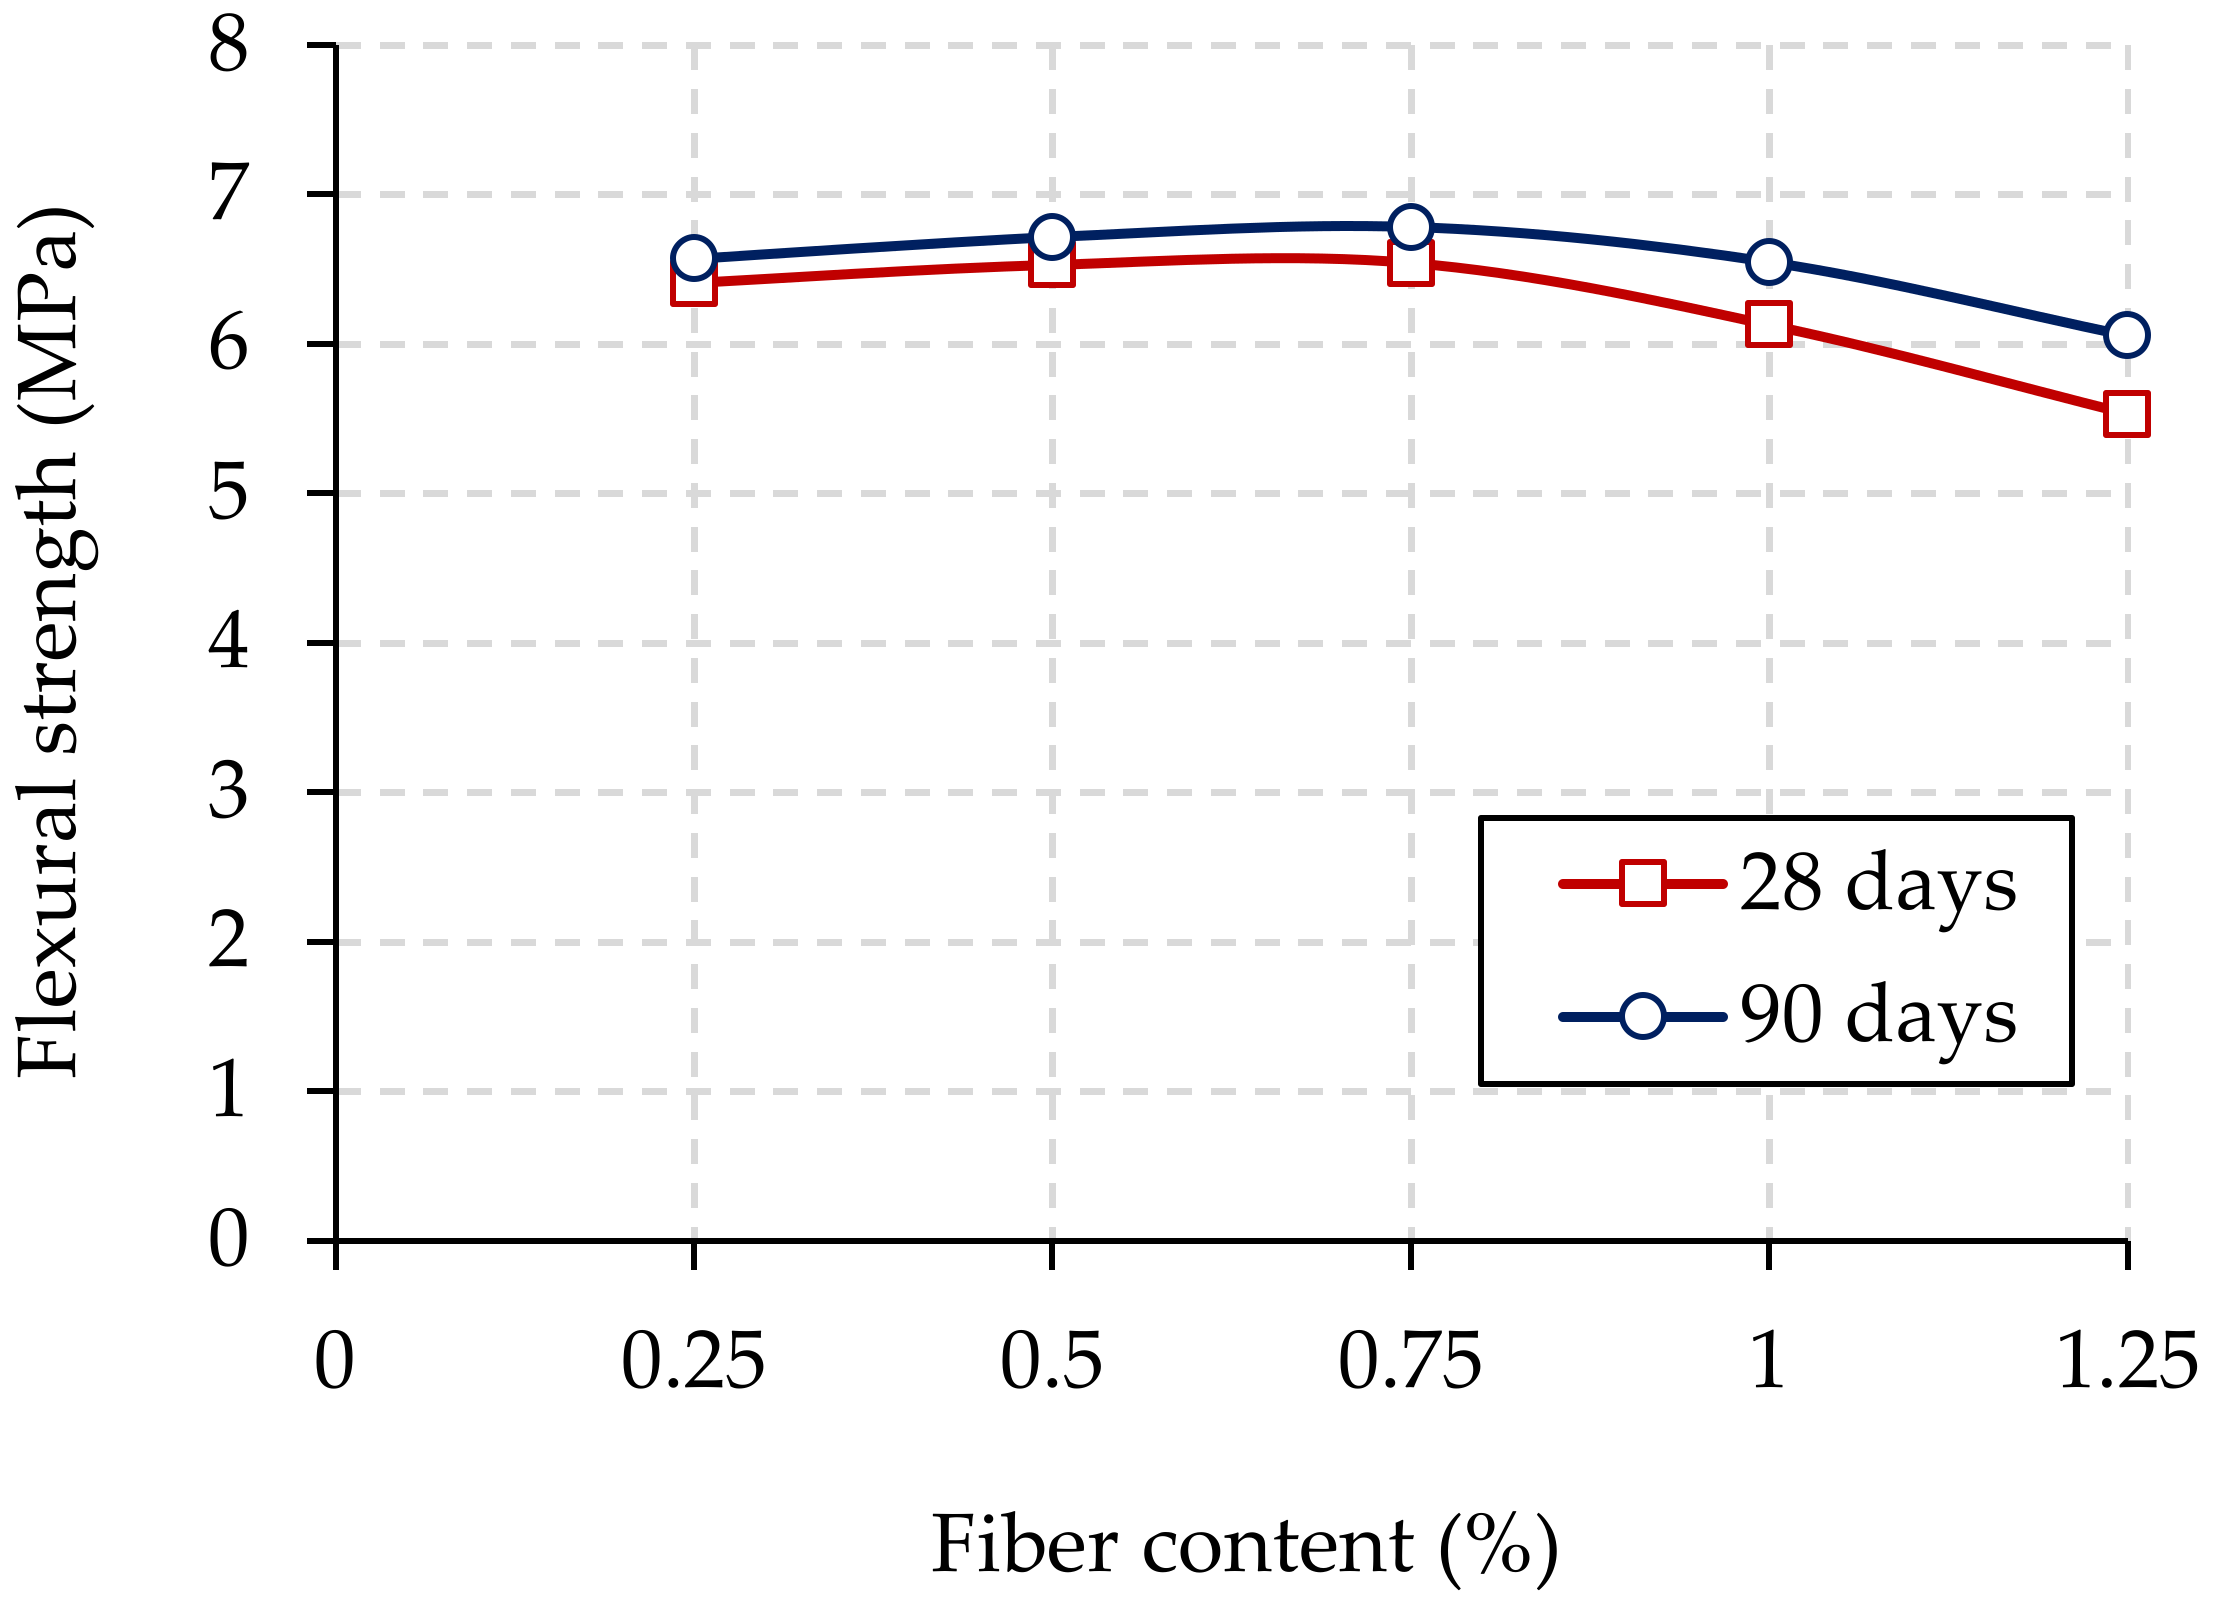
3.5.3. Flexural Strength of PPFRPQC Specimens

IRC: 15-2011 [39] suggested that PQC should be designed according to its flexural strength since the stresses induced in PQC are mainly due to the flexural load when compared with the compressive load. The flexural strengths of the 15% WGP-blended PQC specimen (control PQC) were achieved after curing for 28 days and 90 days and found to be 3.13 MPa and 4.36 MPa, respectively. The flexural strength variations of the PPFRPQC specimens cured for 28 days and 90 days after the inclusion of PP fibers are demonstrated in Figure 15. The flexural strength after adding 0.25% PP fibers to the specimens cured for 28 days and 90 days were 6.408 MPa and 6.572 MPa, respectively, which are 104.73% and 50.73% higher than the control PQC. The flexural strength was sustained up to a substitution of 0.75% PP fibers in PQC. The reduction in the flexural strength was noticed owing to the decrease in bond between matrix and aggregate in concrete [58,59].

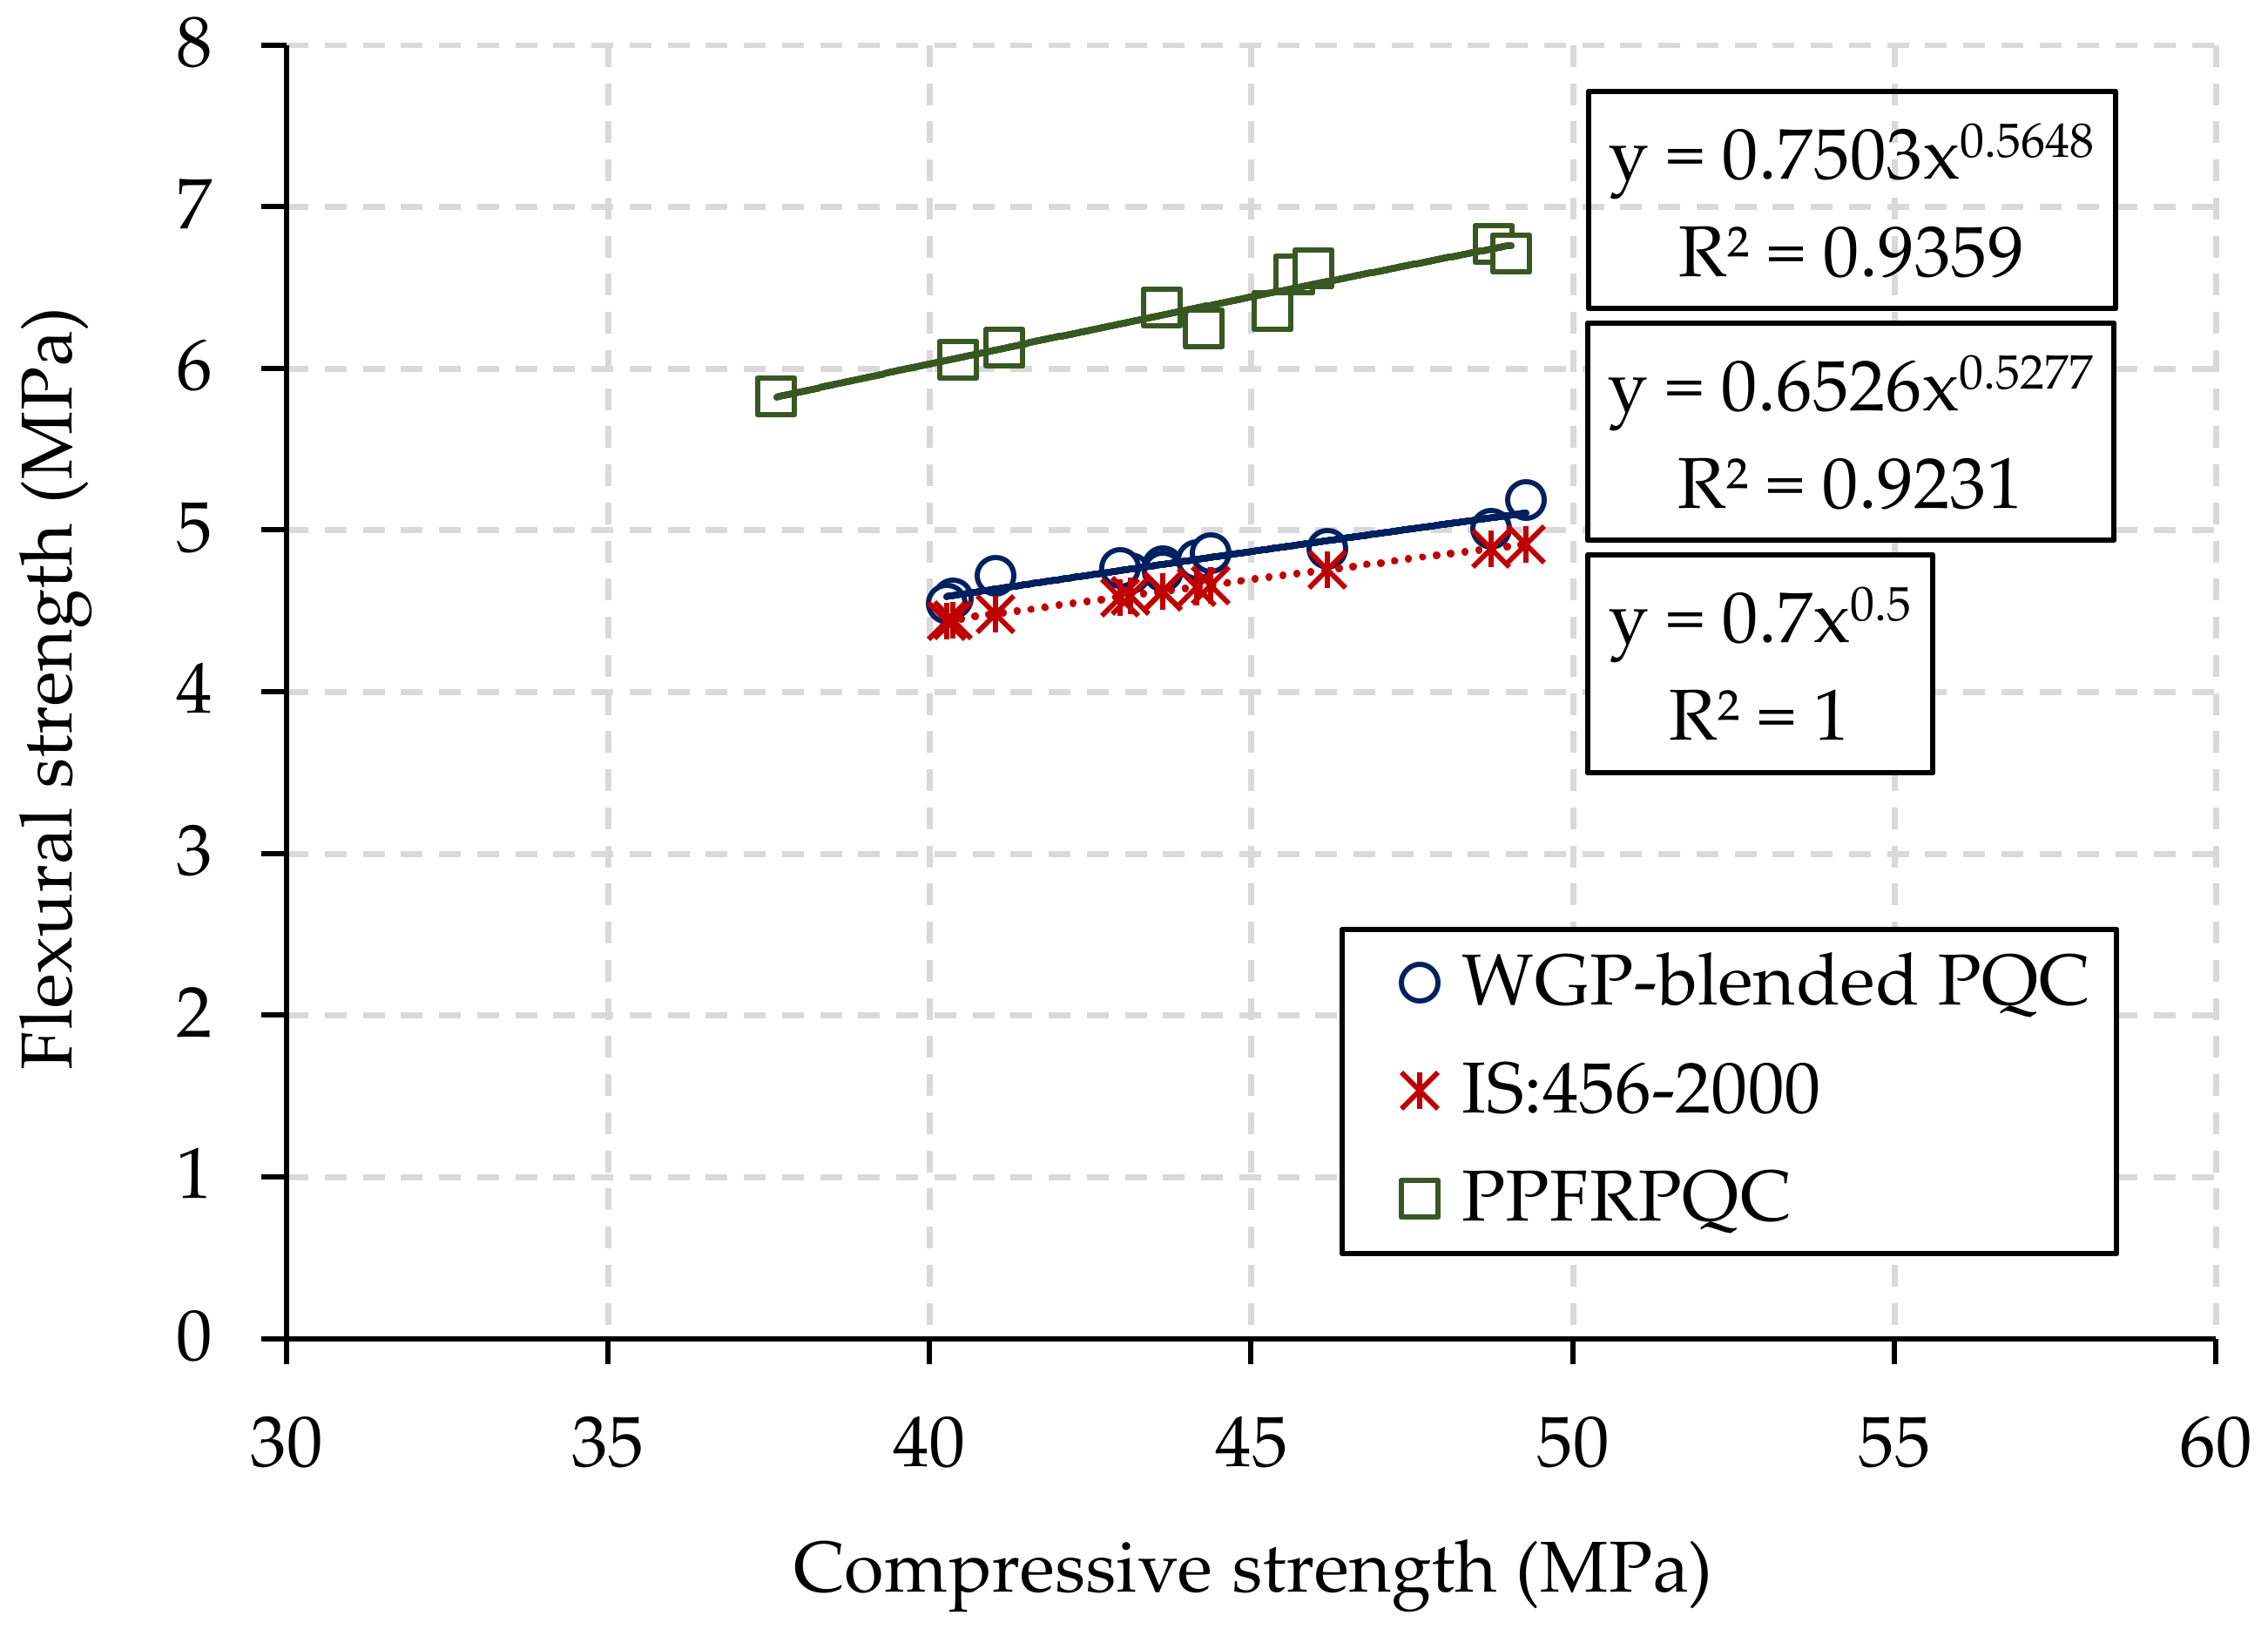
3.5.4. Correlation between Compressive Strength and Flexural Strength

The target strength of PQC was predicted based on the flexural strength as per the IRC code due to the tractive force acting over the surface of the rigid pavement. Hence, predicting the flexural strength from the actual compressive strength of PQC through the perfect relationship is an additional requirement. The correlation between the strength properties of normal concrete was established following the instructions given in IS: 456-2000 [60]. In order to predict the relationship, the flexural strength of PQC was plotted against the corresponding compressive strength between these two mechanical properties. A non-linear relationship was predicted for the WGP-blended PQC and PPFRPQC specimens, as illustrated in Figure 16. From Figure 16, the relationship between the mechanical properties of the WGP-blended PQC specimens could be experimentally established as fr = 0.6526(fc)0.5277 with a higher correlation coefficient as 0.9231. The relationship was established after the addition of fibers to the PPFRPQC specimens as fr = 0.7503(fc)0.5648 with a strong correlation coefficient of 0.9359. The flexural strengths of the WGP-blended PQC specimens were obtained as insignificantly greater than the IS code recommendation. While comparing the achieved results, the substitution of PP fibers in PQC resulted in 32% higher flexural strength than the WGP-blended PQC specimens and 37% higher than the IS: 456-2000 [60] prediction. The higher flexural strength might be attributed to the creation of a denser concrete matrix in the presence of PP fibers.

3.5.5. SEM Image Evaluation of PQC Specimens

The SEM images of the specimens cured for 28 days including the PQC specimen without WGP, the 15% WGP-blended PQC specimen, and the 0.75% PPFRPQC specimen are displayed in Figure 17. The SEM image has widely been used to assess the microstructures of the cement paste after the completion of the hydration process [61]. It can be utilized to study the interfacial transition zone and the pore structure of the hydrated cement paste [62]. As can be seen from Figure 17a, the SEM image of PQC without WGP reveals the liberated calcium hydroxide, Ca(OH)2, during the hydration process. The liberated Ca(OH)2 was between the cement matrix and aggregate and leached in due course, which created the voids in the matrix and hence C-S-H has been separated. Small voids have rooted in the cement matrix without blending any mineral admixtures in the matrix [20,38]. The observed voids weakened the transition zone, which led to the reduction of the strength properties. The consumption of excess Ca(OH)2 through the secondary hydration process in the presence of mineral admixture could reduce the formation of ettringite. Mineral admixture-blended cement concrete indicated more solidity in the cement paste and hydration product, which was reflected in the SEM image [62]. The reduction of Ca(OH)2 was noticed in the 15% WGP-blended PQC specimen which shows the consumption of Ca(OH)2 owing to the secondary hydration process in the presence of 15% WGP and water. It was observed from Figure 17b that the specimen with 15% WGP became very dense and strong, which created a perfect bond between the cement matrix and aggregate because of the formation of the secondary hydration product and ettringite. Hence, more homogenous paste in the 15% WGP-blended specimen was witnessed compared with the control PQC. In addition to the secondary hydration products, it is clear from the SEM image of the 15% WGP-blended PQC specimen that the matrix was denser and compacted due to the pore-filling effect of WGP [15]. This performance is an indication demonstrating the higher strength and durability properties of the WGP-blended PQC specimen. Figure 17c evidences that the strong interlocking by means of bridging of the constitutions was developed, with strong stretched interlocking because of the presence of 0.75% PP fibers in PQC, which led to increasing the flexural strength.

4. Conclusions

The current experimental study demonstrated the suitability of WGP in PQC based on the following conclusions:
  • The pozzolanic performance of WGP was evaluated by SAI and found that the SAI values of the 20% WGP-blended cement mortar were 0.77 and 0.87 after the curing periods of 7 days and 28 days, respectively. These results satisfied the ASTM C311 [40] provisions and hence, WGP can be considered as a suitable natural pozzolanic material in concrete.
  • The slump value was decreased insignificantly from 39 mm to 38 mm (the slump value up to 15% WGP in the PQC mixtures), but a higher rate decrease of the slump value was found at higher rate beyond the presence of 15% WGP. The higher replacement of cement by WGP made the consistency of concrete became sticky, which caused the reduction of the slump value.
  • The strength of the 15% WGP-blended specimen was 9.8% higher than the control PQC after 28 days of curing and 11.1% higher at a 20% WGP replacement level after 90 days of curing. The higher flexural strength of PQC was detected between at 15% and 20% of replacements of OPC by WGP with reference to the 28 days and 90 days curing periods.
  • The encouraging combined effect between WGP and OPC up to a 20% replacement level in PQC was observed according to the SEM image evaluation.
  • A decreased trend of sorptivity value was witnessed up to a 20% WGP replacement level after 28 days and 90 days of curing.
  • The results of durability performance were tested by the water absorption, acid attack, and chloride penetration depth investigations after 28 days of curing, and better results were noticed than in the control concrete.
  • The PPFRPQC specimens were developed and tested. An increasing trend in the compressive strength up to 0.5% addition of PP fibers and in the flexural strength up to 0.75% addition of PP fibers in the PPFRPQC specimens was accomplished. The correlation between the flexural strength and compressive strength was developed in the PPFRPQC specimens as fr = 0.7503(fc)0.5648 with a strong correlation coefficient of 0.9359.
  • It is recommended that WGP can be used in PQC as a partial replacement of OPC of up to 18% without affecting the mechanical and durability properties and 0.5% PP fibers can be incorporated in the WGP-blended PQC specimens to develop PPFRPQCs.

Author Contributions

Conceptualization, P.M. and A.B.; methodology, P.M., A.B. and K.P.; validation, P.M. and A.B.; formal analysis, A.B.; investigation, V.L. and A.B.; resources, A.B.; writing—original draft preparation, V.L. and A.B.; writing—review and editing, V.L., A.B. and K.P.; project administration, A.B. and K.P. All authors have read and agreed to the published version of the manuscript.

Funding

This research received no external funding.

Data Availability Statement

Not applicable.

Conflicts of Interest

The authors declare no conflict of interest.

References

  1. Kathirvel, P.; Sarswathy, V.; Karthik, S.P. Strength and durability properties of quaternary cement concrete made with fly ash, rice husk ash and limestone powder. Arbian J. Sci. Eng. 2013, 38, 589–598. [Google Scholar] [CrossRef]
  2. Dave, N.; Misra, A.N.; Srivastava, A.; Kaushik, S.K. Experimental analysis of strength and durability properties of quaternary cement binder and mortar. Constr. Build. Mater. 2016, 107, 117–124. [Google Scholar] [CrossRef]
  3. Memon, S.A.; Javed, U.; Shah, M.I.; Hanif, A. Use of processed sugarcane bagasse ash in concrete as partial replacement of cement: Mechanical and durability properties. Buildings 2022, 12, 1769. [Google Scholar] [CrossRef]
  4. Zeybek, Ö.; Özkılıç, Y.O.; Karalar, M.; Çelik, A.I.; Qaidi, S.; Ahmad, J.; Burduhos-Nergis, D.D.; Burduhos-Nergis, D.P. Influence of replacing cement with waste glass on mechanical properties of concrete. Materials 2022, 15, 7513. [Google Scholar] [CrossRef] [PubMed]
  5. Basaran, B.; Kalkan, I.; Aksoylu, C.; Özkılıç, Y.O.; Sabri, M.M.S. Effects of waste powder, fine and coarse marble aggregates on concrete compressive strength. Sustainability 2022, 14, 14388. [Google Scholar] [CrossRef]
  6. Moreira, J.M.S.; Freire, M.N.; Holanda, J.N.F. Utilization of granite powder waste in ceramic bodies for civil construction. In Materials Science Forum; Trans Tech: Stafa-Zurich, Switzerland, 2005; pp. 517–522. [Google Scholar]
  7. Guo, H.; Wang, Z.; Zhao, X.; Liu, J.; Ji, X.; Shi, W. Effects of dolomite powder on properties of environment-friendly cement asphalt emulsion composites. J. Clean. Prod. 2022, 369, 2022. [Google Scholar] [CrossRef]
  8. Islam, G.M.S.; Rahman, M.H.; Kazi, N. Waste glass powder as partial replacement of cement for sustainable concrete practice. Int. J. Sustain. Built Environ. 2017, 6, 37–44. [Google Scholar] [CrossRef]
  9. Elaqra, H.; Rustom, R. Effect of using glass powder as cement replacement on rheological and mechanical properties of cement paste. Constr. Build. Mater. 2018, 19, 326–335. [Google Scholar] [CrossRef]
  10. Taha, B.; Nounu, G. Using lithium nitrate and pozzolanic glass powder in concrete as ASR suppressors. Cem. Concr. Compos. 2008, 30, 497–505. [Google Scholar] [CrossRef]
  11. Kannan, D.M.; Aboubakr, S.H.; EL-Dieb, A.S.; Taha, M.M.R. High performance concrete incorporating ceramic waste powder as large partial replacement of Portland cement. Constr. Build. Mater. 2017, 144, 35–41. [Google Scholar] [CrossRef]
  12. Chen, X.; Zhang, D.; Cheng, S.; Xu, X.; Zhao, C.; Wang, X.; Wu, Q.; Bai, X. Sustainable reuse of ceramic waste powder as a supplementary cementitious material in recycled aggregate concrete: Mechanical properties, durability and microstructure assessment. J. Build. Eng. 2022, 52, 104418. [Google Scholar] [CrossRef]
  13. Gusain, P.; Sharma, S.; Debarma, S.; Sharma, A.K.; Mishra, N.; Dahale, P.P. Study of concrete mix by adding dolomite in conventional concrete as partial replacement with cement. Mater. Today Proc. 2023, 73, 163–166. [Google Scholar] [CrossRef]
  14. Kanmalai, W.C.; Partheeban, P.; Felixkala, T. Mechanical properties of high-performance concrete incorporating granite powder as fine aggregate. Int. J. Des. Manuf. Technol. 2008, 2, 67–73. [Google Scholar]
  15. Shamsabadi, E.A.; Ghalehnovi, M.; Brito, J.D.; Khodabakhshian, A. Performance of concrete with waste glass powder: The effect of superplasticizers. J. Appl. Sci. 2018, 8, 2018. [Google Scholar] [CrossRef]
  16. Allam, M.E.; Bakhoum, E.S.; Garas, G.L.; Ezz, H. Durability of green concrete containing granite waste powder. Int. J. Eng. Technol. 2016, 8, 2383–2391. [Google Scholar]
  17. Felix Kala, T. Properties of granite powder concrete. In Proceedings of the 1st International Conference on Infrastructure Development, Jawa Tengah, Indonesia, 1–3 November 2013; UMS Surakarta: Jawa Tengah, Indonesia, 2013. [Google Scholar]
  18. Vijayalakshmi, M.; Sekar, A.S.S.; Sivabharathy, M.; Ganesh Prabhu, G. Utilization of granite powder waste in concrete production. Defect Diffus. Forum 2012, 330, 49–61. [Google Scholar] [CrossRef]
  19. Arivumangai, A.; Felixkala, T. Strength and durability properties of granite powder concrete. J. Civ. Eng. Res. 2014, 4, 1–6. [Google Scholar]
  20. Ghannam, S.; Najm, H.; Vosconez, R. Experimental study of concrete made with granite and iron powders as partial replacement of sand. Sustain. Mater. Technol. 2016, 9, 1–9. [Google Scholar] [CrossRef]
  21. Vijayalakshmi, M.; Sekar, A.S.S.; Ganesh Prabhu, G. Strength and durability properties of concrete made with granite industry waste. Constr. Build. Mater. 2013, 46, 1–7. [Google Scholar] [CrossRef]
  22. Murthi, P.; Poongodi, K.; Saravanan, R.; Gobinath, R. Setting time of granite powder blended banana fibre reinforced high performance concrete. Int. J. Innov. Technol. Explor. Eng. 2020, 9, 891–896. [Google Scholar] [CrossRef]
  23. Thomas, F.K.; Partheeban, P. Study on the effect of granite powder on concrete properties. ICE 2009, 163, 63–70. [Google Scholar] [CrossRef]
  24. Binici, H.; Shah, T.; Aksogan, O.; Kaplan, H. Durability of concrete made with granite and marble as recycle aggregates. J. Mater. Process. Technol. 2008, 208, 299–308. [Google Scholar] [CrossRef]
  25. Naveenkumar, K.; Rohith, M.; Sagar, S.R.; Bandre, H.S. Properties of pavement quality concrete for partial replacement of natural coarse aggregates with coconut shell aggregates. Int. J. Appl. Eng. Res. 2018, 13, 146–149. [Google Scholar]
  26. Poongodi, K.; Murthi, P.; Gobinath, R.; Srinivas, A.; Sangeetha, G. Mechanical properties of pavement quality concrete using recycled aggregate. Int. J. Innov. Technol. Explor. Eng. 2020, 9, 33–38. [Google Scholar] [CrossRef]
  27. Murthi, P.; Poongodi, K.; Gobinath, R. Correlation between rebound hammer number and mechanical properties of steel fibre reinforced pavement quality concrete. Mater. Today Proc. 2021, 39, 142–147. [Google Scholar] [CrossRef]
  28. Prokopski, G.; Marchuk, V.; Huts, A. The effect of using granite dust as a component of concrete mixture. Case Stud. Constr. Mater. 2020, 13, e00349. [Google Scholar] [CrossRef]
  29. Jain, A.; Choudhary, R.; Gupta, R.; Chaudhary, S. Abrasion resistance and sorptivity characteristics of SCC containing granite waste. Mater. Today Proc. 2020, 27, 524–528. [Google Scholar] [CrossRef]
  30. Ahmed, T.I.; Tobbala, D.E. The role of granite dust in engineered cement composites as a partial replacement of fine aggregate. Innov. Infrastruct. Solu. 2022, 7, 104. [Google Scholar] [CrossRef]
  31. Shwetha, K.G.; Mahesh Kumar, C.L.; Dalawai, V.N.; Anadinni, S.B.; Sowjanya, G.V. Comparative study on strengthening of concrete using granite waste. Mater. Today Proc. 2022, 62, 5317–5322. [Google Scholar] [CrossRef]
  32. Mohsen, A.; Ramadan, M.; Gharieb, M.; Yahya, A.; Soltan, A.M.; Hazem, M.M. Rheological behaviour, mechanical performance, and anti-fungal activity of OPC-granite waste composite modified with zinc oxide dust. J. Clean. Prod. 2022, 341, 130877. [Google Scholar] [CrossRef]
  33. Lu, L.; Yang, Z.; Lin, Y.; Dong, S. Partial replacement of manufactured sand with homologous granite powder in mortar: The effect on porosity and capillary water absorption. Con. Build. Mat. 2023, 376, 131031. [Google Scholar] [CrossRef]
  34. Kim, J.; Lee, D.; Sicakova, A.; Kim, N. Utilization of different forms of demolished clay brick and granite wastes for better performance of cement composites. Buildings 2023, 13, 165. [Google Scholar] [CrossRef]
  35. Muñoz Pérez, S.P.; Atoche Zamora, J.J. Effects of incorporating granite powder in the mechanical properties of concrete. Sci. Rev. Eng. Env. Sci. 2023, 32, 18–23. [Google Scholar] [CrossRef]
  36. IS: 269-2015; Indian Standard for Ordinary Portland Cement–Specification (Sixth Revision). Bureau of Indian Standards: New Delhi, India, 2015.
  37. IRC: 44-2017; Guidelines for Cement Concrete Mix Design for Pavements (3rd Revision). Indian Roads Congress: New Delhi, India, 2017.
  38. Li, L.G.; Wang, Y.M.; Tan, Y.P.; Kwan, A.K.H. Filler technology of adding granite dust to reduce cement content and increase strength of mortar. Powder Technol. 2019, 342, 388–396. [Google Scholar] [CrossRef]
  39. IRC: 15-2011; Standard Specification and Code of Practice for Construction of Concrete Roads (Fourth Revision). Indian Road Congress: New Delhi, India, 2011.
  40. ASTM C311; Standard Test Methods for Sampling and Testing Fly Ash or Natural Pozzolanic for Use in Portland-Cement Concrete. American Society for Testing and Materials: West Conshohocken, PA, USA, 2013.
  41. ASTM C618; Standard Specification for Coal Fly Ash and Raw or Calcined Natural Pozzolan for Use in Concrete. American Society for Testing and Materials: West Conshohocken, PA, USA, 2023.
  42. IS: 1199-1959; Indian Standard for Method of Sampling and Analysis of Concrete (Eleventh edition). Bureau of Indian Standards: New Delhi, India, 2004.
  43. IS: 516–1959; Indian Standard for Method of Tests for Strength of Concrete (Eighteenth edition). Bureau of Indian Standards: New Delhi, India, 2006.
  44. ASTM C642-06; Standard Test Method for Density, Absorption, and Voids in Hardened Concrete. American Society for Testing and Materials: West Conshohocken, PA, USA, 2022.
  45. Choudhary, R.; Gupta, R.; Nagar, R.; Jain, A. Sorptivity characteristics of high strength self-consolidating concrete produced by marble waste powder, fly ash, and micro silica. Mater. Today Proc. 2020, 32, 531–535. [Google Scholar] [CrossRef]
  46. Murthi, P.; Sivakumar, V. Studies on acid resistance of ternary blended concrete. Asian J. Civ. Eng. 2008, 9, 473–486. [Google Scholar]
  47. Damrongwiriyanupap, N.; Sae-Long, W.; Limkatanyu, S.; Xi, Y. Influence of associated cautions on chloride ingress into concrete structures. Eng. J. 2021, 25, 51–60. [Google Scholar] [CrossRef]
  48. ASTM C1218/1218M-15; Standard Test Method for Water-Soluble Chloride in Mortar and Concrete. American Society for Testing and Materials (ASTM): West Conshohocken, PA, USA, 2004.
  49. Karim, M.R.; Hashim, H.; Razak, H.A. Assessment of pozzolanic activity of palm oil clinker powder. Constr. Build. Mater. 2016, 127, 335–343. [Google Scholar] [CrossRef]
  50. Singh, M. Coal Bottom Ash. In Waste and Supplementary Cementitious Materials in Concrete; Woodhead Publishing: Sawston, UK, 2018. [Google Scholar] [CrossRef]
  51. Janjaturaphan, S.; Wansom, S. Pozzolanic activity of industrial sugar cane bagasse ash. Suranaree J. Sci. Technol. 2010, 17, 349–357. [Google Scholar]
  52. Singh, B. Rice Husk Ash. In Waste and Supplementary Cementitious Materials in Concrete; Woodhead Publishing: Sawston, UK, 2018. [Google Scholar] [CrossRef]
  53. Mboya, H.A.; King’ondu, C.K.; Njau, K.N.; Mrema, A.L. Measurement of pozzolanic activity index of scoria, pumice and rice husk ash as potential supplementary cementitious materials for Portland cement. Adv. Civ. Eng. 2017, 2017, 6952645. [Google Scholar] [CrossRef]
  54. Chen, J.J.; Kwan AK, H.; Jiang, Y. Adding limestone fines as cement paste replacement to reduce water permeability and sorptivity of concrete. Constr. Build. Mater. 2014, 56, 87–93. [Google Scholar] [CrossRef]
  55. Gulsan, M.E.; Mohammedameen, A.; Sahmaran, M.; Nis, A.; Alzeebaree, R.; Cevik, A. Effects of sulphuric acid on mechanical and durability properties of ECC confined by FRP fabrics. Adv. Concr. Constr. 2018, 6, 199–220. [Google Scholar] [CrossRef]
  56. Kumar, N.V.S. Effect of sulphuric and hydrochloric acid solutions on crushed rock dust concrete. Mater. Today Proc. 2021, 46, 2021. [Google Scholar] [CrossRef]
  57. Min, H.; Song, Z. Investigation on the sulphuric acid corrosion mechanism for concrete in soaking environment. Adv. Mater. Sci. Eng. 2018, 2018, 3258123. [Google Scholar] [CrossRef]
  58. Poongodi, K.; Mahesh, V.; Murthi, P.; Sivaraja, M. Material performance of agro based hybrid natural fibre reinforced high strength concrete. In IOP Conference Series Materials Science and Engineering; IOP: Bristol, UK, 2020. [Google Scholar] [CrossRef]
  59. Murthi, P.; Poongodi, K.; Gobinath, R.; Saravanan, R. Evaluation of material performance of coir fibre reinforced quaternary blended concrete. In IOP Conference series Materials Science and Engineering; IOP: Bristol, UK, 2020. [Google Scholar] [CrossRef]
  60. IS: 456-2000 (R-2005); Indian Standard for Plain and Reinforced Concrete–Code of Practice (4th revision). Bureau of Indian Standards: New Delhi, India, 2005.
  61. Hu, C. Microstructure and mechanical properties of fly ash blended cement pastes. Constr. Build. Mater. 2014, 73, 618–625. [Google Scholar] [CrossRef]
  62. Lee, J.; Lee, T. Durability and engineering performance evaluation of CaO content and ratio of binary blended concrete containing ground granulated blast-furnace slag. J. Appl. Sci. 2020, 10, 2054. [Google Scholar] [CrossRef]
Figure 1. Sieve analysis of sand.
Buildings 13 01294 g001
Figure 2. Granite slurry source.
Buildings 13 01294 g002
Figure 3. Chloride penetration depth test.
Buildings 13 01294 g003
Figure 4. WGP-blended PQC specimens. (a) Slump test, (b) Slump variations.
Buildings 13 01294 g004
Figure 5. WGP-blended PQC specimens. (a) Compressive strength test, (b) Compressive strength variations.
Buildings 13 01294 g005
Figure 6. WGP-blended PQC specimens. (a) Modulus of rupture test, (b) Failure.
Buildings 13 01294 g006
Figure 7. Flexural strength variations of WGP-blended PQC specimens.
Buildings 13 01294 g007
Figure 8. Water absorption variations of WGP-blended PQC specimens.
Buildings 13 01294 g008
Figure 9. Sorptivity variations of WGP-blended PQC specimens.
Buildings 13 01294 g009
Figure 10. WGP-blended PQC specimens. (a) Cubes immersed in acid solution, (b) Surface appearance of cubes.
Buildings 13 01294 g010
Figure 11. Strength reduction factor due to acid attack at curing periods of (a) 28 days, (b) 90 days.
Buildings 13 01294 g011
Figure 12. Chloride penetration depth at curing periods of (a) 28 days, (b) 90 days.
Buildings 13 01294 g012
Figure 13. Slump value variations of PPFRPQC specimens.
Buildings 13 01294 g013
Figure 14. Compressive strength variations of PPFRPQC specimens.
Buildings 13 01294 g014
Figure 15. Flexural strength variations of PPFRPQC specimens.
Buildings 13 01294 g015
Figure 16. Correlation between compressive strength and flexural strength.
Buildings 13 01294 g016
Figure 17. SEM images of PQC specimens. (a) PQC specimen without WGP, (b) 15% WGP-blended PQC specimen, (c) 0.75% PPFRPQC specimen.
Buildings 13 01294 g017
Table 2. Physical properties and chemical compositions of OPC and WGP.
Physical PropertiesOPCWGP
Specific surface area (m2/g)257225
Specific gravity3.152.61
Chemical Compositions (%)
SiO221.9272.05
Al2O35.7111.61
Fe2O33.231.87
CaO60.372.23
MgO1.651.49
Table 3. Physical properties of aggregates.
Physical PropertiesRiver SandCoarse Aggregate
Specific gravity2.632.76
Grading of aggregateGrading zone—IISingle-sized
Fineness modulus2.376.71
Bulk density (kg/m3)16561705
Water absorption (%)0.800.55
Flakiness index (%)-14.57
Elongation index (%)-14.63
Impact value (%)-11.29
Crushing value (%)-12.68
Table 4. Mix proportioning of M35-grade PQC specimens.
Mix DesignationIngredients (kg/m3)
OPCWGPSandCAw/cWater
GP0100%4000%071011200.45180
GP595%3805%2071011200.45180
GP1090%36010%4071011200.45180
GP1585%34015%6071011200.45180
GP2080%32020%8071011200.45180
GP2575%30025%10071011200.45180
Table 5. Mix proportioning of M35-grade WGP-blended PPFRPQC specimens.
Mix DesignationIngredients (kg/m3)
OPC (82%)WGP (18%)FiberSandCAWater
WGP18F0328720%07101120180
WGP18F1328720.25%6.0257101120180
WGP18F2328720.5%12.057101120180
WGP18F3328720.75%18.0757101120180
WGP18F4328721.0%24.107101120180
WGP18F5328721.25%30.1257101120180
Disclaimer/Publisher’s Note: The statements, opinions and data contained in all publications are solely those of the individual author(s) and contributor(s) and not of MDPI and/or the editor(s). MDPI and/or the editor(s) disclaim responsibility for any injury to people or property resulting from any ideas, methods, instructions or products referred to in the content.

