Abstract
Due to the need for comprehensive transportation hub construction, an existing bridge in a bustling urban area with an operation duration of 25 years was required to be demolished. Based on Life Cycle Assessment (LCA), this paper proposes a scheme of “Self-propelled modular transporter (SPMT) technology + large segment cutting” to compare the carbon emissions of demolition schemes qualitatively and quantitatively. To ensure structural safety during demolition, the finite element analysis was used to simulate the entire demolishing process, and measuring points were set up to monitor the deformation of the main girder in real time under various demolition conditions. The results indicate that the scheme of SPMT has the lowest carbon emissions during the demolition stage. Additionally, the long-term prestress loss shall be considered when demolishing existing bridges; the suggested 25% proportional value for the long-term prestress loss of the Caitian Bridge is appropriate, which is determined by comparing the calculated results from various formulas. The values of the calculated and measured deformations of the main girder under different working conditions are in good agreement, with errors mostly within 10% and a maximum of no more than 14.7%. The demolition of the entire bridge was completed in a total of 28 h with little noise and pollution, and the impact on daily traffic was avoided, proving that the proposed “SPMT technology + large segment cutting” scheme is safe, efficient, and achieves the goal of green, environmentally friendly, and rapid demolition.
1. Introduction
During the process of rapid development of urban transportation, it is inevitable that some existing bridges will need to be demolished. Environmental protection is currently a major concern, and carbon emissions are closely related. The International Energy Agency (IEA) released the Report of CO2 Emissions in 2022 [1], which pointed out the severe situation of carbon emissions. Furthermore, buildings and construction account for 40% of all emissions [2]. In addition, bridge demolition is essentially the reverse process of its construction; with the multiple system transformations, structural stress changes need to be considered [3]. In recent years, the demand for demolishing existing bridges has shown an increasing trend, and demolition is required to be green, rapid, and safe.
Carbon emission is an important index to evaluate the green degree. To quantify carbon emissions, Life Cycle Assessment (LCA) is a widely used method [4]. It divides the cycle into six stages: raw material acquisition, material processing, component production, construction, building operation and maintenance, and demolition. Especially for the bridge demolition stage, a decisive factor in the carbon emission quantity is the demolition method [5]. Recently, various demolition methods have been proposed and applied, from blasting to static cutting, gradually reducing the impact on the environment. As a result, low-carbon, green, and harmless demolition methods have become a trend.
On the other hand, existing bridges have structural damage to the extent that the strength, stiffness, and bearing capacity have been reduced as a result of the deterioration of structural material, concrete shrinkage and creep, fatigue, corrosion of steel, relaxation of the prestressed tendon, and environmental influence [6,7,8]. Therefore, ensuring safety during the demolition is an essential issue. Comprehensive consideration of various practical factors to determine a reasonable demolition scheme is an important requirement for achieving green, safe, and rapid demolition.
For bridge demolition cases, safety accidents have occurred frequently due to insufficient consideration of factors that affect the safety of bridge demolition. For example, in 2004, for the demolition of the continuous steel box girder of the Sikorsky Bridge in the United States, the crane overturned [9]. In 2016, for the demolition of the Taihe Bridge in Jiangxi, China, the improper demolition of arches led to its collapse [10]. Finally, in 2017, for the demolition of the overpass on Nongye Road in Zhengzhou, China, it collapsed due to the insufficient bearing capacity of the supports [11]. Therefore, conducting a study of various safety factors and determining a reasonable scheme before demolition is a prerequisite for ensuring demolition construction’s safety.
Currently, bridge demolition methods mainly include blasting, static cutting, etc. To minimize the impact of existing bridge demolition on urban traffic, SPMT (Self-propelled modular transporter) becomes a trend of Accelerated Bridge Deconstruction Technology [12]. The SPMT technology has been successfully applied in projects such as the overall replacement of the superstructure of the Beijing Sanyuan Bridge, the demolition of the Kaiyang Expressway overpass in Guangdong [13], etc. However, the above demolition cases did not consider the impact of prestress loss, which poses potential safety issues. Therefore, for the scheme selection, only qualitative comparisons were conducted without quantifying the environmental impact.
This paper uses the engineering background of the Caitian Bridge demolition project in Shenzhen, China. Based on the actual situation, a qualitative and quantitative comparison of multiple demolition schemes, according to the LCA, is conducted to determine a reasonable scheme. Moreover, the numerical method is used to simulate the demolition process, considering the long-term prestress loss, combined with real-time monitoring, to ensure the rapid, green, and safe demolition of the Caitian Bridge. Based on carbon emission estimation and demolition simulation, the proposed scheme of “SPMT technology + large segment cutting” has the advantages of being green, sustainable, and safe, which can further promote the application of SPMT and provide theoretical and technical support for similar demolition projects. The specific study framework is shown in Figure 1.
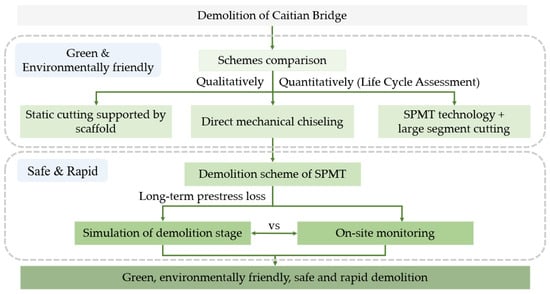
Figure 1.
Study framework.
2. Background Information
2.1. Project Overview
The Caitian Bridge spans the main road and metro line 2 of Shenzhen’s core area. The bridge is located at the intersection of the two main roads, with a high daily flow of people and vehicles. To alleviate traffic congestion, a comprehensive transportation hub is planned to be built here, as shown in Figure 2. Based on the design plan of the comprehensive transportation hub, the existing Caitian Bridge intrudes into its construction area and needs to be demolished. After demolition, a temporary steel bridge will be used for transportation, and after the completion of the top slab of the station, the structural columns of the station will be used as piers to build the new Caitian Bridge in the same place.
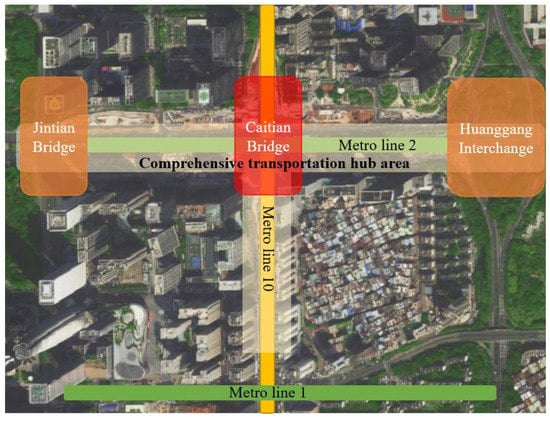
Figure 2.
Map of Caitian Bridge and comprehensive transportation hub.
As a continuous girder bridge, Caitian Bridge is arranged as 20 + 25 × 4 + 20 m, the width along the transverse direction is 28.5 m, which consists of east and west parts with individual widths of 14.25 m, and the clearance under the bridge is 1.6 m~5.8 m, as shown in Figure 3. The standard cross-section of the main girder is shown in Figure 4.
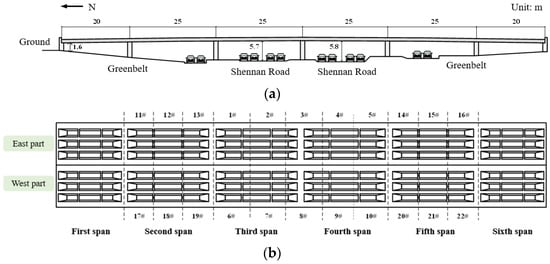
Figure 3.
Span Arrangement of Main Bridge of Caitian Overpass Bridge (Unit: m). (a) Elevation diagram; (b) plan diagram.

Figure 4.
Schematic diagram of main girder standard section (Unit: cm).
According to the Chinese standard of General Specifications for the Design of Highway Bridge and Culverts (JTG D60-2015) [14], the design load is a vehicle load over 20 levels and a trailer load of 120. The superstructure of the main bridge is a continuous box girder with equal cross-sectional prestressed concrete, with a cross-section of a single box and three cells, and a concrete grade of C45. The girder is arranged with longitudinal prestressed tendons of Ryb = 1860 MPa low relaxation steel strand, an XM15-7 anchor mat is used, and the tensioning control stress is 1295 MPa. To reduce the prestress loss due to friction, the XL15-7 connector is installed in the box girder at 6.25 m on both sides of the middle pier. All the piers adopt Φ1.2 m double-column piers with bored pile foundations.
2.2. Comparison of Demolition Schemes
To minimize the negative impact on the normal work and life of residents, the management has limited the demolition of the Caitian Bridge to within 32 h and must satisfy the requirements of safety, high efficiency, and low pollution. Furthermore, based on the surrounding environment of the bridge, the demolition scheme for Caitian Bridge must also consider the following:
- Safety management of traffic;
- Impact on the structural stress and operational safety of the shield tunneling section of the existing metro line 2;
- Reasonable selection of mechanical equipment, equipment quantity investment, and layout scheme;
- Selection of transportation equipment and transportation plan for dismantled girder sections.
Based on the requirements above and referring to successful cases of bridge demolition before, this paper proposes three demolition schemes: static cutting supported by scaffold, direct mechanical chiseling, and SPMT technology + large segment cutting. A comparative analysis of these three schemes is conducted, taking the impact on traffic, demolition time, cost, environmental pollution, etc., into consideration, as shown in Table 1.

Table 1.
Qualitative comparison of demolition schemes.
To quantitatively compare the impact of three construction schemes on the environment, based on the Life Cycle Assessment (LCA), the carbon emissions during the demolition process of Caitian Bridge are estimated. According to the Standard of building carbon emission calculation (GBT 51366-2019) [15], a model of total carbon emission for the bridge demolition stage is established in this paper. This model mainly contains carbon emissions during the demolition stage and waste transportation. Among them, the former mainly comes from labor, machinery, etc., while the latter mainly comes from vehicle transportation of construction waste, as shown in Figure 5.

Figure 5.
Components of demolition carbon emission.
The model can be expressed as:
where,
= total carbon emissions during the bridge demolition stage, kgCO2e;
= carbon emissions from labor and machinery, kgCO2e;
= carbon emissions from waste transportation, kgCO2e;
= shift number of the -th type of construction machinery, shift;
= carbon emission coefficient of the -th type of construction machinery, kgCO2e/shift;
= number of workers, person;
= working hours, one working day (eight hours);
= carbon emission coefficient of a single person per working day, kgCO2e/(person ·working day);
= total amount of the -th type of waste, t;
= average transportation distance of the -th type of waste, km;
= carbon emission coefficient of the -th type of waste transportation with unit weight and distance, kgCO2e/(t·km).
Among them, there is no unified standard for the carbon emission coefficient of labor. Based on statistical data from the World Resources Institute and other research on carbon emission coefficient, bridge demolition workers are regarded as high-intensity workers, with a value of 4.16 kgCO2e/(person·workday) [16]. During the operation of construction machinery, energy consumption leads to significant carbon emissions. The main transportation method for construction waste is road transportation, and the waste is transported to a temporary girder storage yard which is 300 m away from the construction site. The corresponding carbon emission factors for mechanical operation and transportation refer to the Standard of building carbon emission calculation (GBT 51366-2019) [15].
Based on Formulas (1)–(3), the calculated carbon emissions generated by the three construction schemes during the demolition stage are shown in Table 2. Comprehensively considering the results in Table 1 and Table 2, compared to the other two schemes, the “SPMT technology + large segment cutting” scheme requires higher construction costs but can flexibly carry out the construction with a relatively short construction period. Additionally, the total carbon emissions during the demolition process are significantly lower than the other two schemes, with about 1/3 of carbon emissions from other schemes. Therefore, the impact on the environment is minimized, and the comprehensive socio-economic cost is the least. Thus, the “SPMT technology + large segment cutting” scheme is more suitable for the demolition of the Caitian Bridge.

Table 2.
Carbon emissions for three schemes.
2.3. Demolition Scheme Based on SPMT Technology
For the “SPMT technology + large segment cutting” scheme, first, demolish the main girder, then sequentially demolish the piers, abutments, and foundations. During the process, the scaffold and SPMT are used as temporary support, and the diamond rope saws are adopted to cut large segments synchronously. Moreover, SPMT is used to transport the girder segments to the storage yard. According to on-site conditions and design documents, the main girder is divided into 22 segments for demolition and transportation. Figure 3b shows the schematic diagram of the main girder segment division, and Table 3 shows the information on segments for each span. The specific demolition and transportation steps are as follows:

Table 3.
Segmentation information of each span.
- Existing bridge state, the temporary support of SPMT and scaffold are in place;
- Cut the main girder near the side pier of the first span in the east part, and the first and sixth spans are supported by scaffold;
- Cut and demolish segments 1# and 2# of the third span; the cantilever end of segment 3# is supported by SPMT;
- Cut and demolish segment 3#, 4#, and 5# of the fourth span;
- Cut and demolish segments 6# and 7# of the third span; the cantilever end of segment 8# is supported by SPMT;
- Cut and demolish segment 8#, 9#, and 10# of the fourth span;
- Cut and demolish the second and fifth spans of the east part in sequence, namely segments 11#~13# and 14#~16#;
- Cut and demolish the second and fifth spans of the west part in sequence, namely segments 17#~19# and 20#~22#;
- Cut and demolish the first and sixth spans of the east and west parts.
During demolition, SPMT has two main functions. The first is the supporting function, which temporarily supports the demolishing main girder; the second is the transportation function, which transports the demolished girder segment to the storage yard. Based on Table 3, the maximum weight of the demolished segment is approximately 3125 kN, with a width of 12.5 m and a length of 14.25 m. To satisfy the functional requirements, the DCMC 8-axis SPMT is selected, with a length of 15.4 m, a wheelbase of 1.4 m, a width of 2.43 m, a height of 1.5 m, the load capacity of 300 kN to 350 kN per axis, and a single vehicle capacity of 2400 kN to 2800 kN. Each demolished segment is transported to the girder storage yard using 2 SPMTs, and a total of 9 SPMTs are selected for each single cutting segment.
According to the actual bridge alignment survey, the clearance at the bottom of the middle four spans is 5.28 m~5.97 m, but the height range of DCMC 8-axis SPMT is 1.15 m~1.85 m. Therefore, to satisfy the temporary support requirement, two types of height-adjusted jig frames are designed, with heights of 4.42 m and 3.92 m, respectively, and the height adjustment ranges of 5.57 m–6.27 m and 5.07 m–5.77 m, respectively. The combined structure of the selected SPMT and jig frame is shown in Figure 6.
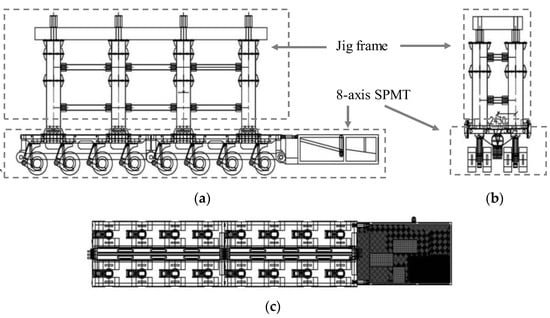
Figure 6.
The combined structure of 8-axis SPMT and adjustable jig frame. (a) Front view; (b) left view; and (c) vertical view.
3. Methodology
3.1. Determination of Long-Term Prestress Loss of Caitian Bridge
As mentioned above, simulating the demolition process and accurately estimating the linear state of the bridge is the essential prerequisite for ensuring the safety of bridge demolition. The Caitian Bridge has been used for nearly 25 years; although the site research has shown that there has been no large-scale maintenance and no serious appearance damage, due to the long-term effects of creep and shrinkage of concrete and relaxation of prestressing tendons, there is inevitably a loss of prestress. Therefore, for the analysis of the bridge demolition process, it is obviously too conservative if the prestressing effect is not considered completely; if it is considered, how to determine the value of prestress loss is the primary problem to be solved.
There are three main types of calculation methods for prestress loss: the Timestep Analysis Method, Subitem Superposition Method, and Overall Estimation Method [17]. Among them, the Subitem Superposition Method refers to the calculation of the various components of prestress loss during each stage, with the total loss being the sum of each component. This method is widely used in various countries due to its clear principle and simple calculation. According to the occurrence time, the prestress loss can be divided into two categories [18,19], namely, (1) instantaneous loss, including friction loss, anchoring loss, temperature difference loss, concrete elastic compression loss, and instantaneous effects of shrinkage and creep of concrete; and (2) long-term loss, including loss caused by shrinkage and creep of concrete, and relaxation of prestressing tendons, which are time-dependent. Moreover, tendon corrosion is the source of prestress loss [20,21], but considering that the cut section of Caitian Bridge has good concrete density, no obvious cracks, and is not in the offshore environment, its impact is ignored.
The calculation of long-term prestress loss is also stipulated in the established design standards of prestressed concrete structures from different countries, but the influence factors and values of related parameters vary greatly. Among them, European standard Eurocode 2 [22] ignores the effect of time and reinforcement; American standard AASHTO [23] and Canadian standard CAS S6 [24] provide the fitting empirical formula based on the experimental results; Australian standard AS 3600 [25] ignores the effect of reinforcement when calculating loss caused by shrinkage and creep of concrete; Chinese standard JTG 3362-2018 [26] ignores the coupling effect of prestressed tendon relaxation, and concrete shrinkage and creep on long-term prestress loss. In addition, based on theoretical analysis, combined with experimental and machine learning methods, researchers have conducted further in-depth research on long-term prestress loss. For example, Zhou et al. [27] proposed a long-term prestress loss calculation method considering the influence of time based on the principles of force equilibrium and strain compatibility; Pablo M. Páez [28] proposed a formula for calculating prestress loss applicable to cracked sections, based on the constitutive relationship and the transformed section method; Zhang et al. [29] used machine learning technology and based on experimental data, the explicit expression for concrete shrinkage and creep was proposed, and a prediction model for long-term prestress loss was established. Table 4 shows some calculation formulas for long-term prestress loss.

Table 4.
Calculation method of long-term prestress loss and meaning of notation.
It can be seen from Table 4 that the formulas above involve complex influence factors and are inconvenient for practical application. To simplify the calculation, American Prestressed Concrete Institute (PCI) has provided estimated prestress loss for different types of prestressed tendons [30], shown in Table 5. Moreover, based on a large amount of experimental data, the original Professional Design Institute of the Ministry of Railways in China has also proposed the recommended values for estimating prestress loss, which is 25%−40% of tensioning control stress for post-tensioned girders [31].

Table 5.
Estimated values of long-term prestress loss by PCI.
To reasonably determine the long-term prestress loss of Caitian Bridge, the standard section at midspan is selected to analyze. Figure 7 shows the layout of prestressed steel tendons in the midspan standard section.

Figure 7.
Midspan tendons layout of Caitian Bridge (Unit: cm).
The proportions of long-term prestress loss calculated according to different standards and methods are listed in Table 6. The results of long-term prestress loss by different methods vary greatly, with a varied range of 11.3% to 28.3%. This paper simulates the demolition of the Caitian Bridge while taking into account all of the methods’ influencing factors, accounting for a 25% long-term prestress loss.

Table 6.
Calculated parameter values and results comparison.
3.2. Finite Element Model of Caitian Bridge during Demolition Process
The Grillage Method is adopted to simulate the demolition process of the Caitian Bridge. For longitudinal grillage dividing, the cross-section is divided into four longitudinal girders, as shown in Figure 8. For transverse grillage dividing, set the spacing of the virtual crossbeam to 1 m to ensure the continuity of load transfer between the longitudinal girders. The finite element model of the east part (see Figure 3b) is established by Midas Civil, which is discretized into 941 beam elements and 571 nodes. The beam elements involve girders, abutments, and virtual crossbeams, with quantities of 536, 21, and 384, respectively. The discrete grid model is shown in Figure 9.

Figure 8.
Longitudinal grillage dividing (Unit: cm).

Figure 9.
Discrete grid model (Unit: cm).
According to the arrangement of supports shown in Figure 10, the middle support is constrained by vertical and longitudinal displacement, while the transverse displacement is not constrained; for bridge abutments, all linear displacements are constrained.

Figure 10.
Support layout (Unit: cm).
For Caitian Bridge, the material of the girder body is C45 concrete; the longitudinal prestressed tendons are all made of 15.2 high-strength, low-relaxation steel strands. The main material parameters are shown in Table 7. For the model loading, moving load is not considered but only considers the self-weight, prestress load, and secondary load, where the secondary load contains bridge deck pavement, etc., taking 11.8 N/mm. The tensioning of steel tendons adopts post-tensioning, and the tension type is stress, with stress applied at the starting and ending points of the tendons, respectively.

Table 7.
Main material parameters.
The main calculation conditions are:
- Working condition 1: existing bridge state, the temporary support of SPMT, and the scaffold are in place, as shown in Figure 11a;
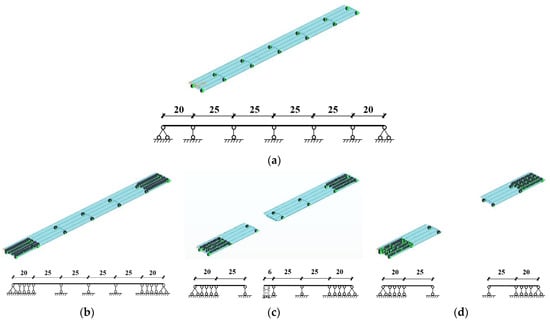 Figure 11. Finite element model under various working conditions (Unit: m). (a) Working condition 1; (b) working condition 2; (c) working condition 3; and (d) working condition 4.
 - Working condition 2: cut the main girder on the north side, and the south and north side span are supported by scaffold, as shown in Figure 11b;
- Working condition 3: demolish about three-quarters of the third span girder, and the remaining one-quarter of the girder is supported by an SPMT, as shown in Figure 11c;
- Working condition 4: demolish the cantilever part of the third span and the fourth span, as shown in Figure 11d.
3.3. Actual Bridge Deformation Monitoring
To ensure the safety of bridge demolition, the electronic total station ES-602G is used to monitor the deformation of the main girder during the whole demolition process, as shown in Figure 12, which is an instrument that can measure the horizontal angle, vertical angle, distance (oblique distance, horizontal distance), and elevation difference. The technical index is shown in Table 8. The data is recorded after each construction condition, which takes about two minutes for each measurement point.
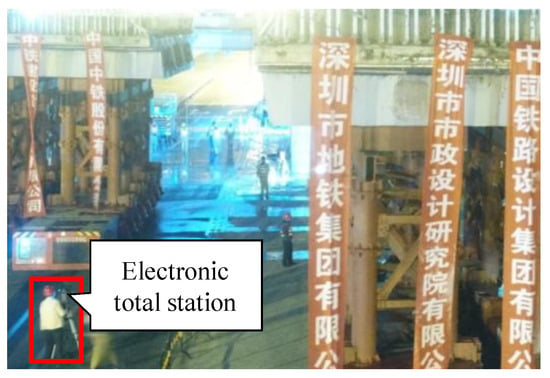
Figure 12.
The electronic total station used in the site.

Table 8.
Technical index of the electronic total station.
The measurement points are mainly arranged in the middle four spans, which are the second to fifth spans in Figure 10. Two rows of measurement points are arranged along the longitudinal direction for a single part located above the edge web. The measurement points on the east part are marked as QC−1− * and QC−2− *, while the measurement points on the west part are marked as QC−3− * and QC−4− *. There are 48 measurement points across the bridge, as shown in Figure 13 and Figure 14.
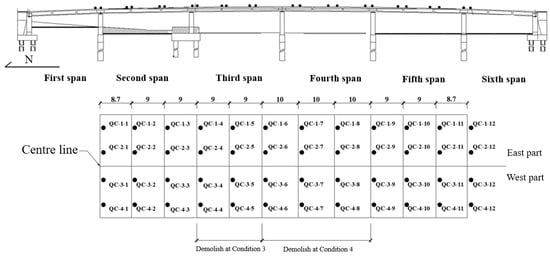
Figure 13.
Layout of measuring points (Unit: m).

Figure 14.
Cross-section layout of measurement point (Unit: cm).
4. Results and Discussion
Based on the proposed scheme above, the demolition of the Caitian Bridge officially began on 29 December 2017 and was completed on 1 January 2018. The demolition operation was carried out during the low-traffic period from 23:00 to 06:00 every day. As a result, the road was partially closed for construction, and traffic was resumed in the early morning, minimizing the impact on the traffic capacity of the main road.
During the demolition process, the maximum deformation under various working conditions occurred at the QC−2− * series measuring points. The comparison between the measured and calculated values at each measuring point is shown in Figure 15. Among them, the calculated values include two cases: without considering the loss of prestress and considering 25% of the loss of prestress. Table 9 shows the comparison between the measured values and calculated values of all measurement points under various demolition conditions.
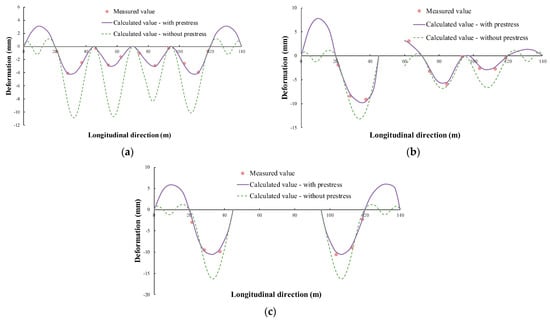
Figure 15.
Comparison of calculated and measured deformation of QC−2− * points under demolition conditions. (a) Working condition 2; (b) working condition 3; and (c) working condition 4.

Table 9.
Comparison of measured and calculated (25% Long-term Prestress Loss) deformation of each measurement point.
Based on the Figure and Table above, it can be seen that:
- The demolition of Caitian Bridge should consider long-term prestress loss, and the 25% value calculated in this paper is appropriate. Under various demolition conditions, compared to not considering long-term prestress loss, the calculated value of 25% long-term prestress loss is in good agreement with the measured value, with an error basically within 10% and a maximum of 14.7%; When long-term prestress loss is not considered, the error is generally more than twice, which is unreasonable;
- Working condition 3 indicates that the remaining main girder end has measured upward warping, which indicates that three-quarters of the third span’s girder has been destroyed. The reason is that the prestressed steel tendon of this section is cut off, and some of the prestress is released, causing the displacement of the girder end to rebound upwards. The calculation results considering 25% long-term prestress loss are consistent with the measured value. In contrast, the calculation results without considering long-term prestress loss show downward deformation, once again proving the rationality of the value of the long-term prestress loss ratio, as shown in Figure 15b;
- Working condition 4, which means cutting off the cantilever part of the third span and the fourth span, is the most unfavorable condition. At this time, the second (fifth) span is 25 m, and the maximum downward deflection is about −10.56 mm under the action of self-weight; the downward deflection caused upward deformation of the first (sixth) span, approximately 5.90 mm, as shown in Figure 15c.
- The entire demolition process of Caitian Bridge was 28 h, which is 4 h shorter than the limited time. Figure 16 shows the actual scene of various working conditions for the bridge demolition. Among them, Figure 16e shows the actual cross-section of the main girder after cutting, indicating that the prestressed tendon is fully grouted without significant shrinkage. Furthermore, using SPMT to support and transport the segments, the construction site is clean and tidy with minimal pollution, as shown in Figure 16b. In conclusion, the demolition of Caitian Bridge is safe and efficient, achieving the goal of green, environmentally friendly, and rapid demolition.
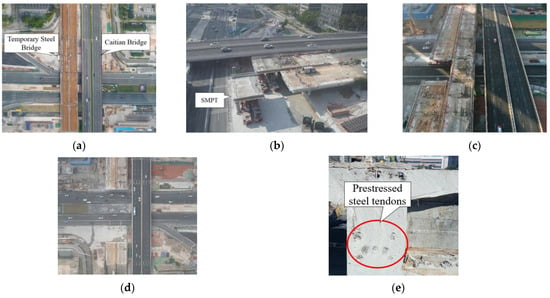 Figure 16. Demolition site of Caitian Bridge. (a) Original state of bridge; (b) SPMT transfers demolished segment; (c) bridge under working condition 3; (d) bridge under working condition 4; and (e) cross-section of the main girder after cutting.
5. Conclusions
- The green demolition scheme of “SPMT technology + large segment cutting” is adopted by qualitative and quantitative comparison, with the lowest carbon emissions. Based on the Life Cycle Assessment, compared to traditional methods, the proposed demolition scheme has the lowest carbon emissions during the demolition stage, which is about one-third of the carbon emissions from other schemes. Moreover, it has the advantages of having a small impact on the surrounding environment, safety and efficiency, and is more suitable for the demolition of existing urban bridges;
- A recommended value of 25% for long-term prestress loss of the Caitian Bridge is proposed, which is determined by a comparison of main calculation methods for long-term prestress loss. In addition, the long-term prestress loss needs to be considered in the simulation analysis of the demolition process of prestressed reinforced concrete, existing bridges;
- The calculated deformation value considering 25% long-term prestress loss, is in good agreement with the measured deformation value. The error is basically within 10% and a maximum of 14.7%, proving the reasonability of the suggested value. When long-term prestress loss is not considered, the error is generally more than twice.
- The practical demolition of Caitian Bridge with the scheme of “SPMT technology + large segment cutting” is completed safely, greenly and rapidly. The total time cost is 28 h, which is 4 h less than the deadline. During the demolition process, the impact on the traffic capacity of the main road was minimized to the greatest extent. The construction site was clean and tidy, with minimal pollution. The demolition scheme proposed in this paper can promote the development and application of SPMT and provide references for similar projects.
- The paper determines the long-term prestress loss by comparing the calculation methods of standards and the literature. Further work will mainly focus on the mechanism analysis of long-term prestress loss to improve the estimation accuracy.
Author Contributions
Methodology, S.L.; software, T.Z.; validation, W.H., S.L. and T.Z.; formal analysis, W.H. and S.L.; investigation, T.M. and Y.H.; resources, W.H.; data curation, S.L. and T.Z.; writing—original draft preparation, T.Z. and S.L.; writing—review and editing, W.H. and Y.H.; supervision, W.H.; project administration, T.M. and Y.H. All authors have read and agreed to the published version of the manuscript.
Funding
This research was funded by the Natural Science Foundation of Hunan Province, China, grant number 2019JJ40385; China Railway Erju Technology Plan, grant number ZTEJ-GXB (2019) 085.
Data Availability Statement
All data, models, and code generated or used during this study appear in the submitted article.
Conflicts of Interest
The authors declare no conflict of interest.
References
- IEA. CO2 Emissions in 2022. Available online: https://www.iea.org/reports/co2-emissions-in-2022 (accessed on 15 April 2023).
- Zhou, F.; Ning, Y.; Guo, X.; Guo, S. Analyze Differences in Carbon Emissions from Traditional and Prefabricated Buildings Combining the Life Cycle. Buildings 2023, 13, 874. [Google Scholar] [CrossRef]
- Rymsza, J. Causes of the Collapse of the Polcevera Viaduct in Genoa, Italy. Appl. Sci. 2021, 11, 8098. [Google Scholar] [CrossRef]
- Giresini, L.; Stochino, F.; Sassu, M. Economic vs environmental isocost and isoperformance curves for the seismic and energy improvement of buildings considering Life Cycle Assessment. Eng. Struct. 2021, 233, 13. [Google Scholar] [CrossRef]
- Liu, H.; Guo, R.; Tian, J.; Sun, H.; Wang, Y.; Li, H.; Yao, L. Quantifying the Carbon Reduction Potential of Recycling Construction Waste Based on Life Cycle Assessment: A Case of Jiangsu Province. Int. J. Environ. Res. Public Health 2022, 19, 12628. [Google Scholar] [CrossRef] [PubMed]
- Garber, D.B.; Gallardo, J.M.; Deschenes, D.J.; Bayrak, O. Experimental Investigation of Prestress Losses in Full-Scale Bridge Girders. ACI Struct. J. 2015, 112, 553–564. [Google Scholar] [CrossRef]
- Fu, M.Z.; Liang, Y.X.; Feng, Q.S.; Wu, B.T.; Tang, G.X. Research on the Application of Multi-Source Data Analysis for Bridge Safety Monitoring in the Reconstruction and Demolition Process. Buildings 2022, 12, 21. [Google Scholar] [CrossRef]
- Pereira, S.S.R.; Magalhaes, M.D.C.; Gazzinelli, H. An alternative technique to the demolition of a prestressed concrete box-girder bridge: A case study. Case Stud. Constr. Mater. 2017, 6, 192–197. [Google Scholar] [CrossRef]
- Chen, F.R. Application of Integral Modeling in Non-Blasting Demolition of Qingkou Interchange; Southwest Jiaotong University: Chengdu, China, 2017. [Google Scholar]
- Yi, H.B.; Yu, B. Analysis of collapse of Taihe Bridge during demolition. Bridge Constr. 2018, 48, 67–72. [Google Scholar]
- Pan, J.G. Monitoring and Reliability Analysis of T-Structure Demolition of Longqiao Dongjiang Bridge; South China University of Technology: Wushan, China, 2021. [Google Scholar]
- Yu, X.D.; Wang, H.H.; Jing, H.Q. Support position optimization with safety factor in the demolition and rebuilding of a bridge using the SPMT method: A case study. Adv. Struct. Eng. 2022, 25, 1701–1713. [Google Scholar] [CrossRef]
- Chen, J.Z.; Feng, P.C.; Yu, S.X. Design of steel tub girders and concrete slabs composite structure erected by SPMT rapid construction method. Bridge Constr. 2022, 52, 112–118. [Google Scholar]
- JTG D60-2015; General Specifications for Design of Highway Bridges and Culverts. China Communication Press: Beijing, China, 2015.
- GB/T 51366-2019; Standard of Building Carbon Emission Calculation. Ministry of Housing and Urban-Rural Development: Beijing, China, 2019.
- Institute, W.R. World Greenhouse Gas Emissions: 2019. Available online: https://www.wri.org/ (accessed on 15 April 2023).
- Yang, Y.M.; Tang, H.; Mao, Y.; Wang, X.Z. Prediction of Long-Term Prestress Loss and Crack Resistance Analysis of Corroded Prestressed Concrete Box-Girder Bridges. Adv. Civ. Eng. 2022, 2022, 16. [Google Scholar] [CrossRef]
- Garber, D.B.; Gallardo, J.M.; Deschenes, D.J.; Bayrak, O. Prestress Loss Database for Pretensioned Concrete Members. ACI Struct. J. 2016, 113, 313–324. [Google Scholar] [CrossRef]
- Bonopera, M.; Chang, K.C. Novel method for identifying residual prestress force in simply supported concrete girder-bridges. Adv. Struct. Eng. 2021, 24, 3238–3251. [Google Scholar] [CrossRef]
- Pelle, A.; Briseghella, B.; Bergami, A.V.; Fiorentino, G.; Giaccu, G.F.; Lavorato, D.; Quaranta, G.; Rasulo, A.; Nuti, C. Time-dependent cyclic behavior of reinforced concrete bridge columns under chlorides-induced corrosion and rebars buckling. Struct. Concr. 2022, 23, 81–103. [Google Scholar] [CrossRef]
- Lavorato, D.; Fiorentino, G.; Pelle, A.; Rasulo, A.; Bergami, A.V.; Briseghella, B.; Nuti, C. A corrosion model for the interpretation of cyclic behavior of reinforced concrete sections. Struct. Concr. 2020, 21, 1732–1746. [Google Scholar] [CrossRef]
- EN 1992-1-1; Eurcode2: Design of Concrete Structures. CEN: Brussels, Belgium, 2004.
- AASHTO; LRFD Bridge Design Specification. American Association of State Highway and Transportations: Washington, DC, USA, 2020.
- CSA S6; Canadian Highway Bridge Design Code. Canadian Standard Association: Toronto, ON, Canada, 2019.
- AS 3600-2001; Australian Standard Concrete Structures. Australia International Ltd.: Sydney, NS, Canada, 2018.
- JTG 3362-2018; Specifications for Design of Highway Reinforced Concrete and Prestressed Concrete Bridges and Culverts. MOT (Ministry of Transport of the People’s Republic of China): Beijing, China, 2018.
- Zhou, Y.Q.; Lv, Z.T. Calculation of long-term prestress losses. J. Southeast Univ. 1997, 27, 5. [Google Scholar]
- Paez, P.M. A simplified approach to determine the prestress loss and time-dependent deflection in cracked prestressed concrete members, prestressed with fiber reinforced polymers or steel tendons. Eng. Struct. 2023, 279, 11. [Google Scholar] [CrossRef]
- Zhang, H.; Guo, Q.Q.; Xu, L.Y. Prediction of long-term prestress loss for prestressed concrete cylinder structures using machine learning. Eng. Struct. 2023, 279, 15. [Google Scholar] [CrossRef]
- Preston, H.K. Recommendations for Estimating Prestress Losses. PCI J. 1975, 18, 43–75. [Google Scholar]
- ACI 435R-95; Control of Deflection in Concrete Structures. ACI Committee: Farmington Hills, MI, USA, 1995.
Disclaimer/Publisher’s Note: The statements, opinions and data contained in all publications are solely those of the individual author(s) and contributor(s) and not of MDPI and/or the editor(s). MDPI and/or the editor(s) disclaim responsibility for any injury to people or property resulting from any ideas, methods, instructions or products referred to in the content. |
© 2023 by the authors. Licensee MDPI, Basel, Switzerland. This article is an open access article distributed under the terms and conditions of the Creative Commons Attribution (CC BY) license (https://creativecommons.org/licenses/by/4.0/).