Article

Comparison of Numerical Strategies for Historic Elevated Water Tanks: Modal Analysis of a 50-Year-Old Structure in Italy

Department of Engineering and Architecture, University of Trieste, 34127 Trieste, Italy
*
Author to whom correspondence should be addressed.
Buildings 2023, 13(6), 1414; https://doi.org/10.3390/buildings13061414
Submission received: 11 May 2023 / Revised: 26 May 2023 / Accepted: 29 May 2023 / Published: 30 May 2023

Abstract

:
The seismic vulnerability assessment of existing structures is a well-known challenging task, due to a combination of several aspects. The use of analytical or finite element (FE) numerical models can offer robust support in this analysis but necessitates the accurate calibration of geometrical and mechanical input, with related uncertainties. In this paper, attention is focused on the identification of dynamic parameters, based on modal numerical analysis, of a 50-year-old, reinforced concrete, elevated water tank (EWT) characterised by a reservoir with a truncated cone shape. The structure is located in a high seismic region of northern Italy and presently necessitates retrofit plans to preserve its functionality. Based on the limited available experimental evidence and technical drawings, major efforts are spent for the numerical prediction of fundamental vibration modes and frequencies of the structure, which represent a first key step for seismic analyses, under various water-filling levels. To this aim, four different FE numerical strategies able to include both structural features and possible fluid–structure interaction (FSI) effects are developed. By progressively increasing the computational cost (and expected the accuracy of the solutions), FE models based on added-mass (M0 model), spring-mass (M1-DM or M1-DS models), or acoustic (M2 model) strategies are taken into account and combined with increasing detailing in geometrical description of the structure. Results from parametric modal analyses are discussed for the case-study EWT, in terms of computational cost, possible numerical limitations, accuracy of predicted frequencies/modal shapes, sensitivity to water-filling levels and operational configurations, with the support of several pieces of experimental evidence and consolidated analytical formulations for fundamental frequency estimations.

1. Introduction

In engineering practice, elevated water tanks (EWTs) represent strategic structural systems and are often characterised by complex structural behaviours under extreme design actions such as seismic events [1]. Especially for old/heritage EWTs, major challenges are represented by their reliable vulnerability assessment and residual capacity quantification, which represent tasks of primary importance for structures located in earthquake-prone regions and for retrofit interventions [2,3]. To this aim, experimental data from in-field inspections can efficiently support the detection of material properties, structural dynamic parameters, and even possible damage/issues [4]. In addition, robust experimental evidence for old/heritage elevated water tanks is limited in number or even restricted to a few selected case-study systems, which are often characterised by specific structural features [2,5]. As such, a multitude of numerical methods can be used in support of structural diagnostics and seismic vulnerability assessment purposes [6,7,8]. Numerical methods and optimisation procedures can be extremely efficient, especially for the design of new EWTs [9,10].
In most cases, in daily practice, structural analyses are based on simple and computationally advantageous formulations, such as single degrees of freedom (SDOF) or equivalent spring-mass modelling strategies, which are able to capture the most important dynamic features and behaviours for a given tank [11,12]. Whilst computationally efficient, however, spring-mass based modelling strategies are also recognised to have basic intrinsic limits compared to more detailed finite element (FE) numerical procedures. The choice can be thus moved to more elaborate FE assemblies in which the majority of components are included. On the other hand, when there is a greater number of elements, components, and interactions, there is also a greater number of possible intrinsic uncertainties which could affect numerical estimates and should possibly be addressed towards experimental evidence [4]. In general, especially for complex systems, geometrical details and restraints can strongly modify global and local structural behaviours [13]. For existing/historic EWTs, a combination of aspects should be addressed, namely: (i) the typical intrinsic uncertainties of mechanical features/phenomena of heritage structures; (ii) the possible lack of supporting technical documents, drawings, or even experiments to minimise uncertainties on materials and geometries; and (iii) the combination of fluid–structure interaction (FSI) phenomena, which can be responsible for severe variations in structural dynamic parameters [14,15,16,17,18,19], as a function of water-filling levels. According to design standards, see for example the ACI 371R-98 document for the analysis of tanks [20], when the distance between the roof of a container and the free liquid surface is larger than 2% of the container height, sloshing phenomena cannot be disregarded, and more sophisticated modelling strategies are necessarily required in place of simplified SDOF models.
In this paper, several modelling strategies are taken into account and compared for the modal analysis of a 50-year-old, reinforced concrete, EWT with a truncated cone container. The examined structure represents a typical water tank, among those constructed in northern Italy in the 1970s, and presently requires detailed investigations for seismic vulnerability assessment, to preserve its functionality in its rather high-seismicity location. The use of four different modelling strategies is assessed in this paper in terms of numerical prediction of fundamental vibration modes and frequencies, with respect to a several background experimental frequencies [21] and consolidated theoretical formulations from the literature, based on Housner’s theory [11,12,22,23]. Under various water-filling level configurations, FE models based on added-mass (M0 model), spring-mass (M1-DM or M1-DS), or even acoustic (M2) modelling strategies are taken into account to possibly describe FSI phenomena and include increasing detailing in the geometrical description of the structure. To this aim, the examined case-study structure is first described in Section 2, while the available background inspections are briefly recalled in Section 3 and the selected FE modelling strategies are described in Section 4.
Parametric numerical results are discussed in Section 5, with evidence of modal analysis outcomes for the EWT with empty or progressively water-filled container. As shown, model accuracy and reliability are of high importance for structural assessment purposes, in the same way as computational efficiency. In addition, engineering knowledge of dynamic parameters for similar structures is of primary importance to reproduce and address loading configurations of technical interest for vulnerability assessment and to support possible retrofit design (where required). The availability of experimental feedback, in this regard, represents a key condition to further support model accuracy judgment, but necessitates a robust description of both vibration frequencies and corresponding shapes (Section 5.1). Numerical modal analysis outcomes are first addressed in Section 5.1 for the EWT with an empty container, and the impact of structural geometrical simplifications are discussed. For the EWT with a variable water-filling level, as shown, even major sensitivity is observed in terms of predicted vibration frequencies (Section 5.2) and shapes (Section 5.3). In this regard, simple theoretical formulations from the literature can capture the fundamental vibration frequency of water-filled EWTs, see Section 5.2, but can offer only partial support in the analysis of such complex historic systems which are characterised by uncertain interpretation and calibration.

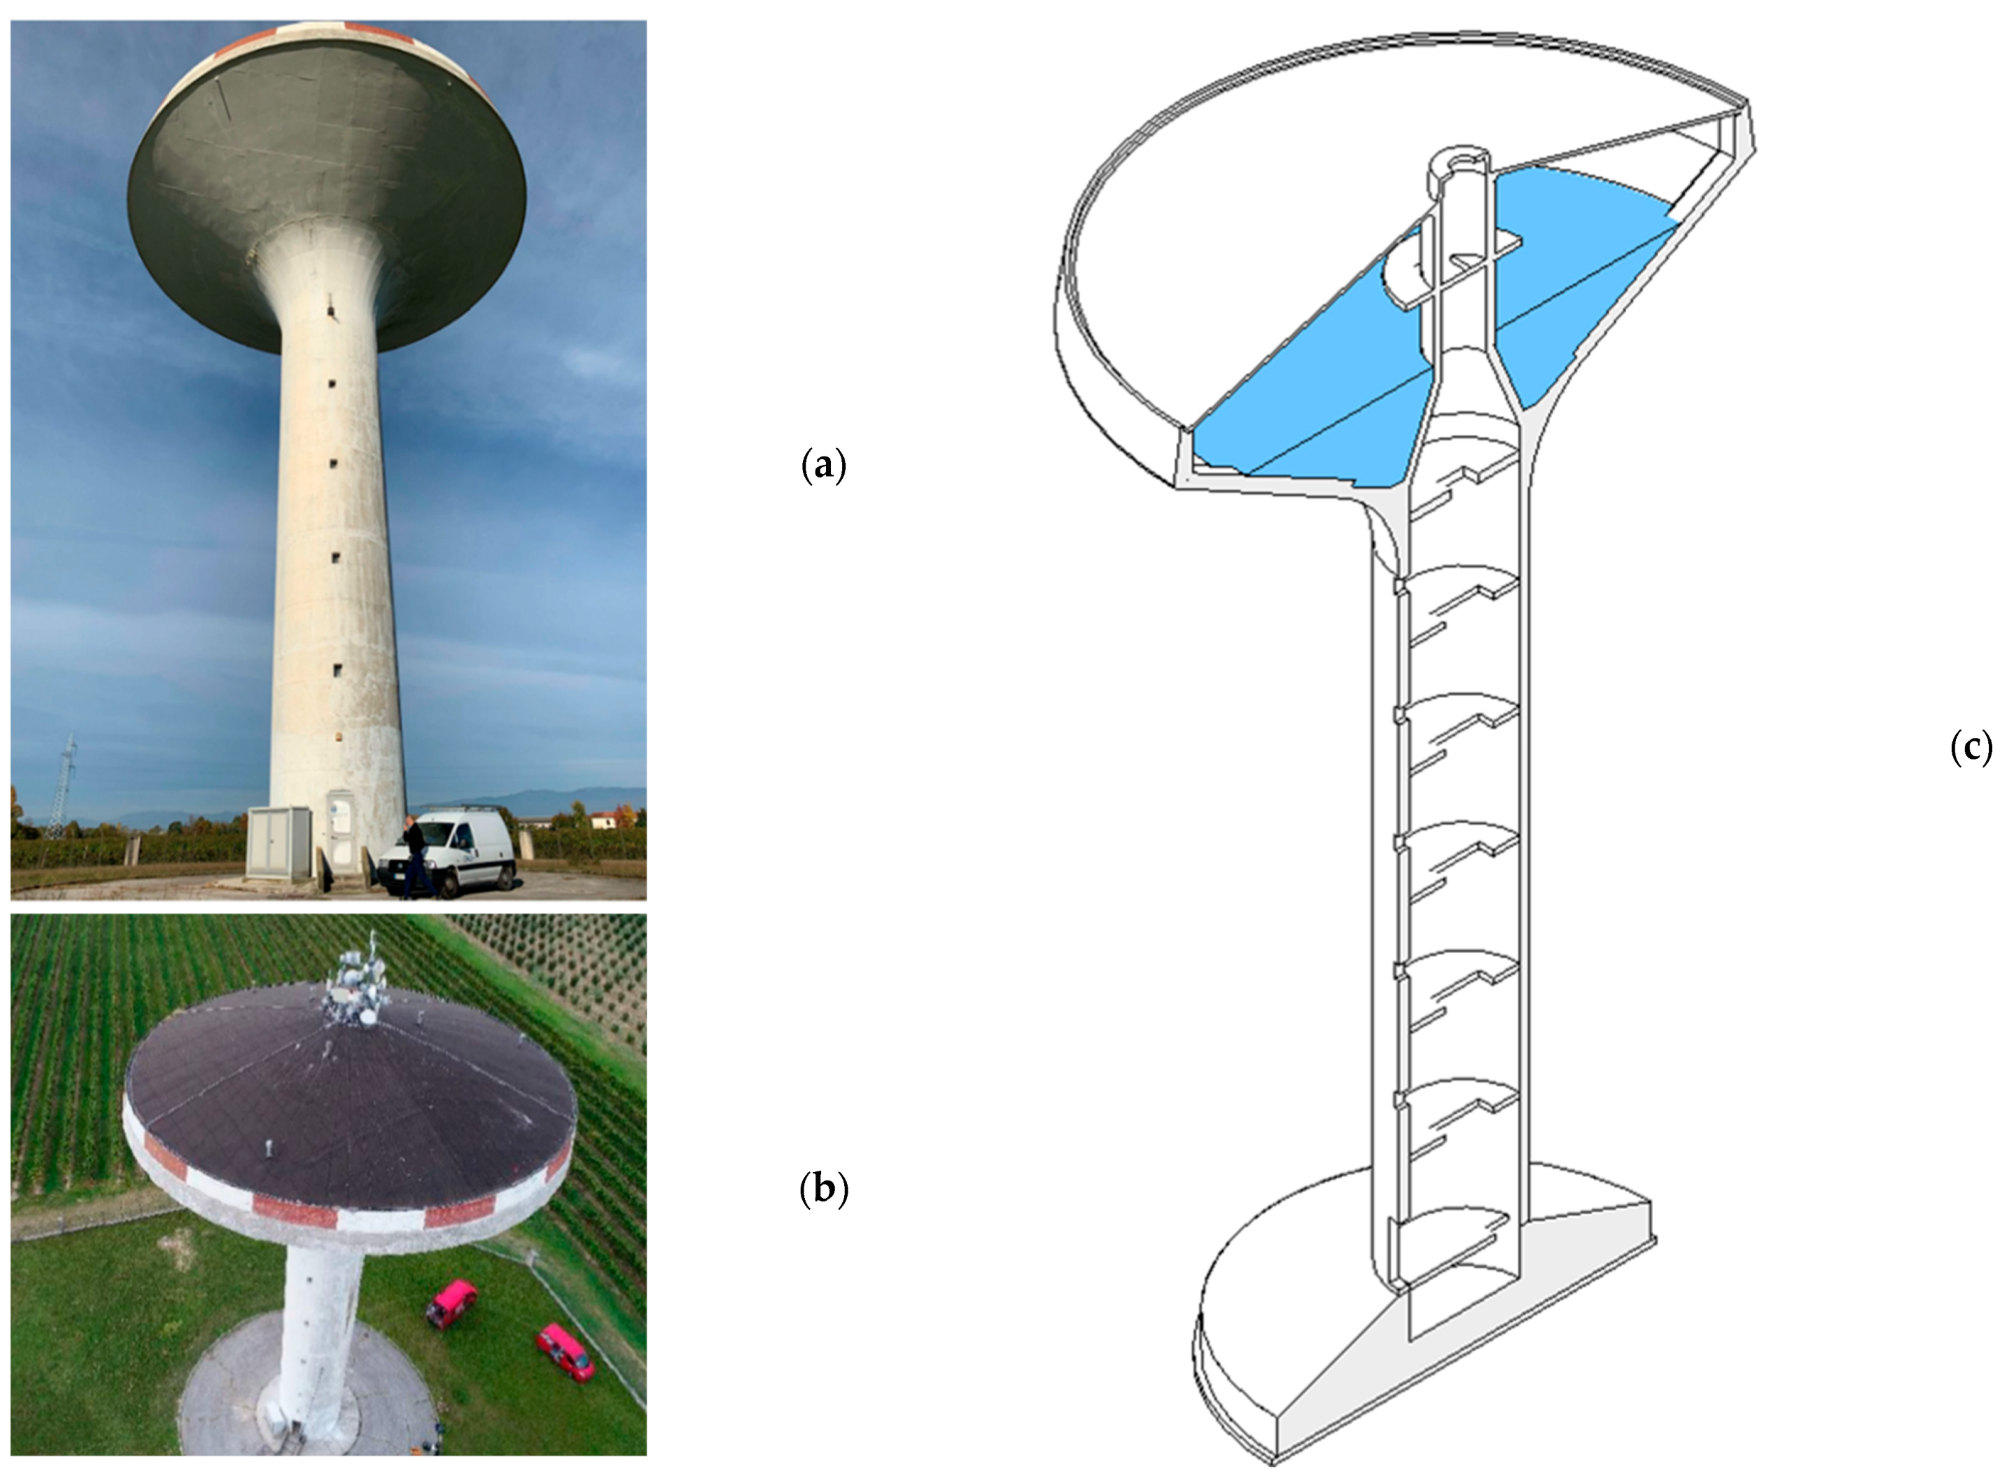
2. Case-Study Structural System

The structural system object of study, in accordance with the topological definitions proposed in [2], can be described as a mushroom-type structure. The EWT is located in Brische village, in the Municipality of Meduna of Livenza (Treviso), Veneto Region (Italy). The structural system was originally built in the 1970s and subjected, only in 2022 [21], to several dedicated on-site investigations in support of preliminary seismic vulnerability assessment considerations (see Section 3). The structure object of study is shown in Figure 1. Based on geophysical parameters [24], in terms of seismic characterisation, the soil category can be classified as type C, with topographic category T1.
In structural terms, the tank consists of a cylindrical shank, with a truncated cone container on top. The shank is made of cast in situ reinforced concrete (its strength class is C40/45) and is characterised by 4.7 m in external diameter and a thickness of 35 cm. It spans over 23.5 m in elevation (its foundation level from ground is 0.8 m). The shank is also characterised by a door opening at the base (1 m in width and 2 m in height) and by rigid diaphragms on the elevation of the structure (Figure 1c). The top container, with a total volume capacity of Vw = 800 m3, measures 20 m in maximum external diameter and 4.7 m in bottom diameter (the same of stem). It is covered by a truncated cone roof made of precast concrete and characterised by 12 cm in thickness. The overall height of the structure (from the ground) is equal to 33.9 m, and the container is installed at a height of 25.15 m from ground. Under maximum filling conditions (full tank with Vw = 800 m3, see Figure 1c), water free surface reaches a level of 30 m from ground. The stem, with reduced diameter, extends to the top of roof and crosses the container, thus affecting the motion of water during vibrations. At ground level, the structure is sustained by a foundation system made of a circular reinforced concrete slab (13.6 m in diameter) which is supported by twelve 40 m long (1 m in diameter) precast concrete drilled piles. The stem is characterised by structural mass Mstem = 273 tons, while the empty container is associated with Mtank = 652 tons, for a total mass in empty conditions of Me = 925 tons.

3. Background Experimental Investigation

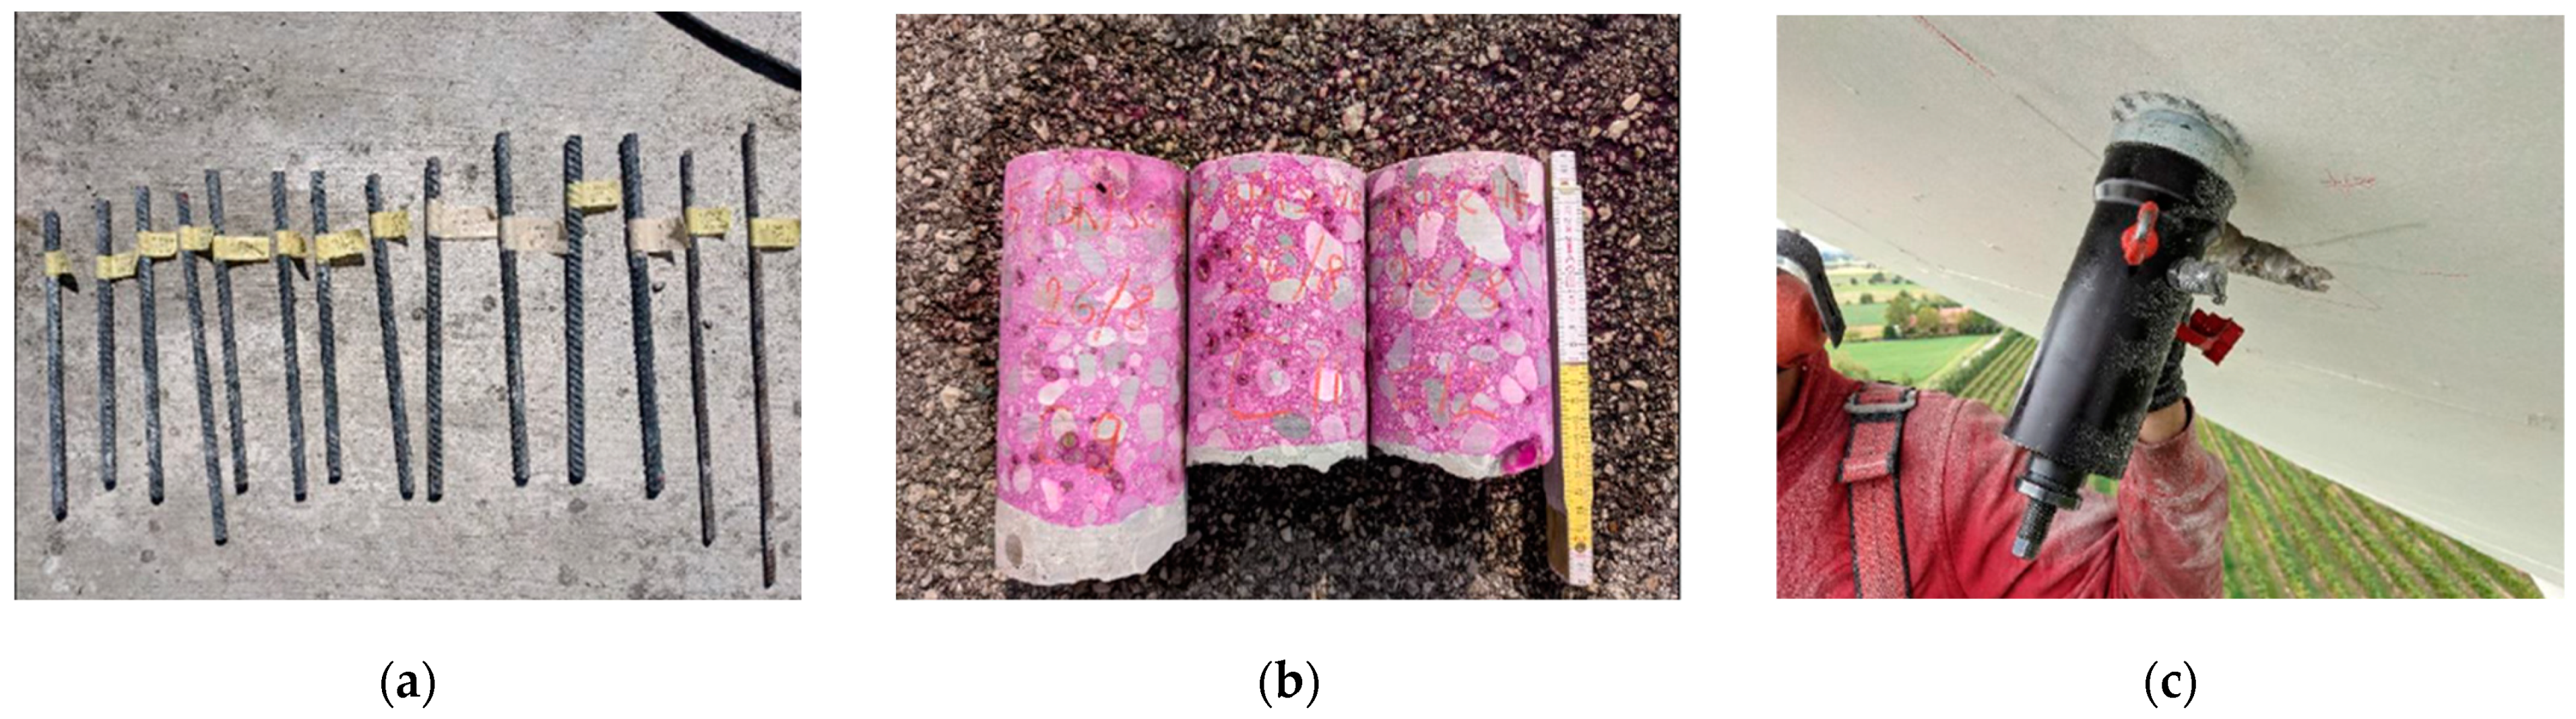
3.1. Characterisation of Material Properties

During 2022, the examined EWT had been the object of various on-site investigations aimed at a first mechanical characterisation of the constituent materials and basic dynamic parameters [21]. The experimental analysis summarised in [21] was carried out by a private company, and partial results from [21] were successively used in the present study for comparative purposes only. Attention was preliminarily given to the inspection of steel and concrete samples (Figure 2).
Accordingly, the investigation included a set of local inspections and micro-demolitions (in order to detect the number, the diameter, and the position of steel rebars and stirrups) such as the acquisition of small-scale steel and cast in situ concrete samples (for the estimation of steel mechanical properties (Figure 2a) and concrete strength in compression), calorimetric tests (for carbonation assessment, see Figure 2b), and ultrasonic and sclerometer measurements (for concrete compressive strength, see Figure 2c). For the mechanical characterisation of material properties, a number of samples were extracted from different levels of the shank. Both direct (core drilled samples based on EN 12504-1 [25]) and indirect “SonReb” tests (EN 12504-2 [26], EN 12504-4 [27]) were carried out on concrete.
For the present numerical investigation, relevant geometrical details can be found in Table 1. Average properties are reported in Table 2 in terms of yielding and ultimate strength for steel (fy and fu) and compressive strength for concrete (fc).

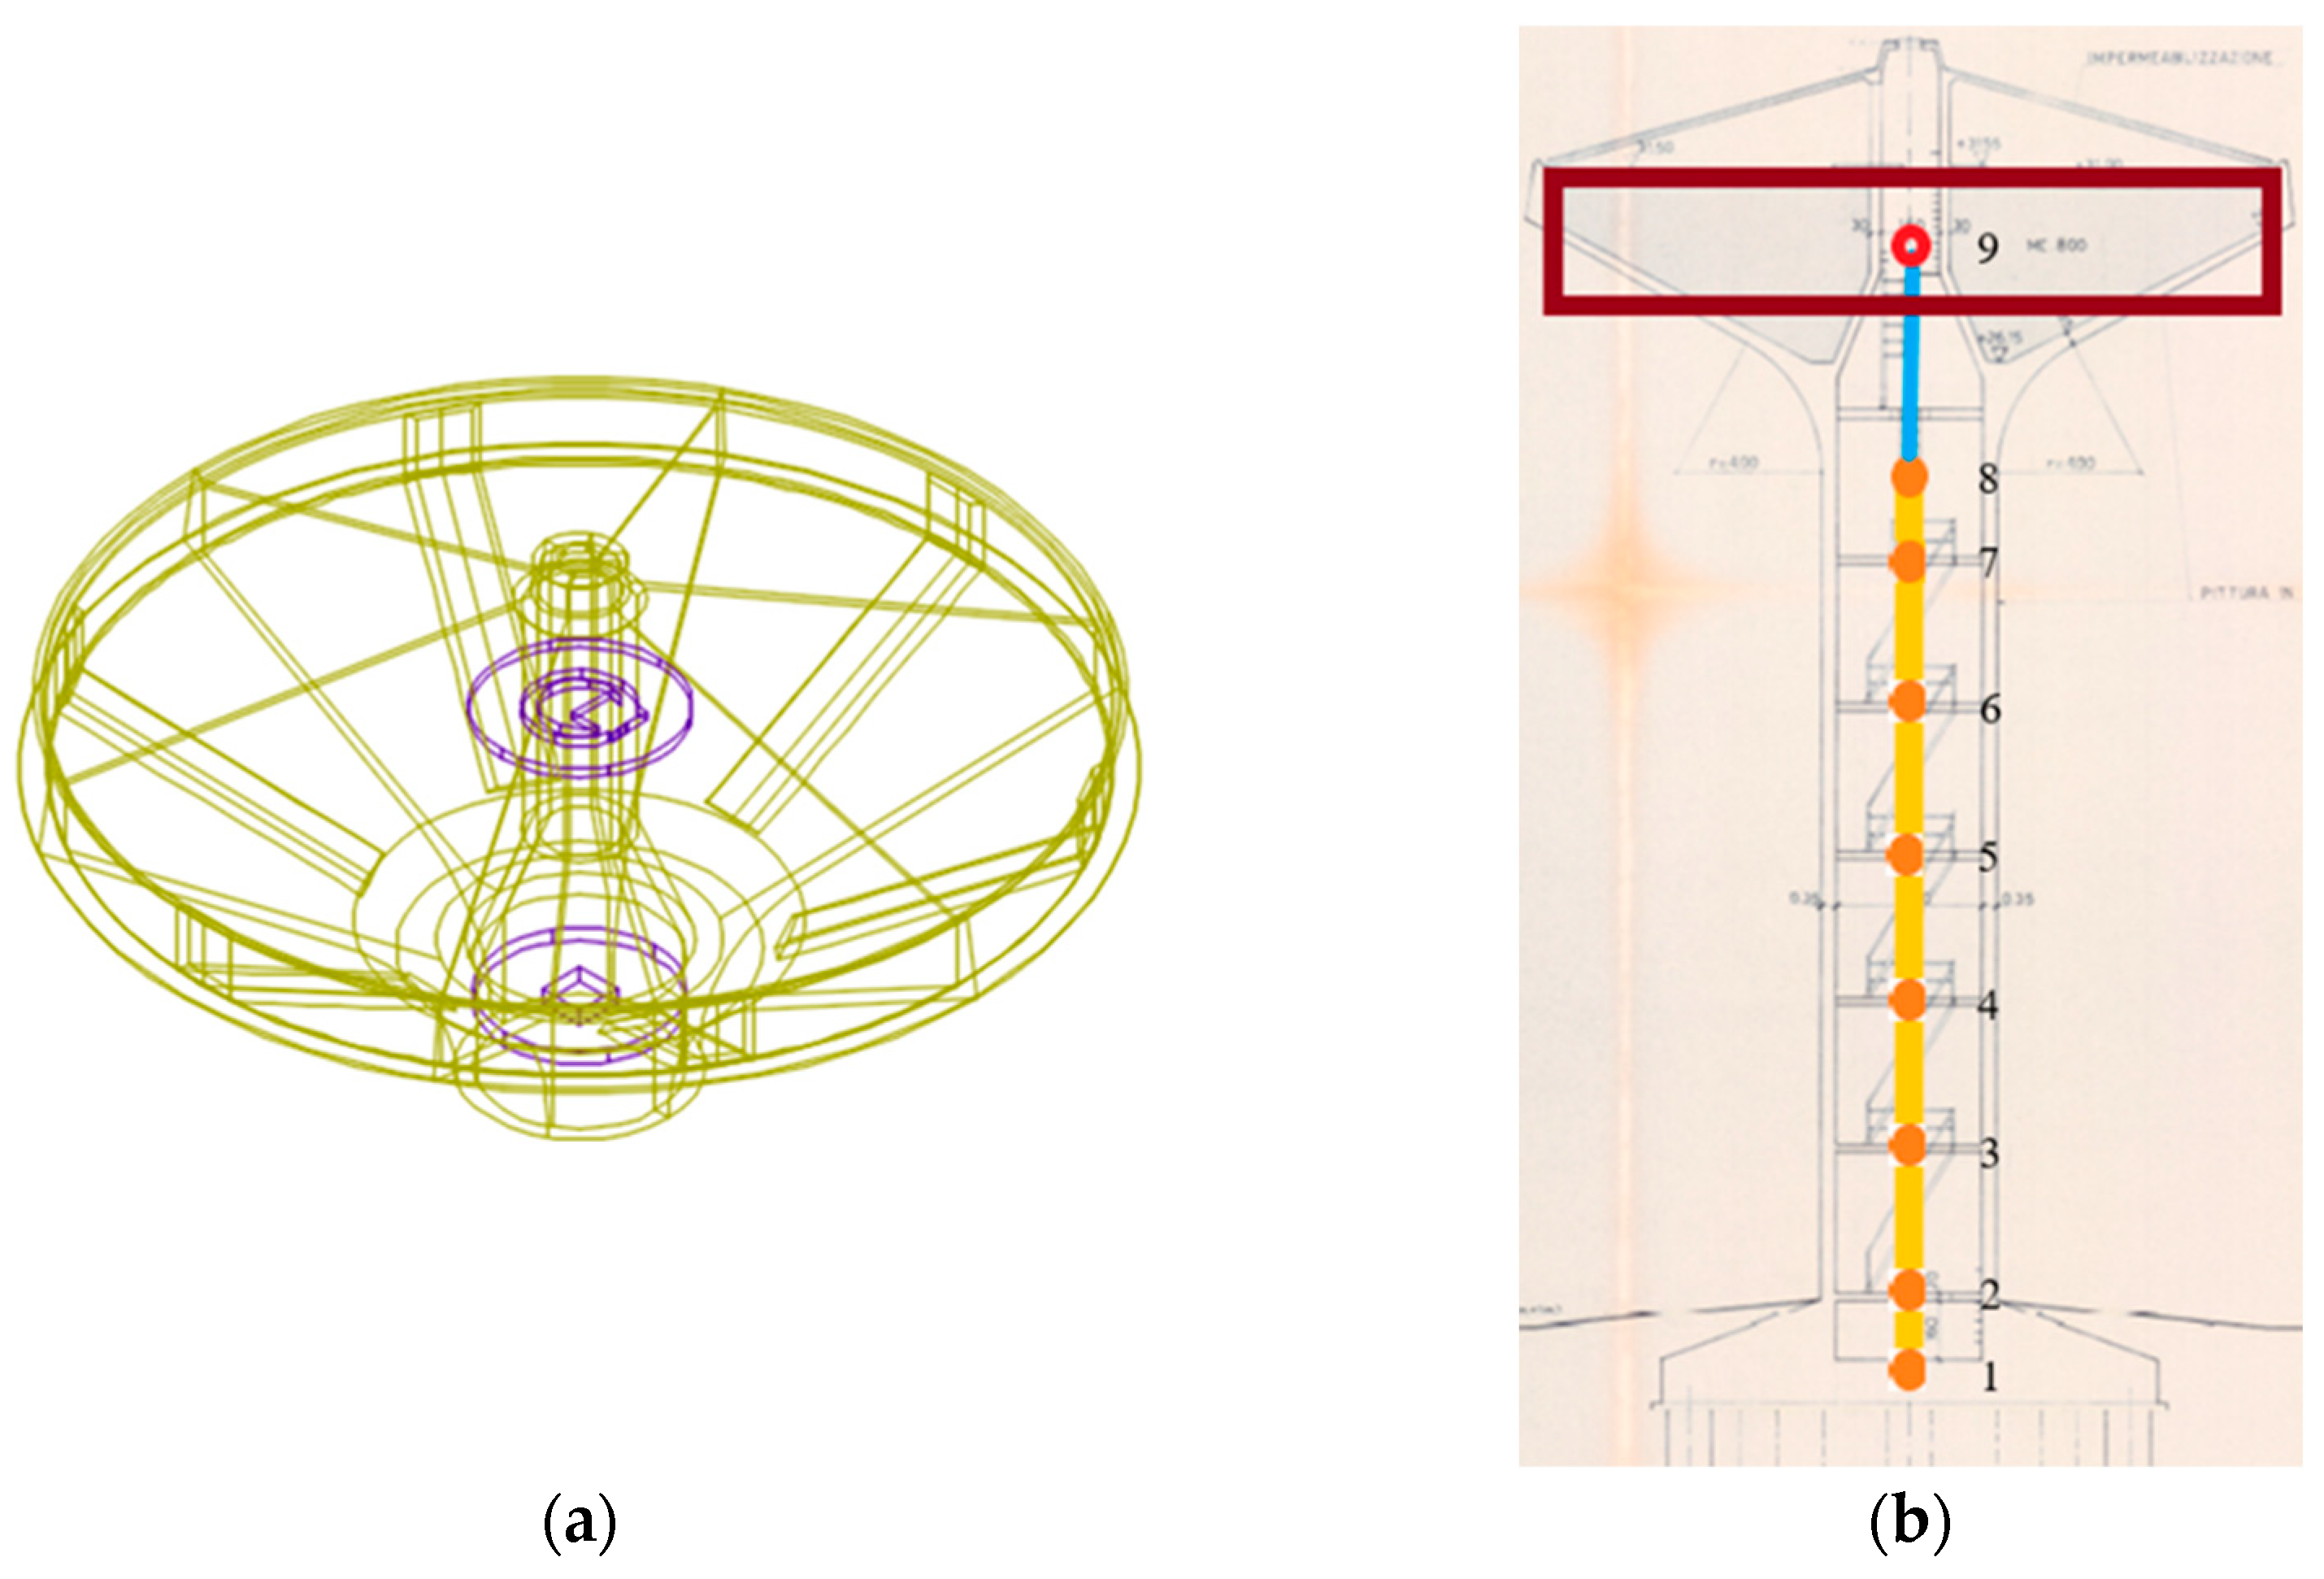
3.2. Vibration Tests

In the same period of material characterisation tests (Section 3.1), a set of vibration experiments was also carried out on the examined EWT, aiming at the detection and quantification of fundamental vibration periods. Experimental modal analysis (EMA) techniques were adopted to predict the low vibration frequencies of the system [21].
More precisely, the shank was subjected to an external force (10 tons, based on the use of tensile ropes and a 32-ton truck, see Figure 3) and then monitored under free-decay vibrations by means of a total number of four triaxial accelerometers. The sensors were installed on the elevation of the structure (up to the base of container). The analysis of experimental records was carried out in the frequency domain.
In order to achieve a more exhaustive dynamic characterisation of the EWT system, two different operational configurations were taken into account for testing, namely representing:
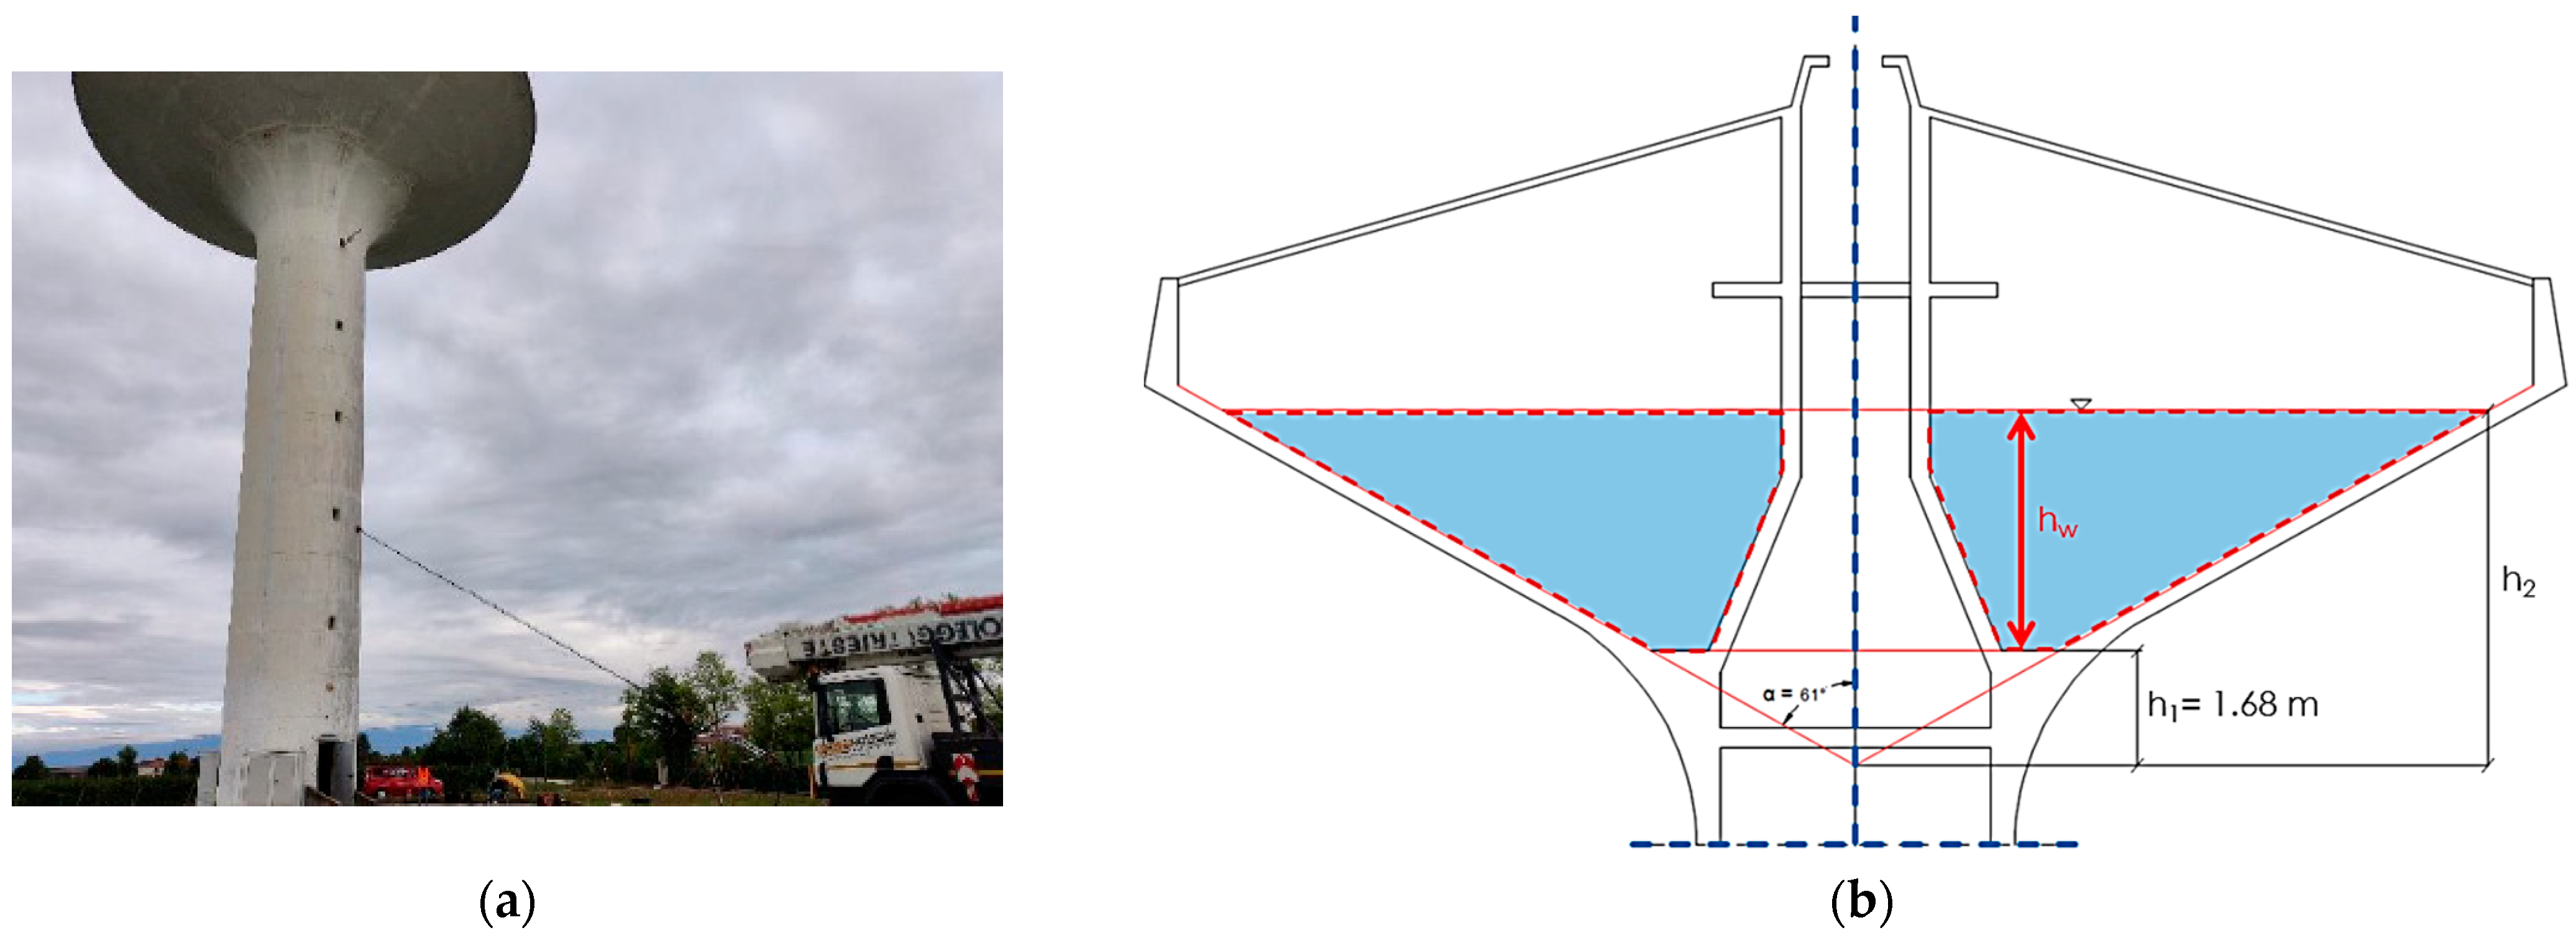
  • the container in an empty condition (i.e., with Vw = 59 m3 of water, corresponding to hw = 1.37 m of free water surface in the container, “MCW0” in the following) or
  • the half-full container (“MCW50” with Vw = 423 m3 and hw = 3.53 m).
Technical details about tank filling are also schematised in Figure 3b. Major vibration outcomes from the experimental investigation reported in [21] are of primary interest for numerical modelling assessment and are summarised in Table 3.
A first-mode frequency corresponding to sloshing (“S1” in Table 3) was detected from the experimental analysis and is significantly lower than the structural vibration frequencies of the system. From a structural point of view, the first three modes were experimentally detected and classified in the 1st flexural mode, a second purely torsional vibration mode, and thirdly, a 2nd flexural mode of the system. It can be seen from Table 3 that the vibration frequency—as expected—decreases with water-filling increase for the 1st and 2nd flexural modes only, which are the most sensitive (especially the lower one) to container configuration. This sensitivity was experimentally quantified in the order of ≈8–10%. For the second structural vibration frequency (torsional mode), as also expected, a rather negligible variation was indeed experimentally observed against water infill, see Table 3.

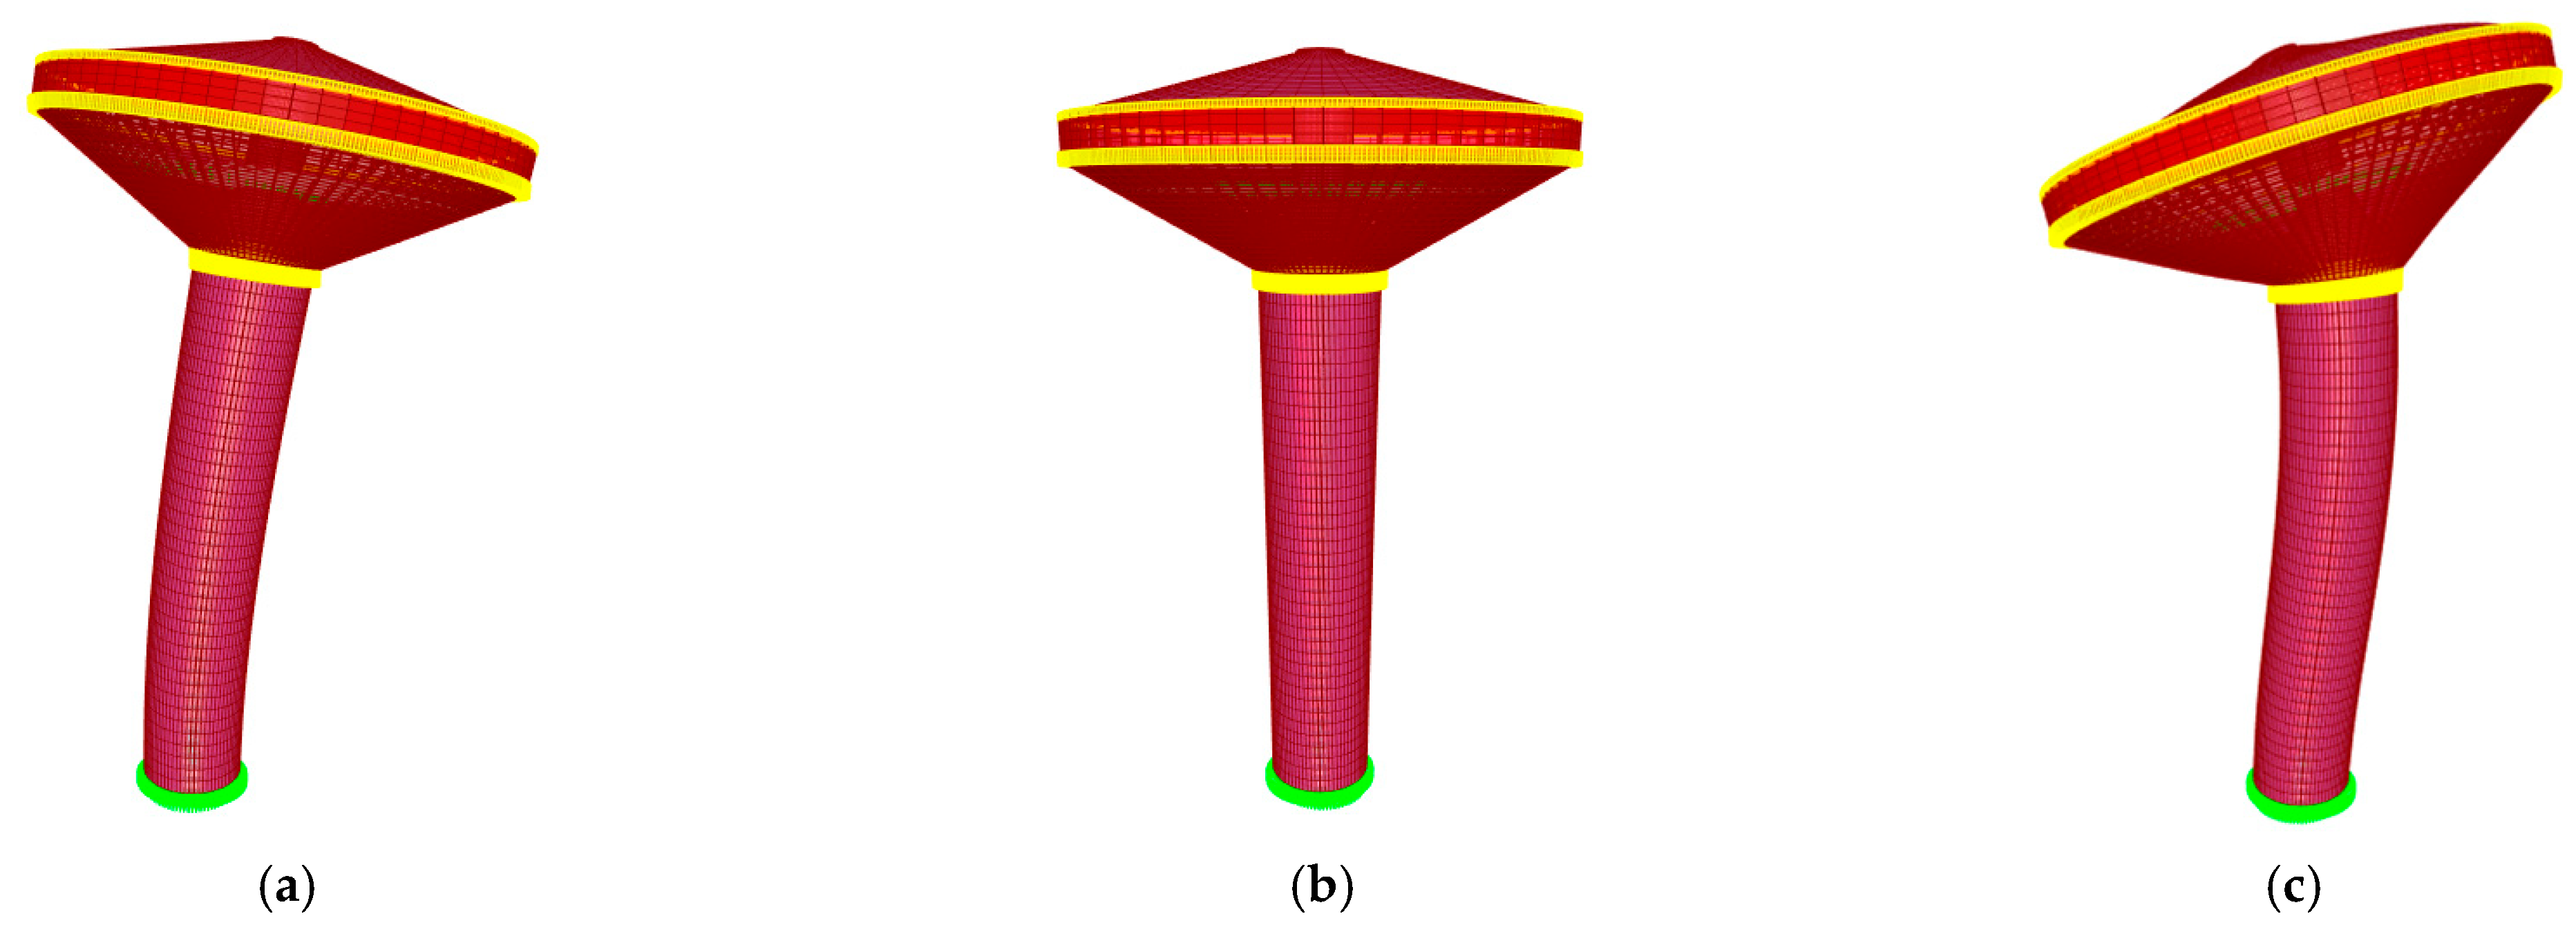
4. Present Numerical Investigation

Different modelling strategies (up to four different approaches) were taken into account in this paper, to assess the dynamic response and parameters of the examined EWT under various water-filling conditions.
Overall, the modelling strategy included a progressive increase in the detailing of geometrical features of the structure and FSI phenomena. Basically, a first “M0” assembly was first developed to study the structural response only (empty container). It is noteworthy that such a rough model, see Section 4.1, was considered for preliminary assessment only, in addition to several pieces of background experimental evidence summarised in Section 3. “M1-DM” and “M1-DS” were partially more refined and were successively elaborated to account for FSI phenomena and additional geometrical details of the structure, see Section 4.2. Finally, an acoustic-based strategy was implemented in the “M2” model, with even more details on the structural side. The investigation on M0, M1-DM, and M1-DS models was carried out in SAP2000 software [28], while ABAQUS software [29] was used for the M2 strategy.
For comparative purposes, basic features of the developed FE models are summarised in Table 4 and are discussed in further detail in the following sections.
It is interesting to note that, regardless of the modelling refinement in Table 4, based on the material characterisation summarised in Section 3 [21], cast in situ concrete was described as linear elastic, with Ec = 34.077 GPa, νc = 0.2, and ρc = 2500 kg/m3 being the modulus of elasticity, Poisson ratio, and density, respectively. Steel rebars and stirrups were disregarded. In case of precast concrete (container), the elastic modulus was set equal to Ec = 35.225 GPa. Moreover, based on experimental evidence, the shank was rigidly clamped at the base in all the FE models.

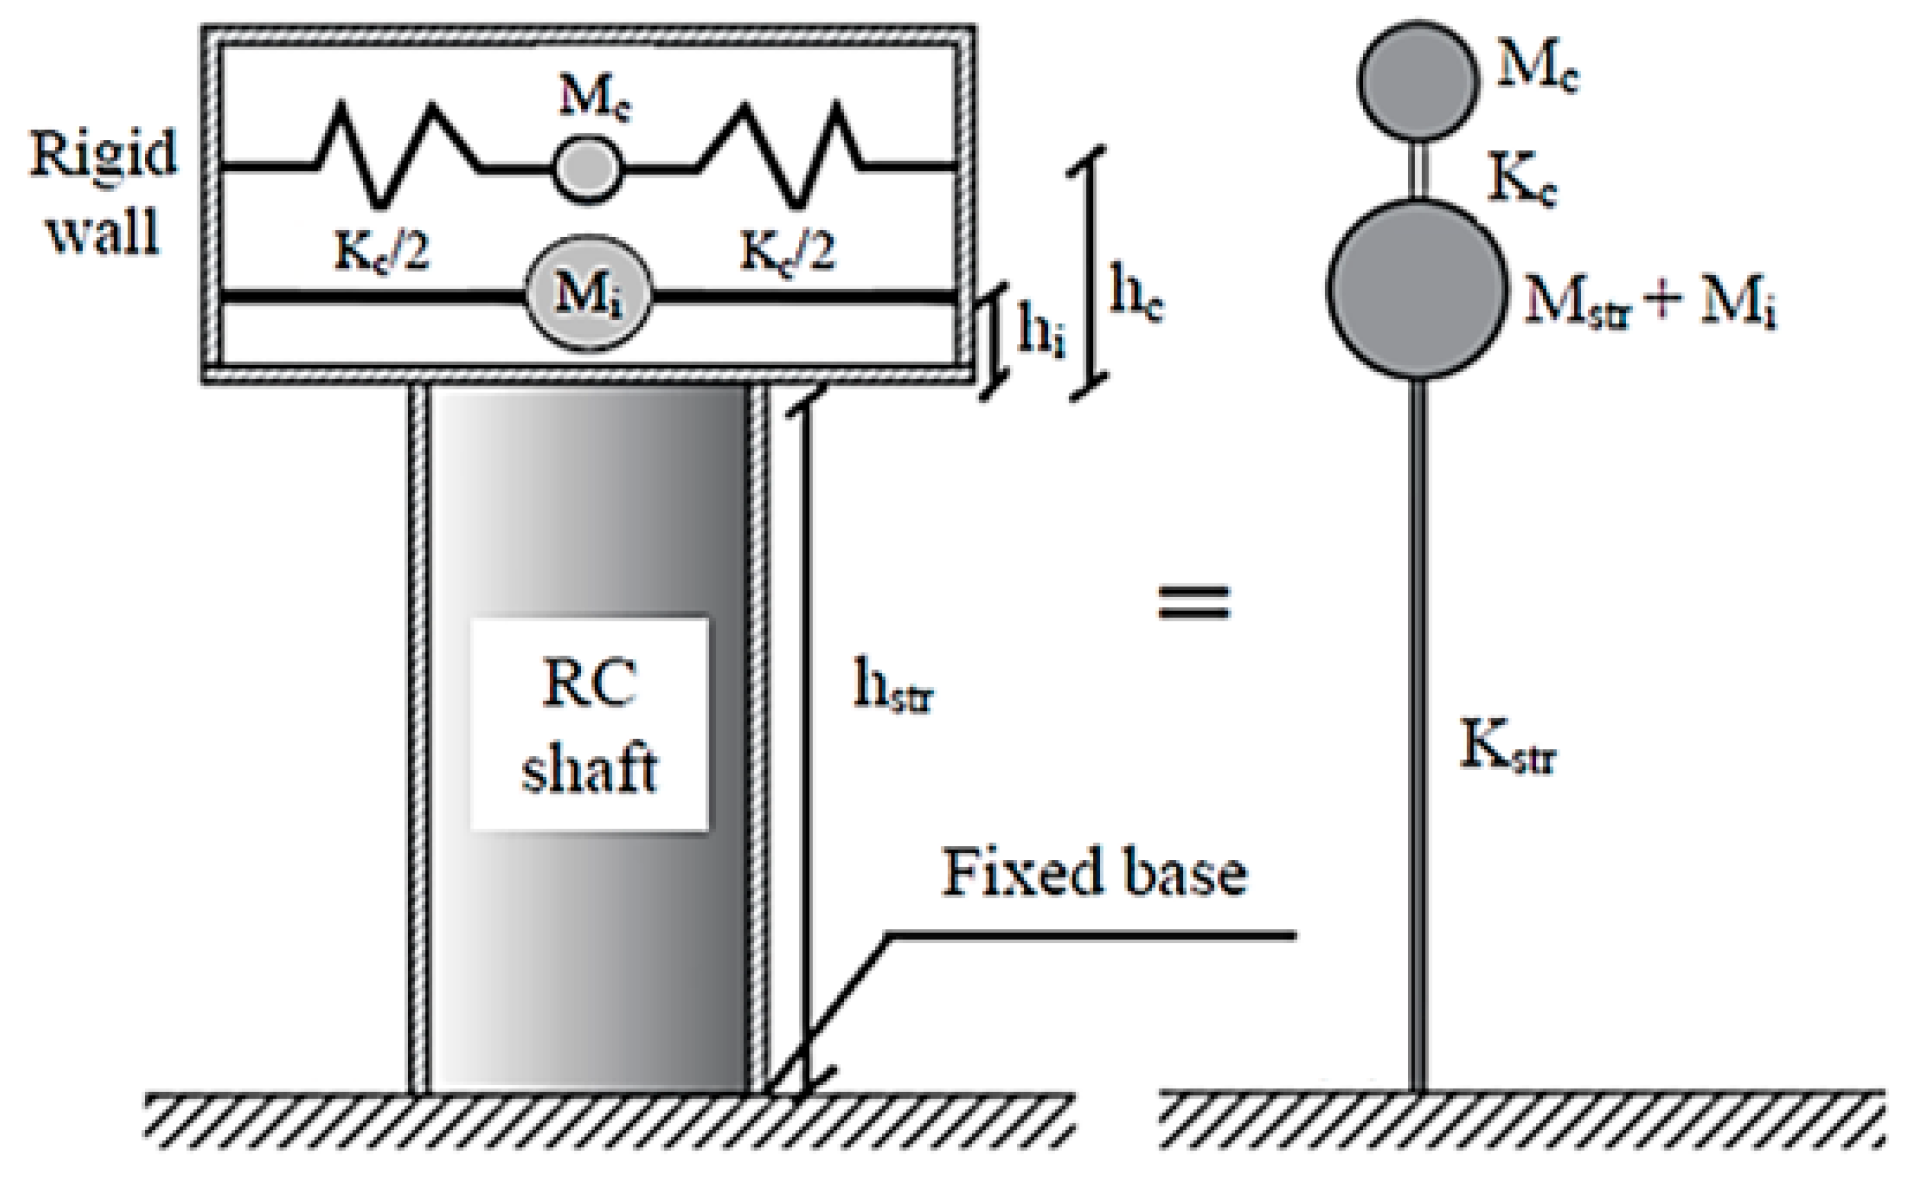
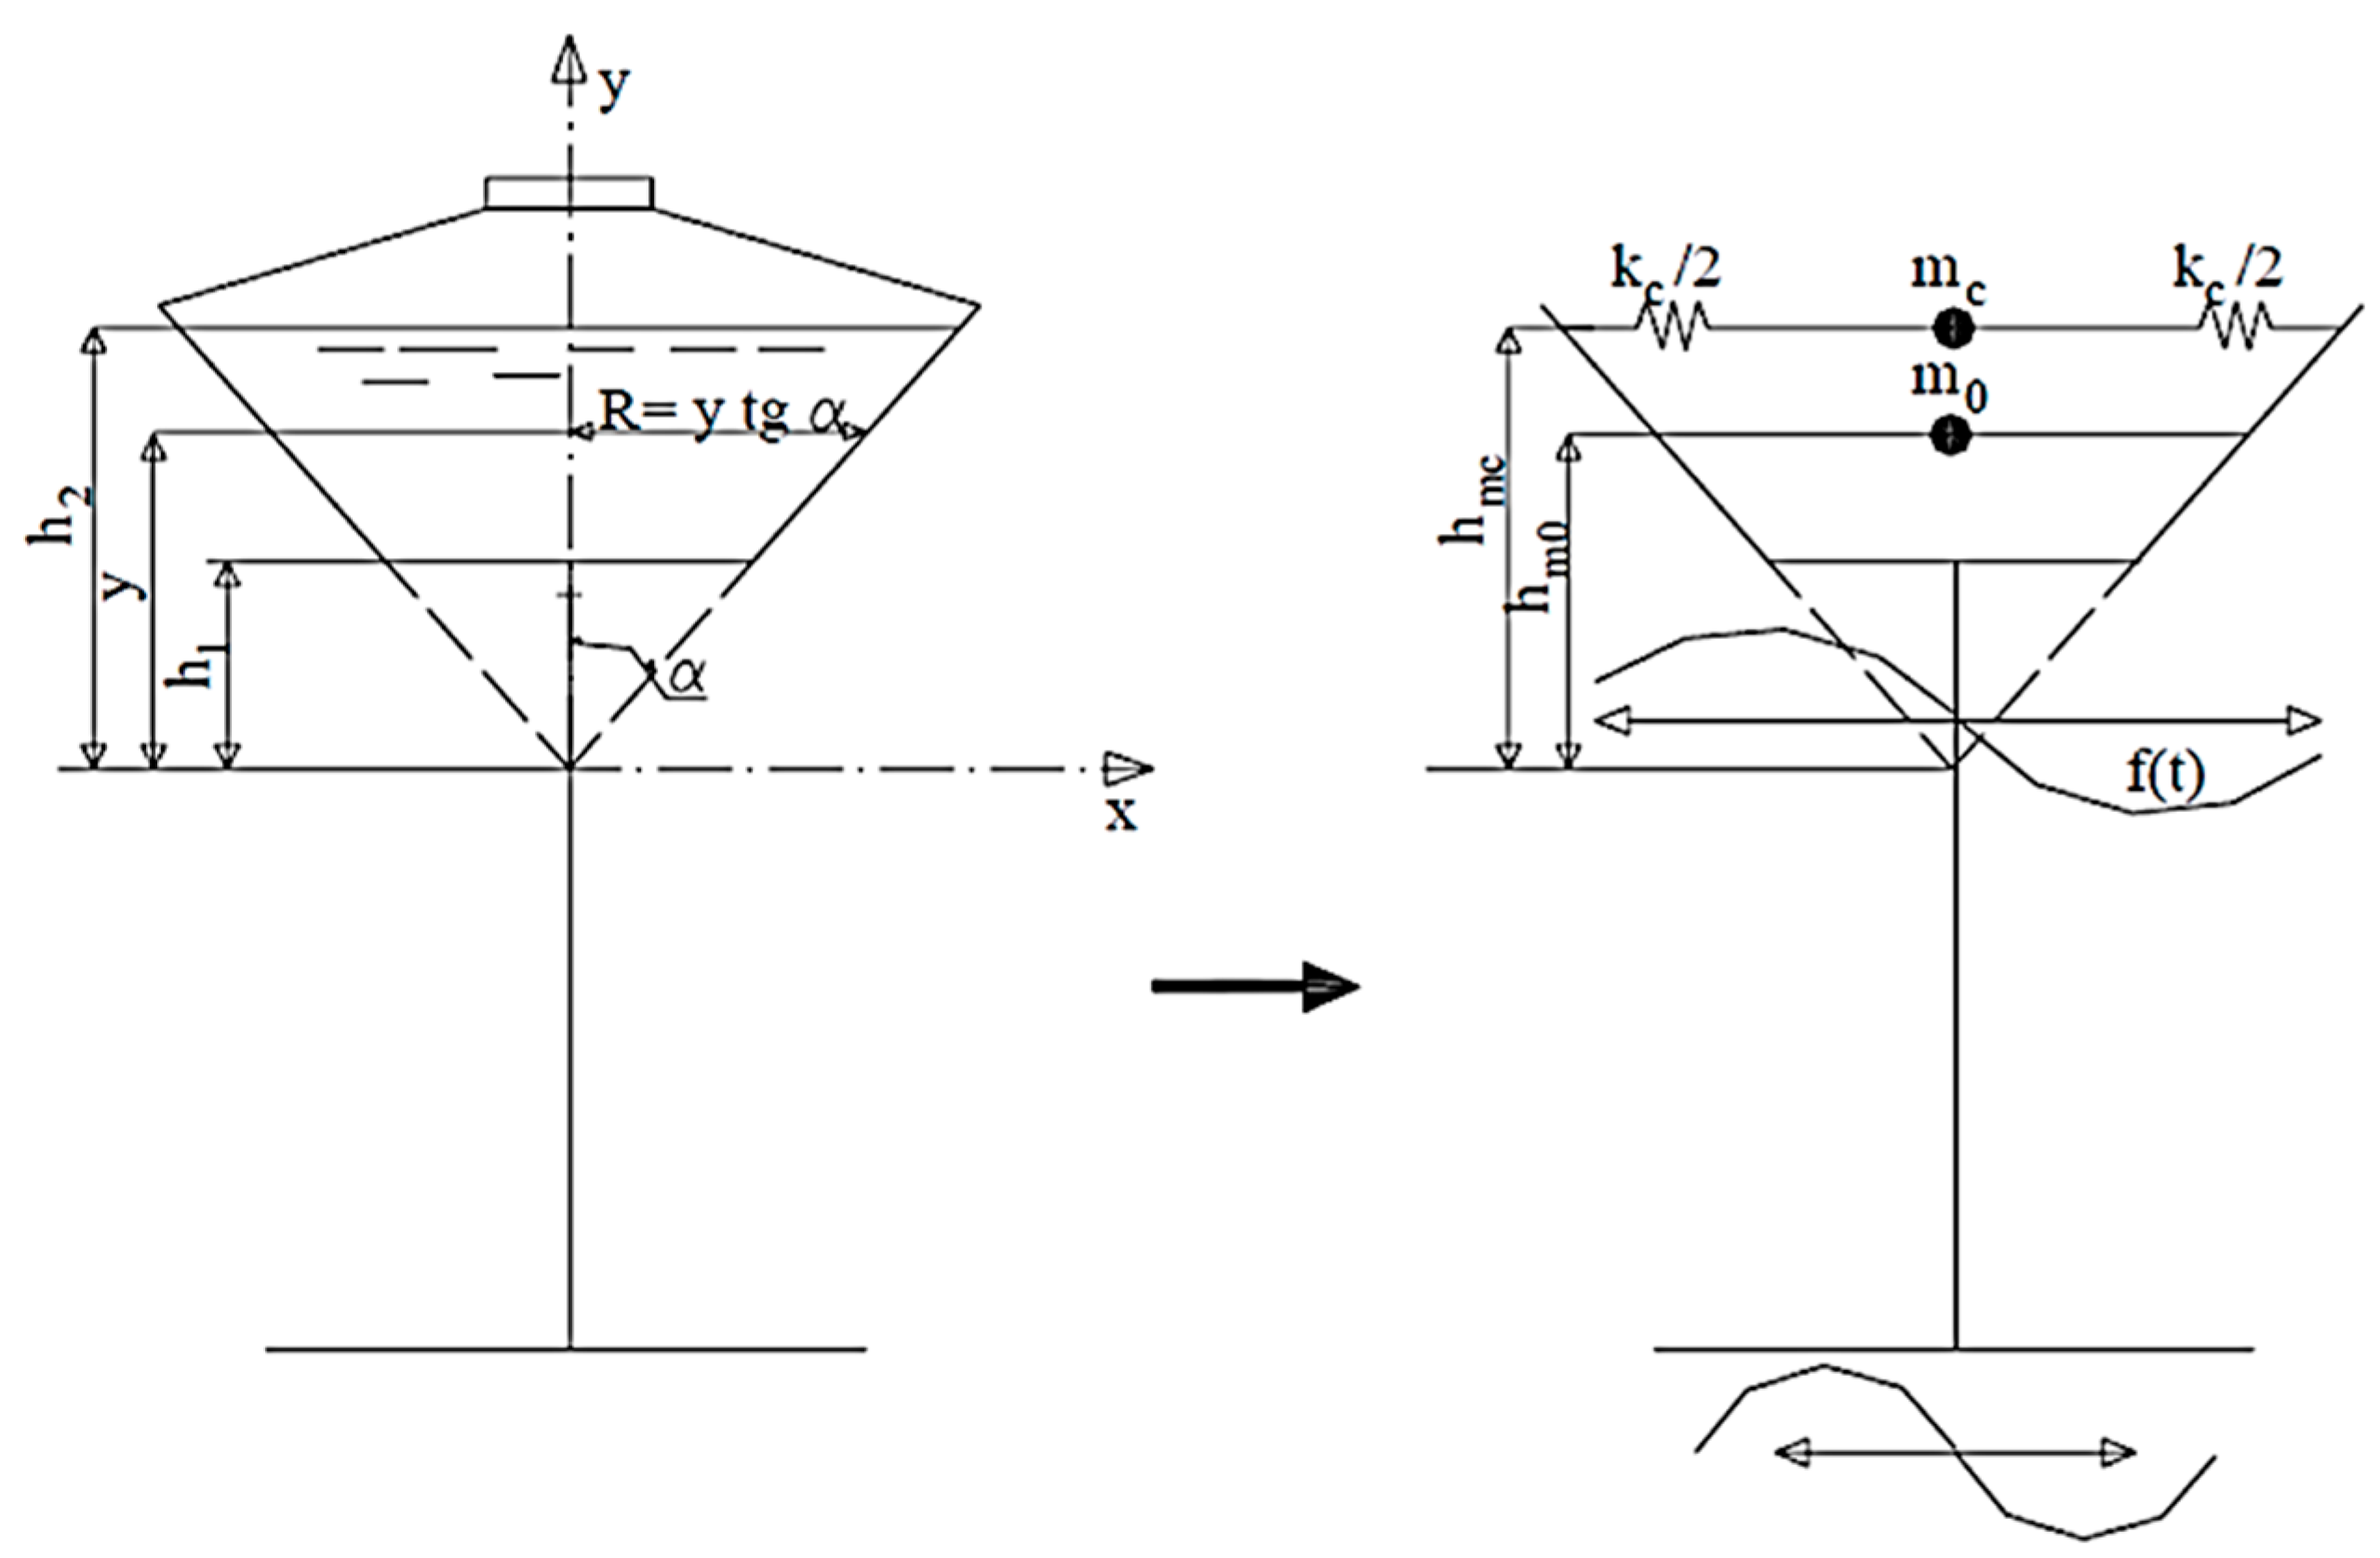
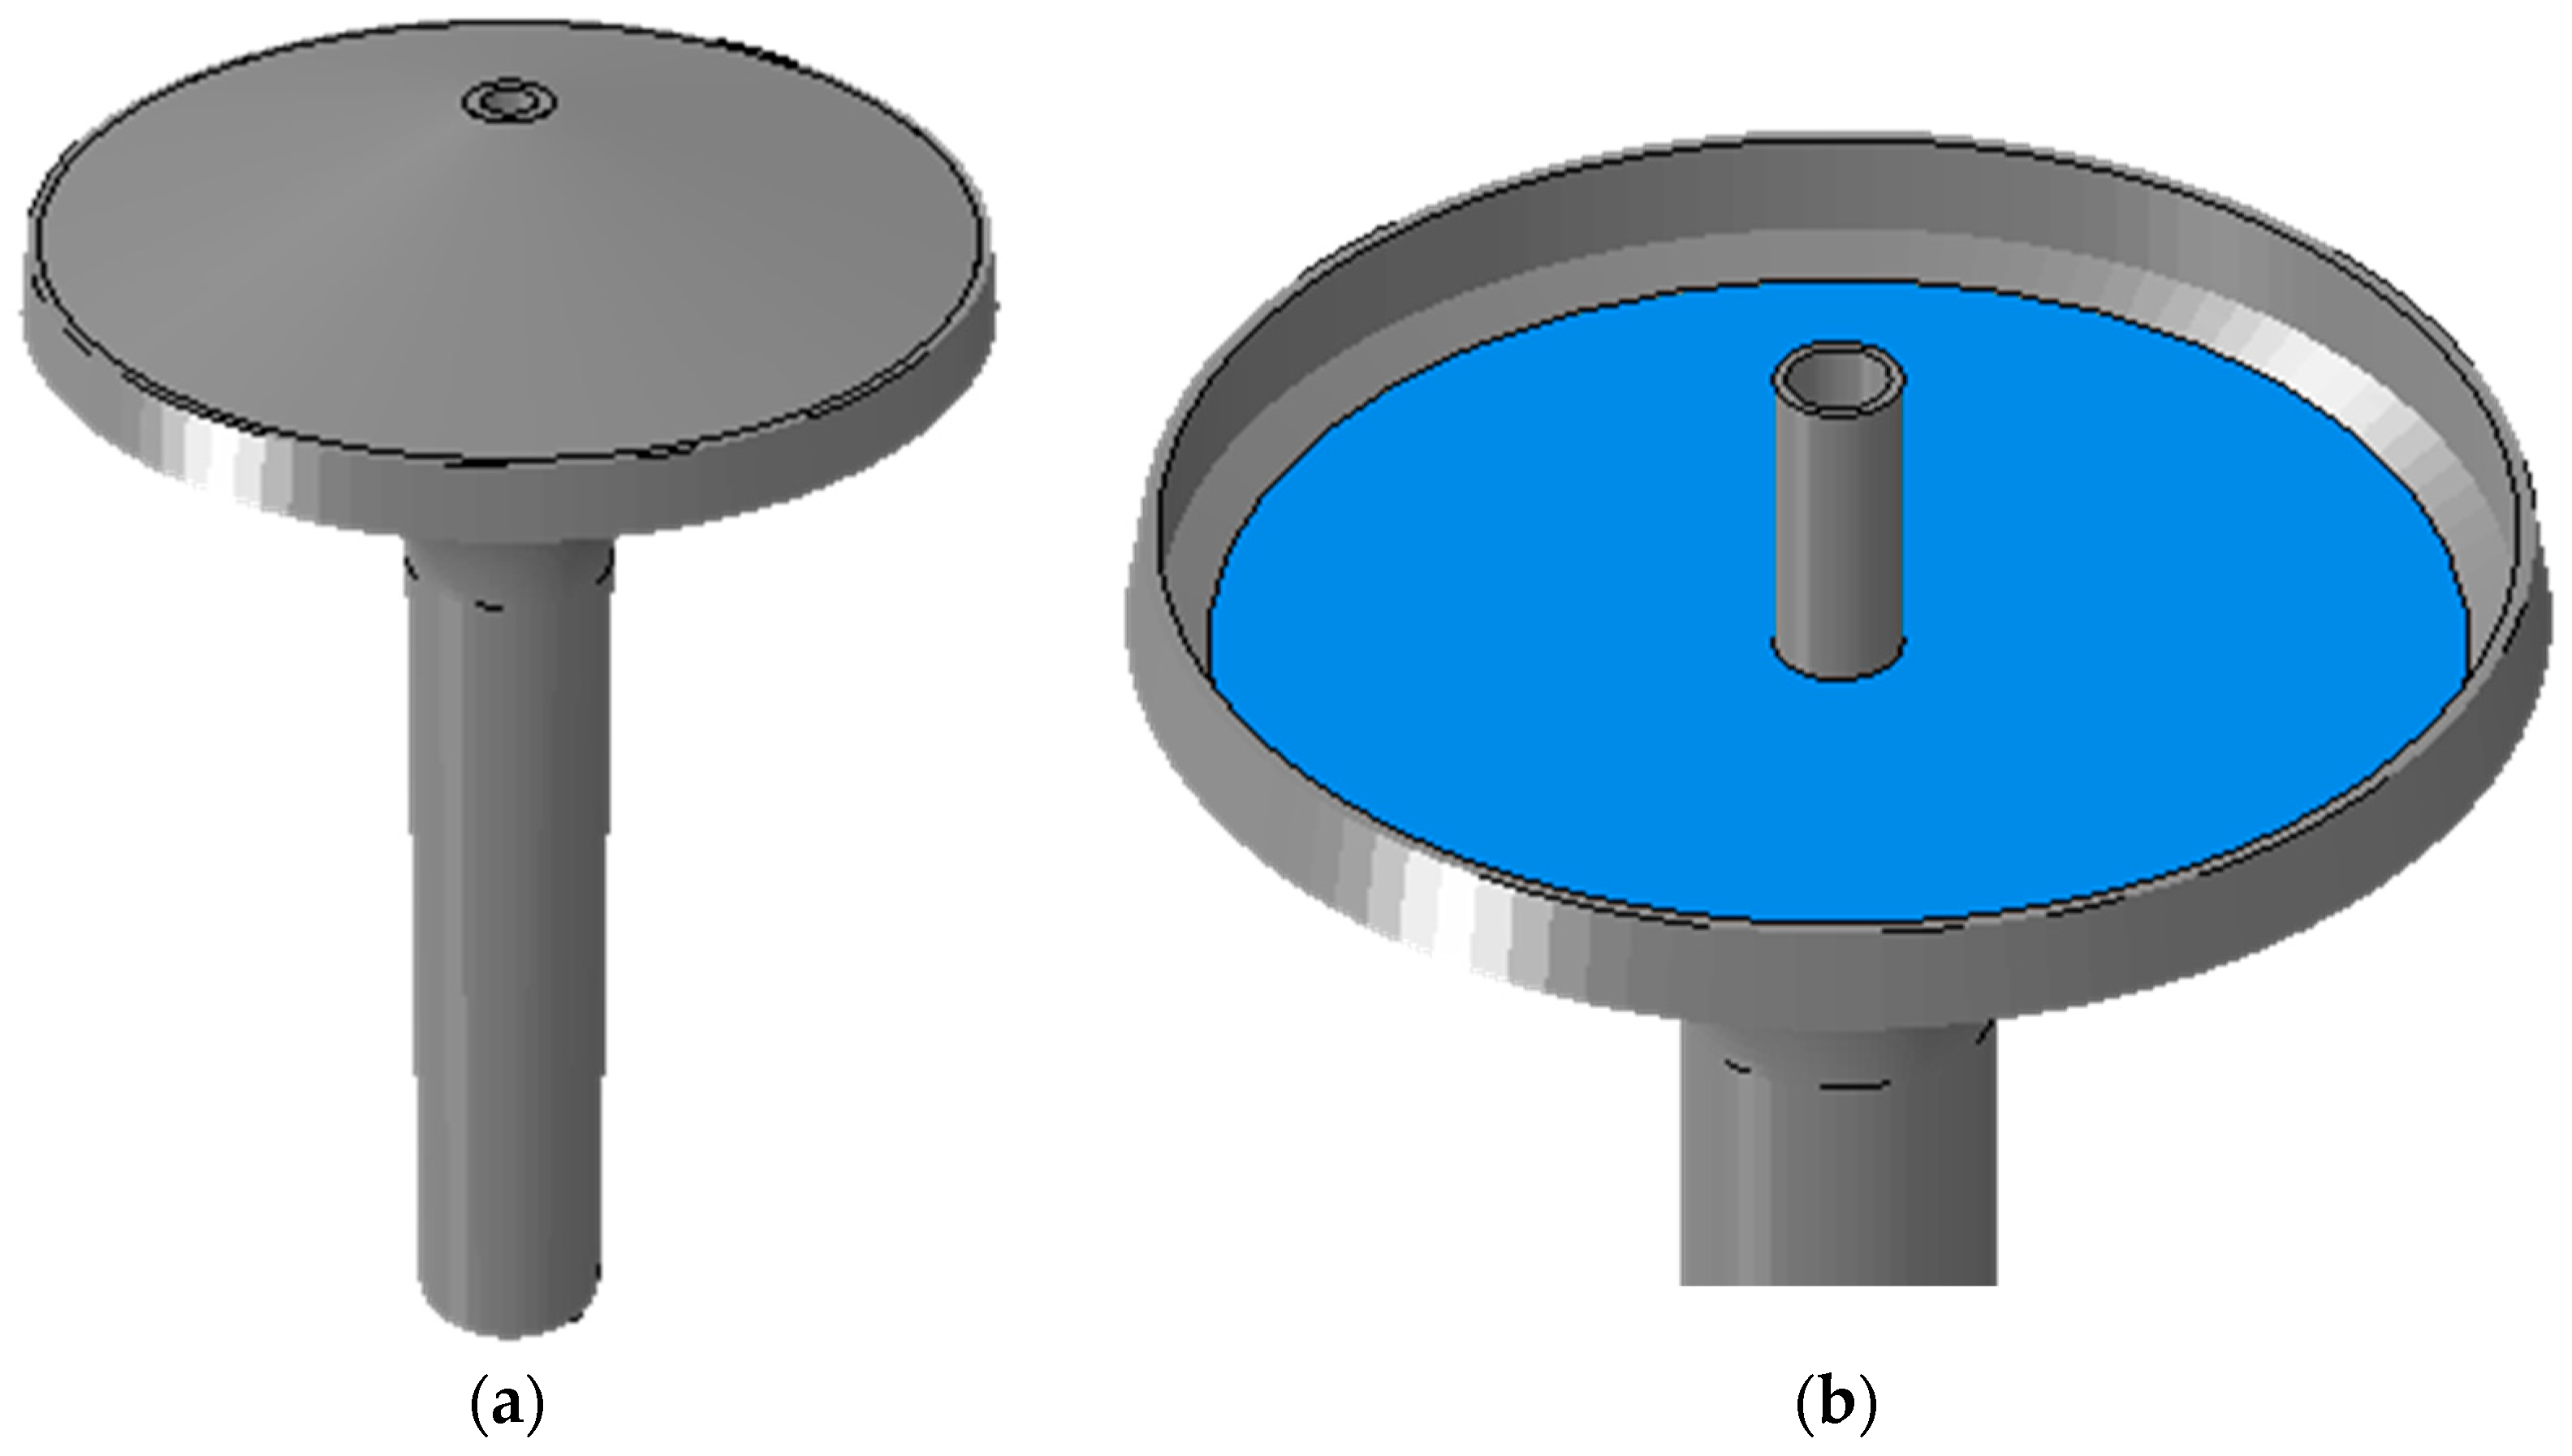
4.1. Simplified Approach for EWT with Empty Container (M0 Model)

At the very preliminary stage, the water tank was numerically described in the form of distributed lumped masses with rigid links for the shank and a circular plate on the top (Figure 4a), reproducing the dynamic properties of container (M0 model). A set of 1D beam elements was used to describe the shank cross-section features, while 2D 4-node Kirchhoff–Love shell elements were described for the equivalent top plate. Under similar modelling assumptions, all relevant geometrical details (i.e., door opening, diaphragms, and container geometry) were disregarded and accounted for in terms of equivalent inertial properties and total mass only. A rigid link was interposed to nodes #8 and #9 in Figure 4b to constrain relative displacements and rotations of the container and the shank.

4.2. Simplified Approach to Account for FSI Phenomena (M1-DM and M1-DS Models)

A more refined, but still simplified, modelling strategy was successively elaborated to account for possible water-filling conditions in the container, and thus for their effects on the estimation of relevant vibration modes. It is known that there are several modelling strategies able to include fluid–structure interaction phenomena. The choice of model strategy is often governed by simulation goals [2].
When the fluid response is characterised by small amplitude motion, as for example in the presently examined configuration, a two-mass equivalent approach is usually able to capture the vibrational behaviour of the fluid and its interaction with the container. A basic requirement is that the tank can be considered as rigid, and that the liquid can be treated as an incompressible viscid fluid, with free surface. As such, the theoretical model by Housner was taken into account [12] for FSI analysis (Figure 5).
Basic input parameters for Housner’s modelling strategy are strictly related to the geometry of the container (i.e., diameter D of the equivalent cylindrical container), and to the actual level (height h) of water filling. The approach assumes that a fraction Mi (known also as impulsive mass) from the total mass Mw of water filling is forced to participate in the motion of container. To this aim, the Mi term is rigidly connected to the tank, at a height hi from the base of container. The residual mass of water, Mc = MwMi, known as convective mass, is assumed to oscillate horizontally, and to be connected by an elastic spring (with stiffness kc) at a height hc from the base of container. The Mc term is particularly important to account for sloshing.
At the comparative stage, two different FE models based on Housner’s strategy for fluid–structure interaction were elaborated in present study. In both cases, the shank and the container were geometrically described based on 2D 4-node Kirchhoff–Love shell elements. A minimum set of 1D beam elements was used at the edges of the cylindrical tank, to reproduce the geometrical details.
In more detail, in the first case (M1-DM model), the equivalent cylindrical tank approach elaborated by De Martino [22] was taken into account, see Figure 6.
De Martino’s approach was addressed towards a more geometrically refined FE model, able to reproduce the truncated cone geometry of the examined container and based on the proposal by De Stefano [23] (M1-DS model, in the following), see Figure 7 and Figure 8. To this aim, the equivalent mass contributions were first calculated as in Figure 7, to facilitate the transposition from cylindrical tank (as in Housner’s model) to a truncated cone container. The theoretical model by De Stefano, in particular, still follows Housner’s classical approach and proposes a variational (Jacobsen) technique for the derivation of equivalent parameters of suspended water tanks with truncated conical shape.
In both cases, for present numerical modelling purposes, mesh size was set at an average of 80 mm edge length for the shank and 55 mm for the container. This resulted in a total number of elements and DOFs for the M1-DM model in Figure 6 equal to 6336 (of which 216 frame elements and 6120 shell elements) and 35,854, respectively. For the more geometrically refined M1-DS truncated cone model as in Figure 8, the number of elements and DOFS was measured in 14,976 (216 frame elements and 14,760 shell elements) and 87,708, respectively. A set of 75 link elements with elastic stiffness was used to link the lumped convective mass to the structure, in both M1-DM and M1-DS model assemblies.

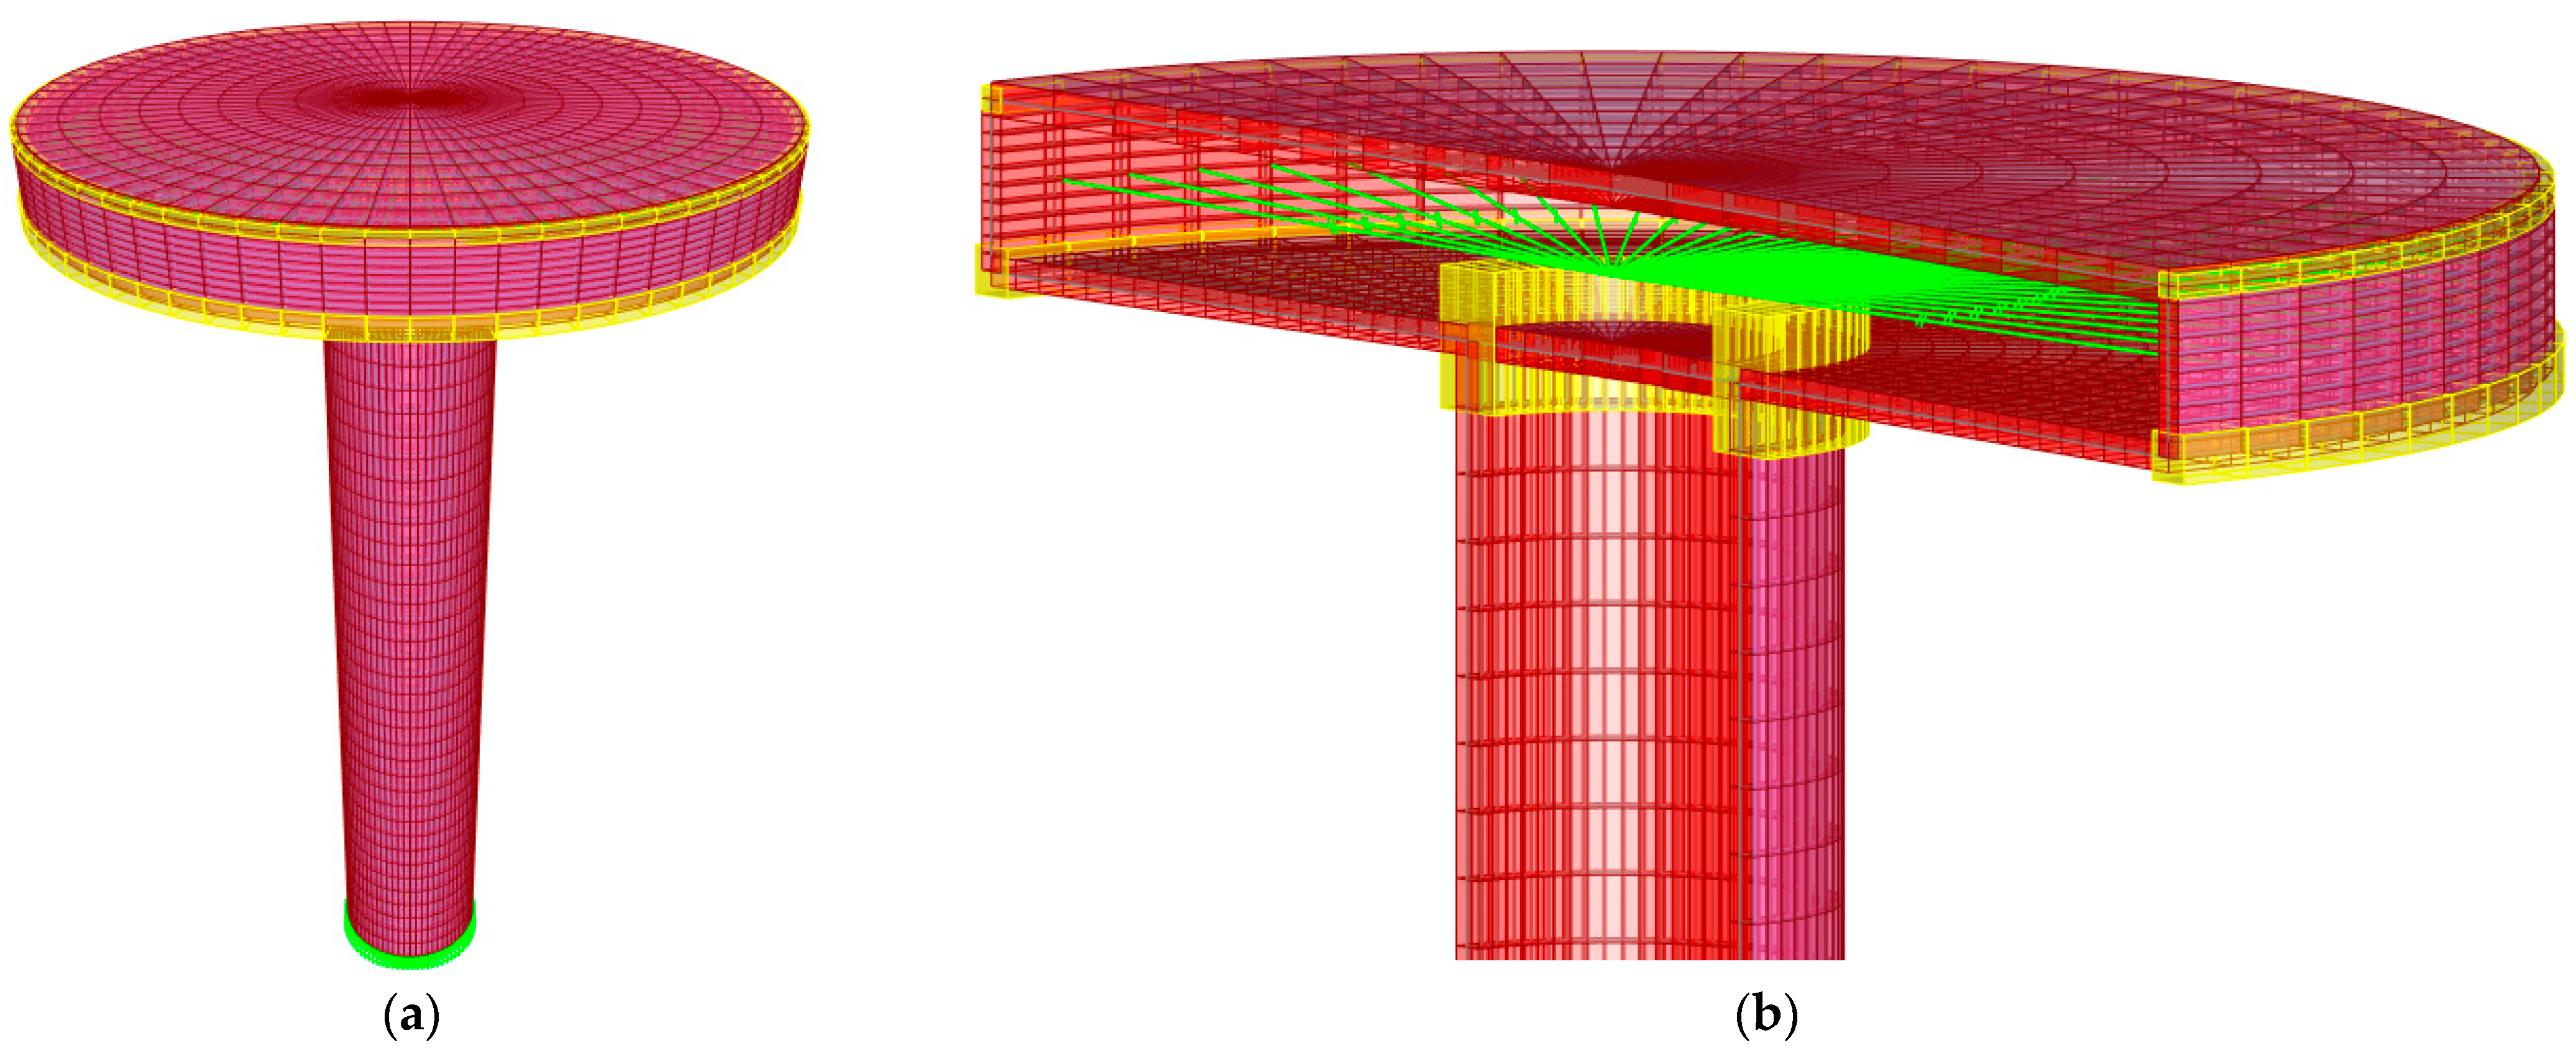
4.3. Acoustic Approach to Account for FSI Phenomena (M2 Model)

In conclusion, a more refined full 3D model was developed (M2 model), in order to account more realistically for FSI effects and to facilitate the modal analysis of the examined water tank. The latter was described in ABAQUS/Standard [29], according to Figure 9, where the nominal geometry was described based on full 3D solid elements to reproduce the shank and the truncated cone container. A combination of C3D8 and C3D4 solid elements was used to consider major geometrical details. The so-assembled structural model was used both for modal analysis in empty conditions, and then adapted with careful attention for operational conditions characterised by a given level water filling.
Differing from previous M1-DM and M1-DS simplified strategies, the geometrical details were reproduced with particular attention, both for the container and for the shank. In the latter case, the diaphragms at the elevation levels of the stem were also reproduced (i.e., see the cross-section axonometry in Figure 1c). The door opening at the base of the shank was also considered. Mesh size was set in a variable free pattern, to facilitate the transition between geometrical details, with edge size ranging from 50 mm minimum to 600 in various regions of model. This resulted in a total number of elements and DOFs for the M2 model equal to 34,535 and 419,301, respectively, for the structural model (empty container).
In addition to the structural part, for the analysis of fluid–structure interaction phenomena, a set of acoustic 3D solid elements (quadratic hexahedron, AC3D20 type from ABAQUS library) was also used for the description of water filling in the tank (Figure 9b). A variable quantity of additional elements and DOFs (i.e., depending on the water level) was added for fluid–structure interaction analyses. The minimum number of elements and DOFs was set in the order of ≈25,000 and ≈110,000, respectively. Water material for acoustic elements was characterised in terms of density (983 kg/m3) and bulk modulus (K= 2.07 GPa).

5. Discussion of Numerical Results

The selected FE models were subjected to linear modal (frequency) analysis, in order to predict the fundamental vibration modes of the structure (with empty container, see Section 5.1) or for the coupled fluid–structure system (see Section 5.2), and assess the corresponding frequencies/shapes.
For structural assessment of similar systems under earthquakes, it is known that the fundamental vibration mode has a key role in terms of structural behaviour under horizontal seismic components [18]. As such, primary attention in FE modelling calibration should be given to the first vibration shape/mode only. Higher modes are in fact not fundamental for predicting the response of elevated tanks to horizontal base motions, in the sense that they do not have typically low modal participation factors. Furthermore, the accuracy of model calibration should be in any case based on a robust validation of the largest number of vibration modes (both frequencies and shapes).

5.1. Modal Analysis of EWT with Empty Container

As far as the simplified modelling strategies from Section 4 are taken into account, typical results as in the following were collected. The distributed mass model with rigid links (M0 model), for example, was found roughly approximate to the geometrical description of the structure, even disregarding the additional uncertainty of FSI phenomena. As such, see Table 5, a rather weak match was observed compared to experimental evidence from [21], with major accuracy especially in terms of vibration type and order, but typically unsatisfactory structural response predictions.
As shown in Table 5, the structural vibration frequencies were typically underestimated by the M0 numerical assembly, in the order of −2% for the fundamental mode, but up to −15÷22% for higher structural modes. In this regard, it is worth noting that a major scatter is observed for the torsional mode, which is mostly affected by geometrical simplifications. On the other hand, see also [2], it is also important remember that the torsional mode is not particularly important for structural analysis. The modal mass participating in the first flexural mode was in fact numerically quantified in the ≈77% part of the total structural mass.
As far as the geometrical complexity (and the computational cost) of selected models was increased according to Table 4, the typical trend of structural vibration frequencies was found to follow the trend which is summarised in Figure 10.
The increase of geometrical detailing can increase up to ≈12 times the total number of DOFs (Figure 10a) for structural components, but progressively reduces the percentage scatter towards the experimental frequencies (Figure 10b), for all of the three low vibration modes. For the M1-DM model, the scatter is satisfactory in the case of the first flexural mode but increases to ≈10% and ≈30% of underestimation for the second and third modes. A partial improvement in accuracy can be noted for the M1-DS model, where a scatter of ≈15% is still observed for the second flexural mode. The best agreement with experimental evidence can be found in Figure 10 for the full 3D solid M2 model, with a scatter measured at less than 1% for the first flexural mode, less than 2% for the torsional mode, and less than 10% for the second flexural mode. Details about the predicted vibration frequencies are listed in Table 6.
Regardless of the FE model strategy and the rough M0 assembly, a rather good match was again found in terms of mode order and type for different FE models discussed herein. Figure 11 reports, as an example, the structural modal shapes for the M1-DS assembly, while in Figure 12 the flexural shapes for the more refined M2 model are shown. The effect of the door opening in the shank, for example, was responsible for minimum loss of symmetry for the dynamic response of the system, as well as for negligible local effects in terms of deformation of the structure. On the other hand, the presence of the door opening itself (and thus partial lack of structural symmetry) was found responsible for an appreciable frequency modification for the same vibration modes.
In comparative terms, it is noteworthy in Figure 13 that the normalised structural modal shapes—as far as the geometrical description of the structure is sufficiently accurate (as in case of M1-DM, M1-DS, or M2 models)—the first and second bending modes of primary interest for structural analysis are in rather close correlation, especially in qualitative but also in quantitative terms. In more detail, the lateral modal displacement measured at selected control points on the elevation of each model is normalised towards the displacement at the top of the shank. The height of the shank itself is also presented in Figure 13 in normalised form (with normalised height h* based on the schematic drawing of Figure 13). For the first bending mode only, see Figure 13a, a more pronounced sensitivity to local deformations can be observed for the shell-based FE models (M1-DM and M2-DS), with higher flexibility on top (i.e., the region of container-to-shank connection) compared to the full 3D solid model (M2). Such local effects were found to be less pronounced for the second flexural mode shape reported in Figure 13b.

5.2. Frequency Analysis including FSI Phenomena

For the analysis of the tank’s dynamic features, including FSI phenomena, the FE models from Table 4 were addressed towards the background experimental evidence reported in Section 3, but also towards consolidated analytical frequency estimates, so as to capture the fundamental sloshing frequency for the examined system.
Based on De Martino’s theoretical model (M1-DM strategy) and the classical Housner’s approach, in particular, it is known that the circular frequency of water filling can be analytically derived from [22]:
ω 2 = g R 1.84   tan h 1.84 h R
and thus:
f S 1 = 1 2 π g R 1.84   tan h 1.84 h R
In terms of truncated cone-shaped tank and the theoretical formulation from De Stefano, it is assumed that the fundamental sloshing pulsation is given by [23]:
ω = g h 2 tan 2 α 8 27 F 1 C 1 + F 2 C 2 + 1
The corresponding vibration frequency is thus given by:
f S 1 = 1 2 π g h 2 tan 2 α 8 27 F 1 C 1 + F 2 C 2 + 1
All the above parameters, based on [22,23] can be analytically calculated as a function of geometrical features of the tank and the level of water filling, with α = 61° in the present case-study system (Figure 1c and Figure 3b).
The reference analytical models were used, in addition to selected FE methods, for the assessment of frequency sensitivity to water infill. Typical analytical trends can be seen in Figure 14, where some key configurations are also highlighted for operational conditions of technical interest. While the normalised frequency variation is identical based on Equation (2) or Equation (4), a typical scatter in the order of ≈10% was calculated in terms of analytical frequencies based on the reference analytical approaches. Most importantly, it is noteworthy that the calculated analytical frequencies in Figure 14 are markedly lower than the first structural vibration frequency of the empty tank.
In this regard, the comparative results in Figure 15 refer to the MCW50 and MCW100 filling configurations, based on experimental testing (from Section 3), analytical modelling (Equations (2) and (4)), and selected FE numerical models (M1-DM, M1-DS, and M2 strategies). It can be seen that the “An-DM” and “An-DS” strategies, in terms of FE numerical modelling description of water infill, both have less than 0.6% scatter towards the corresponding analytical prediction (Equations (2) and (4)) for the examined MCW50 and MCW100 configurations. Additionally, the acoustic-based M2 model is also in good correlation with simplified analytical and numerical comparisons.
Furthermore, all the analytical and numerical models for MCW50 condition (Figure 15a) have a reduction of −38÷45% compared to the experimental value reported from [21]. Such evidence suggests the critical role of in-field experiments for diagnostics and FE model calibration [2,4], which is of utmost importance especially for old/heritage structural systems.
In terms of structural vibration frequencies for the coupled system with fluid–structure interaction, the typical trends as in Table 7 and Table 8 were numerically collected (MCW0 and MCW50 configurations).
As can be seen in Table 7, in terms of FE numerical assessment towards past experimental results and differing from the dynamic assessment of the empty tank (Table 6), the examined structural models are highly affected by the fluid–structure interaction phenomena. For the sake of clarity, Table 7 and Table 8 report the global (coupled) structural modes for comparison with the bending and torsional modes of the empty structure. In terms of frequencies, it can be noted that in Table 7, for example, the M1-DM model roughly captures both the torsional and second flexural mode parameters. Additionally, the M1-DS model in Table 7 has ±10% scatter compared to experiments. For the acoustic-based M2 model, the first flexural and torsional frequencies are correctly captured, but a major divergence is observed for the second flexural one.
For all the developed FE models, it is also possible to see from Table 8 a typical decrease of estimated vibration frequencies compared to the empty system (MCW0 configuration), which is also in line with the background experimental evidence (Table 3). The frequency modification, as expected, is numerically sensitive to water filling, especially for the first and second flexural vibration modes. However, as shown in Figure 16, the frequency sensitivity to water infill is also affected by numerical assumptions.

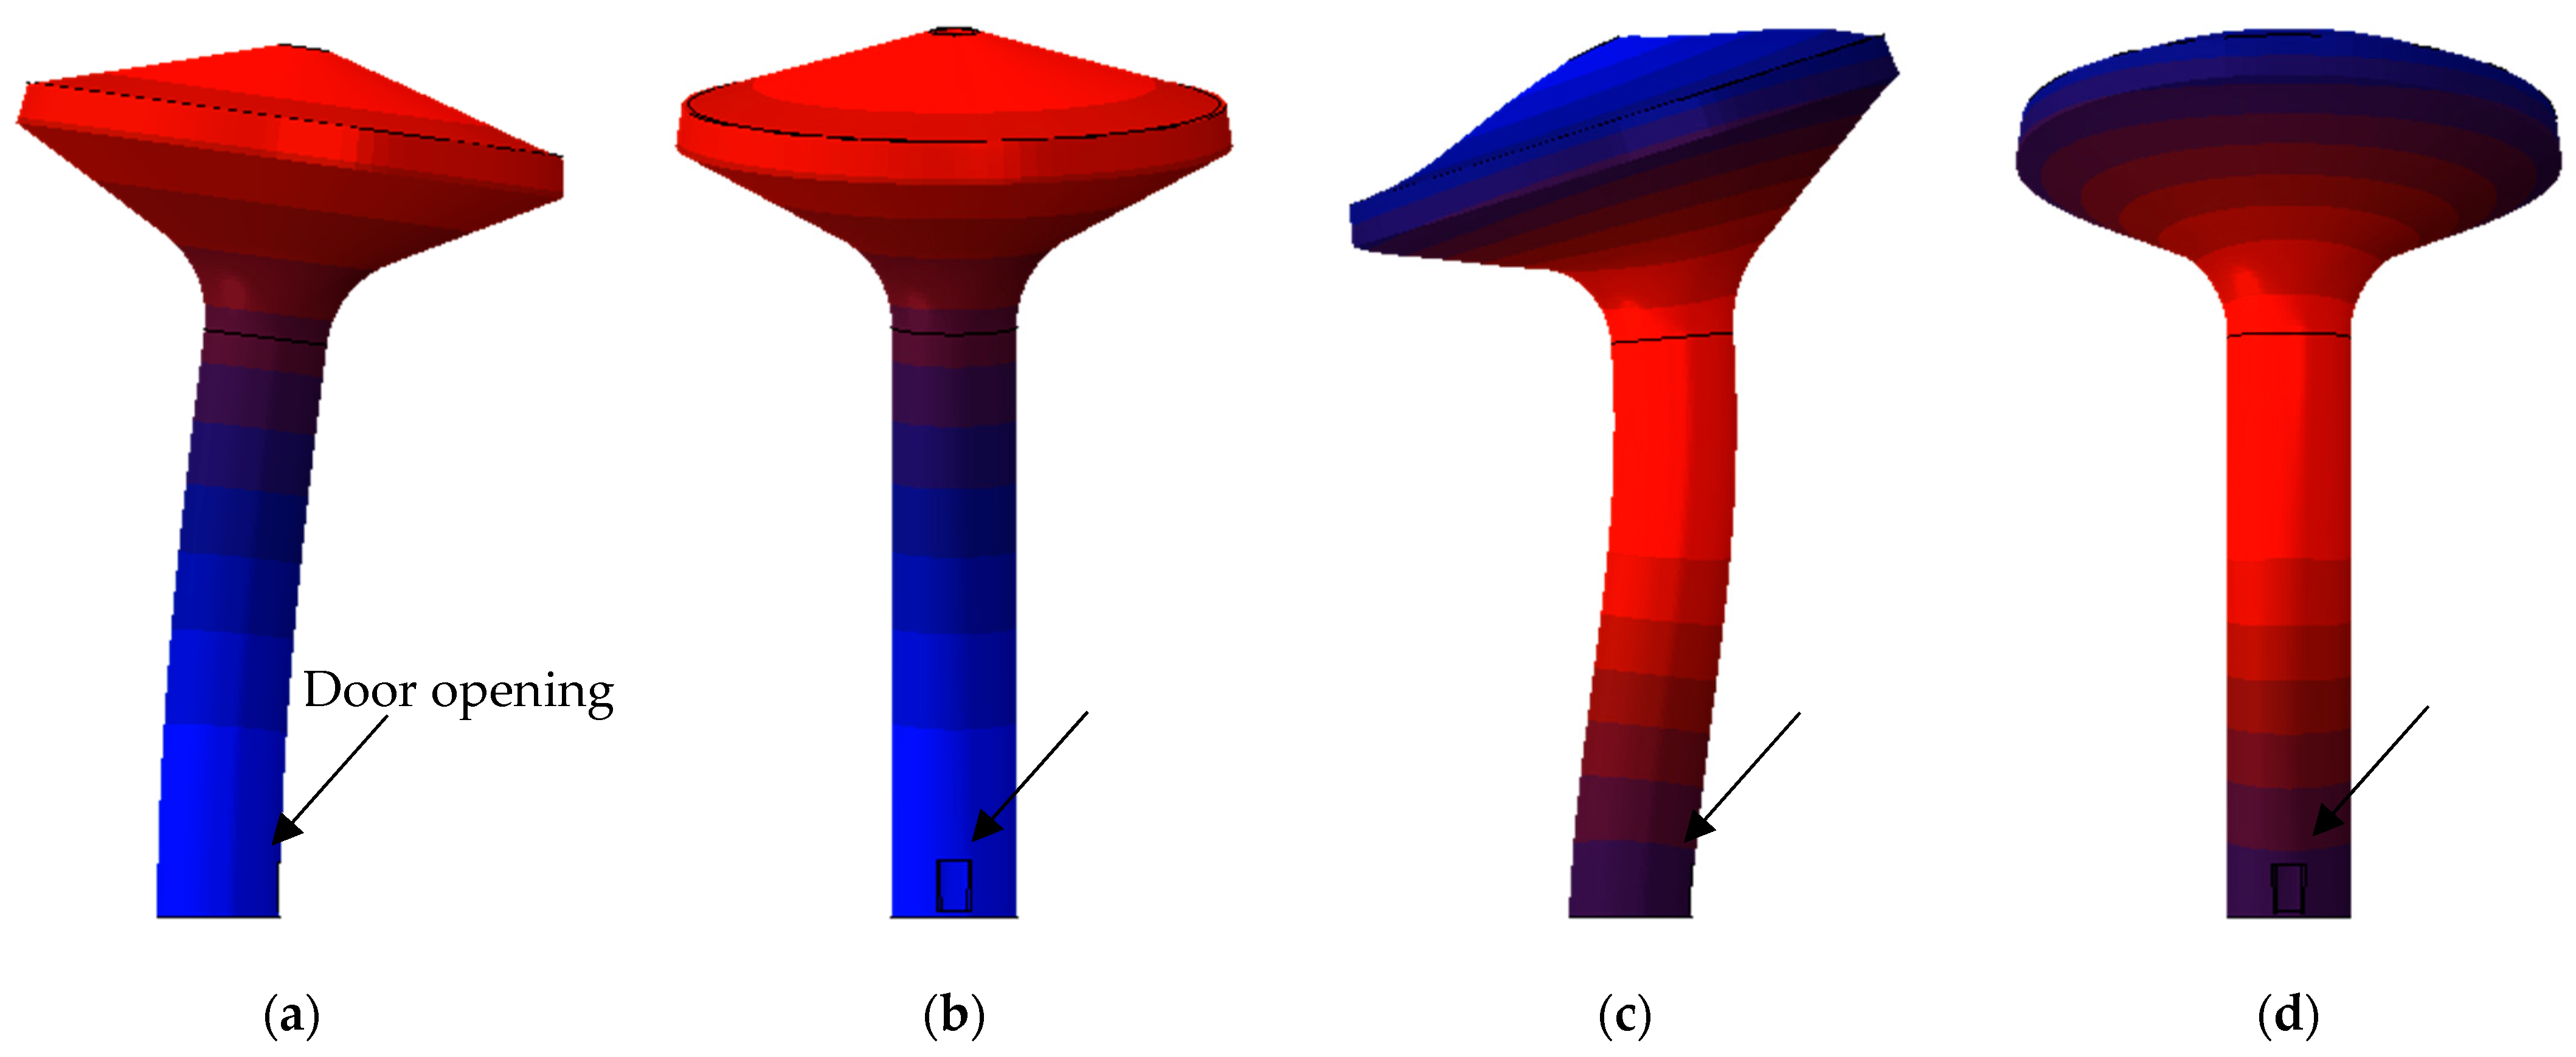
5.3. Modal Shape Analysis including FSI Phenomena

Finally, in terms of corresponding modal shapes, it is important to note that the numerical M1-DM assembly was highly sensitive to local phenomena/deformations of the equivalent cylindrical container (with respect to the shank), both in quantitative and qualitative terms. This is not the case for truncated conical models as in the M1-DS or M2 systems, where the typical global vibration shapes of the structure (i.e., as in Figure 11 and Figure 12) were again numerically detected, under coupled fluid–structure modal analysis. As a major effect of partial water-filling of the container, a progressive modification of normalised vibration shapes of the structure was measured as in Figure 17, where selected examples are reported for the M2 model.
Overall, taking the 3D solid M2 assembly as a reference for modal shape correlation based on numerical predictions (and due to the lack of experimental evidence in terms of vibration shapes), the modal correlation can be efficiently quantified to assess the simplified or more refined FE modelling strategies and their sensitivity to various water infill/operational configurations of technical interest. In this regard, an example of modal shape correlations corresponding to MCW0 and MCW50 filling conditions can be seen in Figure 18.
Figure 18a compares the flexural shapes of M1-DM and M1-DS models towards the M2 acoustic-based solid model (empty container, MCW0). When the container is empty the geometrical simplification of EWT details does not significantly affect the predicted vibration shapes for the first and second flexural modes, and the modal correlation is close to ≈100% for both M1-DM and M1-DS models. The truncated cone description of containers, as in the M1-DS strategy, suggests a minor improvement of modal correlation for both first and second flexural shapes (99.6% and 98.8%, respectively). It is noteworthy that such a rather good modal correlation for the empty structure is also in line with frequency estimates reported in Section 5.1 (Table 6), in terms of fundamental vibration mode only (first flexural). On the other hand, results in Figure 18a for the second flexural mode have a major discrepancy with the corresponding vibration frequencies in Table 6; this is more pronounced especially for the M1-DM assembly with a cylindrical container. Such a comparison confirms that a rough simplification of structural geometrical details as in Table 4 has a minimal effect on the fundamental vibration response of similar structures (i.e., mode one with empty container), but the sensitivity of dynamic estimates progressively increases for higher vibration modes and water-filling levels.
In this regard, as far as water-filling effects are taken into account for the M2 assembly only, see Figure 18b, it can be noted that the FSI phenomena previously emphasised in Figure 17 (especially for the second vibration mode) tend to minimally affect the correlation of global vibration shape for the first flexural mode (99.6%), while the sensitivity of coupled fluid–structure response is more pronounced for the second flexural mode (91.1%).
All these aspects suggest that even major sensitivity can be expected from non-linear analysis in seismic conditions (i.e., in terms of maximum top displacement demand for the EWT and corresponding base seismic shear). As such, special attention is required for the choice of FE modelling strategy and calibration of input parameters, when addressing the seismic vulnerability and residual capacity of similar structural systems.

6. Summary and Conclusions

It is known that the seismic vulnerability assessment of existing structures is typically a challenging task, due to several aspects. In this paper, special attention was given to the dynamic characterisation, based on numerical modal analysis, of a 50-year-old, reinforced concrete, elevated water tank (EWT) constructed in the 1970s in a high-seismicity region in northern Italy and characterised by a truncated cone shape for the top container.
From a practical point of view, model accuracy and reliability are highly important for structural assessment purposes, in the same way as computational efficiency. At the same time, a robust engineering knowledge of dynamic parameters for similar structures is of primary importance to subsequently reproduce and address further loading configurations of technical interest for vulnerability assessment (i.e., nonlinear dynamic simulations in seismic conditions), and even support a possible retrofit plan (where required).
To this aim, for the case-study EWT, several background experiments and technical drawings were taken into account as references for the description of four different finite element (FE) numerical models characterised by increasing levels of geometrical detailing, possible fluid–structure interaction (FSI) phenomena (including various water-filling configurations), and consequently increased computational cost. The collected numerical results were hence addressed towards rather scarce experimental evidence (vibration frequencies only) or even consolidated theoretical formulations of literature.
For the EWT with an empty container it was shown that the added mass modelling approach (M0 model, in the present study), can offer a rather accurate estimation of the first vibration frequency (less than 2% scatter, in the present study), but suffers from major geometrical limitations on higher vibration modes (up to 20% frequency scatter).
For the EWT with water-filling, the use of progressively more refined FE models showed that:
  • The spring-mass simplified approaches based on Housner’s theory accounting for FSI phenomena (M1-DM and M1-DS models, in present study) can be somewhat efficient and accurate in vibration frequency estimates, especially for the first vibration mode. However, major uncertainties in dynamic features can arise in the higher vibration modes, both from FSI phenomena and from geometrical simplification of structural components, with possible discrepancies and additional uncertainties in the interpretation of predictions.
  • For the acoustic-based strategy and geometrically refined description of structural components (M2 model), the best correlation was observed towards both experimental and analytical vibration frequencies. Additionally, further considerations were made possible in terms of modal correlation of corresponding vibration shapes, including FSI phenomena.
Moreover, in terms of vibration frequencies:
  • For the empty container, the first vibration frequency was generally well captured by all developed models (including the M0 assembly), but the scatter for the second and third frequencies was found to decrease only with an increase of model complexity and computational cost.
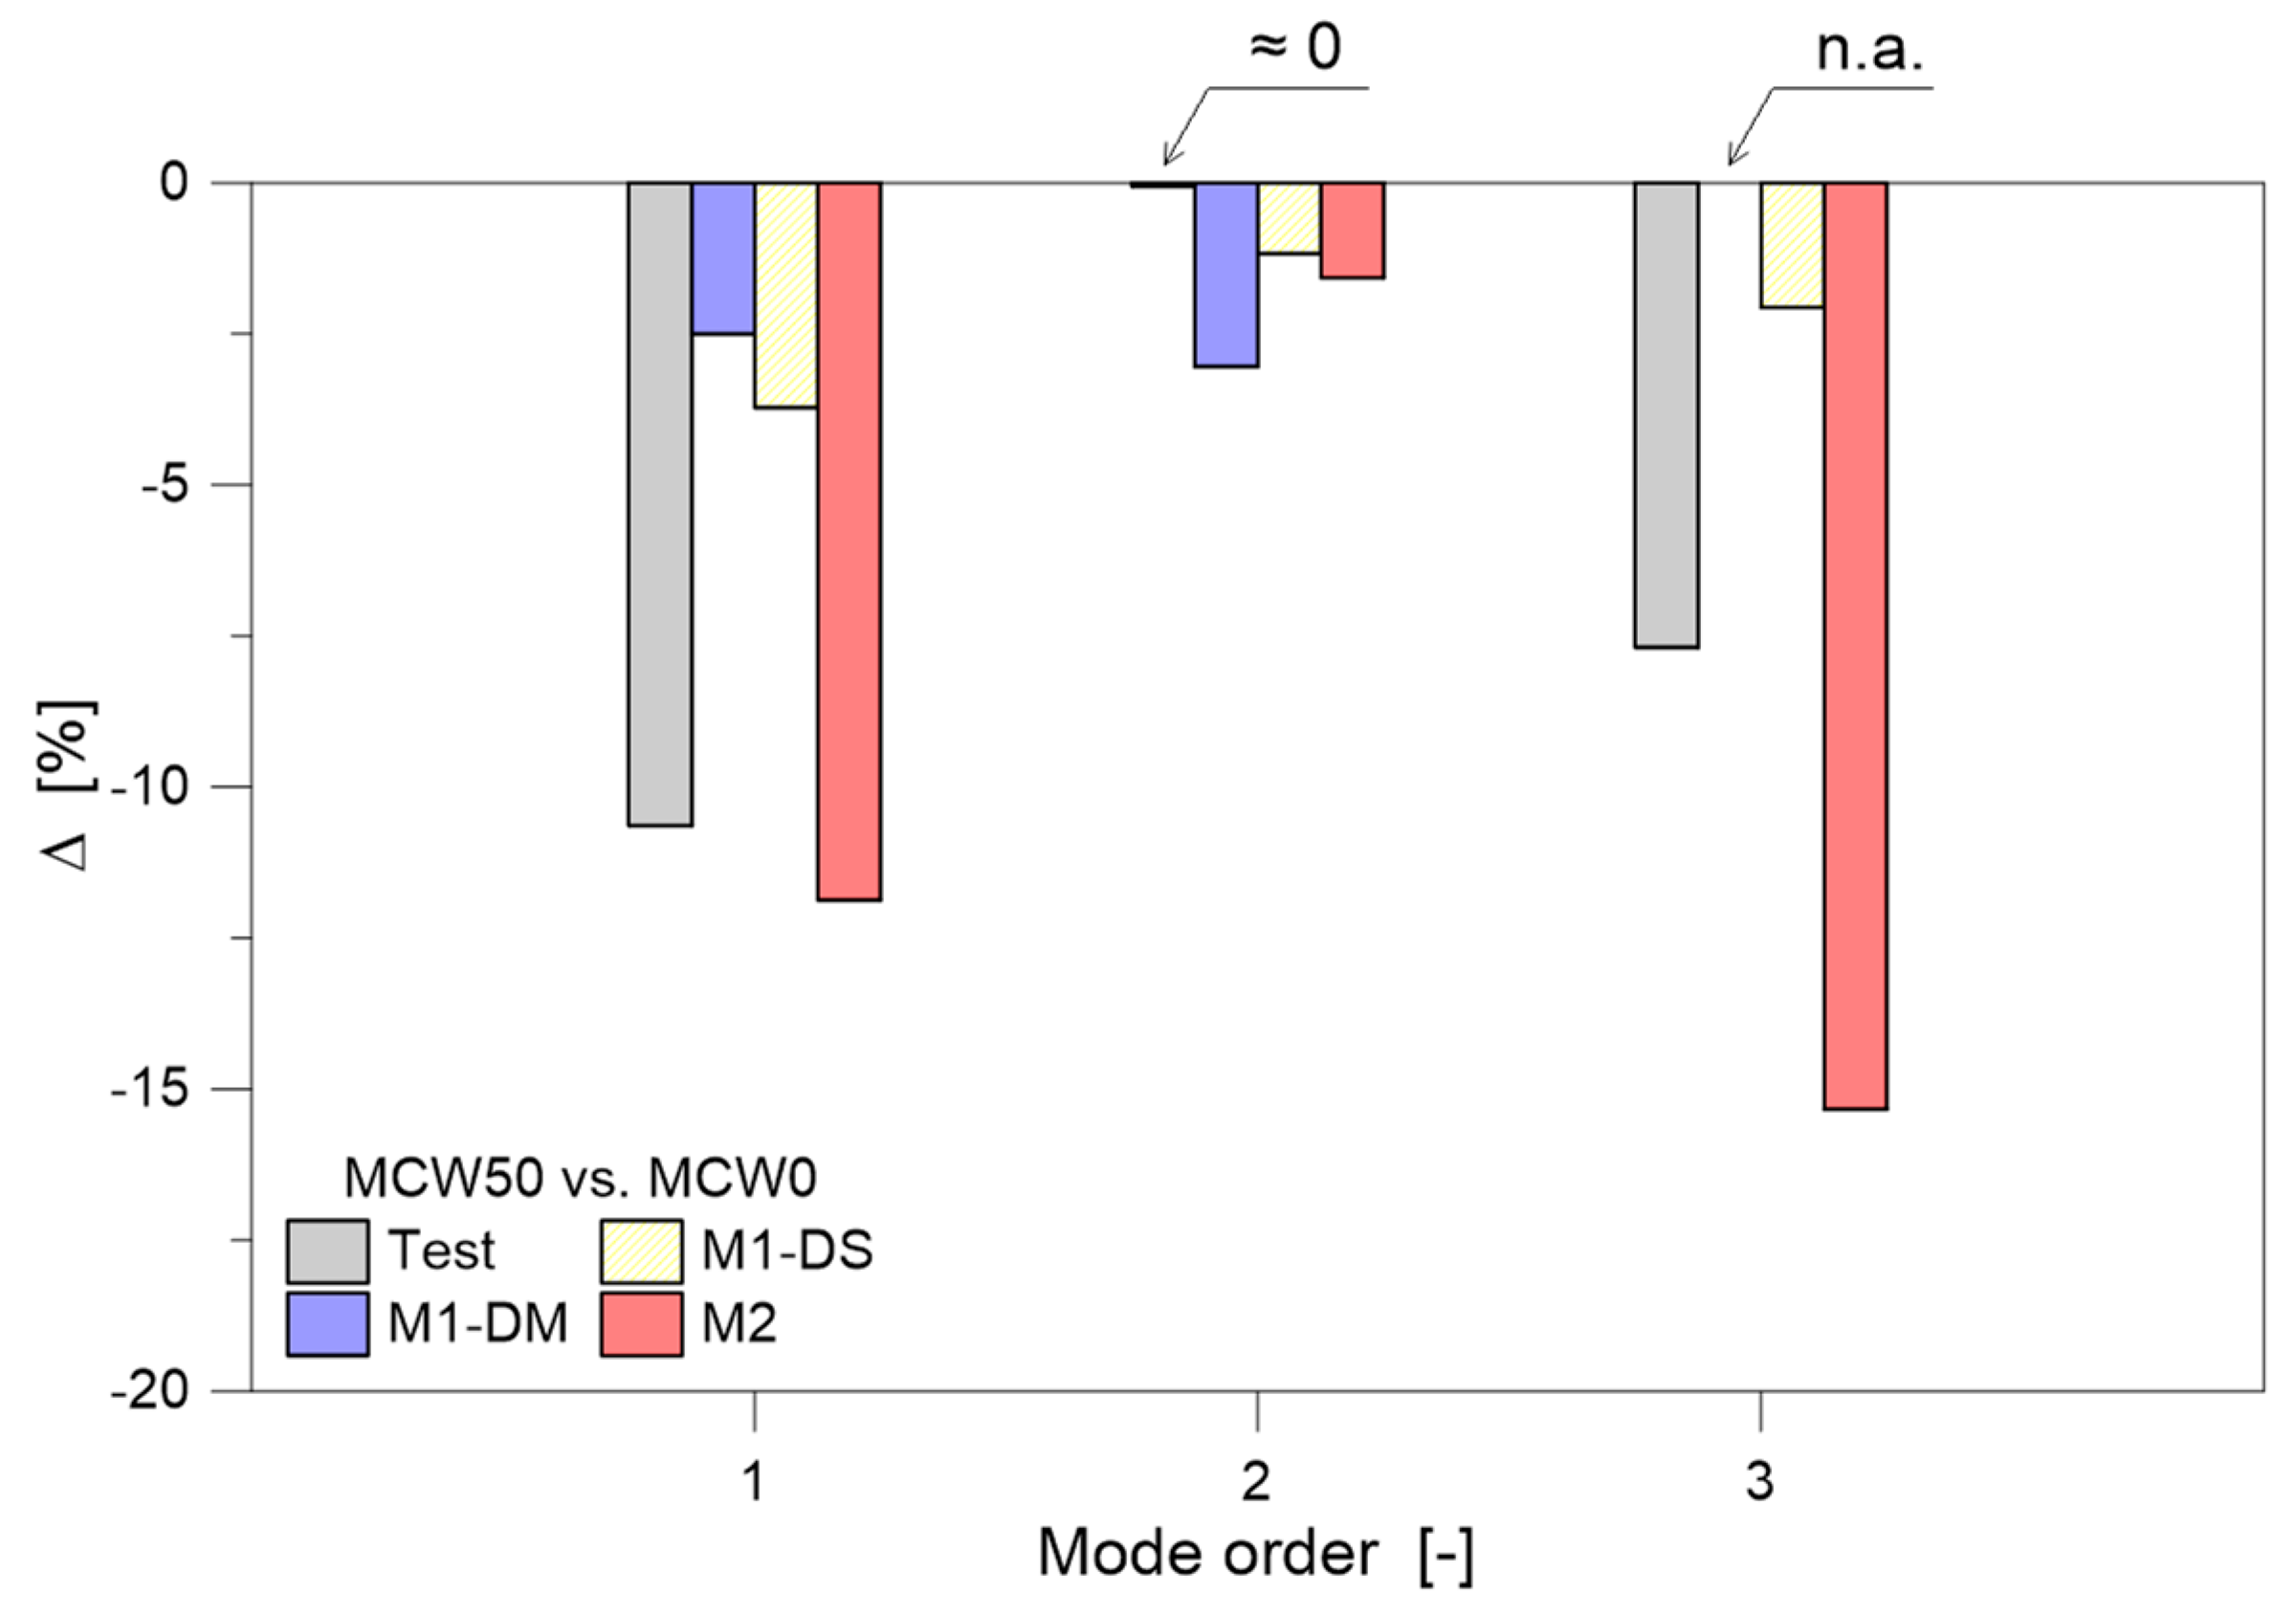
  • For the structure with water-filled container, minimum variations were observed in terms of the first vibration frequency from M1-DM, M1-DS, or M2 models, but increasing scatter was progressively noted for the second and third frequencies, for the spring-mass based M1-DM and M1-DS formulations.
In terms of vibration shapes:
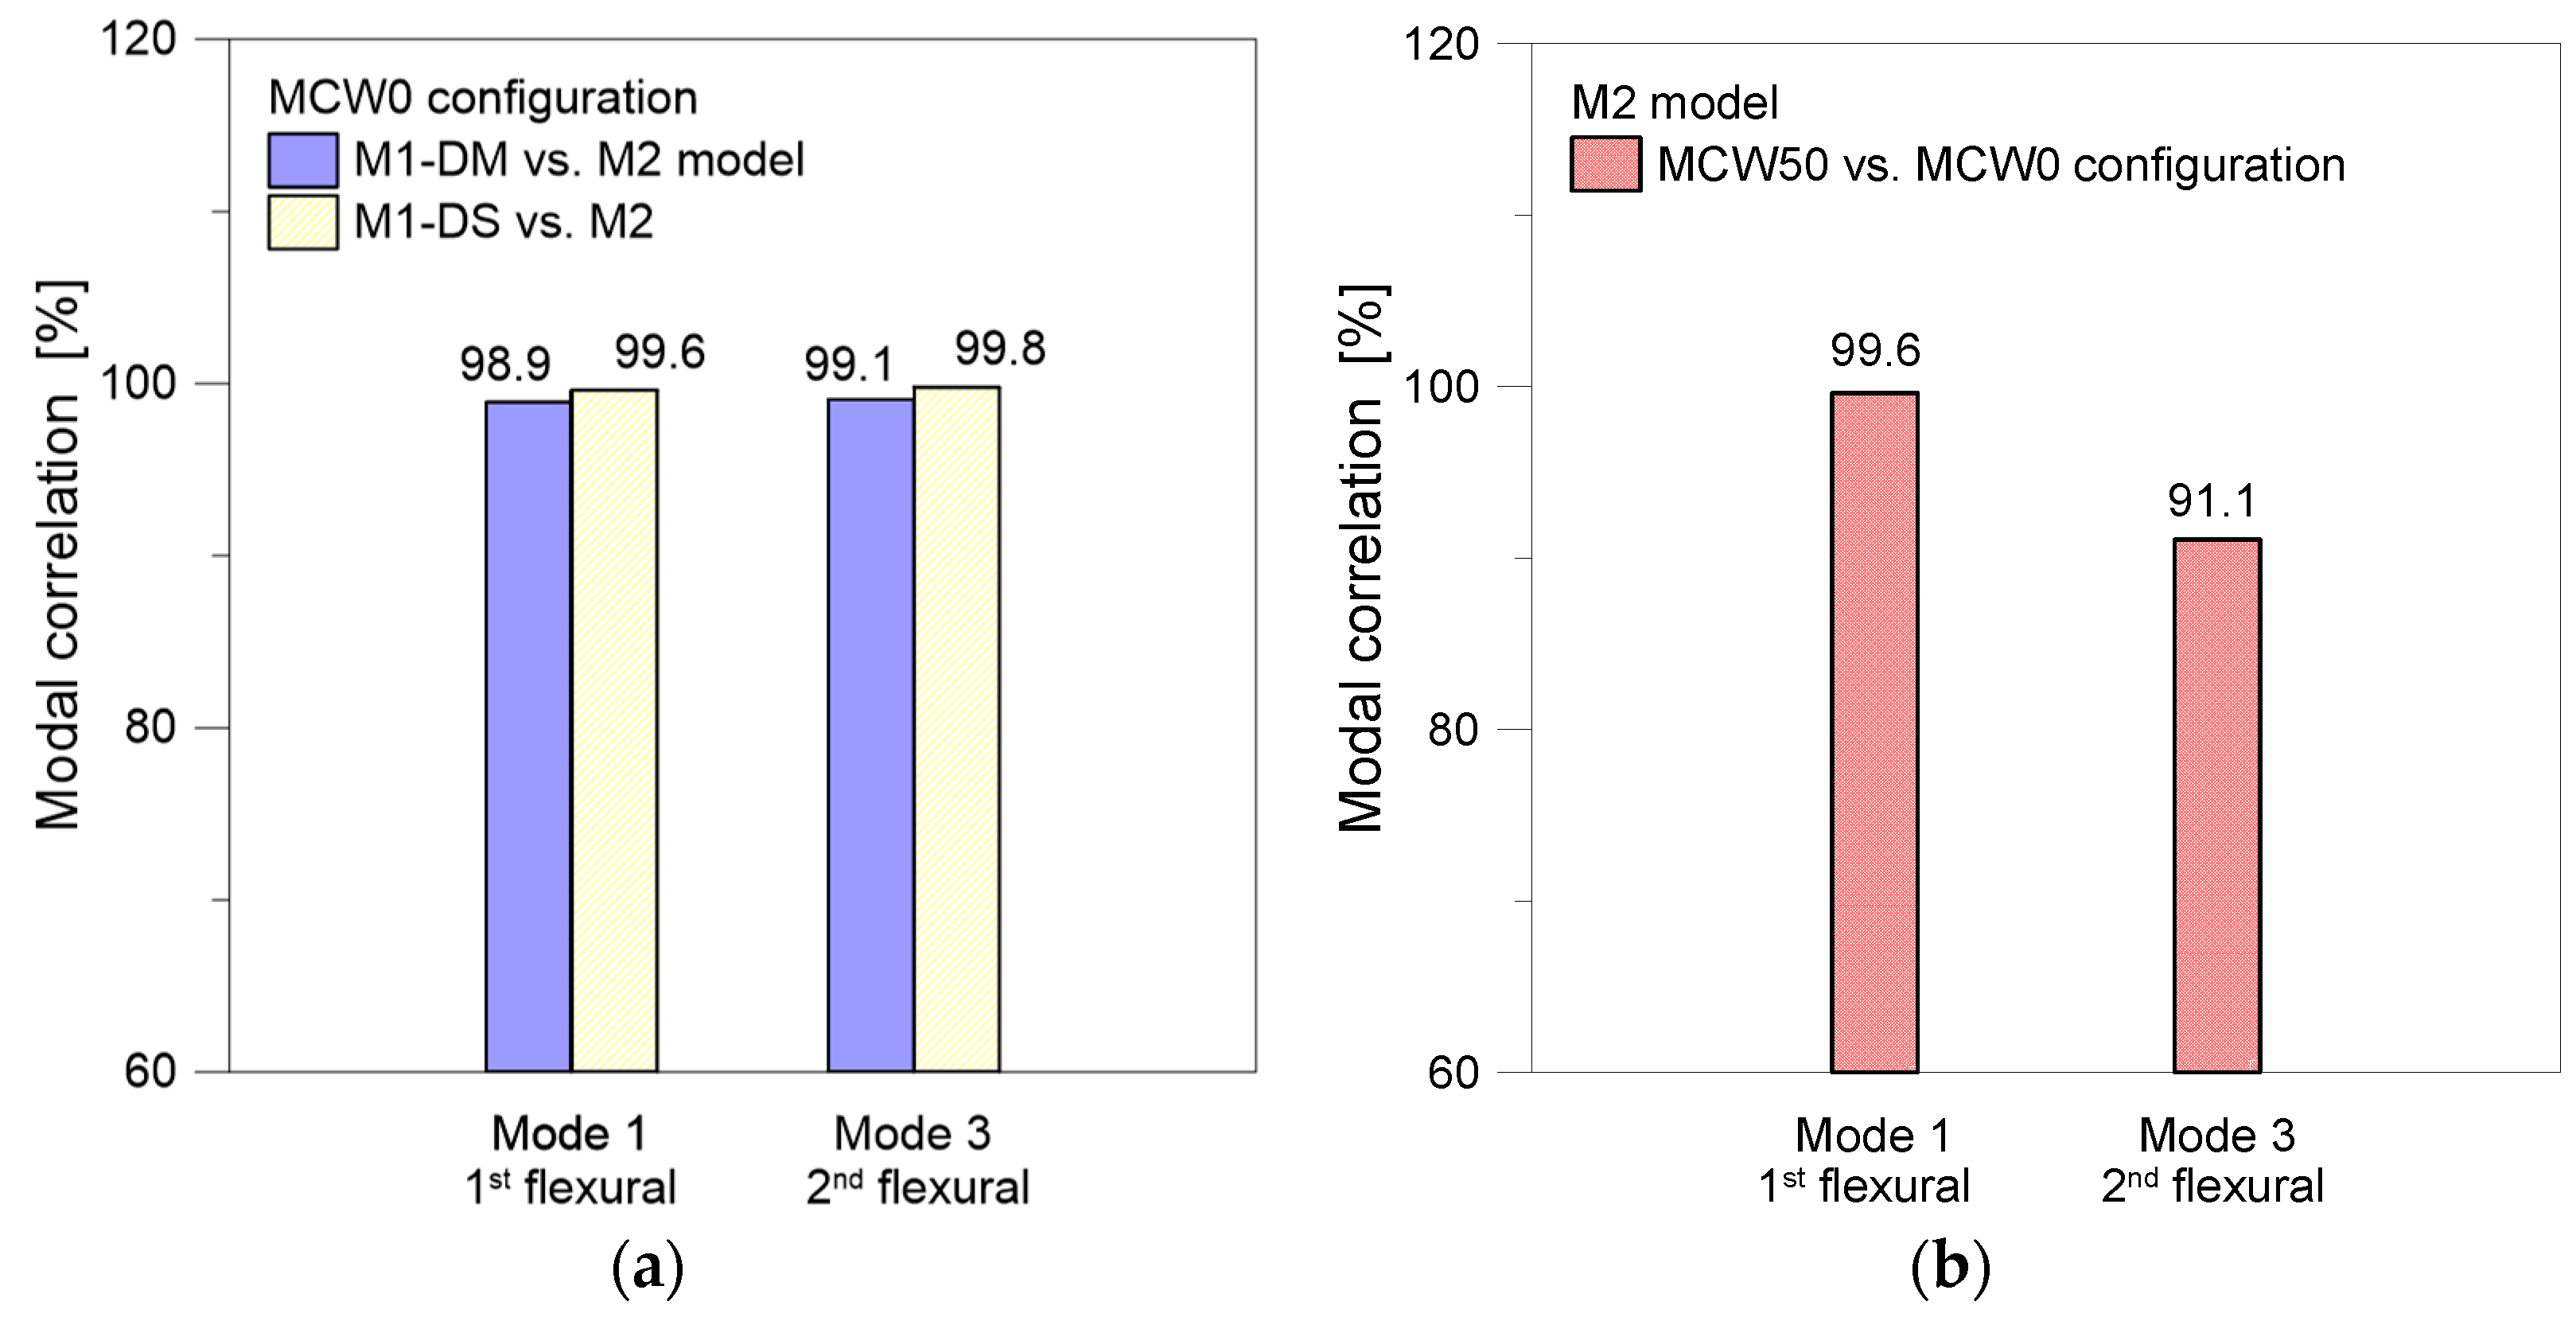
  • The use of simplified M1-DM or M1-DS modelling strategies showed minimum modal shape sensitivity in empty conditions (>98% of the modal correlation coefficient), but major numerical issues in water-filled configurations.
  • The acoustic-based M2 model, once used as a reference for modal correlation analysis, revealed that water infill has major effects on higher vibration modes (i.e., up to 10% for half-filled container), but minimum correlation sensitivity for the first vibration mode (99.6%).
Overall, the assessment of FE numerical outcomes towards background experimental frequency estimates or simplified analytical frequencies (for the water-filled container) showed that:
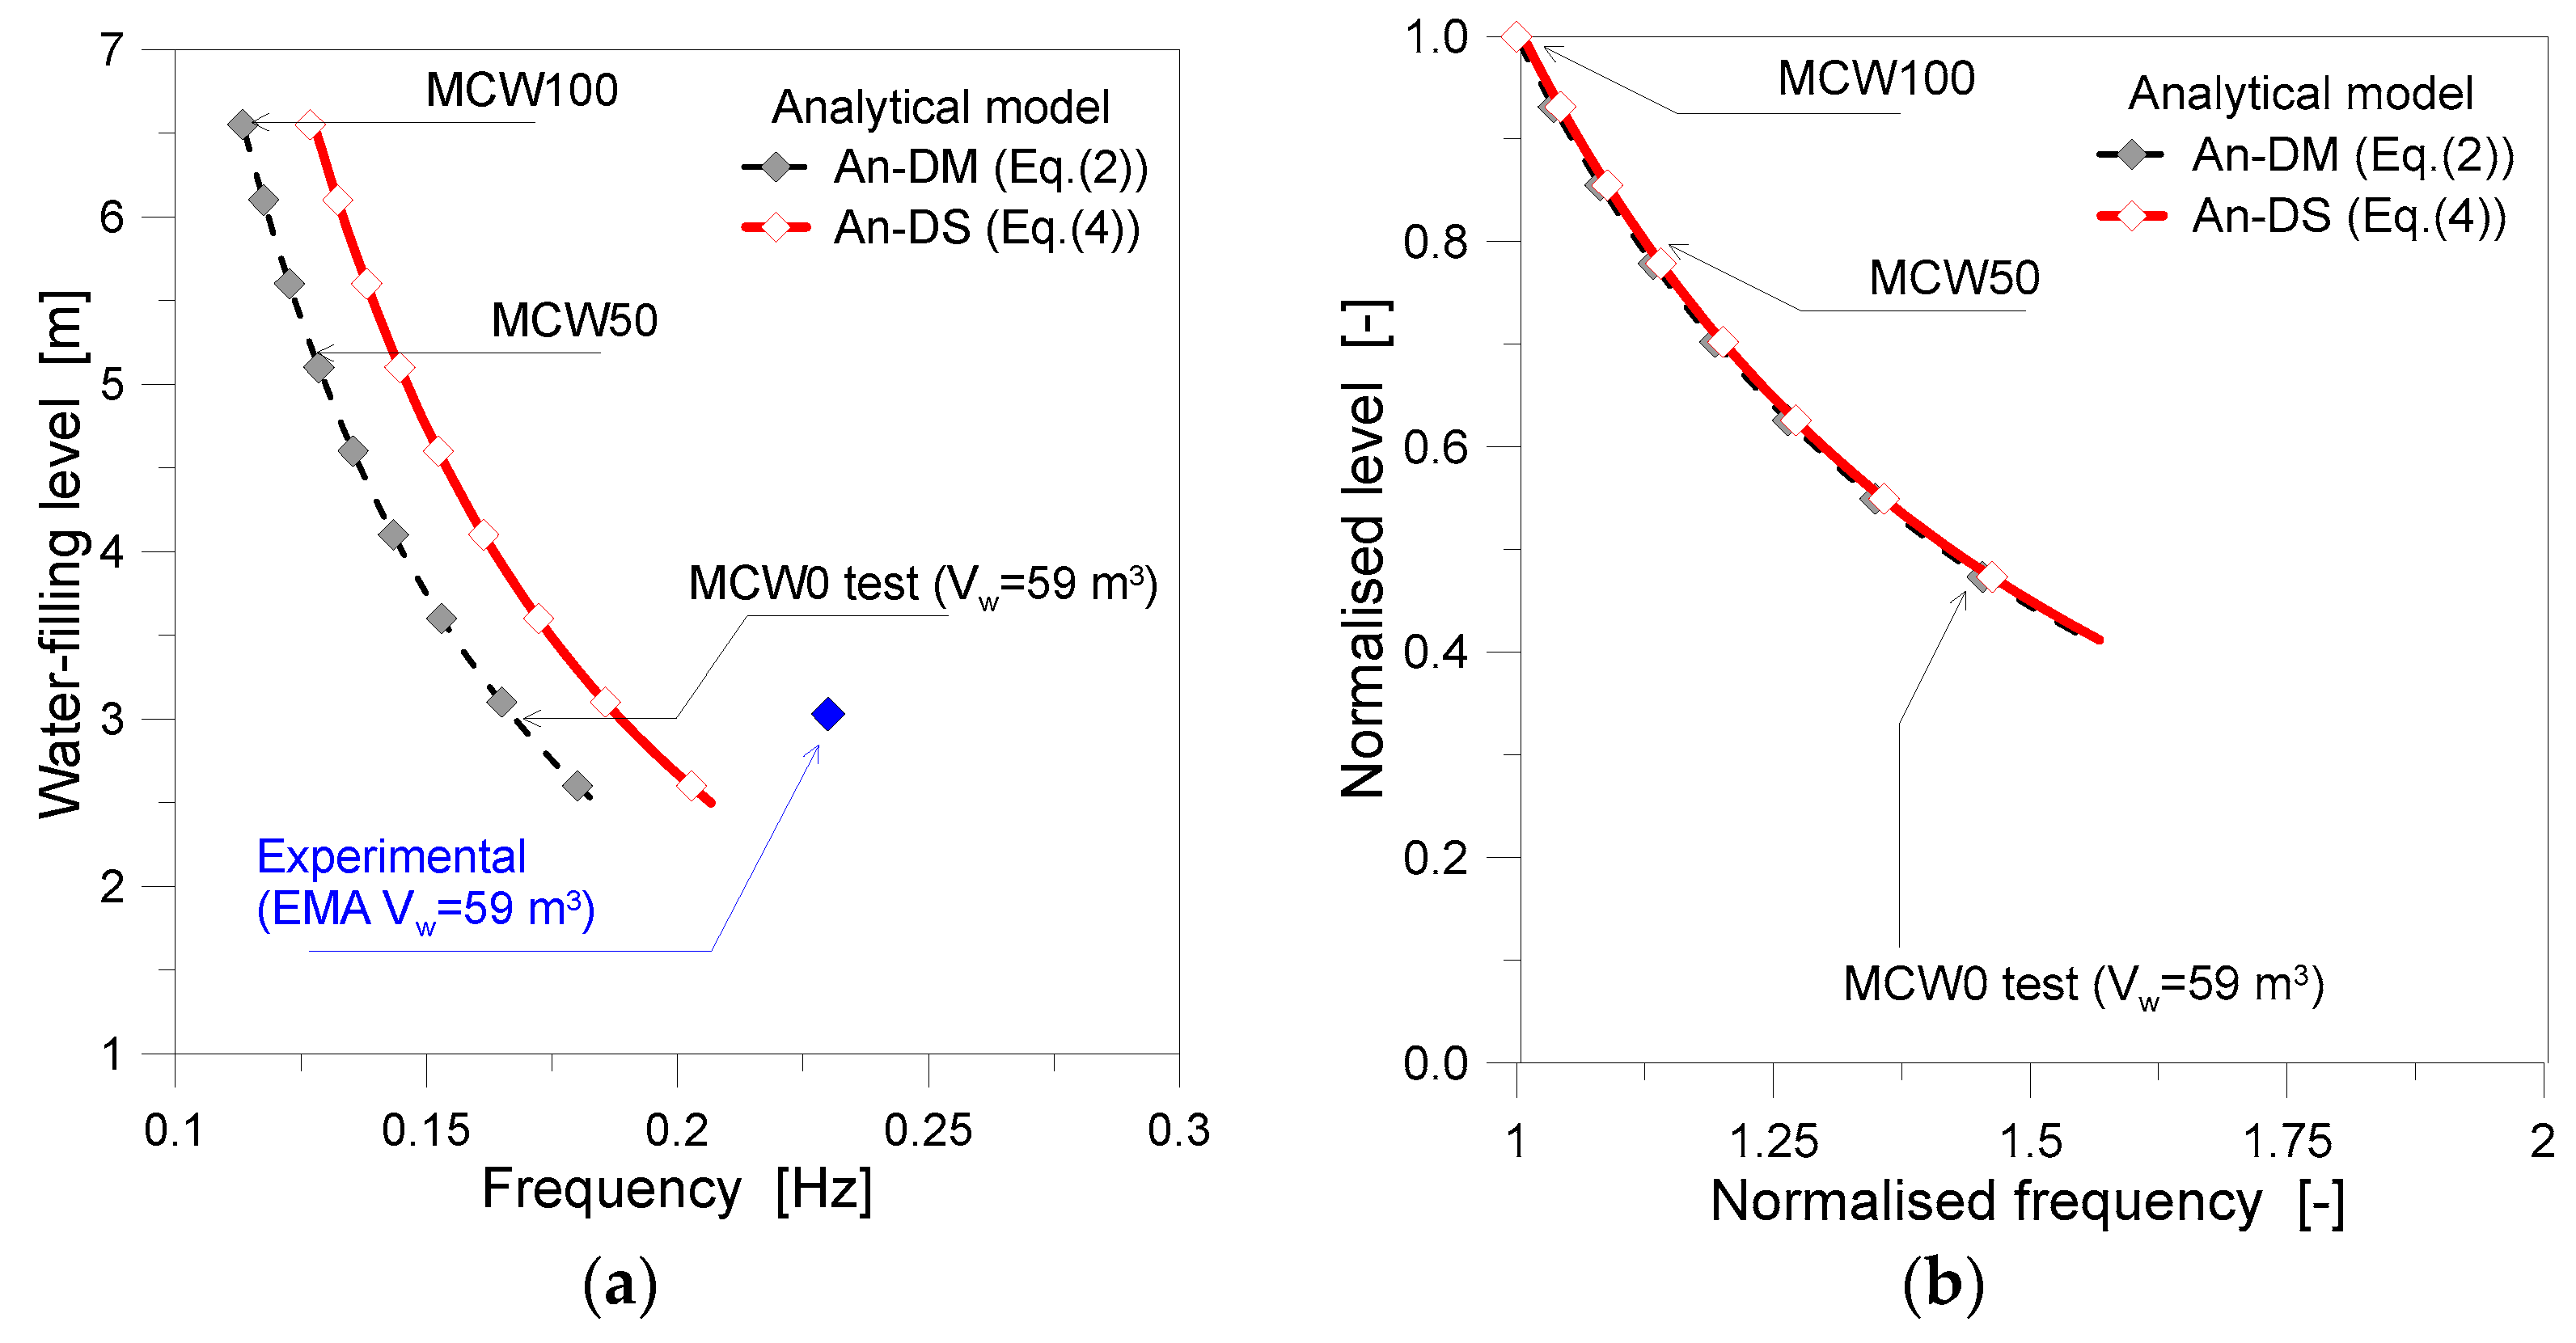
  • Consolidated analytical formulations from the literature, when used for the first vibration frequency prediction, showed a rather good agreement with M1-DM, M1-DS, or M2 numerical estimates, but a major scatter towards the experimental vibration frequency of the examined EWT (half-filled container).
  • In this sense, the availability of in-field experimental tests is of utmost importance for the appropriate calibration and validation of numerical assemblies but should be possibly carried out by taking into account multiple operational conditions (i.e., water-filling levels) and a sufficient number/arrangement of instruments to reproduce the corresponding vibration shapes. In the present study, the scarce availability of experimental frequency data and the lack of corresponding modal shapes for the 50-year-old EWT represented a major gap for possible model updating.

Author Contributions

C.B., conceptualisation, methodology, software, data curation, visualisation, investigation, validation, supervision, and writing—original draft preparation; C.A., conceptualisation, methodology, supervision, and writing—original draft preparation; and M.F. and L.B., software, data curation, and writing—original draft preparation. All authors have read and agreed to the published version of the manuscript.

Funding

This research study received no funding.

Data Availability Statement

Data will be made available on request.

Acknowledgments

Pieralberto Fadalti and Riccardo De Marco are acknowledged for sharing experimental results and for providing technical support in the numerical analysis. Claudio, you’re always with us, we will never forget you.

Conflicts of Interest

The authors declare that they have no conflict of interest.

References

  1. Chitte, C.J.; Charhate, S.; Mishra, S.S. Seismic performance of R.C. elevated water storage tanks. Mater. Today Proc. 2022, 65, 901–907. [Google Scholar] [CrossRef]
  2. Dilena, M.; Dell’Oste, M.F.; Gubana, A.; Morassi, A.; Polentarutti, F.; Puntel, E. Structural survey of old reinforced concrete elevated water tanks in an earthquake-prone area. Eng. Struct. 2021, 234, 111947. [Google Scholar] [CrossRef]
  3. Mori, C.; Sorace, S.; Terenzi, G. Seismic assessment and retrofit of two heritage-listed R/C elevated water storage tanks. Soil Dyn. Earthq. Eng. 2015, 77, 123–136. [Google Scholar] [CrossRef]
  4. Soroushnia, S.; Tafreshi, S.T.; Omidinasab, F.; Beheshtian, N.; Soroushnia, S. Seismic performance of RC elevated water tanks with frame staging and exhibition damage pattern. Procedia Eng. 2011, 14, 3076–3087. [Google Scholar] [CrossRef] [Green Version]
  5. Lopes, H.M.; Oliveira, C.S. Use of in-situ dynamic measurements to calibrate analytical models of RC-elevated water tanks. Shock Vib. 2012, 19, 903–914. [Google Scholar] [CrossRef]
  6. Sweedan, A.M.I.; El Damatty, A.A. Equivalent models of pure conical tanks under vertical ground excitation. J. Struct. Eng. 2005, 131, 725–733. [Google Scholar] [CrossRef]
  7. Anagha, B.V.; Nimisha, P.; Jayalekshmi, B.R. A study on effect of fluid on the modal characteristics of ground supported water tanks. IOP Conf. Ser. Mater. Sci. Eng. 2020, 936, 012027. [Google Scholar] [CrossRef]
  8. Nicolici, S.; Bilegan, R.M. Fluid structure interaction modeling of liquid sloshing phenomena in flexible tanks. Nucl. Eng. Des. 2013, 258, 51–56. [Google Scholar] [CrossRef]
  9. Mansour, A.M.; Kassem, M.M.; Nazri, F.M. Seismic vulnerability assessment of elevated water tanks with variable staging pattern incorporating the fluid-structure interaction. Structures 2021, 34, 61–77. [Google Scholar] [CrossRef]
  10. Martínez-Martín, F.J.; Yepes, V.; González-Vidosa, F.; Hospitaler, A.; Alcalá, J. Optimization Design of RC Elevated Water Tanks under Seismic Loads. Appl. Sci. 2022, 12, 5635. [Google Scholar] [CrossRef]
  11. Housner, G.W. Dynamic pressures on accelerated fluid containers. Bull. Seismol. Soc. Am. 1957, 47, 15–35. [Google Scholar] [CrossRef]
  12. Housner, G.W. Dynamic behavior of water tanks. Bull. Seismol. Soc. Am. 1963, 53, 381–387. [Google Scholar] [CrossRef]
  13. Bedon, C.; Dilena, M.; Morassi, A. Ambient vibration testing and structural identification of a cable-stayed bridge. Meccanica 2016, 51, 2777–2796. [Google Scholar] [CrossRef] [Green Version]
  14. Jhung, M.J.; Kang, S.-S. Fluid effect on the modal characteristics of a square tank. Nucl. Eng. Technol. 2019, 51, 1117–1131. [Google Scholar] [CrossRef]
  15. Amabili, M.; Pagnanelli, F.; Pellegrini, M. Experimental modal analysis of a water-filled circular cylindrical tank. Trans. Built Environ. 2001, 56, 267–276. [Google Scholar]
  16. Jhung, M.J.; Yu, S.O.; Lim, Y.T. Dynamic characteristics of a partially fluid-filled cylindrical shell. Nucl. Eng. Technol. 2011, 43, 167–174. [Google Scholar] [CrossRef] [Green Version]
  17. Livaoglu, R.; Dogangun, A. Simplified seismic analysis procedures for elevated tanks considering fluid-structure-soil interaction. J. Fluids Struct. 2006, 22, 421–439. [Google Scholar] [CrossRef]
  18. Virella, J.C.; Godoy, L.A.; Suarez, L.E. Fundamental modes of tank-liquid systems under horizontal motions. Eng. Struct. 2006, 28, 1450–1461. [Google Scholar] [CrossRef]
  19. Curadelli, O.; Ambrosini, D.; Mirasso, A.; Amani, M. Resonant frequencies in an elevated spherical container partially filled with water: FEM and measurement. J. Fluids Struct. 2010, 26, 148–159. [Google Scholar] [CrossRef]
  20. ACI 371R-98; Guide for Analysis, Design, and Construction of Concrete-Pedestal Water Tanks. American Concrete Institute: Farmington Hills, MI, USA, 1998.
  21. De Marco, R. Analisi Comportamentale e Sismica di un Serbatoio Pensile con Vasca Troncoconica di 800 mc: Studio Dell’interazione Acqua-Struttura; University of Trieste: Trieste, Italy, 2022. (In Italian) [Google Scholar]
  22. De Martino, G.; De Paola, F.; Giugni, M.; Fontana, N. Evaluation of hydrodynamic effects on elevated cone-shaped water tanks. In Fluid Structure Interaction and Moving Boundary Problems IV; Chakrabarti, S.K., Brebbia, C.A., Eds.; WIT Press: Southampton, UK, 2007; pp. 25–34. [Google Scholar]
  23. De Stefano, A. Sulla verifica antisismica approssimata dei serbatoi d’acqua tronco-conici in C.A. In Atti Dell’Istituto di Scienza delle Costruzioni; Politecnico di Torino: Torino, Italy, 1983. [Google Scholar]
  24. Consiglio Superiore dei Lavori Pubblici. Italian National Building Code “NTC 2018”; Italian Ministry of Infrastructure and Transportation: Rome, Italy, 2018. (In Italian)
  25. EN 12504-1:2019; Testing Concrete in Structures—Part 1: Cored Specimens—Taking, Examining and Testing in Compression. SIST: Ljubljana, Slovenia, 2019.
  26. EN 12504-2:2012; Testing Concrete in Structures—Part 2: NDT—Determination of Rebound Number. SIST: Ljubljana, Slovenia, 2012.
  27. EN 12504-4:2004; Testing Concrete—Part 4: Determination of Ultrasonic Pulse Velocity. SIST: Ljubljana, Slovenia, 2004.
  28. CSI. SAP2000—Integrated Software for Structural Analysis and Design, version 24.2.0; Computers and Structures Inc.: Berkeley, CA, USA, 2003. [Google Scholar]
  29. Simulia. ABAQUS—Computer Software and Online Documentation, version 6.14; Dassault Systems: Johnston, RI, USA, 2023. [Google Scholar]
Figure 1. Elevated water tank object of study: (a) bottom view; (b) top view; and (c) schematic cross-section axonometry (based technical drawings).
Buildings 13 01414 g001
Figure 2. On-site experiments for material characterisation: (a) steel and (b,c) concrete testing.
Buildings 13 01414 g002
Figure 3. Background experiments for dynamic identification of the system: (a) experimental setup and (b) geometrical details for the tested configurations (cross-section).
Buildings 13 01414 g003
Figure 4. Details of simplified M0 model strategy (SAP2000). (a) Axonometric drawing of container. (b) M0 assembly concept.
Buildings 13 01414 g004
Figure 5. Schematic representation of two-mass modelling strategy, based on Housner’s formulations.
Buildings 13 01414 g005
Figure 6. Overview of simplified M1-DM model (SAP2000). (a) Axonometry. (b) Model details (cross-section).
Buildings 13 01414 g006
Figure 7. Schematic geometrical model of a cone-shaped tank scheme and mechanical equivalence based on De Stefano’s approach.
Buildings 13 01414 g007
Figure 8. Overview of simplified M1-DS model (SAP2000). (a) Side view. (b) Model details (cross-section).
Buildings 13 01414 g008
Figure 9. Overview of coupled acoustic-structural M2 model (ABAQUS). (a) Axonometry. (b) Detail of container (top cover hidden).
Buildings 13 01414 g009
Figure 10. Fundamental vibration frequencies for low structural modes: (a) numerical results and (b) percentage scatter compared to experimental frequencies.
Buildings 13 01414 g010
Figure 11. Fundamental vibration shapes for the structural modes of the tank with empty container (side view of M1-DS model, SAP2000). (a) Mode 1 (1st flexural). (b) Mode 2 (torsional). (c) Mode 3 (2nd flexural).
Buildings 13 01414 g011
Figure 12. Fundamental vibration shapes for the structural modes of the tank with empty container (M2 model, ABAQUS). (a) Mode 1 (1st flexural) Side view. (b) Mode 1 (1st flexural) Front view. (c). Mode 3 (2nd flexural) Side view. (d) Mode 3 (2nd flexural) Front view.
Buildings 13 01414 g012
Figure 13. Normalised displacements for (a) first and (b) second flexural modal shapes, based on various modelling strategies (M1-DM, M1-DS, and M2).
Buildings 13 01414 g013
Figure 14. Analytical variation of fundamental vibration frequency for the tank with water infill, based on De Martino (from Equation (2)) or De Stefano (Equation (4)) formulation: (a) frequency-to-infill level trend and (b) normalised variations.
Buildings 13 01414 g014
Figure 15. Experimental, analytical, and numerical fundamental vibration frequency for (a) MCW50 (half-full container) and (b) MCW100 (full) configurations.
Buildings 13 01414 g015
Figure 16. Variation of vibration frequency for the EWT with water infill (MCW50 towards MCW0 configurations). Δ = 100 × (fMCW50fMCW0)/fMCW0.
Buildings 13 01414 g016
Figure 17. Normalised displacements for (a) first and (b) second flexural modal shapes, based on the M2 modelling strategy, under empty (MCW0), or half-full (MCW50) configurations.
Buildings 13 01414 g017
Figure 18. Modal correlation for numerical modal shapes: (a) M1-DM and M1-DS in empty configuration (MCW0) and (b) M2 model sensitivity to water infill (MCW50).
Buildings 13 01414 g018
Table 1. Arrangement of steel rebars and stirrups (based on on-site inspections and experiments carried out in 2022).
RebarsStirrups
Diameter
[mm]
Spacing
[cm]
Diameter
[mm]
Spacing
[cm]
Shank16301220
Container20161435
Table 2. Material characterisation (based on on-site inspections and experiments carried out in 2022).
SteelConcrete
N. Samplesfy
[MPa]
fu
[MPa]
fu/fyN. Samplesfc
[MPa]
Stem—GL4517.5814.91.57443.9
Stem—3L6529.5822.71.55445.9
Stem—5L4528.4791.71.50439.6
Table 3. Fundamental vibration periods for the structure (based on experiments carried out in 2022).
Vibration Frequency [Hz]
ModeEMA (Free Decay)
OrderTypeMCW0
(Vw = 59 m3)
MCW50
(Vw = 423 m3)
Δ
[%]
S1Sloshingn.a.0.230n.a.
11st flexural1.3161.176−10.64
2Torsional3.4483.446−0.06
32nd flexural8.3337.692−7.69
Table 4. Summary of selected FE modelling strategies, with evidence of major input features.
Numerical Model
M0M1-DMM1-DSM2
Type of
elements
Beam + shellBeam + shellBeam + shellSolid
DOFs650035,85487,708419,301
ContainerEquivalent plate (shell)Equivalent cylinder (beam + shell)Truncated cone (beam + shell)Truncated cone
(solid)
ShankEmpty cylinder,
no shank door (beam)
Empty cylinder,
no shank door (shell)
Empty cylinder,
no shank door (shell)
Cylinder + door opening + diaphragms (solid)
Structural symmetryYesYesYesNo
FSI
phenomena
Not availableSpring + Mass
system
Spring + Mass
system
Acoustic solid elements
(>DOFs)
Table 5. Vibration frequencies for the structure with empty container, based on M0 model (SAP2000). Δ = 100 × (fnumfexp)/fexp.
Vibration Frequency [Hz]
ModeExperimentalNumerical
OrderTypeEMA
(MCW0)
M0 Model
(Empty)
Δ
[%]
11st flexural1.3161.299−1.29
2Torsional3.4482.703−21.61
32nd flexural8.3337.143−14.28
Table 6. Fundamental structural vibration frequencies, based on M1-DM, M1-DS, or M2 model setup configurations (SAP2000 and ABAQUS). Δ = 100 × (fnumfexp)/fexp.
Vibration Frequency [Hz]
ModeExperimentalNumerical
OrderTypeEMAM1-DMΔ
[%]
M1-DSΔ
[%]
M2Δ
[%]
11st flexural1.3161.282−2.581.316≈01.3990.99
2Torsional3.4483.125−9.373.333−3.343.5673.45
32nd flexural8.3335.882−29.417.143−14.287.529−9.65
Table 7. Fundamental vibration frequencies for the coupled fluid–structure system (MCW50 configuration), based on M1-DM, M1-DS, or M2 models (SAP2000 and ABAQUS). Δ = 100 × (fnumfexp)/fexp.
Vibration Frequency [Hz]
ModeExperimentalNumerical
OrderTypeEMAM1-DMΔ
[%]
M1-DSΔ
[%]
M2Δ
[%]
11st flexural1.1761.2052.501.2677.741.2334.85
2Torsional3.4462.917−15.353.294−4.413.5111.89
32nd flexural7.692n.a.n.a.6.996−9.056.375−17.12
Table 8. Fundamental vibration frequencies for the coupled fluid–structure system, based on M1-DM, M1-DS, or M2 models (SAP2000 and ABAQUS). Δ = 100 × (fMCW50fMCW0)/fMCW0.
Vibration Frequency [Hz]
ModeM1-DMM1-DSM2
OrderMCW0MCW50Δ
[%]
MCW0MCW50Δ
[%]
MCW0MCW50Δ
[%]
11.2821.205−2.501.3161.267−3.721.3991.233−11.87
23.1252.917−3.043.3333.294−1.173.5673.511−1.57
35.882n.a.n.a.7.1436.996−2.067.5296.375−15.33
Disclaimer/Publisher’s Note: The statements, opinions and data contained in all publications are solely those of the individual author(s) and contributor(s) and not of MDPI and/or the editor(s). MDPI and/or the editor(s) disclaim responsibility for any injury to people or property resulting from any ideas, methods, instructions or products referred to in the content.

