Article

Probabilistic Incremental Dynamic Analysis for Seismic Isolation Systems through Integration with the NHERI-SimCenter Performance-Based Engineering Application

1
Department of Civil Engineering, College of Engineering, American University of Sharjah, Sharjah P.O. Box 26666, United Arab Emirates
2
Materials Science and Engineering Program, College of Arts and Sciences, American University of Sharjah, Sharjah P.O. Box 26666, United Arab Emirates
3
Structural Engineering Department, Faculty of Engineering, Tanta University, Tanta P.O. Box 31733, Egypt
*
Author to whom correspondence should be addressed.
Buildings 2023, 13(6), 1413; https://doi.org/10.3390/buildings13061413
Submission received: 10 April 2023 / Revised: 15 May 2023 / Accepted: 24 May 2023 / Published: 30 May 2023
(This article belongs to the Special Issue Base Isolation for Earthquake-Resistant Design)

Abstract

:
In the wake of the 1994 Northridge and 1995 Kobe earthquakes, structural designers adopted performance-based engineering concepts instead of traditional deterministic design approaches. The primary change was to evaluate the design according to stakeholders’ interests instead of the engineering parameters. This evaluation process required a probabilistic estimation for the included variables at all design stages. The NHERI-SimCenter application framework provides generic solutions implemented in different hazard simulation problems. Seismic isolation is an efficient, proven technique for improving seismic performance by limiting drift ratios and reducing damage. During the design stage, seismic isolation-system parameters must be carefully calibrated to control different aspects of the response, and it is necessary to run multiple simulations and count for parameter uncertainties. This research introduced components for seismic isolation and incremental dynamic analysis procedures integrated with framework modules, such as uncertainty quantifications and damage and loss estimation. Furthermore, an illustrative case study was included to reflect the impacts of this development.

Graphical Abstract

1. Introduction

The traditional philosophy of seismic design of structures is bounded by two primary variables: earthquake intensity and corresponding damage for structural and non-structural elements. The acceptance criteria are: preventing any damage in low-intensity earthquakes; accepting only repairable damage in medium-intensity earthquakes; and preventing collapse in high-intensity earthquakes. The structural engineering community recognized many deficits in this methodology after the 1994 Northridge and 1995 Kobe earthquakes. Although structures were designed according to seismic codes inherited from this philosophy, the reported total damage and economic losses were extremely high [1]. The deterministic methodology describes the structural design only in binary terms, as either safe or unsafe. Additionally, it depends only on meaningful parameters for engineers, not other stakeholders. These facts initiated the concept of performance-based earthquake engineering (PBEE).
In 1995, The Structural Engineers Association of California (SEAOC) published its PBEE Vision 2000 report, which is considered the most remarkable document of first-generation PBEE in the USA. It defines a framework for performance-based earthquake design (PBED) by selecting the desired system performance at various earthquake intensity levels, as shown in Figure 1. Seismic hazard intensity can be described as frequent, occasional, rare, or very rare events. Moreover, the system performance levels are classified as fully operational, operational, life-safety, and near-collapse. The design objectives are determined based on private property owners, e.g., residential, or commercial buildings, or by public resiliency requirements, such as those for hospital buildings. Additionally, subsequent documents of first-generation PBEE, e.g., FEMA-356 [2], introduced a similar framework with different descriptions for hazard levels and system performance. Despite the conceptual progress, this framework has several shortcomings related to the system performance estimation: (1) the engineering parameters are determined by structural analysis procedure, but the uncertainties in the numerical model are not considered; (2) the element performance is defined by a deterministic relationship with the engineering measures. These relationships can be calibrated from experimental tests or analytical models without a probability distribution; and (3) the overall system performance is assumed to be equal to the worst performance of any component.
The Pacific Earthquake Engineering Research Center (PEER) developed a more robust methodology fitting the complex, multi-disciplinary problem, thereby overcoming the deficits of earlier PBEE methods. Unlike first-generation PBEE frameworks, estimating the system performance includes variables that reflect the direct interests of various stakeholders, such as monetary loss, repair duration, and casualties. System performance assessment is based on a rigorous probabilistic framework consisting of four logical, sequential components: hazard analysis, structural analysis, damage analysis, and loss analysis. Each component defines and quantifies a set of variables according to two inputs probability of exceedance (POE) and inherent uncertainties. The relationships among element outcomes are expressed in a probabilistic form, i.e., p A B . These groups of variables are respectively known as intensity measures (IM), engineering demand parameters (EDP), damage measures (DM), and decision variables (DV), as shown in Figure 2. Many publications have summarized and explained the PEER methodology, such as [4,5,6].
The selection of optimal intensity measures (IMs) in probabilistic seismic demand models depends on several criteria, including efficiency, sufficiency, practicality, effectiveness, and hazard computability [7,8]. The efficiency criterion requires that the selected IMs be capable of providing accurate and reliable predictions of ground motion intensity. The sufficiency criterion requires that the selected IMs capture the key aspects of ground motion that are relevant to the response of the structure or system under consideration. The practicality criterion requires that the selected IMs be measurable and readily available. The effectiveness criterion requires that the selected IMs be capable of capturing the effects of earthquake hazards on the structure or system. Finally, the hazard computability criterion requires that the selected IMs be computationally efficient and amenable to probabilistic hazard analysis. In summary, the selection of optimal IMs for probabilistic seismic demand models involves a careful balance of these criteria to ensure that the models are both accurate and practical for use in seismic risk assessment and engineering design.
The hazard analysis considers the sources of earthquakes and facility characteristics to evaluate the ground motions’ IMs. It requires selecting nearby faults and collecting their descriptions, i.e., source–site distance, magnitude–recurrence frequencies, and fault mechanism. The facility data are defined in two terms: the location (O) and design characteristics (D), i.e., the fundamental period of vibration and the foundation type. Engineering seismology relationships, such as ground motion prediction equations, are employed to quantify the desired variables from these inputs, including issued uncertainties. The intensity measure variables might include: peak ground acceleration (PGA); peak ground velocity (PGV); spectral acceleration at the period of the first mode (Sa(T1)); spectral shape; and the duration of ground motions. The current attenuation relationships are based on interpolating empirical data from past earthquakes. For example, the PEER Strong Motion Database (http://peer.berkeley.edu, accessed on 5 April 2023) contains over 1500 records collected from 143 earthquakes [9]. Moreover, it contains associated site conditions and rupture properties. Although this estimating procedure is industry-accepted, it can cause a high bias error and subsequential uncertainty in extensive scattered data cases. PEER is currently investigating the expansion of this database by adding new records or providing more information about the included records. The next generation will include a higher range of data variety, less dispersion, and more confidence in expecting shaking intensity. The hazard curve shows hazard analysis results by plotting the selected IMs versus their mean annual frequency (M.A.F.) of exceedance [10]. These results can be transformed into IM versus probability of exceedance (POE) in “t” years by using Equation (1) for the Poisson model, as shown in Figure 2:
p I M = 1 e λ I M t
where λ I M is the annual frequency of exceedance of IM, and t can be considered as the duration of the facility life cycle.
After quantifying IM variables, the next step is to perform structural analysis to quantify the structure’s responses to these various ground motions. This process involves developing a computational model, performing nonlinear simulations, and calculating engineering demand parameters (EDP). This step’s uncertainty stems from the numerical model parameters such as mass, stiffness, strength, etc. Generally, EDPs characterize the response in terms of deformations, accelerations, induced forces, or other appropriate quantities [11]. Additionally, EDPs can be determined for local structural components’ behavior or the overall building behavior. For a structural component, element forces (i.e., axial and shear forces) and plastic deformations (i.e., rotations and deflections) are examples of practical EDPs. The global building behavior can be described in EDPs such as inter-story drift, floor velocity, floor acceleration, roof drift, etc. Global EDPs can indicate damage for different damageable components (both structural and non-structural elements). For example, inter-story drifts measure structural system damage [12], while floor acceleration is used for non-structural equipment, e.g., office or laboratory buildings [13]. PEER developed the incremental dynamic analysis (IDA) procedure to investigate the relationship between ground motion intensity and structural simulations. This procedure is based on repeating structural simulations with scaling input ground motions. The resulting series of values can establish the statistical relationships between IM and EDP or the POE of EDP at a particular IM. The structural analysis step requires several nonlinear time history analyses, as the total number of simulations equals the number of ground motions multiplied by different modeling variations. The PEER–PBEE formulation adopts a single value for each defined EDP, so the peak value from all simulations is selected. Additionally, performing multiple simulations demands excessive effort from structural engineers and consumes high computational time for traditional software. However, PEER has overcome this barrier by developing OpenSees (Open System for Earthquake Engineering Simulation; http://opensees.berkeley.edu, accessed on 5 April 2023) [14]. It represents an open-source, object-oriented, and parameter-based finite element simulation software. It contains several commands to model materials, sections, joints, structural elements, and liquefiable soils in a nonlinear behavior. Additionally, integrating structures and soil models allows the integration of soil–structure–foundation–interaction (SSFI) investigations. Unlike traditional methods, OpenSees can handle modeling parameter variations and multiple ground motions with less computational cost. Its efficiency can be attributed to the software architecture of well-designed interfaces by a substantial community of developers. The results of the structural analysis can be summarized as the determination of probability distribution functions (PDFs) of EDP (e.g., EDPj) for a given IM (e.g., IMm), as shown in Figure 2. The number of PDFs equals α multiplied by β, where α is the number of IM data points and β is the number of considered EDPs [11].
The damage measures (DM) are the quantitative variables describing the physical damage to structural elements, non-structural elements, and contents. These measures can be related to given EDPs through the damage analysis conditional probability relationships. The conditional relationships can be calibrated by the results of experiments or previous earthquake reconnaissance reports. PEER continuously develops conditional probability relationships for different components by collecting previous test data or performing other experiments. This procedure requires defining damageable groups, as each group includes facility parts that are similarly affected by certain EDPs. For example, Bohl [15] proposed a methodology for damage analysis of a steel moment frame building. It considered 16 damageable groups: the structural system, exterior enclosure, drift-sensitive and acceleration-sensitive non-structural elements, and office content on each floor. Multiple DM levels describing the types of required repair for a damageable group should be defined. For example, the three DM levels of structural elements defined by [16] are light, moderate, and severe (or collapse). They respectively represent repair with epoxy injections, repair with jacketing, and element replacement. A single EDP value cannot be mapped deterministically into a certain DM level because this value can occur in different structural response scenarios and with different behaviors. Instead, any DM level can occur according to this value but with different probabilities. Fragility curves are established to show the variations in POE of all defined DMs in different EDP values, as shown in Figure 2. The probability of kth DM level can be estimated from fragility curves according to the following algorithm for the jth damageable group of the facility, and the ith value of the EDP utilized for the fragility function:
for k 1:# of DM levels p D M k = p D M k E D P j i i f k = # p D M k = p D M k E D P j i p D M k + 1 E D P j i     o t h e r w i s e
The last step of the PEER PBEE methodology is the loss analysis to estimate decision variables (DVs). These variables reflect the direct interests of various stakeholders in the design. Some of the DVs are economic loss, repair duration, and the number of fatalities and injuries. A loss function is determined to calculate the POE of the losses for different damageable groups at different DMs. The total number of loss functions required for a facility is γ multiplied by λ, where γ and λ are the number of DMs and damageable groups, respectively. The accumulative loss curve can be calculated based on the total probability theorem. The probability of the nth value of the DV is according to Equation (3) [17] in the form of a triple summation.
p D V n = m i k p D V n D M k p D M k E D P j i p E D P j i I M m p I M m
The structural engineering community started to realize the impact of PBEE methodology. It was included in several benchmark studies, such as [12,13,18].
Over the past few years, the advancement of seismic isolation (SI) systems has been significant. However, this progress has created a need for further development in incremental dynamic analyses. Despite this, these SI systems have the potential to make significant contributions to various areas of structural engineering applications, such as structural assessment [19,20,21,22,23,24], and the application of soft computing techniques in civil engineering [25,26,27,28,29,30,31,32,33,34]. Additionally, they can aid in the evaluation of structures under various lateral loads (e.g., seismic [35,36,37,38,39,40,41,42,43,44,45,46,47,48,49,50,51,52,53,54,55,56,57,58,59,60,61,62,63,64,65,66,67] and wind [68,69,70,71,72] loads), as well as many other applications [73,74,75,76,77,78,79,80,81,82,83,84,85,86,87,88,89,90,91,92,93,94,95,96,97,98,99,100,101,102,103,104,105,106,107,108,109,110,111,112,113,114,115,116,117,118,119,120,121,122,123,124,125,126,127,128,129,130,131,132,133,134,135,136,137,138].

Research Significance

The research presented in this study holds significant importance in the field of structural engineering and seismic performance. The adoption of performance-based engineering concepts following major earthquakes has revolutionized the traditional deterministic design approach. By focusing on stakeholders’ interests and incorporating probabilistic estimation in the design process, engineers can enhance the reliability and safety of structures. Seismic isolation, a proven technique for mitigating earthquake damage, plays a crucial role in improving the seismic performance of structures. However, accurate calibration of seismic isolation system parameters is essential to control various response aspects. This research addresses this critical requirement by introducing components for seismic isolation and incremental dynamic analysis procedures integrated with uncertainty quantification and damage and loss estimation modules within the NHERI-SimCenter application framework. The addition of new features, including solving different isolated models and updating the user interface, enhances the functionality and usability of the framework. By advancing the capabilities of the NHERI-SimCenter application framework, this research contributes to the development of more reliable and efficient seismic design practices, ultimately leading to improved structural resilience and reduced seismic risks.

2. NHERI-SimCenter Application Framework

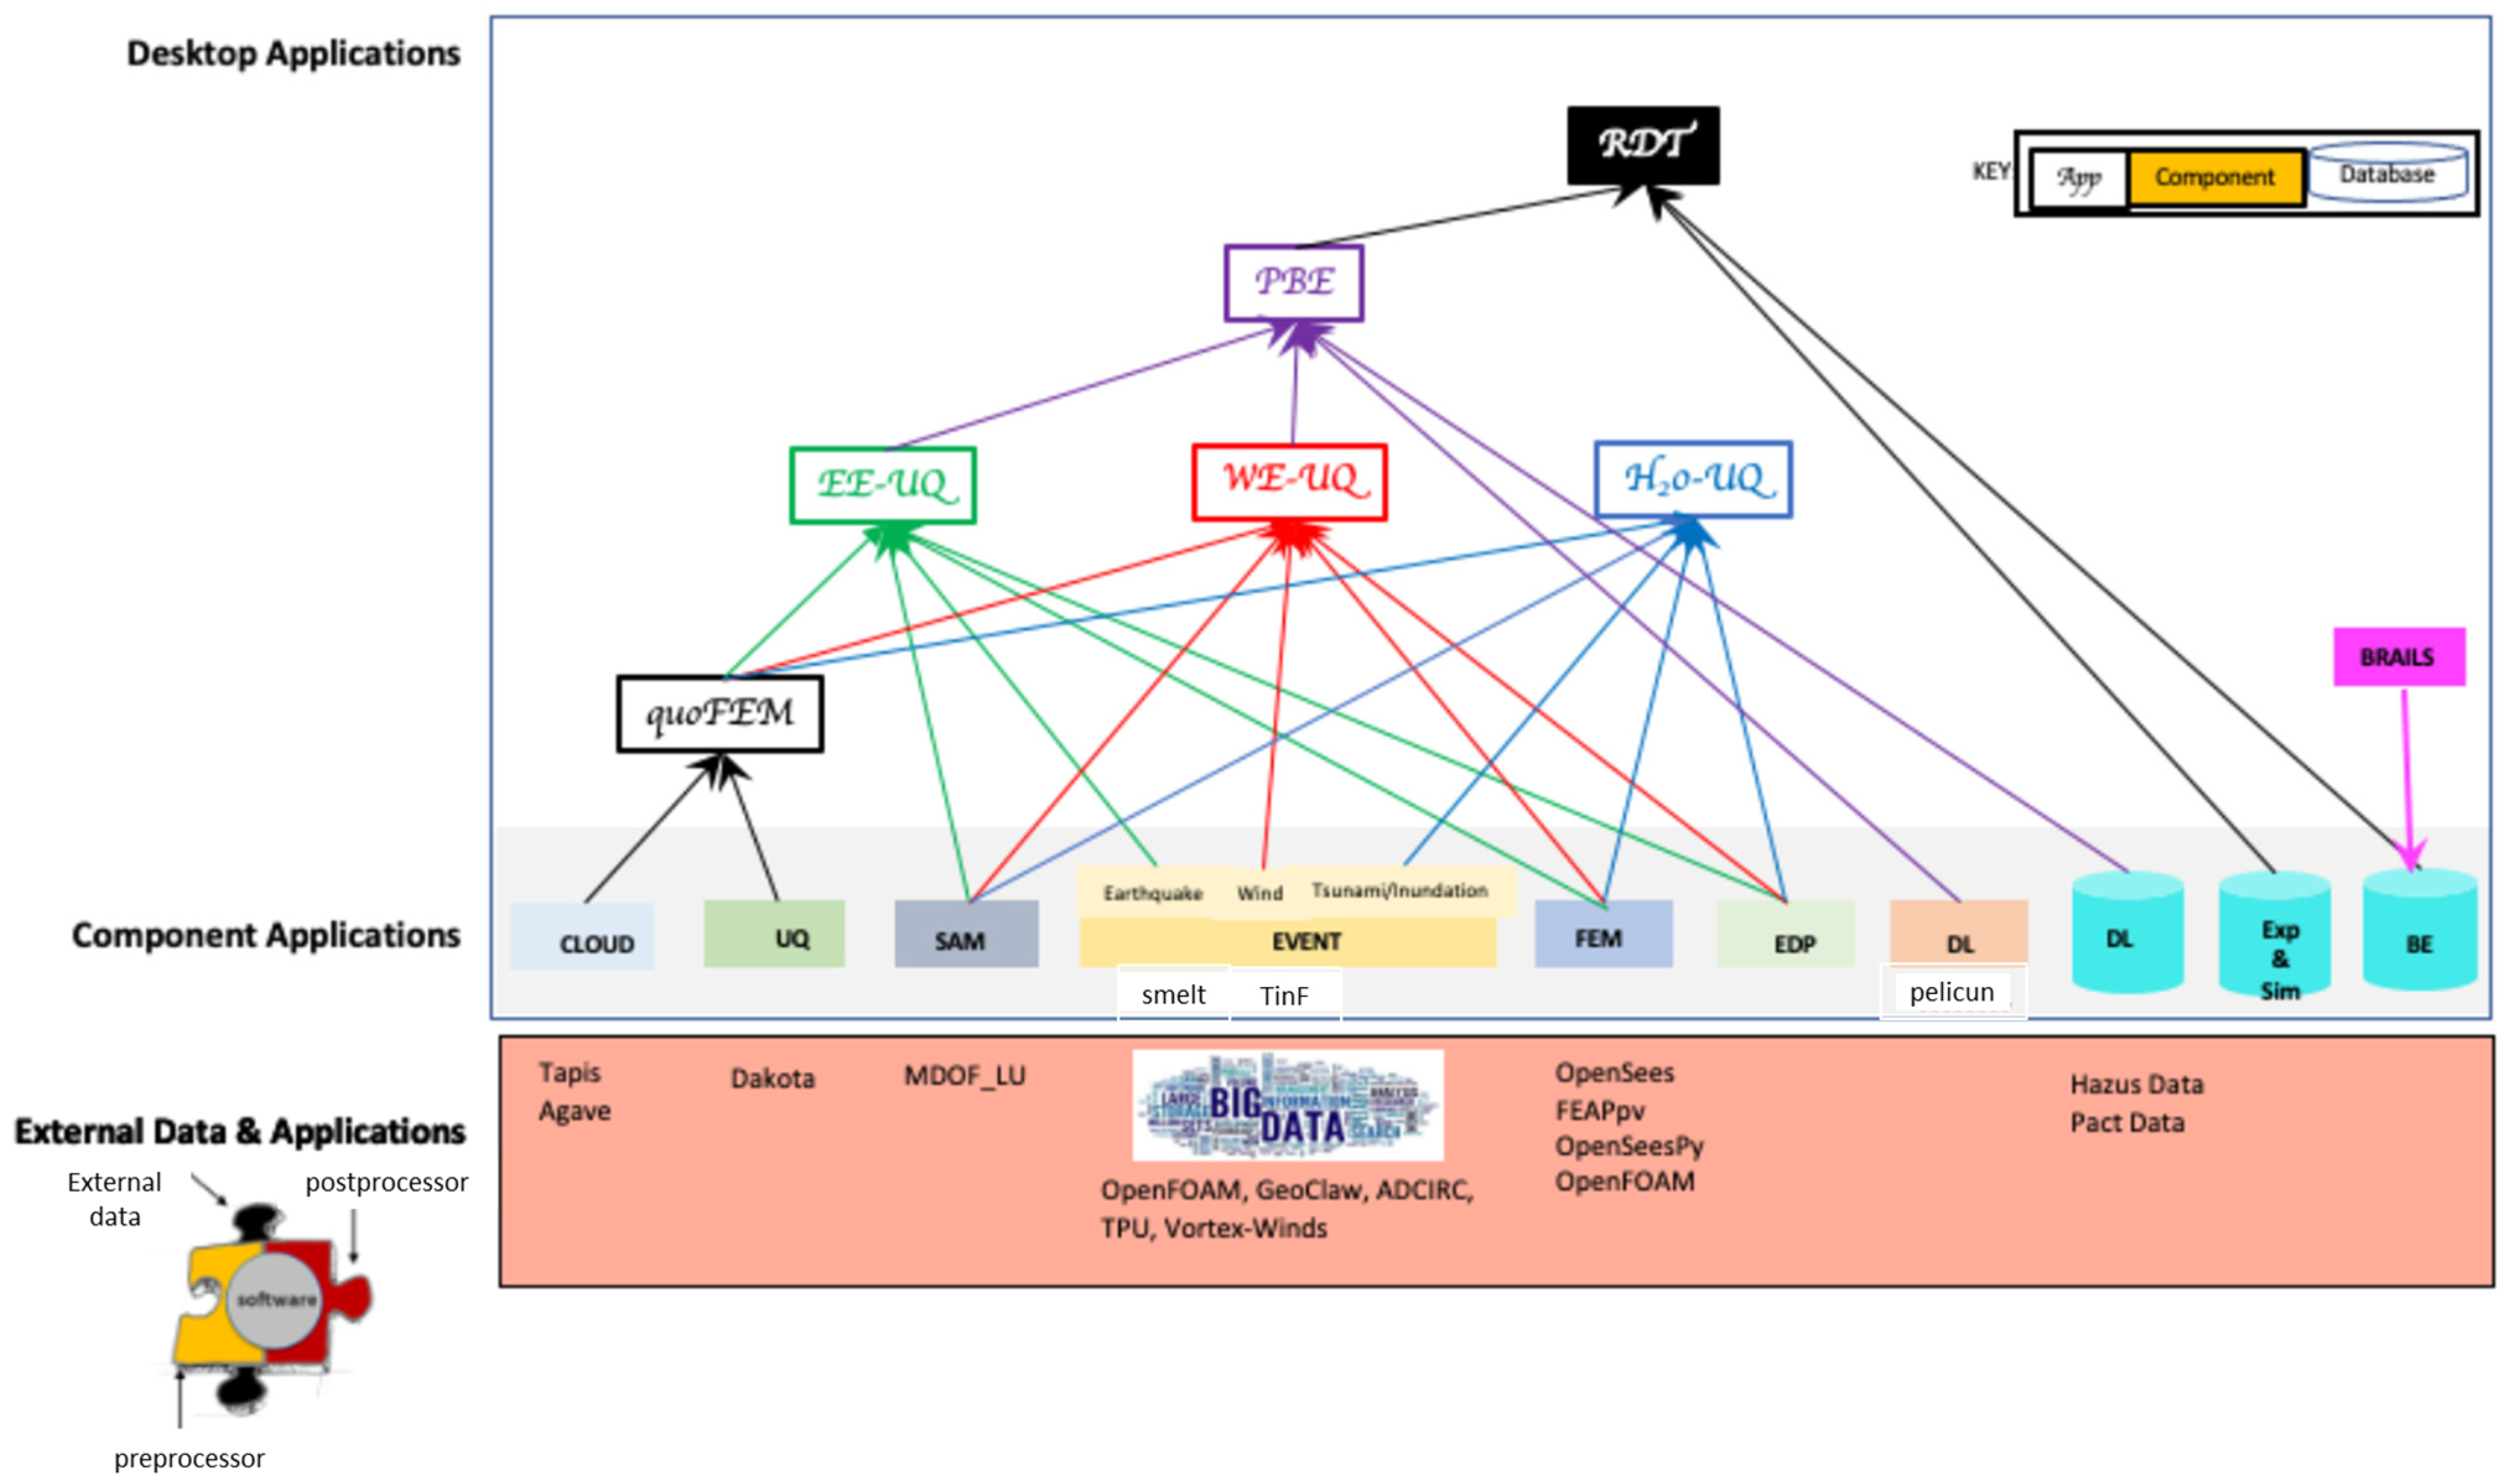
The Computational Modeling and Simulation Center (SimCenter) [139] develops many software tools specialized for natural hazard engineering (NHE) problems. The SimCenter’s vision contributes to The Natural Hazards Engineering Research Infrastructure (NHERI) program, funded by the National Science Foundation (NSF) in the United States. The main goal is to provide an application framework for researchers to use, build, and extend scientific workflows for natural hazard simulations. This framework implements integrated relationships among three units: model, scientific workflow, and application. The model is a conceptual component with a particular role or analysis procedure (refer to Figure 3). Practically, many software applications can simulate each model. However, a workflow is a collection of models integrated into a sequence to automate multi-step solutions. This approach requires developing pre- and post-processors for existing applications for data parsing. The end-user can customize the workflow by selecting the in-use application for each model depending on the nature of the problem, available input format, and the required specifications. Finally, the NHERI-SimCenter application is defined by a workflow as a backend package connected with a wrapping frontend user interface (UI). The UI components define workflow applications and their parameters, generate input file(s), and present output results. The architecture of the NHERI-SimCenter application framework [140], shown in Figure 4, has an intelligent design because it considers the following principles:
  • The architecture is designed as a modular framework to integrate with external applications or datasets. This feature can save repeating the work of an existing application and guarantee futural scalability and interoperability. For example, the NHERI-SimCenter team developed pre-and post-processors to benefit from existing applications such as OpenSees [141], OpenFOAM [142], and PEER Strong Ground Motion Databases [143]. Moreover, they developed and linked additional applications with the framework, such as Building Recognition using AI at Large-Scale (BRAIL) [144], to automate the collection of building inventory data;
  • End-users can excuse the computational workflow in their local desktop environment or on the cloud through DesignSafe [145]. The second method utilizes high-performance computing resources and parallel workflow executions for large-scale datasets;
  • The framework allows for defining input uncertainties in models. It implements uncertainty quantification (UQ) by utilizing Dakota [146] in sampling models with random variables. It supports various UQ methods: forward propagation, sensitivity analysis, and reliability analysis;
  • The architecture provides a high order of flexibility and generality. It is designed for NHE problems with different hazards, e.g., earthquake, wind, tsunami, or assets classification, such as buildings, network pipelines, bridges, etc. The ability to customize the scientific workflow, in areas such as available inputs, required outputs, and defined specifications in some models may accommodate the different interests of researchers.
Figure 3. The roles and sequences of models in the application framework proposed by NHERI-SimCenter [147].
Buildings 13 01413 g003
Figure 4. The architecture of the NHERI-SimCenter application framework [140].
Buildings 13 01413 g004
PELICUN [147], the Probabilistic Estimation of Losses, Injuries, and Community Resilience Under Natural Disasters, is a performance assessment framework developed by the NHERI-SimCenter. It includes three different workflows to estimate DVs from input IM, as shown in Figure 5. Each workflow determines a specific path and assumptions as follows:
  • The first path is the most rapid and straightforward calculation approach, skipping the structural and damage analysis steps. It consists of a single direct step from IM to DVs using vulnerability functions. These functions are calibrated using ground motion intensity maps, and insurance claims data from past earthquakes. This approach may be efficient for limited asset types, i.e., single-family timber houses;
  • The second approach breaks the process into two steps: estimating DMs through fragility functions and using consequence functions to identify DVs of repair. Fragility functions are calibrated based on previous earthquake databases of IMs and corresponding DMs for different building types. Similarly, consequence functions can be determined to describe the cost and time of repairs as a function of damages from standard construction practices;
  • The third path is the most detailed and computationally demanding approach, as it adds structure analysis to the second path. It requires a sophisticated estimation of structure response through a finite element model or measured with a structural health monitoring system. This response is used to identify the values of EDPs, e.g., peak inter-story drift (PID), residual inter-story drift (R.I.D.), and peak floor acceleration (PFA). Then, calibrated fragility curves measure the damage variables as a function in the EDPs.
Uncertainty quantification is a necessary model in the loss assessment process. Its implementation requires the creation of a large number of samples with random variables for inputs. The accuracy of the resulting DVs distribution curves increases according to the number of samples. However, increasing this number demands more computational resources and time for execution. This increase could be acceptable for the first and second paths and extreme for the third path because of the complexity of the structure response simulation. This problem is handled by estimating a few dozen EDP samples, then re-sampling them by fitting a probability distribution. The re-sampling technique will generate more samples for DMs and DVs models because they require fewer calculations with calibrated functions.
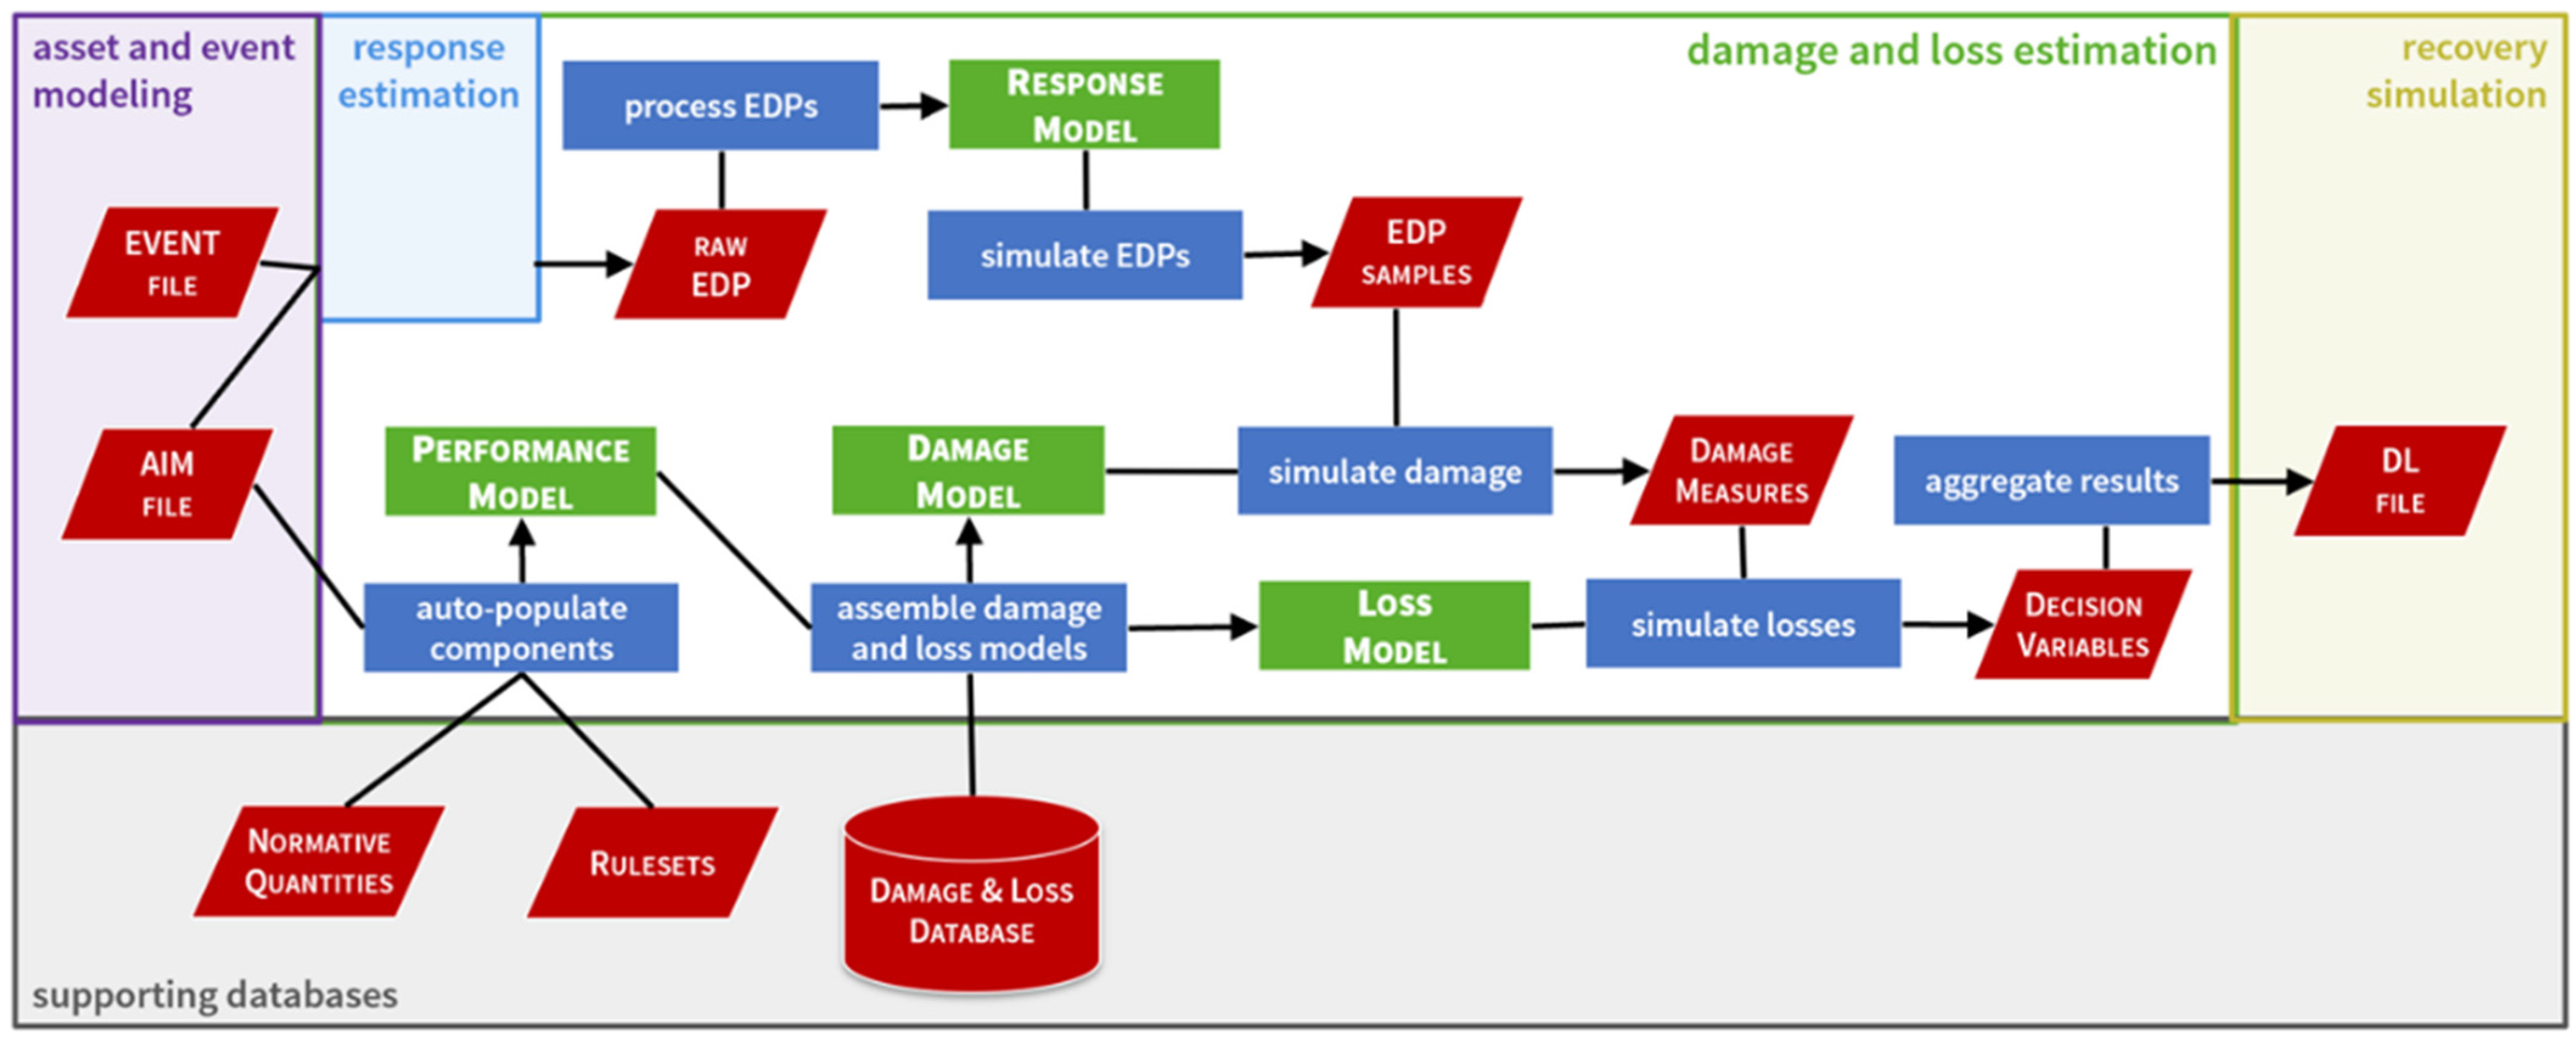
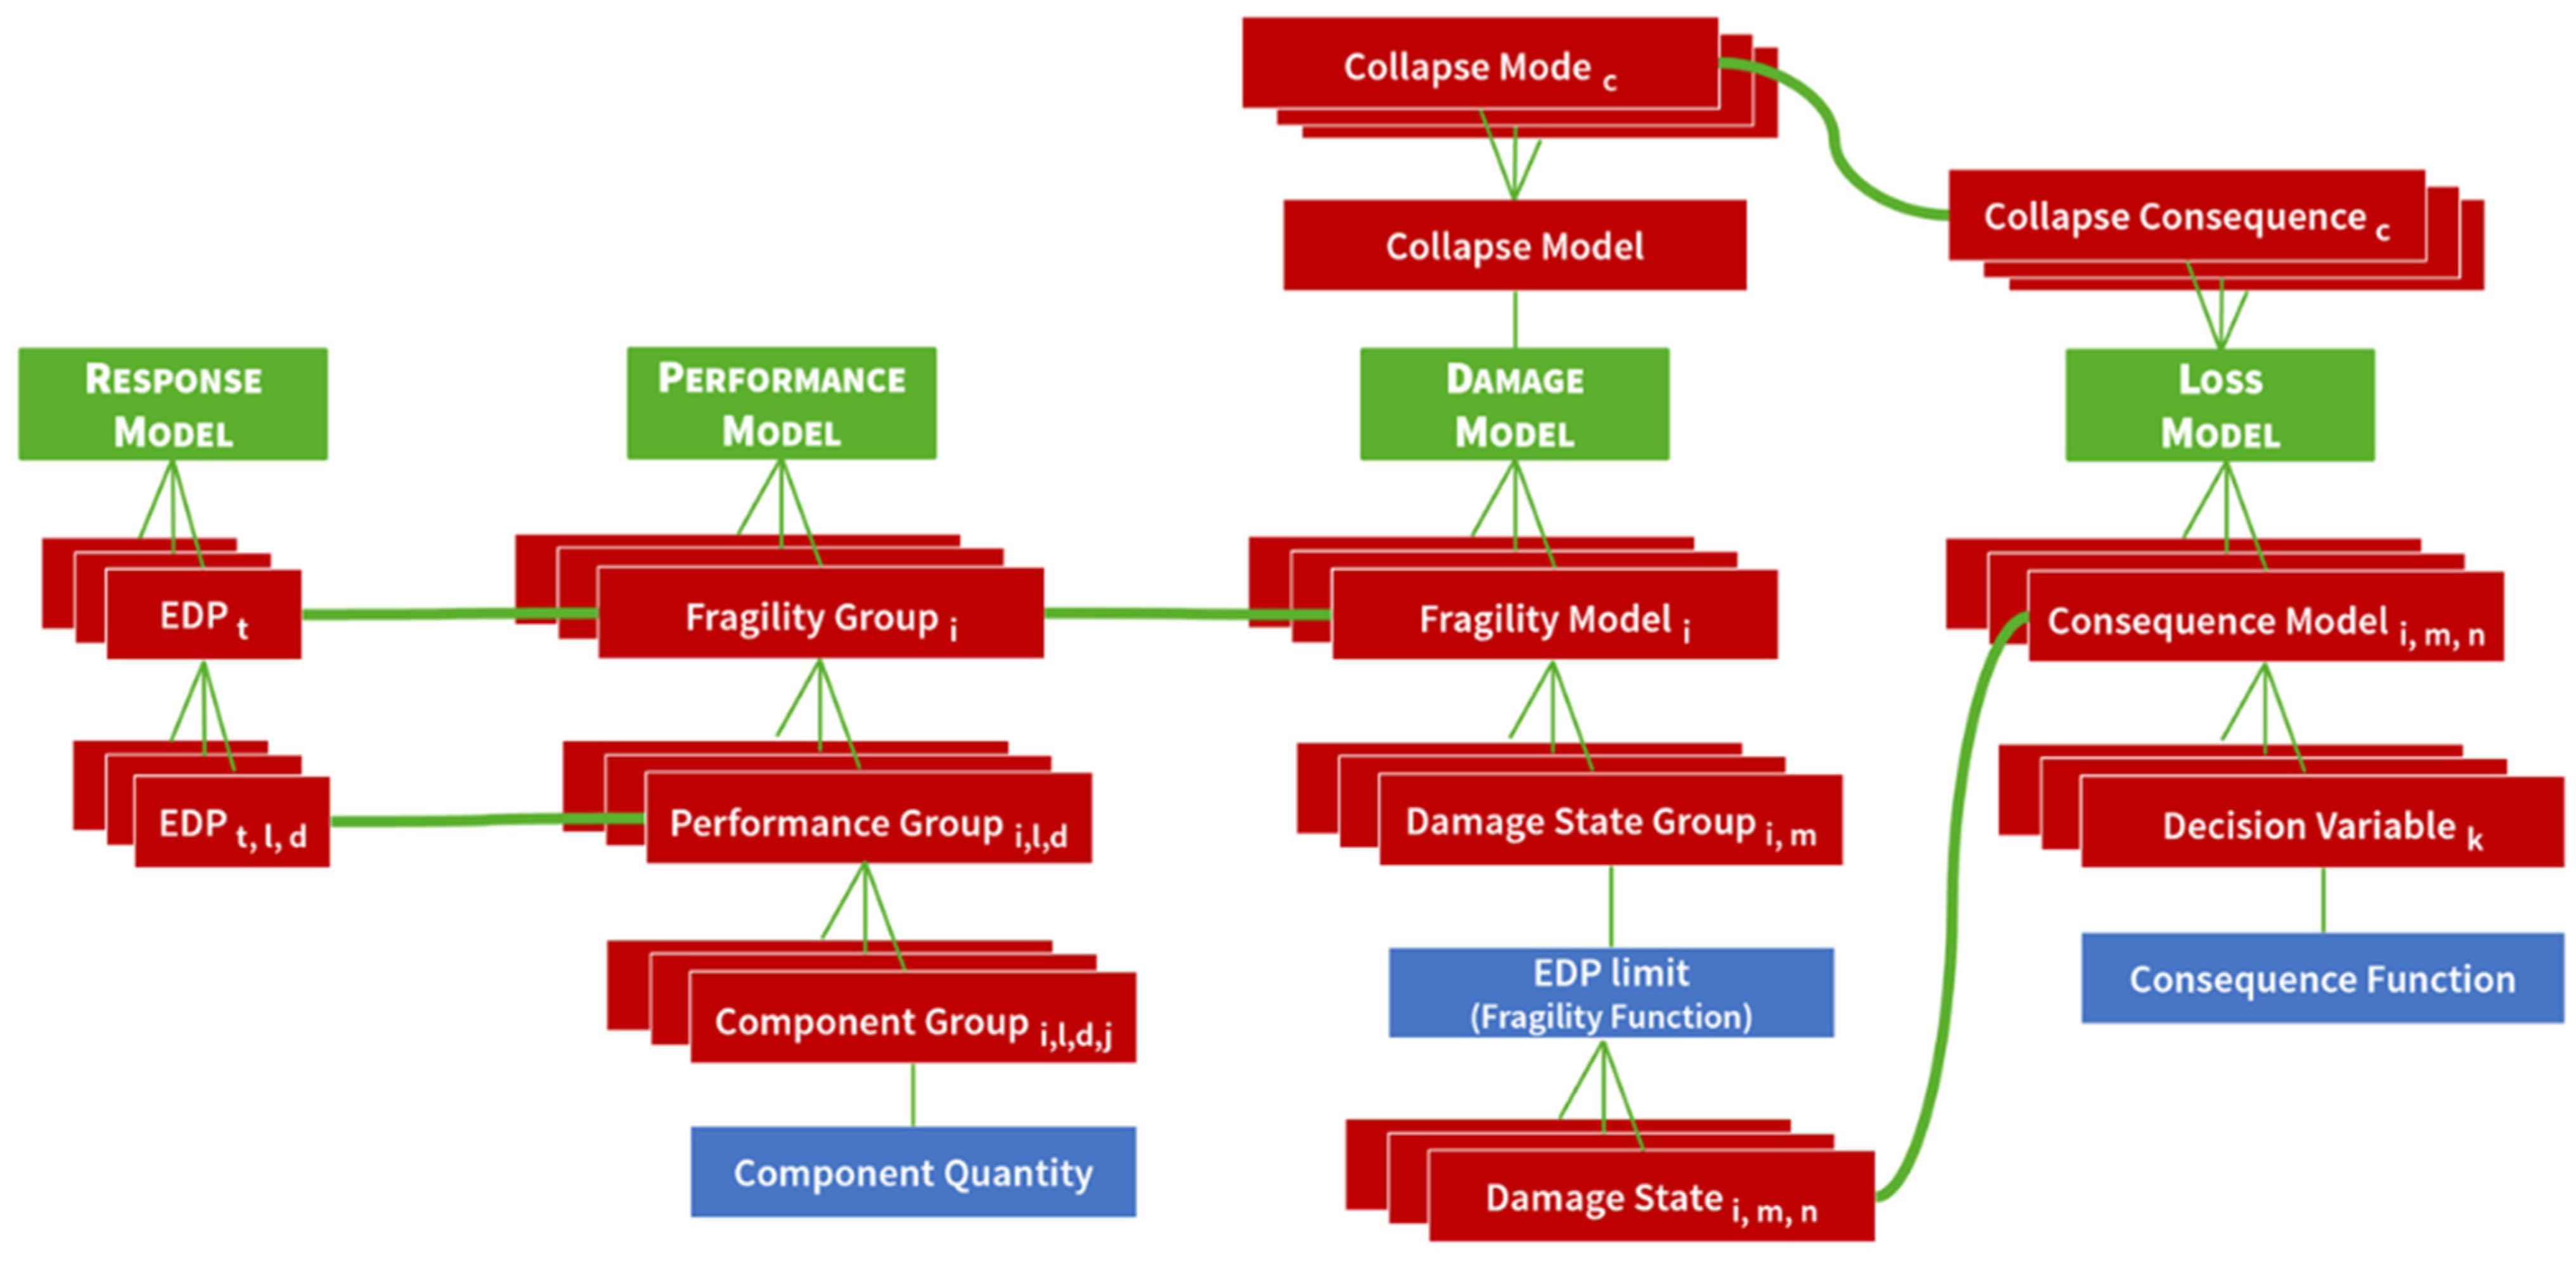
As explained in Figure 6, the software architecture has a flexible design that allows for all three paths [147]. Moreover, it considers minimizing computational resources and future scalability. The source code is written in Python to provide cross-platform usability, meaning that it works on Windows, Macintosh, and Unix operating systems. Furthermore, this will facilitate its usability in high-performance computing (HPC) cluster environments without requiring administrator support, compilation, or the installation of dependencies. Workflow inputs are the Asset Information Model (AIM) and EVENT files; both should follow a standard JSON format. Structure-response simulations are out of PELICUN’s scope, so this model integrates an exterior application to the framework, such as OpenSees [141]. The process of integration requires only developing interface classes for parsing data formats. The architecture includes four main models, and their objectives are shown in Figure 7 and determined as follows [20]:
  • The response model describes the outputs of structural simulations according to types of EDPs written in the raw EDP file. The peak values are selected in terms of (EDP:t-l-d) where t is the EDP type, l refers to the location (the floor), and d represents the direction index according to a predefined list of directions. For example, (PID-2-1) describes the maximum value of inter-story drift that occurred on the second floor and towards the first axis;
  • The performance model organizes the asset components (structural, non-structural, and contents) in a descriptive hierarchy for damage analysis based on the FEMA P58 method [148]. The hierarchy consists of three layers:
    • The highest level is responsible for defining fragility groups (FGs). Each FG contains all the components whose damage behavior is controlled by the same EDP type and leads to similar consequences. According to the FEMA P58 method [148], buildings have FGs sensitive to either PID or PFA;
    • The intermediate layer divides F.G.s into several performance groups (PGs). Components in the same PG are sensitive to the same EDP; their location and direction must be identical;
    • The third layer breaks each P.G. into different component groups (CGs). Each CG collects components that experience the same damage. The component quantity of a CG is typically the accumulative amount for components in this group. According to the components, the quantity may be in units of area, length, etc. Additionally, it can comprise random variables with a normal or lognormal distribution;
  • The damage model indicates a fragility model for every assembled PG in the performance model based on the damage and loss database. The properties of a fragility model are a collapse limit and damage state groups (DSG.s). A damage state is considered a severity level of expected damage and can occur within a defined limit of the EDP value. The estimated EDP value can trigger one or many damage states (because of the overlapping among EDP limits). Additionally, if it exceeds the group collapse limit, it triggers a collapse model, which is a unique damage state;
  • The loss model estimates DVs according to the triggered damage states. Each damage state has a corresponding consequence mode and, similarly, a collapse consequence model in the case of the collapse model. The calibrated consequence functions are used to quantify expected losses, such as the repair costs and times and the number of injuries of various severities.
The implementation of damage and loss models handles both the high-fidelity component-based FEMA P58 method [148] and the more approximate building-level approach used by HAZUS [149]. The framework utilizes parallel executions by dividing calculations into two threads: (a) structure response simulations, creating the response model and estimating EDPs, and (b) assembling the performance, damage, and loss models. PELICUN is an essential component in the backend calculations of the NHERI-SimCenter application workflow, and many released applications are based on its capabilities.
The launched NHERI-SimCenter applications simulate performance-based engineering but with different problem definitions. These differences can be regarding desired workflow architecture, the type of hazard studied, or the investigation scale (individual assets or regional simulations). The launched application can be classified into several layers of hierarchy according to their complexity, refer to Figure 4. This hierarchy starts with the quoFEM [150] application, which calls for quantified uncertainty with optimization for the finite element method. This application provides a probabilistic structural analysis by integrating finite element modeling (FEM) with uncertainty quantification (UQ) procedures and simple UI. The FEM component includes several applications, e.g., OpenSees [14], OpenFOAM [142], OpenSeesPy [151], and FEAPpv, while the UQ model implements Dakota [146]. The second level contains three applications: EE-UQ [152], WE-UQ [153], and HYDRO-UQ [154], respectively, for earthquake engineering, wind engineering, and water-borne natural hazards with uncertainty quantification. In addition to using user-defined simulation scripts, this layer provides customized models to describe a building asset numerically. Also, it provides many options for inputs or to describe hazards, such as selecting records from a database, using previous records, or setting the parameters of other specifications. The outputs are the sampled EDPs determined by locations and directions. Moreover, applying performance-based engineering (PBE) [147] introduces a more comprehensive workflow than EE-UQ by combining damage and loss estimations using PELICUN components. The Regional Resilience Determination Tool (R2D) [155] presents the highest level, which was developed for simulating risk assessment on a regional scale on buildings inventory. It uses graphical components to classify the risk levels on a map view. This broad vision still has details and areas that need further development. The architecture of the framework is designed to launch more applications flexibly.

3. Seismic Isolation

According to conventional seismic specifications, structural design is based on collapse prevention with expected damages from strong earthquakes. This approach could not be acceptable for some facilities, such as hospitals, fire stations, nuclear plants, and historical buildings. These cases require a control mechanism on the structural response and reducing inter-stories drift and floor accelerations to decrease component damages and injuries. The seismic isolation technique was developed for this purpose, and the technique involves physically uncoupling the superstructure from the foundation [156]. The decoupling concept is based on isolation devices that provide a high stiffness in the vertical direction and flexibility in the horizontal direction. These properties dissipate motion energy and concentrate deformed displacement at the isolation interface. The fundamental natural period of isolated structures is in the long period range, e.g., two to four seconds, so the superstructure remains elastic or nearly elastic. In some cases, isolation systems contain dampers in cooperation with isolation devices to increase the capacity of the overall dissipated energy. Many publications compared isolation systems and design procedures, such as [157,158]. Practically, the increase in seismic isolation systems can prove the efficiency and impact of this technology. Various iconic and critical building designs implement seismic isolation to preserve serviceability even after large earthquakes [159], such as: (1) Apple’s new corporate headquarters, which opened in April 2017, and is a ring-shaped building with a circumference of 1512 sq ft and houses 12,000 employees. It contains four stories above the ground and three stories below. Seven hundred bearing isolators support the superstructure. Each isolator has a 7 ft diameter and weighs about 15,000 lbs; and (2) Sabiha Gökçen Airport International Terminal, located in Istanbul and opened in 2009, was designed to rest on 292 triple-friction-pendulum isolation bearings supplied by Earthquake Protection Systems, Inc. The superstructure is a four-story steel moment frame, with a 160 m × 272 m footprint and seven arched bays alternating 32-m and 48-m spans. (3) Tan Tzu Medical Center, located in Tai Chung, Taiwan, and only 400 m from the Chelungpu fault, has a capacity of 1300 beds. The layout consists of a four- to six-story complex in the western section, a 17-story tower, and two underground service levels. The superstructure comprises steel-reinforced concrete moment frames weighing about 285,600 tons and rests on 325 lead–rubber-bearing base isolators.
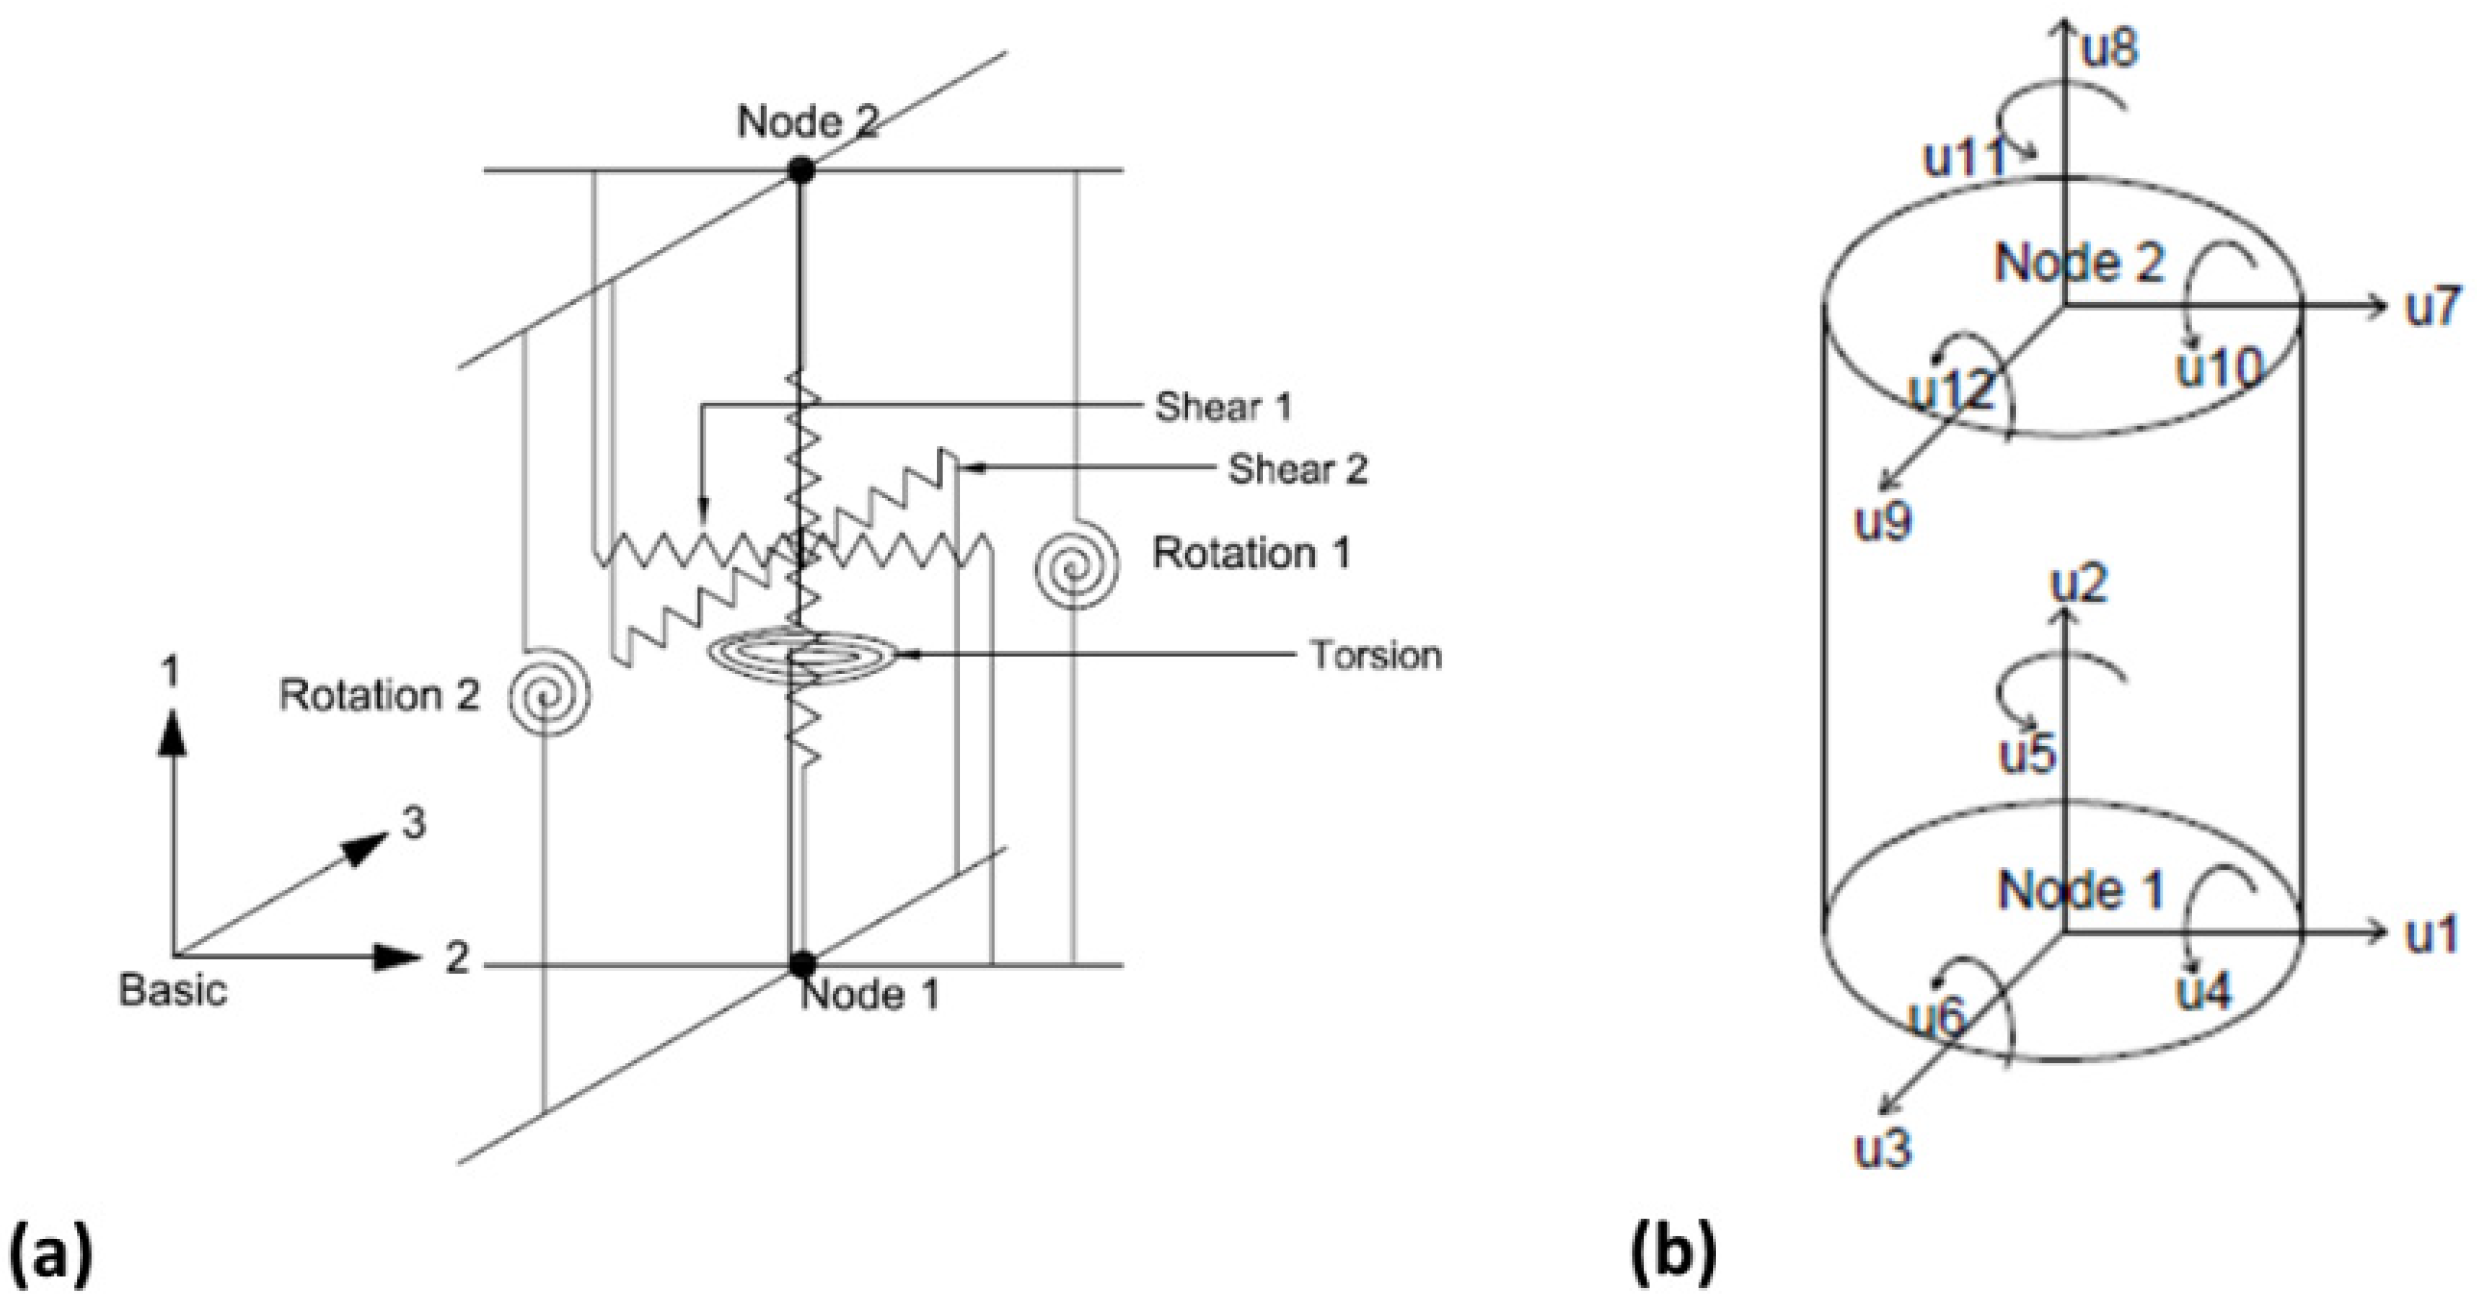
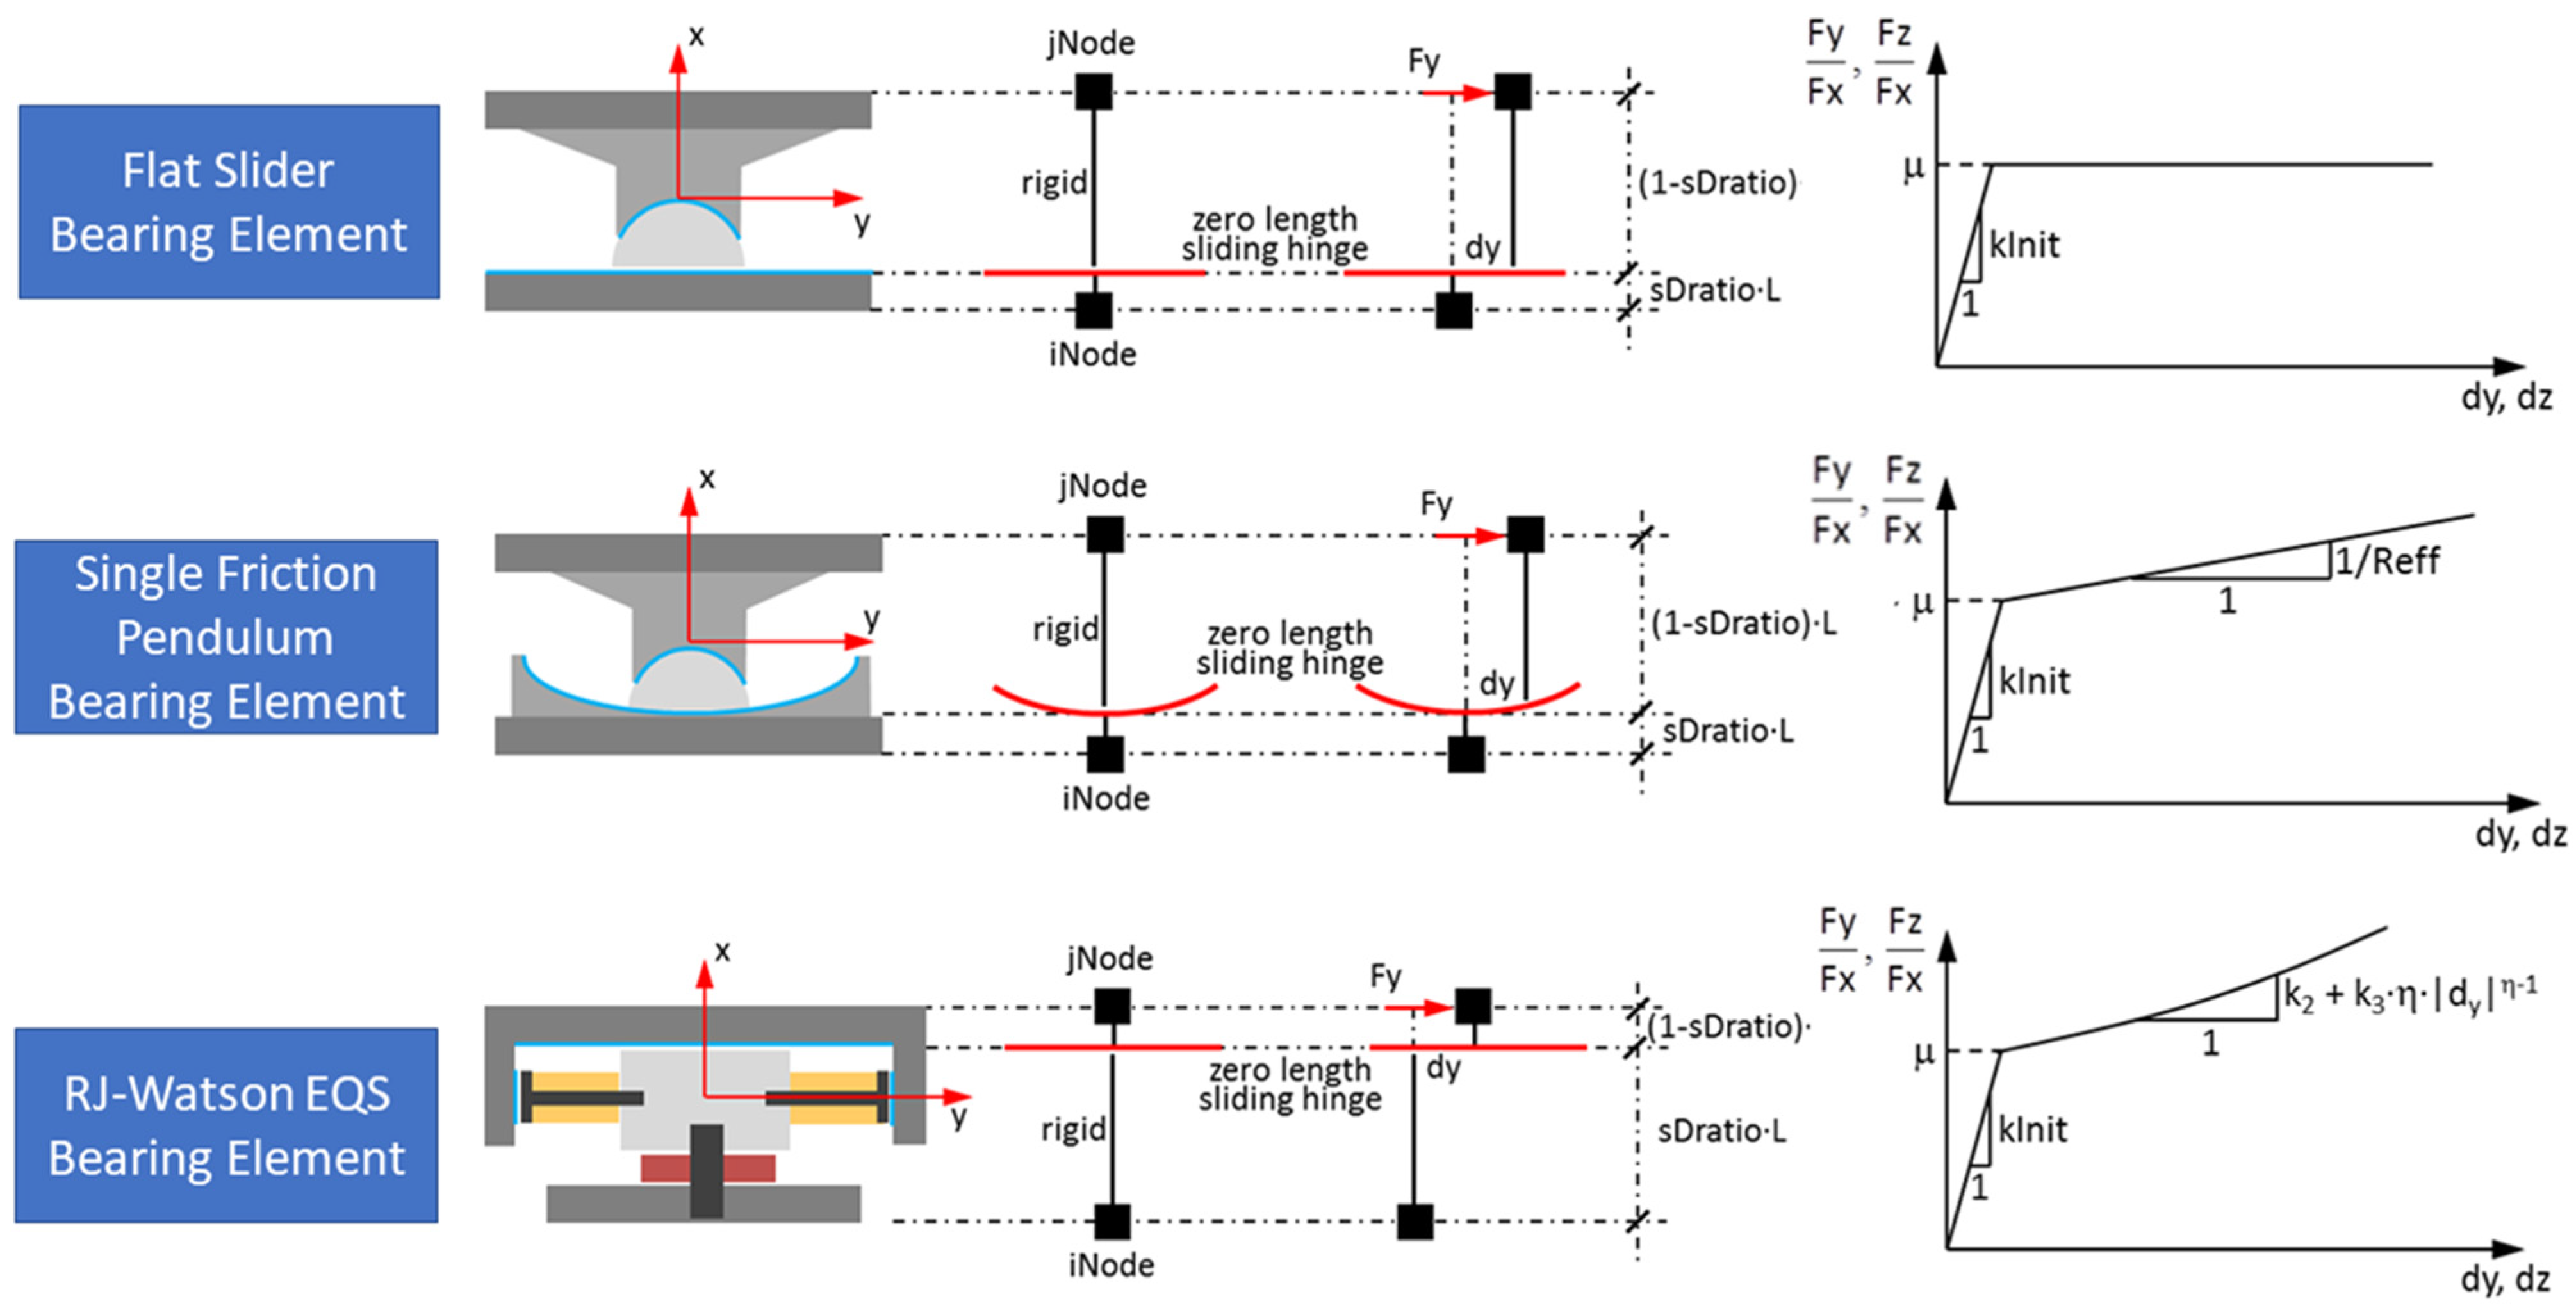
Isolation devices are designed to possess vertical stiffness for required service loads and lateral flexibility calibrated for damping and isolation demands. Figure 8 shows a traditional finite element model to simulate a bearing element. It consists of two primary nodes (i and j) connected by six springs in the six primary directions (12 degrees of freedom). In Opensees [141], most isolator-bearing element commands are an extension of this model. Predefined uniaxial materials, i.e., P, T, My, Mz, determine the general behavior of this element in the axial direction, torsional direction, moment around the local y-axis, and moment around the local z-axis. However, the uniaxial materials of shear springs are customized according to the mechanical properties of the isolator device to calibrate its horizontal flexibility.
Additionally, the location of shear springs from the ith node is expressed as a relative ratio to the isolator height, called the shear distance ratio (sDratio). The isolator devices can be classified according to their mechanism into two main categories: friction-based and elastomer-based [161]. The concept of a friction-based isolator is to support the weight of structures on bearing support with a sliding interface [162]. The horizontal strength or zero-displacement force intercept ( Q d ) is calculated according to the following equation:
Q d = μ W
where W is the weight carried by the bearing isolator, and μ represents the friction coefficient of the sliding interface. Isolators should have a low value of μ to permit in-plane displacements and achieve flexible behavior. According to the manufacturers’ reports, the practical value could range from 0.03 to 0.2. The slider is usually manufactured from ductile iron bonded with polytetrafluorethylene (PTFE) material. Figure 9 shows different friction-based slider-bearing devices and their nonlinear shear behavior. The friction effect can be simulated numerically on OpenSees [141] through friction models: (Coulomb), (velocity dependent), (velocity and normal force dependent), (velocity and pressure dependent), and (multi-linear velocity dependent). The flat slider bearing element is the simplest device with a flat steel-bearing plate and a slider that is allowed to move horizontally. This model leads to elastic–perfectly plastic behavior in the shear force and displacement relationship.
In Opensees [141] an encapsulated element command, flatSliderBearing, was developed for this type of isolator. It considers the primary bearing element, shown in Figure 8. Shear springs are assigned to an elastic-perfectly plastic uniaxial material, whose behavior is a function of the elastic slope (Kinit) and an assigned friction model. Specifically, the sDratio is determined by the position of the slider interface. The single friction pendulum (FP) and the RJ-Watson EQS bearing elements are evolving forms of the flat slider element, as their behavior has a linear increase in the force capacity through the plastic zone. The restoring force capability in the single FP element results from exposing the slider to a spherical concave dish. The second-slope stiffness (Kd) is estimated according to Equation (5), where R is the radius of curvature of the spherical concave dish:
K d = W R
Also, Opensees contains an element command for modeling a single F.P. element, named singleFPBearing, which follows the same assumptions of the flatSliderBearing model. However, the nonlinear sliding hinge movements are assigned to a spherical surface instead of a horizontal plane. The effective radius of the concave sliding surface (Reff) is required as an additional parameter to generate a uniaxial material with strain-hardening behavior. For the RJ-Watson EQS bearing elements, MER springs along the y- and z-axes provide restoring forces on the slider interface. Equation (6) demonstrates how to calculate Kd for this system, where k2 and k3 are post-yield stiffness of linear and nonlinear hardening in MER springs, dy is the displacement as shown in Figure 9, and η is the exponent of nonlinear hardening.
K d = W ( k 2 + k 3 . η | d y | η 1 )
Similarly, the RJWatsonEqsBearing element command was developed following previously mentioned assumptions. In this case, k2, k3, and η are the additional parameters for shear springs material. Instead of a single concave dish in the single F.P. isolator, the triple friction pendulum bearing (TPB) elements have three spherical surfaces associated with an inner slider, the top plate, and the bottom plate, as shown in Figure 10.
It is considered the most effective friction-based isolation system for intense earthquakes [164]. Since the normalized backbone curve is complicated, the TripleFrictionPendulum element command requires parameters to simulate this complexity perfectly. The essential prerequisite parameters are (1) three predefined friction models for the three sliding surfaces; (2) the displacements limits (d1, d2, and d3), which are clarified in Figure 10; and (3) the effective radii (L1, L2, and L3), which are determined according to Equation (7), where the Ri and hi values are shown in Figure 10.
L i = R i h i
The elastomer-based bearing consists of alternating natural or synthetic rubber layers bonded to intermediate steel shim plates and an outer rubber cover to protect steel layers from corrosion and environmental degradation, as shown in Figure 11.
After placing un-vulcanized rubber sheets and steel plates in a mold, this mold is subjected to high temperature and pressure to vulcanize and bond the rubber. Increasing the bearing’s vertical stiffness corresponds to the number of steel shims and closing their spacing. However, reducing the horizontal stiffness requires a relative increase in the total thickness of rubber (Tr). The design of elastomeric bearing elements is a compromising process among these factors to produce determined properties [165]. Elastomeric bearings can be classified into three categories: (1) low-damping natural or synthetic rubber; (2) high-damping rubber (HDR); and (3) lead-rubber bearings. Natural rubber with a type A durometer hardness of 50 is the most used low-damping material for seismic bearings. It has an approximate shear modulus (G) that ranges from 0.65 MPa to 0.9 MPa, and an equivalent damping ratio ξ between 2% and 3% at 100% shear strain. These properties can be modified by adding carbon black and other fillers to the raw rubber to create high-damping rubber (HDR) materials. The equivalent damping ratio of HDR bearings can reach from 10% to 20% at 100% shear strain, with an almost equivalent shear modulus. The horizontal stiffness of the bearing (Kh) can be calculated as the following, where Ab is the total bonded rubber area:
K h = G A b T r
The spacing between steel plates (the thickness of the individual rubber layer) defines the compression modulus of the individual elastomeric layer (Ec) due to changes in the bulging around the perimeter. According to [166,167] and assuming the rubber is incompressible, the Ec of a single rubber layer can be calculated as follows:
E c = 6 G S 2
where S is a dimensionless geometric parameter called the shape factor and defined as:
S = L o a d e d   A r e a A r e a   f r e e   t o   b u l g e
The simplification assumption of rubber incompressibility overestimates the compression (vertical) stiffness (Kv). According to [166], this overestimation increases in the cases of large S values. Typically, this assumption is invalid for thin rubber layers (close steel shims). The Kv is defined as:
K v = E c A b T r = 6 G S 2 A b T r
Inspection of Equations (8) and (11) reveals that the relative ratio of horizontal to vertical stiffness corresponds to the shape factor (S).
K v K h = 6 S 2
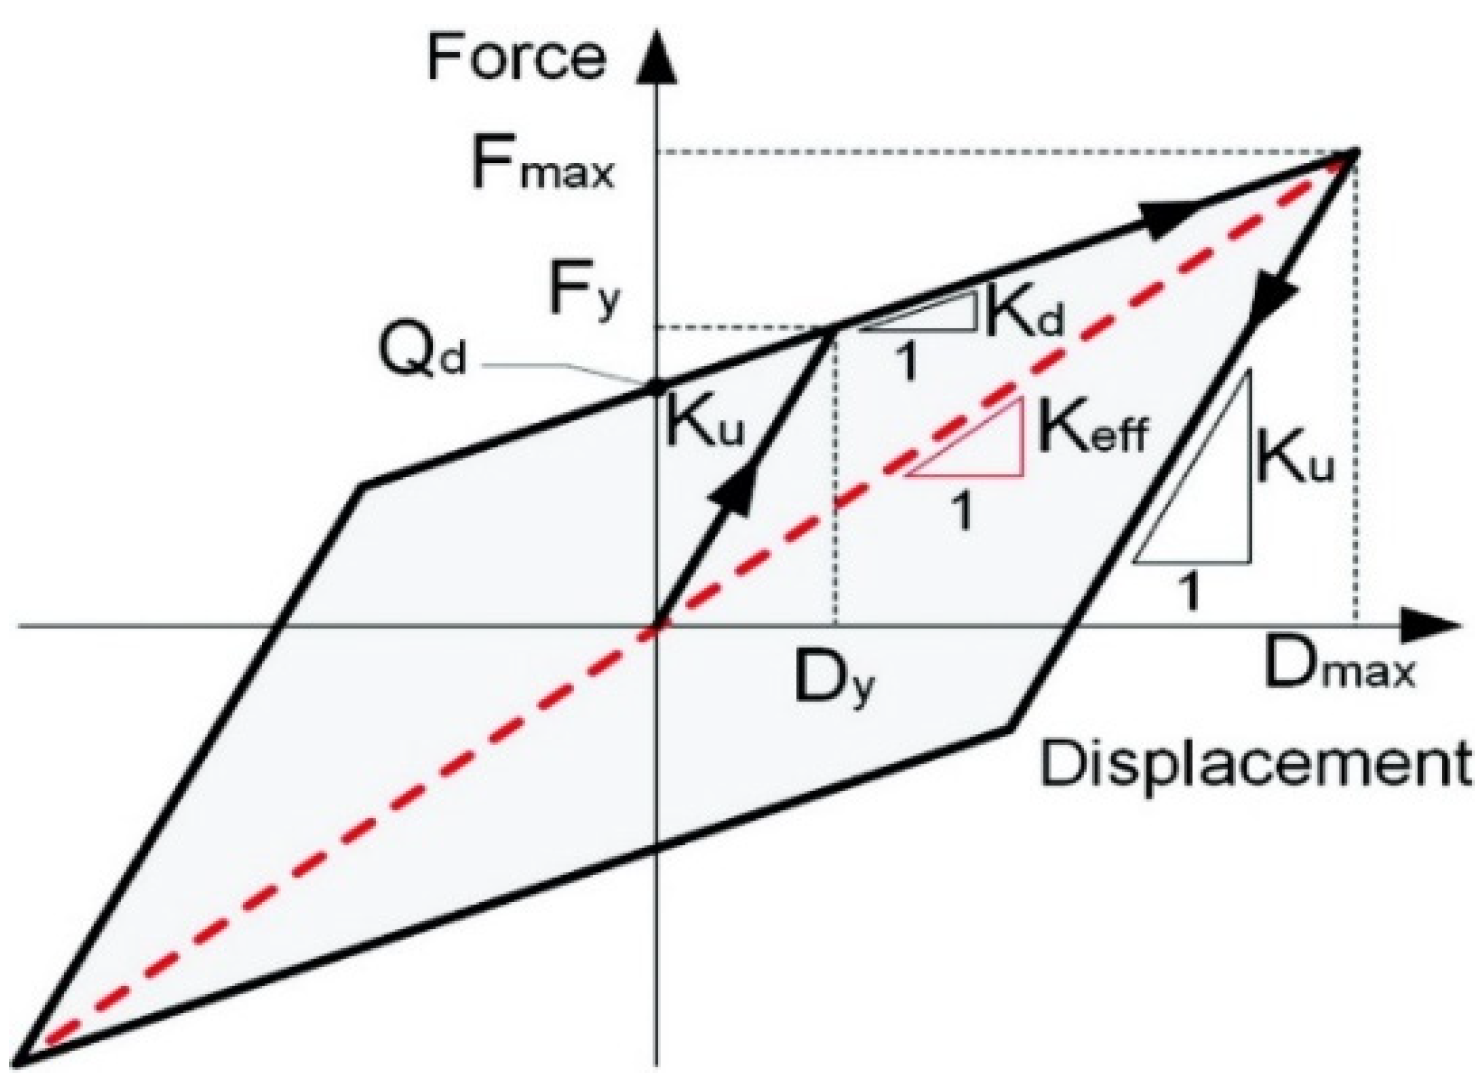
According to [168,169], designing elastomeric bearings with a high shape factor provides some benefits, such as mitigating rocking motion and enhancing stability. Most guidelines recommend designing elastomeric bearings with shape factors from 15 to 25 [170] or 30 [171]. However, Equation (12) demonstrates that the vertical stiffness would be thousands of times greater than horizontal stiffness for these high shape factors. Additionally, the actual value is potentially more, as rubber compressibility is neglected. This design procedure could be effective in horizontal isolation, but it causes vertical isolation periods ranging from 0.03 to 0.15 s and significant amplification of the vertical acceleration. Lead–rubber bearings are an enhancement of low-damping natural rubber bearings by adding a lead plug in the central hole of the bearing, refer to Figure 11. This plug deforms plastically under shear deformation, which increases the energy dissipation capabilities. The resulting horizontal force–deformation relationship of a lead–rubber bearing is defined using bilinear behavior, as shown in Figure 12.
The Q d of a lead–rubber bearing can be calculated as follows:
Q d = σ L A L
where σ L and A L are the shear yield strength and the cross-sectional area of the lead plug, respectively. For a given horizontal displacement, d, and the second-slope stiffness, K d , the effective or secant stiffness, K e f f , can be defined by Equation (14). The effective shear modulus, G e f f , is estimated for a given K e f f , then Equation (11) is applied to define the vertical stiffness.
K e f f = Q d d + K d
OpenSees [10] numerically includes various commands developed specifically for elastomeric bearings. As shown in Figure 13, the elastomericBearingPlasticity and elastomericBearingBoucWen elements adopt the traditional bearings elements with customizing shear components, where K d is determined according to following equation:
K d = α 1 · k i n i t + α 2 · k i n i t · μ | d y | μ 1
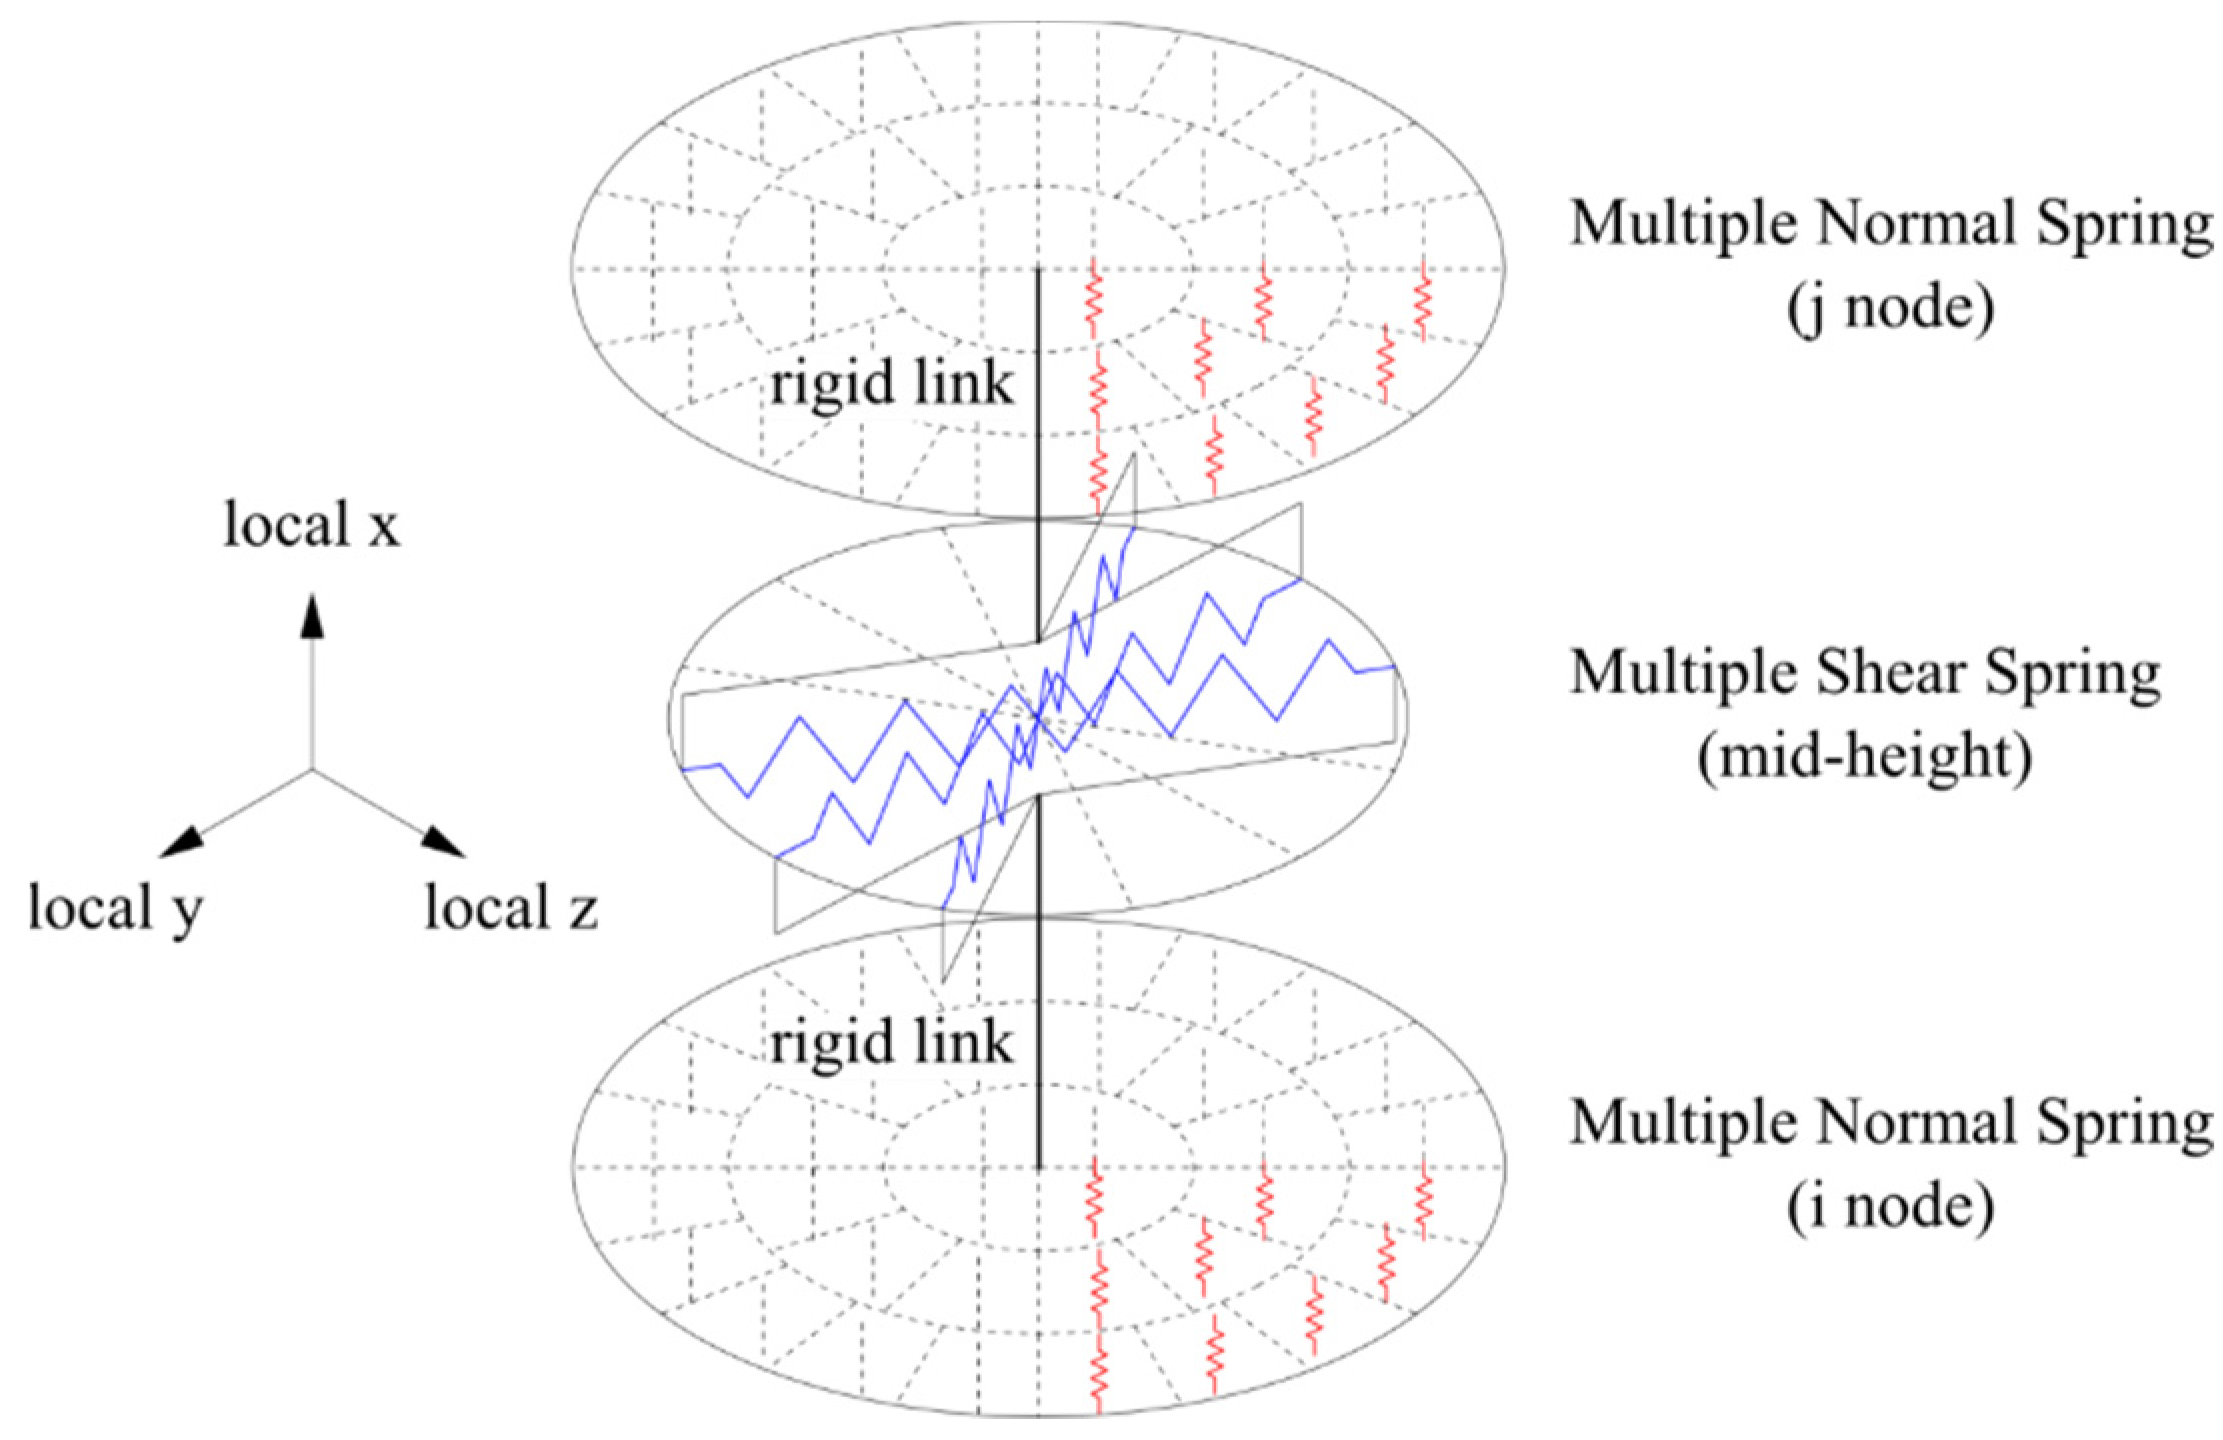
where α 1 , α 2 are, respectively, the post-yield stiffness ratio of linear and nonlinear hardening, k i n i t is the initial stiffness, dy is the displacement, and μ is the exponent of nonlinear hardening. The elastomericBearingPlasticity element requires defining Q d and the associated parameters with K d to simulate horizontal isolation. However, the elastomericBearingBoucWen requires additional parameters to predict the hysteretic energy dissipation precisely, and they are typically the yielding exponent (sharpness of hysteresis loop corners, η), first hysteretic shape parameter (β), and second hysteretic shape parameter (γ). Furthermore, the elastomericX, LeadRubberX, and HDR elements are developed for modeling circular low-damping rubber, lead–rubber, and high-damping rubber isolators, respectively. These commands might be more accessible as no predefined materials are required. Instead, modeling requires geometric properties, e.g., internal diameter, outer diameter, the number and thickness of steel or rubber layers, and material properties, such as shear modulus, bulk modulus, and yield strength. These commands were developed by [172] to provide an automation procedure for generating mechanical properties with a broad verification investigation. For general modeling purposes of square or circular shapes, the KikuchiBearing element, which was developed by [173], provides an elastomeric bearing element. It consists of multiple shear spring (MSS) and multiple normal spring (MNS) models, as shown in Figure 14. The required parameters are the assigned material, the total number of shear and normal springs, and the geometric parameters, e.g., the cross-section, total rubber thickness, and the total height.
Some isolation systems, usually low-damping rubber bearings, adopt supplemental damping devices across the isolator interface to control displacements and increase the provided damping ratio. The most common response control dampers can be categorized into steel hysteretic dampers, viscoelastic dampers, and viscous fluid dampers, as shown in Figure 15. A steel hysteretic damper is installed in a brace configuration and composed of low-yield-strength steel inserted between a pair of steel channels that prevent the plate from buckling. The device mechanism depends on absorbing energy through the elastic deformations of the plate. A similar technique is used for viscoelastic dampers but uses a high-damping rubber to absorb the vibration energy and convert it into heat [175]. The viscous fluid damper is a cylinder filled with hydraulic fluid and a piston that can move in both directions. The hydraulic fluid flows from one chamber to the other through valves. The motion of a piston resists this flow and causes energy dissipation. An axial hinge assigned to hysteretic uniaxial material could be a straightforward modeling approach for damper elements. The viscous material can be used for this model, which adopts the stress–strain relationship expressed in Equation (16).
σ t = C · ε ˙ ( t ) α
where σ is the instant stress, ε ˙ refers to the strain rate, α is the power factor (when set to 1, it makes a linear damper), and C is called for the damping coefficient. Also, the ViscousDamper was developed to simulate the hysteretic response of nonlinear viscous dampers. It implements the Maxwell Model (linear spring and nonlinear dashpot in series), demonstrated in Equation (17).
F d ˙ ( t ) K d + sign ( F d ( t ) ) F d ( t ) C d 1 α = u ˙ m ( t )
where u ˙ m is the damper’s extensional velocity, F d and F d ˙ represent the applied force and velocity, respectively, K d is the elastic stiffness of a linear spring, C d is the viscous damper parameter, and α is the viscous damper exponent.

4. Software Description

This research proposes extending the NHERI-SimCenter application framework to implement seismic isolation (SI) modeling rather than incremental dynamic analysis (IDA). The NHERI-SimCenter EE-UQ tool provides the capability to perform simulations and estimate the EDPs of multi-degree-of-freedom (MDOF) system structures, considering input uncertainties. Moreover, the PBE tool completes these steps with damage and loss measures. Some effort was required in the frontend and backend components to integrate previously mentioned isolator models with these tools. Figure 16 shows the added panel in the user interface to model multiple isolation systems. Since some SI models require predefined objects of materials or friction models, it is divided into three tabs. The user can define a list of materials and friction models (if needed) and assign their elements as properties for an isolator object. Combining dampers with the bearing elements is a valid option, rather than assigning their axial materials. This interface contains wrappers for all previously discussed bearing elements, all friction models in Opensees [141], damping materials, i.e., viscous, and ViscousDamper, and general behavior uniaxial materials, i.e., elastic, elastic–perfectly plastic, and hysteretic.
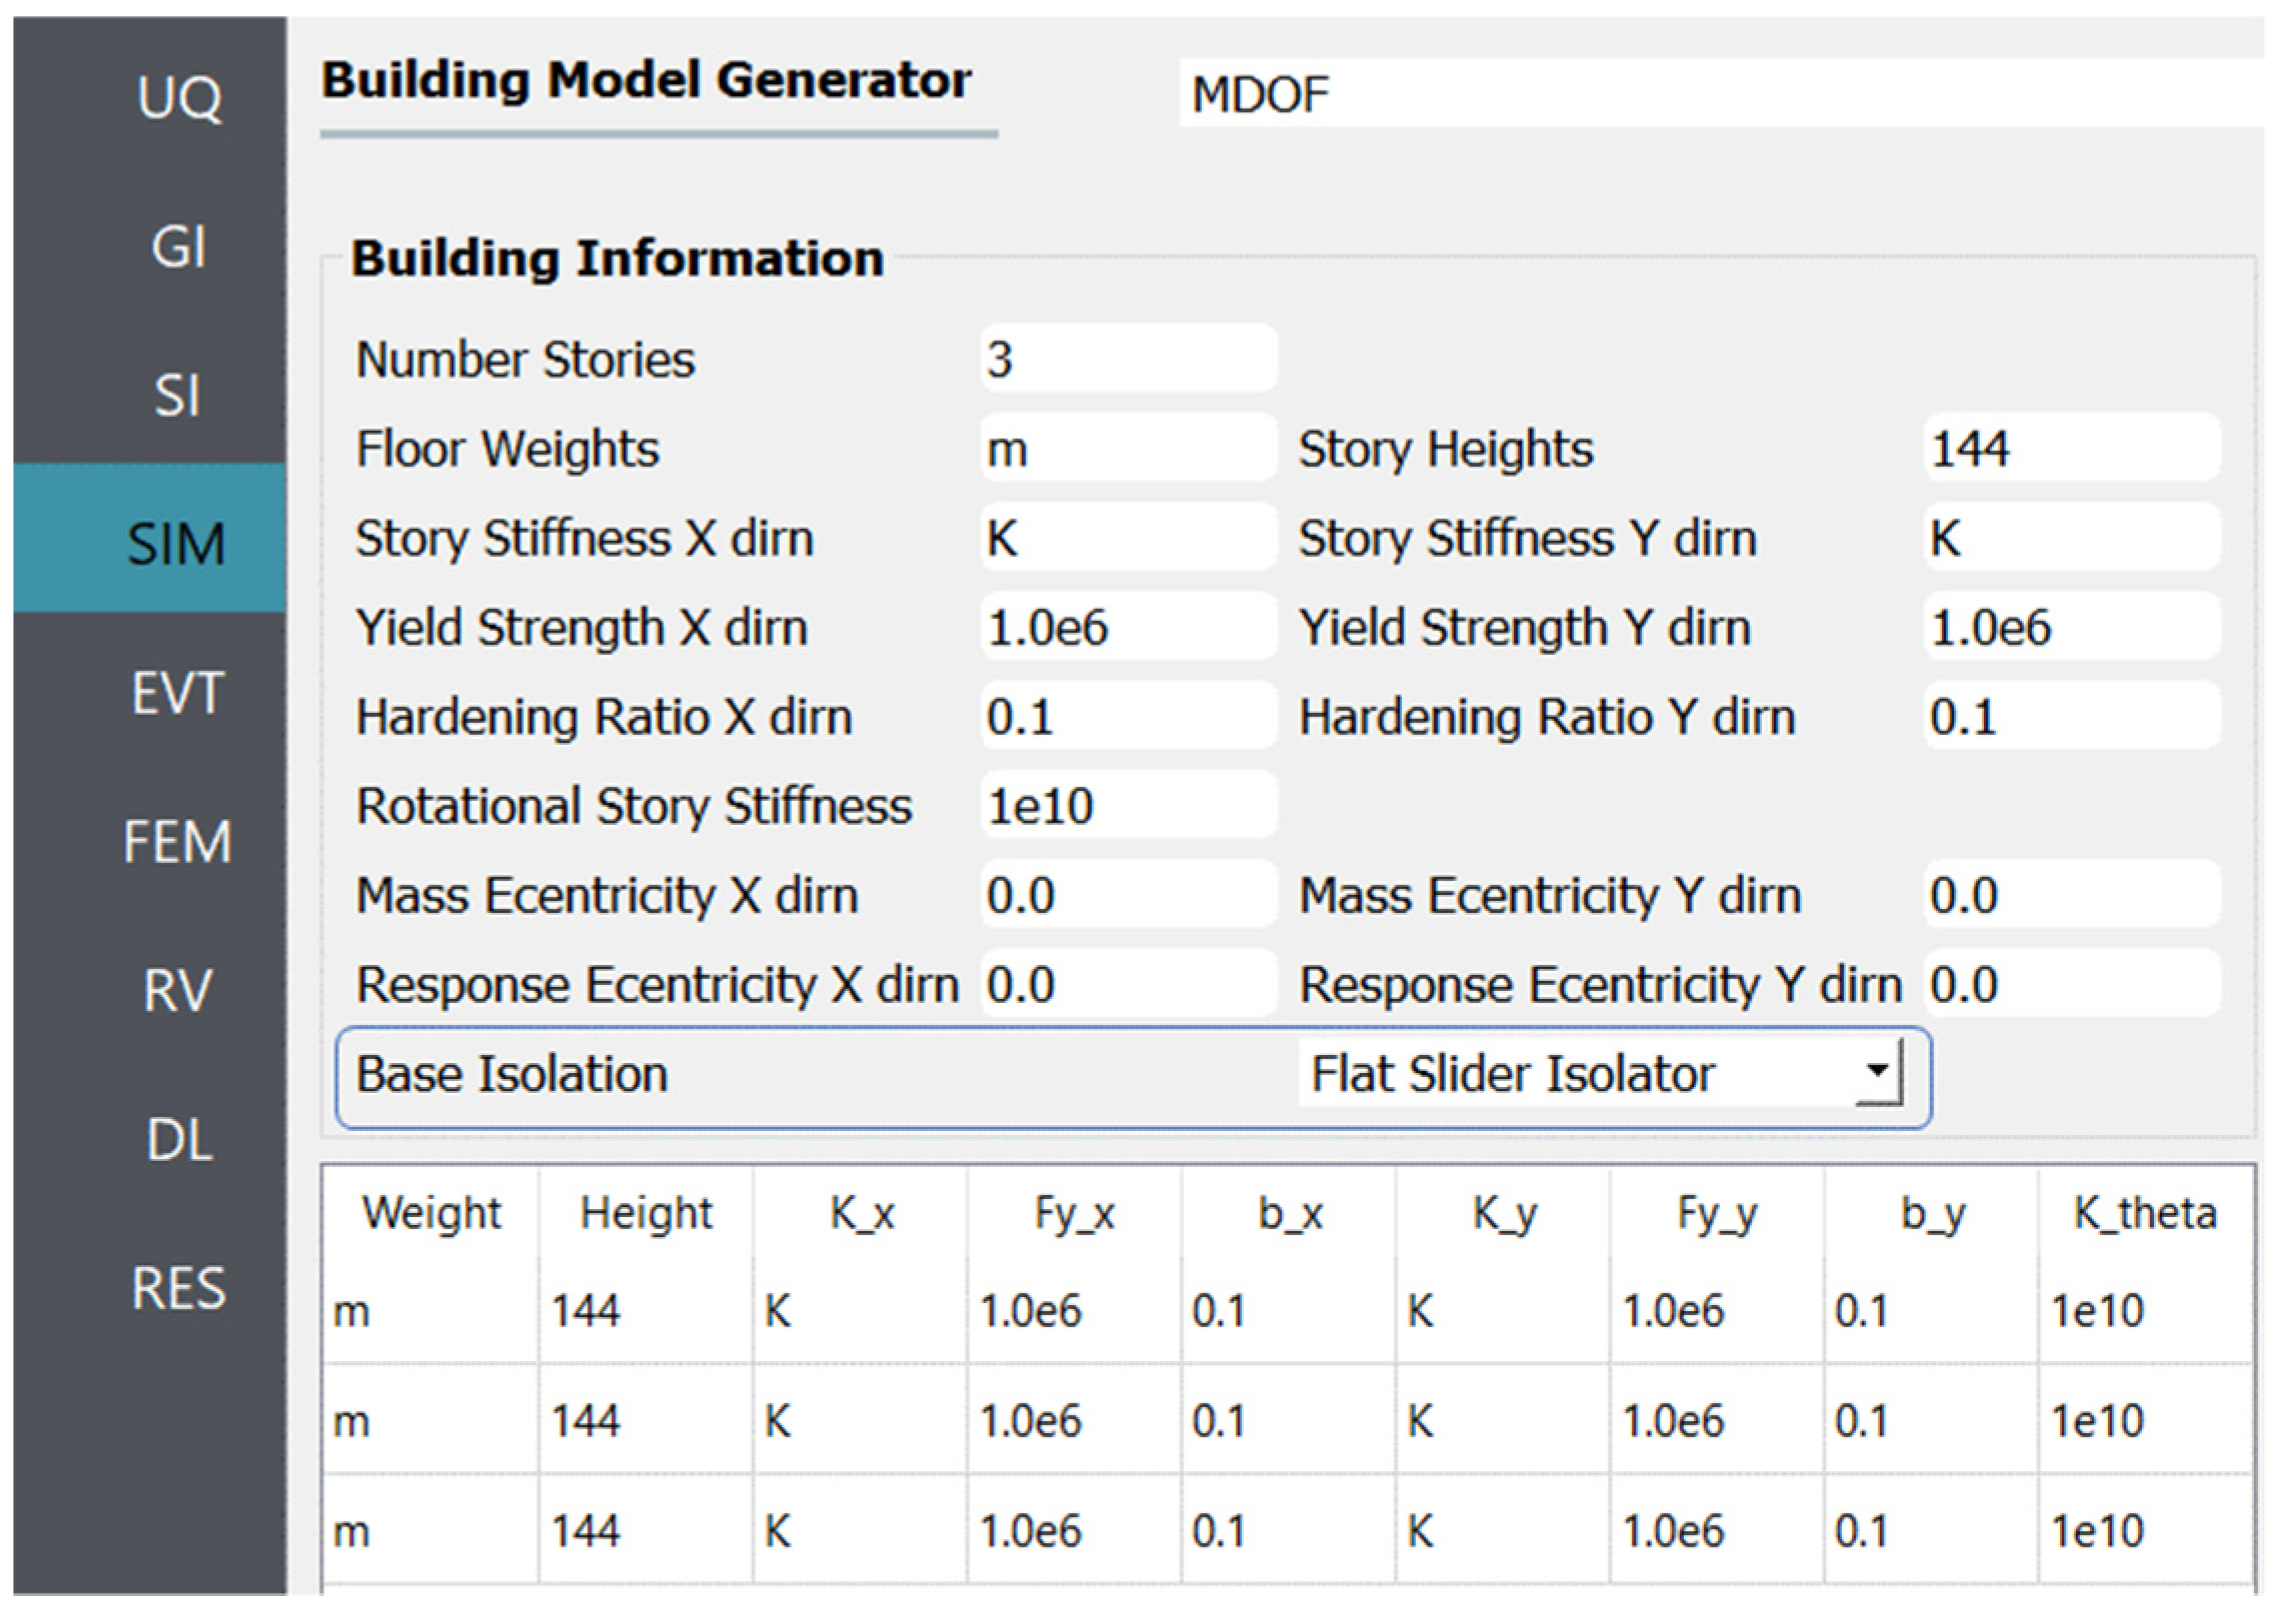
Finally, an isolator object should be assigned to the MDOF system, as shown in Figure 17, while allowing the default option of the fixed base case. However, the backend extensions include adding several commands in wrapping scripts to retrieve the newly defined objects, execute their commands, and define new EDP cases for the isolator’s horizontal displacements and damper forces.
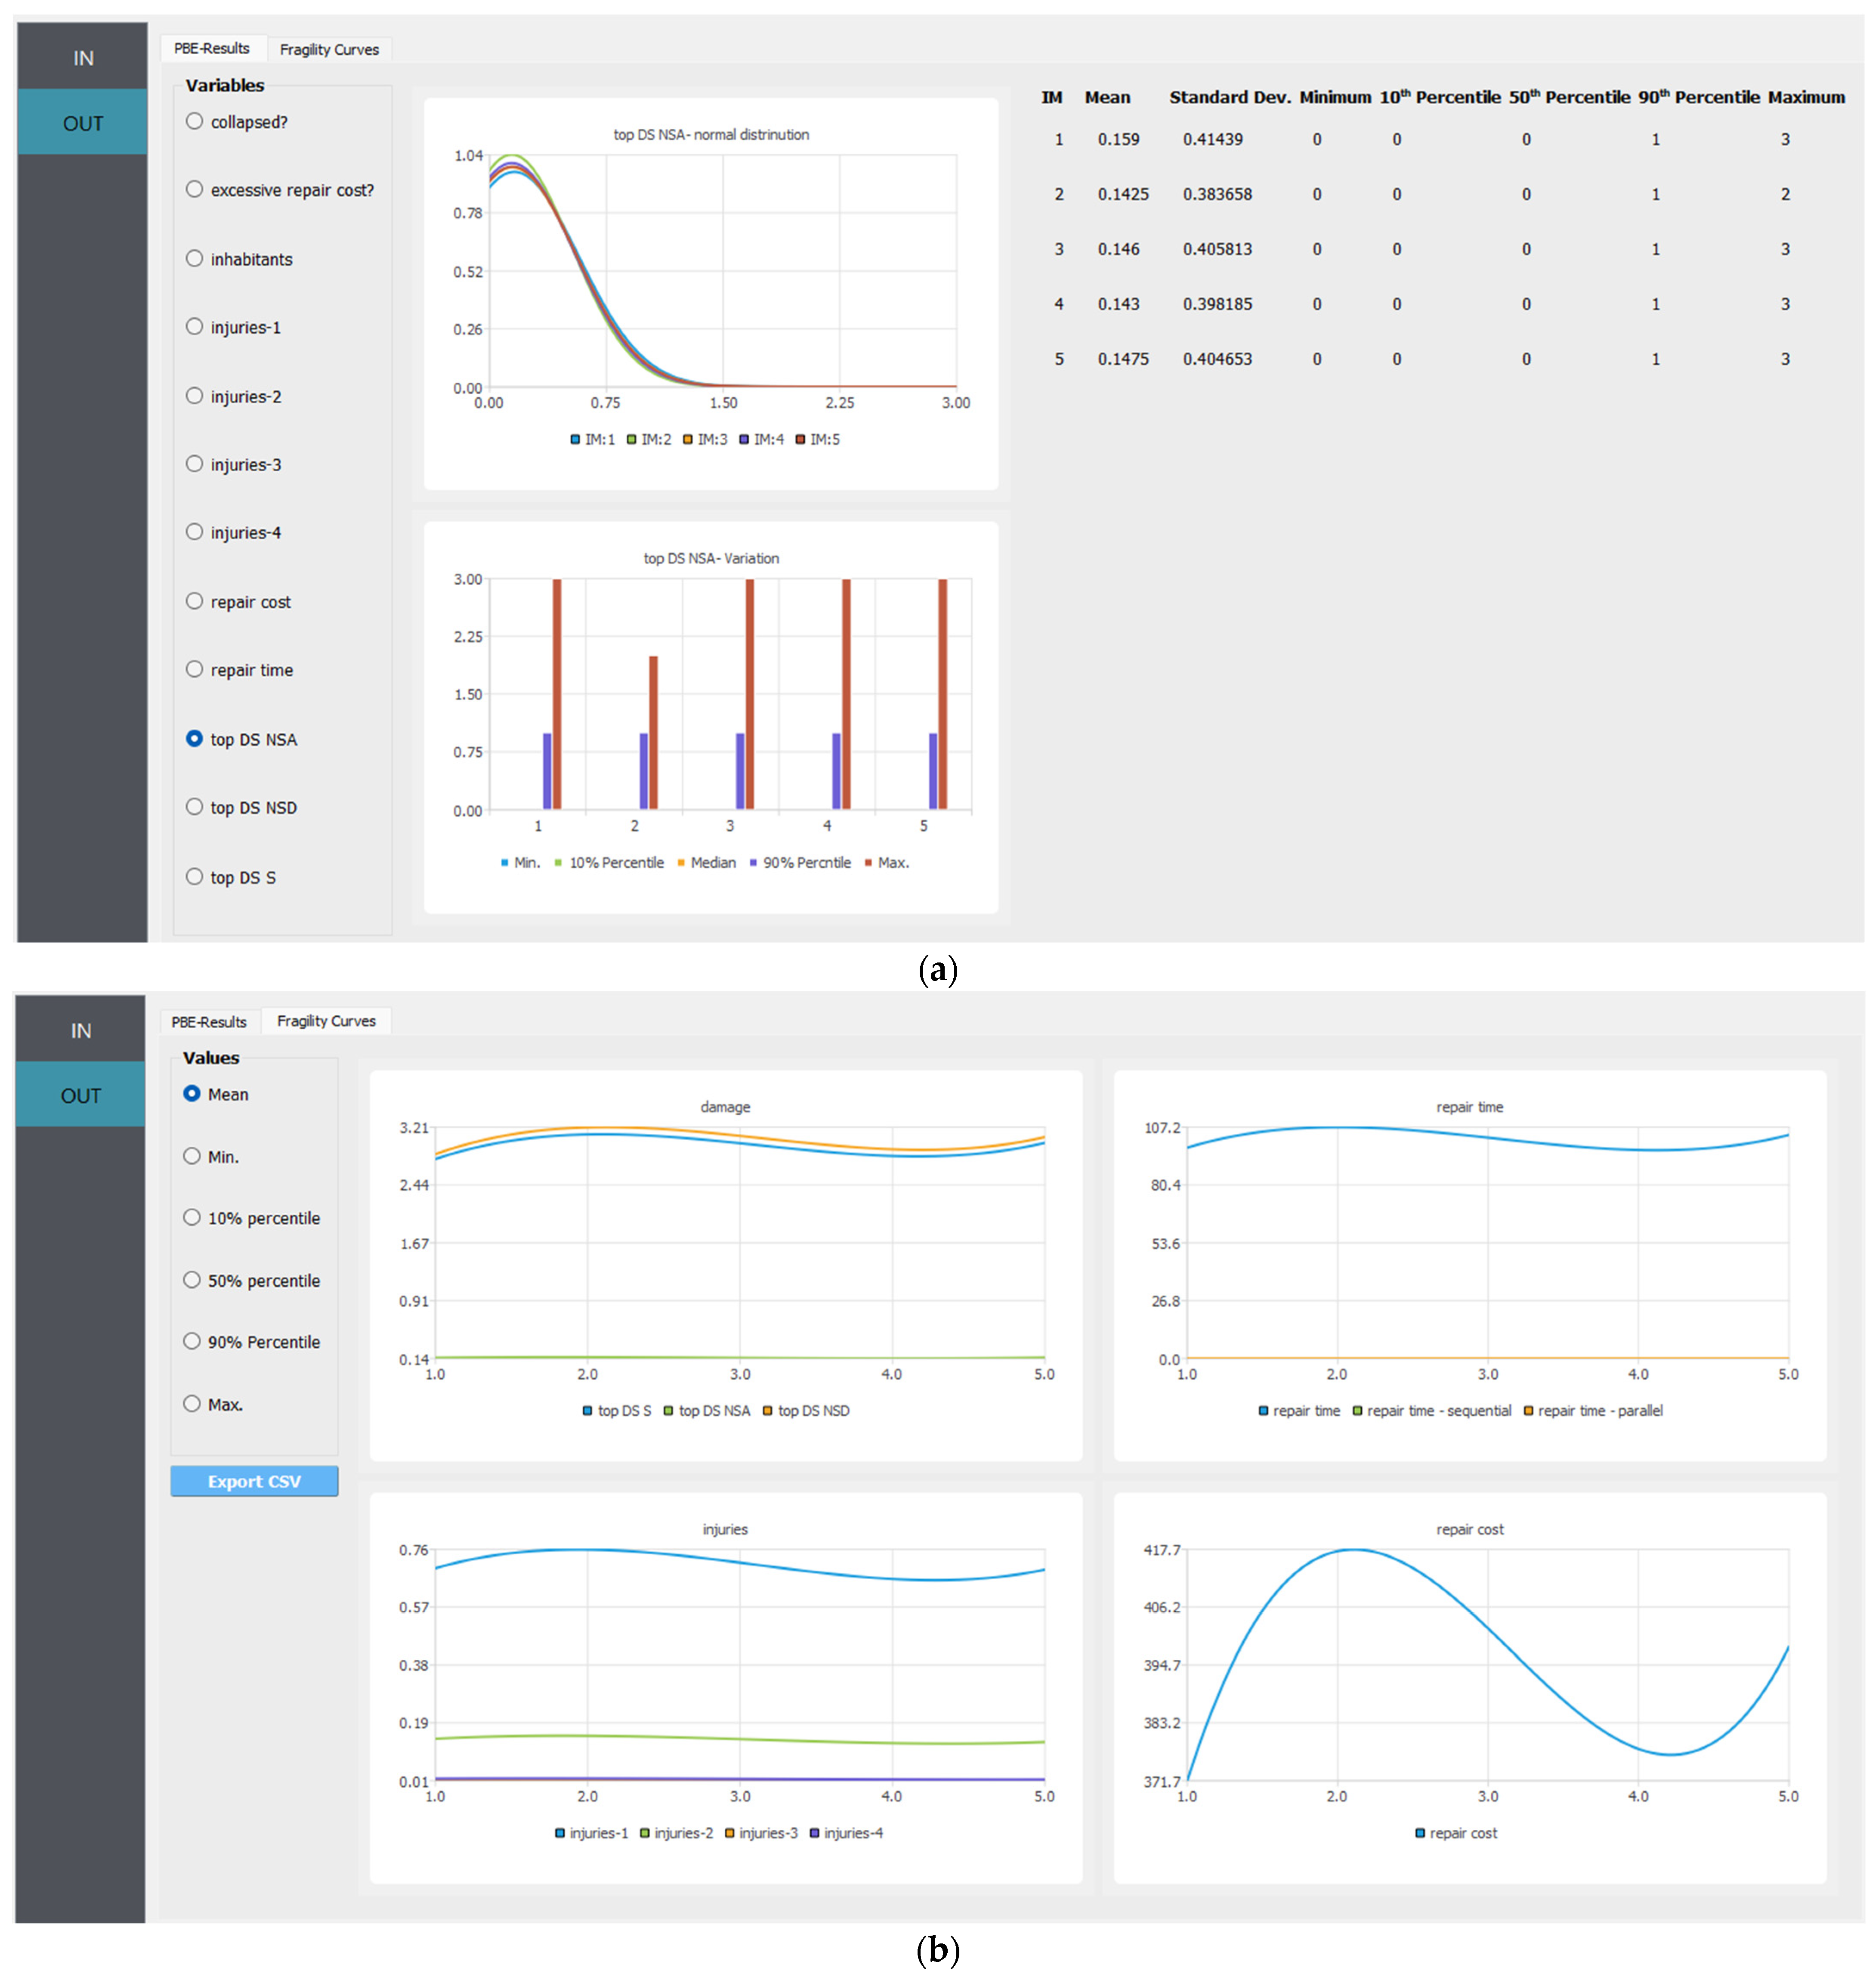
On the other hand, a new application with a simple user interface has been developed for IDA. It is designed to access and execute PBE classes in the background. The user should determine a PBE file and required IMs increments. Then, the program creates multiple copies of this file and scales the record motions each time. Referring to Figure 18, the outputs are presented in two taps: presenting the decision variables’ probabilities at each incremental step and showing them as a function in different IMs.

5. Illustrative Examples

A simple case study is discussed herein to present the impact of integrating the recent features, i.e., seismic isolation (SI) modeling and incremental dynamic analysis (IDA), with legacy workflow models, e.g., uncertainty quantification (UQ) and PELICUN. The benchmark structural system is a realistic MDOF system introduced by [176]. Additionally, it was adopted in a previous publication by the lead author study [118] for multiple regression analysis (MRA) of natural rubber bearings (NRB) combined with viscous fluid dampers (VFDs) with isolators. The SI system was evaluated using a realistic five-story base-isolated building and an array of feasible damper combinations. Two ensembles of seven NF earthquake records were utilized to represent different seismic hazard levels. The key response parameters, including total maximum displacement, peak damper force, and top story acceleration ratio, were examined, and the MRA models provided satisfactory results with less computation. Table 1 shows the material properties (the mass and stiffness for each story) and the period of vibrations for the first six modes of the adopted system. Three models were generated based on this system: fixed base (A-FixedBase), isolated with only NRB (B-NRB-SI), and isolated with NRB combined with VFDs (C-NRB-VFD-SI). The damping coefficient (C) and the damping exponent (α) of the mean values were assumed to be 350 kN-s/m and 0.7, respectively. Model uncertainties were defined with a normal distribution, with a coefficient of variation values ranging from 5 to 20. The forward propagation Monte Carlo method was selected for the distribution of random values. In addition, the interactive interface for PEER Strong Ground Motions Databases was utilized to select 10 earthquake records, and their properties are defined in Table 2. It is important to highlight that the focus of this study was on the near-field ground motion records, given that SI systems are typically employed in highly active seismic zones. The exclusion of far-field records is a deliberate decision that allows for a more specific and targeted investigation of the behavior of the combined NRBVFD system under the conditions most relevant to its practical application. This approach enables the researchers to achieve a more accurate and realistic assessment of the SI system’s performance in response to the seismic events that are most likely to occur in the regions where these systems are implemented. The filtration criterion was a magnitude ranging from 6.5 to 7.5 and up to 12 km distance to the fault, as mentioned in [118]. A performance-based assessment was conducted for all three models, including structure responses, damage measures, and scaling factors for ground motions in different intensities.
The effect of the isolation systems can be measured by comparing structure-response characteristics. Table 3 introduces this analogy based on several EDPs: the peak floor acceleration (PFA) on the top floor, the peak inter-story drift (PID) on the first floor, and the peak roof drift (PRD). Comparing the “A-FixedBase” and “B-NRB-SI” models illustrates the impact of this isolation system as follows: (1) PFA range values were decreased from (0.3816–2.5476) to (0.2570–0.9959) m/s2, typically a 47% reduction for the mean value, as shown in Figure 19a; and (2) the fixed base model reported mean values of 0.0649 and 0.0394 for PID and PRD, while the isolated models provided only 0.0003 and 0.0001 drift ratios.
In addition, adding VFDs to the isolation system includes controlling the horizontal displacements at the isolation level to protect the bearing device. As a result, the total maximum displacement (DTM) for the bearing element was decreased by 4% on average (refer to Figure 19b). The peak damper force (PDF) values were estimated from 129.14 to 244.24 KN. For the global behavior, the mean values of PID and PRD ratios enlarged to 0.0018 and 0.0007 due to increasing Kh. In addition, a slight enhancement occurred regarding minimizing PFAs. This variation reflects the importance of the relative properties between dampers and bearing elements to compromise acceptable response.
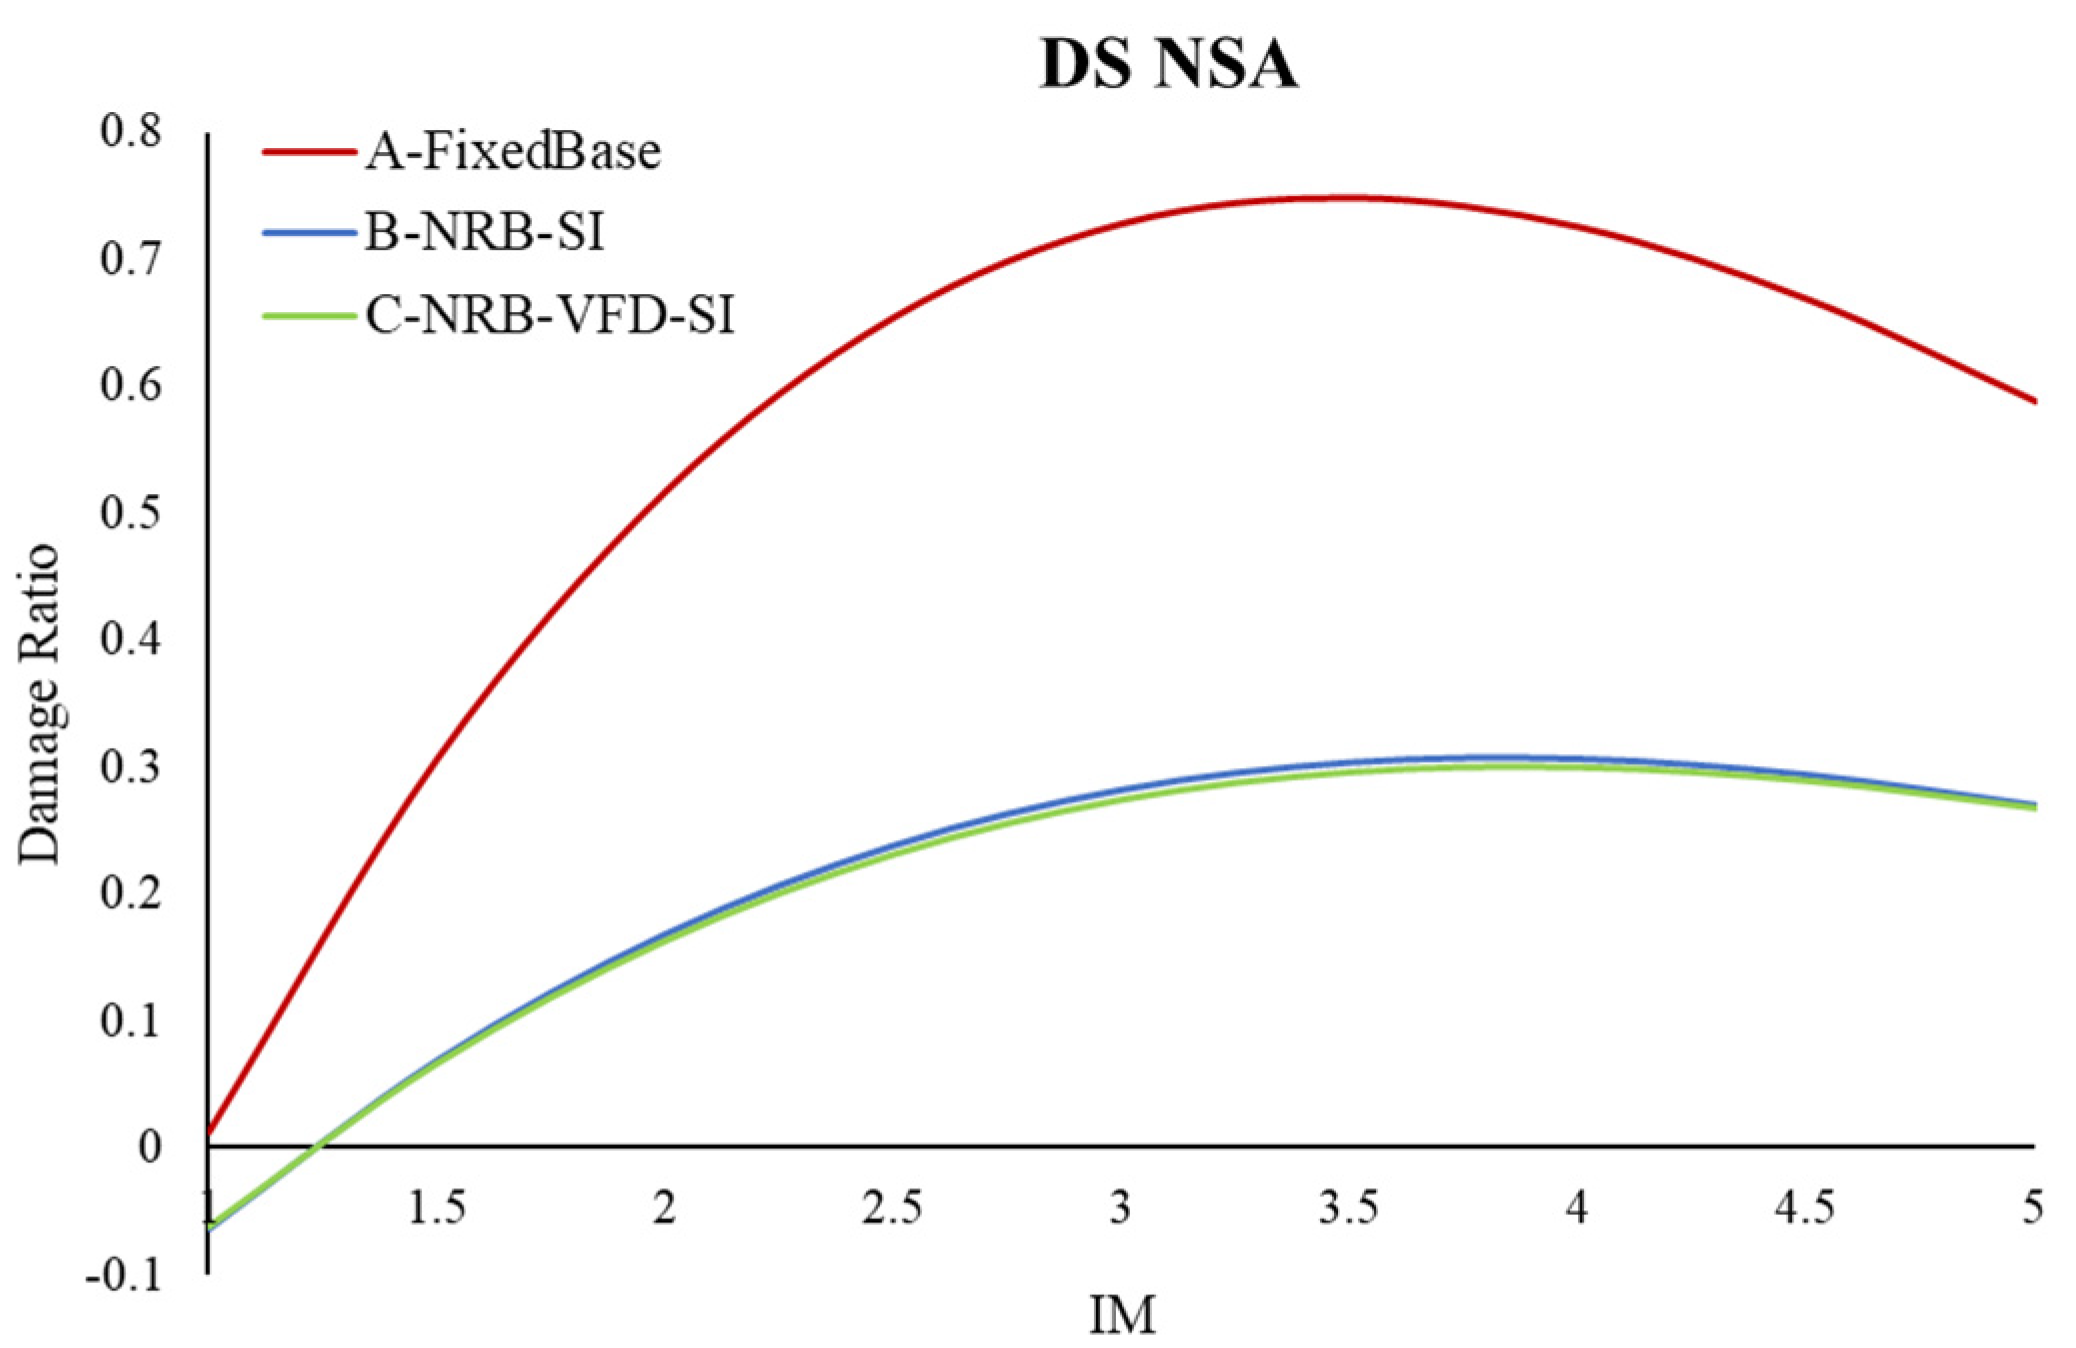
An incremental dynamic analysis was conducted by scaling the ground motions up to 5 with 0.25 increments for a better assessment. Damages and loss analyses were applied according to the HAZUS approximate approach [149] Arbitrary values were assigned to replacement cost, replacement time, and population. Damage measures (DMs) are classified into three damage states (DS): structural (S), non-structural drift-sensitive (NSD), and non-structural acceleration-sensitive (NSA), while losses are described according to the time and cost for repairs, in addition to four levels of injuries. Table 4 shows DVs for the fixed base model at different intensities of motion, while Table 5 compares the results among the three models at the maximum scale factor. Damage and loss values followed the same trends of structural responses. Moving from a fixed base to an NRB isolation, the variations of the results can be summarized as: (1) a substantial decrease occurred for S and NSD damage states as a result of minimizing drifts ratios. For instance, the reported value for “B-NRB-SI” at maximum estimated damage state is about 0.08 of its counterpart; and (2) the estimation of the NSA damage state was reduced by about 50% on average, which is close to the reduction ratio in acceleration, as shown in Figure 20. Naturally, minimizing damages is accompanied by reduced losses, so the time and cost for repairs become almost negligible. However, the tiny range of damages in the isolated models impacts the employed VDPs to be extended.
The tendency of reducing accelerations and maximizing drifts is reflected in corresponding damage states. Although calculating decision variables reflected response behavior, this transformation is necessary. It is easier to judge the design regarding monetary losses and injuries than the drift ratios or floor accelerations.

6. Conclusions

The structural engineering community started to recognize the limited advantages of the traditional, deterministic earthquake design philosophy. PBEE was established as a probabilistic framework containing hazard, structure, designing uncertainties, and shifting decision variables from engineering parameters to general variables of losses, injuries, monetary, and repair downtime variables. The PBEE Vision 2000 report and FEMA-356 presented the first generation of PBEE. Then, the PEER Center introduced a more comprehensive and rigorous methodology, which comparted the design process into four modules of hazard, structural, damage, and loss analyses. This conceptual evolution created a demand for more flexible and generic computer programs. The NHERI-SimCenter team has developed an intelligent framework of well-structured integrated mini-programs. This architecture is interactive with the different interests of researchers corresponding to the studied hazard, asset classification, and desired outputs. The integration of uncertainty quantification procedures with finite elements simulation could be the most significant feature of the program. The framework design also permits futural development for more customized and scalable cases. This research adopted the development of seismic isolation components and an incremental dynamic analysis user interface as add-ons to the design. Seismic isolation is a powerful technique to control response and minimize damages implemented in several critical structures. It is based on decoupling the superstructure and foundations and absorbing ground motion energy at the isolation level. According to their energy-dissipation mechanisms, seismic isolation bearings are classified into friction-based and elastomeric-based. Several finite element models are provided for each bearing element type. All these models were implemented in the developed add-on software components. A simple case study was included to reflect the impact of integrating the developed components with previous components. An incremental dynamic analysis was conducted for three cases of a benchmark five-story structure, as a fixed base, NRB isolation, and NRB-VFD combined isolation system. For this case study, the uncertainties of structural properties and multiple earthquake motions were applied. The corresponding results demonstrated the efficiency of the isolation technique by reducing the drift ratios and drift-sensitive components’ damages into negligible values. Moreover, it produced about a 50% reduction in floor accelerations and corresponding component damages. In addition, VFDs protect the bearing element by controlling the horizontal displacements at the interface, affecting the global isolation behavior. This demonstrates how critical it is to calibrate dampers and the properties of bearing elements to produce optimal designs. This process requires several analysis simulations according to uncertainties in the model parameters and earthquake intensity.

Author Contributions

Conceptualization, M.A.; methodology, M.A. and A.M.; software, A.M.; validation, M.A., A.M. and M.E.; formal analysis, A.M.; investigation, M.A., A.M. and M.E.; resources, M.A. and A.M.; data curation, A.M.; writing—original draft preparation, A.M.; writing—review and editing, M.A. and M.E.; visualization, A.M.; supervision, M.A.; project administration, M.A.; funding acquisition, M.A. All authors have read and agreed to the published version of the manuscript.

Funding

This research was financially supported by the American University of Sharjah (AUS) through the Faculty Research Grant program (FRG20-M-E152) and the Open Access Program (OAP). This paper represents the opinions of the authors and does not intend to represent the position or opinions of AUS.

Data Availability Statement

All data, models, or code generated or used during the study are available in a repository or online in accordance with funder data retention policies. All materials can be found at the following link: https://github.com/alhamaydeh/IDA-SI, assessed on 23 May 2023.

Acknowledgments

This research was financially supported by the American University of Sharjah (AUS) through the Faculty Research Grant program (FRG20-M-E152) and the Open Access Program (OAP). The authors greatly appreciate this financial support. This paper represents the opinions of the authors and does not intend to represent the position or opinions of AUS.

Conflicts of Interest

The authors declare no conflict of interest.

References

  1. Lee, T.; Mosalam, K.M. Probabilistic Seismic Evaluation of Reinforced Concrete Structural Components and Systems; Pacific Earthquake Engineering Research Center: Berkeley, CA, USA, 2006; p. 193. [Google Scholar]
  2. American Society of Civil Engineers (ASCE). Prestandard and Commentary for the Seismic Rehabilitation of Buildings; FE-MA-356., no. 1; American Society of Civil Engineers: Washington, DC, USA, 2000. [Google Scholar]
  3. SEAOC. Performance-Based Seismic Engineering; SEAOC Vision 2000 Committee: Sacramento, CA, USA, 1995. [Google Scholar]
  4. Günay, M.S.; Mosalam, K.M. PEER performance-based earthquake engineering methodology, revisited. J. Earthq. Eng. 2013, 17, 829–858. [Google Scholar] [CrossRef]
  5. Porter, K.A. An Overview of PEER’s Performance-Based Earthquake Engineering Methodology. In Proceedings of the 9th International Conference on Applications of Statistics and Probability in Civil Engineering, San Francisco, CA, USA, 6–9 July 2003; Volume 273, pp. 973–980. [Google Scholar]
  6. Moehle, J.; Deierlein, G.G. A Framework Methodology for Performance-Based Earthquake Engineering. In Proceedings of the 13th World Conference on Earthquake Engineering, Vancouver, BC, Canada, 1–6 August 2004; p. 679. [Google Scholar]
  7. Li, H.; Zhou, G.; Wang, J. Selection of Ground Motion Intensity Measures and Evaluation of the Ground Motion-Related Uncertainties in the Probabilistic Seismic Demand Analysis of Highway Bridges. Buildings 2022, 12, 1184. [Google Scholar] [CrossRef]
  8. Padgett, J.E.; Nielson, B.G.; DesRoches, R. Selection of optimal intensity measures in probabilistic seismic demand models of highway bridge portfolios. Earthq. Eng. Struct. Dyn. 2008, 37, 711–725. [Google Scholar] [CrossRef]
  9. Berkeley. Pacific Earthquake Engineering Research Center. Available online: https://peer.berkeley.edu/ (accessed on 26 April 2023).
  10. Bommer, J.J.; Abrahamson, N.A. Why Do Modern Probabilistic Seismic-Hazard Analyses Often Lead to Increased Hazard Estimates? Bull. Seism. Soc. Am. 2006, 96, 1967–1977. [Google Scholar] [CrossRef]
  11. Xu, C.; Deng, J.; Peng, S.; Li, C. Seismic fragility analysis of steel reinforced concrete frame structures based on different engineering demand parameters. J. Build. Eng. 2018, 20, 736–749. [Google Scholar] [CrossRef]
  12. Krawinkler, H. Van Nuys Hotel Building Testbed Report: Exercising Seismic Performance Assessment; PEER Report 2005/11; University of California: Berkeley, CA, USA, 2005. [Google Scholar]
  13. Comerio, M.C. PEER Testbed Study on a Laboratory Building: Exercising Seismic Performance Assessment; University of California: Berkeley, CA, USA, 2005. [Google Scholar]
  14. Berkeley. OpenSees. 2006. Available online: https://opensees.berkeley.edu/ (accessed on 26 April 2023).
  15. Bohl, A. Comparison of Performance Based Engineering Approaches. Master’s Thesis, The University of British Columbia, Vancouver, BC, Canada, 2009; p. 104. [Google Scholar]
  16. Goulet, C.A.; Haselton, C.B.; Mitrani-Reiser, J.; Beck, J.L.; Deierlein, G.G.; Porter, K.A.; Stewart, J.P. Evaluation of the seismic performance of a code-conforming reinforced-concrete frame building—From seismic hazard to collapse safety and economic losses. Earthq. Eng. Struct. Dyn. 2007, 36, 1973–1997. [Google Scholar] [CrossRef]
  17. CFI Team. Total Probability Rule. 2022. Available online: https://corporatefinanceinstitute.com/resources/data-science/total-probability-rule/ (accessed on 26 April 2023).
  18. Mitrani-Reiser, J.; Haselton, C.; Goulet, C.; Porter, K.; Beck, J.; Deierlein, G. Evaluation of the seismic performance of a code-conforming reinforced-concrete frame building—Part II: Loss estimation. In Proceedings of the 8th US National Conference on Earthquake Engineering, San Francisco, CA, USA, 18–22 April 2006; Volume 8. [Google Scholar]
  19. AlHamaydeh, M.; Jaradat, M.A.; Serry, M.; Sawaqed, L.; Hatamleh, K.S. Structural control of MR-dampers with genetic algorithm-optimized Quasi-Bang-Bang controller. In Proceedings of the 2017 7th International Conference on Modeling, Simulation, and Applied Optimization (ICMSAO), Sharjah, United Arab Emirates, 4–6 April 2017; pp. 1–6. [Google Scholar] [CrossRef]
  20. El-Sinawi, A.H.; AlHamaydeh, M.H.; Jhemi, A.A. Optimal Control of Magnetorheological Fluid Dampers for Seismic Isolation of Structures. Math. Probl. Eng. 2013, 2013, 251935. [Google Scholar] [CrossRef]
  21. Hussain, S.; Van Benschoten, P.; Al Satari, M.; Lin, S. Use of Viscous Fluid Dampers to Retrofit Steel Moment Frame Structures. In Proceedings of the 10th World Conference on Seismic Isolation, Energy Dissipation and Active Vibrations Control of Structures, Istanbul, Turkey, 28–31 May 2007. [Google Scholar]
  22. Hussain, S.; Al Satari, M. Viscous-Damped Seismic Isolation System for a Near-Fault Essential Services Facility. In Proceedings of the 10th World Conference on Seismic Isolation, Energy Dissipation and Active Vibrations Control of Structures, Istanbul, Turkey, 28–31 May 2007. [Google Scholar]
  23. Yehia, S.; Al Satari, M.; Abdelfatah, A.; Tabsh, S. Civil Engineering Curriculum Development Based on Track Approach. In Proceedings of the ICERI2009 Proceedings, Madrid, Spain, 16–18 November 2009; pp. 5442–5448. [Google Scholar]
  24. AlHamaydeh, M.; Maky, A.M.; Elkafrawy, M. INSPECT-SPSW: INelastic Seismic Performance Evaluation Computational Tool for Steel Plate Shear Wall Modeling in OpenSees. Buildings 2023, 13, 1078. [Google Scholar] [CrossRef]
  25. Awad, M.I.; Alhamaydeh, M.; Faris, A. Fault detection via nonlinear profile monitoring using artificial neural networks. Qual. Reliab. Eng. Int. 2018, 34, 1195–1210. [Google Scholar] [CrossRef]
  26. AlHamaydeh, M.; Choudhary, I.; Assaleh, K. Virtual Testing of Buckling-Restrained Braces via Nonlinear AutoRegressive eX-ogenous Neural Networks. J. Comput. Civ. Eng. ASCE 2013, 27, 755–768. [Google Scholar] [CrossRef]
  27. Choudhary, I.; Assaleh, K.; AlHamaydeh, M. Nonlinear AutoRegressive eXogenous Artificial Neural Networks for predicting Buckling restrained braces force. In Proceedings of the 2012 International Symposium on Mechatronics and Its Applications (ISMA 2012), Sharjah, United Arab Emirates, 10–12 April 2012. [Google Scholar] [CrossRef]
  28. Barakat, S.; AlHamaydeh, M. Preliminary Design of Seismic Isolation Systems Using Artificial Neural Networks. In Proceedings of the 2014 International Conference on Neural Networks—Fuzzy Systems (NN-FS 2014), Gdansk, Poland, 15–17 May 2014; pp. 91–95. [Google Scholar]
  29. Awad, M.; AlHamaydeh, M.; Mohamed, A.F. Structural damage fault detection using Artificial Neural network profile moni-toring. In Proceedings of the 2017 7th International Conference on Modeling, Simulation, and Applied Optimization (ICMSAO), Sharjah, United Arab Emirates, 4–6 April 2017; pp. 1–6. [Google Scholar]
  30. Barakat, S.A.; AlHamaydeh, M.H. Preliminary Design of Seismic Isolation Systems Using Artificial Neural Networks. Int. J. Neural Netw. Adv. Appl. 2022, 9, 12–17. [Google Scholar] [CrossRef]
  31. Assaleh, K.; AlHamaydeh, M.; Choudhary, I. Modeling nonlinear behavior of Buckling-Restrained Braces via different artificial intelligence methods. Appl. Soft Comput. 2015, 37, 923–938. [Google Scholar] [CrossRef]
  32. AlHamaydeh, M.; Markou, G.; Bakas, N.; Papadrakakis, M. AI-based shear capacity of FRP-reinforced concrete deep beams without stirrups. Eng. Struct. 2022, 264, 114441. [Google Scholar] [CrossRef]
  33. Al Satari, M.; Abdalla, J. Optimization of A Base-Isolation System Consisting of Natural Rubber Bearings and Fluid Viscous Dampers. In Proceedings of the 11th World Conference on Seismic Isolation, Energy Dissipation and Active Vibration Control of Structures, Guangzhou, China, 17–20 November 2009. [Google Scholar]
  34. AlHamaydeh, M.H.; Mohamed, A.F.; Awad, M.I. Development of Fault-Detection ANNs for Structural Damage Prediction. In ACI SP-350: The Concrete Industry in the Era of Artificial Intelligence; American Concrete Institute (ACI): Indianapolis, IN, USA, 2021; pp. 45–53. [Google Scholar]
  35. AlHamaydeh, M.; Elkafrawy, M.; Banu, S. Seismic Performance and Cost Analysis of UHPC Tall Buildings in UAE with Ductile Coupled Shear Walls. Materials 2022, 15, 2888. [Google Scholar] [CrossRef]
  36. AlHamaydeh, M.; Elkafrawy, M.E.; Kyaure, M.; Elyas, M.; Uwais, F. Cost Effectiveness of UHPC Ductile Coupled Shear Walls for High-Rise Buildings in UAE Subjected to Seismic Loading. In Proceedings of the 2022 Advances in Science and Engineering Technology International Conferences (ASET), Dubai, United Arab Emirates, 21–24 February 2022; pp. 1–6. [Google Scholar] [CrossRef]
  37. AlHamaydeh, M.; Elkafrawy, M.E.; Aswad, N.G.; Talo, R.; Banu, S. Evaluation of UHPC Tall Buildings in UAE with Ductile Coupled Shear Walls under Seismic Loading. In Proceedings of the 2022 Advances in Science and Engineering Technology International Conferences (ASET), Dubai, United Arab Emirates, 21–24 February 2022; pp. 1–6. [Google Scholar] [CrossRef]
  38. AlHamaydeh, M.; Al-Shamsi, G.; Aly, N.; Ali, T. Seismic risk quantification and GIS-based seismic risk maps for Dubai-UAE_Dataset. Data Brief 2021, 39, 107566. [Google Scholar] [CrossRef]
  39. AlHamaydeh, M.; Al-Shamsi, G.; Aly, N.; Ali, T. Geographic Information System-Based Seismic Risk Assessment for Dubai, UAE: A Step toward Resilience and Preparedness. Pract. Period. Struct. Des. Constr. 2022, 27, 04021069. [Google Scholar] [CrossRef]
  40. Malekloo, A.; Ozer, E.; AlHamaydeh, M.; Girolami, M. Machine learning and structural health monitoring overview with emerging technology and high-dimensional data source highlights. Struct. Health Monit. 2022, 21, 1906–1955. [Google Scholar] [CrossRef]
  41. Sawires, R.; Peláez, J.; AlHamaydeh, M.; Henares, J. Up-to-date earthquake and focal mechanism solutions datasets for the assessment of seismic hazard in the vicinity of the United Arab Emirates. Data Brief 2019, 28, 104844. [Google Scholar] [CrossRef] [PubMed]
  42. AlHamaydeh, M.; Wong, K.; Fernandes, R.; Seok, J.; Abdel-Rahman, E.; El-Borgi, S. Structural Health Monitoring Using Time-Delay Embedding and Phase-Space Warping. In Proceedings of the 5th International Conference on Computational Methods in Structural Dynamics and Earthquake Engineering (COMPDYN2015), Crete Island, Greece, 25–27 May 2015; pp. 2568–2575. [Google Scholar]
  43. AlHamaydeh, M.; Siddiqi, M. OpenSEES GUI for Elastomeric Seismic Isolation Systems. In Proceedings of the First Eurasian Conference on Open-SEES (OpenSEES Days Eurasia), Hong Kong, China, 20–21 June 2019. [Google Scholar]
  44. Sawires, R.; Peláez, J.A.; AlHamaydeh, M.; Henares, J. A state-of-the-art seismic source model for the United Arab Emirates. J. Asian Earth Sci. 2019, 186, 104063. [Google Scholar] [CrossRef]
  45. AlHamaydeh, M.; Elayyan, L. Impact of diverse seismic hazard estimates on design and performance of Steel Plate Shear Walls buildings in Dubai, UAE. In Proceedings of the 2017 7th International Conference on Modeling, Simulation, and Applied Optimization (ICMSAO), Sharjah, United Arab Emirates, 4–6 April 2017; pp. 1–4. [Google Scholar] [CrossRef]
  46. AlHamaydeh, M.; Elayyan, L.; Najib, M. Impact of Eliminating Web Plate Buckling on the Design, Cost and Seismic Perfor-mance of Steel Plate Shear Walls. In Proceedings of the 2015 International Conference on Steel and Composite Structures (ICSCS15), Incheon, Republic of Korea, 25–29 August 2015. [Google Scholar]
  47. Alhamaydeh, M.; Barakat, S.; Nassif, O.; Papadrakakis, M. Optimization of quatropod jacket support structures for offshore wind turbines subject to seismic loads using genetic algorithms. In Proceedings of the 5th International Conference on Computational Methods in Structural Dynamics and Earthquake Engineering (COMPDYN2015), Crete Island, Greece, 25–27 May 2015; pp. 3505–3513. [Google Scholar] [CrossRef]
  48. Barakat, S.; AlHamaydeh, M.; Nassif, O. Optimization of Seismic Isolation Systems with Viscous Fluid Dampers Using Genetic Algorithms. In Proceedings of the 5th International Conference on Computational Methods in Structural Dynamics and Earthquake Engineering (COMPDYN2015), Crete Island, Greece, 25–27 May 2015; pp. 4086–4095. [Google Scholar]
  49. AlHamaydeh, M.; Aly, N. Optimum Seismic Isolation System Design for Retrofitting and Upgrading Existing Concrete Bridges. In Proceedings of the 2014 International Conference on Mechanics, Fluid Mechanics, Heat and Mass Transfer (MFMHMT 2014), Orlando, FL, USA, 14–16 July 2014; pp. 135–139. [Google Scholar]
  50. Al Satari, M. Estimation of Seismic Response Demands for R/C Framed Structures: An Insight into the Nonlinear Seismic Behavior; VDM Verlag: Saarbrücken, Germany, 2008. [Google Scholar]
  51. Hussain, S.; Al Satari, M. Design of a Seismic Isolation System with Supplemental Viscous Damping for a Near-Fault Essential Facility. In Proceedings of the 14th World Conference on Earthquake Engineering, Beijing, China, 12–17 October 2008. [Google Scholar]
  52. Al Satari, M.; Anderson, J. Nonlinearity Effects on the Seismic Behavior of RC Framed Structures. In Proceedings of the 76th SEAOC Annual Convention, Squaw Creek, CA, USA, 26–29 September 2007. [Google Scholar]
  53. Anderson, J.; Bertero, V.; Al Satari, M. Inelastic Seismic Response of a Tilt-up Wall Building and Design Implications. In Proceedings of the 74th SEAOC Annual Convention, San Diego, CA, USA, 28 September–1 October 2005. [Google Scholar]
  54. Al Satari, M.H. Estimation of Seismic Response Demands for RC Framed Structures; University of Southern California: Los Angeles, CA, USA, 2005. [Google Scholar]
  55. Hussain, S.; Al Satari, M. Design of a Seismic Isolation System with Supplemental Viscous Damping for a Near-Fault Essential Services Facility. In Proceedings of the 76th SEAOC Annual Convention, Tainan, Taiwan, 7–10 May 2007. [Google Scholar]
  56. Anderson, J.C.; Bertero, V.V.; Kargahi, M.; Al Satari, M. Seismic Performance of an Instrumented Tilt-up Wall Building; Pacific Earthquake Engineering Research Center: Berkeley, CA, USA, 2004. [Google Scholar]
  57. ElSinawi, A.H.; Jhemi, A.; AlHamaydeh, M. Adaptive seismic isolation of structures using MR-fluid dampers. In Proceedings of the 2013 5th International Conference on Modeling, Simulation and Applied Optimization (ICMSAO), IEEE, Hammamet, Tunisia, 28–30 April 2013; pp. 1–6. [Google Scholar] [CrossRef]
  58. AlHamaydeh, M.; Galal, K.; Yehia, S. Impact of lateral force-resisting system and design/construction practices on seismic performance and cost of tall buildings in Dubai, UAE. Earthq. Eng. Eng. Vib. 2013, 12, 385–397. [Google Scholar] [CrossRef]
  59. AlHamaydeh, M.; Abdalla, J.; Abdalla, S.; Al-Rahmani, A.; Mostafa, A. Inelastic Seismic Demands for Reinforced Concrete Frames in Dubai. In Proceedings of the 14th European Earthquake Engineering Conference (14EEEC), Ohrid, North Macedonia, 30 August–3 September 2010. [Google Scholar]
  60. Hussain, S.; AlHamaydeh, M.; Aly, N. Jakarta’s First Seismic-Isolated Building—A 25 Story Tower. In Proceedings of the 15th World Conference on Earthquake Engineering (15WCEE), Lisbon, Portugal, 24–28 September 2012. [Google Scholar]
  61. Aly, N.; Alhamaydeh, M.; Galal, K. Quantification of the Impact of Detailing on the Performance and Cost of RC Shear Wall Buildings in Regions with High Uncertainty in Seismicity Hazards. J. Earthq. Eng. 2018, 24, 421–446. [Google Scholar] [CrossRef]
  62. AlHamaydeh, M.; Aly, N.; Galal, K. Effect of Diverse Seismic Hazard Estimates on Design and Performance of RC Shear Wall Buildings in Dubai, UAE. In Proceedings of the 2015 World Congress on Advances in Structural Engineering and Mechanics (ASEM15), Incheon, Republic of Korea, 25–29 August 2015. [Google Scholar]
  63. AlHamaydeh, M.; Aly, N.; Galal, K. Impact of Seismicity on Performance and Cost of RC Shear Wall Buildings in Dubai, United Arab Emirates. J. Perform. Constr. Facil. 2017, 31, 04017083. [Google Scholar] [CrossRef]
  64. AlHamaydeh, M.; Abdullah, S.; Hamid, A.; Mustapha, A. Seismic design factors for RC special moment resisting frames in Dubai, UAE. Earthq. Eng. Eng. Vib. 2011, 10, 495–506. [Google Scholar] [CrossRef]
  65. AlHamaydeh, M.; Aly, N.; Galal, K. Seismic response and life-cycle cost of reinforced concrete special structural wall buildings in Dubai, UAE. Struct. Concr. 2017, 19, 771–782. [Google Scholar] [CrossRef]
  66. AlHamaydeh, M.; Hussain, S. Innovative Design of a Seismically-Isolated Building with Supplemental Damping. In Proceedings of the 14th European Earthquake Engineering Conference (14EEEC), Ohrid, North Macedonia, 30 August–3 September 2010. [Google Scholar]
  67. AlHamaydeh, M.; Elkafrawy, M.E.; Amin, F.M.; Maky, A.M.; Mahmoudi, F. Analysis and Design of UHPC Tall Buildings in UAE with Ductile Coupled Shear Walls Lateral Load Resisting System. In Proceedings of the 2022 Advances in Science and Engineering Technology International Conferences (ASET), Dubai, United Arab Emirates, 21–24 February 2022; pp. 1–6. [Google Scholar] [CrossRef]
  68. Al Satari, M.; Hussain, S. Vibration-Based Wind Turbine Tower Foundation Design Utilizing Soil-Foundation-Structure Inter-action. In Proceedings of the 3rd International Conference on Modeling, Simulation and Applied Optimization (ICMSAO’09), Sharjah, United Arab Emirates, 20–22 January 2009. [Google Scholar]
  69. Hussain, S.; Al Satari, M. Vibration-Based Wind Tower Foundation Design. Wind Systems Magazine, 2009; 28–35. [Google Scholar]
  70. AlHamaydeh, M.; Hussain, S. Optimized frequency-based foundation design for wind turbine towers utilizing soil–structure interaction. J. Frankl. Inst. 2011, 348, 1470–1487. [Google Scholar] [CrossRef]
  71. AlHamaydeh, M.; Barakat, S.; Nasif, O. Optimization of Support Structures for Offshore Wind Turbines Using Genetic Algo-rithm with Domain-Trimming. Math. Probl. Eng. 2017, 2017, 5978375. [Google Scholar] [CrossRef]
  72. Al Satari, M.; Hussain, S. Vibration Based Wind Turbine Tower Foundation Design Utilizing Soil-Foundation-Structure Inter-action. In Proceedings of the 14th World Conference on Earthquake Engineering, Beijing, China, 12–17 October 2008. [Google Scholar]
  73. Abdel-Jawad, Y.; Al Satari, M. Freeze-Thaw Resistance of Concrete Incorporating Recycled Tire Rubbers as Fine Aggregate. In Fifth International Conference on Concrete Technology for Developing Countries: Proceedings; European Council: Brussels, Belgium, 1999. [Google Scholar]
  74. Hussain, S.; Van Benschoten, P.; Al Satari, M.; Lin, S. Buckling Restrained Braced Frame (BRBF) Structures: Analysis, Design and Approvals Issues. In Proceedings of the 75th SEAOC Annual Convention, Long Beach, CA, USA, 13–16 September 2006. [Google Scholar]
  75. Hussain, S.; Van Benschoten, P.; Nerurkar, A.; Al Satari, M.; Guttema, T. Viscous Fluid Damper Retrofit of Pre-Northridge Steel Moment Frame Structures. In Proceedings of the 75th SEAOC Annual Convention, Long Beach, CA, USA, 13–16 September 2006. [Google Scholar]
  76. Hussain, S.; Van Benschoten, P.; Al Satari, M.; Lin, S. Viscous-Fluid-Spring Damper Retrofit of a Steel Moment Frame Structure. In Proceedings of the 2008 Seismic Engineering International Conference commemorating the 1908 Messina and Reggio Calabria Earthquake (MERCEA’08), Reggio Calabria, Italy, 8–11 July 2008; pp. 1381–1389. [Google Scholar]
  77. Yehia, S.; AlHamaydeh, M.; Al-Khanchi, Y.; Ghonima, O. Investigation of Utilizing Lightweight Fine Aggregate on the De-velopment of SCC Matrix. In Proceedings of the 7th International Conference on Material Sciences (CSM7), Beirut, Lebanon, 20–22 May 2010. [Google Scholar]
  78. AlHamaydeh, M.; Hussain, S.; Tasbihgoo, F. Design of a High-Rise Building Utilizing Supplemental Damping. In Proceedings of the 14th European Earthquake Engineering Conference (14EEEC), Ohrid, North Macedonia, 30 August–3 September 2010. [Google Scholar]
  79. Yehia, S.; AlHamaydeh, M.; Al Ali, H.; Al Jarwan, M.; Al-Khanchi, Y. Effect of Aggregate Source on the Development of High Strength Lightweight SCC Matrix. In Proceedings of the 7th International Conference on Material Sciences (CSM7), Beirut, Lebanon, 20–22 May 2010. [Google Scholar]
  80. Yehia, S.; Al Satari, M.; Al Ali, H.; Al-Jarwan, M.; Al-Omari, F. High Strength Light Weight Self-Consolidating Concrete Mix-ture: Development and Evaluation. In Proceedings of the 4th International Conference on the Applications of Traditional and High Performance Materials in Harsh Environment (IMS/4); 2010; pp. 83–90. [Google Scholar]
  81. Tabsh, S.; Abdelfatah, A.; AlHamaydeh, M.; Yehia, S. Comparison of civil engineering curricula in the Arab Middle-East countries. In Proceedings of the 5th International Forum on Engineering Education (IFEE2010), Sharjah, United Arab Emirates, 23–25 November 2010; pp. 403–412. [Google Scholar]
  82. Yehia, S.; AlHamaydeh, M.; Alhajri, R.; Abdelsalam, A.; Farid, A. Steel Fiber SCC High Strength Lightweight Concrete with Local Available Materials. In Proceedings of the Central European Congress on Concrete Engineering (CCC 2011), Balatonfüred, Hungary, 22–23 September 2011; pp. 1–4. [Google Scholar]
  83. Yehia, S.; AlHamaydeh, M.; El Kalie, S.; Ibrahim, Y. Recommended Concrete Properties for High Strength Steel Reinforcement—Overview. In Proceedings of the Central European Congress on Concrete Engineering (CCC 2011), Balatonfüred, Hungary, 22–23 September 2011; pp. 1–4. [Google Scholar]
  84. AlHamaydeh, M.; Yehia, S.; Aly, N.; Douba, A.; Hamzeh, L. Design Alternatives for Lateral Force-Resisting Systems of Tall Buildings in Dubai, UAE. Int. J. Civ. Environ. Eng. 2012, 6, 185–188. [Google Scholar]
  85. Yehia, S.; Al Hamaydeh, M.; Abdelfatah, A.; Tabsh, S. ABET-accredited civil engineering programmes following track system: Part II—Implementation of the proposed framework. Glob. J. Eng. Educ. 2012, 14, 69–76. [Google Scholar]
  86. Yehia, S.; AlHamaydeh, M.; Abdelfatah, A.; Tabsh, S. ABET-accredited civil engineering programmes following track system: Part I—Survey and framework development. Glob. J. Eng. Educ. 2012, 14, 57–68. [Google Scholar]
  87. Tabsh, S.W.; Abdelfatah, A.; Alhamaydeh, M.; Yehia, S. Comparison of civil engineering curricula in the Arab world. Int. J. Eng. Educ. 2012, 28, 1213. [Google Scholar]
  88. Yehia, S.; AlHamaydeh, M.; Alhajri, R.; Abdelsalam, A. Development and Evaluation of Self-Consolidated High Strength Lightweight Steel Fiber Concrete in UAE. In Proceedings of the IABSE Symposium Report, Rotterdam, The Netherlands, 6–8 May 2013. [Google Scholar] [CrossRef]
  89. Yehia, S.; AlHamaydeh, M.; Abed, F.; Rabie, M.; Resheidat, S.; El-Kalie, S.; Abudagga, M. Evaluation of Concrete Properties for High Strength Steel Applications. In Proceedings of the IABSE Symposium Report, Rotterdam, The Netherlands, 6–8 May 2013. [Google Scholar] [CrossRef]
  90. Abdalla, S.; Abed, F.; AlHamaydeh, M. Behavior of CFSTs and CCFSTs under quasi-static axial compression. J. Constr. Steel Res. 2013, 90, 235–244. [Google Scholar] [CrossRef]
  91. ElSinawi, A.H.; Jhemi, A.; AlHamaydeh, M. Linearized state-space model of the behavior of MR-fluid dampers. In Proceedings of the 5th International Conference on Modeling, Simulation and Applied Optimization (ICMSAO’13), Hammamet, Tunisia, 28–30 April 2013; pp. 1–5. [Google Scholar] [CrossRef]
  92. AlHamaydeh, M.; Al-Shamsi, G. Development of Analytical Fragility Curves for Representative Buildings in Dubai, United Arab Emirates. In Proceedings of the International Conference on Earthquake Engineering; Skopje Earthquake—50 Years of European Earthquake Engineering (SE-50EEE), Skopje, North Macedonia, 29–31 May 2013. [Google Scholar]
  93. Yehia, S.; AlHamaydeh, M.; Farrag, S. High-Strength Lightweight SCC Matrix with Partial Normal-Weight Coarse-Aggregate Replacement: Strength and Durability Evaluations. J. Mater. Civ. Eng. 2014, 26, 04014086. [Google Scholar] [CrossRef]
  94. AlHamaydeh, M.; Ibrahim, N.; Kaloti, D.; Alhasan, O.; Aisha, A. Structural Design of Steel Plate Shear Wall Systems in Dubai, UAE. In West-Meets-East: Exploring Sustainable Development, Innovation, and Entrepreneurship Opportunities; IEEE: Piscataway, NJ, USA, 2014. [Google Scholar]
  95. AlHamaydeh, M.; Najib, M.; Elayyan, L. INSPECT-Lite: A GUI Pre-Processor Package for IDARC-2D Ver 7. In 0. In Proceedings of the 2015 World Congress on Advances in Structural Engineering and Mechanics (ASEM15), Incheon, Republic of Korea, 25–29 August 2015. [Google Scholar]
  96. AlHamaydeh, M.; Abed, F.; Mustapha, A. Key parameters influencing performance and failure modes for BRBs using nonlinear FEA. J. Constr. Steel Res. 2016, 116, 1–18. [Google Scholar] [CrossRef]
  97. AlHamaydeh, M.; Najib, M.; Alawnah, S. INSPECT: A graphical user interface software package for IDARC-2D. Softwarex 2016, 5, 243–251. [Google Scholar] [CrossRef]
  98. Tiberti, G.; Trabucchi, I.; AlHamaydeh, M.; Minelli, F.; Plizzari, G. Crack control in concrete members reinforced by conventional rebars and steel fibers. In Proceedings of the 9th International Conference on Fibre Reinforced Concretes (FRC), Textile Reinforced Concretes (TRC) and Ultra-High Performance Concretes (UHPC) (FIBRE CONCRETE 2017), Prague, Czech Republic, 13–16 September 2017; p. 012008. [Google Scholar] [CrossRef]
  99. AlHamaydeh, M.; Sagher, A. Key parameters influencing the behavior of Steel Plate Shear Walls (SPSW). In Proceedings of the 2017 7th International Conference on Modeling, Simulation, and Applied Optimization (ICMSAO), Sharjah, United Arab Emirates, 4–6 April 2017; pp. 1–6. [Google Scholar] [CrossRef]
  100. Markou, G.; AlHamaydeh, M.; Saadi, D. Effects of the Soil-Structure-Interaction Phenomenon on RC Structures with Pile Foundations. In Proceedings of the 9th GRACM International Congress on Computational Mechanics, Crete, Greece, 4–6 June 2018. [Google Scholar]
  101. Tiberti, G.; Trabucchi, I.; Alhamaydeh, M.; Minelli, F.; Plizzari, G.A. Crack development in steel-fibre-reinforced concrete members with conventional rebars. Mag. Concr. Res. 2019, 71, 599–610. [Google Scholar] [CrossRef]
  102. AlHamaydeh, M.; Aly, N.; Najib, M.; Alawnah, S. INSPECT-PBEE: A performance-based earthquake engineering GUI for IDARC-2D. Softwarex 2019, 9, 132–144. [Google Scholar] [CrossRef]
  103. Kuehn, N.; Kishida, T.; AlHamaydeh, M.; Lavrentiadis, G.; Bozorgnia, Y. Nikuehn/BayesTruncRegGMM: Pre-review; Zenodo: Genève, Switzerland, 2020. [Google Scholar] [CrossRef]
  104. Kuehn, N.M.; Kishida, T.; AlHamaydeh, M.; Lavrentiadis, G.; Bozorgnia, Y. A Bayesian model for truncated regression for the estimation of empirical ground-motion models. Bull. Earthq. Eng. 2020, 18, 6149–6179. [Google Scholar] [CrossRef]
  105. Saleh, E.; Tarawneh, A.; Dwairi, H.; AlHamaydeh, M. Guide to non-destructive concrete strength assessment: Homogeneity tests and sampling plans. J. Build. Eng. 2022, 49, 104047. [Google Scholar] [CrossRef]
  106. Al-Sadoon, Z.A.; Karzad, A.S.; Sagheer, A.; AlHamaydeh, M. Replaceable fuse buckling-restrained brace (BRB): Experimental cyclic qualification testing and NLFEA modeling. Structures 2022, 39, 997–1015. [Google Scholar] [CrossRef]
  107. Moghadam, A.; AlHamaydeh, M.; Sarlo, R. Bridge-weigh-in-motion approach for simultaneous multiple vehicles on concrete-box-girder bridges. Autom. Constr. 2022, 137, 104179. [Google Scholar] [CrossRef]
  108. Alashkar, A.; Elkafrawy, M.; Hawileh, R.; AlHamaydeh, M. Buckling Analysis of Functionally Graded Materials (FGM) Thin Plates with Various Circular Cutout Arrangements. J. Compos. Sci. 2022, 6, 277. [Google Scholar] [CrossRef]
  109. Nambiar, D.K.; Kishida, T.; Abdallatif, T.F.; AlHamaydeh, M.H. VS30 Correlations from Shear Wave Velocity Profiles in the UAE. In Geotechnical, Geological and Earthquake Engineering, Proceedings of the 4th International Conference on Performance Based Design in Earthquake Geotechnical Engineering (Beijing 2022); Springer: Berlin/Heidelberg, Germany, 2022; pp. 971–979. [Google Scholar]
  110. Saleh, M.; AlHamaydeh, M.; Zakaria, M. Finite element analysis of reinforced concrete deep beams with square web openings using damage plasticity model. Eng. Struct. 2023, 278, 115496. [Google Scholar] [CrossRef]
  111. Karzad, A.S.; Al-Sadoon, Z.A.; Sagheer, A.; AlHamaydeh, M. Experimental and Nonlinear Finite Element Analysis Data for an Innovative Buckling Restrained Bracing System to Rehabilitate Seismically Deficient Structures. Data 2022, 7, 171. [Google Scholar] [CrossRef]
  112. Karzad, A.S.; Al-Sadoon, Z.; Sagheer, A.; AlHamaydeh, M. Dataset from Experimental and Nonlinear Finite Element Modeling Investigating an Innovative Buckling Restrained Bracing System for Rehabilitation of Seismic Deficient Structures; Zenodo: Genève, Switzerland, 2022. [Google Scholar] [CrossRef]
  113. Elkafrawy, M.E.; Khalil, A.M.; Abuzaid, W.; Hawileh, R.A.; AlHamaydeh, M. Nonlinear Finite Element Analysis (NLFEA) of Pre-stressed RC Beams Reinforced with Iron-Based Shape Memory Alloy (Fe-SMA). In Proceedings of the 2022 Advances in Science and Engineering Technology International Conferences (ASET), Dubai, United Arab Emirates, 21–24 February 2022; pp. 1–7. [Google Scholar] [CrossRef]
  114. Markou, G.; Alhamaydeh, M. 3D finite element modeling of GFRP-reinforced concrete deep beams without shear reinforce-ment. Int. J. Comput. Methods 2018, 15, 1–35. [Google Scholar] [CrossRef]
  115. Abed, F.H.; Barakat, S.; AlHamaydeh, M. Nonlinear Finite Element Analysis of Buckling Capacity of Pretwisted Bars. J. Eng. Mech. 2013, 139, 791–801. [Google Scholar] [CrossRef]
  116. Elkafrawy, M.; Khalil, A.; AlHamaydeh, M.; Hawileh, R.; Abuzaid, W. Enhancing the Shear Capacity of RC Beams with Web Openings in Shear Zones Using Pre-Stressed Fe-SMA Bars: Numerical Study. Preprints.org 2023, 2023050292. [Google Scholar] [CrossRef]
  117. Abed, F.; Barakat, S.; AlHamaydeh, M. Numerical simulation of buckling of pretwisted non-circular bars. In Proceedings of the 4th International Conference on Modeling, Simulation and Applied Optimization (ICMSAO’11), Kuala Lumpur, Malaysia, 19–21 April 2011; pp. 1–6. [Google Scholar] [CrossRef]
  118. AlHamaydeh, M.; Barakat, S.; Abed, F. Multiple Regression Modeling of Natural Rubber Seismic-Isolation Systems with Sup-plemental Viscous Damping for Near-Field Ground Motion. J. Civ. Eng. Manag. 2013, 19, 665–682. [Google Scholar] [CrossRef]
  119. AlHamaydeh, M.; Markou, G.; Saadi, D. Nonlinear FEA of soil-structure-interaction effects on RC shear wall structures. In Proceedings of the 6th International Conference on Computational Methods in Structural Dynamics and Earthquake Engineering Methods in Structural Dynamics and Earthquake Engineering, Rhodes Island, Greece, 15–17 June 2017; pp. 3476–3490. [Google Scholar] [CrossRef]
  120. AlHamaydeh, M.; Amin, F. Interaction Diagrams of Geopolymer FRC Slender Columns with Double-Layer Reinforcement_Dataset V1; Zenodo: Genève, Switzerland, 2021. [Google Scholar] [CrossRef]
  121. AlHamaydeh, M.; Amin, F. Strength Curves of Slender Geopolymer Concrete Columns_Dataset; Zenodo: Genève, Switzerland, 2021. [Google Scholar] [CrossRef]
  122. AlHamaydeh, M.; Amin, F.M. Strength curve data for slender geopolymer concrete columns with GFRP, steel and hybrid reinforcement. Data Brief 2021, 39, 107589. [Google Scholar] [CrossRef] [PubMed]
  123. AlHamaydeh, M.; Amin, F. Data for Interaction Diagrams of Geopolymer FRC Slender Columns with Double-Layer GFRP and Steel Reinforcement. Data 2021, 6, 43. [Google Scholar] [CrossRef]
  124. Elkafrawy, M.; Alashkar, A.; Hawileh, R.; AlHamaydeh, M. FEA Investigation of Elastic Buckling for Functionally Graded Material (FGM) Thin Plates with Different Hole Shapes under Uniaxial Loading. Buildings 2022, 12, 802. [Google Scholar] [CrossRef]
  125. Khalil, A.; Elkafrawy, M.; Abuzaid, W.; Hawileh, R.; AlHamaydeh, M. Flexural Performance of RC Beams Strengthened with Pre-Stressed Iron-Based Shape Memory Alloy (Fe-SMA) Bars: Numerical Study. Buildings 2022, 12, 2228. [Google Scholar] [CrossRef]
  126. Al Satari, M.; Anderson, J. Estimating Inelastic Seismic Demands by Elastic Analysis for Reinforced Concrete (RC) Framed Structures. In Proceedings of the 75th SEAOC Annual Convention, Long Beach, CA, USA, 13–16 September 2006; pp. 153–167. [Google Scholar]
  127. Abed, F.; AlHamaydeh, M.; Abdalla, S. Experimental and numerical investigations of the compressive behavior of concrete filled steel tubes (CFSTs). J. Constr. Steel Res. 2013, 80, 429–439. [Google Scholar] [CrossRef]
  128. AlHamaydeh, M.; Jarallah, H.; Ahmed, M. Punching Shear Capacity of Two-Way Slabs Made with Macro Synthetic Fiber-Reinforced Concrete. In Proceedings of the 11th International Conference on Composite Science and Technology (ICCST-11), Sharjah, United Araba Emirates, 4–6 April 2017. [Google Scholar]
  129. AlHamaydeh, M.; Orabi, M.A.; Ahmed, M.; Mohamed, S.; Jabr, A.; Al Hariri, M.K. Punching Shear Capacity of Macro Synthetic Fiber-Reinforced Concrete Two-Way Slabs with GFRP Rebars. In Proceedings of the 11th International Conference on Composite Science and Technology (ICCST-11), Sharjah, United Araba Emirates, 4–6 April 2017. [Google Scholar]
  130. Al Hamaydeh, M.; Afghan, F.; Mithani, R.; Besiso, T.; Al Salim, H. Shear strength of circular beams made of geopolymer concrete and reinforced with GFRP rebars. AIP Conf. Proc. 2020, 2297, 020031. [Google Scholar] [CrossRef]
  131. AlHamaydeh, M.; Orabi, M.A. Experimental quantification of punching shear capacity for large-scale GFRP-reinforced flat slabs made of synthetic fiber-reinforced self-compacting concrete dataset. Data Brief 2021, 37, 107196. [Google Scholar] [CrossRef] [PubMed]
  132. AlHamaydeh, M.; Orabi, M.A. Punching Shear Behavior of Synthetic Fiber–Reinforced Self-Consolidating Concrete Flat Slabs with GFRP Bars. J. Compos. Constr. 2021, 25, 04021029. [Google Scholar] [CrossRef]
  133. Al-Sadoon, Z.A.; Karzad, A.S.; Sagheer, A.; AlHamaydeh, M. Proof-of-Concept and Experimental Qualification for a Repairable Buckling-Restrained Brace (BRB). In Proceedings of the Coordinating Engineering for Sustainability and Resilience (CESARE22), Irbid, Jordan, 6–9 May 2022; pp. 279–288. [Google Scholar]
  134. Abed, F.; El-Chabib, H.; AlHamaydeh, M. Shear characteristics of GFRP-reinforced concrete deep beams without web reinforcement. J. Reinf. Plast. Compos. 2012, 31, 1063–1073. [Google Scholar] [CrossRef]
  135. Khalil, A.E.-H.; Etman, E.; Atta, A.; Essam, M. Nonlinear behavior of RC beams strengthened with strain hardening cementitious composites subjected to monotonic and cyclic loads. Alex. Eng. J. 2016, 55, 1483–1496. [Google Scholar] [CrossRef]
  136. Khalil, A.E.-H.; Etman, E.; Atta, A.; Essam, M. Ductility enhancement of RC beams strengthened with strain hardening cementitious composites. Proc. Int. Struct. Eng. Constr. 2017, 4, 1–6. [Google Scholar] [CrossRef]
  137. Khalil, A.E.-H.; Etman, E.; Atta, A.; Essam, M. Strengthening of RC beams subjected to cyclic load using ultra high-performance strain hardening cementitious composites. Proc. Int. Struct. Eng. Constr. 2017, 4, 1–6. [Google Scholar] [CrossRef]
  138. Khalil, A.E.-H.; Etman, E.; Atta, A.; Essam, M. Behavior of RC beams strengthened with strain hardening cementitious composites (SHCC) subjected to monotonic and repeated loads. Eng. Struct. 2017, 140, 151–163. [Google Scholar] [CrossRef]
  139. SimCenter. SimCenter. Available online: https://simcenter.designsafe-ci.org/ (accessed on 5 April 2023).
  140. Deierlein, G.G.; Zsarnóczay, A. State of the Art in Computational Simulation for Natural Hazards Engineering; SimCenter: Kariya, Japan, 2021. [Google Scholar]
  141. McKenna, F.; Scott, M.H.; Fenves, G.L. Nonlinear Finite-Element Analysis Software Architecture Using Object Composition. J. Comput. Civ. Eng. 2010, 24, 95–107. [Google Scholar] [CrossRef]
  142. Jasak, H. OpenFOAM: Open source CFD in research and industry. Int. J. Nav. Arch. Ocean Eng. 2009, 1, 89–94. [Google Scholar] [CrossRef]
  143. PEER. PEER Strong Motion Database; University of California at Berkeley: Berkeley, CA, USA, 2010. [Google Scholar]
  144. Wang, C.; Hornauer, S.; Cetiner, B.; Guo, Y.; McKenna, F.; Yu, Q.; Yu, S.X.; Taciroglu, E.; Law, K.H. Building Recognition Using Artificial Intelligence at Large Scale (BRAILS); Zenodo: Genève, Switzerland, 2021. [Google Scholar] [CrossRef]
  145. Rathje, E.M.; Dawson, C.; Padgett, J.E.; Pinelli, J.-P.; Stanzione, D.; Adair, A.; Arduino, P.; Brandenberg, S.J.; Cockerill, T.; Dey, C.; et al. DesignSafe: New Cyberinfrastructure for Natural Hazards Engineering. Nat. Hazards Rev. 2017, 18, 06017001. [Google Scholar] [CrossRef]
  146. Dalbey, K.; Eldred, M.S.; Geraci, G.; Jakeman, J.D.; Maupin, K.A.; Monschke, J.A.; Seidl, D.T.; Swiler, L.P.; Tran, A.; Menhorn, F.; et al. DAKOTA, A Multilevel Parallel Object-Oriented Framework for Design Optimization, Parameter Estimation, Sensitivity Analysis, and Uncertainty Quantification Acknowledgment; U.S. Department of Energy: Washington, DC, USA, 2021; p. 354.
  147. Zsarnóczay, A.; Deierlein, G.G. PELICUN—A Computational Framework for Estimating Damage, Loss and Community Resilience. In Proceedings of the 17th World Conference on Earthquake Engineering, Sendai, Japan, 13–18 September 2020; pp. 1–12. [Google Scholar]
  148. FEMA. Seismic Performance Assessment of Buildings, Volume 1—Methodology; FEMA: Washington, DC, USA, 2018; Volume 1, p. 340. [Google Scholar]
  149. Hazus. Hazus–MH 2.1: Technical Manual; Federal Emergency Management Agency: Washington, DC, USA, 2012; p. 718. [Google Scholar]
  150. McKenna, F.; Zsarnoczay, A.; Gardner, M.; Elhaddad, W.; Yi, S.; Satish, A.B. NHERI-SimCenter/quoFEM: Version 2.4.0; SimCenter: Kariya, Japan, 2021. [Google Scholar]
  151. Zhu, M.; McKenna, F.; Scott, M.H. OpenSeesPy: Python library for the OpenSees finite element framework. Softwarex 2018, 7, 6–11. [Google Scholar] [CrossRef]
  152. McKenna, F.; Elhaddad, W.; Gardner, M.; Wang, A.Z.C.; Gavrilovic, S.; Chen, L. NHERI-SimCenter/EE-UQ: Release 2.2.0; SimCenter: Kariya, Japan, 2020. [Google Scholar]
  153. McKenna, F.; Mackenzie-Helnwein, P.; Elhaddad, W.; Gardner, M.; Wan, J.; Kwon, D.K. NHERI-SimCenter/WE-UQ: Version 2.0.0; SimCenter: Kariya, Japan, 2019. [Google Scholar]
  154. Harish, A.B.; McKenna, F. NHERI-SimCenter/HydroUQ: Version 1.0.0; SimCenter: Kariya, Japan, 2021. [Google Scholar]
  155. McKenna, C.P.F.; Gavrilovic, S.; Zsarnóczay, A.; Zhong, K.; Elhaddad, W.; Zou, J. Regional Resilience Determination Tool; SimCenter: Kariya, Japan, 2021. [Google Scholar]
  156. Nakamura, Y.; Okada, K. Review on seismic isolation and response control methods of buildings in Japan. Geoenviron. Disasters 2019, 6, 7. [Google Scholar] [CrossRef]
  157. Bhatt, G.; Paul, D.K.; Bhowmick, S. Design of Base Isolation System for Buildings. In Design and Optimization of Mechanical Engineering Products; IGI Global: Hershey, PA, USA, 2018; pp. 67–82. [Google Scholar] [CrossRef]
  158. Warn, G.P.; Ryan, K.L. A Review of Seismic Isolation for Buildings: Historical Development and Research Needs. Buildings 2012, 2, 300–325. [Google Scholar] [CrossRef]
  159. Scott, L. The 10 Largest Base-Isolated Buildings in the World. Engineering News Record, 17 July 2017. [Google Scholar]
  160. Kim, Y.; Shahriyer, H.; Hu, J. Seismic Performance Evaluation According to HSS and CFST Columns of 3D Frame Buildings with Rubber Friction Bearing (RFB). Materials 2022, 15, 1281. [Google Scholar] [CrossRef]
  161. Etedali, S.; Hasankhoie, K.; Sohrabi, M.R. Seismic responses and energy dissipation of pure-friction and resilient-friction base-isolated structures: A parametric study. J. Build. Eng. 2020, 29, 101194. [Google Scholar] [CrossRef]
  162. FlatSliderBearingFig01.png. 2013. Available online: https://opensees.berkeley.edu/wiki/index.php/File:FlatSliderBearingFig01.png (accessed on 26 April 2023).
  163. Egbelakin, T.; Ogunmakinde, O.E.; Omotayo, T.; Sojobi, A. Demystifying the Barriers and Motivators for the Adoption of Base Isolation Systems in New Zealand. Buildings 2022, 12, 522. [Google Scholar] [CrossRef]
  164. Rahgozar, A.; Estekanchi, H.E.; Mirfarhadi, S.A. On optimal triple friction pendulum base-isolation design for steel moment-frame buildings employing value-based seismic design methodology. J. Build. Eng. 2023, 63, 105494. [Google Scholar] [CrossRef]
  165. Mazza, F.; Mazza, M. Influence of Elastomeric Bearings in Tension on the Seismic Performance of Base-Isolated r.c. Buildings. Appl. Sci. 2020, 11, 82. [Google Scholar] [CrossRef]
  166. Chalhoub, M.S.; Kelly, J.M. Effect of bulk compressibility on the stiffness of cylindrical base isolation bearings. Int. J. Solids Struct. 1990, 26, 743–760. [Google Scholar] [CrossRef]
  167. Constantinou, M.C.; Kartoum, A.; Kelly, J.M. Analysis of compression of hollow circular elastomeric bearings. Eng. Struct. 1992, 14, 103–111. [Google Scholar] [CrossRef]
  168. Kelly, J.M. Earthquake-Resistant Design with Rubber; Springer: Berlin/Heidelberg, Germany, 1993. [Google Scholar] [CrossRef]
  169. Buckle, I.; Nagarajaiah, S.; Ferrell, K. Stability of Elastomeric Isolation Bearings. Structures 2001, 109, 1–12. [Google Scholar] [CrossRef]
  170. Civil Engineering Research Foundation. Evaluation Findings for Skellerup Base Isolation Elastromeric Bearings; American Society of Civil Engineers: Reston, VA, USA, 1998. [Google Scholar]
  171. Kelly, J.M. Dynamic and Failure Characteristics of Bridgestone Isolation Bearings; University of California: Riverside, CA, USA, 1991; p. 93. [Google Scholar]
  172. Kumar, M.; Whittaker, A.S.; Constantinou, M.C. Verification and Validation of Models of Elastomeric Seismic Isolation Bear-ings. In Proceedings of the Conference 2015 SMiRT-23, Manchester, UK, 10–14 August 2015; p. 11. [Google Scholar]
  173. Kikuchi, M.; Aiken, I.D.; Kasalanati, A. Simulation analysis for the ultimate behavior of full-scale lead-rubber seismic isolation bearings. In Proceedings of the 15th World Conference on Earthquake Engineering, Lisbon, Portugal, 24–28 September 2012. [Google Scholar]
  174. Schellenberg, A. Modelling Seismic Isolation and Viscous Damping. OpenSees; University of California: Berkeley, CA, USA, 2014. [Google Scholar]
  175. Nakamura, Y.; Hanzawa, T.; Nomura, T.; Takada, T. Performance-Based Placement of Manufactured Viscoelastic Dampers for Design Response Spectrum. Front. Built Environ. 2016, 2, 10. [Google Scholar] [CrossRef]
  176. Kelly, J.M.; Leitmann, G.; Soldatos, A.G. Robust control of base-isolated structures under earthquake excitation. J. Optim. Theory Appl. 1987, 53, 159–180. [Google Scholar] [CrossRef]
Figure 1. SEAOC Vision 2000 [3] recommended seismic performance objectives for buildings.
Buildings 13 01413 g001
Figure 2. Analysis stages of PEER–PBEE methodology [4].
Buildings 13 01413 g002
Figure 5. Performance assessment workflow supported by Pelicun [147].
Buildings 13 01413 g005
Figure 6. The main components of the PELICUN framework [147].
Buildings 13 01413 g006
Figure 7. The four models and their logical relationships in the PELICUN framework [147].
Buildings 13 01413 g007
Figure 8. Traditional finite-element model for a bearing element: (a) model components; and (b) degrees of freedom [160].
Buildings 13 01413 g008
Figure 9. Examples of friction-based isolators [162].
Buildings 13 01413 g009
Figure 10. Triple friction pendulum bearing (TFB) element: (a) three-dimensional view; (b) basic parameters in a section view; and (c) normalized backbone curve [163].
Buildings 13 01413 g010
Figure 11. View of elastomeric bearings: (a) low-damping or high-damping rubber bearing; and (b) lead-rubber bearing [163].
Buildings 13 01413 g011
Figure 12. Bilinear horizontal force–displacement characterization of lead–rubber isolation bearings [158].
Buildings 13 01413 g012
Figure 13. Examples of models for simulating elastomeric bearings in OpenSees [174].
Buildings 13 01413 g013
Figure 14. Sample models for simulating elastomeric bearings in OpenSees [174].
Buildings 13 01413 g014
Figure 15. Types of response control dampers: (a) steel hysteretic damper using low-yield-strength steel; (b) viscoelastic damper using high-damping rubber; and (c) viscous fluid damper [156].
Buildings 13 01413 g015
Figure 16. User-interface to define isolation systems: (a) material definitions; (b) friction models; and (c) isolator bearings.
Buildings 13 01413 g016aBuildings 13 01413 g016b
Figure 17. Assigning an isolator to the MDOF system.
Buildings 13 01413 g017
Figure 18. Outputs of IDA: (a) probability of decision variables; and (b) values’ variations at different IMs.
Buildings 13 01413 g018
Figure 19. Probabilistic EDPs results: (a) peak floor acceleration (PFA) for the top floor; and (b) total maximum displacement (DTM) for the isolation system.
Buildings 13 01413 g019
Figure 20. The mean values of non-structural acceleration-sensitive damage states for different earthquake intensities.
Buildings 13 01413 g020
Table 1. The parameters of the MDOF system [176].
StoryMass (kg)Stiffness (kN/m)ModePeriod of Vibration (s)
5589719,05960.05
4589724,95450.06
3589728,62140.07
2589729,09330.12
1589733,33220.31
IS *680023212.50
Note: * I.S. indicates the isolation system.
Table 2. Properties of selected earthquake records.
LabelYearStation NameMagnitudeDistance to Fault (km)Ia (m/s)Vs30 (m/s)
EQ11979Brawley Airport6.5310.420.4208.71
EQ2EC County Center FF7.310.8192.05
EQ3El Centro Array #108.60.7202.85
EQ4El Centro Array #47.051.4208.91
EQ5El Centro Array #53.951.7205.63
EQ6El Centro Array #70.561.7210.51
EQ7El Centro Differential Array5.092.1202.26
EQ8Holtville Post Office7.50.9202.89
EQ91989Saratoga—W Valley Coll6.939.311.3347.9
EQ101995Amagasaki6.911.342256
Note: Ia is the Areas intensity, and Vs30 refers to the average shear wave velocity for the top 30 m of the soil.
Table 3. A summary of EDP probabilistic values according to uncertainties at IM = 1.00.
EDPModel LabelμσCVMin.10th P.50th P.90th P.Max.
PFAA-FixedBase0.97250.26893.61630.38160.67160.93731.30142.5476
B-NRB-SI0.51460.10105.09490.25700.39360.50490.64830.9959
C-NRB-VFD-SI0.51460.10055.11920.26670.39430.50570.64720.9576
PIDA-FixedBase0.06490.01733.75260.02600.04500.06270.08750.1590
B-NRB-SI0.00030.00012.67010.00010.00020.00020.00040.0010
C-NRB-VFD-SI0.00180.00044.38190.00090.00130.00180.00240.0038
PRDA-FixedBase0.03940.01522.60050.00880.02320.03690.05830.1484
B-NRB-SI0.00010.00012.49480.00000.00010.00010.00020.0006
C-NRB-VFD-SI0.00070.00022.95800.00020.00040.00060.00090.0021
DTMB-NRB-SI0.18850.05423.47930.10600.11850.18270.25240.2626
C-NRB-VFD-SI0.18040.05183.48200.10150.11580.17380.24500.2539
PDFC-NRB-VFD-SI183.3032.555.63129.14139.56179.70228.62244.24
Note: μ is the mean value, σ is the standard deviation, CV is the coefficient of variation, and Kth P. is the percentile.
Table 4. Decision variables of the A-FixedBase model in different IMs.
Decision
Variables
IM = 1IM = 3IM = 5
Min.μMax.Min.μMax.Min.μMax.
Collapsed00.00390.965100.01821.008700.01221.0524
DS S0.95182.70983.86041.63213.52514.03491.26803.35804.2095
DS NSA00.01202.348500.72753.474100.58743.4248
DS NSD0.41832.78433.86041.45663.56574.03491.32013.42284.2095
Repair time7.585887.4571930.218.692171.312017.459.2857141.3432104.73
Repair cost−7.8107335.75965.0980.536586.591008.7378.2160508.5001052.36
Injuries-10.01690.579723.1620.03581.574924.20950.02151.179125.2567
Injuries-20.00140.112611.5810.00370.388812.10470.00160.270312.6284
Injuries-300.00591.737200.02451.815700.01531.8943
Injuries-400.00942.895300.03923.026200.02433.1571
Table 5. Decision variables of the three models at IM = 5.0.
Decision
Variables
A-FixedBaseB-NRB-SIC-NRB-VFD-SI
Min.μMax.Min.μMax.Min.μMax.
Collapsed00.01221.0524000000
DS S1.26803.35804.209500.00040.342400.05081.3508
DS NSA00.58743.424800.26992.695500.26722.6813
DS NSD1.32013.42284.209500.00020.342400.03321.3164
Repair time9.2857141.3432104.7300.00070.684800.133711.6037
Repair cost78.2160508.5001052.3603.0152108.15303.4213119.396
Injuries-10.02151.179125.2567000.003500.00100.0596
Injuries-20.00160.270312.628400000.00000.0062
Injuries-300.01531.8943000000
Injuries-400.02433.1571000000
Disclaimer/Publisher’s Note: The statements, opinions and data contained in all publications are solely those of the individual author(s) and contributor(s) and not of MDPI and/or the editor(s). MDPI and/or the editor(s) disclaim responsibility for any injury to people or property resulting from any ideas, methods, instructions or products referred to in the content.