Abstract
Prestressed rebars are usually used to apply vertical prestress to concrete to prevent web cracking. The reduction of working stress will affect the durability of the structure. However, the existing working stress detection methods for prestressed rebars still need to be improved. To monitor the working stress of rebars, a magnetic resonance sensor was introduced to carry out experimental research. The correlation between rebar stress and the sensor’s induced voltage was theoretically analyzed using the magnetoelastic effect and magnetic resonance theory. A working stress monitoring method for prestressed rebars based on magnetic resonance was proposed. Working stress monitoring experiments were carried out for 16 mm, 18 mm, and 20 mm diameter rebars. The results showed that the induced voltage peak-to-peak value and the rebar prestress were nonlinearly correlated under different working conditions. Correlations between the characteristic indicators and the rebar working stress were obtained using nonlinear and linear fit. The cubic polynomial segmented fit outperformed the gradient overall linear fit, with the goodness of fit R2 greater than 0.96. The average relative error values of working stress monitoring were less than 5% under different working conditions. This provides a new method for working stress measurement of vertical prestressed rebars.
1. Introduction
The prestressed concrete bridge is widely used in bridge construction because of its advantages of sizeable structural stiffness, smooth driving, and low maintenance cost [1]. Vertical prestressed rebar is used to provide vertical compressive stress to the reinforcement by post-tensioned method. The effect of vertical prestressed rebar can make the shear load capacity of the structure significantly increase by 95% [2]. However, the elongation of vertical prestressed rebar is slight during vertical prestressing tensioning in construction. Therefore, the prestress loss caused by rebar retraction is significant [3]. Furthermore, the loss of vertical prestress has an important influence on the principal tensile stress of the box girder web [4]. Once the vertical prestress is lost and the web cracks, the bridge structure’s safety and durability will be affected [5,6,7]. Therefore, the vertical prestressed rebar working stress must be accurately monitored to ensure the structure’s safety.
To avoid prestress detection affecting the structure’s durability, nondestructive testing methods are usually used [8]. Commonly used methods are the strain method, electromagnetic resonance method, the stiffness method, the ultrasonic guided wave method, the eddy current method, and the magnetoelastic method. The strain method is based on the stress–strain relationship. The test is carried out by pasting electronic strain gauges or embedded sensors, and then converting the stress. Sawicki [9] successfully identified the stress of rebars by using strain gauges installed on rebars and distributed optical fiber sensors for strain detection. However, this method is susceptible to temperature and has low durability. The electromagnetic resonance method connects the steel strand analog inductor to the oscillation circuit and calculates the stress by measuring the oscillation frequency of the circuit with a frequency meter. Cui [10] measured the stress of prestressed concrete beams by the electromagnetic resonance method and obtained the functional relationship between resonance frequency increment and stress increment. However, rebars cannot simulate the inductance due to their different configurations, so this method is unsuitable for rebar stress monitoring. The stiffness method measures the frequency of the anchorage zone of the exposed section of the rebar and then infers the magnitude of the prestress [11]. Zhong has conducted much research on the measurement of rebar tension by the stiffness method and achieved specific results [12,13]. However, this method is susceptible to boundary conditions and is only suitable for stress measurement during construction [14]. The ultrasonic guided wave method measures stress by the acoustoelastic effect. Chen [15] used single-source high-frequency cylindrical guided waves to improve the accuracy of the ultrasonic guided wave method. The ultrasonic guided wave method has a rapid energy attenuation rate due to the bonding between rebar and concrete, so the method’s reliability needs to be improved. It can be seen that the existing methods are not suitable for rebar stress monitoring, or the detection accuracy needs to be further improved. Therefore, the monitoring of working stress of rebar still needs further study.
The magnetoelastic effect indicates that the magnetism of ferromagnetic material changes with its stress. Based on the magnetoelastic effect, scholars have conducted much research and proposed the eddy current and magnetoelastic methods. The eddy current method realizes stress monitoring through the relationship between sensor impedance and stress [16]. To improve the eddy current sensor’s performance, Xiu [17] designed a sleeve structure to reduce the loss of magnetic field and provide a higher permeability path. Alonso [18] used an eddy current sleeve structure and phase shift measurements to detect the stress in iron-based materials. Liang [19] found that the magnetoelastic method is more suitable for stress monitoring than the eddy current method.
The magnetoelastic method uses the magnetoelastic effect to monitor the change of magnetization intensity to obtain the magnitude of stress. Due to its advantages of noncontact, high sensitivity, and robustness, the method is considered a promising nondestructive stress monitoring method [20]. According to their different structural forms, magnetoelastic sensors can be divided into U-type sensors, permanent magnet magnetization sensors, and sleeve sensors. Joh [21] designed a U-shaped sensor to measure the magnitude of prestress. Deng [22] used the static magnetization of the permanent magnet to replace the magnetization of the coil. However, the U-shaped sensor and the permanent magnet magnetization sensor are unsuitable for monitoring vertical prestress due to the irregular excitation structure and large size. The sleeve magnetoelastic sensor uses the coil as the excitation element and the sensing element. The monitoring object is used as the coil core. This method has the advantages of a clear magnetic circuit and less magnetic field leakage [23]. To optimize the sleeve sensor, Duan [24] proposed an intelligent elastomagnetic (EME) sensor by replacing the secondary coil with a laminated composite magnetic sensor. Due to its large size and high functional requirements, the sensor is mainly used for cable force detection. Zhang [25] simplified the primary coil and induction unit of the EM sensor into self-inductive coils, then proposed a magnetoelastic inductance method using weak magnetic excitation. The magnetoelastic inductance method has the advantages of reducing the sensor size and reducing the power supply demand. However, the low sensitivity of this method affects the accuracy of stress monitoring. Therefore, the sensor needs to be optimized.
Kurs [26] first proposed the magnetic resonance theory, which improves the transmission efficiency of the coil-based energy transmission system. To improve the working performance of the sensor, magnetic resonance theory is introduced into the sensor field. Hughes [27] studied the enhancement effect of resonant coupling on eddy current sensors and improved the sensitivity of corrosion damage detection. The magnetoelastic sensor is also composed of the coil as the main component. To improve the sensor’s sensitivity, Zhang [28] introduced the magnetic resonance theory into the magnetoelastic effect method. He proposed the resonance enhanced magnetoelastic method (REME) and verified the feasibility of this method for monitoring the stress of steel strands. However, as a hot-rolled low-carbon steel structure, the rebar’s section form, initial magnetization state, and stress–strain relationship differ from those of the steel strand, resulting in different stress identification. In addition, the advantage of small size of the magnetic resonance sensor meets the pre-embedded requirement of vertical prestressed rebar and can be applied in post-tensioned pipeline [29]. Therefore, monitoring the working stress of the rebar by REME needs further study.
Based on the existing research, this paper combined the magnetoelastic effect, electromagnetic induction law, and magnetic resonance effect. A working stress monitoring method for vertical prestressed rebar was proposed using the magnetic resonance sensor. Firstly, the relationship between sensor induced voltage and rebar stress was analyzed. Then, working stress monitoring experiments under different working conditions were carried out on rebars with different diameters. According to the experiment results, the nonlinear relationship between the induced voltage peak-to-peak values and the prestress was analyzed. Based on the experiment data, the correlation between the characteristic indicator and the rebar working stress was obtained by nonlinear fit and linear fit. According to the relationship, the working stress was accurately evaluated, and the feasibility of the proposed method was verified.
2. Theory
According to the Joule effect and the magnetization theory of ferromagnetic material, there is a functional relationship between the stress of rebar and the change in magnetic permeability [30,31]. In Equation (1), μ is the permeability of rebar, μ0 is the vacuum permeability, λs is the axial deformation constant, Ms is the saturation magnetization, Ku is the uniaxial magnetic anisotropy constant, HR is the excitation magnetic field, and θ0 is the angle between the magnetic field and the easy magnetization axis [32].
A magnetic resonance sensor [28] was used to monitor the working stress of the rebar. The sensor’s two coils are the excitation and induction coils. The coil is wound on the PVC skeleton, as shown in Figure 1. The equivalent circuit diagram [28] of the magnetic resonance sensor is shown in Figure 1. LT and LR are the inductance of the excitation coil and induction coil, respectively. CT and CR are the excitation and induction coil’s compensation capacitors, respectively. uCT and uCR are the voltage of the compensation capacitor of the excitation coil and the induction coil. RT and RR are the internal resistance of the excitation coil and the induction coil, respectively. The voltage source is AC power, and the input voltage is uin. The millivoltmeter is regarded as a load connected in series with an induction coil, and its equivalent resistance is RL.
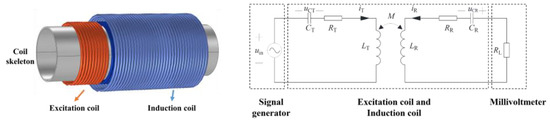
Figure 1.
The magnetic resonance sensor and equivalent circuit diagram schematic.
According to Kirchhoff’s voltage law [33], the self-impedance of the excitation coil and the induction coil is ZT and ZR, respectively, as shown in Equations (2) and (3). The loop current IR of the induction coil is shown in Equation (4), where j is the imaginary part of the complex number, Uin is the effective value of uin, ω is the angular frequency of uin, and M is the mutual inductance between the excitation coil and the induction coil. According to the coupled mode equation of LC coupled circuit [34], the relationship between coupling coefficient κ and mutual inductance M can be expressed as Equation (5); ω0 is the resonant frequency.
A rebar with a cross-sectional area of Airon is placed in a magnetic resonance sensor. Aair is the cross-sectional area of the nonmagnetic material between the coil and the rebar. The voltage source provides alternating current for the excitation coil. Under the action of alternating current, the excitation coil generates an excitation magnetic field [35,36]. The excitation coil and the induction coil are resonantly coupled. An excitation magnetic field of the magnetized rebar is generated in the induction coil. The magnetic field is expressed as HR, which has a functional relationship with the coupling coefficient κ, as shown in Equation (6). NR is the number of turns of the induction coil. lR is the effective magnetic circuit length of the induction coil. According to electromagnetic induction law, the induced voltage of the induction coil can be obtained by the magnetic flux in the area around the coil [37], as shown in Equation (7), where Φ is the magnetic flux around the area of the induction coil, and t is the time.
Combined with the electric power calculation formula, the excitation coil’s input power Pin and the millivoltmeter’s output power Po as the load can be calculated, respectively. The results are shown in Equations (8) and (9). The transmission efficiency can be obtained as shown in Equation (10). XT = ωLT−1/ωCT, XT = ωLR−1/ωCR.
When the induction coil resonates, XR = 0, the transmission efficiency reaches the maximum, and the measured induced voltage is the highest. In the working stress monitoring experiment, the rebar is used as the core of the induction coil. The change of permeability of rebar caused by working stress also causes the induction coil’s inductance change. After the inductance changes, the resonant frequency of the induction coil changes, as shown in Equation (11). When the resonant frequency of the induction coil deviates from the initial resonant frequency, the coil coupling coefficient κ and the sensor induced voltage are significantly reduced, thereby improving the sensitivity of the rebar working stress monitoring.
The above relationship is solved simultaneously to explore the internal relationship among stress, magnetism, and electricity. The change in stress will lead to the change of permeability of the rebar. The relationship between induced voltage and permeability can be simplified from Equations (7)–(12), where f(uCR) is the function of induced voltage uCR representing permeability μ. The induced voltage uCR is related to the coupling coefficient κ. For a specific rebar and sensor, the relationship between the sensor’s induced voltage and the rebar’s working stress can be expressed as Equation (13); g(uCR) is the function of the induced voltage uCR representing the working stress σ.
Through the above derivation, it can be found that the rebar working stress is related to the sensor’s induced voltage. Therefore, the induced voltage of the magnetic resonance sensor can be used to evaluate the working stress of the rebar. To verify the feasibility of the magnetic resonance monitoring method (REME) for rebar working stress monitoring, rebar working stress monitoring experiments were carried out.
3. Experiment Design
Vertical prestressed tendons generally use rebar. To explore the relationship between rebar stress and sensor induced voltage, this paper uses the magnetic resonance sensor to carry out working stress monitoring experiments on rebar under different working conditions.
3.1. Experiment Equipment
A rebar working stress monitoring system was built to carry out the experiment, as shown in Figure 2. The experiment system comprised a universal testing machine, magnetic resonance sensor, signal generator, power amplifier, millivoltmeter, and computer. The maximum tensioning load of the universal testing machine is 100 tons. The universal testing machine was used to tension the rebar to different stress levels. In this experiment, a magnetic resonance sensor was used for working stress monitoring. The signal type for data analysis was induced voltage. The induced voltage peak-to-peak value was chosen as the electrical characteristic value characterizing the variation of the magnetic properties of the rebar with stress. The signal generator was connected to the excitation coil. The millivoltmeter was considered as a resistor connected to the induction coil. The signal generator generated an alternating excitation signal as a sine wave. The power amplifier was used to amplify the excitation signal power. The effective value of the induced voltage was measured by the millivoltmeter during the experiment. The value was transmitted and saved in the computer for further processing.
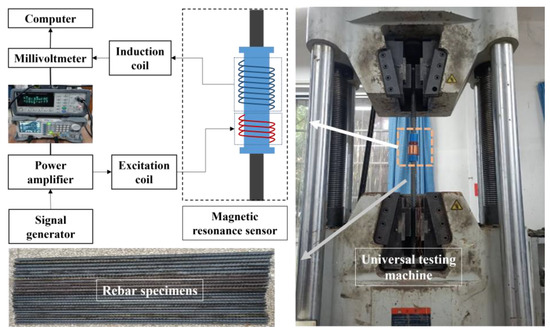
Figure 2.
Rebar working stress monitoring system.
3.2. Sensor and Specimen Preparation
A PVC tube with an outer diameter of 40 mm was used as the magnetic resonance sensor skeleton. The excitation and induction coil were wound with 0.25 mm-diameter enameled wire. The total number of turns of the excitation coil was 40 turns, and 1 layer was wound. The total number of turns of the induction coil was 1400 turns, and 10 layers were wound. The yield strength of HRB400 rebar is 400 MPa. HRB400 rebar is widely used in engineering projects. Rebar is a common ferromagnetic material with magnetoelastic effect [38,39]. The length of the sensor was 80 mm. The specimens were made of rebars with the yield strength of 400 MPa. To verify the applicability of the working stress monitoring method to different diameters of rebars, the specimens’ diameters were made of 16 mm, 18 mm, and 20 mm. In actual engineering, the working stress of the rebar is lower than the yield strength. Therefore, the maximum design stresses are 50%, 70%, and 90% of the yield strength, respectively. There were 6 specimens of each diameter and a total of 18 specimens. The specimens were divided into three groups according to their diameter. Each rebar diameter yielded at 89 kN, 109 kN, and 155 kN in tension, respectively. The specimens were numbered as shown in Table 1, with D being the diameter of the rebar and P being the maximum stress-to-yield strength ratio. To ensure the reproducibility of the experiment results, two specimens with the same stress conditions were set up, numbered T1 and T2.

Table 1.
Specimen number and loading procedure.
3.3. Loading Procedure
In the experiment, the magnetic resonance sensor was fixed in the middle of the rebar to avoid the magnetic field’s influence at the rebar’s end. The universal testing machine stretched the specimens. Loading and unloading were carried out with 3 kN as the starting and ending points to avoid instrument errors. The working stress of rebar does not reach its yield strength. Therefore, to ensure that no plastic deformation of the rebar occurs, the maximum stress levels were designed to be 50%, 70%, and 90% of the yield strength, and the step size was 10% of the yield strength. In practical engineering, the prestressed rebar will be initially tensioned to reduce the prestress loss. Therefore, the experiment was conducted with pretreatment of the rebars to simulate the initial tensioning during the construction phase. Then, the specimens were loaded and unloaded using the universal testing machine. The loading stage simulated the prestress application during the construction phase. The unloading stage was used to simulate the working stress during the operation phase. The loading and unloading speeds were both 0.2 kN/s.
During the experiment, the excitation coil was excited with the initial resonant frequency of the induction coil (with rebar inside). Then, the induction coil resonated with the excitation coil. The excitation frequency and excitation voltage of each specimen are shown in Table 1. It can be seen that different diameters of rebars’ excitation frequency and excitation voltage had some differences, but those of the same diameter were more stable. To ensure adequate deformation of the rebar and stability of the loading and test systems, the load was held for 30 s after each loading to the specified tension (each tension level). After the induced voltage was stabilized, the induced voltage peak-to-peak value of the induction coil was measured. The peak-to-peak induction voltage (Vpp) was repeated seven times, and the average value was taken to reduce the measurement error.
4. Experimental Results and Discussion
To study the relationship between the induced voltage peak-to-peak value and working stress, the loading and unloading experiment results with the maximum design stress of rebars with diameters of 16 mm, 18 mm, and 20 mm being 50%, 70%, and 90% of yield strength, respectively, were analyzed.
4.1. The Evolution Law of Induced Voltage with Working Stress
Due to the different diameters of the specimens, the tensile force during the data analysis was converted into stress to facilitate the control variable. To compare different groups of rebars with the same stress level, the stress to yield strength ratio was taken as the abscissa and expressed by Tp. Considering the different initial magnetization states of different specimens, their initial induced voltage peak-to-peak values after pretreatment were different. Therefore, the starting point of each group of data was excluded from the initial value, and the increment of induced voltage peak-to-peak value (ΔVpp) was used as an indicator. As shown in Figure 3, ΔVpp and rebar working stress are nonlinearly correlated. According to the magnetoelastic effect, the magnetization strength of the rebar changes when the stress changes. During the elastic stage, the force-induced magnetization is theoretically reversible. Therefore, during the unloading stage, the elastic strain recovery makes the reversible magnetization intensity recover. However, as shown in Figure 3, the induced voltage peaks did not fully recover when the rebar was unloaded to its starting value. This was because the plastic deformation generated by the rebar fabrication was not completely eliminated in the pretreatment stage. The magnetic domain structure was irreversibly rotated during loading, which resulted in irreversible magnetization.
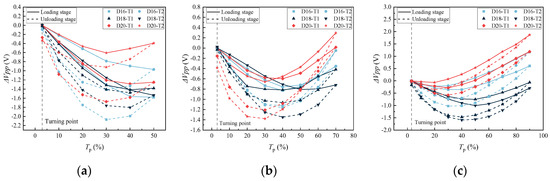
Figure 3.
The ΔVpp for each stress level measured during loading and unloading: (a) design stress level of P50; (b) design stress level of P70; (c) design stress level of P90.
The corresponding ΔVpp-Tp curves were similar for each specimen. Therefore, the design stress range of 90% yield strength in each group of specimens was selected for further analysis. As shown in Figure 4, the relationship of the ΔVpp-σ was similar for the same stressing process for different rebars. During the loading stage, the ΔVpp decreased and then increased with the increase of working stress. During the unloading stage, the ΔVpp decreased and then increased with the decrease of working stress. The corresponding ΔVpp-σ curves in the loading and unloading stages were different. The same stress level in loading and unloading corresponded to two different ΔVpp. This was due to the hysteresis of the rebar as a ferromagnetic material after loading and unloading [40].
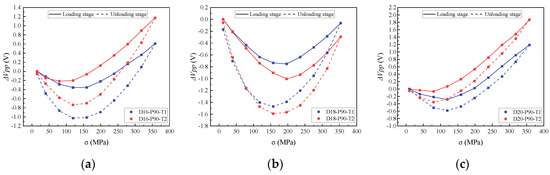
Figure 4.
The ΔVpp corresponding to the design stress condition of P90 in the loading and unloading stages: (a) Group 1; (b) Group 2; (c) Group 3.
The working stress loss stage corresponded to the unloading stage. Further analysis of the unloading stage was performed. The maximum stress level was taken as the starting point for comparison purposes. The starting point of each specimen was removed from the initial value. The increment of induced voltage peak-to-peak (ΔVpp) was used to characterize the working stress of the rebar, as shown in Figure 5.
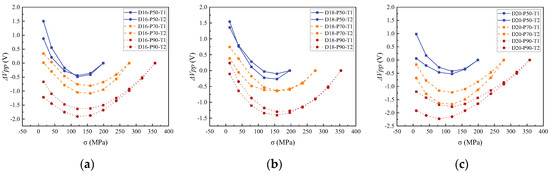
Figure 5.
Comparison of the same stress level of the ΔVpp under three design stress conditions for each group of specimens: (a) Group 1; (b) Group 2; (c) Group 3.
There was a similar relationship between the ΔVpp and working stress for rebars with different diameters. For specimens with the same diameter, due to the different composition and processing technology of different rebars, the force-induced magnetization law of rebars was different. Therefore, the reversible magnetization of each specimen was different, which made the ΔVpp of different rebars different under the same working stress level. However, under different working conditions, the ΔVpp-σ curve was similar. In the unloading stage, the ΔVpp decreased first and then increased with the decrease of working stress. From the perspective of magnetic domain theory, it can be seen that the working stress had a more substantial influence on magnetization than the excitation magnetic field at a greater working stress level. Therefore, magnetization would increase with the increase of stress at a greater stress level [41].
Comparing Figure 5a–c, it can be seen that under the same working stress level, the greater the design stress of different rebars in the same group, the lower the ΔVpp corresponding to the specimen. This was because when the design stress increased, the elastic strain generated by the rebar during the prestressing process increased, reducing the rebar’s effective area. In addition, the more extensive range increased the magnetization range of the rebar. Therefore, in the unloading stage, the rebar simulated the working stress loss; when the working stress was lost to the same stress level, the ΔVpp measured by the specimen with high design stress was less. For each group of specimens, the turning point of the ΔVpp-σ curve was different, but it was concentrated at 135 ± 25 MPa. For the same group, the distribution of turning points was more concentrated. For example, the turning point of Group 2 was 157.19 MPa. In the same design stress of the same group, except for D20-P90-T1 and D20-P90-T2, the turning point of the ΔVpp-σ curve of other repetitive tests was the same stress level.
From the above analysis, it can be seen that the induced voltage peak-to-peak value was nonlinearly related to working stress. Therefore, to evaluate the working stress of prestressed rebar using the induced voltage peak-to-peak value, the mapping relationships between characteristic indicators and working stress were established by nonlinear fit and linear fit.
4.2. Characteristic Indicators for the Evaluation of Working Stress
4.2.1. Relationship between Working Stress and the ΔVpp
Due to the measurement under different working conditions, the changing trend between the stress of prestressed rebar and the ΔVpp was basically the same. Therefore, a representative ΔVpp-σ curve was selected from three diameters for further analysis. Because the design stress of 90% yield strength included the stress process of 50% and 70% yield strength design conditions, this paper selected specimens D16-P90-T1, D18-P90-T1, and D20-P90-T1 for discussion. In working stress monitoring, the working stress was unknown and needed to be evaluated based on the measured ΔVpp. Therefore, the ΔVpp was used as the abscissa and the stress converted by tension was used as the ordinate, which was recorded as Method 1. The σ-ΔVpp curves of D16-P90-T1, D18-P90-T1, and D20-P90-T1 are shown in Figure 6.
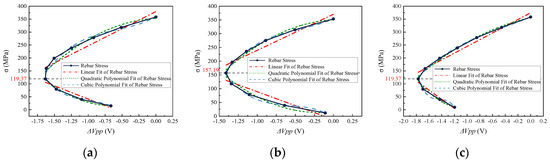
Figure 6.
The ΔVpp-σ curves and fitted curves of three specimens: (a) D16-P90-T1; (b) D18-P90-T1; (c) D20-P90-T1.
As shown in Figure 6, during the unloading stage, the ΔVpp decreased first and then increased with the decrease of rebar working stress. Therefore, when the increase of the ΔVpp was observed, it could be considered that the working stress of the rebar had dropped to a low stress level relative to the design prestress. However, all three specimens had a ΔVpp corresponding to two different rebar prestress levels, and the mapping relationship between the ΔVpp and working stress could not be established. Therefore, the corresponding relationship between working stress and the ΔVpp variation under each stress level was discussed in sections.
The whole unloading stage bounded by the turning point can be divided into two sections: the high stress section and low stress section. Since the importance of the two sections was the same, it was necessary to evaluate the fit effect as a whole. The Taylor expansion of Equation (13) was carried out, the higher order term after the third order was ignored, and Equation (14) was obtained. The first, second, and third orders of the corresponding relationship between the ΔVpp and rebar working stress were discussed separately, as shown in Equation (15). The turning points of the corresponding curves of each specimen in Figure 6 were 119.37 MPa, 157.19 MPa, and 119.37 MPa, respectively. Taking the turning point as the dividing line, the three specimens were fitted to obtain the corresponding linear, quadratic, and cubic fit curves. Therefore, the goodness of fit (R2) was used to evaluate the fit effect. The R2 of each specimen was calculated based on two segmented data.
The R2 is shown in Figure 7, demonstrating that as the order of fit increased, the R2 approached one. The R2 of cubic polynomial fit was higher than that of quadratic polynomial fit and linear fit, and its R2 reached 0.98 on average. The cubic polynomial R2 of the specimen D20-P90-T2 was as high as 0.99781, which was close to 1. In addition, when the order increased from three to four, there was little room for improvement in the R2. Considered comprehensively, the cubic polynomial was selected for piecewise fit to explore the correlation between working stress and the ΔVpp. To verify the feasibility of using cubic polynomial fit to determine the correlation between ΔVpp and working stress, the ΔVpp data of each specimen were fitted by cubic polynomial, and the R2 was shown as follows.
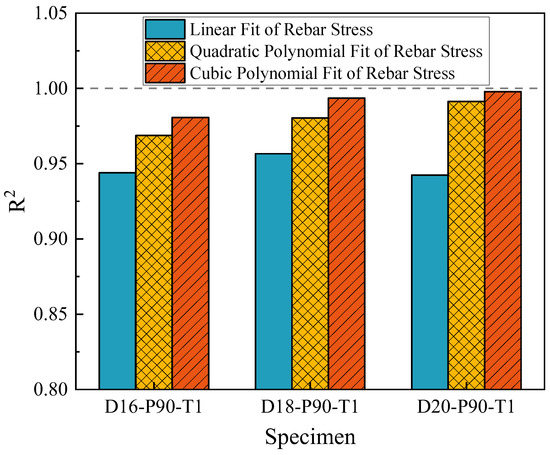
Figure 7.
The goodness of fit R2 of different fit methods of three specimens.
As shown in Figure 8, the R2 of D18-P50-T2 was at least 0.96928. The R2 of each specimen was more significant than 0.96, indicating a high degree of compliance with the cubic polynomial fit of the line between σ-ΔVpp. Therefore, the working stress of the rebar could be determined from the σ-ΔVpp curve.
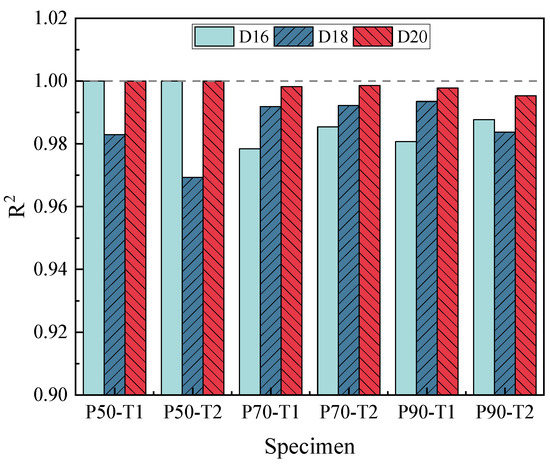
Figure 8.
The cubic polynomial R2 of the relationship between the ΔVpp and working stress change under different working conditions.
4.2.2. Relationship between Working Stress and dΔVpp
As shown in Figure 5, the gradient of the σ-ΔVpp curve (dΔVpp) decreased continuously during the unloading stage. The curves of ΔVpp and working stress for different diameters had similarities. When the working stress decreased gradually, one ΔVpp corresponded to two different stress levels of the rebar. Therefore, in the data analysis, dΔVpp could be chosen as the fit variable to characterize the variation of the magnetic properties of prestressed rebar with working stress, which was recorded as Method 2. D16-P90-T2, D18-P90-T2, and D20-P90-T2 were used as examples.
As shown in Figure 9, the working stress of rebar could be uniquely determined by the dΔVpp. In the unloading stage, the trend between the dΔVpp and the working stress was basically the same. With the decrease of working stress, the dΔVpp decreased gradually and was linearly correlated. Therefore, to clarify the relationship between the two variables, a linear fit was made between the dΔVpp and working stress of the three specimens. The goodness of fit (R2) was used to indicate the linear fit of the specimens. The R2 corresponding to D16-P90-T2, D18-P90-T2, and D20-P90-T2 was 0.97112, 0.97041, and 0.91294, respectively. Therefore, it was preliminarily shown that there was a good linear relationship between the working stress and the dΔVpp curve. The R2 of all specimens was calculated, and the results are shown in Figure 10.
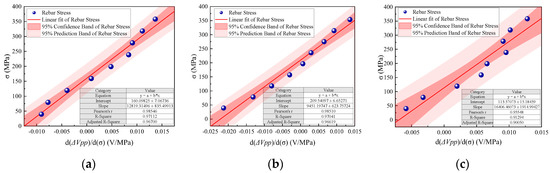
Figure 9.
The overall linear fitting of the relationship between working stress and dΔVpp of three diameter rebars: (a) D16-P90-T2; (b) D18-P90-T2; (c) D20-P90-T2.
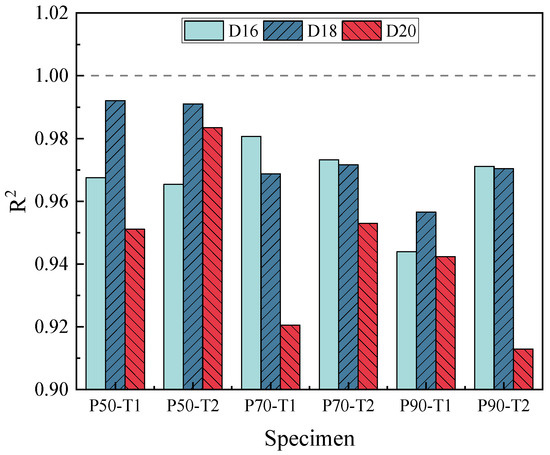
Figure 10.
The overall linear fit R2 of the relationship between working stress and the dΔVpp of each group of specimens.
It can be seen from Figure 10 that the R2 of each specimen was more significant than 0.9, indicating an excellent linear fit between dΔVpp-σ. Therefore, the working stress of rebar could be determined by the linear relationship of dΔVpp-σ. Among them, the minimum R2 was 0.91293 for D20-P90-T2, and the maximum R2 was 0.99208 for D18-P50-T1. The R2 for each of the three diameters was discussed by taking the average values of each specimen. The average values of R2 for Group 1 and Group 2 were similar: 0.96699 and 0.97510, respectively. The average value of the R2 of Group 3 was slightly lower, 0.94390. This was because the relative effective working area of the rebar decreased with increasing diameter due to the skin effect at a high alternating frequency.
4.2.3. Working Stress Monitoring Error Analysis
To propose a more reliable evaluation method for the working stress of vertical prestressed rebar, the errors of Method 1 and Method 2 proposed were compared. The calculation steps can be shown in Figure 11.
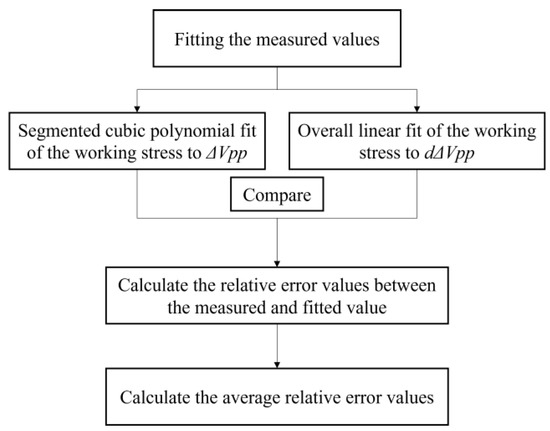
Figure 11.
Calculation flow chart.
For Method 1, the curve fit degree was good; all groups’ R2 were greater than 0.96. This showed that working stress had an excellent functioning relationship with the ΔVpp. The fit relationship was generalized to Equation (16). The measured ΔVpp was substituted into the fit equation. The results were compared with the actual measured working stress. The relative error values of each specimen were calculated as shown in Figure 12.
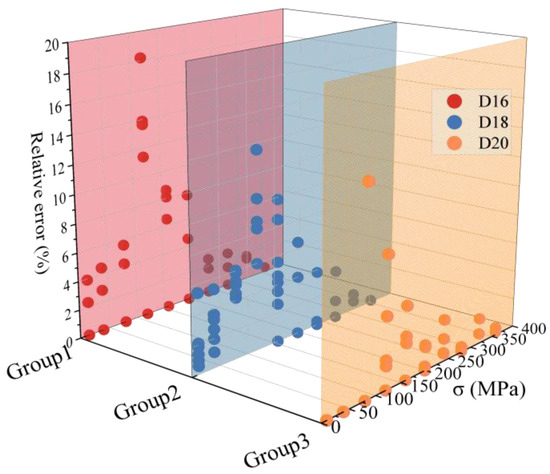
Figure 12.
The relative error values of the fitted and measured values of Method 1.
From the error analysis of the fitted and measured values under the unloading stage, it was found that the relative error values did not exceed 20% under any working conditions. The relative error values were concentrated below 10% in the high stress section. The measured ΔVpp was substituted into the corresponding fit equation under different working conditions. The percentage of relative error at the turning point of D20-P90-T1 was the highest, 18.21%, and the maximum relative error between the fitted and measured value was 21.73 MPa. The high relative errors were concentrated near the turning point. Therefore, increasing the measurement points near the measured turning points during the calibration in the laboratory could significantly reduce the relative error. The relative error values of all specimens were normalized, and the average relative error values with robustness were used for comparative analysis. The maximum average relative error values for Group 1, Group 2, and Group 3 at different stress levels were 3.68%, 4.16%, and 2.79%, respectively. The average relative error values for all specimens were less than 5%, close to the results of the REME method for testing strand stresses [28].
For Method 2, the R2 were greater than 0.90. This showed that working stress has a good linear correlation with the dΔVpp. The measured induced voltage peak-to-peak values were substituted into Method 2. The results were compared with the actual working stress. To ensure the consistency of the dΔVpp loading step, only the prestress levels with a design stress above 20% of the yield strength ratio were analyzed. The results are shown in Figure 13.
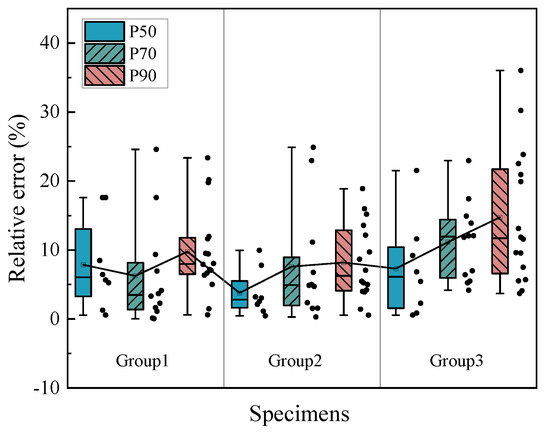
Figure 13.
The relative error values of the fitted and measured values of Method 2.
More than 75% of the test points had relative error values below 20%, and the maximum relative error value was 23.85%. The errors of all specimens were normalized and the average relative error value with robustness was used for comparative analysis. The results are shown in Figure 12. In the error analysis, it was found that the maximum average relative error values of each group were 9.77%, 8.20%, and 14.53%, respectively. Therefore, under any working conditions, the average relative error values were less than 15%, better than the 25% average relative error value of the ultrasonic guided wave method [42]. This result showed that using Method 2 to monitor vertical prestressed rebar’s working stress loss had good reliability. However, the error was greater than that of the traditional magnetoelastic method [22].
In summary, Method 1 could avoid high error by increasing the measurement points near the turning point. Therefore, the Method 1 test error value can be considered as low and could meet engineering needs. Method 2 avoided the uncertainty of the turning point in the laboratory calibration process, but its error was greater than the traditional magnetoelastic method. Therefore, the cubic polynomial segmental fit (Method 1) was selected to establish the mapping relationship between working stress and the ΔVpp. Then, the working stress monitoring method of prestressed rebar based on magnetic resonance was proposed.
5. Conclusions
In this paper, the relationship between the sensor induced voltage and the rebar stress was derived based on the electromagnetic induction law, magnetoelastic effect, and magnetic resonance theory. Working stress monitoring experiments with different design stress levels were carried out for rebars with diameters of 16 cm, 18 cm, and 20 cm. The induced voltage peak-to-peak values under working stress variations were collected with a magnetic resonance sensor. The main conclusions were as follows:
- (1)
- The curves of the working stress and the induced voltage peak-to-peak values at different design stress levels showed nonlinear correlation. Due to the hysteresis effect, the induced voltage peak-to-peak values measured in the loading stage differed from those in the unloading stage. Two characteristic indicators, the ΔVpp and dΔVpp, were proposed for evaluating the working stress. The correlation between the two characteristic indicators and the working stress was analyzed. On this basis, the mapping relationships from the characteristic indicators to the working stress were obtained by nonlinear fitting and linear fitting, respectively.
- (2)
- For the dΔVpp overall linear fit method, the R2 was greater than 0.90. The average relative error values in different design conditions were less than 15%. This method ignored the influence of different turning points caused by external factors, but the measurement accuracy and stability needed further improvement. For the ΔVpp segmented polynomial fit method, the cubic polynomial fit was better than the quadratic polynomial and linear fit. The R2 of the cubic polynomial fit was greater than 0.96, and the relative error values in the high stress section were all concentrated below 10%. The high errors were concentrated near the turning points, and the errors could be reduced by increasing the measurement points near the turning points. The average relative error values in different design conditions were less than 5%.
- (3)
- According to the actual demand, the method of ΔVpp segmented polynomial fit was selected to monitor the working stress of the rebar. The magnetic resonance sensor has the advantages of small power supply, small size, light weight, and high accuracy, which is suitable for the internal monitoring of working stress of rebar. This paper verified the applicability of the induced voltage peak-to-peak value to characterize the rebar working stress.
This paper provided a new method for the working stress monitoring of vertical prestressed rebars.
Author Contributions
J.X.: methodology, validation, investigation, and writing—original draft; S.Z.: term and writing—review and editing; H.L.: validation and investigation; L.L.: software, formal analysis, and data curation; Y.S.: methodology and formal analysis. All authors have read and agreed to the published version of the manuscript.
Funding
This research was funded by the National Natural Science Foundation of China (52278146, 51978111), the Chongqing Natural Science Foundation of China (cstc2022ycjh-bgzxm0086), and the lnnovation Fund Project of Graduate Education of Chongqing Jiaotong University (2023S0022).
Data Availability Statement
The data presented in this study are available on request from the corresponding author.
Conflicts of Interest
The authors declare no conflict of interest.
References
- Abdel-Jaber, H.; Glisic, B. Monitoring of prestressing forces in prestressed concrete structures—An overview. Struct. Control. Health Monit. 2019, 26, e2374. [Google Scholar] [CrossRef]
- Liu, Z.; Cui, Y.; Wang, W.; Cao, W.; Wang, X.; Xue, X. Strengthening Shear Resistance of Beams without Web Reinforcements Using Vertical Prestressed Steel Bars. Adv. Mater. Sci. Eng. 2022, 2022, 3869978. [Google Scholar] [CrossRef]
- Ferreira, D.; Bairan, J.M.; Marí, A. Shear strengthening of reinforced concrete beams by means of vertical prestressed reinforcement. Struct. Infrastruct. Eng. 2015, 12, 394–410. [Google Scholar] [CrossRef]
- Yin, H.J.; Li, Z.Q.; Hao, X.W.; Zhao, B. Analysis on stress state of box-girder web under prestressing effect. ITM Web Conf. 2018, 17, 03007. [Google Scholar] [CrossRef]
- Li, S.; Xin, J.; Jiang, Y.; Wang, C.; Zhou, J.; Yang, X. Temperature-induced deflection separation based on bridge deflection data using the TVFEMD-PE-KLD method. J. Civ. Struct. Health Monit. 2023, 13, 781–797. [Google Scholar] [CrossRef]
- Xin, J.; Jiang, Y.; Zhou, J.; Peng, L.; Liu, S.; Tang, Q. Bridge deformation prediction based on SHM data using improved VMD and conditional KDE. Eng. Struct. 2022, 261, 114285. [Google Scholar] [CrossRef]
- Xin, J.; Zhou, C.; Jiang, Y.; Tang, Q.; Yang, X.; Zhou, J. A signal recovery method for bridge monitoring system using TVFEMD and encoder-decoder aided LSTM. Measurement 2023, 214, 112797. [Google Scholar] [CrossRef]
- Bonopera, M.; Chang, K.; Lee, Z. State-of-the-Art Review on Determining Prestress Losses in Prestressed Concrete Girders. Appl. Sci. 2020, 10, 7527. [Google Scholar] [CrossRef]
- Sawicki, B.; Brühwiler, E.; Bassil, A. Deformational behavior and damage mechanism of R-UHPFRC beam subjected to fatigue loading. Mater. Struct. 2021, 54, 158. [Google Scholar] [CrossRef]
- Cui, H.; Li, X.; Zhang, B.; Yuan, F.; Chen, B. Research on Inductance–capacitance electromagnetic resonance measurement of prestressed concrete beam. Measurement 2022, 189, 110618. [Google Scholar] [CrossRef]
- Wu, B.; Cui, W.; Sun, J.L.; Long, Y.Y. Research for Non-Destructive Detection of Vertical Prestressed Tensile Force in Box Girder. Adv. Mater. Res. 2013, 838–841, 2052–2057. [Google Scholar] [CrossRef]
- Zhong, X.; Yang, T.; Shen, M.; Yu, J.; Xie, X. Method for Testing the Tension of Vertical Prestressing Bars in Webs of Concrete Box Girder Bridges. J. Bridg. Eng. 2011, 16, 438–444. [Google Scholar] [CrossRef]
- Zhong, X.; Zhang, T.; Zhao, C.; Shu, X.; Shen, M.; Chen, Y.F. New non-destructive dynamic tensile testing of prestressing fine-rolled screw-threaded steel bars. Eng. Struct. 2018, 182, 153–163. [Google Scholar] [CrossRef]
- Zhong, X.; Zhang, T.; Zhao, C.; Shu, X.; Shen, M.; Chen, Y.F. Tension Test for Axially Vibrated Prestressing Fine-Rolled Screw-Threaded Steel Bars Based on Thread-Contact Connection. Adv. Civ. Eng. 2019, 2019, 1806532. [Google Scholar] [CrossRef]
- Chen, P.; He, X.; Wang, X. Ultrasonic Measurement of Axial Stress Using High-Frequency Cylindrical Guided Wave. IEEE Sensors J. 2021, 21, 6691–6697. [Google Scholar] [CrossRef]
- Xiu, C.; Ren, L.; Li, H.; Jia, Z. Study on an innovative self-inductance tension eddy current sensor based on the inverse magnetostrictive effect. Sens. Rev. 2017, 37, 43–53. [Google Scholar] [CrossRef]
- Xiu, C.; Ren, L.; Li, H. Investigation on Eddy Current Sensor in Tension Measurement at a Resonant Frequency. Appl. Sci. 2017, 7, 538. [Google Scholar] [CrossRef]
- Alonso, M.S.G.; Hernando, A.; Vinolas, J.; García, M.A. Magnetic detection of high mechanical stress in iron-based materials using eddy currents and phase shift measurements. J. Appl. Phys. 2021, 129, 243901. [Google Scholar] [CrossRef]
- Liang, K.; Angelopoulos, S.; Ktena, A.; Bi, X.; Hristoforou, E. Residual Stress Distribution Monitoring and Rehabilitation in Ferromagnetic Steel Rods. Sensors 2022, 22, 1491. [Google Scholar] [CrossRef] [PubMed]
- Cappello, C.; Zonta, D.; Laasri, H.A.; Glisic, B.; Wang, M. Calibration of Elasto-Magnetic Sensors on In-Service Cable-Stayed Bridges for Stress Monitoring. Sensors 2018, 18, 466. [Google Scholar] [CrossRef]
- Joh, C.; Lee, J.W.; Kwahk, I. Feasibility Study of Stress Measurement in Prestressing Tendons Using Villari Effect and Induced Magnetic Field. Int. J. Distrib. Sens. Networks 2013, 9. [Google Scholar] [CrossRef]
- Deng, D.; Wu, X. Feasibility study of determining axial stress in ferromagnetic bars using reciprocal amplitude of initial differential susceptibility obtained from static magnetization by permanent magnets. J. Magn. Magn. Mater. 2018, 449, 243–256. [Google Scholar] [CrossRef]
- Yan, S.; Wang, Y.; Li, P.; Gao, Z.; Wu, B.; Liu, X. Comprehensive Indicators for Evaluating and Seeking Elasto-Magnetic Parameters for High-Performance Cable Force Monitoring. Sensors 2022, 22, 7776. [Google Scholar] [CrossRef]
- Duan, Y.-F.; Zhang, R.; Dong, C.-Z.; Luo, Y.-Z.; Or, S.W.; Zhao, Y.; Fan, K.-Q.; Or, D.S.W. Development of Elasto-Magneto-Electric (EME) Sensor for In-Service Cable Force Monitoring. Int. J. Struct. Stab. Dyn. 2016, 16, 1640016. [Google Scholar] [CrossRef]
- Zhang, S.; Zhou, J.; Chen, J. Cable Tension Monitoring Based on the Elasto-Magnetic Effect and the Self-Induction Phenomenon. Materials 2019, 12, 2230. [Google Scholar] [CrossRef]
- Kurs, A.; Karalis, A.; Moffatt, R.; Joannopoulos, J.D.; Fisher, P.; Soljačić, M. Wireless Power Transfer via Strongly Coupled Magnetic Resonances. Science 2007, 317, 83–86. [Google Scholar] [CrossRef]
- Hughes, R.; Fan, Y.; Dixon, S. Investigating electrical resonance in eddy-current array probes. AIP Conf. Proc. 2016, 1706, 090001. [Google Scholar] [CrossRef]
- Zhang, S.; Zhang, H.; Liu, H.; Zhou, J.; Yin, C.; Liao, L. Resonance enhanced magnetoelastic method with high sensitivity for steel stress measurement. Measurement 2021, 186, 110139. [Google Scholar] [CrossRef]
- Zhang, K.C.; Chen, J.Z.; Liu, H.Q.; Zheng, Y. Research of Vertical Prestressed Losses during Construction Process of PC Continuous Box Girder Bridge. Appl. Mech. Mater. 2013, 351–352, 1142–1145. [Google Scholar] [CrossRef]
- Liu, X.; Chen, Y.; Hu, H.; Feng, S.; Feng, Z. Measurement method of natural frequencies and tension forces for cables based on elasto-magnetic sensors calibrated by frequencies. AIP Adv. 2022, 12, 015301. [Google Scholar] [CrossRef]
- Zhang, H.; Li, H.; Zhou, J.; Tong, K.; Xia, R. A multi-dimensional evaluation of wire breakage in bridge cable based on self-magnetic flux leakage signals. J. Magn. Magn. Mater. 2023, 566, 170321. [Google Scholar] [CrossRef]
- Zhang, S.; Zhou, J.; Zhang, H.; Liao, L.; Liu, L. Influence of cable tension history on the monitoring of cable tension using magnetoelastic inductance method. Struct. Health Monit. 2021, 20, 3392–3405. [Google Scholar] [CrossRef]
- Stefański, T.P.; Gulgowski, J. Electromagnetic-based derivation of fractional-order circuit theory. Commun. Nonlinear Sci. Numer. Simul. 2019, 79, 104897. [Google Scholar] [CrossRef]
- De Angelis, G.; De Angelis, A.; Moschitta, A.; Carbone, P.; Pintelon, R. Online Identification of the LC Product in Coupled Resonant Circuits. IEEE Trans. Instrum. Meas. 2019, 69, 4592–4603. [Google Scholar] [CrossRef]
- Burdin, D.; Chashin, D.; Fetisov, L.; Saveliev, D.; Ekonomov, N.; Vopson, M.; Fetisov, Y. Towards Fabrication of Planar Magnetoelectric Devices: Coil-Free Excitation of Ferromagnet-Piezoelectric Heterostructures. Actuators 2021, 10, 294. [Google Scholar] [CrossRef]
- Ru, G.; Gao, B.; Liu, D.; Ma, Q.; Li, H.; Woo, W.L. Structural Coupled Electromagnetic Sensing of Defects Diagnostic System. IEEE Trans. Ind. Electron. 2023, 70, 951–964. [Google Scholar] [CrossRef]
- Weng, G.; Wang, J.; Liu, Y.; Zhu, X.; Dai, J. Magnetic Stress Sensing System for Nondestructive Stress Testing of Structural Steel and Steel Truss Components Based on Existing Magnetism. Sensors 2020, 20, 4043. [Google Scholar] [CrossRef]
- Zhang, H.; Ma, X.; Jiang, H.; Tong, K.; Zheng, Y.; Zhou, J. Grading Evaluation of Overall Corrosion Degree of Corroded RC Beams via SMFL Technique. Struct. Control. Health Monit. 2023, 2023, 6672823. [Google Scholar] [CrossRef]
- Tong, K.; Zhou, J.; Ma, X.; Ying, H.; Zhao, R. Investigation of the effect of initial magnetization state on the force-magnetic coupling effect of rebars. J. Magn. Magn. Mater. 2023, 569, 170382. [Google Scholar] [CrossRef]
- Diogenes, A.G.; de Moura, E.P.; Machado, A.D.S.; Gonçalves, L.L. Corrosion evaluation of carbon steel bars by magnetic non-destructive method. Nondestruct. Test. Evaluation 2022, 37, 315–331. [Google Scholar] [CrossRef]
- Zhang, R.; Duan, Y.; Or, S.W.; Zhao, Y. Smart Elasto-Magneto-Electric (EME) Sensors for Stress Monitoring of Steel Cables: Design Theory and Experimental Validation. Sensors 2014, 14, 13644–13660. [Google Scholar] [CrossRef] [PubMed]
- Zhang, Z.; Tang, F.; Cao, Q.; Pan, H.; Wang, X.; Lin, Z. Deep Learning-Enriched Stress Level Identification of Pretensioned Rods via Guided Wave Approaches. Buildings 2022, 12, 1772. [Google Scholar] [CrossRef]


Disclaimer/Publisher’s Note: The statements, opinions and data contained in all publications are solely those of the individual author(s) and contributor(s) and not of MDPI and/or the editor(s). MDPI and/or the editor(s) disclaim responsibility for any injury to people or property resulting from any ideas, methods, instructions or products referred to in the content. |
© 2023 by the authors. Licensee MDPI, Basel, Switzerland. This article is an open access article distributed under the terms and conditions of the Creative Commons Attribution (CC BY) license (https://creativecommons.org/licenses/by/4.0/).