Article

Evaluation of the Seismic Behavior of RC Buildings through the Direct Modeling of Masonry Infill Walls

by
Abdelkader Nour
1,
Sidi Mohammed El-Amine Bourdim
1,2,* and
Mohammed Issam Eddine Terki Hassaine
1
1
Laboratory Materials and Construction Processes, Faculty of Science and Technology, University Adelhamid Ibn Badis of Mostaganem, Mostaganem 27000, Algeria
2
Department of Hydraulic and Civil Engineering, University Center of Maghnia, Tlemcen 13300, Algeria
*
Author to whom correspondence should be addressed.
Buildings 2023, 13(7), 1576; https://doi.org/10.3390/buildings13071576
Submission received: 26 April 2023 / Revised: 2 June 2023 / Accepted: 15 June 2023 / Published: 21 June 2023

Abstract

:
The direct modeling of masonry infill walls on many buildings, based on damage recorded by various past earthquakes, has become increasingly necessary in order to identify the seismic behavior of these elements, which constitute an important part of reinforced concrete buildings. In this paper, several 3D models were analyzed by the nonlinear static (pushover) method, when ignoring, and when considering, masonry infill walls. The finite element software SAP analyzed the proposed models. These models represent low and mid-rise reinforced concrete buildings infilled with double-leaf hollow bricks. The properties of materials used in Algeria, either in the frame elements or the infill elements, were used. The results obtained were compared according to two parameters, the natural time period of the building and the pushover curve, by varying the values of the dead load and the concrete compressive strength. The results were discussed according to the suggested parameters. The results showed that indirect modeling of such walls, either by taking assumptions embedded in the seismic behavior factor or by means of the macro-modal, can lead to a poor appreciation of the seismic behavior of such buildings. Consequently, direct modeling of walls by the infill of the real void showed acceptable results to some extent. This contributes greatly towards understanding the seismic behavior of this type of building.

1. Introduction

Reinforced concrete buildings infilled with masonry walls represent a large part of the total urban heritage in Algeria, especially in the country’s northern regions. The most-used types of masonry infill walls can be summarized into two types, clay bricks and light concrete blocks.
Until recently, the prevailing idea of many designers was to consider masonry infill walls as secondary elements when reinforced concrete structures were subjected to seismic loads. Moreover, this process was only considered for dead loads or through the dynamic behavior coefficient. Many international seismic codes, including the Algerian code, do not include any requirements related to the calculation of the effect of masonry infill walls on the seismic response of buildings during their exposure to seismic loads.
Multiple earthquakes, in particular the Boumerdes earthquake (May 2003), have proven beyond any doubt that the neglect of the effect of masonry infill walls on the seismic behavior of reinforced concrete buildings is a misconception that can lead to a wrong evaluation of the responses of the buildings in question. The damage to these walls on the one hand, as well as the damage to the structural elements on the other hand, has been substantiated by numerous research studies that took place long ago and are still ongoing today.
Several experiments and numerical simulations [1,2] were conducted to study the behavior of masonry infill walls, which provided insight into the expected collapse patterns when subjected to lateral loads such as earthquakes.
In assessing the above damages and analyzing the results of extensive research, some seismic codes have proposed several approaches showing the participation of masonry infill walls with the rest of the elements of reinforced concrete buildings to better evaluate the seismic behavior of how this type of building’s infill walls contribute significantly to modifying the seismic behavior of reinforced concrete buildings [3,4]. It increases the stiffness and base shear of the building and reduces the natural time period of the building. This leads to higher seismic loads. The clear difference between the elastic behavior of frames (columns and beams) and the brittle behavior of masonry infill walls can negatively affect the seismic behavior of reinforced concrete buildings. The presence of masonry infill walls can cause several undesirable phenomena and failure mechanisms [5], including the soft story [6,7,8,9,10,11,12,13] and short column [14,15].
Many researchers now recognize the need to include masonry infill walls in the design of infilled reinforced concrete buildings to more accurately simulate the actual behavior of walls that infill the voids resulting from the intersection of reinforced concrete frames.
Most previous numerical studies related to the inclusion of masonry infill walls can be divided into three types.
The first model is the simplified model (macro-model) [16,17,18], which revolves around replacement of the entire wall with a compressed diagonal strut [19], taking into account the homogenized characteristics of the wall, including the mortar and block, made of either concrete or clay. This model was approved by many researchers and international seismic codes [20,21,22,23,24] and is considered the simplest and easiest to use. The modeling processes give relatively acceptable results but do not treat either the phenomenon of the interaction of the elements that make up the wall, or the interaction between the frame elements (columns and beam), and the masonry infill wall. However, we can say that it is better than not including the masonry infill wall directly into the modeling process.
The second model is the plate model (meso-model) [25,26,27], which is the replacement of all wall components by a plate element, with homogenization of the mortar and block properties by adopting the overall properties of the masonry infill wall. This model is better than the first one in terms of infilling all the spaces produced between the frames as well as in approximating the real wall behavior. The results prove that this model is more accurate than the first one, but it remains below the level required to model these walls, since the characteristics of each component are not specific.
The third model (micro-model) [25,28,29,30,31,32] requires the explicit modeling of all components of the masonry infill wall, taking into account the interaction of the wall components, as well as the interaction of the frame elements with the wall. This model is considered the most accurate model based on the extended modeling of the different elements, but in return, it requires more effort and time to analyze and present the results.
In what follows, we have relied on the average (plate) model or meso-model, because of its ease of use and the results that can be obtained. We have chosen several three-dimensional models of a reinforced concrete building located in a known seismic zone in Algeria. The building was modeled using the finite element software SAP 2000 [33]. We used the pushover method to simulate these models, which is a nonlinear static method known to designers, and is a much better method than linear methods.
We presented the results of each model separately, then compared the results and commented on them according to each case. The difference between neglecting the modeling of masonry infill walls or including them in a simplified way by approximate coefficients and their direct modeling by specialized software was then ascertained. The results indicated that direct modeling of the masonry infill walls gives relatively acceptable results and obtains the closest and most correct evaluation of the seismic behavior of this type of reinforced concrete buildings infilled by masonry, which arise most commonly in our country and in many countries.
Through what will be presented later, it is worth highlighting the main objective of this paper, which was to mainly focus on the evaluation of the seismic behavior of reinforced concrete buildings through direct modeling of the masonry infill walls and a comparison of the results taking into account several criteria. All this was done using the pushover method, which is a nonlinear static method.

2. Modeling Strategy and Validation

In this section, we demonstrate the numerical modeling method to study the seismic behavior of reinforced concrete buildings infilled with masonry walls consisting mainly of hollow clay bricks used in Algeria, with the characteristics given in the Algerian code of masonry [34]. The model used was validated by comparing it with the famous software, SeismoStruct [35], which offers a great capacity for modeling masonry infill walls. The model used in the SeismoStruct software was validated experimentally. The purpose of the proposed model is to allow us to study the seismic behavior of masonry infill walls in a good way that can be applied in the design of this type of building.
The proposed models include the bare-frame model (BF), fully infilled model (FI) and ground soft-story model (GSS).

2.1. Description of the Numerical Modeling Strategy

After validation of the proposed model, we used the finite element software SAP 2000 [33] to model the proposed models. This software allowed us to study the seismic behavior of the proposed models by the pushover method. In a pushover analysis, a lateral force distribution representing the inertia forces is applied statically to the structure with increasing intensity until the ultimate condition is exceeded [36]. The global response is represented by the base shear-top displacement curve, called also the pushover or capacity curve. The choice of a proper load shape is a significant aspect of this method because of its influence on the structural response. There are no clear criteria to define the load shape, and must often make reference to the literature, guidelines or codes. The Eurocode 8 [36], similar to FEMA 356 [37], requires the use of at least two force patterns: one, termed the uniform pattern, is based on forces proportional at each story to the mass, the other, termed the modal pattern, is based on forces proportional at each story to the mass multiplied by the corresponding modal deformation, in general, assuming a load shape related to the displacement shape. All the models proposed for the study are in three dimensions, representing a reinforced concrete building.
Throughout this study, we have defined the elements of the frame (columns and beams) by defining the zones that reach the nonlinear level, called plastic hinges, that are usually located at the ends of the elements. The nonlinear behavior of the frame elements can be determined by identifying plastic hinges that are usually located at the beginnings and ends of the elements. These are the areas where the shear and bending moments usually carry maximum values compared to the middle areas of these elements. This facilitates the analysis methods and gives good results in less time and with less effort [38]. This simplification avoids the linear distribution of masses and replaces them with lumped masses.
The method used for modeling of the masonry infill walls relies on the plate model (meso-model). This model is based on homogenizing the characteristics of mortar and blocks as a single element with certain simplifying assumptions, where an equivalent thickness to the real wall thickness was proposed with the use of the multilayer shell element provided by the SAP 2000. The latter software has nonlinear characteristics as a function of the concentration of plastic hinges at some zones of the masonry infill walls.
In our approach to modelling masonry infill walls, we used the shell element with homogenization of the block and mortar characteristics. The infill wall was considered as a homogeneous, isotropic plate (the meso-model). We referred to the Algerian masonry code [34], or assumed a hollow brick wall with thin-layer mortar [36], or freshly laid mortar. We assumed no interaction between the panel and the surrounding portal frame (no gaps). Non-linear behavior was used.
We have suggested that the double-leaf hollow brick can be replaced by another solid brick of equivalent thickness with the same cross-section as the hollow brick.
After determining the cross-section of the hollow brick, the hollow brick can be replaced by another solid brick of equivalent thickness.
After all the calculations were made, we can say that the equivalent thickness corresponds to the double-leaf hollow brick.
We then used the shell element recommended by the SAP 2000 software to model the masonry infill wall.

2.2. Validation of the Proposed Model

To validate the proposed model, we used the famous software SeismoStruct [35], which offers a great capacity to model the masonry infill walls through the nonlinear cyclic double-strut model, the latter having been experimentally validated. We modeled several two-dimensional frames with a double wall composed of a hollow brick and a freshly laid mortar (thin joint wall), thickness (30 cm) considering bare, partially, and fully 2D frames. The same frames were modeled with the finite element software SAP 2000. The geometric characteristics of the analyzed models are given in Table 1.
After analyzing the proposed models with the two software programs, we compared the results given by the two programs. The results showed a great convergence between the two programs, depending on the time periods of the building, which allowed us to use the proposed model. The results are shown in Figure 1.
Then, the proposed model was generalized for other models.

3. Case Study

3.1. General Description

The proposed building analyzed in this study is a reinforced concrete structure composed of three, six and nine stories. This building represents a residential building located in an area of high seismic risk according to the classification of the Algerian seismic code [23] The building is a frame-resisting system and is symmetrical in both directions. The dimensions in the plan of the building are 11.6 × 9.9 m2 and it has seven bays in the longitudinal direction and three bays in the transverse direction, as seen in Figure 2, Figure 3 and Figure 4.
The building was designed under the influence of a dead load of 6, 9 and 12 kN/m2 and a live load of 1.5 kN/m2. The compressive strength of the reinforced concrete was estimated to be 25, 40 and 55 MPa, the yield strength of the steel was estimated to be 500 Mpa. The parameters of the structure are shown in Table 2. All models were analyzed by the finite element software SAP 2000, considering a bare frame model (BF), a fully infilled model (FI), and a ground soft story model (GSS).
The height of each story is 3.06 m. The section of the columns is defined in Table 3. The section of the main beam is 300 × 400 mm2 with a section of 300 × 300 mm2 for the secondary beam. All cross-sections of the elements used are given in Table 3.
All models were analyzed by the pushover method in the longitudinal and transverse directions. This method was applied progressively to determine and evaluate the seismic response of each model separately. This type of analysis allowed us to determine and predict potential scenarios related to the different elements of the building, from limit values to collapse, and to follow the evolution of the capacity curve of the building. It also allowed us to check the stiffness and resistance of the different components of the building.

3.2. Parametric Study

Using the proposed models, we conducted a parametric study to determine the effect of the direct modeling of the masonry infill walls. The proposed models were analyzed, and the results were presented and compared in terms of the natural period, pushover curve, and performance parameters.

4. Results and Discussions

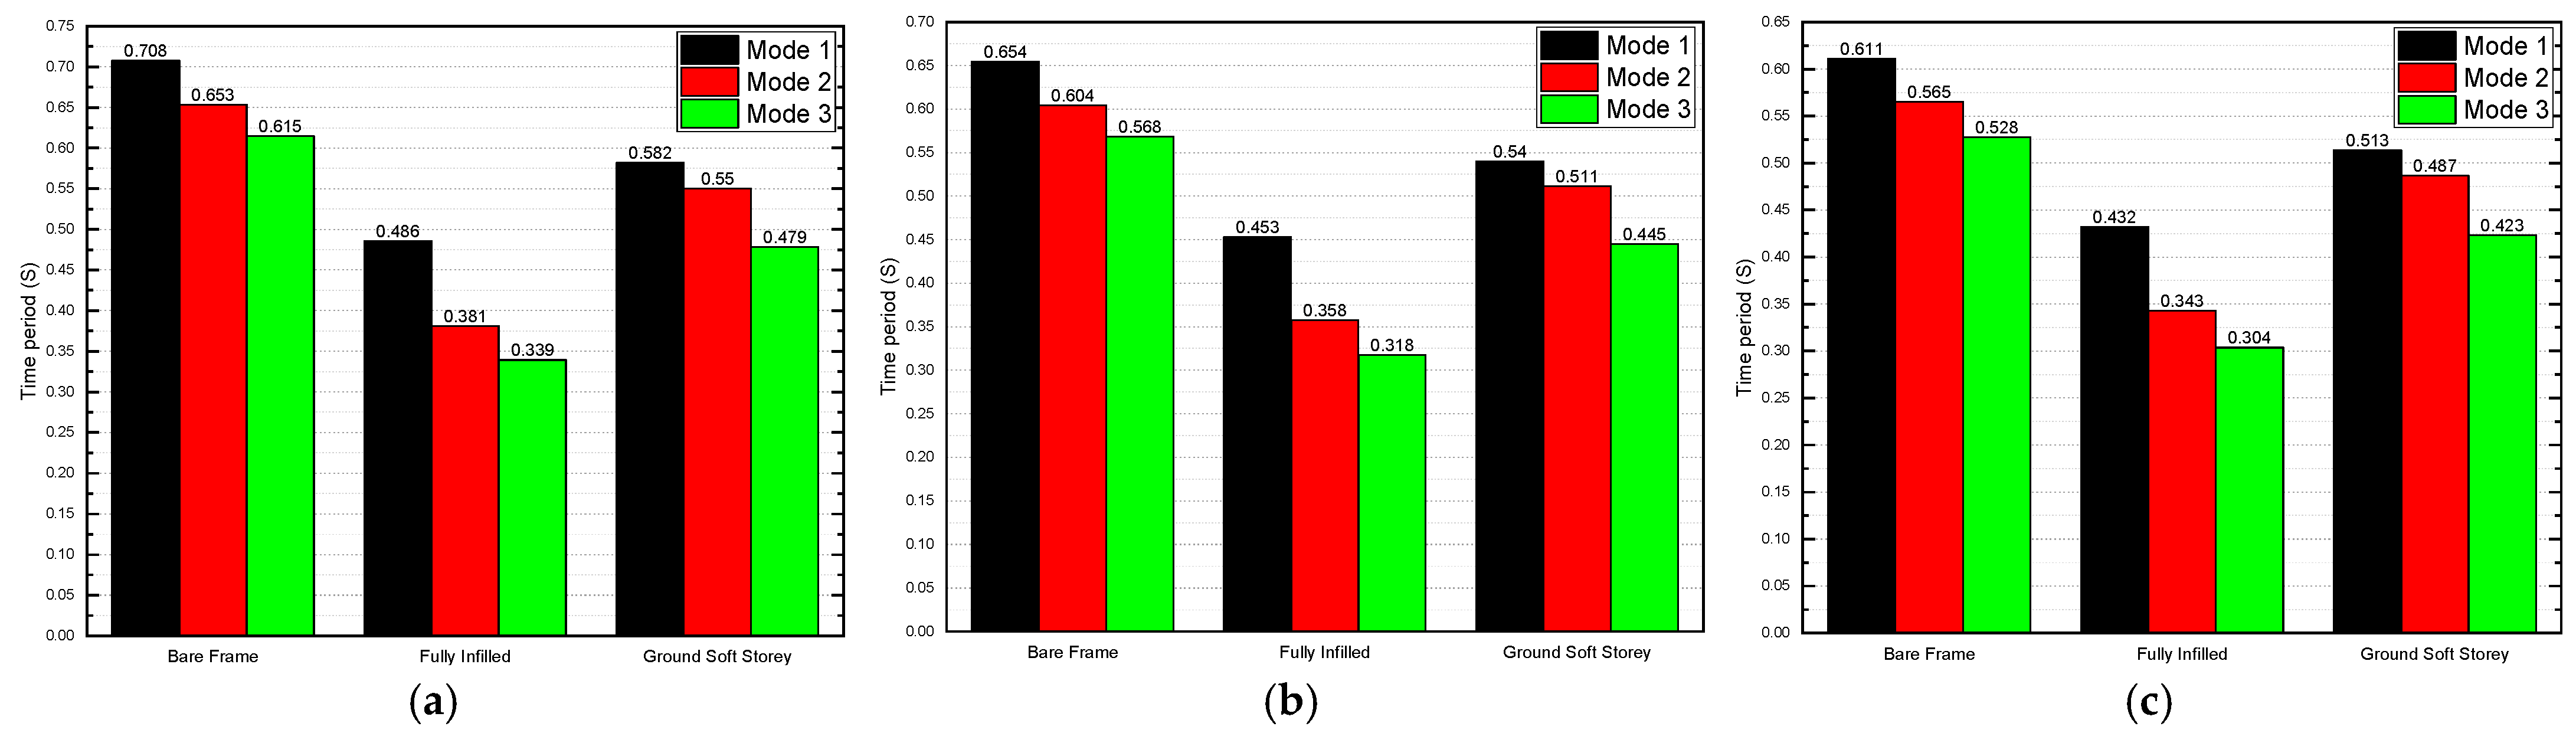
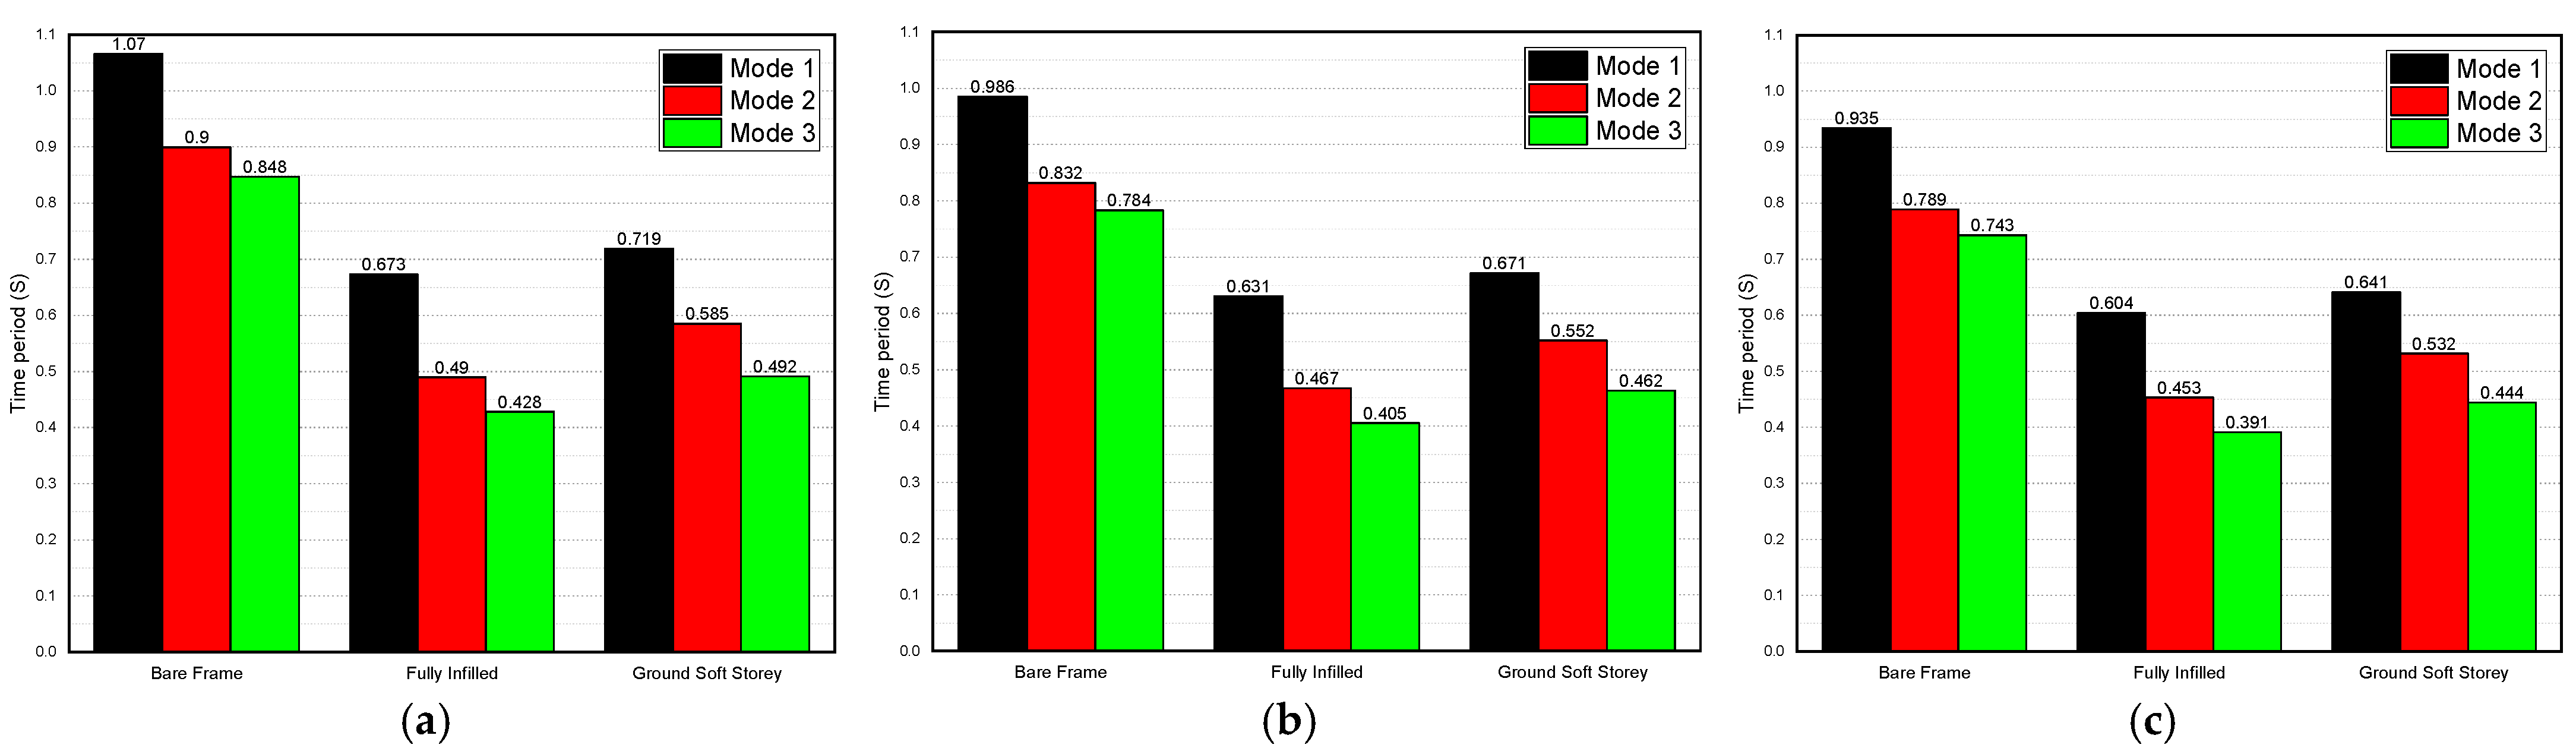
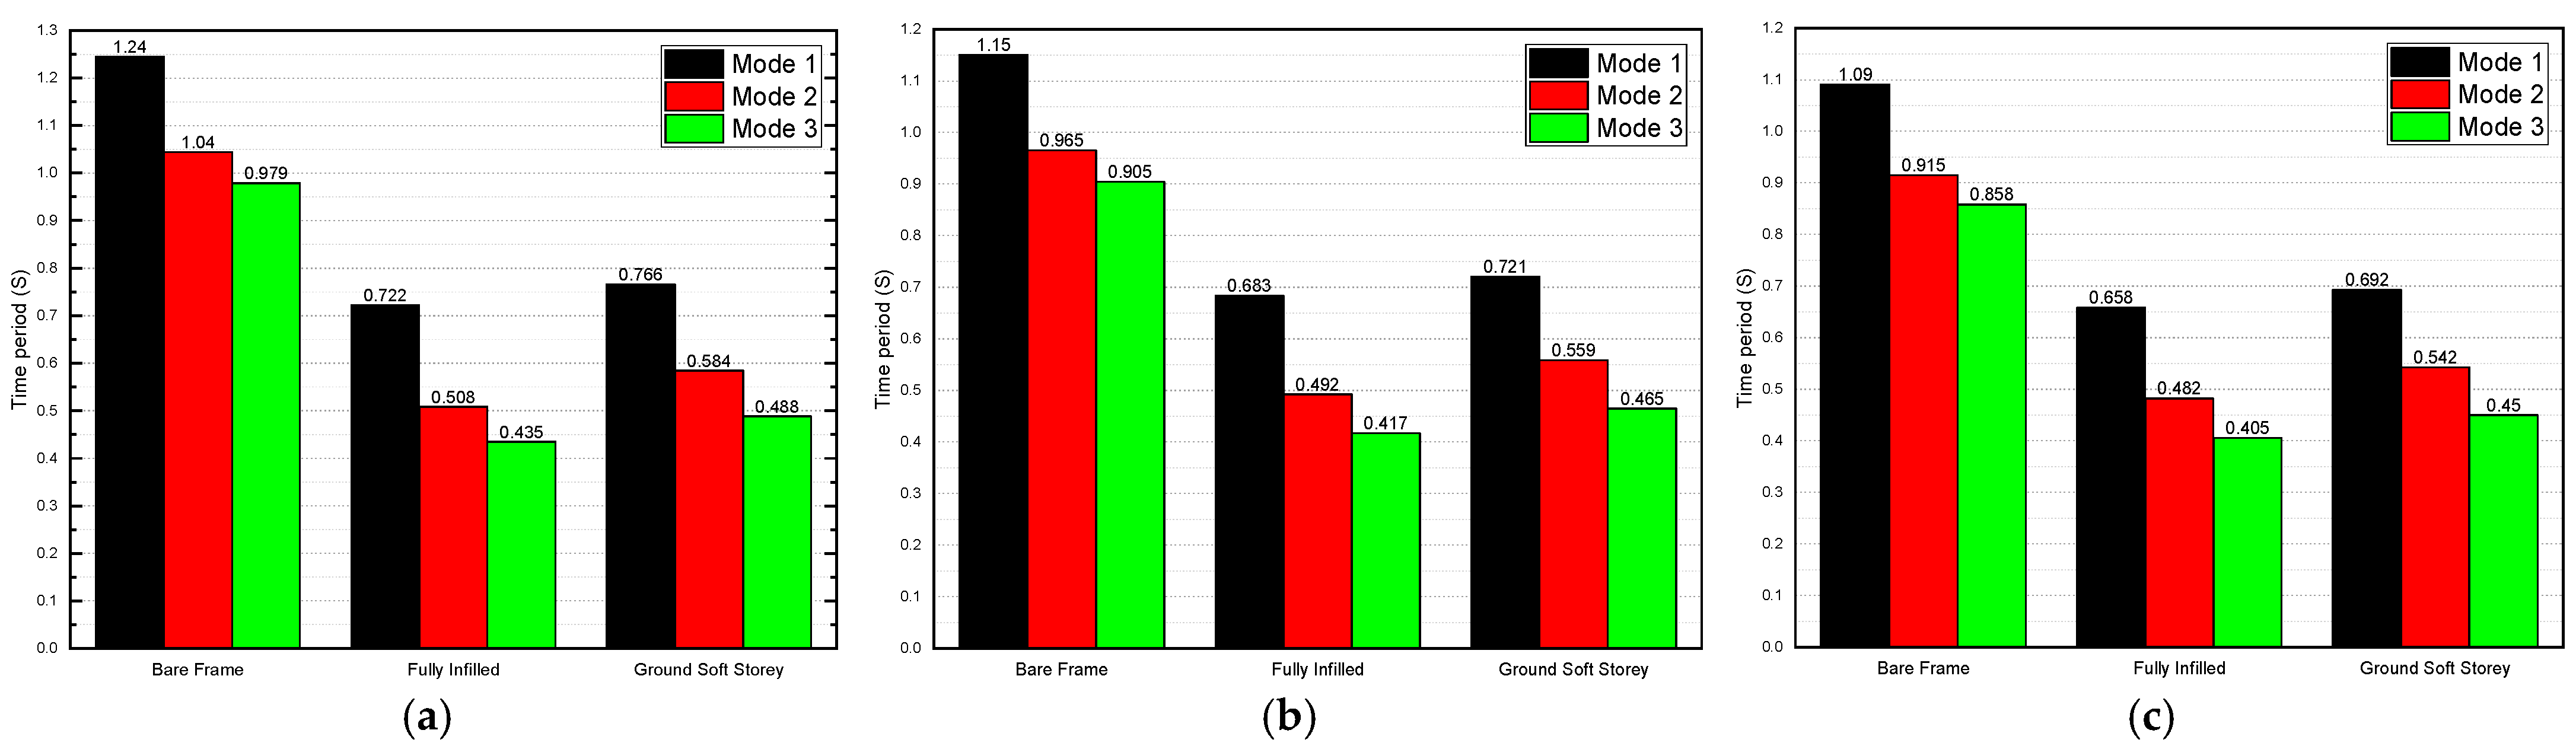
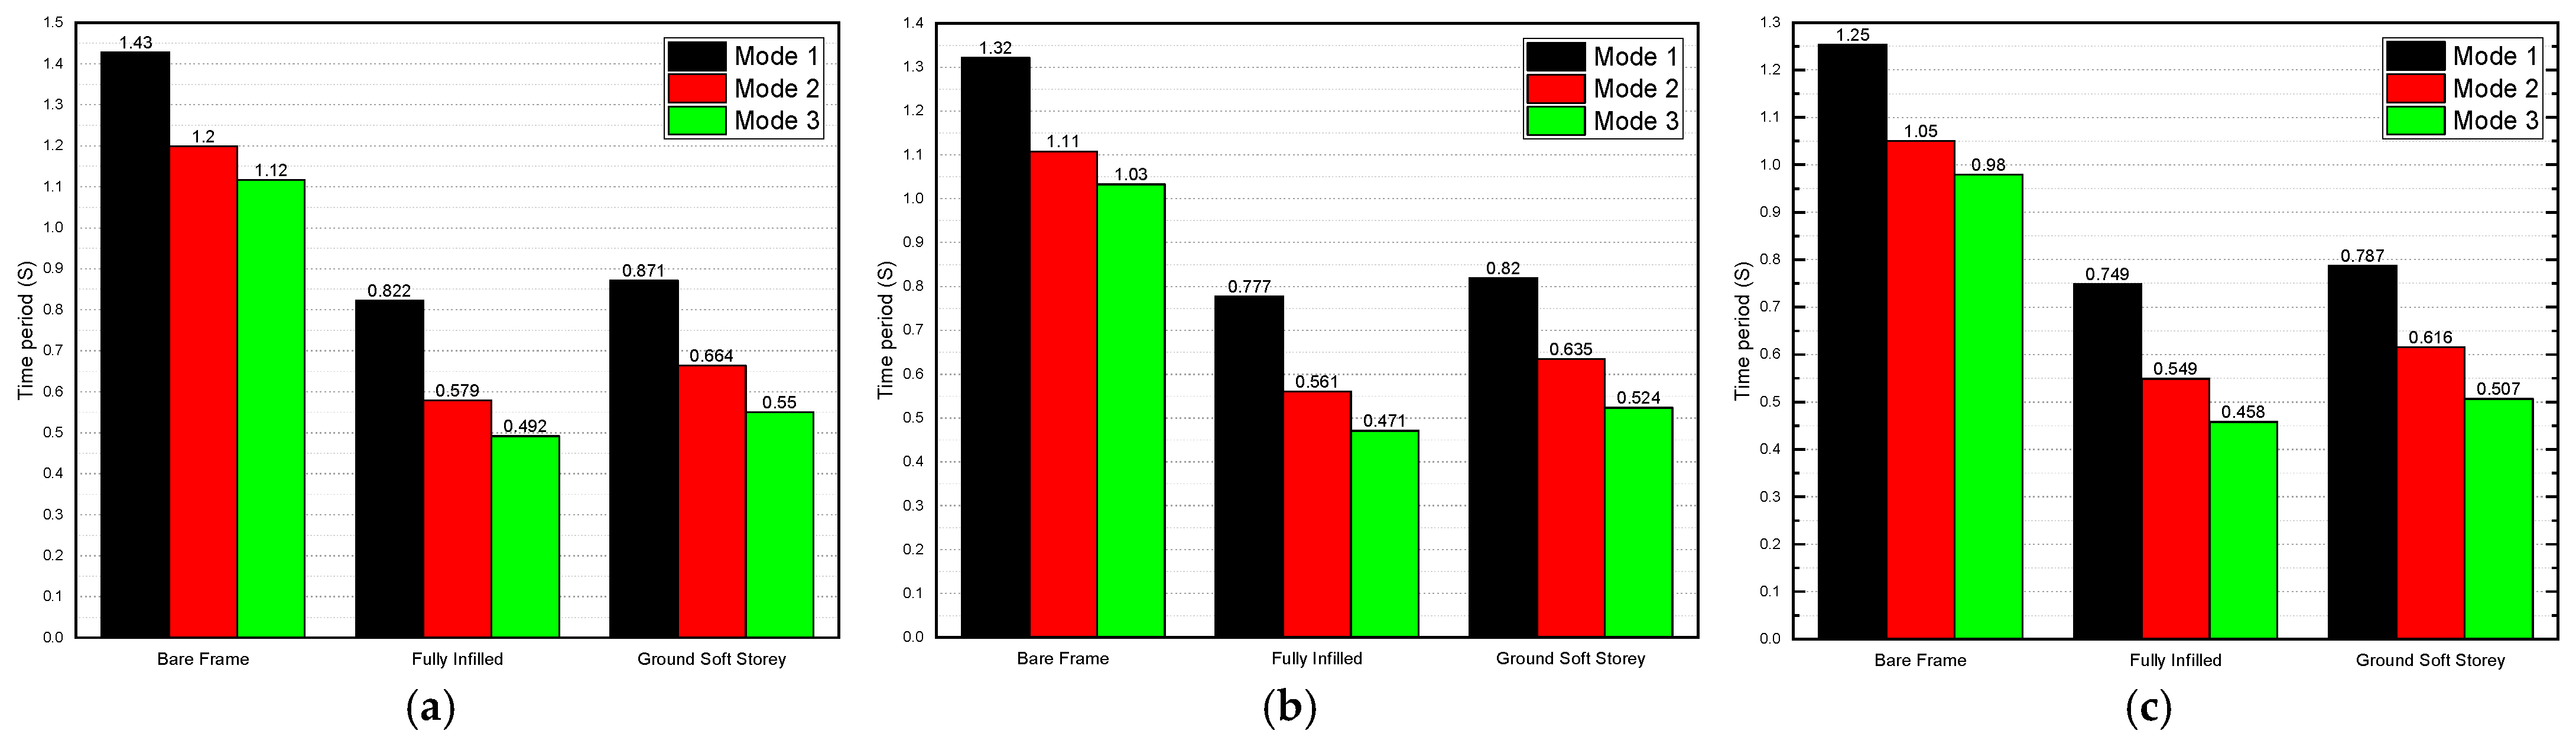
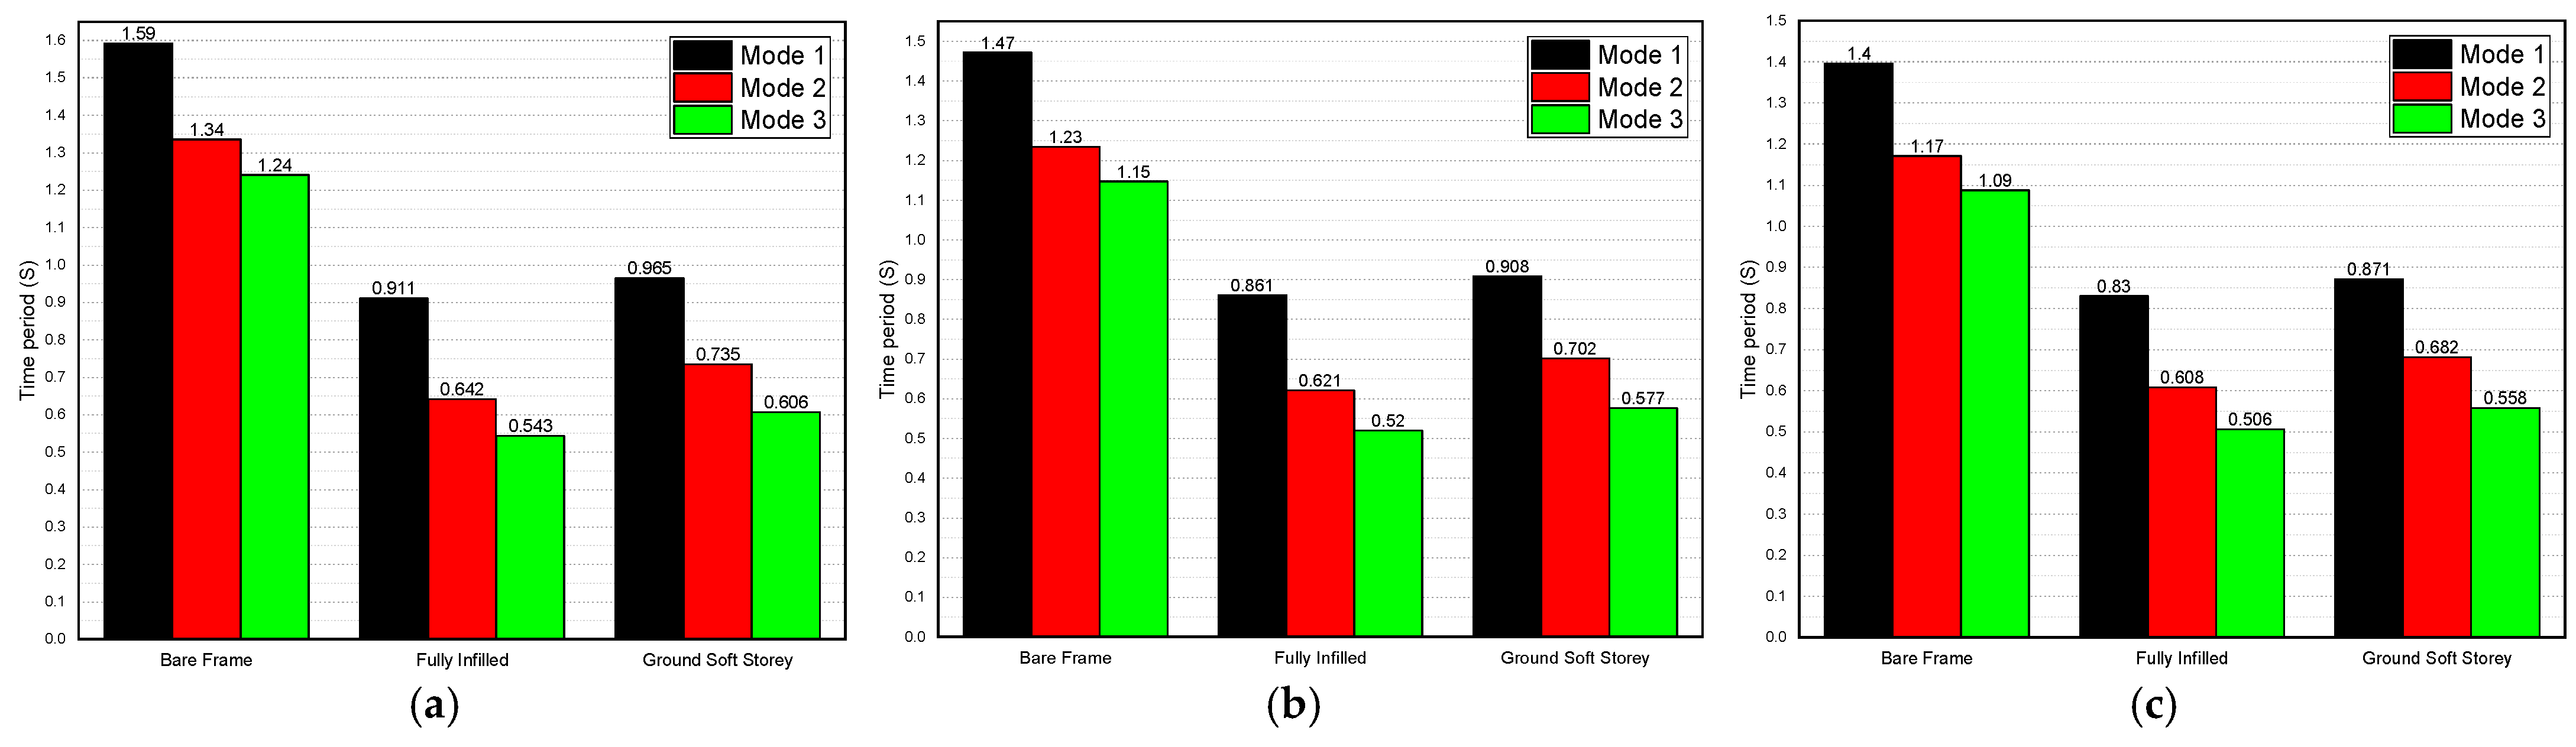
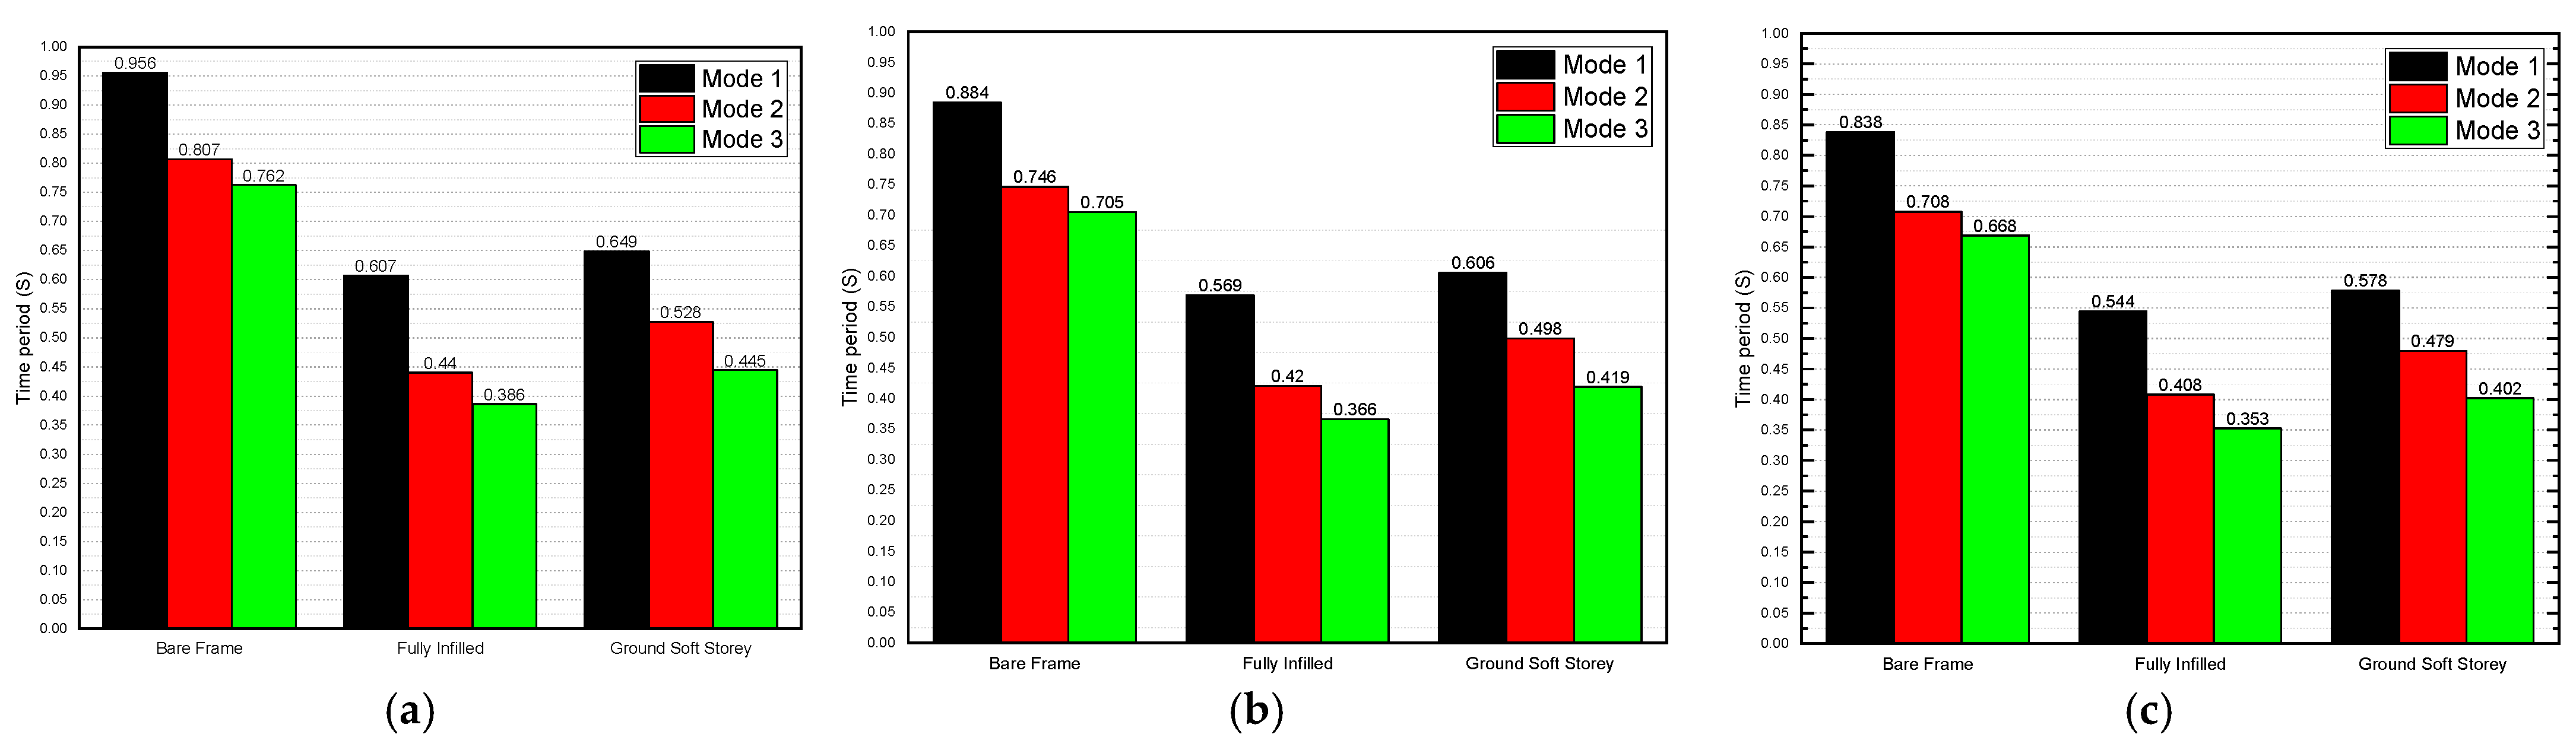
4.1. Effect of the Masonry Infill Walls on the Natural Time Period

Figure 5, Figure 6, Figure 7, Figure 8, Figure 9, Figure 10, Figure 11, Figure 12 and Figure 13 illustrate the effect of the masonry infill walls on the natural time period for the models with three, six and nine stories, with modifications of the dead-load values, as well as the compressive strength of the concrete.
We can see how the masonry infill walls affect the period values. All the analyzed models in which the masonry infill walls were included during modeling show lower values than those that did not contain the masonry infill walls. We can also notice a decrease in these values in models that contain a ground soft story. All this indicates an increase in the building’s base shear values, and therefore an increase in the initial stiffness values.
Modeling the masonry infill walls, in whole or in part, contributed significantly to increases in the stiffness of the building, which was reflected in the decrease in the time-period values for all models analyzed. Thus, the modeling of masonry infill walls contributes directly to providing the building with the additional rigidity that is likely needed to prevent the building from undergoing further deformations.

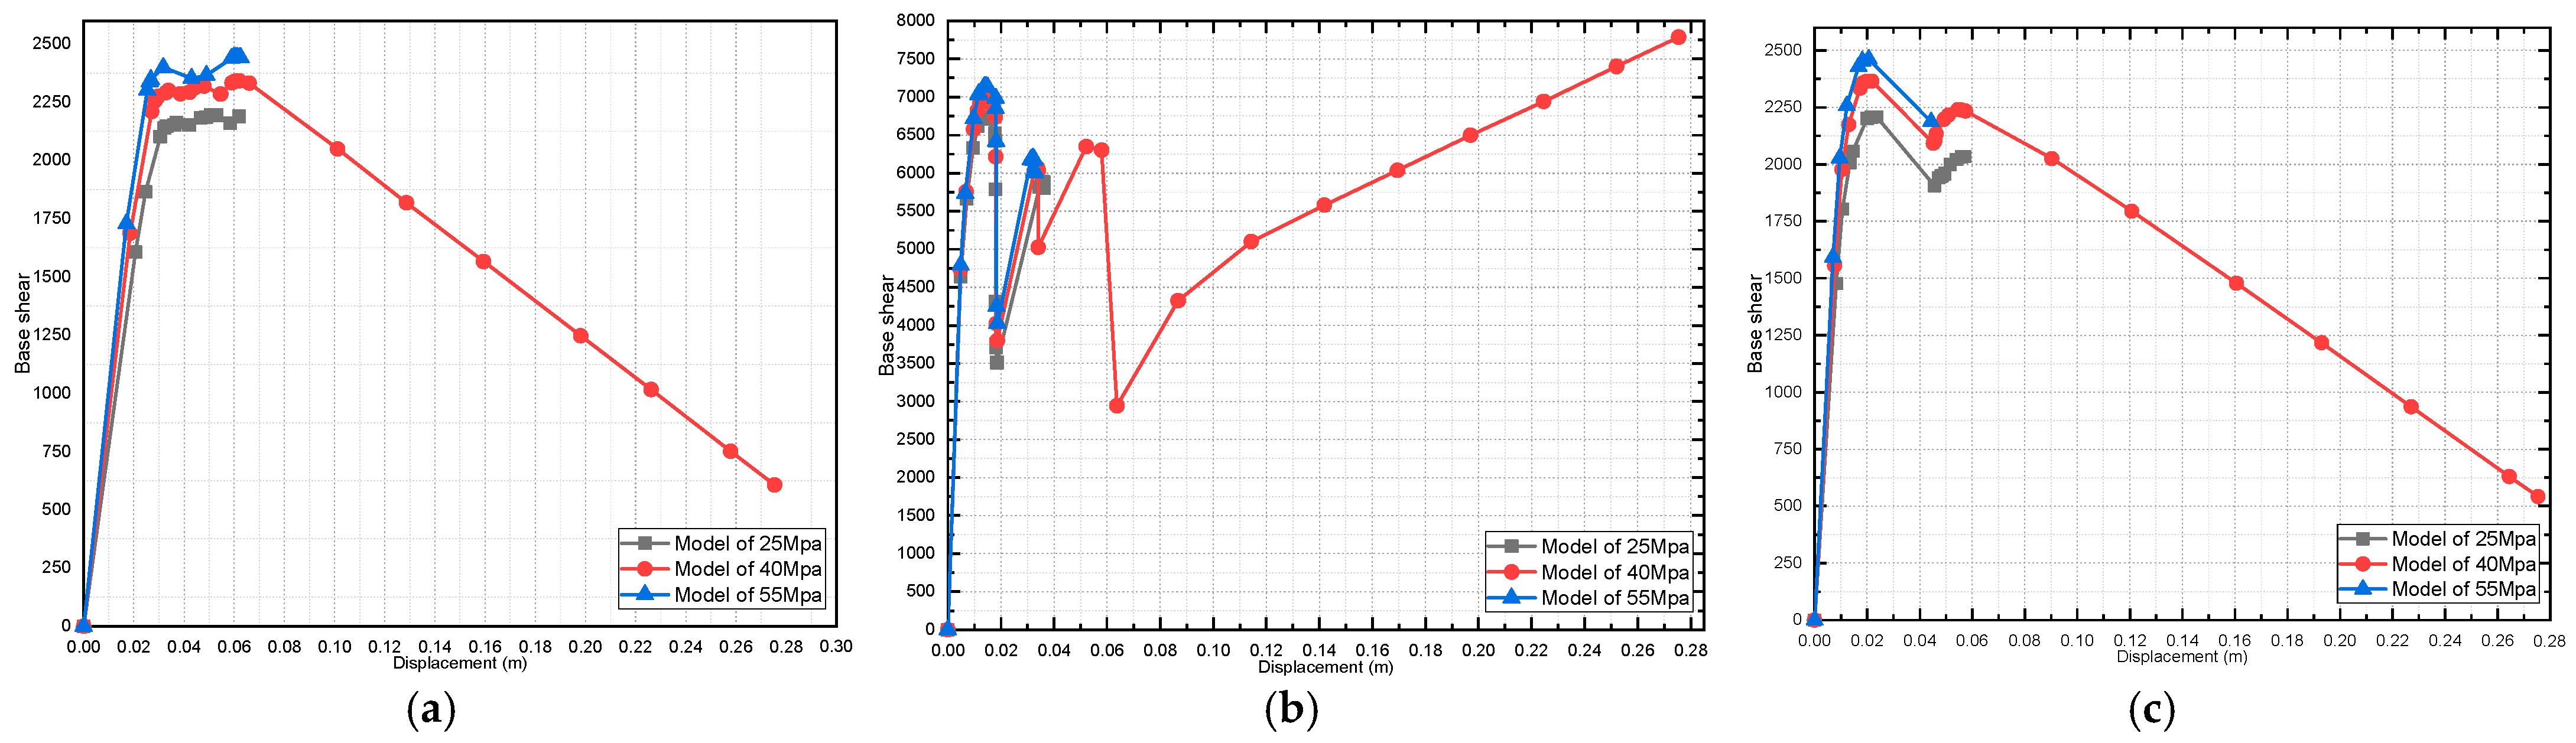
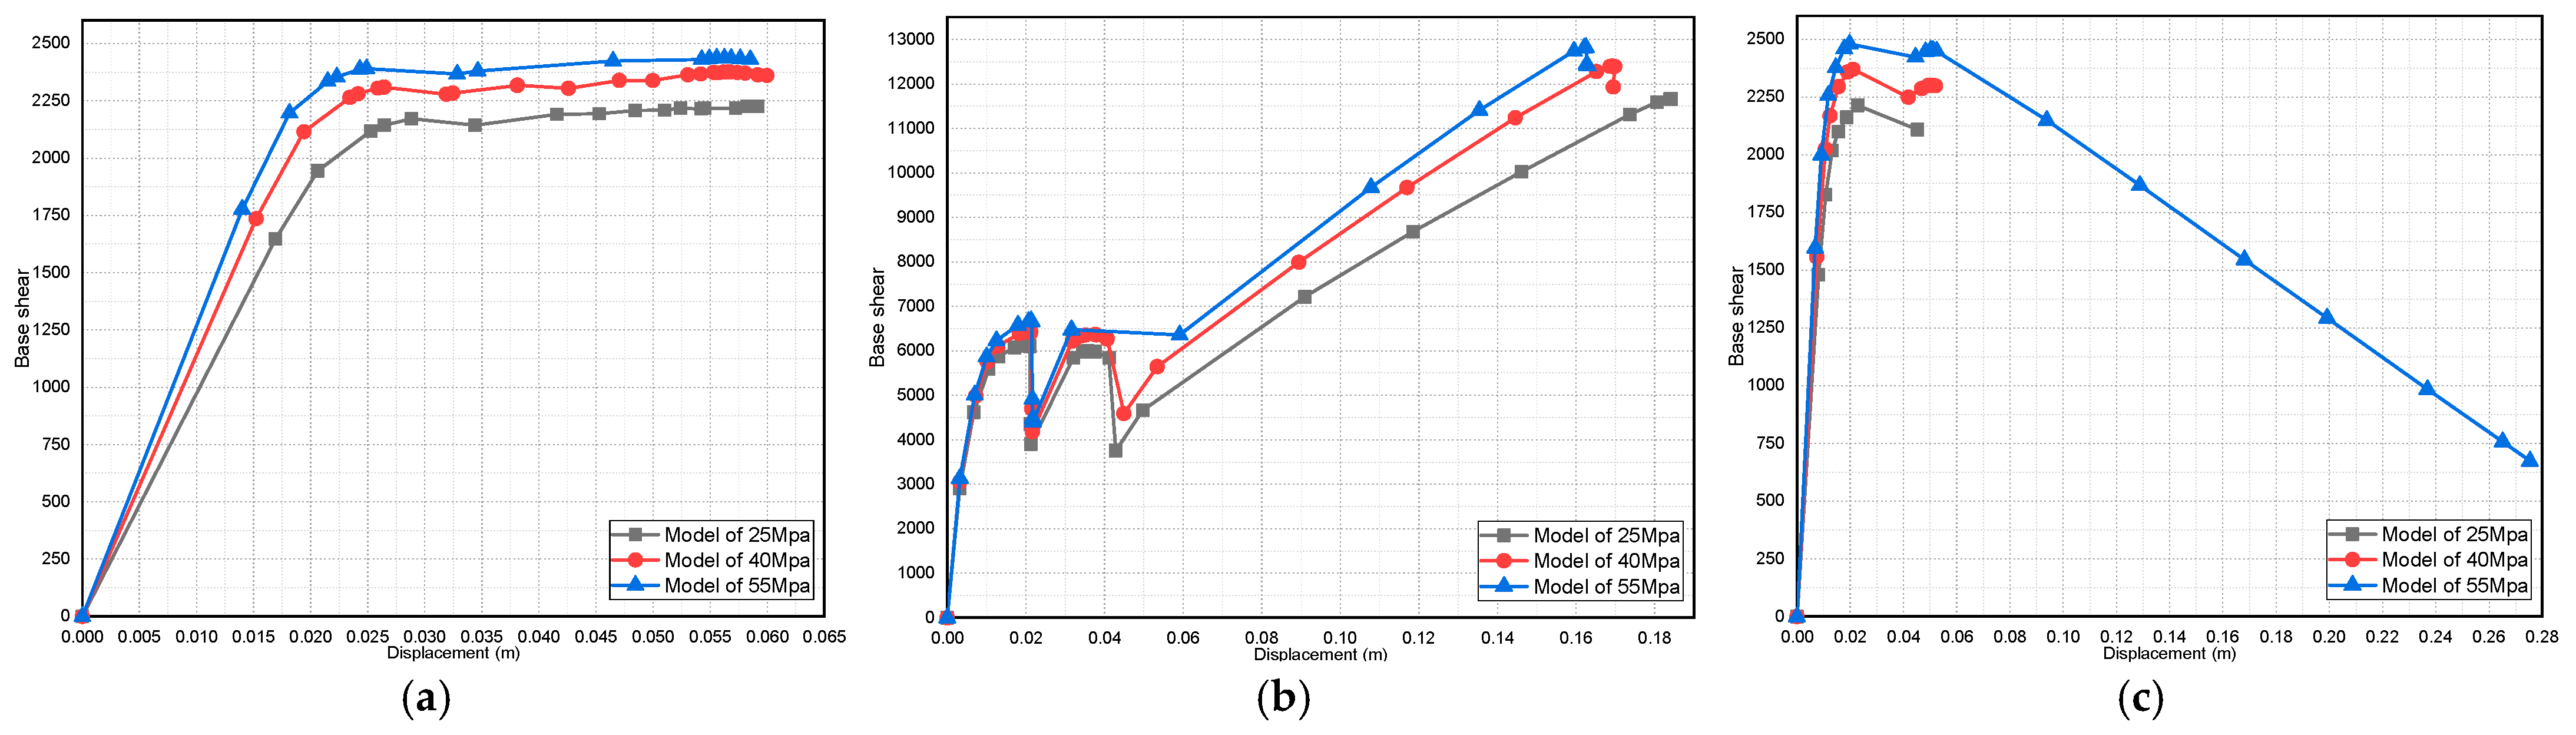
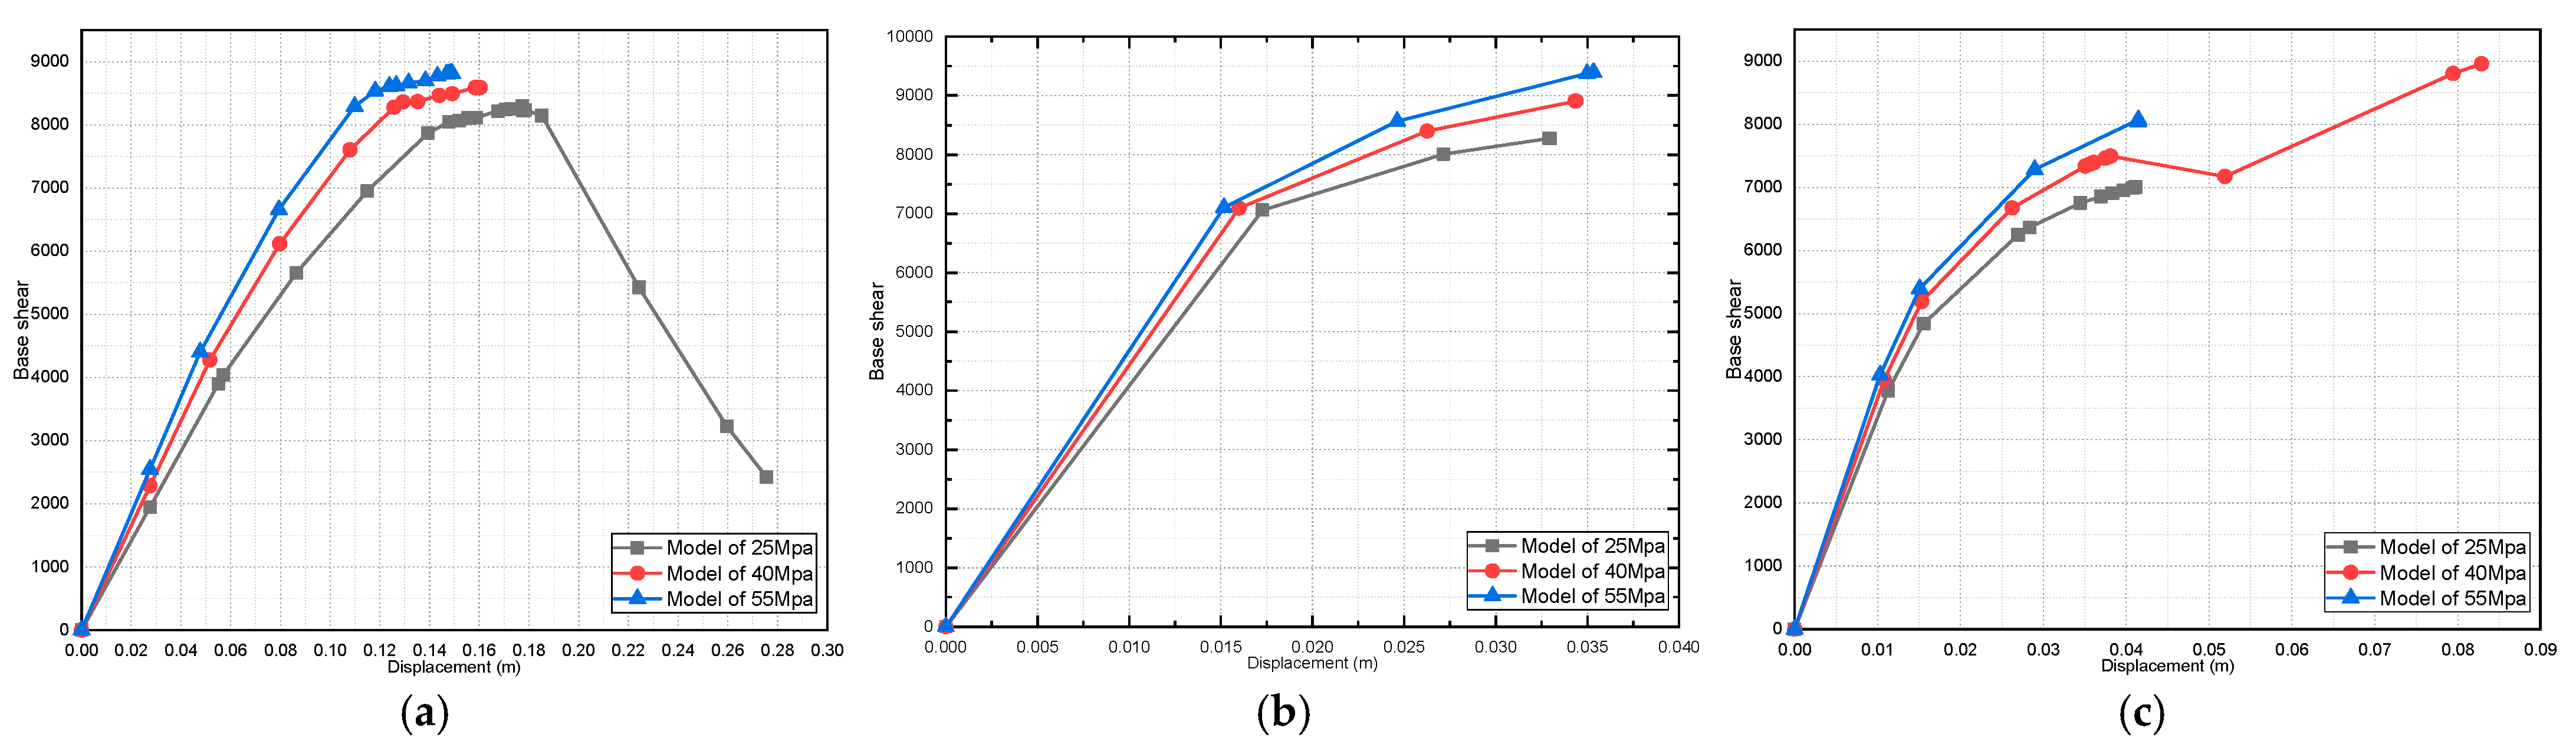
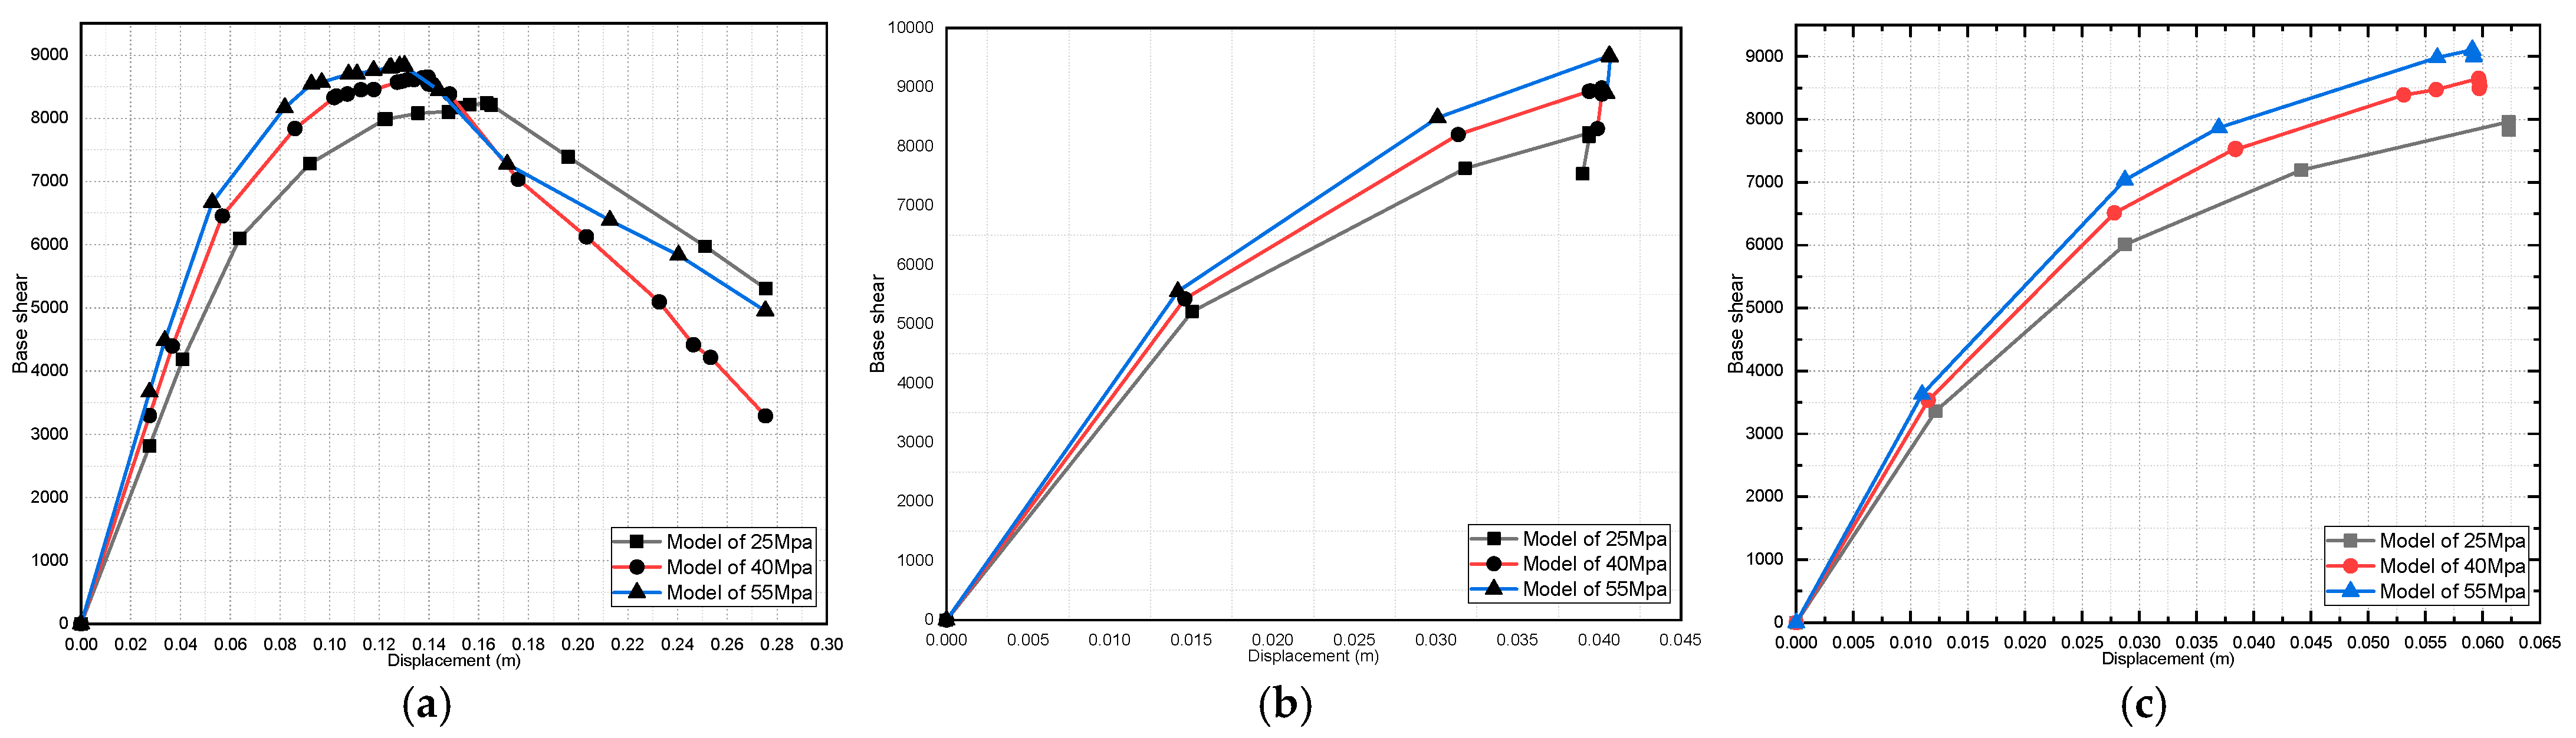
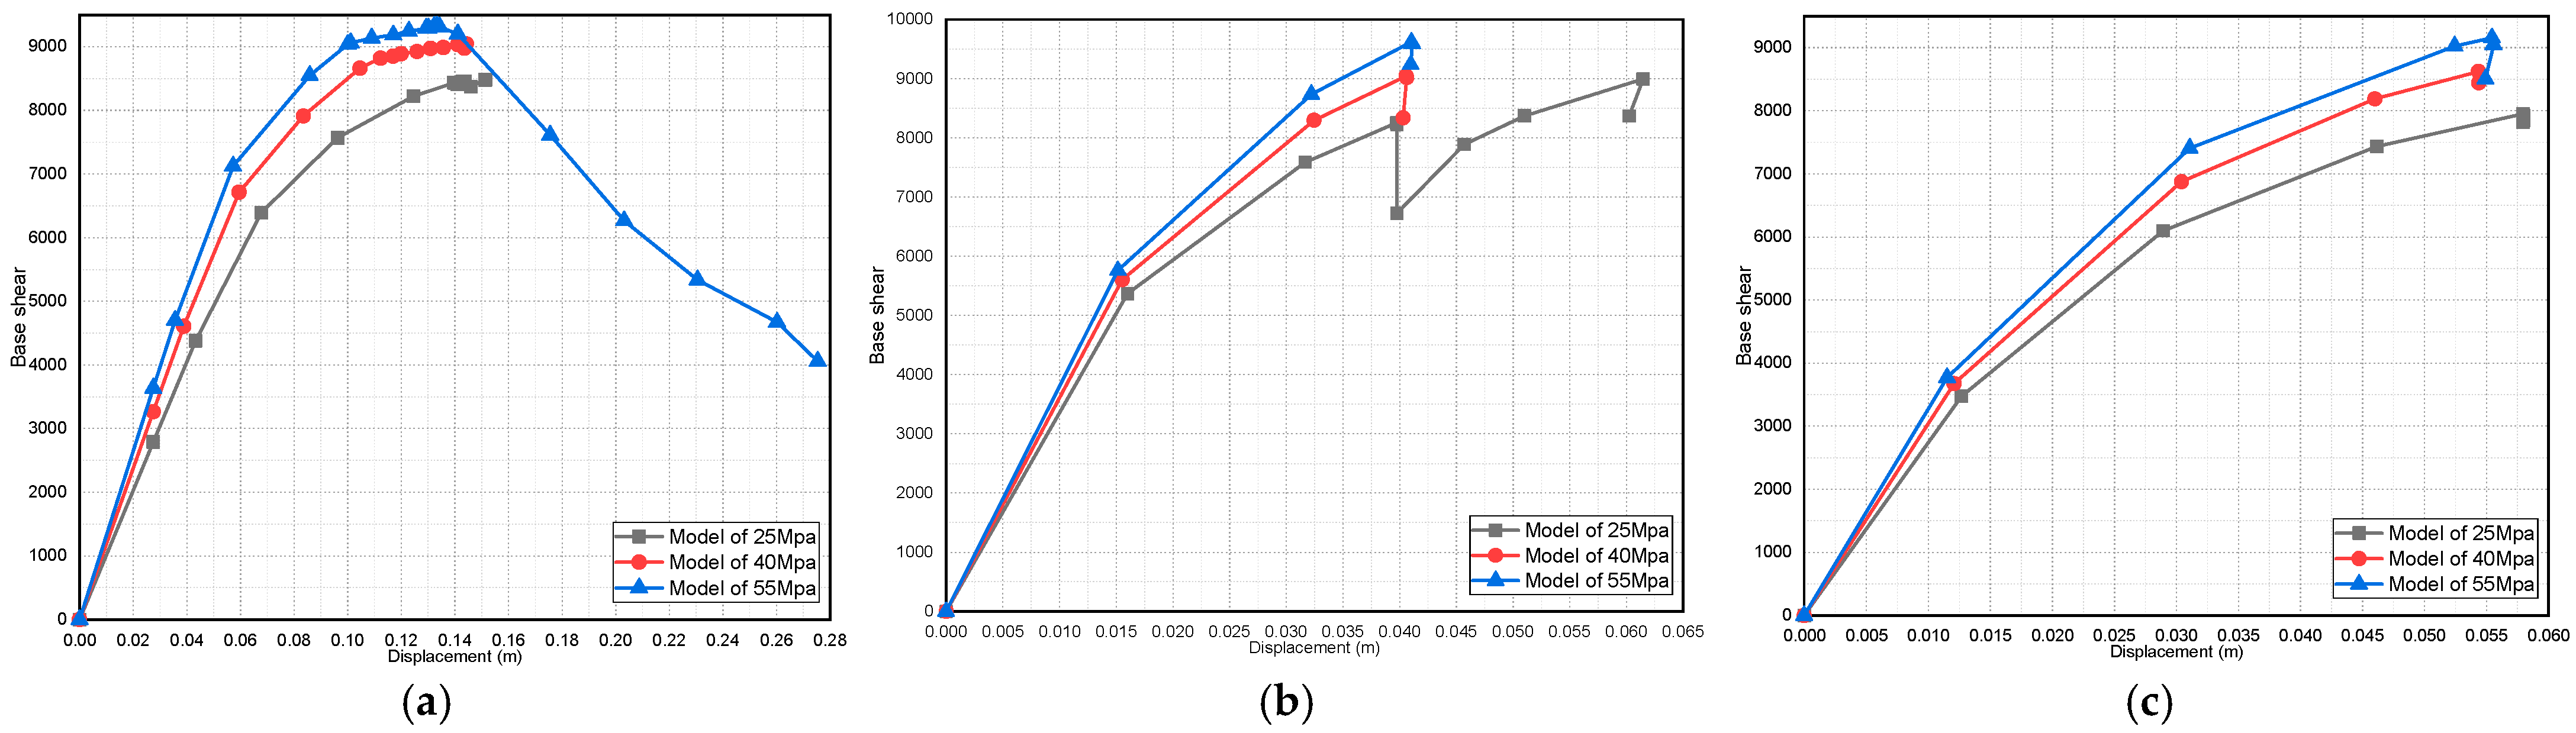
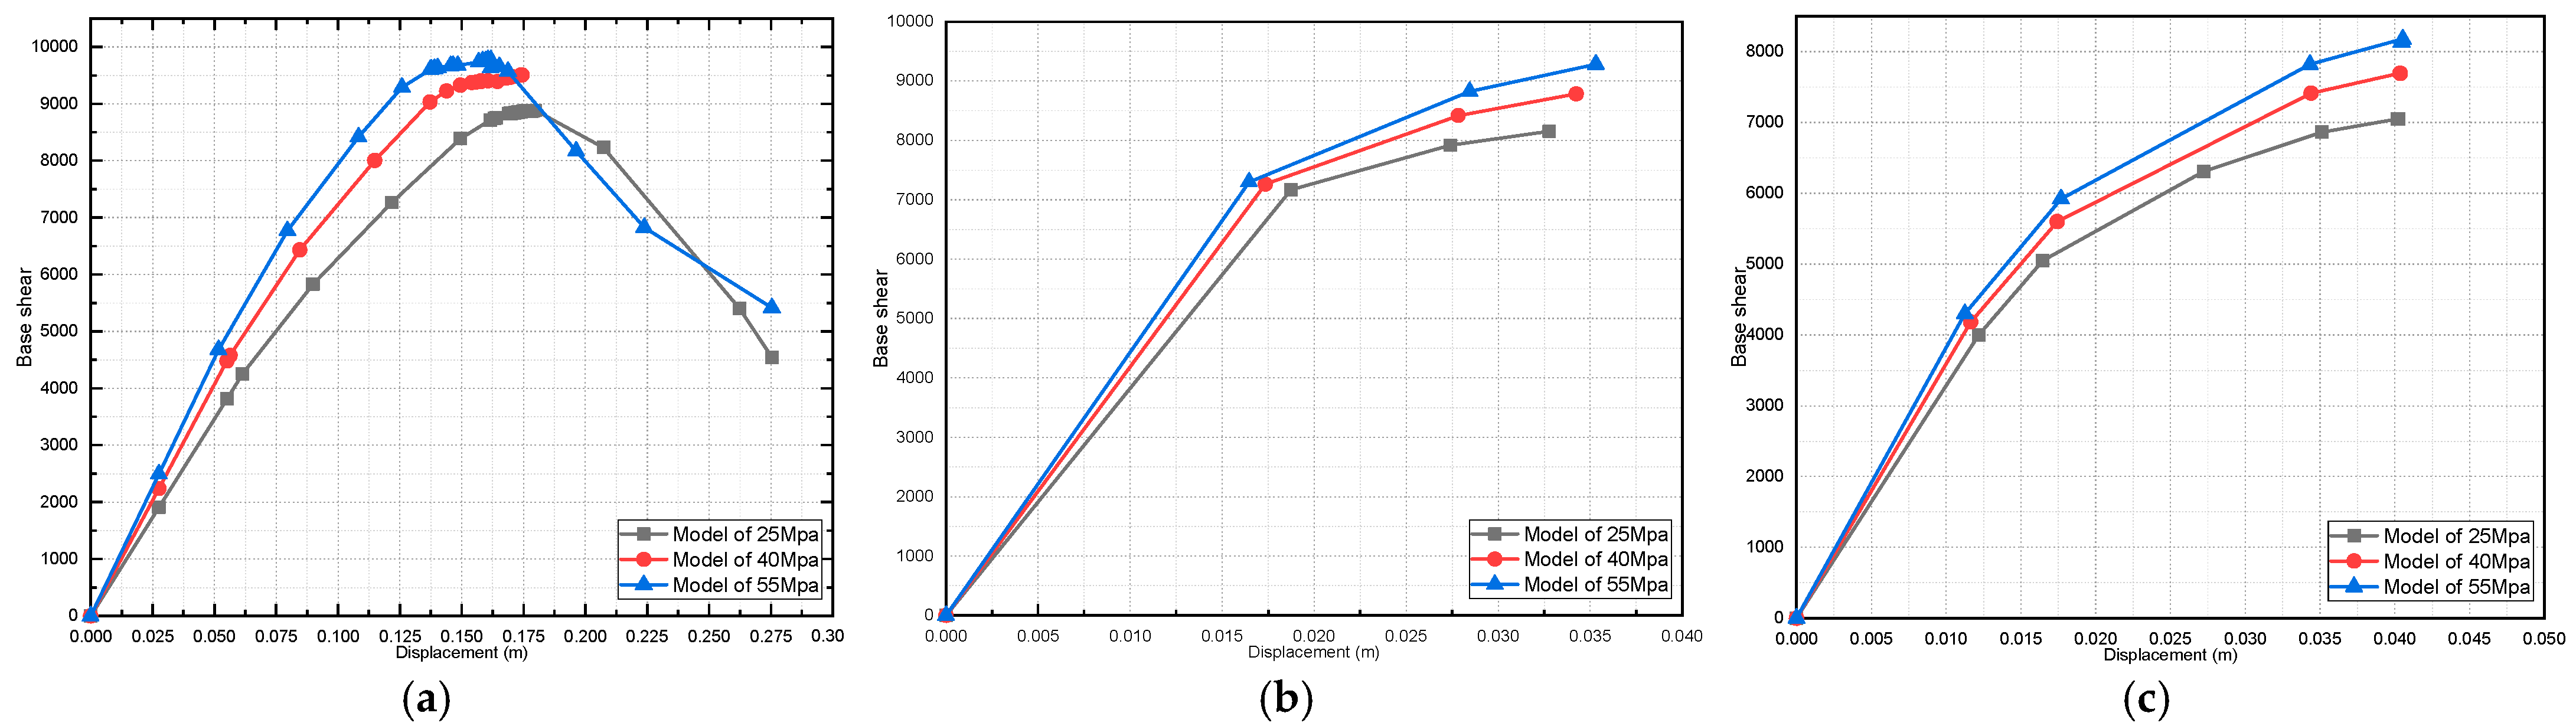
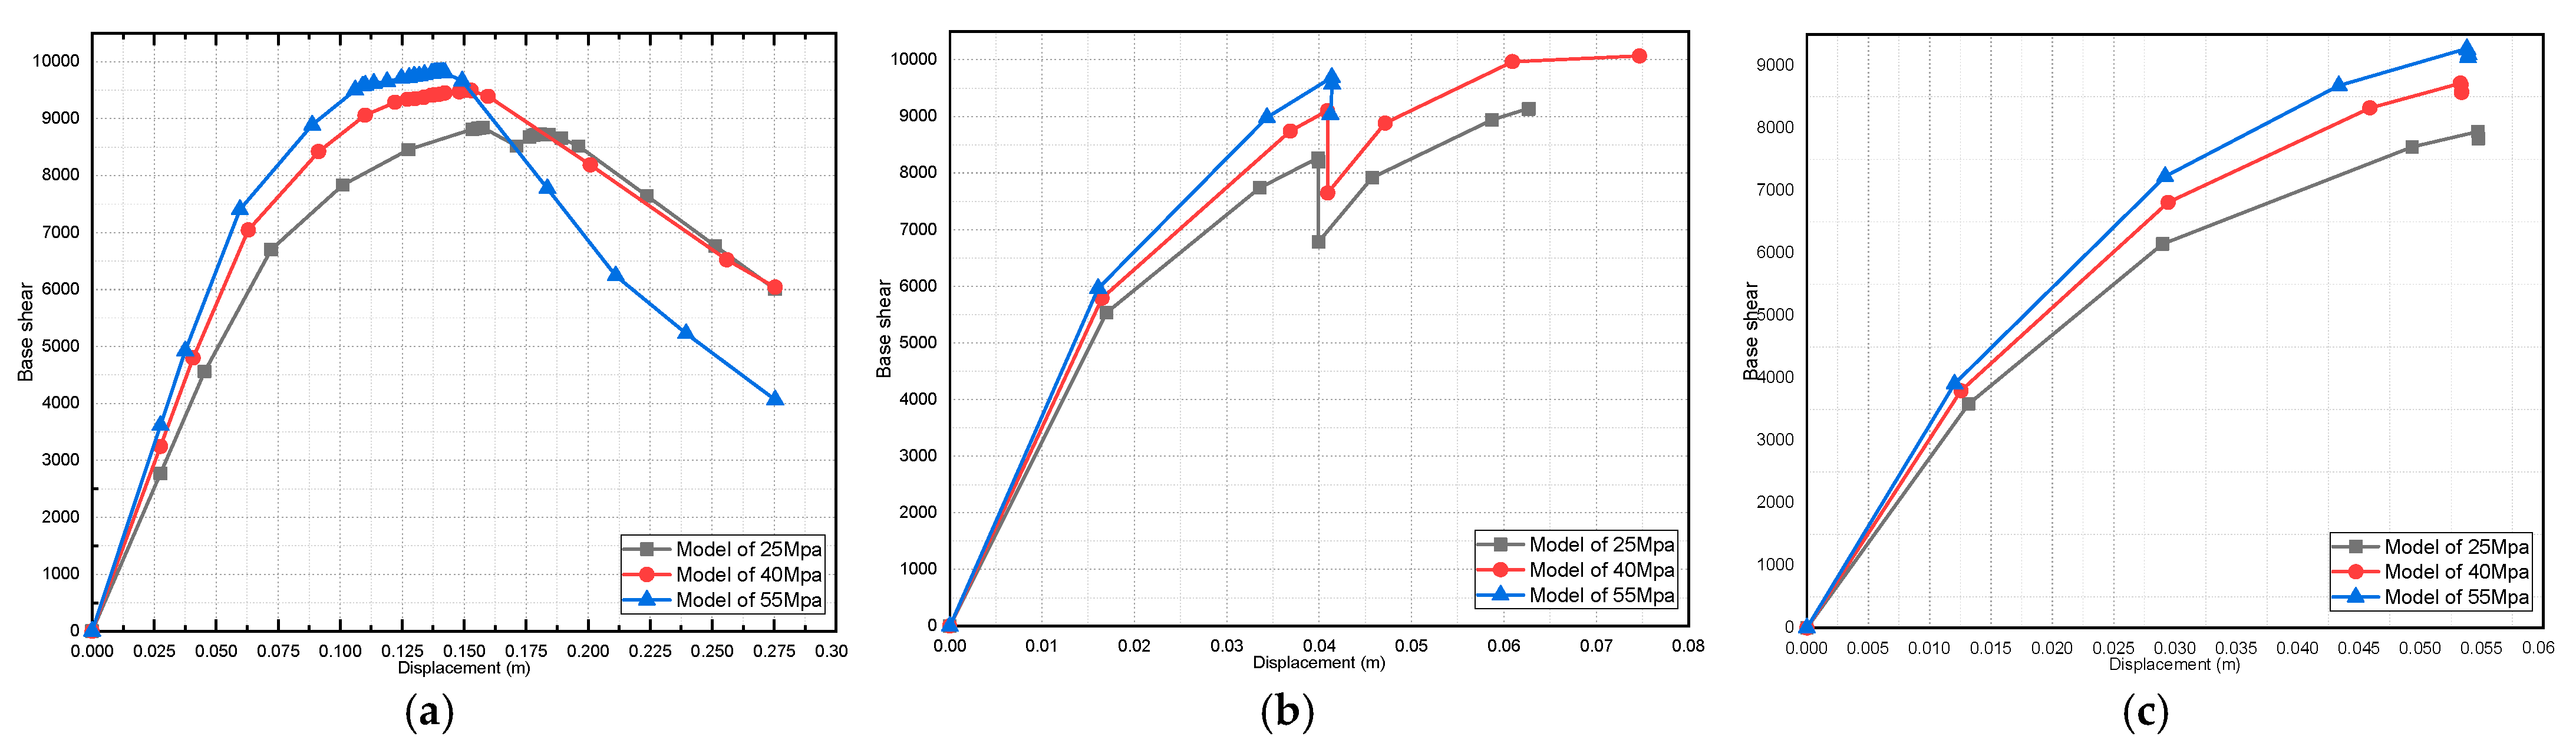
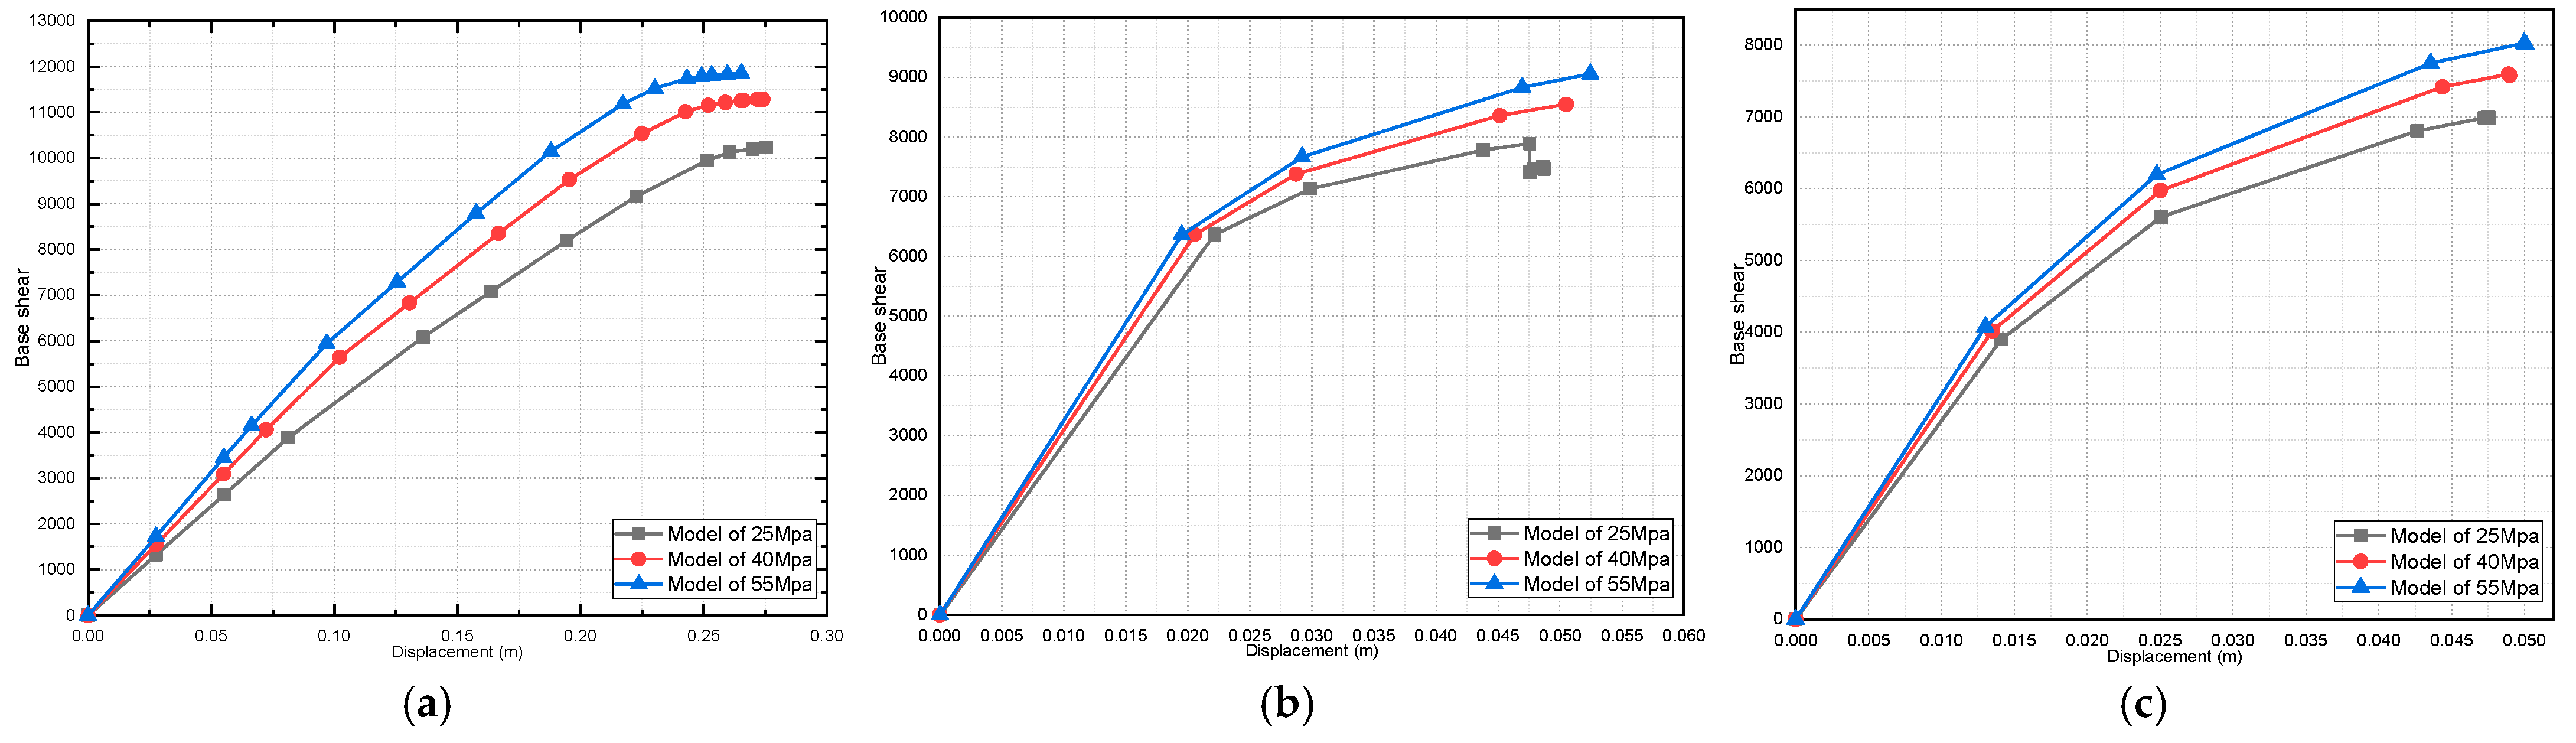
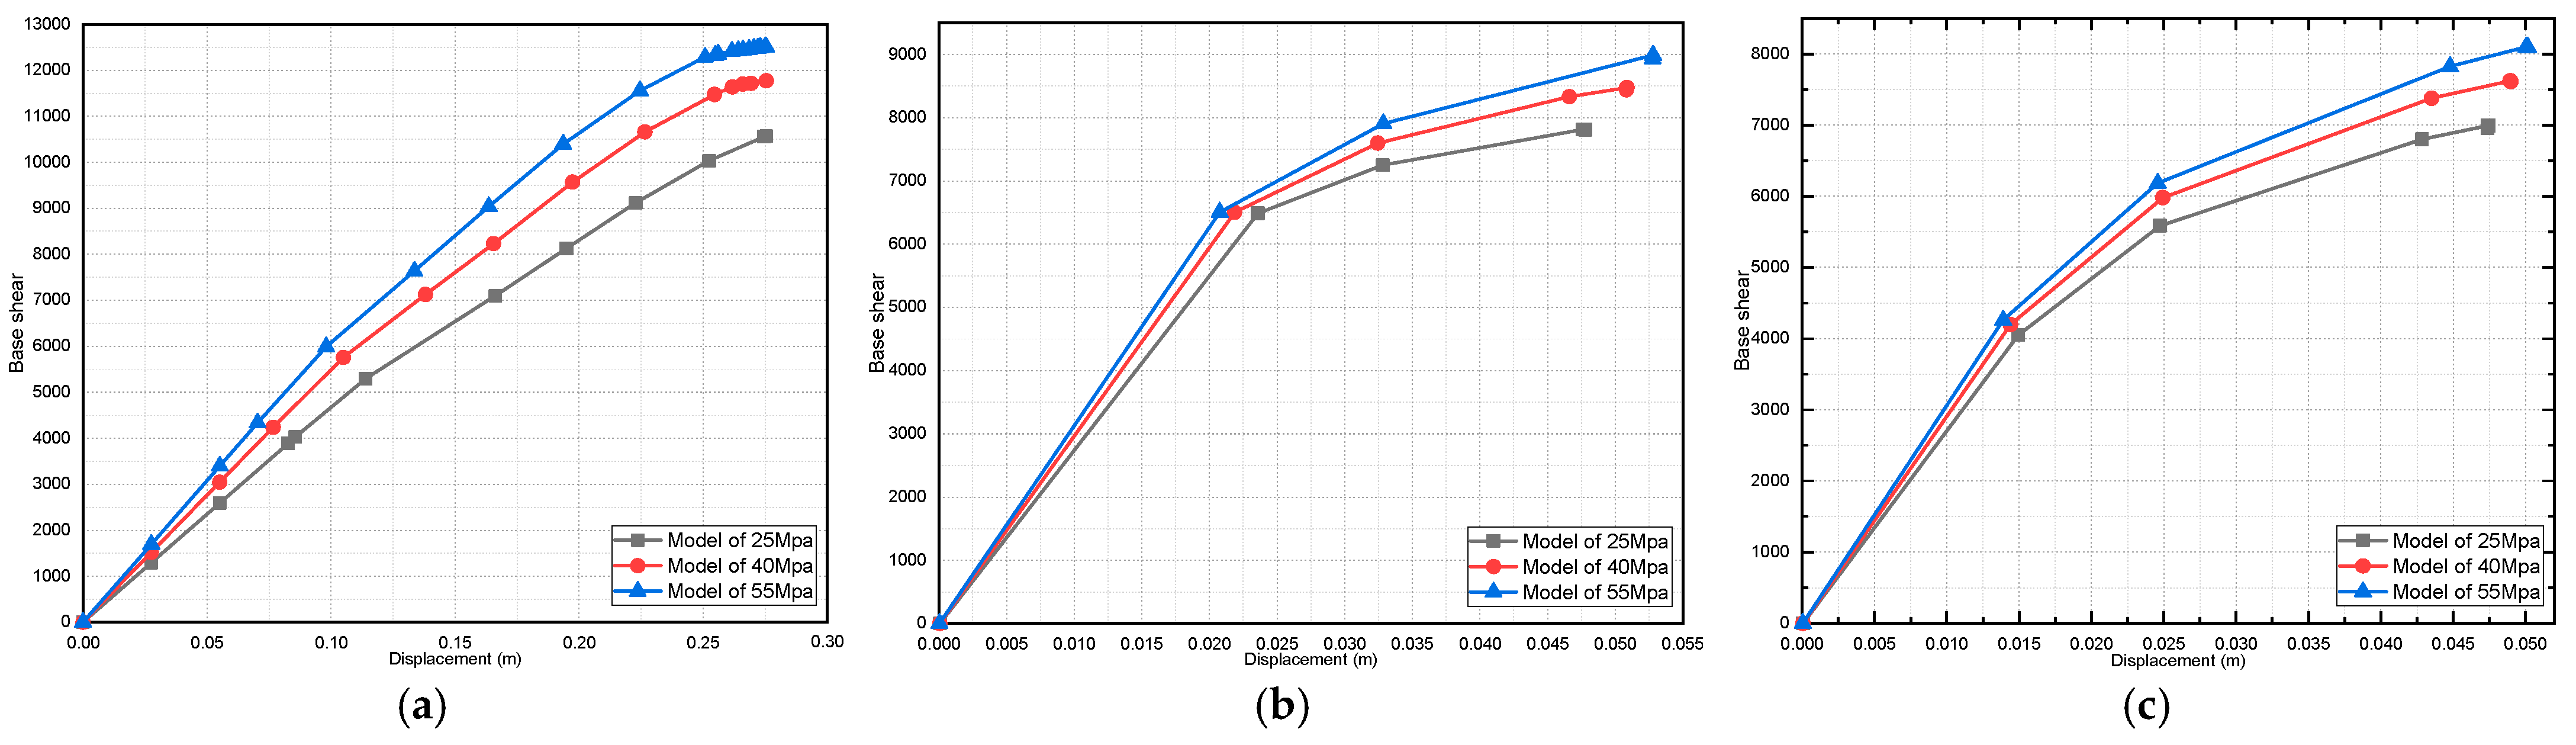
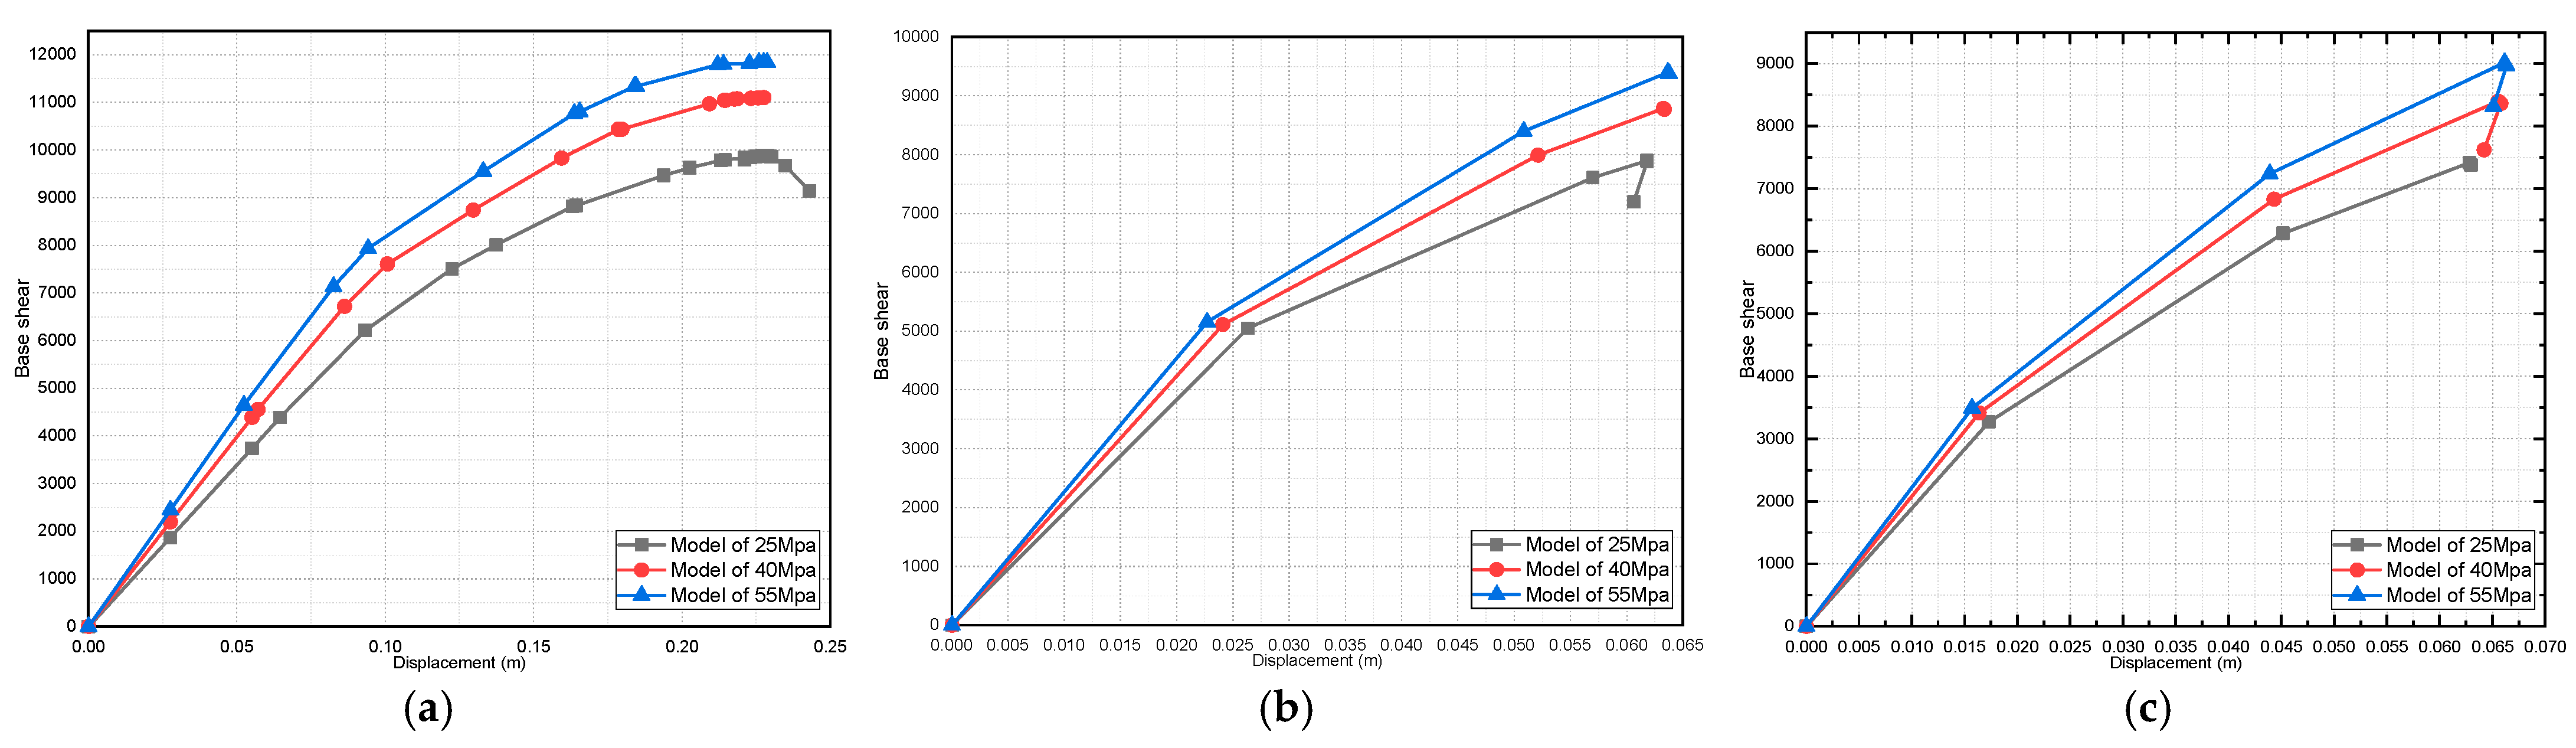
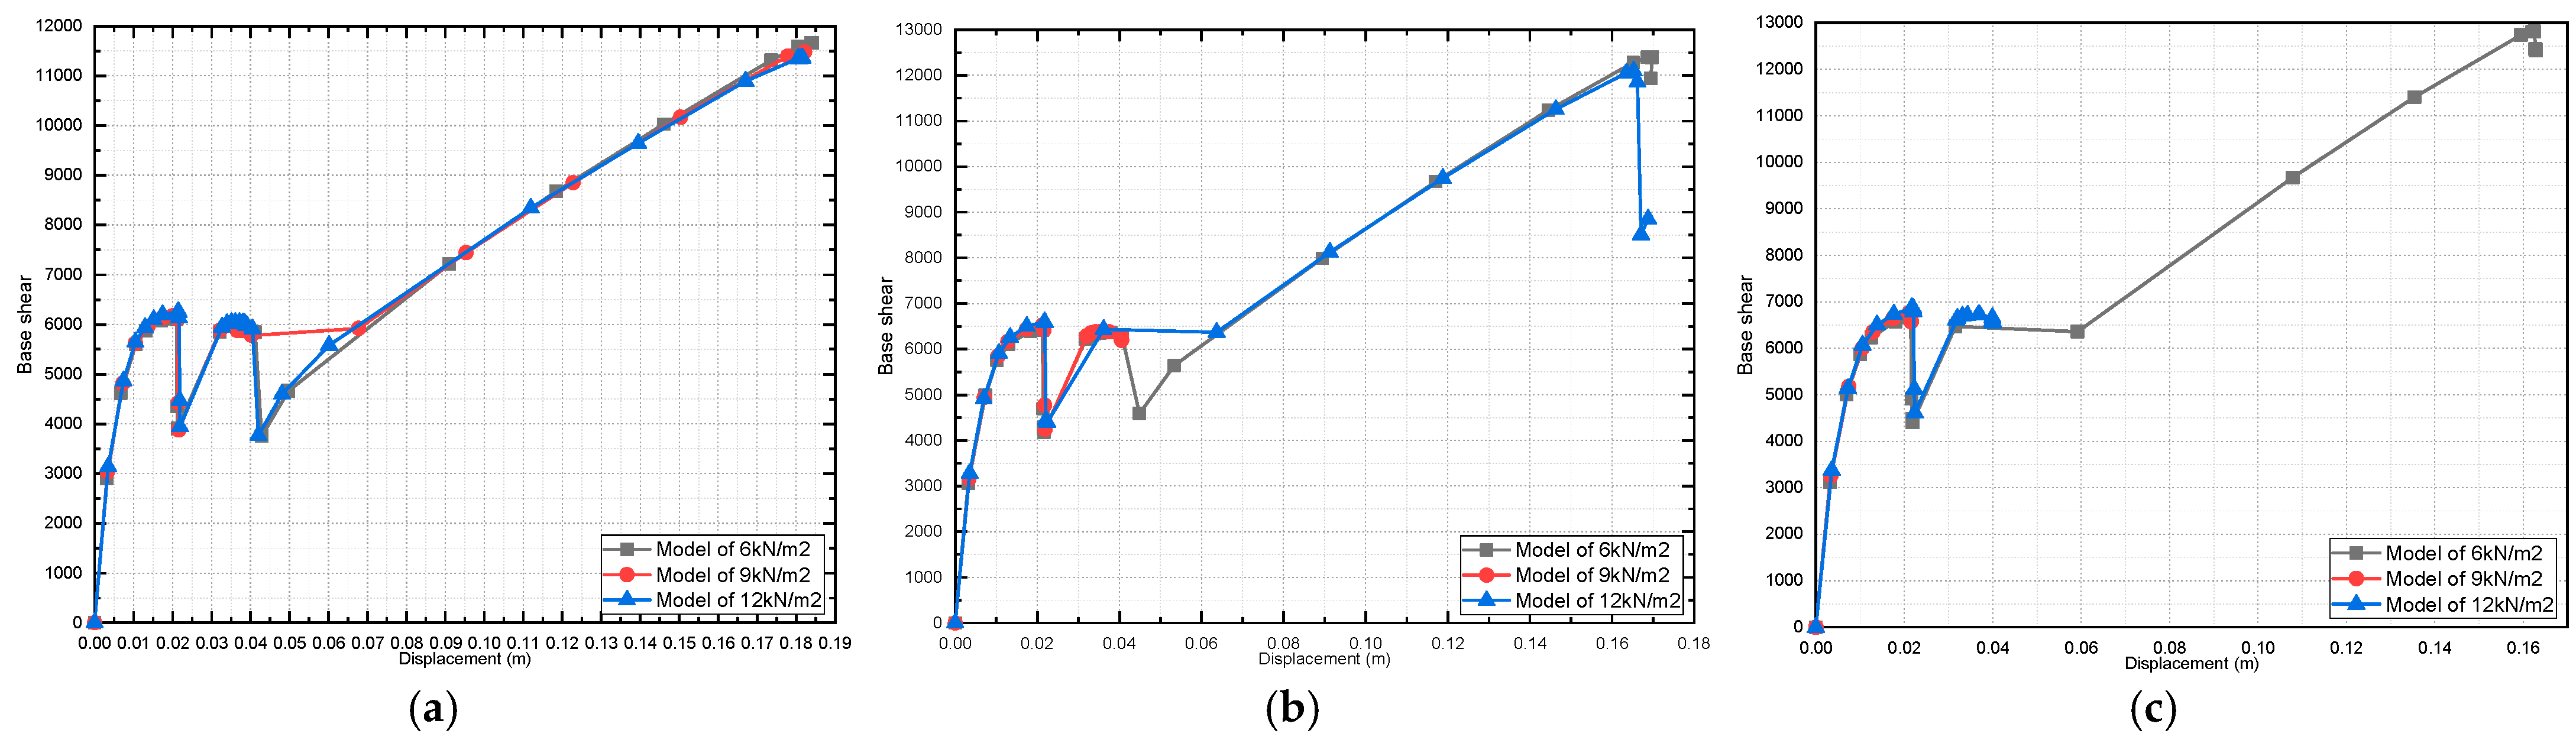
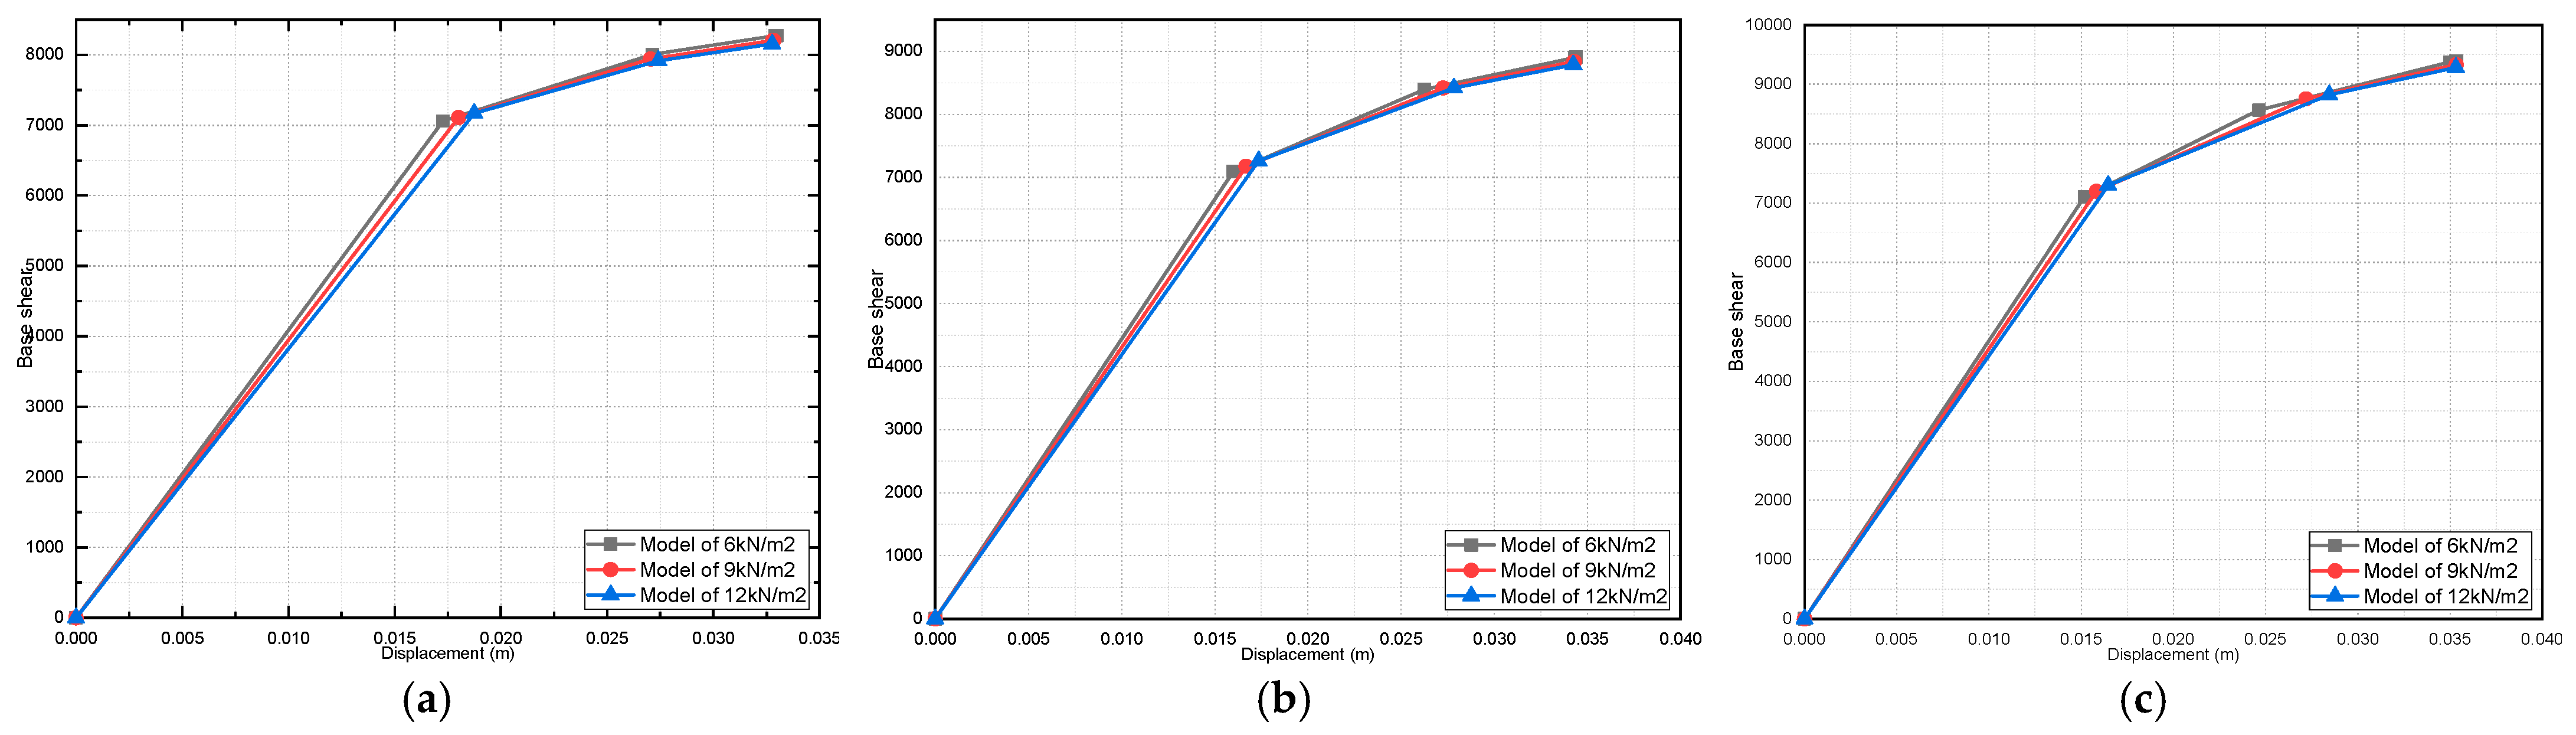
4.2. Effect of Variation in Concrete Compressive Strength on the Pushover Curve

Figure 14, Figure 15, Figure 16, Figure 17, Figure 18, Figure 19, Figure 20, Figure 21, Figure 22, Figure 23, Figure 24, Figure 25, Figure 26, Figure 27, Figure 28, Figure 29, Figure 30 and Figure 31 show the effect of changing the concrete compressive strength on the pushover curve by fixing the value of the dead load each time in addition to what was presented previously throughout the time period, which clarified the importance of modeling masonry infill walls on the seismic response of the building. It can be said that the increase in the values of the concrete compressive strength contributes to the increase in the values of the base shear of the building. Therefore, the values of the initial stiffness increase, and vice versa. On the other hand, increasing the concrete compressive strength values helps to reduce the period values. These observations can be recorded in all models analyzed, either in the x direction or in the y direction.
On the other hand, it can be seen that the deformations recorded in the models, whether fully or partially infilled, obtained lower values than the bare frame models. This was mainly due to the presence of the masonry infill walls, which considerably reduced the deformation values.

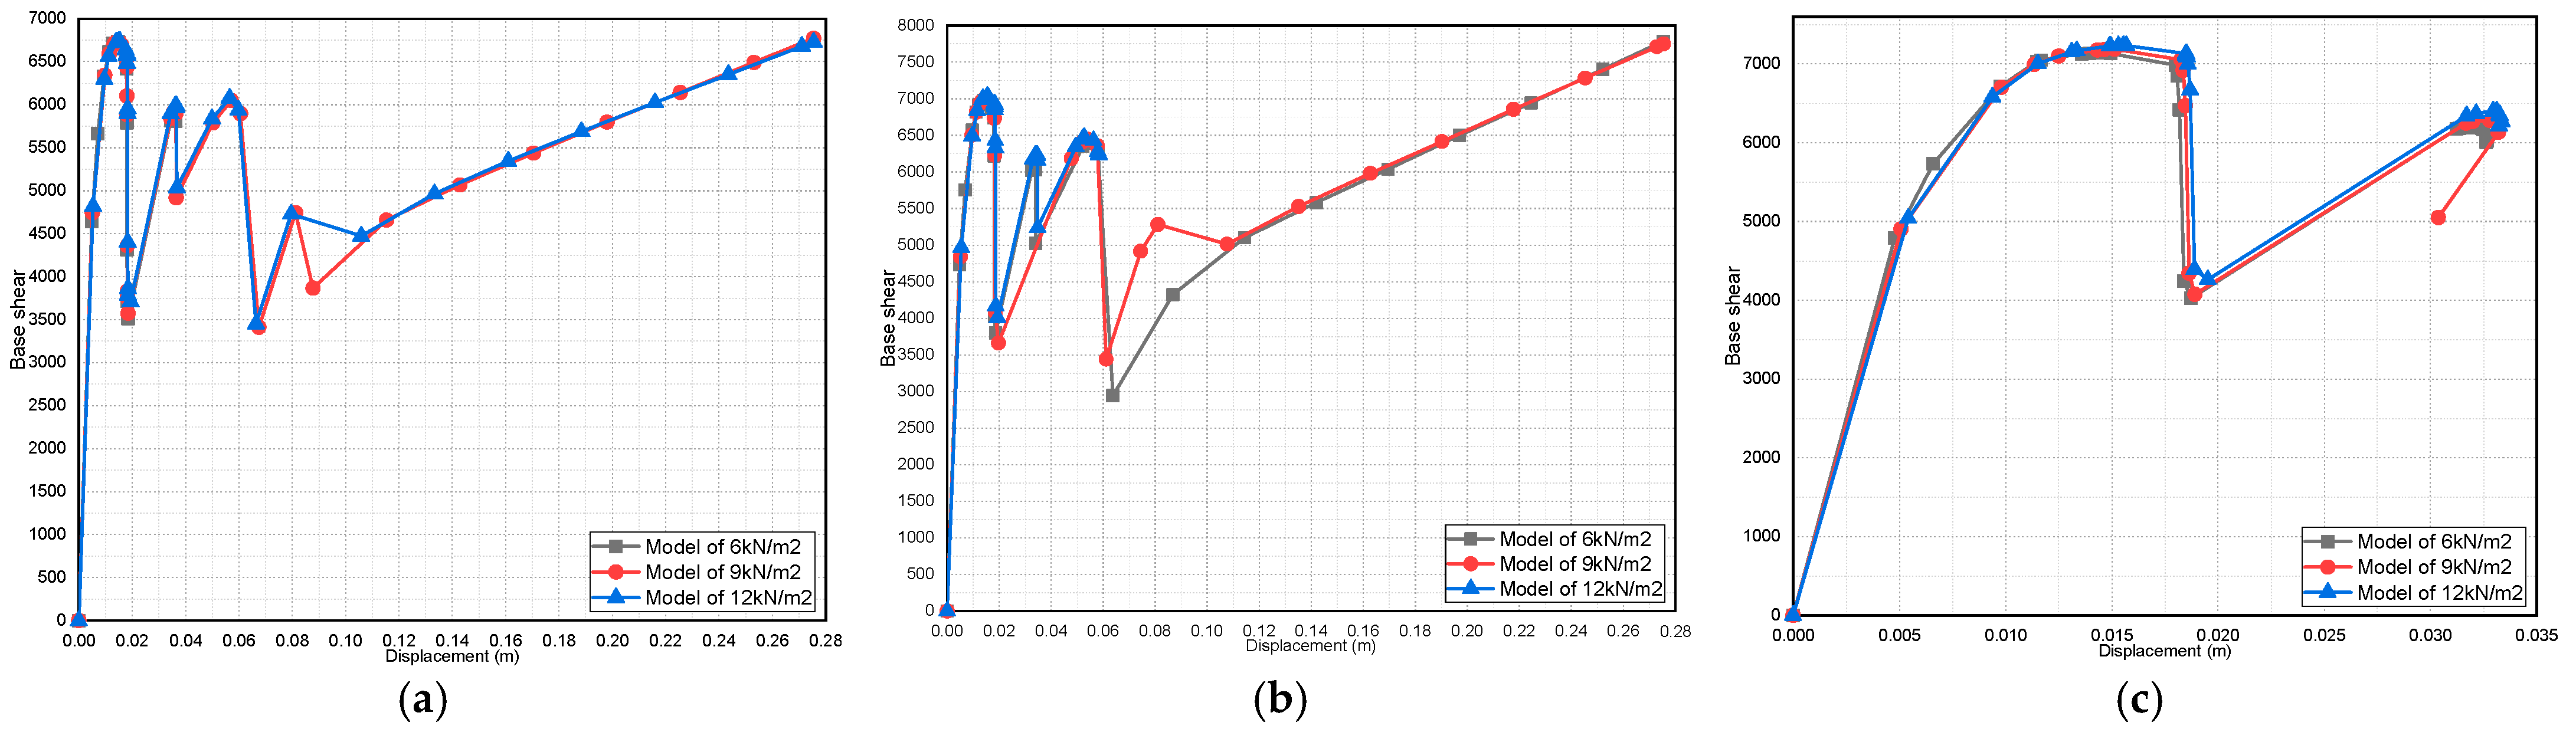
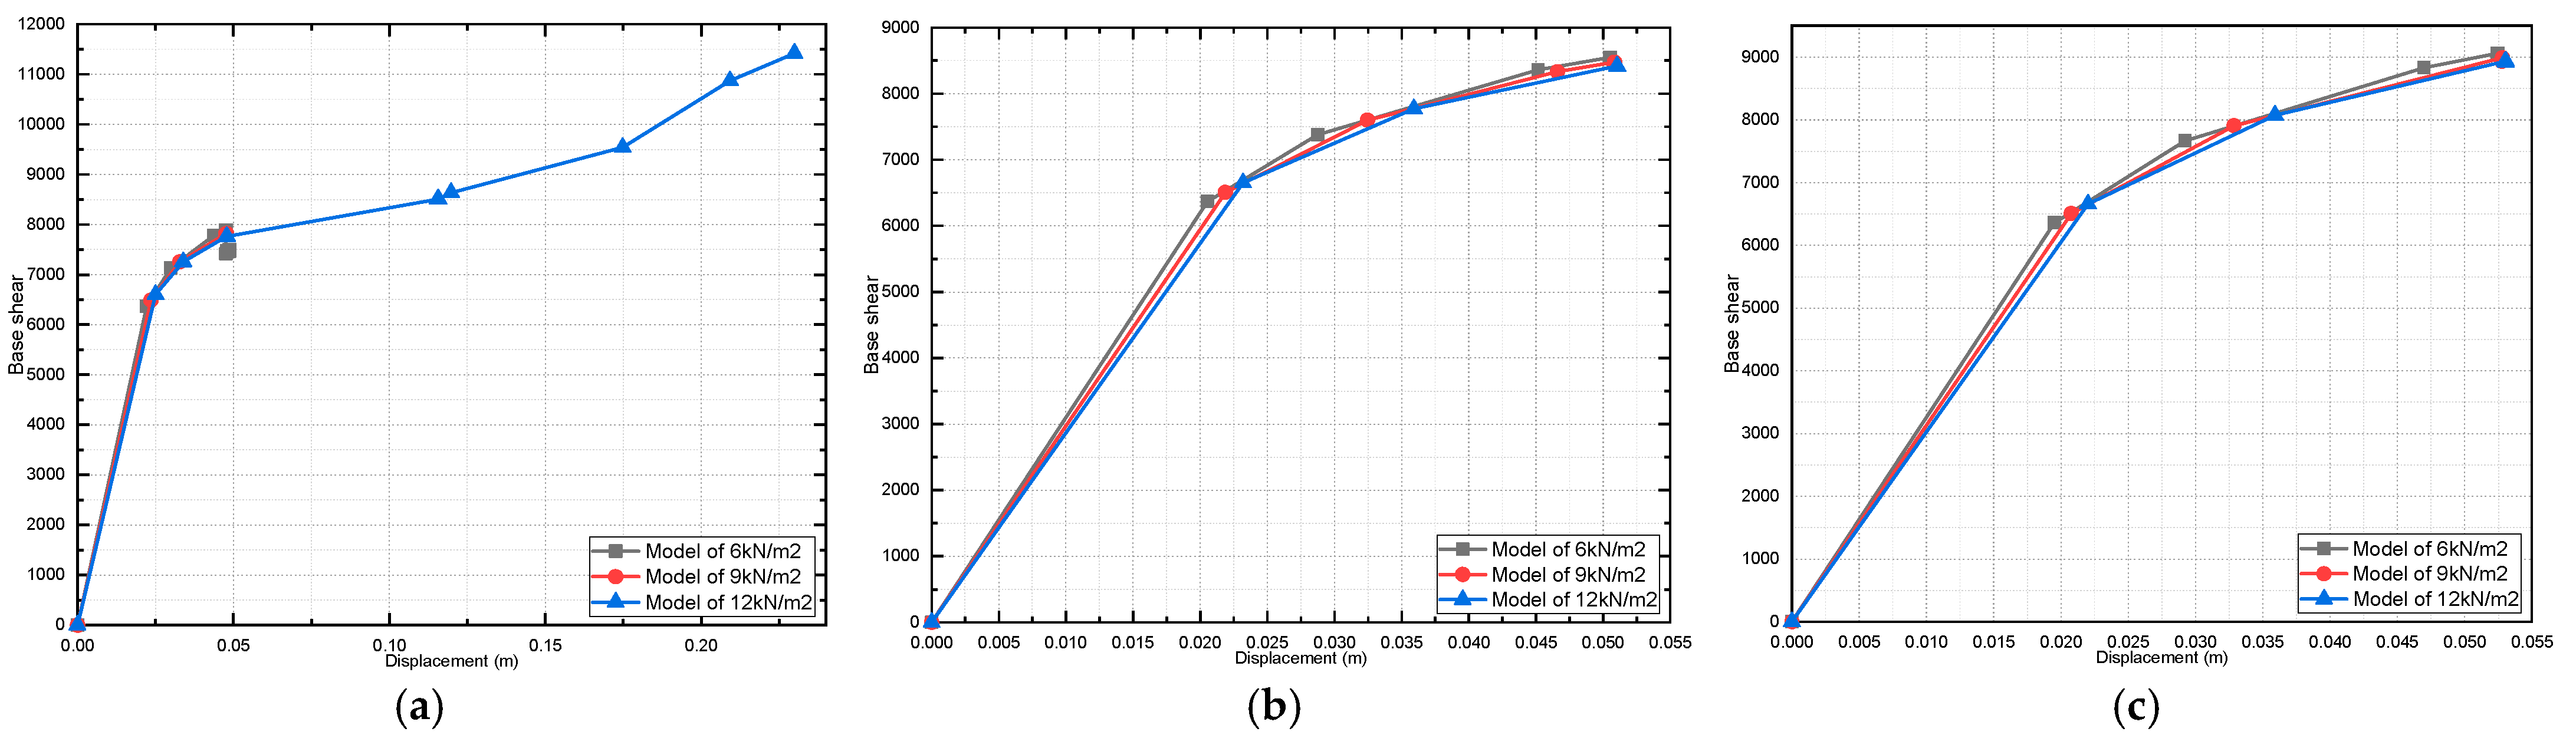
4.3. Effect of Dead-Load Variation on Building Response

Analyzing the curves shown in Figure 32, Figure 33, Figure 34, Figure 35, Figure 36 and Figure 37, which only represent the fully infilled models, it can be said that varying the values of the dead load while fixing the value of the concrete compressive strength in each case did not significantly affect the pushover curve. This is mainly due to the considered stiffness, which was added by the presence of masonry infill walls through their direct modeling. On the other hand, it is possible to notice a difference in the deformations between dead loads of 6 and 12 kN/m2, particularly when the concrete compressive strength is estimated at 25 MPa.
In general, it can be said that the base shear and the strain associated with it were not significantly affected. As a result, the issue of varying the dead-load values while fixing the concrete compressive strength value cannot be invoked to determine any change in the pushover curve. Irrespective of the results recorded through the mentioned figures, the modeling of the masonry infill walls increased the stiffness values of the analyzed models and decreased the time-period values compared to the bare frame models.

5. Conclusions

Direct modeling of masonry infill walls can reduce time periods. This modeling can provide greater rigidity to the building.
Neglecting the modeling of masonry infill walls can cause the building to lose additional stiffness and resistance, which can save such a building in the case of, especially, moderate earthquakes, because of the quasi-fragile behavior of masonry infill walls compared to the ductile behavior of the porticos surrounding these walls.
The variation of the concrete compressive strength contributes to increasing the values of the base shear of the building and decreases the time-period values. The variation of the values of the dead load did not significantly affect the pushover curve.
In any case, it can be said that the direct modeling of the masonry infill walls represents at least, a real model that is similar to the executed building.
We performed a nonlinear analysis of seven models of a reinforced concrete building infilled with hollow brick walls by direct modeling of the masonry infill walls to study the building collapse scenario, from which we can deduce the following points:
-
The time-period values showed how much the models were affected by the presence of masonry infill walls;
-
For the pushover curve of all the studied models, it was found that the fully infilled models obtained the maximum value of the base shear;
-
It was found that the initial stiffness values increased in the presence of masonry infill walls.
Summarizing the results and the analyses discussed above, we can say that direct modeling of the masonry infill walls in reinforced concrete buildings infilled with hollow brick very clearly affects the seismic response of this type of building.
Therefore, ignoring of the masonry infill walls can lead to a misjudgment of the seismic behavior of the building. Therefore, designers needed to accurately include these walls to accurately assess the seismic response of the building.
In the future, more research is needed to provide a numerical simulation that works on the modeling of all wall components (blocks, mortars, or the interaction of the wall with the surrounding frame). In this way, a better representation of the wall can be obtained.

Author Contributions

Methodology, A.N.; Software, A.N.; Validation, S.M.E.-A.B.; Formal analysis, S.M.E.-A.B.; Investigation, A.N.; Data curation, A.N.; Writing—original draft, A.N.; Writing—review and editing, S.M.E.-A.B.; Visualization, M.I.E.T.H.; Supervision, S.M.E.-A.B. All authors have read and agreed to the published version of the manuscript.

Funding

This research received no external funding.

Data Availability Statement

Data available on request due to restrictions privacy.

Acknowledgments

I would like to thank Benanane Abdelkader from University of Mostaganem and Humberto from University of Porto for their precious help to achieve my PhD. I would like to thank also my dear parents and my family for all that they do.

Conflicts of Interest

The authors declare no conflict of interest.

References

  1. Nicoletti, V.; Arezzo, D.; Carbonari, S.; Gara, F. Vibration-Based Tests and Results for the Evaluation of Infill Masonry Walls Influence on the Dynamic Behaviour of Buildings: A Review. Arch. Comput. Methods Eng. 2022, 29, 3773–3787. [Google Scholar] [CrossRef]
  2. Nicoletti, V.; Arezzo, D.; Carbonari, S.; Gara, F. Expeditious methodology for the estimation of infill masonry wall stiffness through in-situ dynamic tests. Constr. Build. Mater. 2020, 262, 120807. [Google Scholar] [CrossRef]
  3. Alhaddad, M.S.; Siddiqui, N.A.; Abadel, A.A.; Alsayed, S.H.; Al-Salloum, Y.A. Numerical Investigations on the Seismic Behavior of FRP and TRM Upgraded RC Exterior Beam-Column Joints. J. Compos. Constr. 2012, 16, 308–321. [Google Scholar] [CrossRef]
  4. Altheeb, A.; Alshaikh, I.M.H.; Abadel, A.; Nehdi, M.; Alghamdi, H. Effects of Non-Structural Walls on Mitigating the Risk of Progressive Collapse of RC Structures. Lat. Am. J. Solids Struct. 2022, 19, 1–18. [Google Scholar] [CrossRef]
  5. Furtado, A.; Rodrigues, H.; Arêde, A.; Varum, H. A Review of the Performance of Infilled RC Structures in Recent Earthquakes. Appl. Sci. 2021, 11, 5889. [Google Scholar] [CrossRef]
  6. Abdelaziz, M.M.; Gomaa, M.S.; El-ghazaly, H. Effect of Unreinforced Masonry Infill Walls on Seismic Performance of Reinforced Concrete Framed Structures. Open Civ. Eng. J. 2017, 11, 919–931. [Google Scholar] [CrossRef]
  7. Ning, N.; Ma, Z.J.; Zhang, P.; Yu, D.; Wang, J. Influence of masonry infills on seismic response of RC frames under low frequency cyclic load. Eng. Struct. 2019, 183, 70–82. [Google Scholar] [CrossRef]
  8. Dias-Oliveira, J.; Rodrigues, H.; Asteris, P.G.; Varum, H. On the Seismic Behavior of Masonry Infilled Frame Structures. Buildings 2022, 12, 1146. [Google Scholar] [CrossRef]
  9. Barnaure, M.; Ghiţă, A.-M.; Stoica, D.N. Seismic Performance of Masonry—Infilled RC Frames; INCD URBAN-INCERC: Bucharest, Romania, 2016; pp. 229–238. [Google Scholar]
  10. Bahadir, F. Experimental study on three-dimensional reinforced concrete frames subjected to dynamic loading. Structures 2020, 24, 835–850. [Google Scholar] [CrossRef]
  11. Magdi, M.; Mohamed, A.; Gomma, S.; El, H. Seismic evaluation of reinforced concrete structures infilled with masonry infill walls. Asian J. Civ. Eng. 2019, 20, 961–981. [Google Scholar]
  12. Pokhrel, A.; Gautam, D.; Chaulagain, H. Effect of variation on infill masonry walls in the seismic performance of soft story RC building. Aust. J. Struct. Eng. 2018, 20, 1–9. [Google Scholar] [CrossRef]
  13. Khanal, N.; Campus, T.; Wagley, S.; Singh, S.K. Seismic consideration of soft story in rc frame buildings using various. Int. J. Civ. Eng. Technol. 2019, 10, 343–352. [Google Scholar]
  14. Nour, A.; Benanane, A.; Varum, H. Influence of Chained Masonry on the Seismic Response of Reinforced Concrete Buildings. Walailak J. Sci. Technol. 2021, 18, 13194. [Google Scholar] [CrossRef]
  15. Nour, A.; Benanane, A.; Humberto, V. Seismic Behavior of Reinforced Concrete Buildings Using Chained Masonry Walls. Comportamiento Sismico de Edificios de Hormigón Armado con Muros de Mampostería; Revista Facultad de Ingeniería, Universidad de Antioquia: Antioquia, Colombia, 2023; pp. 102–112. [Google Scholar]
  16. Jin, H. Comparative Study on the Effects of Infill Walls on Reinforced Concrete Frame Structures. Appl. Mech. Mater. 2015, 730, 81–84. [Google Scholar] [CrossRef]
  17. Mansouri, A.; Marefat, M.S.; Khanmohammadi, M. Experimental evaluation of seismic performance of low-shear strength masonry in fi lls with openings in reinforced concrete frames with de fi cient seismic details. Struct. Des. Tall Spec. Build. 2014, 1210, 1190–1210. [Google Scholar] [CrossRef]
  18. Eren, N.; Brunesi, E.; Nascimbene, R. Influence of masonry infills on the progressive collapse resistance of reinforced concrete framed buildings. Eng. Struct. 2019, 178, 375–394. [Google Scholar] [CrossRef]
  19. Chikka, C.; Javaregowda, K.S.; Prasad, M. Seismic Analysis on bare frame, infilled frame and soft story RC framed buildings. IRJET 2017, 4, 1899–1905. [Google Scholar]
  20. Moretti, M.L.; Papatheocharis, T.; Perdikaris, P.C. Design of Reinforced Concrete Infilled Frames. J. Struct. Eng. 2014, 140, 04014062. [Google Scholar] [CrossRef]
  21. Ghiassi, B.; Soltani, M.; Tasnimi, A.A. Seismic Evaluation of Masonry Structures Strengthened with Reinforced Concrete Layers. J. Struct. Eng. 2012, 138, 729–743. [Google Scholar] [CrossRef] [Green Version]
  22. Fardis, M.N.; Carvalho, E.C.; Fajfar, P.; Pecker, A. Seismic Design of Concrete Buildings to Eurocode 8; CRC Press: Boca Raton, FL, USA, 2015. [Google Scholar]
  23. EN 1998–1:2004; Eurocode 8: Design of Structures for Earthquake Resistance—Part 1: General Rules, Seismic Actions and Rules for Buildings. European Committee for Standardization: Brussels, Belgium, 2004.
  24. Ministry of Housing of Algeria. Reglement parasismique Algerien—RPA99—Version 2003; DTR B C 2–48; Ministry of Housing of Algeria: Sidi M’Hamed, Algeria, 2003.
  25. Nicola, T.; Leandro, C.; Guido, C.; Enrico, S. Masonry infilled frame structures: State-of-the-art review of numerical modelling. Earthq. Struct. 2015, 8, 733–759. [Google Scholar] [CrossRef]
  26. Aref, A.J.; Dolatshahi, K.M. A three-dimensional cyclic meso-scale numerical procedure for simulation of unreinforced masonry structures. Comput. Struct. 2013, 120, 9–23. [Google Scholar] [CrossRef]
  27. Macorini, L.; Izzuddin, B.A. A non-linear interface element for 3D mesoscale analysis of brick-masonry structures. Int. J. Numer. Methods Eng. 2010, 85, 1584–1608. [Google Scholar] [CrossRef] [Green Version]
  28. Soulis, V.J. Micro and Macro-modeling Techniques for the Simulation of the Masonry Infilled R/C Frames under Earthquake Type Loading. Eur. J. Eng. Technol. Res. 2018, 3, 16–25. [Google Scholar]
  29. Farshidnia, P. Behavior and analysis of masonry-infilled reinforced concrete frames subjected to lateral load. WIT Trans. Built Environ. 2009, 104, 13–23. [Google Scholar]
  30. Baloevic, G.; Radnic, J.; Matesan, D.; Grgic, N.; Banovic, I. Comparison of Developed Numerical Macro and Micro Masonry Models for Static and Dynamic Analysis of Masonry-infilled Steel Frames. Lat. Am. J. Solids. Struct. 2016, 13, 2251–2265. [Google Scholar] [CrossRef] [Green Version]
  31. Asteris, P.G. Finite element micro-modeling of infilled frames. Electron. J. Struct. Eng. 2008, 8, 1–11. [Google Scholar] [CrossRef]
  32. Anić, F.; Penava, D.; Sarhosis, V.; Abrahamczyk, L. Development and Calibration of a 3D Micromodel for Evaluation of Masonry Infilled RC Frame Structural Vulnerability to Earthquakes. Geosciences 2021, 11, 468. [Google Scholar] [CrossRef]
  33. Wilson, E.L. CSI Analysis Reference Manual for SAP 2000, ETABS, SAFE and CSI Bridge; Computers and Structure, Inc.: Berkeley, CA, USA, 2015. [Google Scholar]
  34. Ministry of Housing of Algeria. Règles de conception et de calcul des maçonneries; DTR C2-45; Ministry of Housing of Algeria: Sidi M’Hamed, Algeria, 1996.
  35. Seismosoft Ltd. SeismoStruct SeismoStruct User Manual; Seismosoft Ltd.: Pavia, Italy, 2018; p. 325. [Google Scholar]
  36. Elghazouli, A. (Ed.) Seismic Design of Buildings to Eurocode 8, 2nd ed.; CRC Press: Boca Raton, USA, 2016. [Google Scholar] [CrossRef]
  37. FEMA. Evaluation of Earthquake Damaged Concrete and Masonry Wall Buildings: Basic Procedures Manual; FEMA: Washington, DC, USA, 1998; Volume 306. [Google Scholar]
  38. Terki Hassaine, M.I.E.; Bourdim, S.M.E.A.; Varum, H.; Benanane, A.; Nour, A. Push-over Analysis of Optimized Steel Frames. Eng. Technol. Appl. Sci. Res. 2022, 12, 9720–9725. [Google Scholar] [CrossRef]
Figure 1. Time period: (a) bare frame; (b) fully infilled; and (c) ground soft story.
Buildings 13 01576 g001
Figure 2. Three-story models: (a) bare frame; (b) fully infilled; and (c) ground soft story.
Buildings 13 01576 g002
Figure 3. Six-story models: (a) bare frame; (b) fully infilled; and (c) ground soft story.
Buildings 13 01576 g003
Figure 4. Nine-story models: (a) bare frame; (b) fully infilled; and (c) ground soft story.
Buildings 13 01576 g004
Figure 5. Time period of three-story models for a dead load of 6 kN/m2: (a) 25 MPa; (b) 40 Mpa; and (c) 55 Mpa.
Buildings 13 01576 g005
Figure 6. Time period of three-story models for a dead load of 9 kN/m2: (a) 25 MPa; (b) 40 MPa; and (c) 55 MPa.
Buildings 13 01576 g006
Figure 7. Time period of three-story models for a dead load of 12 kN/m2: (a) 25 MPa; (b) 40 MPa; and (c) 55 MPa.
Buildings 13 01576 g007
Figure 8. Time period of six-story models for a dead load of 6 kN/m2: (a) 25 MPa; (b) 40 MPa; and (c) 55 MPa.
Buildings 13 01576 g008
Figure 9. Time period of six-story models the for a dead load of 9 kN/m2: (a) 25 MPa; (b) 40 MPa; and (c) 55 MPa.
Buildings 13 01576 g009
Figure 10. Time period of six-story models for a dead load of 12 kN/m2: (a) 25 MPa; (b) 40 MPa; and (c) 55 MPa.
Buildings 13 01576 g010
Figure 11. Time period of nine-story models for a dead load of 6 kN/m2: (a) 25 MPa; (b) 40 MPa; and (c) 55 MPa.
Buildings 13 01576 g011
Figure 12. Time period of nine-story models for a dead load of 9 kN/m2: (a) 25 MPa; (b) 40 MPa; and (c) 55 MPa.
Buildings 13 01576 g012
Figure 13. Time period of nine-story models for a dead load of 12 kN/m2: (a) 25 MPa; (b) 40 MPa; and (c) 55 MPa.
Buildings 13 01576 g013
Figure 14. Effect of variation in concrete compressive strength on three story pushover curve (X direction and DL = 6 kN/m2): (a) BF; (b) FI; and (c) GSS.
Buildings 13 01576 g014
Figure 15. Effect of variation in concrete compressive strength on a three-story pushover curve (Y direction and DL = 6 kN/m2): (a) BF; (b) FI; and (c) GSS.
Buildings 13 01576 g015
Figure 16. Effect of variation in concrete compressive strength on a three-story pushover curve (X direction and DL = 9 kN/m2): (a) BF; (b) FI; and (c) GSS.
Buildings 13 01576 g016
Figure 17. Effect of variation in concrete compressive strength on a three-story pushover curve (Y direction and DL = 9 kN/m2): (a) BF; (b) FI; and (c) GSS.
Buildings 13 01576 g017
Figure 18. Effect of variation in concrete compressive strength on a three-story pushover curve (X direction and DL = 12 kN/m2): (a) BF; (b) FI; and (c) GSS.
Buildings 13 01576 g018
Figure 19. Effect of variation in concrete compressive strength on a three-story pushover curve (Y direction and DL = 12 kN/m2): (a) BF; (b) FI; and (c) GSS.
Buildings 13 01576 g019
Figure 20. Effect of variation in concrete compressive strength on a six-story pushover curve (X direction and DL = 6 kN/m2): (a) BF; (b) FI; and (c) GSS.
Buildings 13 01576 g020
Figure 21. Effect of variation in concrete compressive strength on a six-story pushover curve (Y direction and DL = 6 kN/m2): (a) BF; (b) FI; and (c) GSS.
Buildings 13 01576 g021
Figure 22. Effect of variation in concrete compressive strength on a six-story pushover curve (X direction and DL = 9 kN/m2): (a) BF; (b) FI; and (c) GSS.
Buildings 13 01576 g022
Figure 23. Effect of variation in concrete compressive strength on a six-story pushover curve (Y direction and DL = 9 kN/m2): (a) BF; (b) FI; and (c) GSS.
Buildings 13 01576 g023
Figure 24. Effect of variation in concrete compressive strength on a six-story pushover curve (X direction and DL = 12 kN/m2): (a) BF; (b) FI; and (c) GSS.
Buildings 13 01576 g024
Figure 25. Effect of variation in concrete compressive strength on a six-story pushover curve (Y direction and DL = 12 kN/m2): (a) BF; (b) FI; and (c) GSS.
Buildings 13 01576 g025
Figure 26. Effect of variation in concrete compressive strength on a nine-story pushover curve (X direction and DL = 6 kN/m2): (a) BF; (b) FI; and (c) GSS.
Buildings 13 01576 g026
Figure 27. Effect of variation in concrete compressive strength on a nine-story pushover curve (Y direction and DL = 6 kN/m2): (a) BF; (b) FI; and (c) GSS.
Buildings 13 01576 g027
Figure 28. Effect of variation in concrete compressive strength on a nine-story pushover curve (X direction and DL = 9 kN/m2): (a) BF; (b) FI; and (c) GSS.
Buildings 13 01576 g028
Figure 29. Effect of variation in concrete compressive strength on a nine-story pushover curve (Y direction and DL = 9 kN/m2): (a) BF; (b) FI; and (c) GSS.
Buildings 13 01576 g029
Figure 30. Effect of variation in concrete compressive strength on a nine-story pushover curve (X direction and DL = 12 kN/m2): (a) BF; (b) FI; and (c) GSS.
Buildings 13 01576 g030
Figure 31. Effect of variation in concrete compressive strength on a nine-story pushover curve (Y direction and DL = 12 kN/m2): (a) BF; (b) FI; and (c) GSS.
Buildings 13 01576 g031
Figure 32. Effect of dead-load variation on a three-story pushover curve (fully infilled models in X direction): (a) 25 MPa; (b) 40 MPa; and (c) 55 MPa.
Buildings 13 01576 g032
Figure 33. Effect of dead-load variation on a three-story pushover curve (fully infilled models in Y direction): (a) 25 MPa; (b) 40 MPa; and (c) 55 MPa.
Buildings 13 01576 g033
Figure 34. Effect of dead-load variation on a six-story pushover curve (fully infilled models in X direction): (a) 25 MPa; (b) 40 MPa; and (c) 55 MPa.
Buildings 13 01576 g034
Figure 35. Effect of dead-load variation on a six-story pushover curve (fully infilled models in Y direction): (a) 25 MPa; (b) 40 MPa; and (c) 55 MPa.
Buildings 13 01576 g035
Figure 36. Effect of dead-load variation on a nine-story pushover curve (fully infilled models in X direction): (a) 25 MPa; (b) 40 MPa; and (c) 55 MPa.
Buildings 13 01576 g036
Figure 37. Effect of dead-load variation on a nine-story pushover curve (fully infilled models in Y direction): (a) 25 MPa; (b) 40 MPa; and (c) 55 MPa.
Buildings 13 01576 g037
Table 1. Geometric characteristics of analyzed models.
Story HeightNumber and Length Span (m)Column Dimensions (mm)Beam
Dimensions (mm)
Story 63.064 × 4.5 m450450450450300 × 400
Story 53.06450450450450
Story 43.06450450450450
Story 33.06500500500500
Story 23.06500500500500
Story 13.06500500500500
Table 2. Structure parameters.
DescriptionValue or Type
Concrete compressive strength 25, 40 and 55 Mpa
Modulus of elasticity of concrete, Ec32,164, 37,619 and 41,832 Mpa
Steel tensile yield strength500 Mpa
Story height3.06
Number of stories 6 and 9
Building height18.36 and 27.54 m
Span lengths in X direction3.4, 3.5, 3.4, 2.8, 3.4, 3.5, 3.4 m
Number of spans in X direction7
Span lengths in the Y direction4.7, 2, 4.9 m
Number of spans in Y direction3
Masonry compressive strength, fm2 Mpa
Modulus of elasticity of masonry, Em2000 Mpa
The thickness of masonry walls, tm300 mm
Table 3. Geometric characteristics of analyzed 3D models.
Story Height (m)Column’s
Dimensions (mm)
Main Beam’s
Dimensions (mm)
Secondary Beam’s
Dimensions (mm)
Story 93.06400 × 400 300 × 400300 × 300
Story 83.06400 × 400
Story 73.06400 × 400
Story 63.06450 × 450400 × 400
Story 53.06450 × 450400 × 400
Story 43.06450 × 450400 × 400
Story 33.06500 × 500450 × 450300 × 300
Story 23.06500 × 500450 × 450300 × 300
Story 13.06500 × 500450 × 450300 × 300
9 stories6 stories3 stories
Disclaimer/Publisher’s Note: The statements, opinions and data contained in all publications are solely those of the individual author(s) and contributor(s) and not of MDPI and/or the editor(s). MDPI and/or the editor(s) disclaim responsibility for any injury to people or property resulting from any ideas, methods, instructions or products referred to in the content.

