Article

Numerical Analysis of Steam Ejector Performance with Non-Equilibrium Condensation for Refrigeration Applications

1
Chongqing Airport Group Co., Ltd., Chongqing 401120, China
2
School of Civil Engineering, Chongqing University, Chongqing 400045, China
3
Chongqing Jida Environmental Engineering Technology Research Institute Co., Ltd., Chongqing 405299, China
*
Author to whom correspondence should be addressed.
Buildings 2023, 13(7), 1672; https://doi.org/10.3390/buildings13071672
Submission received: 7 June 2023 / Revised: 24 June 2023 / Accepted: 27 June 2023 / Published: 29 June 2023

Abstract

:
In recent years, there has been great interest in developing cooling systems with humidity- and temperature-independent control capabilities that can operate efficiently at varying temperatures. This paper proposes a bi-loop double-evaporator ejection–compression cycle, which utilizes low-grade heat and is suitable for the construction industry. The proposed cycle involves the concurrent operation of a vapor compression cycle and an ejector refrigeration cycle that enables it to handle altered pressure levels and operate with varying compression ratios all the way to a common condenser pressure. Conventional computational fluid dynamics (CFD) approaches often model steam as an ideal gas with single-phase flow. In contrast, this research employs the wet steam model to optimize ejector geometry. The wet steam model takes into account non-equilibrium water vapor condensation, thus providing a more precise assessment of spontaneous condensation behavior and its impact on ejector performance. When compared to the conventional dry gas model, the use of the wet steam model dramatically decreases the entrainment ratio error from 16.24% for single-phase steam to 3.92% when compared to experimental data. This study concentrates on four critical attributes of wet steam, including Mach number, droplet nucleation rate, average droplet radius, and liquid mass fraction, to develop a strategy for enhancing ejector performance and efficiency. The study demonstrates that optimal area and primary nozzle diameter ratios for the steam ejector are 5 and 2.4, respectively. Increasing the area ratio mitigates condensation intensity, thereby reducing the liquid mass fraction in the diffuser. Overall, this paper provides valuable insights into improving and optimizing ejector performance, thus highlighting the importance of considering the behavior of spontaneous condensation in ejector design and modeling.

1. Introduction

More than 60% of energy generated by fossil fuels is wasted, with over 50% being low-grade heat at temperatures below 275 °C [1]. As a result, researchers and engineers are increasingly turning their attention to alternative energy sources such as waste heat and geothermal energy to replace electricity in running refrigeration systems [2,3,4]. This trend has become especially prevalent in the construction industry, where low-grade heat is typically utilized in ejector refrigeration cycles (ERC), desiccant systems, and absorption systems [5]. While LiBr–water and ammonia–water absorption systems are currently available on the market (Coefficient of Performance (COP) of absorption refrigeration system changes within the range of 0.5 to 0.8 [6]), ejector cycles offer several advantages over these options. For instance, they can avoid issues related to internal corrosion and crystallization of the solution [7]. Moreover, ERC is the only refrigeration system that can use nontoxic, nonflammable, and environmentally safe refrigerants (such as water) as its single-component working fluid, which happens to be both inexpensive and ecologically friendly [8]. In regions where electricity is scarce or expensive, ejector refrigeration systems can provide an efficient and cost-effective alternative to conventional refrigeration technologies [9]. This is because ejector refrigeration systems do not require any electrical power to operate. Instead, they rely on a combination of thermal energy input (such as hot water or steam) and the pressure differential created by the ejector to generate cooling. Scholars such as Braimakis [10], Tashtoush et al. [11], and Besagni et al. [12] have provided in-depth descriptions of the latest practical technologies in this field.
Despite numerous advantages, ERC face significant challenges in the market compared to vapor compression cycles (VCC). One major contributing factor is their typically lower COP which is often less than 0.5. Combining ERC and VCC into an ejection–compression refrigeration cycle, such as enhanced ERC and cascade ERC, is a promising solution to address this issue [13]. For example, Sokolov [14] introduced a modified ERC that mechanically boosts the vapor to leave the evaporator, with the goal of increasing the ejector secondary pressure. Sun [15] built a cascade cycle that combines a compression subcycle and an ejection subcycle, with the intercooler serving as both an evaporator and a condenser for both subsystems. Xu et al. [16] proposed a hybrid ejection–compression refrigeration cycle for cooling in multi-story buildings, which aimed to reduce heat consumption and solar collector area. This system entrains the ejector secondary flow at an intermediate pressure from a separator, and the vapor exiting the ejector is mixed with the compressor discharge before entering the condenser. Results show superior electrical COP, with a maximal increase of 22.8%. Additionally, Ghaebi and Rostamzadeh [4] proposed a novel dual-evaporator ejection–compression refrigeration cycle for freezing and air-conditioning applications. Their analysis considered energy, exergy, exergoeconomic, and sustainability viewpoints, and computed an optimum range of COP (1.077–1.745) for various working fluids. Overall, these innovative designs represent promising developments in improving the efficiency and performance of ejection–compression refrigeration cycles.
The ejector geometry plays a critical role in determining the performance of an ejector refrigeration system. For certain operating conditions, there is an optimal or appropriate ejector geometry that provides the maximum entrainment ratio and critical condensation pressure. Several mathematical models for ejector geometrical parameters have been proposed based on the “one-dimensional flow ejector theory” [17]. For example, Huang et al. [18] established a variable geometry ejector model to evaluate ejector performance under critical mode operation, assuming constant pressure mixing in an equal area section. Meanwhile, Chen et al. [19] proposed a fixed geometry ejector model that is suitable for both critical and sub-critical operations. Furthermore, detailed ejector geometric optimization can be performed using computational fluid dynamics (CFD) simulations. CFD can provide a detailed understanding of the flow behavior within the ejector and can help optimize the ejector geometry to achieve maximum performance for a given set of operating conditions. Besagni and Inzoli [20,21] provided a comprehensive review of ejector design, highlighting the importance of two key geometric factors (see Table 1): the area ratio of the ejector constant area chamber to the main throat area ( A R ) and the nozzle exit position ( N X P ). However, other geometrical parameters (such as the nozzle diameter and length, the diffuser angle, and the constant area chamber length) also play important roles in determining ejector performance.
Fixed geometry ejectors have limited applicability due to their sensitivity to operational conditions and lack of controllability. For instance, changes in external temperature necessitate the need for the primary and secondary flow rate control in ERC, while the cooling load and heat source power of solar ejector refrigeration cycle (SERC)fluctuate over time. Therefore, the variable geometry ejector (VGE) is proposed and analyzed [26]. Movable spindles are a widely applied solution, allowing A R to be controlled by adjusting the front and rear positions of the spindles [27]. Changing the position of the motive nozzle is another option. This technique implies that the N X P can remain unchanged if the ejector is designed and optimized properly. In contrast, the spindle position affects all the operating variables, such as cooling capacity, COP, generator pressure, generator heat, as well as mass flow rates. Table 2 briefly summarizes the literature of this study. Despite numerous theoretical studies, a gap still remains between their results and practical applications, primarily because of the use of dry gas assumptions and the neglect of the phase transition process. Ignoring the impact of the condensation shock on fluid density renders some conclusions highly inaccurate and some results even invalid.
Tang et al. [32] conducted an experiment to visualize two-phase choking flow in ejectors. Their study revealed that an increased primary fluid pressure led to a reduction in the choking area, which, in turn, resulted in a decreased entrainment ratio as the choking area moved upstream. Several ejector CFD optimization studies, such as those conducted by Fu et al. [33], Dong et al. [34], Hou et al. [35], and Yan et al. [36], do not account for the effects of spontaneous steam condensation on ejector design. As supersonic ejectors have a significantly short residence time and high cooling rates, a considerable deviation from the equilibrium process occurs. Consequently, an accurate condensation model is essential for predicting ejector performance reliably. Ariafar et al. [37] compared the ideal-gas model with the condensation model and concluded that the latter resulted in a 10% higher entrainment ratio and a 7% higher critical backpressure. In a similar study, Wen et al. [38] found that the dry gas model leads to an unrealistic temperature distribution, resulting in an underestimation of entropy loss by 15% compared to non-equilibrium condensation models. Conversely, Ding et al. [39] found that the dry gas model led to an overestimation of entropy destruction by approximately 16%. Despite several studies in recent decades that focused on spontaneous condensation inside the nozzle of steam ejectors, these studies were limited to specific components such as the nozzle [40,41,42,43]. As for the entire steam ejector, researchers have only paid attention to the effect of steam spontaneous condensation on internal flow and the optimization of numerical algorithms (Table 3). A thorough comprehension of the performance characteristics of steam ejector flows is essential for extending their industrial applications. Hence, the steam condensation effect inside the entire ejector needs to be carefully examined, especially with regard to optimizing the key geometric parameters while taking into account non-equilibrium condensation (NEC). The NEC process is of great significance to the ejector performance evaluation for ERC. Nevertheless, the optimization of the ejector structure through the NEC model has rarely been considered.
In the past, researchers have concentrated on enhancing the performance of ejection–compression refrigeration cycles by incorporating economizers or other modifications. However, limited research has been carried out on utilizing dual-loop bi-evaporator ejection–compression refrigeration cycles to offer different cooling capacities for each loop. An air conditioning system that provides temperature- and humidity-independent control can remove moisture load through the low-temperature evaporator and heat load using the high-temperature evaporator. The application of the proposed cycle is not limited to either freezing or air-conditioning systems. Instead, it holds a broader relevance in the development of energy-efficient and environmentally friendly refrigeration systems and could spark the interest of both manufacturers and researchers in the field. As far as the authors know, no research has been conducted on ejector design and the application of dual-loop bi-evaporator ERC for office air conditioning, indicating a lack of research in investigating the dual-loop bi-evaporator air conditioning performance of the ejection–compression air conditioner. Moreover, research has primarily focused on the impact of spontaneous steam condensation on the internal flow of steam ejectors and on enhancing numerical algorithms for individual ejector components. However, comprehending the characteristics of steam ejector flow holistically is critical for extending their industrial applicability. Thus, thoroughly examining the steam condensation effect throughout the entire ejector and optimizing characteristic geometrical parameters while factoring in non-equilibrium condensation (NEC) is paramount. While NEC is critical for evaluating ejector performance in ERC, little attention has been paid towards optimizing the ejector structure via NEC model.
To sum up, the novelty of this research is as follows:
  • The phase change condensing model is established for ejector refrigeration systems considering phase transition processes with the condensation and evaporation of massive droplets in supersonic flows.
  • The optimization of pivotal ejector parameters and ejector performance is investigated considering the behavior of spontaneous condensation phenomenon.
  • A novel conceptual configuration of dual-loop bi-evaporator ejector refrigeration cycles with independent temperature and humidity control strategy based on climate adaptation is proposed (see Figure 1) to deal with the varying sensible and latent loads in different climates.
The main purposes of present study are multi-fold and can be summarized as follows:
  • Proposing a novel dual-loop bi-evaporator ejection–compression refrigeration cycle.
  • Designing the first set of ejector dimensions for a dual-loop bi-evaporator refrigeration system.
  • Developing a non-equilibrium condensation model for the steam ejector.
  • Validating the wet steam model by comparing it with experimental data and dry gas model.
  • Studying the effect of the ejector area ratio and primary nozzle diameter ratio on the ejector performance using the wet steam model for a certain operating condition.

2. Description of Bi-Evaporator Ejection–Compression Refrigeration Cycle

Figure 1a illustrates the proposed bi-evaporator ejection–compression refrigeration cycle (BECRC) plant layout and corresponding P-h diagram. In such refrigeration systems, each loop operates at a different pressure level and is compressed to a common pressure (condenser pressure) with differing compression ratios. The VCC stage involves compressing the vapor that emerges from the low-pressure evaporator (state 12) to high pressure (state 13) using a compressor, and then mixing it with the outlet of the ejector (state 4). In the condenser, the mixed flow (state 5) is condensed into a saturated liquid by rejecting heat to the surroundings (state 6). The resulting liquid is then split into two streams, with one stream going to the low-pressure evaporator after throttling (state 11), completing the low-pressure loop. In the ERC stage, the remaining flow is divided into two streams. One of the streams passes through the expansion valve and is throttled to a lower-pressure, two-phase flow (state 8), while the other stream enters the generator after being pumped up to a higher pressure (state 7). The high-pressure vapor from the generator (state 1) entrains the low-pressure vapor from the high-temperature evaporator (state 7), and the resulting superheated flow leaves the ejector and enters the condenser (state 4), thereby completing the high-pressure loop. Such a dual-temperature system has potential for broad applications, where the radiant panel cooling system employs a high-temperature cold source (18/23 °C) and the air handling unit uses a low-temperature cold source (7/12 °C). For more details and discussions on such proposed systems, please refer to our published paper [48].
Working fluids for ERC are classified under two main categories: wet vapor and dry vapor, based on whether phase change occurs during the expansion process or not [49]. For dry vapor, the ideal gas dynamics principle is used to model ejectors, as there is no phase change during the expansion process through the converging–diverging nozzle of ejectors. For wet vapor, ejector modeling should incorporate the phase change that occurs during the expansion process. The detailed thermophysical properties of these refrigerants are listed in Table 4. Figure 1b shows the enthalpy–entropy diagram of the working procedure in ERC. Expanding from state 1 to 2, the primary steam flow experiences a sharp pressure and temperature drop, entering the two-phase region where it becomes non-equilibrium and eventually supercooled as it expands further to the Wilson Line. A similar degree of supercooling is observed for the secondary flow, from state 9 to 10. The condensate in the diffuser evaporates as the pressure is restored from state 3 to 4. The non-equilibrium condensation model (Section 3) proposed in the article considers real gas equations of state to account for the non-ideal behavior of the refrigerants involved in the ejector-based refrigeration system.

3. Numerical Method

3.1. Ejector Design

The rapid development of personal computers and commercial software has enabled more detailed and accurate analysis of ejector performance through CFD simulations. However, it is still not feasible to use CFD simulations directly for designing ejector geometries. Hence, a steam ejector is designed according to a one-dimensional theoretical model originally developed by Stoecker [50]. The method requires iteration to calculate the flow states occurring inside the ejector and across the normal shock wave. At that time, calculating the flow state of the working fluid using only a calculator and conventional fluid properties table was quite challenging, especially at very low absolute pressure and near the freezing temperature. Although Stoecker’s ejector model is a useful tool for designing and optimizing ejectors, its application to ERC is not yet fully established.
Table 5 summarizes the operating conditions used to run Stoecker’s model, while Table 6 shows the main ejector dimensions. Reference to ESDU 94046 can provide guidance for the ejector design [51]. The generator temperature is set as the motive flow inlet temperature, the evaporator temperature as the induced inlet temperature, and the condenser temperature as the mixed flow outlet temperature. Additionally, this study refers to the empirical formula reported by Zhu et al. [52] to design the initial structural parameters of the ejector.
Reference to ESDU 94046 can provide guidance for the ejector design [51]. The distance between nozzle exit and diffuser inlet ( L 1 + L 2 ) is approximately 5–10 times the throat diameter ( D 2 ); the throat length ( L 2 ) should be from 2 to 4 D 2 ; the conical inlet of the mixing chamber should have an included angle of 2 10 ° ; the diffuser should have a moderate divergence angle of 3 5 ° ; the nozzle converging angle should be in the range of 20 40 ° ; the nozzle diverging angle should be in the range of 10 12 ° . Therefore, the convergent and divergent angles of the primary nozzle are equal to 20 ° and 10 ° , respectively; the conical inlet of the mixing chamber is equal to 6 ° and the diffuser divergent angle is 4 ° ; the nozzle outlet and the mixing chamber inlet are at the same cross-section.
The design procedure outlined in ESDU assumes that both primary and secondary flow exhibit ideal gas behavior with a specific heat ratio of 1.315 and a specific gas constant of 461.5 J · kg 1 · K 1 . However, this assumption is often extended to saturated steam as well under the assumption that condensation will not occur due to metastable behavior. This is because there are no nucleation sites for condensation to occur, and the steam remains in a superheated state until it encounters a surface or particle where condensation can occur. Therefore, it is important to verify the accuracy of such assumptions and consider non-equilibrium condensation models if necessary for a more accurate design and optimization of ejectors in ERC systems.

3.2. CFD Modeling of Ejectors

3.2.1. Governing Equations

The non-equilibrium condensation model includes the nucleation and droplet growth processes, in which the former process is carried out according to the classical non-isothermal nucleation theory while the latter involves the droplet growth model of Hill [54] and Yong [55]. The assumption of no-slip velocity between the droplets and the gaseous phase is made since the droplet size and mass fraction are small [56]. The flow field of the gas phase is modeled using the condensation phase transition theory, while the liquid phase is modeled using the compressible Navier–Stokes equations [57,58,59].
ρ t + x i ρ u i = Γ
t ρ u i + x j ρ u j u i = P x i + τ i j x j u i Γ
t ρ E + x j u j ρ E + P = · λ e f f T x j + u i τ i j h l v Γ
where u i , u j , u k are components of the velocity; ρ , P , E , and T refer to the mixture density, pressure, gross energy, and temperature, respectively; τ i j represents the stress tensor; λ e f f represents the effective thermal conductivity; h l v is the specific enthalpy of condensation; Γ is the generation rate of liquid mass, m 3 · m 1 ; and I is the nucleation rate, kg · m 3 · s 1 .
Two scalar equations are composed to describe the liquid fraction ( β ), and the droplet number per volume ( N ):
ρ β t + · ρ u β = Γ
ρ N t + · ρ u N = ρ I
The steam properties are measured from the truncated Virial equation of state in the third expanded term:
P = ρ v R T 1 + B ρ v + C ρ v 2
where B and C are both functions of temperature, representing the second virial coefficient and the third virial coefficient, respectively; R is the specific gas constant for gaseous mixture of air and vapor [60].
To determine the number of droplets per unit volume ( N ), the vapor density ( ρ v ) and the average droplet volume ( V d ) are expressed as:
N = β 1 β V d ρ l ρ v
ρ v = ρ 1 β
V d = 4 3 π r ¯ 3
where r ¯ is the average droplet radius.
The nucleation and droplet growth model are employed for the simulation of non-equilibrium condensation. The Appendix A illustrates the condensation of wet steam in supersonic flows.

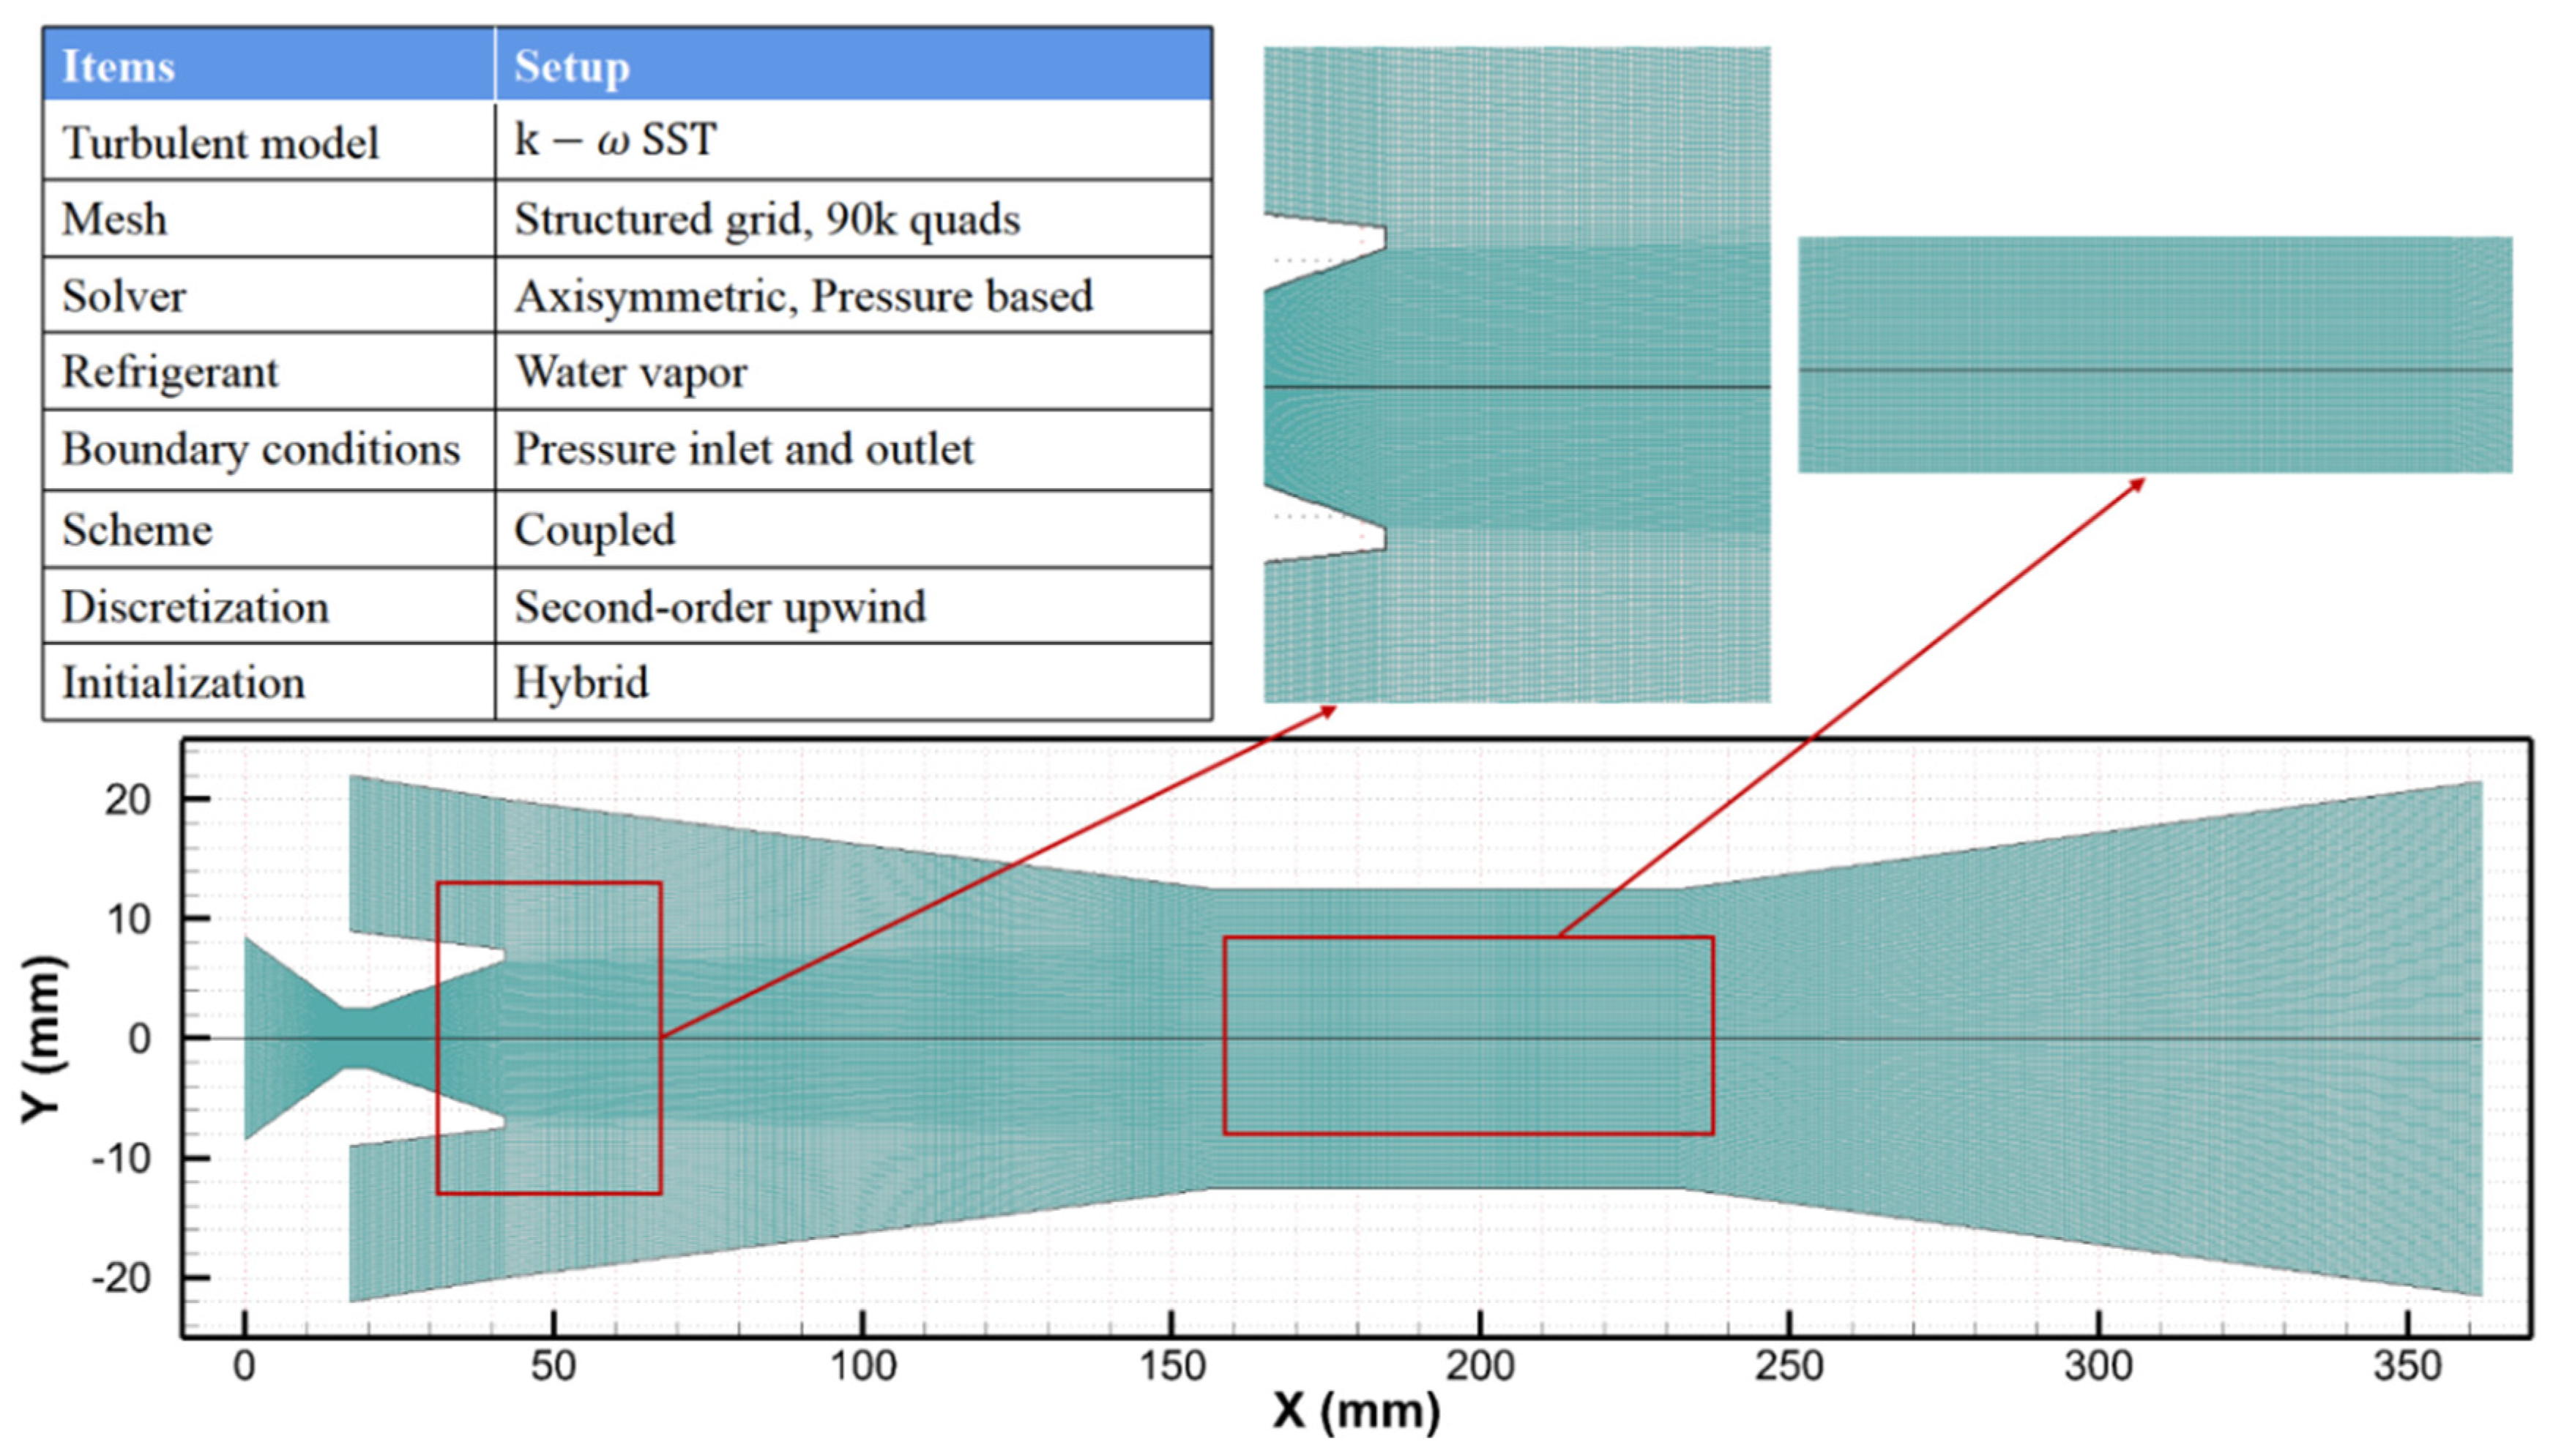
3.2.2. Numerical Setup

Pianthong et al. [61] demonstrated that two-dimensional (2D) axisymmetric and three-dimensional (3D) models predict static pressure at the center line similarly. Studies have demonstrated that using a 2D axisymmetric model can yield equivalent results to the 3D model while requiring less computational effort [62]. In terms of the turbulent model, Zhang et al. [63] proposed that the k ω SST model can predict the intensity and position of shock wave more accurately; Schlieren optical measurements were utilized by Zhu and Jiang [64] to compare the performance of Realizable, RNG, and standard k ε and k ω SST models and the results revealed that the RNG k ε model had the highest level of agreement with experimental data in terms of predicting both mass flow rate and shock wave structures; Elbarghthi et al. [65] found that the k ω SST model is more accurate than the RNG k ε model for ejector calculations. Additionally, the k ω SST model is widely recommended in the literature due to its superior performance in stream mixing, convergence, and flow field prediction [66]. Definitions of the k ω SST model can be found in Refs. [21,67].
ANSYS Fluent 2020 was used to perform the numerical simulation. To solve for droplet number and liquid fraction, the UDS method was employed, while the UDF method was used to model mass generation in the process of condensation in transonic flow. The inlet flows are usually low speed, which means that the total pressure and temperature are almost similar to the static magnitudes. Turbulence intensity at the inlets is measured by the rate of the root-mean-square of the velocity fluctuation in the average velocity. Because the insensitivity of the outcomes to their variability is between 1% and 10%, the parameter is determined as 5%. Although the density-based algorithm is recommended widely for supersonic flow, the pressure-based solver can effectively handle highly compressible flows, including both single-phase and two-phase flow ejectors. While the density-based algorithm is commonly recommended for supersonic flow, the pressure-based solver was deemed effective for highly compressible flows, including single-phase and two-phase flow ejectors, and provided smoother and faster convergence, making it more suitable for problems that require a large number of simulations [68]. To make sure that the outcome is convergent to the expected tolerance, three convergence monitors are utilized. The residuals are lower than 10 5 and the mass flow is still unchanged within certain times of iterations; the outlet net mass flow needs to coincide with the inlet net mass flow within a tolerance of 10 6   kg · s 1 ; the maximum velocity value at the ejector throat is constant.

3.2.3. Grid Independence

Figure 2 presents the quadrilateral structured grids and outlines the settings utilized in Fluent, with a focus on refining the mesh in regions with wide velocity and pressure variations for accurate prediction of flow behavior. The axial distances of the nozzle outlet, constant section inlet, and diffuser inlet are 42 mm, 157 mm, and 232 mm, respectively. y + refers to the friction velocity ratio between the wall and the fluid velocity profile, which should typically be controlled within the range of 30 to 100 in order to obtain accurate results. Figure 3 illustrates the axial distribution of static pressure across four grid levels: 25,000 elements (coarse level), 60,000 elements (medium level), 90,000 elements (fine level), and 110,000 elements (meticulous level). Table 7 displays the secondary mass flow rate and entrainment ratio at different grid levels. The Grid Convergence Index (GCI) for a mesh containing 90,000 elements is less than 1%. Therefore, a quadrilateral grid consisting of 90,000 cells is considered a suitable reference model for this study.

4. Model Validation

The research data of Sriveerakul et al. [70,71] is compared with the numerical results obtained by dry gas and wet steam models under various back pressures and the same geometric parameters, as shown in Figure 4. Compared to the dry gas model, the wet steam model fits the experimental results better. The average error of the E R reduces from 16.24% (dry gas results) to a negligible difference of 3.92% (wet steam results). This indicates that the dry gas model overestimates the E R values in critical modes, as observed in previous studies by Yang et al [42]. Furthermore, the critical back pressure of the experimental data is around 50 mbar: 45 mbar for dry gas simulation and 51 mbar for wet steam simulation. The predicted critical pressure carried out by the wet steam model has increased; in the on-design region (critical mode zone), the wet steam model exhibits a wider range compared to the dry gas model (the compression effect is caused by the impact of diffuser). These results align with those observed in prior studies by Zhang et al. [72]. On the premise of non-equilibrium condensation, the error can be considered an effective modification to the predicted entrainment ratio. In contrast, since the wet steam model involving non-equilibrium condensation can predict the E R and compression ratio more accurately, it is more suitable for investigating complex flow phenomena in a supersonic steam ejector.

5. Results and Discussion

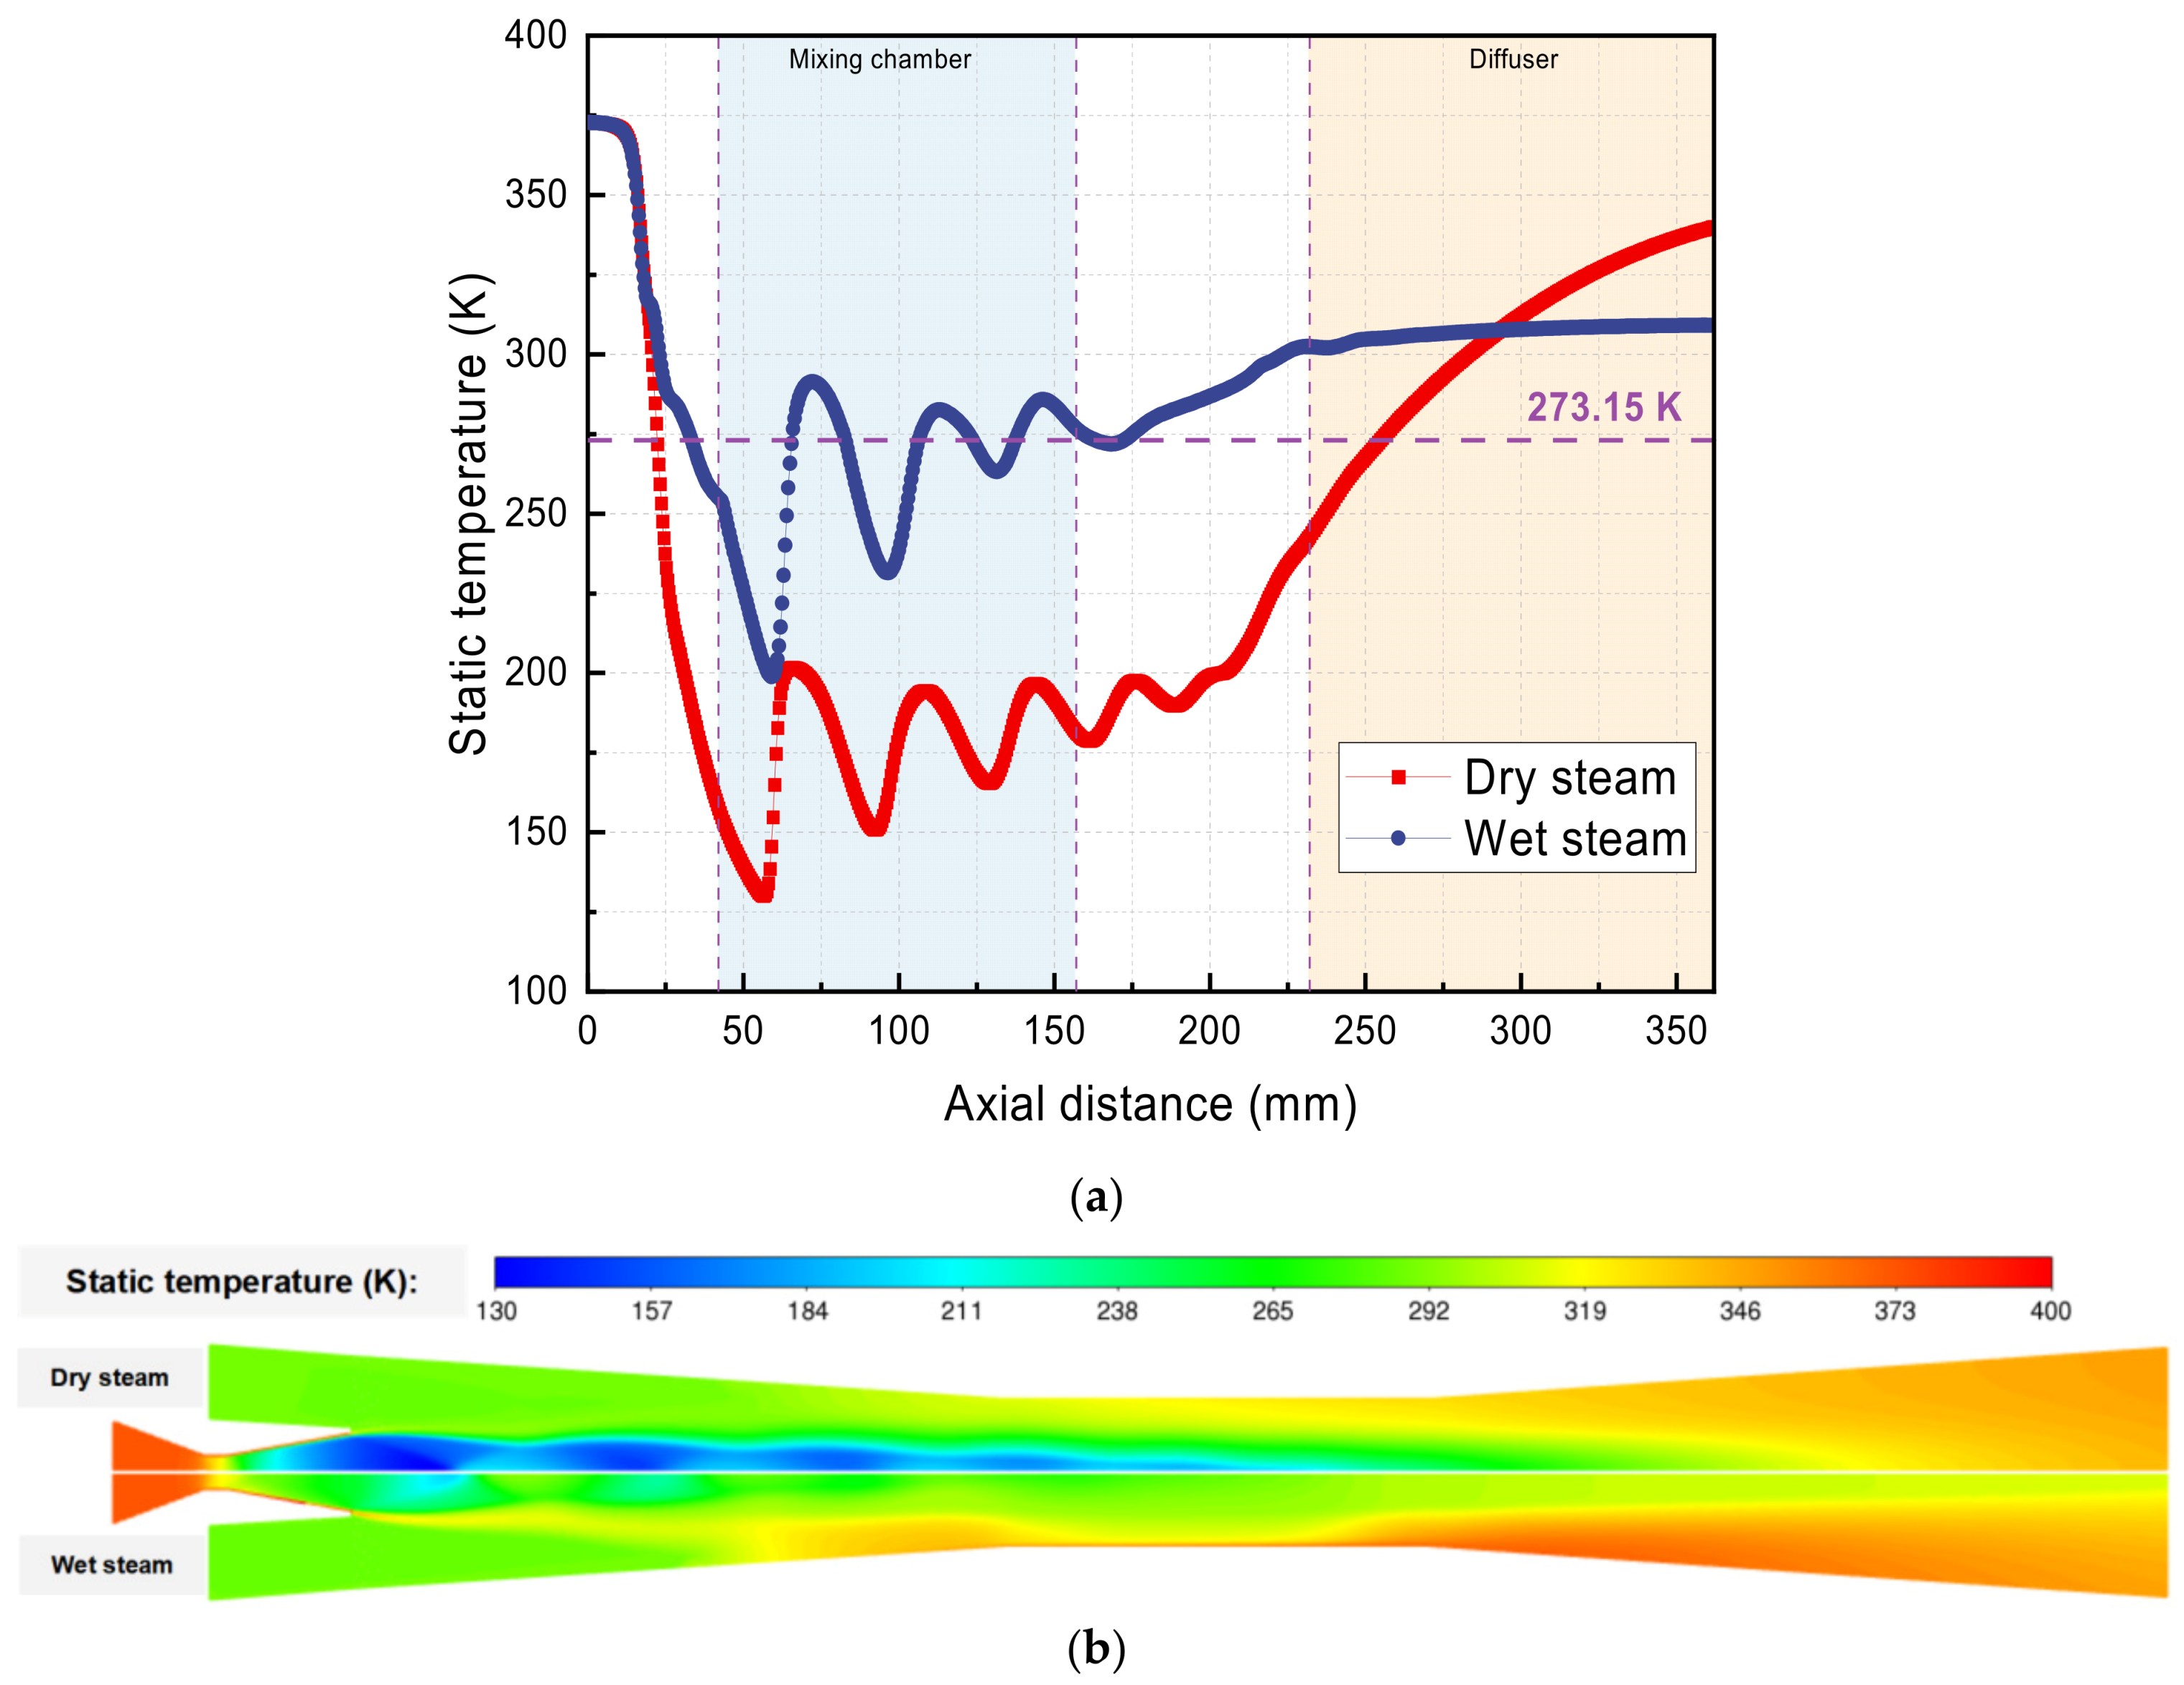
5.1. Dry and Wet Steam Ejector

Figure 5a,b compares the flow Mach numbers (i.e., M a = u / γ R T ) of dry and wet steam. When the flow temperature is below the saturation temperature of the flow pressure, some vapor undergoes rapid condensation in a transient process. The local maximum Mach number is 3.28 at x = 59   mm in the wet steam model, while in the dry gas model, it is 3.54 at x = 56   mm . The average Mach value between wet and dry steam models is 1.76 and 1.97, respectively, showing that the dry gas model overpredicts the Mach numbers by 11.93%. These results are consistent with previous studies by Sharifi et al. [57]. This is due to the fact that the expansion characteristics of supersonic flow in the ejector are limited by steam condensation, which absorbs energy from the gas-phase flow, resulting in a decrease in fluid velocity and weaker shock waves. The dry steam model indicates that the shock wave appears earlier in the mixing chamber compared to that predicted by wet steam simulations. Additionally, the sonic line fails to reach the ejector wall in the constant section, resulting in a distinctive shape of the characteristic curve, as shown in Figure 4.
Figure 6a,b provides further insight into the differences between the wet steam and dry steam models through profiles and contours of static temperature. The wet steam model predicts higher temperatures compared to the dry steam model, in line with findings by Yang et al. [73]. The presence of droplets releases latent heat of condensation, which heats the gas phase in the wet steam model. In the dry steam model, the minimum temperature is 130 K at x = 56   mm , with most temperatures in the nozzle, mixing chamber, and constant section below freezing point (273.15 K), which is an unrealistic outcome. In contrast, the lowest temperature in the wet steam model is 198 K at x = 59   mm , and only a small portion of the temperature profile in the mixing chamber falls below freezing point. The low temperature in the nozzle outlet is due to the high Mach number at the “shock chain” region. The dry gas assumption assumes that all the internal energy of the fluid is converted into kinetic energy, and the vapor temperature is much lower than the triple point temperature of water (the hypothesis of ice crystal formation), while droplet temperature (the same as the saturation temperature at the vapor pressure) is generally well above that of the vapor. The average static temperatures for dry and wet steam are 235.48 K and 288.88 K, respectively. When droplets condense in the wet steam model, latent heat is released, which heats up the gas phase and leads to a temperature jump in the primary nozzle.
The temperature inside the ejector is modeled to be approximately 200 K, which is significantly lower than typical operating temperatures for refrigeration systems. However, the involved area below the triple point of water is limited, and the sudden rise in temperature could prevent ice from forming. This is because the rate of crystallization is highly dependent on the temperature and can be significantly impacted by even small changes in temperature or humidity.
In summary, the single-phase model overestimates the entrainment ratio of the ejector due to its prediction of a higher Mach number (lower pressure) and lower temperature compared to the two-phase model. The findings demonstrate the importance of considering phase change effects in the steam ejector.

5.2. Internal Analysis of the Ejector

The ratio of the outlet and throat cross-sectional area ( A 4 / A t h ), outlet–throat diameter ratio ( γ d ), and area ratio ( A R ) are critical parameters that significantly affect the flow characteristics of a converging–diverging nozzle and the Mach number at the nozzle exit. It can be calculated as follows [74]:
A 4 A t h = 1 M a 2 2 + k 1 M a 2 k + 1 k + 1 k 1
γ d = D 4 D t h = A 4 A t h
A R = D 2 D t h = A 2 A t h
To achieve changes in A 4 / A t h and A 2 / A t h , the diameter of various ejector sections needs to be adjusted. The optimization sequence follows the order of the primary nozzle outlet diameter ( D 4 ) and then the diameter of the mixing chamber ( D 2 ). Therefore, a detailed study of the different γ d and A R , with a fixed throat diameter D t h , is conducted while taking the phase change process into consideration.
The ejector performance is measured in terms of the entrainment ratio, whilst the performance of the whole system is evaluated in terms of the COP. The change in E R in the ERC is closely related to the thermal COP ( C O P t = E R h 9 h 6 h 1 h 6 ) [75]. As depicted in Figure 7, when A R reaches 6.0, the secondary flow inlet refluxes with an E R below −0.1, indicating the ejector loses its entrainment performance. It is indicated that the ERC achieves a maximum E R of 0.59 when the γ d is 2.4 and A R is 5.0, while the maximum deviation of E R for γ d and A R are 16.64% and 391.95%, respectively. A R has a great influence on the E R as compared to that of γ d .
The objective of this study is not only to facilitate the practical design of the ejector, but also to investigate the variations in flow behaviors under different parameters. The flow pattern cannot be clarified by the entrainment ratio. It is crucial to carry out research on several wet steam parameters, including Mach number, droplet average radius, nucleating rate, and liquid mass fraction, and so on.

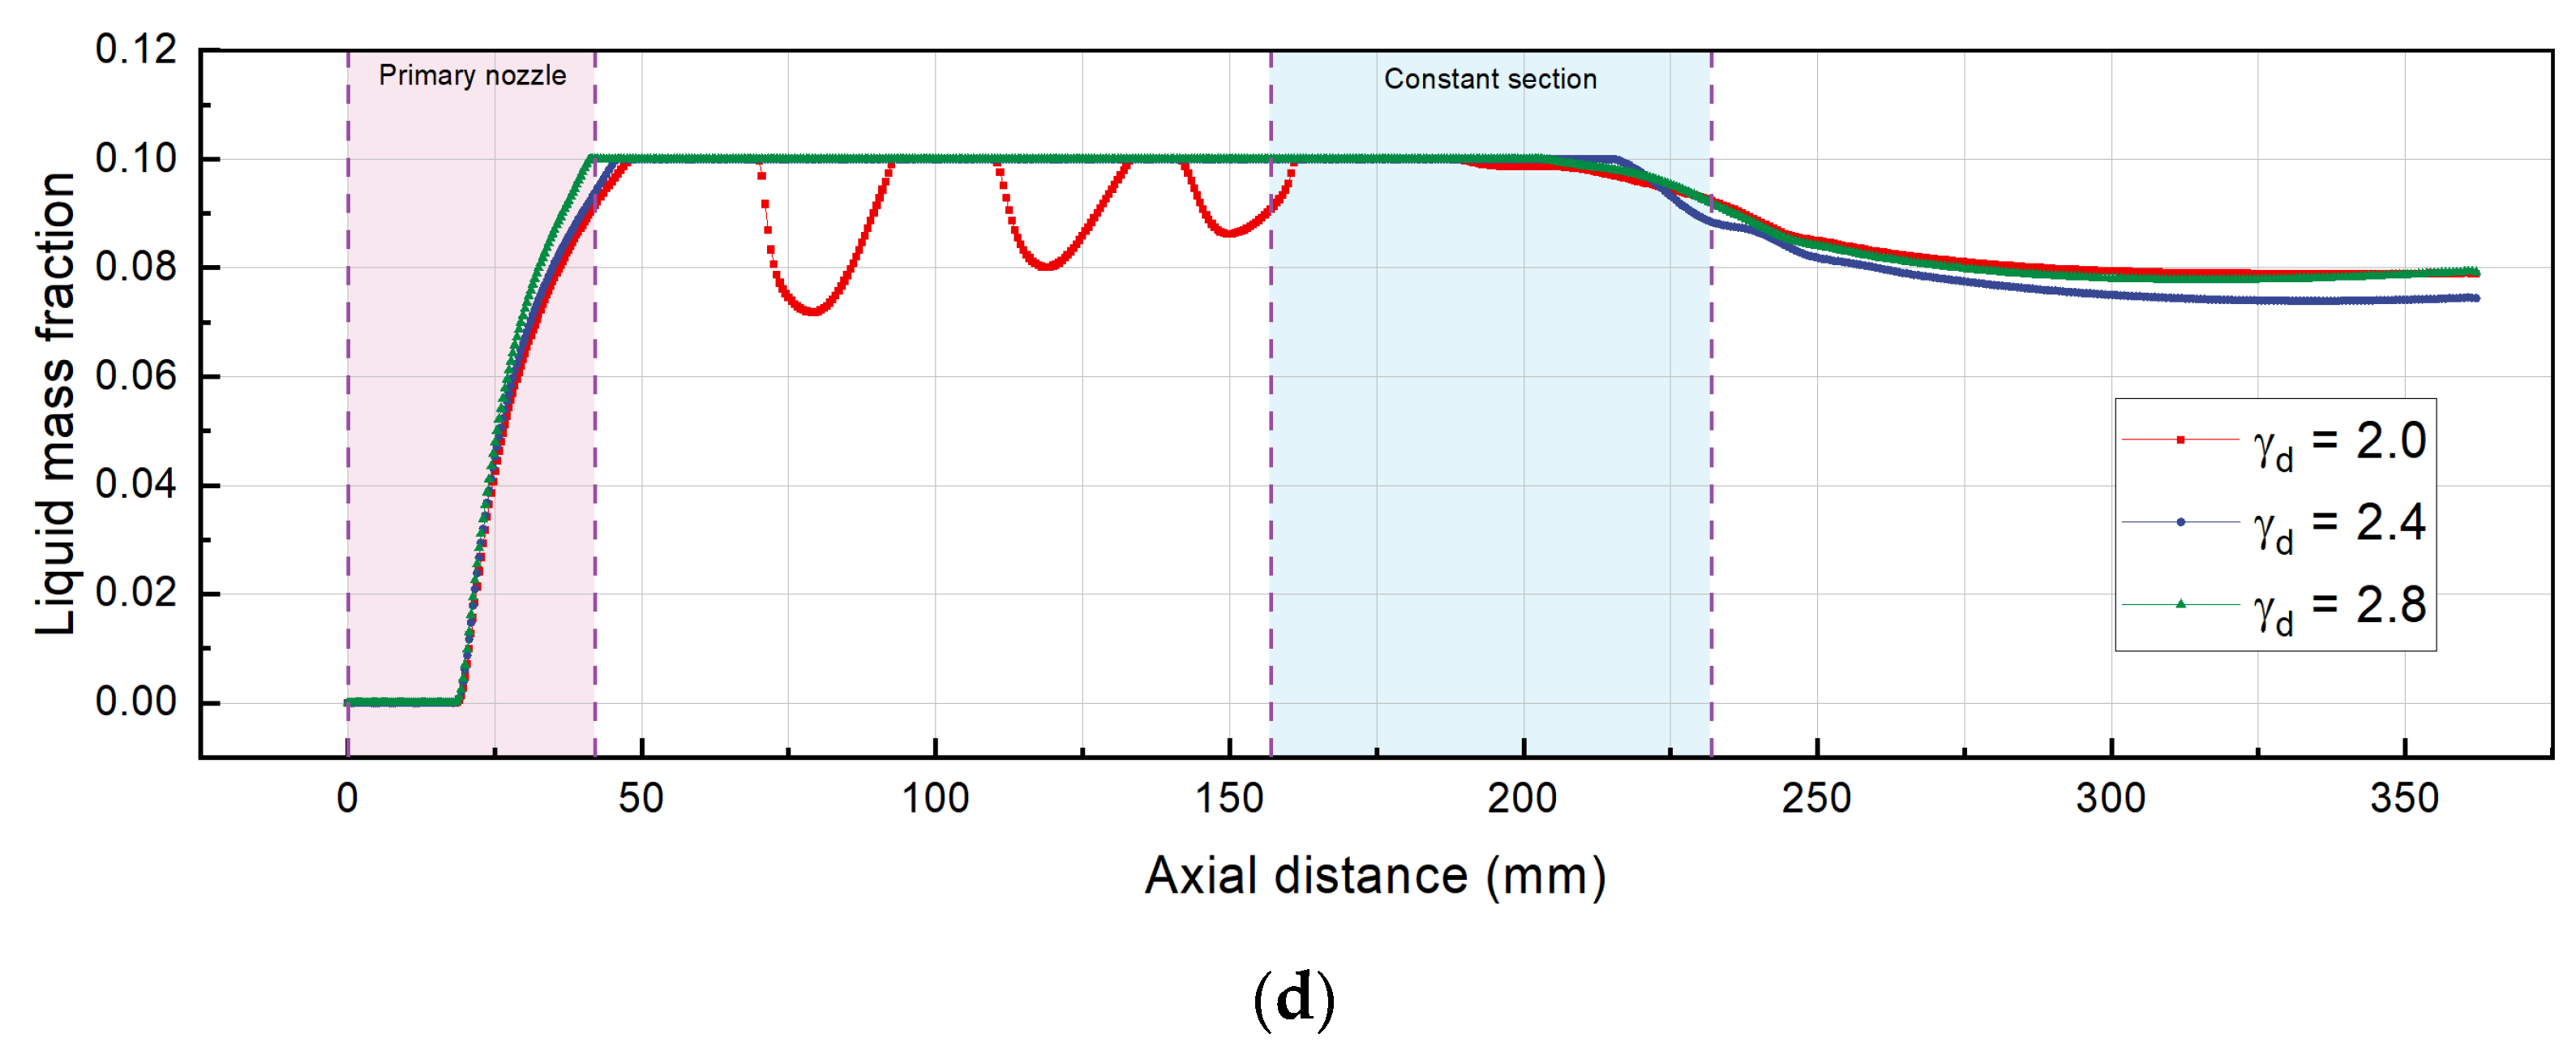
5.2.1. Effect of the Primary Nozzle Outlet Diameter

Figure 8a demonstrates the variations in Mach number at different γ d . At γ d = 2.0 , 2.4 ,   and   2.8 , their corresponding Mach values are 2.28, 2.52, and 2.72, respectively. For γ d = 2.0 , the steam experiences a violent expansion in the mixing chamber, resulting in a Mach number of up to 4, which induces an under-expanded flow. As the γ d increases to 2.4 and 2.8, the flow structure transition slightly decreases the maximum Mach value in the mixing section, resulting in a decrease in the maximum Mach number to approximately 3.39 and 3.34, respectively. Nonetheless, the results still present a moderate under-expanded flow in the flow structure.
Figure 8b depicts the non-equilibrium condensation process, which generates nanodroplets in the steam ejector. The droplet nucleation occurs inside the primary nozzle and at its exit region. As the γ d increases, the droplet average radius decreases, causing the maximum droplet average radius to move upstream. The maximum average radius of the droplet is approximately 39 nm in the mixing section for γ d = 2.0 , whereas it reduces to 26 nm in the primary nozzle for γ d = 2.8 . Additionally, the homogeneous nucleation process occurs for various γ d , indicating slightly different nucleating rates, as shown in Figure 8c.
Considerable heat is released into the supersonic flow during droplet growth, leading to compressive effects that bring about condensation shock. A moderate under-expanded flow with outlet–throat diameter ratios of γ d = 2.4   and   2.8 triggers a homogeneous nucleation process in both the mixing section and constant section. However, non-equilibrium condensations are absent in the constant section for γ d = 2.0 . As γ d increases, the Wilson points gradually converge, and the initial position of the droplet nucleation rate moves forward. It can be inferred that the formation and evaporation of nanodroplets may be influenced by varying γ d .
Subsequently, Figure 8d illustrates the impact of γ d on the liquid fraction profiles. Initially, liquid droplets form in the ejector due to nucleation. As soon as the nucleation process is complete, the droplets will begin to grow. As the temperature decreases below saturation temperature, the vapor condenses, and the liquid mass fraction increases, whereas as the liquid droplets evaporate, the liquid mass fraction decreases. The conclusion can be extracted that the liquid mass fraction increases with the rising of γ d in the primary nozzle. The minimum liquid mass fraction at the nozzle outlet is 9.14% ( γ d = 2.0 ), while the liquid mass fraction increases to 9.41% when γ d = 2.8 . The maximum liquid mass fraction of 8% reported by Zhang et al. [76] and 19% reported by Sharifi [77]. The maximum liquid mass fraction is attained in the constant section, followed by a gradual decrease due to droplet evaporation within the diffuser. As such, the liquid content reduces progressively.
As shown in Figure 8a, the basic driving potential of droplet vaporization and condensation is the low-pressure region caused by the transformation of the Mach number. In addition, a larger γ d not only reduces the E R but also causes accelerated droplet nucleation rate and more liquid fractions, as shown in Figure 8c,d.

5.2.2. Effect of the Mixing Chamber Throat

Figure 9a depicts the Mach number along the ejector central line at A R = 4 , 5 , and 6. With the increase of the A R from 4 to 6, the Mach numbers maintain almost the same trend until the primary and secondary flows are mixed. The maximum value of the Mach number is unchanged, which means A R will not affect the primary flow. With the increase of A R , the Mach number after condensation shock decreases. The A R = 5 ejector reduces 60.46% of outlet Mach number ( M a = 0.43 ) as compared to the A R = 4 ejector ( M a = 0.69 ).
Figure 9b illustrates the variation trend of the droplet average radius of each A R ejectors with axial coordinates. The average radius of droplets first increases, and then decreases; the maximum droplet average radius appears at approximately 36 mm in the primary nozzle. The rise in A R does not alter the average radius of droplets. In other words, droplet growth only exists in the primary nozzle, and droplet growth no longer continues when the flow enters the mixing section. Furthermore, before the diffuser outlet, the profiles of various A R ejectors show a constant trend. In fact, there are a lot of small droplets in this region. No matter how the A R changes, the droplet average radius remains unchanged, indicating the little impact of A R on the droplet average radius.
Figure 9c shows the profiles of droplet nucleation rates with different AR along the axis of the ejector. Once the nucleation rate reaches its peak, the droplet radius undergoes a rapid increase, compared to Figure 10b. The nucleation occurs in two regions for the A R = 4 ejector. One is in the primary nozzle, and the supercooling impact of the divergent section leads to the supersonic flow reaching the equilibrium state. The other two nucleation processes occur in the mixing section. For the A R = 5 ejector, the nucleation occurs in three regions; the difference is that nucleation occurs again in the constant section. The ending position of the droplet nucleation rate moves forward with the increase of the A R .
The distribution of liquid mass fractions is shown in Figure 9d. In the primary nozzle and mixing chamber, there is no effect of A R on the liquid mass fraction distribution. The condensed phase is up to 10%, and its maximum value appears in the downstream area of the nozzle exit plane. In the constant section, the liquid mass fraction under AR = 6 rapidly decreases to 0. The increase in A R decreases the liquid mass fraction in the constant section and diffuser. Furthermore, with the increase of A R , the liquid mass fraction in the diffuser chamber decreases, and the intensity of non-equilibrium condensation in the ejector is reduced. The frequent occurrence of steam condensation and evaporation behaviors is indicated by the fluctuations of the liquid mass fraction curves in the diffuser at various A R .

5.2.3. Two-Phase Flow Features

For a clear view of the simulation results, Figure 10 illustrates flow structures in the steam ejector, including Mach number, subcooled vapor temperature, droplet nucleation rate, and liquid mass fraction, respectively. The supersonic flow becomes supercooled and produces vast condensation nuclei and droplets after the primary flow expands strongly. The mixed flow pressure drops significantly, producing a lot of condensed droplets. Meanwhile, infinitesimal droplets absorb part of the flow kinetic energy, causing the flow velocity to decrease.
As shown in Figure 10a, the subcooling degree is approximately 37 K at the nozzle throat, which leads to the first nucleation and condensation of the steam ejector with a peak nucleation rate of 5.62 × 10 20   m 3 · m 1 . The supercooled vapor temperature stays at approximately 50 K at the primary nozzle exit. The peak values of supercooled vapor temperature are found to decrease gradually in the mixing and constant section, while the trough values increase, resulting in the condensation and re-evaporation of steam. The four peak values of subcooled vapor temperature are 80 K, 55 K, 31 K, and 23 K, and the three troughs are 10 K, 17 K, and 15 K. The corresponding peak values of droplet nucleation rate are 1.51 × 10 26   m 3 · m 1 , 3.02 × 10 24   m 3 · m 1 , 2.45 × 10 16   m 3 · m 1 , and 5.13 × 10 6   m 3 · m 1 . The supercooled vapor temperature is approximately equal to 0 at downstream of the constant section ( x > 220   mm ), and the droplet nucleation rate is around 0 in this region ( x > 175   mm ). However, the liquid droplets do not disappear. Figure 10b displays that the liquid mass fraction attains its highest value of 10% at the nozzle outlet and decreases to a minimum in the diffuser due to droplet evaporation. After the droplet nucleation rate reaches its peak, the liquid mass fraction undergoes a sharp increase and reaches its peak value. Figure 10c shows that the liquid mass fraction near the ejector wall is almost zero. This is because the fluid deceleration and viscous dissipation in the boundary layer lead to some extent of heat recovery, resulting in the absence of liquid droplets in the region (represented by the blue color in the liquid mass fraction contour). The distribution of liquid mass generation rate is primarily concentrated in the mixing chamber due to the heat exchange occurring during the mixing process.
According to the experiment results, the homogeneous nucleation of ice is usually observed at a subcooling degree of about 30–40 K. Simulation results indicate that the supercooled vapor temperature reaches up to 80 K. However, the formation of ice crystals is basically a similar time-dependent phenomenon as the nucleation of liquid droplets. Although the primary flow can reach a temperature level well below the triple point, ice may not occur since the involved area is limited and the temperature suddenly rises. Alternatively, shocks may cause the ice to melt suddenly if they occur immediately after steam expansion. Given the uncertain characteristics of supercooled water below the triple point temperature, (surface tension, specific heat, viscosity, etc.), the ice formation in the steam ejector should be further analyzed in future experiments.

6. Conclusions and Future Works

This paper proposes a novel bi-loop double-evaporator ejection–compression refrigeration cycle, which can generate refrigeration at two temperature levels and be used in temperature- and humidity-independent control systems. The cycle features a combination of vapor compression refrigeration and ejector refrigeration sub-cycles, allowing the compression of each pressure level to a common pressure (the condenser pressure) at varying compression rates. To examine the steam ejector performance and optimize the ejector geometry, homogeneous, non-equilibrium, two-phase flow computational fluid dynamics model is applied. The wet steam model is found to be more suitable than the dry gas model in predicting the entrainment ratio when compared to experimental data, with an error decreasing from 16.24% to 3.92%. Some remarkable findings are summarized below:
  • Neglecting the phase change process, the dry gas model results in an overestimation of steam expansion and lower temperature predictions compared to the wet steam model. The average Mach numbers are 1.97 and 1.76 for dry and wet steam models, respectively. The average static temperatures between dry and wet steam are 235.48 K and 288.88 K, respectively.
  • The optimum values for the primary nozzle outlet diameter γ d and area ratio A R are 2.4 and 5.0, respectively. The optimized E R reaches up to 0.59. In addition, the maximum deviation of E R for γ d and A R is 16.64% and 391.95%, respectively.
  • When the γ d increases to γ d = 2.4   and   2.8 , the maximum Mach number decreases to about 3.39 and 3.34. The minimum liquid mass fraction is 9.14% ( γ d = 2.0 ) at the nozzle outlet, while there is an approximate growth of 9.41% when γ d = 2.8 .
  • The A R = 5 ejector reduces 60.46% of outlet Mach number ( M a = 0.43 ) as compared to the A R = 4 ejector ( M a = 0.69 ). Droplet growth only takes place within the primary nozzle and no longer continues as the flow enters the mixing section. The nucleation occurs in two regions for the A R = 4 ejector, and the nucleation occurs in three regions for the A R = 5 ejector.
The proposed cycle has potential applications for both freezing and air-conditioning systems and could be of interest to manufacturers and researchers looking to develop more energy-efficient and environmentally friendly refrigeration systems. This study provides reference for predicting the geometrical parameter and performance of supersonic steam ejectors. However, there are limitations to this study, including its focus on a specific type of steam ejector and its reliance on numerical simulations rather than experimental data. The following areas could be explored in future research: (1) Exploring the effect of different geometries and operating conditions on the performance of supersonic steam ejectors with non-equilibrium condensing; (2) investigating the use of alternative working fluids in supersonic steam ejectors, such as refrigerants or compressed air; (3) developing new models to account for different wet fluids, as they may have varying nucleation and droplet growth rates; and (4) performing optimization and parametric studies in terms of the proposed conceptual configuration (energy, exergy, exergoeconomic, and sustainability). Additionally, experimental validation may be necessary to confirm the advantages in real-world applications.

Author Contributions

Conceptualization, J.L.; Methodology, J.L.; Software, S.L.; Validation, Y.L., S.L. and Y.Y.; Formal analysis, Y.L.; Investigation, Y.X.; Data curation, Y.L.; Writing–original draft, S.L.; Writing–review & editing, Y.L., S.L., Y.X., Y.Y. and D.X.; Visualization, D.X.; Supervision, J.L.; Project administration, J.L.; Funding acquisition, J.L. All authors have read and agreed to the published version of the manuscript.

Funding

This research received no external funding.

Data Availability Statement

Not applicable.

Acknowledgments

The authors wish to acknowledge Cenker Aktemur, from the Department of Mechanical Engineering, Faculty of Engineering, Kocaeli University, for his selfless help in interpreting the significance of the results of this study.

Conflicts of Interest

The authors declare no conflict of interest.

Nomenclature

SymbolsUnit
D Diameter mm
E Total energy kJ
h Specific enthalpy kJ · kg 1
I Nucleation rate kg 1 · s 1
K n Knudsen number
k Turbulent kinetic energy m 2 · s 2
K b Boltzmann’s constant
L   and S Lengthmm
M a Mach number
N Number of liquid droplets m 3
P Pressure Pa
Q Heat transfer rate kW
q c Condensation coefficient
r Droplet radius m
R Gas constant kJ · kg 1 · K 1
S r Saturation ratio
t Time s
T Temperature K or °C
u Velocity components m · s 1
VAverage droplet volume m 3
Greeks
α and ϕ Tuning parameter
β Liquid mass fraction
γ Specific heat ratio
δ Mixing layer growth rate
ε Turbulent dissipation rate m 2 · s 3
η Efficiency
θ Non-isothermal correction coefficient
λ Thermal conductivity kW · m 1 · K 1
μ Dynamic viscosity Pa · s
ρ Density kg · m 3
σ Liquid surface tension N · m 1
τStress tensorPa
Γ Mass generation rate kg · m 3 · s 1
Abbreviations
ARArea ratio
BECRCBi-evaporator ejection–compression refrigeration cycle
CFDComputational fluid dynamics
COPCoefficient of performance
EREntrainment ratio
ERCEjector refrigeration cycle
GCIGrid convergence index
NECNon-equilibrium condensation
NXPNozzle exit position
SERCSolar ejector refrigeration cycle
VCCVapor compression cycle
VGEVariable geometry ejector
Subscripts
1, 2, 3...State point
bBoiling
c Critical
d Droplet
l Liquid
l v Liquid-vapor
pPrimary flow
sSecondary flow
s a t Saturation
v Vapor

Appendix A

The nucleation and growth of droplets jointly affect the mass generation rate Γ , which is calculated as follows:
Γ = 4 3 π ρ l I r * 3 + 4 π ρ l N r ¯ 2 r ¯ t
where the first term represents the additional liquid mass resulting from nucleation, while the second term represents the change in mass due to droplet growth or disappearance; ρ l represents the droplet density; r ¯ represents the average radius of the droplet; r ¯ t represents the growth rate of droplets; r * refers to the Kelvin–Helmholtz critical radius. Droplet growth occurs when r ¯ exceeds r * , while droplet evaporation takes place when r ¯ is less than r * .
An expression for r ¯ is given by:
r ¯ = 3 β 4 π N 1 β ρ l ρ v 3
An expression for r * is given by:
r * = 2 σ ρ l R T ln S r
where ρ l refers to the liquid density; σ refers to the liquid surface tension; S r refers to the super saturation ratio, that is, the ratio of vapor pressure to the equilibrium saturation pressure:
S r = P P s a t T
where P s a t T is the saturation pressure at temperature T .
According to the modified classical nucleation model using Kantrowitz’s non-isothermal correction, the nucleation rate I can be obtained as shown below:
I = q c 1 + θ ρ v 2 ρ l 2 σ M 3 π exp 4 π σ r * 2 3 K b T
where q c = 1 refers to condensation coefficient, M refers to the molecule mass of vapor, Kb refers to the Boltzmann constant ( 1.3807 × 10 23   J · K 1 ); and θ is the non-isothermal correction coefficient (Kantrowitz correction).
θ = 2 γ 1 γ + 1 h l v R T h l v R T 0.5
where γ is the ratio of specific heat capacity.
Two mechanisms are involved during condensation: mass transfer from vapor to droplets and heat transfer from droplets to vapor as latent heat.
Hill (1966) [54] proposed this energy transfer relation with the equation below:
r ¯ t = P h l v ρ l 2 π R T γ + 1 2 γ C p T d T
Gyarmathy’s droplet growth model is:
r ¯ t = λ v T d T h l v ρ l r ¯ 1 + 3.18 K n
Young (1982) [55] modified the droplet growth model proposed by Gyarmathy (1962) [78]; this formula is tunable with two modeling parameters, α = 9 and ϕ = 1 :
r ¯ t = λ v T d T h l v ρ l r ¯ 1 r * / r ¯ 1 1 + 2 ϕ K n + 3.78 1 ψ K n P r
where Td is the droplet temperature; C p is the vapor isobaric specific heat capacity; λ v represents the vapor thermal conductivity; K n represents the Knudsen number; P r represents the Prandtl number; and ψ is the modeling correction coefficient:
ψ = R T s a t h l v α 0.5 2 q c 2 q c γ + 1 2 γ C p T s a t h l v
An expression for T d is given by:
T d = T s a t P T r * r ¯
where T is the subcooled vapor temperature, and T s a t P is the saturation temperature at pressure P .

References

  1. Hamzaoui, M.; Nesreddine, H.; Aidoun, Z.; Balistrou, M. Experimental study of a low grade heat driven ejector cooling system using the working fluid R245fa. Int. J. Refrig. 2018, 86, 388–400. [Google Scholar] [CrossRef]
  2. Chen, J.; Yu, J. Theoretical analysis on a new direct expansion solar assisted ejector-compression heat pump cycle for water heater. Sol. Energy 2017, 142, 299–307. [Google Scholar] [CrossRef]
  3. Sun, W.; Ma, X.; Zhang, Y.; Jia, L.; Xue, H. Performance analysis and optimization of a steam ejector through streamlining of the primary nozzle. Case Stud. Therm. Eng. 2021, 27, 101356. [Google Scholar] [CrossRef]
  4. Ghaebi, H.; Rostamzadeh, H. Design and optimization of a novel dual-loop bi-evaporator ejection/compression refrigeration cycle. Appl. Therm. Eng. 2019, 151, 240–261. [Google Scholar] [CrossRef]
  5. Mwesigye, A.; Dworkin, S.B. Performance analysis and optimization of an ejector refrigeration system using alternative working fluids under critical and subcritical operation modes. Energy Convers. Manag. 2018, 176, 209–226. [Google Scholar] [CrossRef]
  6. Chauhan, P.; Kaushik, S.; Tyagi, S. Current status and technological advancements in adsorption refrigeration systems: A review. Renew. Sustain. Energy Rev. 2022, 154, 111808. [Google Scholar] [CrossRef]
  7. Modi, N.; Pandya, B. Integration of evacuated solar collectors with an adsorptive ice maker for hot climate region. Energy Built Environ. 2022, 3, 181–189. [Google Scholar] [CrossRef]
  8. Zhang, F.; Cai, J.; Ji, J.; Han, K.; Ke, W. Experimental investigation on the heating and cooling performance of a solar air composite heat source heat pump. Renew. Energy 2020, 161, 221–229. [Google Scholar] [CrossRef]
  9. Grazzini, G.; Milazzo, A.; Mazzelli, F. Ejectors for Efficient Refrigeration: Design, Applications and Computational Fluid Dynamics; Springer: Cham, Switzerland, 2018. [Google Scholar]
  10. Braimakis, K. Solar ejector cooling systems: A review. Renew. Energy 2021, 164, 566–602. [Google Scholar] [CrossRef]
  11. Tashtoush, B.M.; Al-Nimr, M.A.; Khasawneh, M.A. A comprehensive review of ejector design, performance, and applications. Appl. Energy 2019, 240, 138–172. [Google Scholar] [CrossRef]
  12. Besagni, G.; Mereu, R.; Inzoli, F. Ejector refrigeration: A comprehensive review. Renew. Sustain. Energy Rev. 2016, 53, 373–407. [Google Scholar] [CrossRef] [Green Version]
  13. Chen, G.; Ierin, V.; Volovyk, O.; Shestopalov, K. An improved cascade mechanical compression–ejector cooling cycle. Energy 2019, 170, 459–470. [Google Scholar] [CrossRef]
  14. Sokolov, H.D. Enhanced ejector refrigeration cycles powered by low grade heat. Part 1. Systems characterization. Int. J. Refrig. 1990, 13, 351–356. [Google Scholar]
  15. Sun, D.-W. Solar powered combined ejector-vapour compression cycle for air conditioning and refrigeration. Energy Convers. Manag. 1997, 38, 479–491. [Google Scholar] [CrossRef]
  16. Xu, Y.; Jiang, N.; Wang, Q.; Mao, N.; Chen, G.; Gao, Z. Refrigerant evaluation and performance comparison for a novel hybrid solar-assisted ejection-compression refrigeration cycle. Sol. Energy 2018, 160, 344–352. [Google Scholar] [CrossRef]
  17. Liu, Y.; Yu, M.; Yu, J. An improved 1-D thermodynamic modeling of small two-phase ejector for performance prediction and design. Appl. Therm. Eng. 2022, 204, 118006. [Google Scholar] [CrossRef]
  18. Huang, B.J.; Chang, J.M.; Wang, C.P.; Petrenko, V.A. A 1-D analysis of ejector performance. Int. J. Refrig. 1999, 22, 354–364. [Google Scholar] [CrossRef]
  19. Chen, W.; Liu, M.; Chong, D.; Yan, J.; Little, A.B.; Bartosiewicz, Y. A 1D model to predict ejector performance at critical and sub-critical operational regimes. Int. J. Refrig. 2013, 36, 1750–1761. [Google Scholar] [CrossRef]
  20. Besagni, G.; Cristiani, N.; Croci, L.; Guédon, G.R.; Inzoli, F. Computational fluid-dynamics modelling of supersonic ejectors: Screening of modelling approaches, comprehensive validation and assessment of ejector component efficiencies. Appl. Therm. Eng. 2021, 186, 116431. [Google Scholar] [CrossRef]
  21. Besagni, G.; Inzoli, F. Computational fluid-dynamics modeling of supersonic ejectors: Screening of turbulence modeling approaches. Appl. Therm. Eng. 2017, 117, 122–144. [Google Scholar] [CrossRef]
  22. Chen, W.; Chong, D.; Yan, J.; Liu, J. The numerical analysis of the effect of geometrical factors on natural gas ejector performance. Appl. Therm. Eng. 2013, 59, 21–29. [Google Scholar] [CrossRef]
  23. Jeon, Y.; Kim, S.; Kim, D.; Chung, H.J.; Kim, Y. Performance characteristics of an R600a household refrigeration cycle with a modified two-phase ejector for various ejector geometries and operating conditions. Appl. Energy 2017, 205, 1059–1067. [Google Scholar] [CrossRef]
  24. Pei, P.; Ren, P.; Li, Y.; Wu, Z.; Chen, D.; Huang, S.; Jia, X. Numerical studies on wide-operating-range ejector based on anodic pressure drop characteristics in proton exchange membrane fuel cell system. Appl. Energy 2019, 235, 729–738. [Google Scholar] [CrossRef]
  25. Bai, T.; Xie, H.; Liu, S.; Yan, G.; Yu, J. Experimental investigation on the influence of ejector geometry on the pull-down performance of an ejector-enhanced auto-cascade low-temperature freezer. Int. J. Refrig. 2021, 131, 41–50. [Google Scholar] [CrossRef]
  26. Smolka, J.; Palacz, M.; Bodys, J.; Banasiak, K.; Fic, A.; Bulinski, Z.; Nowak, A.J.; Hafner, A. Performance comparison of fixed- and controllable-geometry ejectors in a CO2 refrigeration system. Int. J. Refrig. 2016, 65, 172–182. [Google Scholar] [CrossRef]
  27. Besagni, G.; Cristiani, N. Multi-scale evaluation of an R290 variable geometry ejector. Appl. Therm. Eng. 2021, 188, 116612. [Google Scholar] [CrossRef]
  28. Varga, S.; Lebre, P.M.; Oliveira, A.C. CFD study of a variable area ratio ejector using R600a and R152a refrigerants. Int. J. Refrig. 2013, 36, 157–165. [Google Scholar] [CrossRef]
  29. Pereira, P.R.; Varga, S.; Soares, J.; Oliveira, A.C.; Lopes, A.M.; de Almeida, F.G.; Carneiro, J.F. Experimental results with a variable geometry ejector using R600a as working fluid. Int. J. Refrig. 2014, 46, 77–85. [Google Scholar] [CrossRef]
  30. Galindo, J.; Dolz, V.; García-Cuevas, L.M.; Ponce-Mora, A. Numerical evaluation of a solar-assisted jet-ejector refrigeration system: Screening of environmentally friendly refrigerants. Energy Convers. Manag. 2020, 210, 112681. [Google Scholar] [CrossRef]
  31. Van Nguyen, V.; Varga, S.; Soares, J.; Dvorak, V.; Oliveira, A.C. Applying a variable geometry ejector in a solar ejector refrigeration system. Int. J. Refrig. 2020, 113, 187–195. [Google Scholar] [CrossRef]
  32. Tang, Y.; Yuan, J.; Liu, Z.; Feng, Q.; Gong, X.; Lu, L.; Chua, K.J. Study on evolution laws of two-phase choking flow and entrainment performance of steam ejector oriented towards MED-TVC desalination system. Energy 2022, 242, 122967. [Google Scholar] [CrossRef]
  33. Fu, W.; Liu, Z.; Li, Y.; Wu, H.; Tang, Y. Numerical study for the influences of primary steam nozzle distance and mixing chamber throat diameter on steam ejector performance. Int. J. Therm. Sci. 2018, 132, 509–516. [Google Scholar] [CrossRef]
  34. Dong, J.; Hu, Q.; Yu, M.; Han, Z.; Cui, W.; Liang, D.; Ma, H.; Pan, X. Numerical investigation on the influence of mixing chamber length on steam ejector performance. Appl. Therm. Eng. 2020, 174, 115204. [Google Scholar] [CrossRef]
  35. Hou, Y.; Chen, F.; Zhang, S.; Chen, W.; Zheng, J.; Chong, D.; Yan, J. Numerical simulation study on the influence of primary nozzle deviation on the steam ejector performance. Int. J. Therm. Sci. 2022, 179, 107633. [Google Scholar] [CrossRef]
  36. Yan, J.; Li, S.; Li, R. Numerical study on the auxiliary entrainment performance of an ejector with different area ratio. Appl. Therm. Eng. 2021, 185, 116369. [Google Scholar] [CrossRef]
  37. Ariafar, K.; Buttsworth, D.; Al-Doori, G.; Malpress, R. Effect of mixing on the performance of wet steam ejectors. Energy 2015, 93, 2030–2041. [Google Scholar] [CrossRef]
  38. Wen, C.; Gong, L.; Ding, H.; Yang, Y. Steam ejector performance considering phase transition for multi-effect distillation with thermal vapour compression (MED-TVC) desalination system. Appl. Energy 2020, 279, 115831. [Google Scholar] [CrossRef]
  39. Ding, H.; Zhao, Y.; Wen, C.; Wang, C.; Sun, C. Energy efficiency and exergy destruction of supersonic steam ejector based on nonequilibrium condensation model. Appl. Therm. Eng. 2021, 189, 116704. [Google Scholar] [CrossRef]
  40. Zhang, G.; Dykas, S.; Yang, S.; Zhang, X.; Li, H.; Wang, J. Optimization of the primary nozzle based on a modified condensation model in a steam ejector. Appl. Therm. Eng. 2020, 171, 115090. [Google Scholar] [CrossRef]
  41. Chen, J.; Huang, Z. Numerical study on carbon dioxide capture in flue gas by converging-diverging nozzle. Fuel 2022, 320, 123889. [Google Scholar] [CrossRef]
  42. Yang, Y.; Karvounis, N.; Walther, J.H.; Ding, H.; Wen, C. Effect of area ratio of the primary nozzle on steam ejector performance considering nonequilibrium condensations. Energy 2022, 237, 121483. [Google Scholar] [CrossRef]
  43. Jabir, E.; Dmitrii, B.; Konstantin, A.; Kim, H.D. Numerical estimation of non-equilibrium condensation of steam in supersonic nozzles. J. Mech. Sci. Technol. 2018, 32, 4649–4655. [Google Scholar] [CrossRef]
  44. Li, Y.; Niu, C.; Shen, S.; Mu, X.; Zhang, L. Double choking characteristics of three-dimensional steam ejector with non-equilibrium condensing. Appl. Therm. Eng. 2022, 211, 118446. [Google Scholar] [CrossRef]
  45. Han, J.; Feng, J.; Peng, X. Phase change characteristics and their effect on the performance of hydrogen recirculation ejectors for PEMFC systems. Int. J. Hydrogen Energy 2021, 47, 1144–1156. [Google Scholar] [CrossRef]
  46. Dadpour, D.; Lakzian, E.; Gholizadeh, M.; Ding, H.; Han, X. Numerical modeling of droplets injection in the secondary flow of the wet steam ejector in the refrigeration cycle. Int. J. Refrig. 2022, 136, 103–113. [Google Scholar] [CrossRef]
  47. Li, Y.; Shen, S.; Niu, C.; Mu, X.; Zhang, L. The effect of variable motive pressures on the performance and shock waves in a supersonic steam ejector with non-equilibrium condensing. Int. J. Therm. Sci. 2023, 185, 108034. [Google Scholar] [CrossRef]
  48. Li, S.; Hu, X.; Lu, J. Analysis and Selection of Working Fluid for Marine Ejection-Compression Air-Conditioning System. In Proceedings of the 2022 7th International Conference on Power and Renewable Energy (ICPRE), Shanghai, China, 23–26 September 2022; pp. 645–649. [Google Scholar] [CrossRef]
  49. Li, F.; Chang, Z.; Tian, Q.; Wu, C.; Wang, X. Performance Predictions of Dry and Wet Vapors Ejectors Over Entire Operational Range. Energies 2017, 10, 1012. [Google Scholar] [CrossRef] [Green Version]
  50. Stoecker, W. Steam-jet refrigeration. In Refrigeration and Air Conditioning; McGraw-Hill: New York, NY, USA, 1958; pp. 194–205. [Google Scholar]
  51. Cardemil, J.M.; Colle, S. A general model for evaluation of vapor ejectors performance for application in refrigeration. Energy Convers. Manag. 2012, 64, 79–86. [Google Scholar] [CrossRef]
  52. Zhu, Y.; Cai, W.; Wen, C.; Li, Y. Fuel ejector design and simulation model for anodic recirculation SOFC system. J. Power Sources 2007, 173, 437–449. [Google Scholar] [CrossRef]
  53. Zarei, A.; Elahi, S.; Pahangeh, H. Design and analysis of a novel solar compression-ejector cooling system with eco-friendly refrigerants using hybrid photovoltaic thermal (PVT) collector. Therm. Sci. Eng. Prog. 2022, 32, 101311. [Google Scholar] [CrossRef]
  54. Hill, P.G. Condensation of water vapour during supersonic expansion in nozzles. J. Fluid Mech. 1966, 25, 593–620. [Google Scholar] [CrossRef]
  55. Young, J.B. Two-Dimensional, Nonequilibrium, Wet-Steam Calculations for Nozzles and Turbine Cascades. J. Turbomach. 1992, 114, 569–579. [Google Scholar] [CrossRef]
  56. Zhou, Y.; Liu, J.; Mo, Y.; Chen, W.; Xiao, Q.; Li, Y.; Yan, J. Numerical simulation on the direct contact condensation in a steam-water two-phase ejector with non-condensable gas. Int. J. Therm. Sci. 2023, 185, 108030. [Google Scholar] [CrossRef]
  57. Sharifi, N.; Boroomand, M.; Sharifi, M. Numerical assessment of steam nucleation on thermodynamic performance of steam ejectors. Appl. Therm. Eng. 2013, 52, 449–459. [Google Scholar] [CrossRef]
  58. Yang, Y.; Walther, J.H.; Yan, Y.; Wen, C. CFD modeling of condensation process of water vapor in supersonic flows. Appl. Therm. Eng. 2017, 115, 1357–1362. [Google Scholar] [CrossRef]
  59. Wen, C.; Li, B.; Ding, H.; Akrami, M.; Zhang, H.; Yang, Y. Thermodynamics analysis of CO2 condensation in supersonic flows for the potential of clean offshore natural gas processing. Appl. Energy 2022, 310, 118523. [Google Scholar] [CrossRef]
  60. Li, Y.; Niu, C.; Shen, S.; Mu, X.; Zhang, L. Turbulence Model Comparative Study for Complex Phenomena in Supersonic Steam Ejectors with Double Choking Mode. Entropy 2022, 24, 1215. [Google Scholar] [CrossRef]
  61. Pianthong, K.; Seehanam, W.; Behnia, M.; Sriveerakul, T.; Aphornratana, S. Investigation and improvement of ejector refrigeration system using computational fluid dynamics technique. Energy Convers. Manag. 2007, 48, 2556–2564. [Google Scholar] [CrossRef]
  62. Muhammad, H.A.; Abdullah, H.M.; Rehman, Z.; Lee, B.; Baik, Y.-J.; Cho, J.; Imran, M.; Masud, M.; Saleem, M.; Butt, M.S. Numerical Modeling of Ejector and Development of Improved Methods for the Design of Ejector-Assisted Refrigeration System. Energies 2020, 13, 5835. [Google Scholar] [CrossRef]
  63. Zhang, G.; Wang, X.; Pourranjbar, D.; Dykas, S.; Li, H.; Chen, J. The comprehensive analysis of the relationship between the latent heat, entrainment ratio, and ejector performance under different superheating degree conditions considering the non-equilibrium condensation. Appl. Therm. Eng. 2022, 200, 117701. [Google Scholar] [CrossRef]
  64. Zhu, Y.; Jiang, P. Experimental and numerical investigation of the effect of shock wave characteristics on the ejector performance. Int. J. Refrig. 2014, 40, 31–42. [Google Scholar] [CrossRef]
  65. Elbarghthi, A.F.; Mohamed, S.; Nguyen, V.V.; Dvorak, V. CFD Based Design for Ejector Cooling System Using HFOS (1234ze(E) and 1234yf). Energies 2020, 13, 1408. [Google Scholar] [CrossRef] [Green Version]
  66. Besagni, G.; Mereu, R.; Chiesa, P.; Inzoli, F. An Integrated Lumped Parameter-CFD approach for off-design ejector performance evaluation. Energy Convers. Manag. 2015, 105, 697–715. [Google Scholar] [CrossRef]
  67. Ding, H.; Zhao, Y.; Wen, C.; Wang, C.; Liu, X. A visual mass transfer study in the ejector considering phase change for multi-effect distillation with thermal vapour compression (MED-TVC) desalination system. Desalination 2022, 532, 115722. [Google Scholar] [CrossRef]
  68. Li, S.; Liu, Y.; Liu, Y.; Zhang, J. Performance comparison of ejectors in ejector-based refrigeration cycles with R1234yf, R1234ze(E) and R134a. Environ Sci. Pollut. Res. Int. 2021, 28, 57166–57182. [Google Scholar] [CrossRef] [PubMed]
  69. Chen, W.; Shi, C.; Zhang, S.; Chen, H.; Chong, D.; Yan, J. Theoretical analysis of ejector refrigeration system performance under overall modes. Appl. Energy 2017, 185, 2074–2084. [Google Scholar] [CrossRef]
  70. Sriveerakul, T.; Aphornratana, S.; Chunnanond, K. Performance prediction of steam ejector using computational fluid dynamics: Part 2. Flow structure of a steam ejector influenced by operating pressures and geometries. Int. J. Therm. Sci. 2007, 46, 823–833. [Google Scholar] [CrossRef]
  71. Sriveerakul, T.; Aphornratana, S.; Chunnanond, K. Performance prediction of steam ejector using computational fluid dynamics: Part 1. Validation of the CFD results. Int. J. Therm. Sci. 2007, 46, 812–822. [Google Scholar] [CrossRef]
  72. Zhang, G.; Dykas, S.; Li, P.; Li, H.; Wang, J. Accurate condensing steam flow modeling in the ejector of the solar-driven refrigeration system. Energy 2020, 212, 118690. [Google Scholar] [CrossRef]
  73. Yang, Y.; Zhu, X.; Yan, Y.; Ding, H.; Wen, C. Performance of supersonic steam ejectors considering the nonequilibrium condensation phenomenon for efficient energy utilisation. Appl. Energy 2019, 242, 157–167. [Google Scholar] [CrossRef] [Green Version]
  74. Ruangtrakoon, N.; Thongtip, T.; Aphornratana, S.; Sriveerakul, T. CFD simulation on the effect of primary nozzle geometries for a steam ejector in refrigeration cycle. Int. J. Therm. Sci. 2013, 63, 133–145. [Google Scholar] [CrossRef]
  75. Liu, H.; Wen, C.; Yuen, A.C.Y.; Han, Y.; Cheung, S.C.-P.; Kook, S.; Yeoh, G.H. A novel thermal management system for battery packs in hybrid electrical vehicles utilising waste heat recovery. Int. J. Heat Mass Transf. 2022, 195, 123199. [Google Scholar] [CrossRef]
  76. Zhang, G.; Zhang, X.; Wang, D.; Jin, Z.; Qin, X. Performance evaluation and operation optimization of the steam ejector based on modified model. Appl. Therm. Eng. 2019, 163, 114388. [Google Scholar] [CrossRef]
  77. Sharifi, N. Numerical study of non-equilibrium condensing supersonic steam flow in a jet-pump based on supersaturation theory. Int. J. Mech. Sci. 2020, 165, 105221. [Google Scholar] [CrossRef]
  78. Gyarmathy, G. Grundlagen Einer Theorie der Nassdampfturbine. Ph.D. Thesis, Eidgenössische Technische Hochschule Zürich, Zurich, Switzerland, 1962. [Google Scholar]
Figure 1. Schematic and P-h diagram of the proposed bi-evaporator ejection–compression refrigeration cycle (a); Enthalpy–entropy graphics of the working procedure for wet steam (b).
Buildings 13 01672 g001aBuildings 13 01672 g001b
Figure 2. CFD model settings and structured meshing of the baseline geometry [69].
Buildings 13 01672 g002aBuildings 13 01672 g002b
Figure 3. Axial static pressure distribution at various grid levels.
Buildings 13 01672 g003
Figure 4. Validation of the wet steam ejector model.
Buildings 13 01672 g004
Figure 5. Axial distribution of Mach number: (a) dry steam and wet steam profiles; and (b) dry steam and wet steam contours.
Buildings 13 01672 g005
Figure 6. Axial distribution of static temperature: (a) dry steam and wet steam profiles; and (b) dry steam and wet steam contours.
Buildings 13 01672 g006
Figure 7. The effect of key geometry parameters consists of (a) primary nozzle diameter and (b) area ratio on the entrainment ratio and the global COP.
Buildings 13 01672 g007
Figure 8. Profiles of Mach number (a), droplet average radius (b), droplet nucleation rate (c), and liquid fraction (d) along the ejector center line with different primary nozzle diameter ratios.
Buildings 13 01672 g008aBuildings 13 01672 g008b
Figure 9. Profiles of Mach number (a), droplet average radius (b), droplet nucleation rate (c), and liquid fraction (d) along the ejector center line with different area ratios.
Buildings 13 01672 g009aBuildings 13 01672 g009b
Figure 10. Profiles and contours of Mach number, subcooled vapor temperature, droplet nucleation rate, and liquid mass fraction in the ejector ( γ d = 2.4 and A R = 5 ). (a) Profiles of Mach number and subcooled vapor temperature. (b) Profiles of droplet nucleation rate and liquid mass fraction. (c) Contours of Mach number, subcooled vapor temperature, droplet nucleation rate, and liquid mass fraction.
Buildings 13 01672 g010aBuildings 13 01672 g010b
Table 1. Effect of area ratio and nozzle exit position.
ReferenceModelArea Ratio and Nozzle Exit Position
Chen et al. [22]CFD, natural gasThe N X P varies between 3.6 and 7.2 mm to obtain the maximum entrainment ratio. In addition, it is displayed between 1.2   and   7.2   mm for the optimal pressure ratio.
Jeon et al. [23]Experiment, R600aThe maximum pressure ratio was attained at NXP = 3 mm.
Pei et al. [24]CFD, Hydrogen gasWhen the NXP exceeds the optimal range, the hydrogen entrainment ratio drops sharply in the entire operating range. The optimum A R ranges from 3   to   3.54 .
Bai et al. [25]Experiment, R23/R600aThe main factors affecting the available freezing temperature and the cooling rate are the mixing chamber length and the nozzle throat, rather than the mixing chamber diameter and the position of the nozzle outlet.
Table 2. Variable geometry ejector literature review.
ReferenceStudy FluidOperating ConditionsKey Results
Varga et al. [28]CFD
Spindle
R152a
R600a
T e = 10   ° C
  25   ° C < T c < 44   ° C
  70   ° C < T g < 90   ° C
By adjusting the position of the spindle, an improvement in the entrainment ratio of up to 177% is achieved.
Pereira et al. [29]Experimental
Spindle
R600a T e = 9   ° C
  15   ° C < T c < 31   ° C
  T g = 83   ° C
0.4 < COP < 0.8
The COP is increased up to 85% with the variable geometry ejector.
Galindo et al. [30]Theoretical
Spindle
R1234yf T e = 13   ° C
  T c = 40   ° C
  T g = 101   ° C
0.36 < COP < 0.48
There was an improvement in COP from 0.34 and 0.31 (in July and May, respectively) to 0.42 and 0.48.
Van Nguyen et al. [31]Experimental
Spindle, NXP
R600a T e = 8.5   ° C
  84   ° C < T g < 90   ° C
0.19 < COP < 0.29
The COP is increased by 24% compared to the fixed geometry ejector.
Besagni and Cristiani [27]Theoretical
Spindle
R290 9   ° C < T e < 19   ° C
  20   ° C < T c < 40   ° C
  84   ° C < T g < 104   ° C
0.18 < COP < 1.1
Increasing the area ratio by 33% resulted in an average COP enhancement of 57.1%.
Table 3. Classification of viewpoints in steam ejectors considering non-equilibrium condensation.
ReferenceRemarks
Zhang et al. [40]This study presented a modified condensation model to optimize steam ejector performance. The primary nozzle is optimized using the Multi-Objective Genetic Algorithm method, resulting in a 27.5% increase in entrainment ratio.
Li et al. [44]This study investigated the relationship between double choking characteristics and ejector performance. Results showed that the double choking mode occurs when the minimum distance between the sonic velocity line and the wall is 0.21 mm, and the second choking position is 4 mm downstream of the diffuser entrance.
Han et al. [45]This study analyzed the effect of phase change on the performance of a hydrogen recirculation ejector in proton exchange membrane fuel cell systems. The results showed that a higher entrainment ratio predicted by the two-phase flow model compared to the single-phase flow model. Droplet nucleation occurs at the junction of primary and secondary flow, with the nucleation rate increasing with primary flow pressure.
Dadpour et al. [46]This study investigated the effect of droplets injection at secondary flow on the performance of ejector refrigeration cycle. Results showed that a decrease in COP, and entrainment ratio with increasing wetness and number of droplets in the secondary flow.
Li et al. [47]The study examined how variable motive pressures affect the performance and shock waves in the system. Results indicated that increasing the motive pressure led to an improvement in the entrainment ratio and a reduction in the strength of the condensation shock wave, but it also resulted in an increase in the total pressure loss coefficient.
Table 4. Physical properties of the refrigerants (Critical temperature T c , Critical pressure P c , Boiling point T b * ) [5].
Refrigerant T c (°C) P c (MPa) T b * (°C) Weight
( g m o l 1 )
ODPGWPSafety GroupFluid Type
R141b204.44.2132.1116.950.11725A2dry
R245fa153.93.6515.1134.0501050B1
R1336mzz(Z)171.32.9033.4164.1002A1
R1233zd(E)166.03.6019.0131.004.5A1
R245fa2171.73.4329.24150.00286
R365mfc186.93.2740.18148.101110
R134a101.04.10−26.0102.0301430A1Wet
R29096.684.25−42.144.103A3
R1234ze(Z)150.13.539.2811406A2L
R1234yf94.73.38−29.4911404A2LIsentropic
R1234ze(E)109.43.63−19.2811406A2L
R600a134.73.64−11.6858.1204A3
Table 5. Nominal operating conditions.
Temperature (°C)Pressure (kPa)
Primary flow100101.42
Secondary flow182.53
Mixed flow/5.95
Table 6. Scheme of the ejector geometric design procedure [53].
DiameterValue (mm)LengthValue (mm)
Nozzle entrance D p 17Nozzle convergent section length S 1 16
Nozzle throat D t h 5Nozzle throat length S 2 4
Nozzle exit D 4 13Nozzle divergent section length S 3 22
Mixing throat D 2 25Mixing chamber length L 1 + L 2 190
Suction chamber inlet D 1 40Constant-area Mixing chamber length L 2 75
Diffuser outlet D 3 43Diffuser length L 3 130
Table 7. Mesh sensitivity analysis.
Grid NumberSecondary Mass Flow Rate
  ( g s 1 )
ErrorEntrainment RatioError
25 k1.487/0.572/
60 k1.462 1.68%0.5831.92%
90 k1.4540.55%0.5771.03%
110 k1.4430.48%0.5750.35%
Disclaimer/Publisher’s Note: The statements, opinions and data contained in all publications are solely those of the individual author(s) and contributor(s) and not of MDPI and/or the editor(s). MDPI and/or the editor(s) disclaim responsibility for any injury to people or property resulting from any ideas, methods, instructions or products referred to in the content.

