Abstract
In this study, the flow patterns and fluctuating wind pressure characteristics around the roof of a spherical dome with a low rise–span ratio (f/D) were analyzed in detail. Significant differences were observed when compared to the results of previous studies on spherical dome roofs with relatively high f/D. The flow-pattern-based zone divisions and zone-specific pressure spectra models proposed in previous studies have limitations when applied to a spherical dome with an f/D ratio of 0.1, which is the subject of this study. Therefore, this study modified and proposed zone division and pressure spectra modeling methods based on the zone division and pressure spectra models of previous studies, and applied them to spherical dome roofs with a low rise–span ratio. Based on spectral statistics, the average error between the measured and simulated spectra was less than 4%, demonstrating high accuracy.
1. Introduction
Spherical dome roofs are commonly used in large structures requiring large interior spaces, such as stadiums. They are composed of lightweight materials, such as membranes or metal panels, in a long-span structure. Because of these characteristics, they have high flexibility, small mass, and low natural frequencies, making them sensitive to wind loads. Therefore, it is necessary to consider not only the peak wind pressure acting on the roof but also the fatigue damage caused by wind pressure fluctuations that occur repeatedly over time. The curvature of the dome roof affected the separation point and reattachment location under various conditions, thereby significantly influencing the flow patterns around the structure. Several studies have been conducted on the wind–pressure distribution of spherical dome roofs. Toy et al. [1] and Taylor [2] explained that the wind pressure distribution on spherical dome roofs can change according to the approaching flow characteristics and the Reynolds number. Accordingly, various studies have been conducted to clarify the characteristics of wind pressure distribution on dome roofs according to the approaching flow, Reynolds number, and shape. Uematsu et al. [3] investigated the characteristics of wind pressure distribution according to variations in the rise-span ratio (f/D) and height-span ratio (h/D) to analyze the characteristics of wind pressure owing to shape changes in dome roofs. They confirmed that changes in f/D significantly affected the wind pressure distribution. Letchford and Sakar [4] built upon the research of Toy et al. [1] and Taylor [2] to investigate the distributions of the average and fluctuating wind pressures on dome roofs at various Reynolds numbers. They observed that the wind pressure distribution remained constant within the Reynolds number range of to . In addition, they observed that when the surface roughness increased at these Reynolds numbers, the negative pressure at the apex of the dome roof decreased and the negative pressure in the wake zone increased, leading to a decrease in lift and an increase in drag on the dome roof. Cheng and Fu [5] investigated wind pressure distribution according to the Reynolds number for various dome roof sizes in smooth and turbulent boundary layers. In smooth boundary layers, they observed the wind pressure distribution to be relatively stable when the Reynolds number was less than or equal to ; however, in turbulent boundary layers, they confirmed that the wind pressure distribution was stable when the Reynolds number was between and . Noguchi and Uematsu [6] conducted a detailed analysis of the wind pressure distribution characteristics according to f/D and h/D and proposed zone-specific wind pressure coefficients for frame and cladding designs. Lee et al. [7] investigated various h/D wind pressure distribution characteristics for elliptical closed and open dome roofs and confirmed that the wind pressure may increase depending on the wind direction, although it shows a similar wind pressure distribution pattern to that of the circular dome roof. Based on the analysis, a peak pressure coefficient was proposed for the cladding design. Rizzo and Avossa [8] analyzed the aerodynamic characteristics through wind tunnel tests on a large-span project canopy roof for the Pescara football stadium in Italy. According to the results of their research, wind pressure is greatly influenced by wind direction, and, owing to the unusual roof shape, the calculation of the wind load through the wind load code may be partially overestimated compared to the actual wind load. Sun et al. [9] conducted wind tunnel tests on various wind directions, f/D, eave heights, and terrain roughness of membrane structures that are widely used in dome roofs. The experimental results confirmed that the mean wind pressure was significantly affected by the wind direction and f/D, and the terrain roughness had a slight effect on the mean wind pressure; however, the height factor was insignificant. Zhang [10] analyzed the mean and fluctuating wind pressure distribution characteristics, power spectral density, and coherence of the fluctuating wind pressure between different measurement points through wind tunnel tests on large-span canopy roof structures. Kumar and Stathopoulos [11] analyzed the characteristics of pressure spectra on flat rectangular roofs and mono-slope roofs and proposed Gaussian and non-Gaussian spectral models based on spectral patterns. Uematsu et al. [12] investigated the fluctuating wind pressure characteristics on flat circular plane roofs and proposed a spectral model as a function of the geometrical parameters of a building combined with approaching flow turbulence parameters. Lo and Kanda [13] analyzed the flow patterns around structures by examining the power and cross spectra of the fluctuating wind pressure on spherical domes and proposed a zone division method that can be used for a wind-resistant design based on flow patterns. Sun et al. [14] analyzed the spectra and patterns under various conditions for 12 dome models with various geometric parameters and proposed zone-specific spectral models divided into three zones. The aforementioned studies by Uematsu et al. [12], Lo and Kanda [13], and Sun et al. [14] focused on flat roofs and spherical domes with f/D ratios ranging from 0.14 to 0.5, thus limiting their ability to understand the characteristics of the fluctuating pressure spectra for domes with low f/Ds. Recently, large-space roofs have been predominantly constructed as retractable roofs that are not affected by weather and offer energy-saving effects, such as daylighting and ventilation. These dome roofs have f/D ratios ranging from 0 to 0.18, with most cases having f/D ratios below 0.1. Based on the results of research on the general wind pressure distribution, we expect that the flow patterns around the roof may change when f/D is relatively low [15,16,17,18,19,20]. According to previous studies, the positive pressure is dominant when the f/D of the dome roof is high, whereas the negative pressure is dominant when the f/D is low. This is because, as f/D decreases, the direct effect of the approach flow decreases, and phenomena such as separation occur. Many studies have been conducted on the mean and peak pressures of relatively various f/Ds values; however, studies on the pressure spectra are limited.
In this study, the characteristics of fluctuating wind pressure were analyzed in a spherical dome with a low f/D. During the wind tunnel experiment, the wind pressure data of spherical domes for various h/D values at an f/D of 0.1 were collected. As mentioned above, the f/D value was targeted at 0.1, which is the average value for an actual dome roof with a low rise-span ratio. Subsequently, the obtained wind pressure coefficient and spectral data were analyzed, and the fluctuating wind pressure characteristics and flow patterns around the roof were discussed in detail. Additionally, the applicability of the spectral model proposed in a previous study was investigated. Based on the analysis results, zone divisions were proposed according to the flow patterns of spherical dome roofs with low f/D values and modified spectral models for each zone.
2. Wind Tunnel Tests
2.1. Test Model
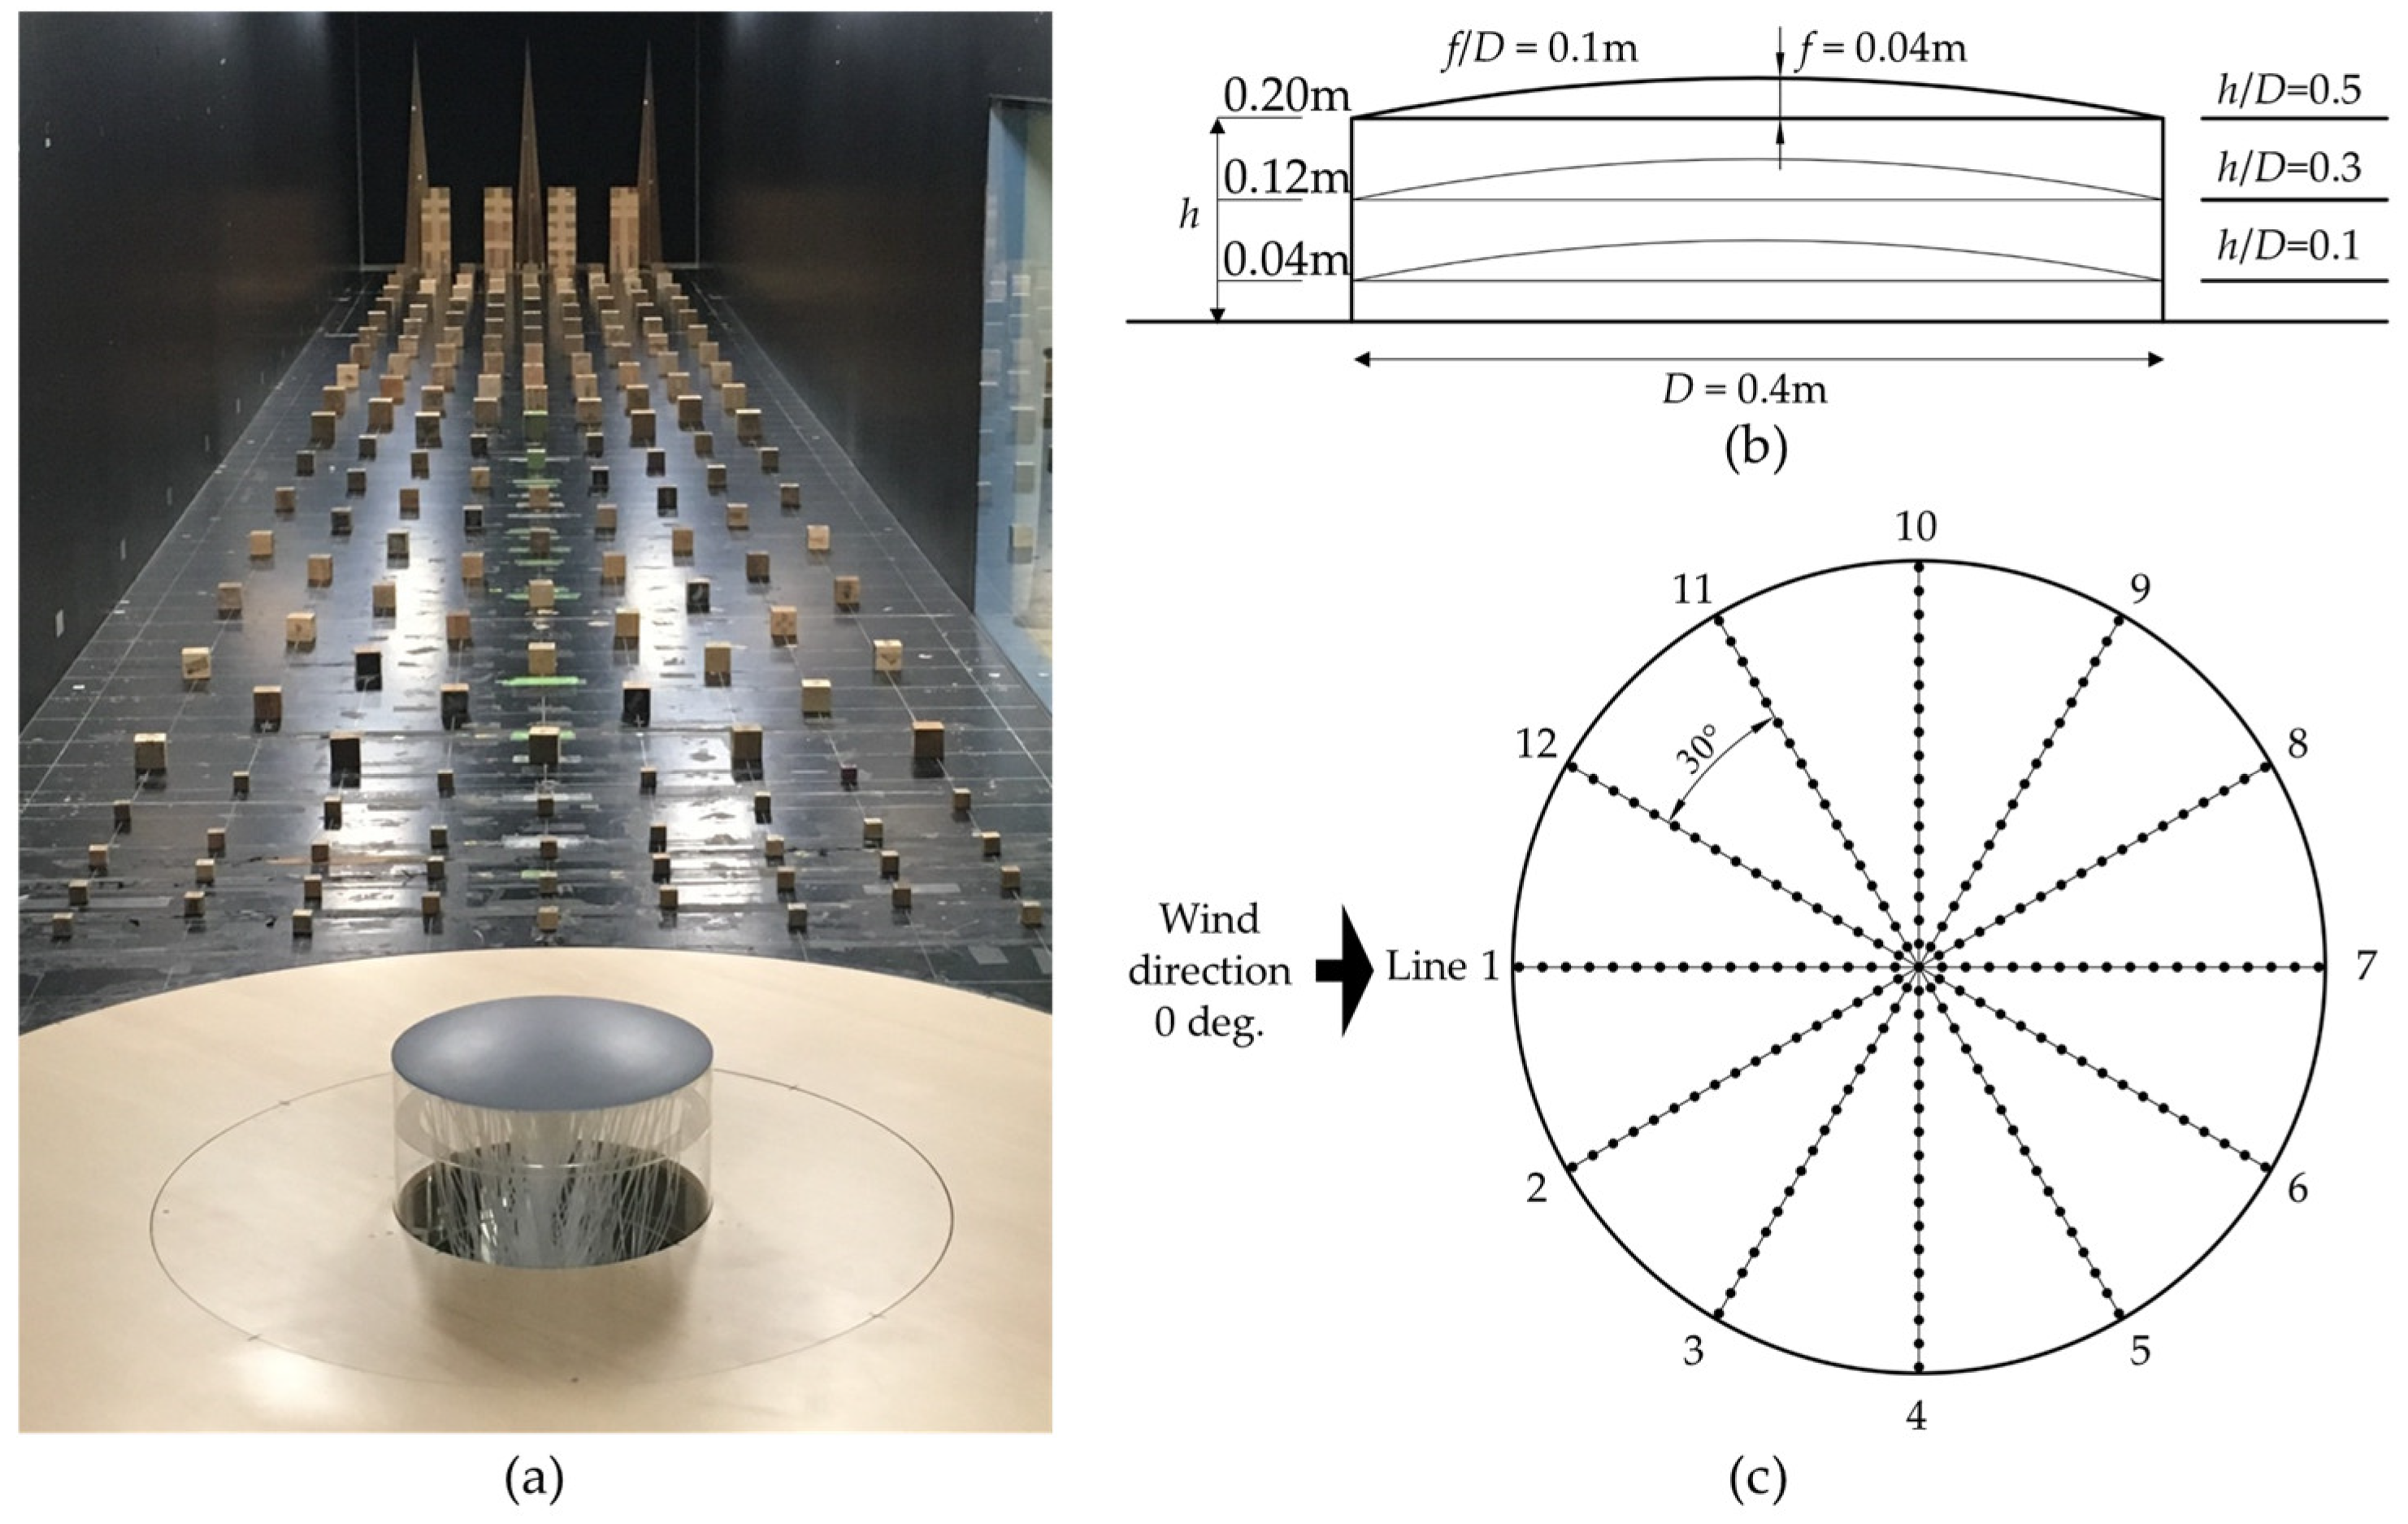
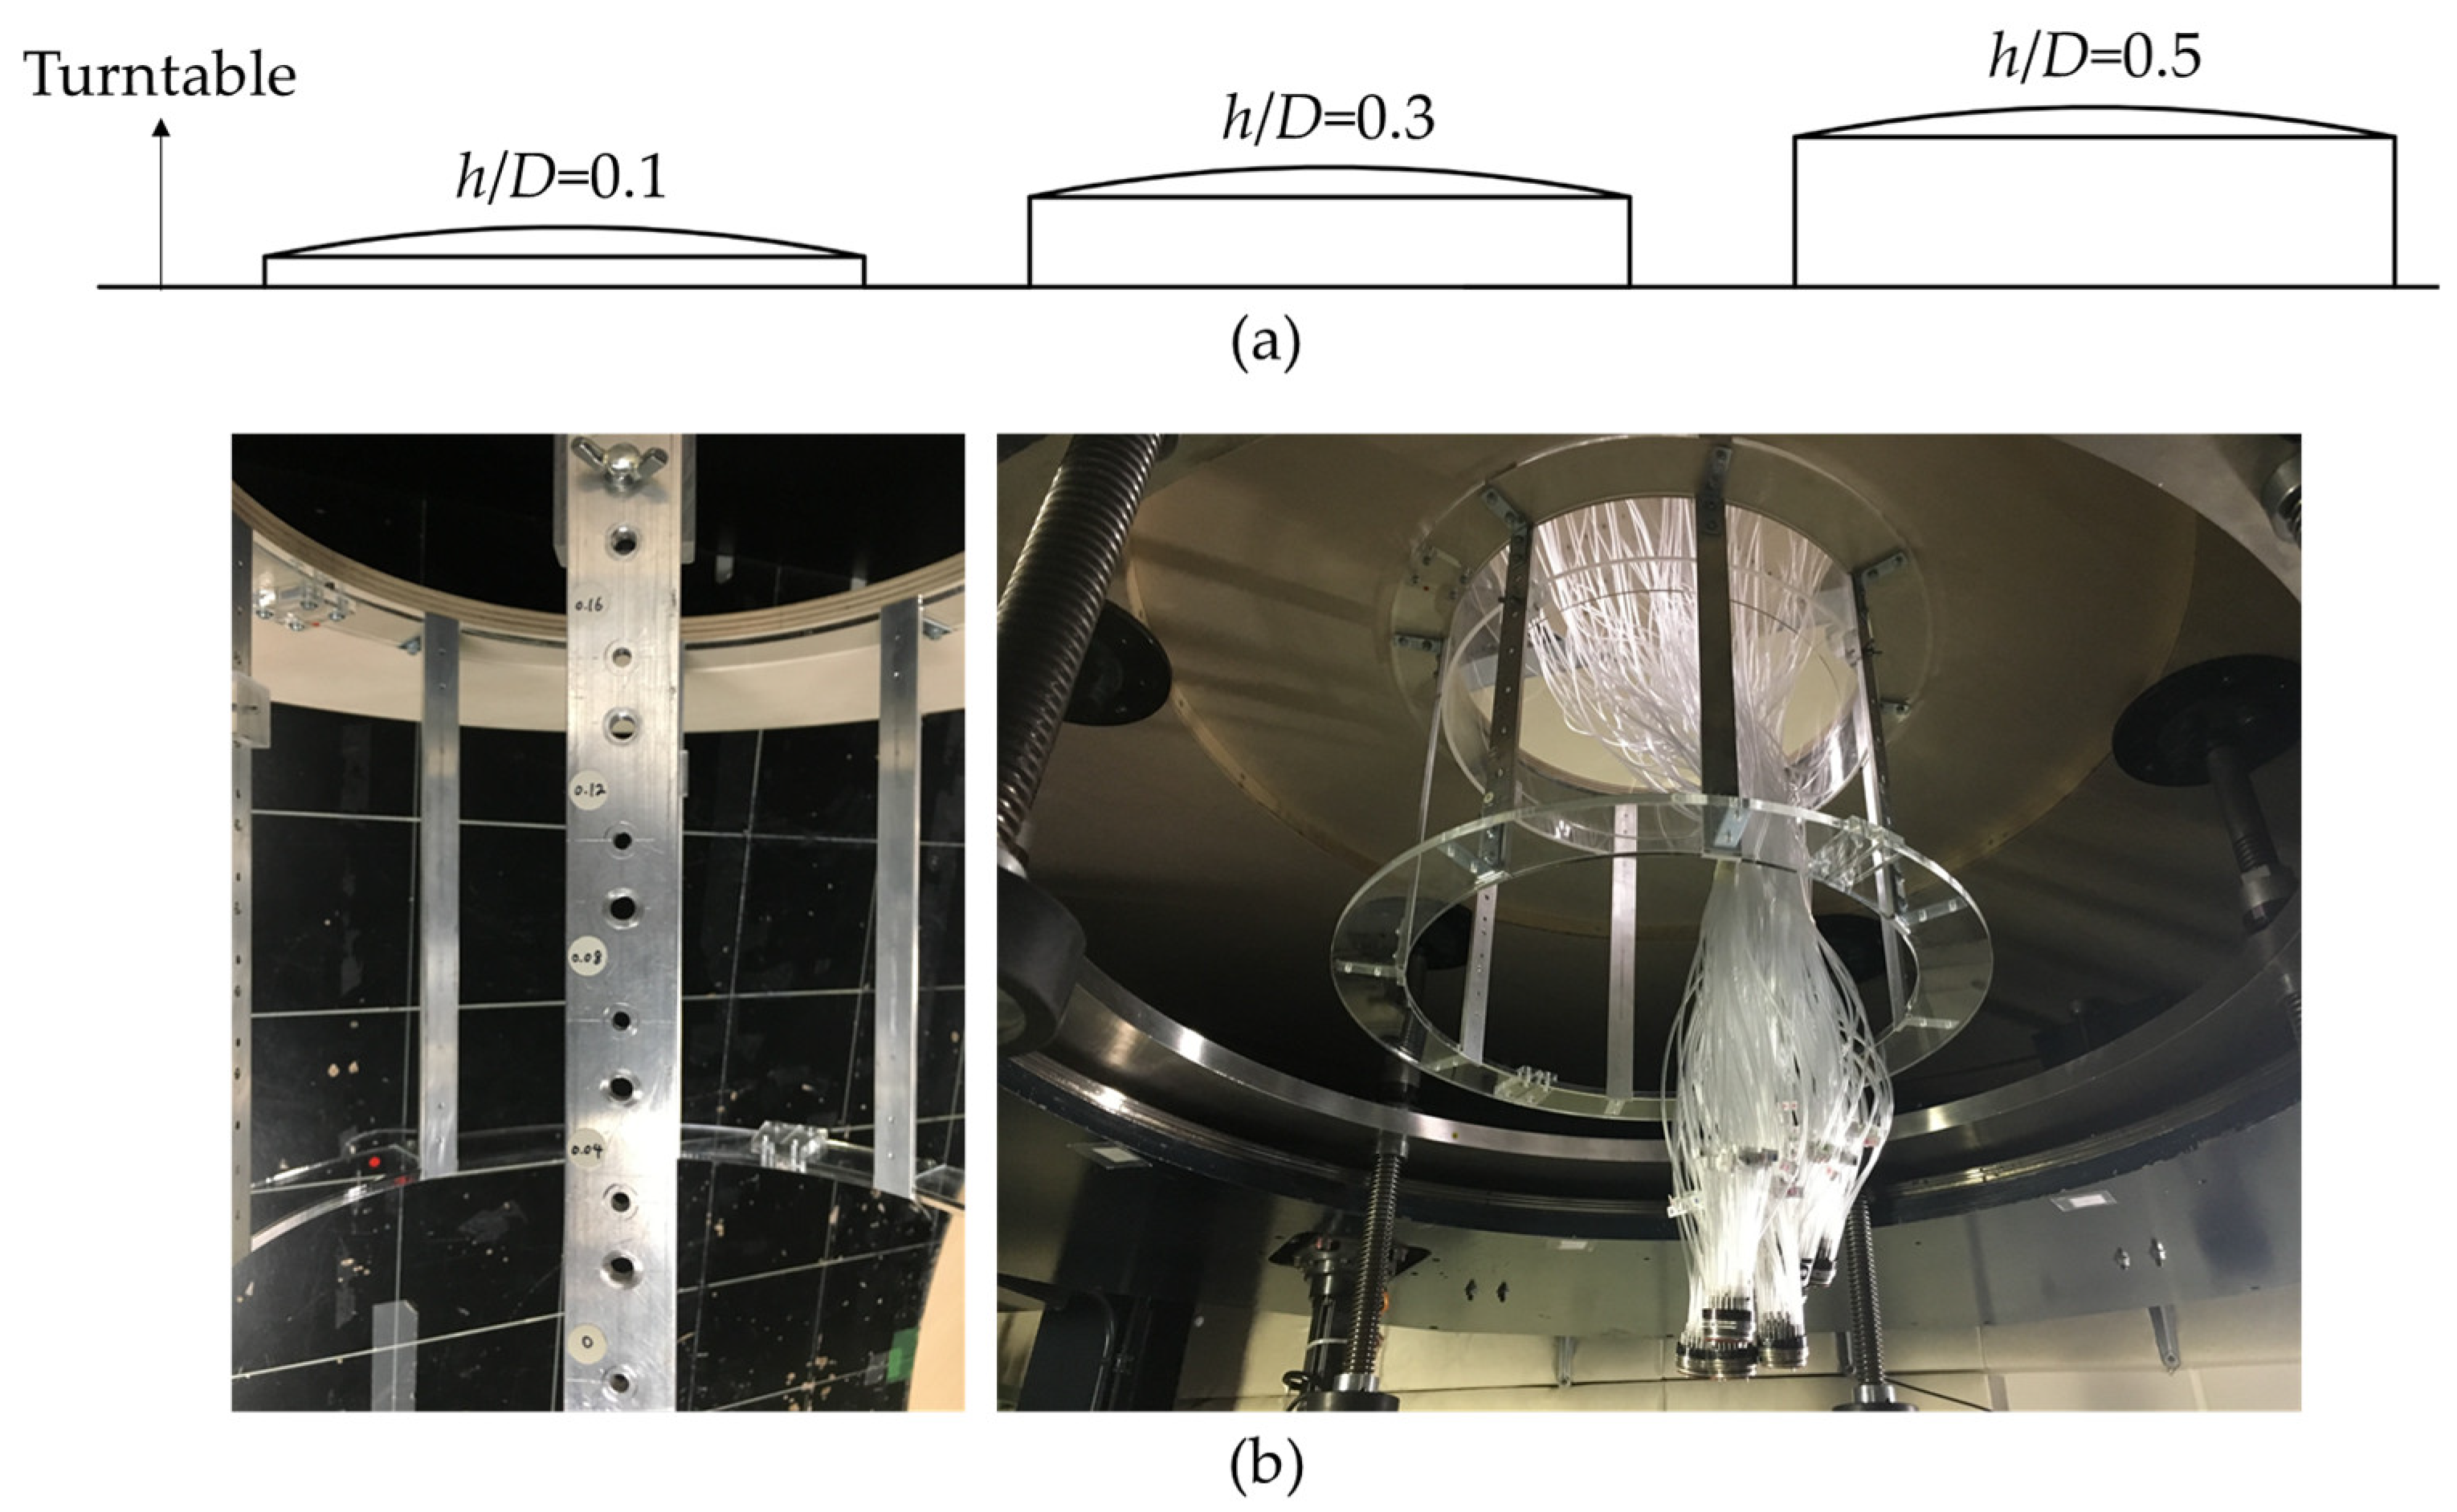
The wind tunnel experiments were conducted at a large boundary layer wind tunnel laboratory located at Tokyo Polytechnic University. The model used in the experiments and pressure taps installed on the roof are shown in Figure 1. The model has a length scale of 1/150, resulting in a rise (f) of 0.04 m and a span (D) of 0.4 m for the roof. The height of the model was adjusted in increments of 0.08 m using a turntable, and the experiments were conducted at heights of 0.04, 0.12, and 0.20 m. Table 1 lists the detailed dimensions of the model. Figure 1b shows the dimensions of the model: f/D and h/D. Figure 1c shows the pressure taps and wind directions used in these experiments. In the experiment, 205 pressure taps were placed on the roof of the model along 12 lines. Each line was arranged at 30° intervals, with 18 pressure taps installed per line, including a pressure tap at the center of the dome. Because the spherical dome roofs exhibited symmetrical values along the centerline, the wind direction was not adjusted. Figure 2a shows the cross-sections of the model with varying h/D values. Figure 2b shows the height adjustment tool of the experimental model installed under the turntable. While adjusting the height of the model using the tool shown in Figure 2b, the wind pressure data for h/D = 0.1, 0.3, and 0.5 were obtained.

Figure 1.
Experimental model and pressure taps installed on the roof surfaces of the model: (a) experimental model; (b) section of the model; and (c) location of pressure taps and wind direction.

Table 1.
Model dimensions.
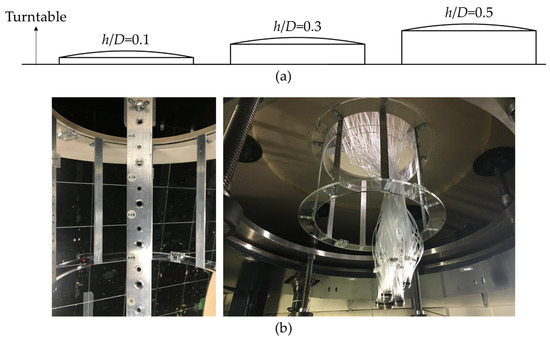
Figure 2.
Section of the model according to h/D: (a) section of the model; and (b) height adjustment tool for model.
2.2. Characteristics of Approaching Flow and Data Acquisition
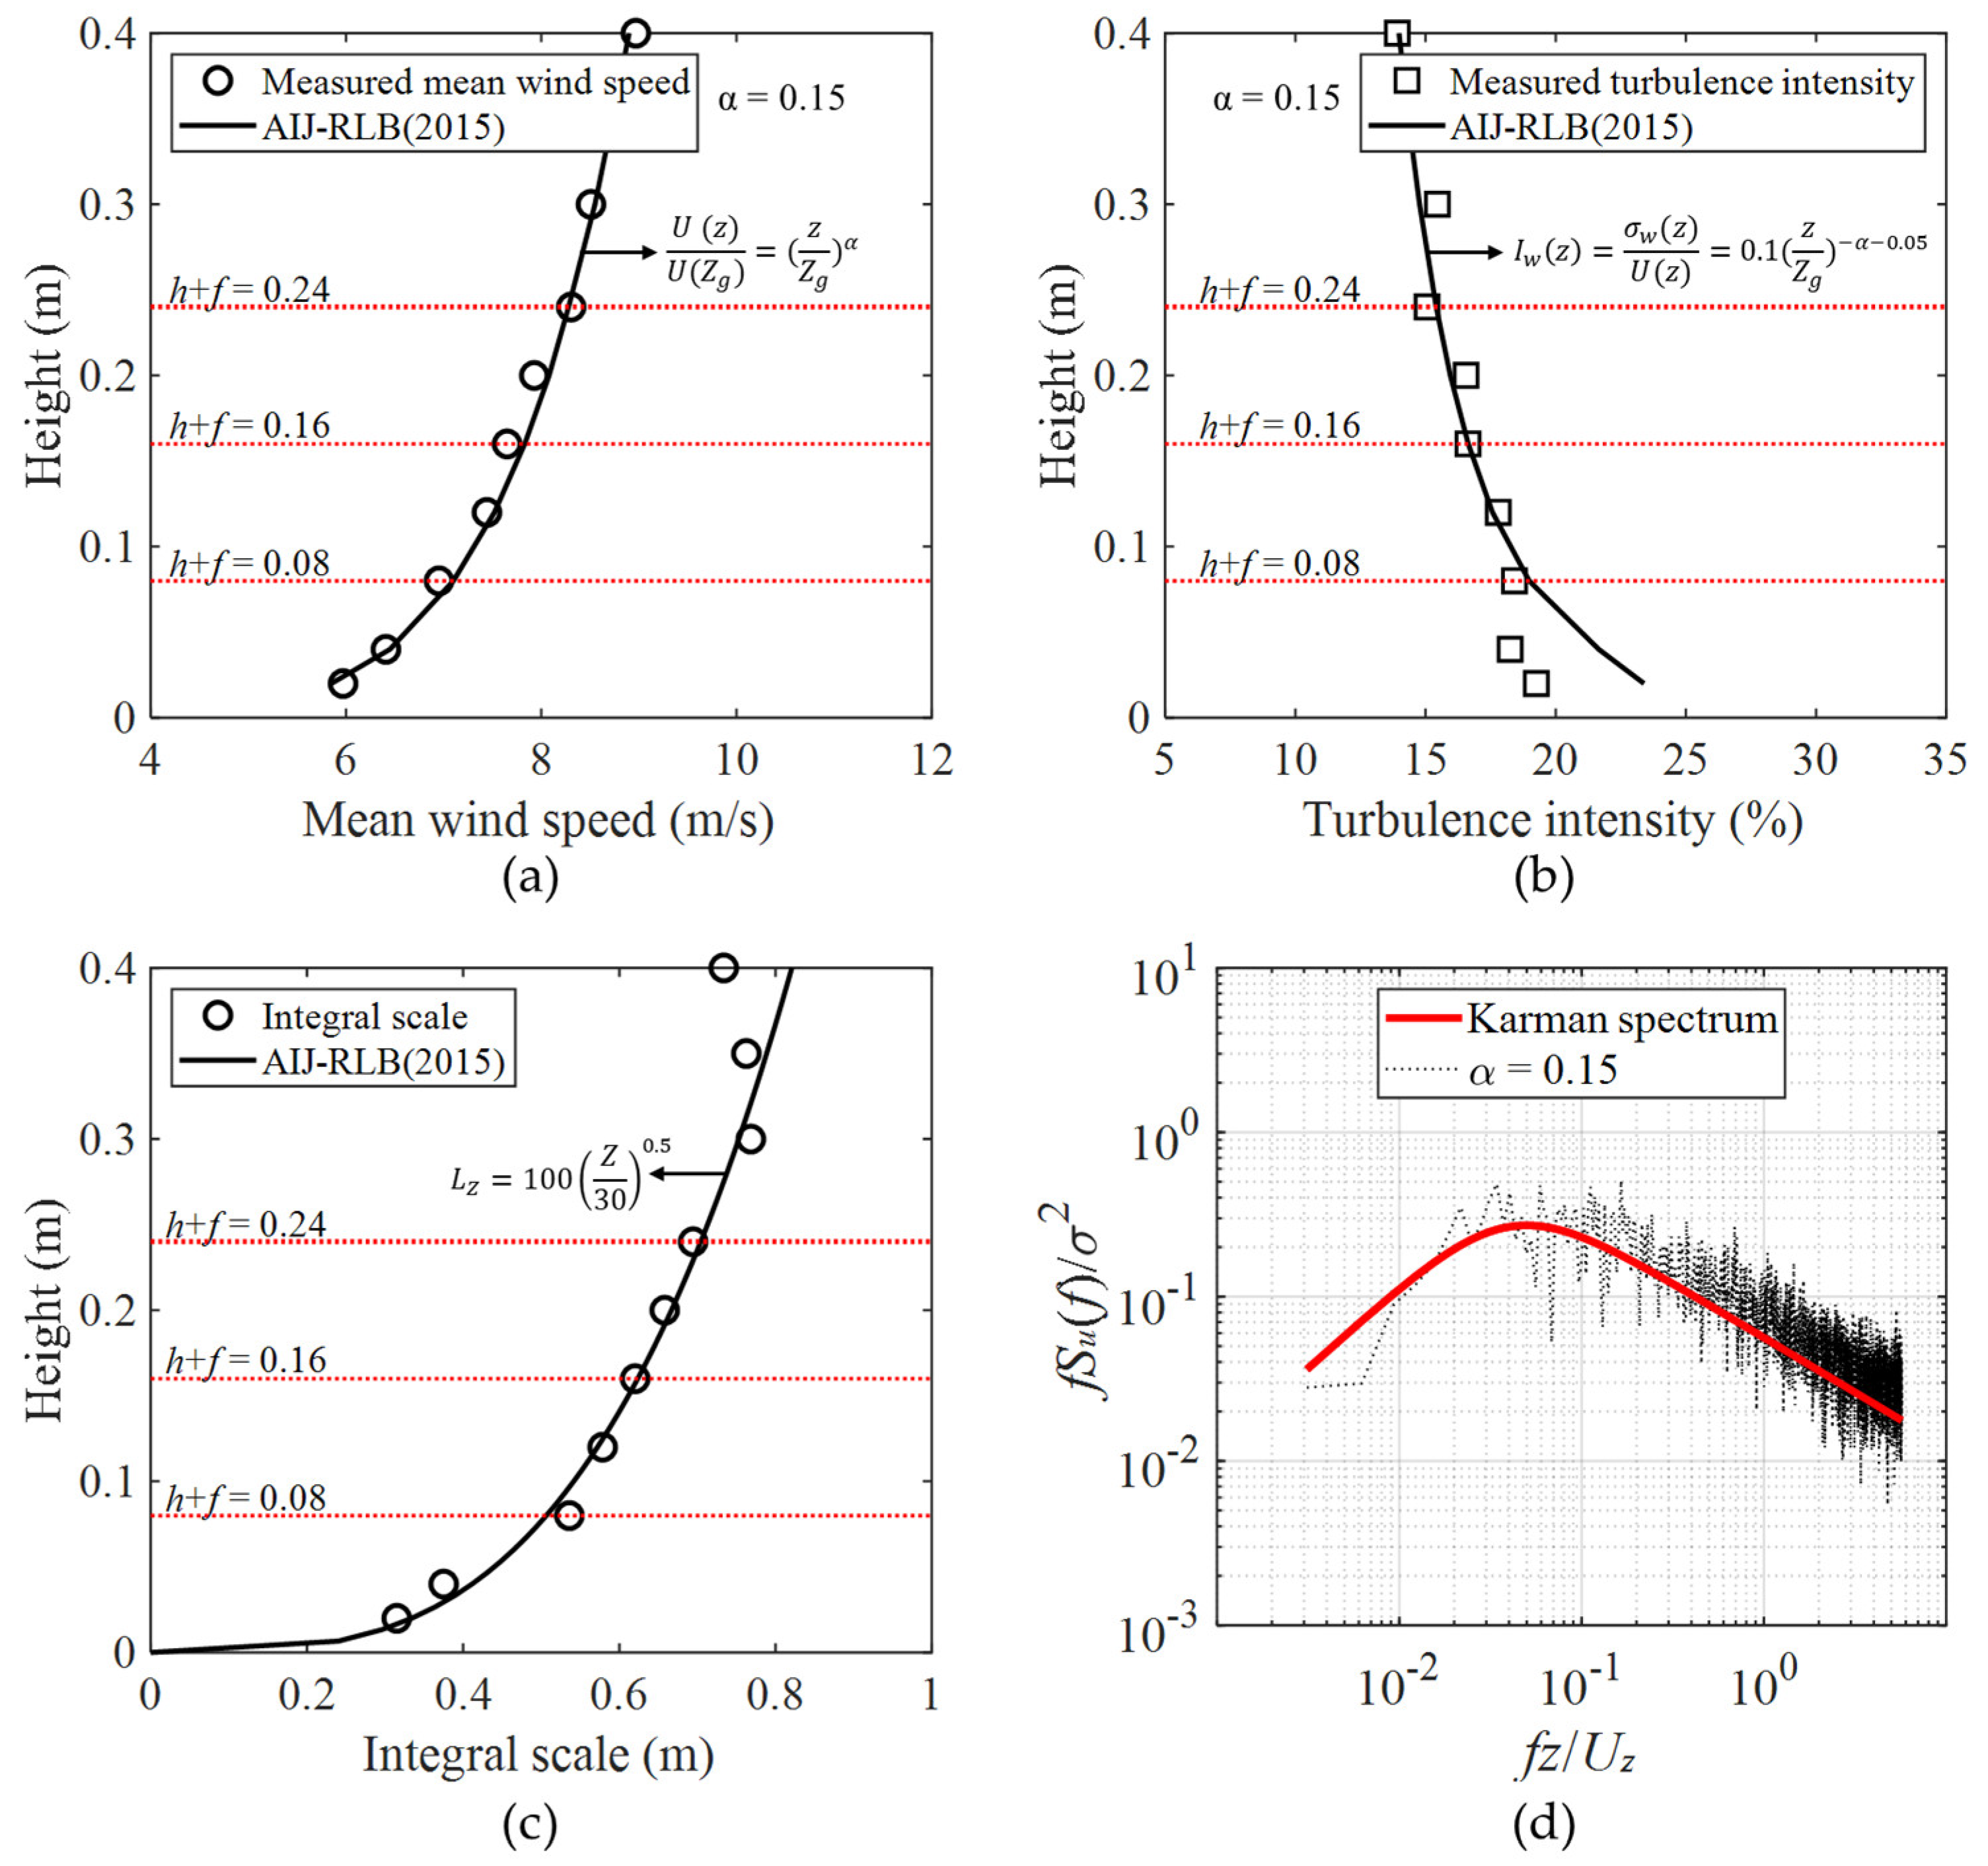
The measurement section of the boundary layer wind tunnel had dimensions of 2.2 m (width) × 1.8 m (height), with a length of 19 m. Assuming a nonurban area, the power-law exponent (α) of the mean wind speed profile was set to 0.15, referring to the Japanese wind load code (AIJ-RLB) [18]. Turbulent boundary layer flow was simulated using spires, barriers, and blocks of various sizes (Figure 1a). The mean wind speed and turbulence intensity profiles are shown in Figure 3a,b, respectively. In this study, the characteristics of the approaching flow were reproduced based on dome-roof heights. At each roof height (h + f = 0.08, 0.16, and 0.24 m), the mean wind speed and turbulence intensity were consistent with the code values, with an error rate of less than 3%. Based on an assumed velocity scale of 1/3, the mean wind speed at the highest point of the roof for a model with h/D = 0.5 (h + f = 0.24 m) was determined to be 8.28 m/s, with a turbulence intensity of 15%. Figure 3c,d show the turbulence integral scale and longitudinal power spectra of the fluctuating wind speed, respectively. Both the turbulence integral scale and power spectra of the fluctuating wind speed showed good agreement with the AIJ-RLB(2015) [21] code and the Karman spectrum.
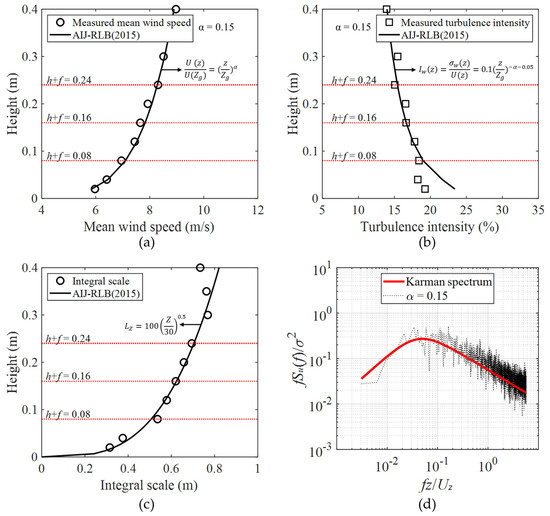
Figure 3.
Characteristics of approaching flow: (a) mean wind speed; (b) turbulence intensity; (c) integral length scale; and (d) power spectra of velocity fluctuation at z = 0.24 m.
Considering the time scale obtained from the length and velocity scales, that is, (1/150)/(1/3) = 1/50, each pressure record was sampled for 12 s, which is equivalent to 10 min on the full scale. The sampling frequency was set to 1000 Hz, and the experiment was conducted for 120 s (12 × 10 = 120 s) to acquire 10 samples. All the pressure taps were measured simultaneously using a multichannel pressure measurement system. The experimental conditions are listed in Table 2.
Table 2.
Experimental conditions.
The Reynolds number was defined using the span D and the mean wind speed at the maximum height of the roof. In this study, the Reynolds number varied from 1.8 × 10⁵ to 2.6 × 10⁵. According to previous studies pertaining to dome roofs, when the Reynolds number exceeded 1.0 × 10⁵, the location of the flow separation remained unchanged, and the wind pressure was stable [5]. Figure 4 shows the mean pressure coefficients along several pressure taps lines on the surface of the dome roof for different Reynolds numbers. Because the values are symmetrical with respect to the centerline (lines 1 and 7), the pressure tap values from lines 1 to 7 are expressed. Pressure tap #1 on the x-axis of Figure 4 is the wind pressure tap located at the center of the dome, and taps #18, #35, #52, #69, #86, #103, and #120 are the wind pressure taps located at the edge of the dome roof. The mean pressure coefficient stabilizes when the Reynolds number is greater than 2.0 × 10⁵. Based on the initial experiment, the wind speed at which the wind pressure coefficient was stable was determined and subsequent experiments were conducted. The maximum blockage rate was 2.0%; therefore, data correction was unnecessary.
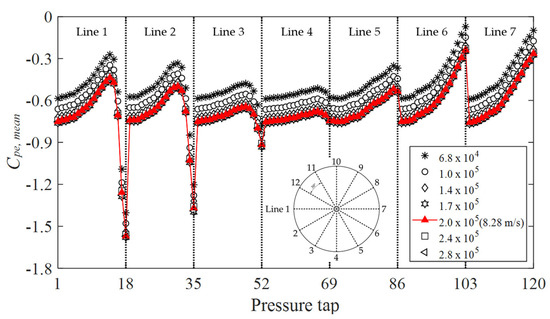
Figure 4.
Variation of the mean wind pressure coefficient for different Reynolds numbers.
2.3. Definitions of Wind Pressure Coefficients
In this study, the time history of pressure coefficients was calculated as follows:
where is the wind pressure at each pressure tap; is the static pressure measured at a pitot tube; is the air density; and is the mean wind speed at the maximum height of the roof (each of h/D).
The mean and fluctuating pressure coefficients ( and ) were calculated as follows:
where is the data number during the measurement period, the mean and fluctuating pressure coefficients were calculated for each of the ten samples, and only the mean values were used.
3. Fluctuating Wind Pressure Characteristics on Spherical Dome with Low Rise-Span Ratio
3.1. Distribution of Pressure Coefficients
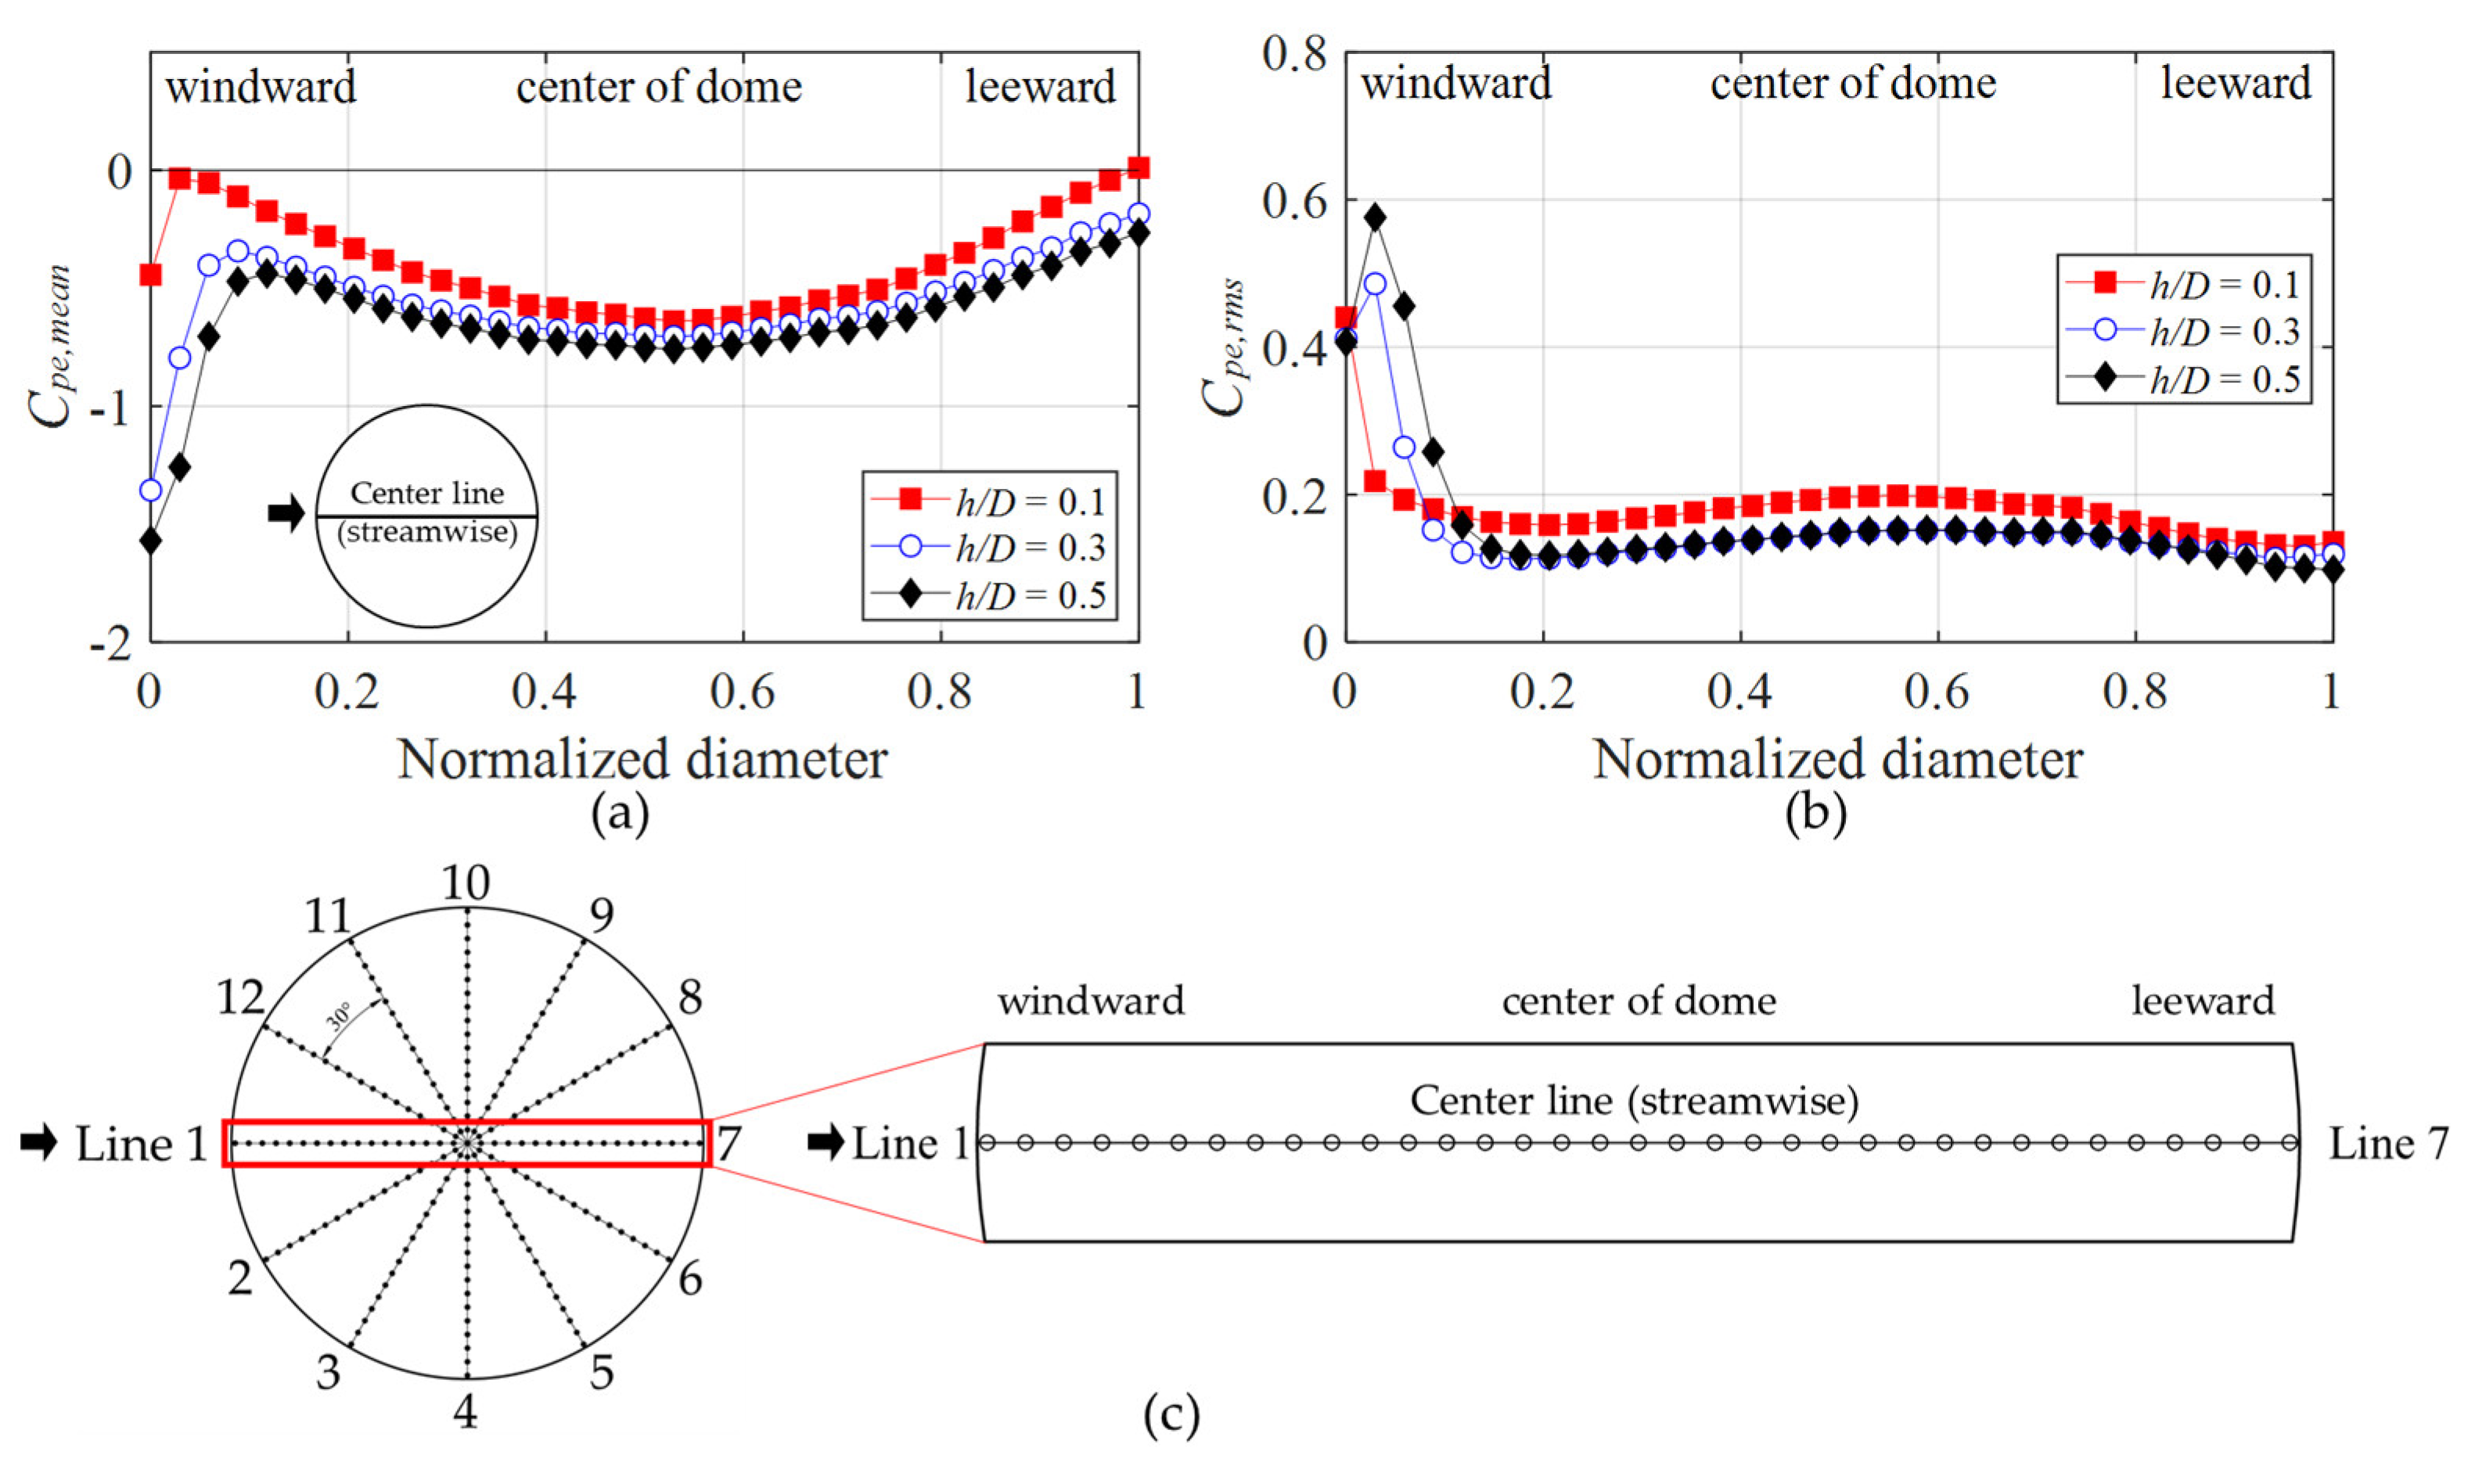
Figure 5 shows the mean pressure coefficient (Cpe,mean) and the fluctuating pressure coefficient (Cpe,rms) of the streamwise centerline. The x-axis represents the normalized diameter based on the pressure tap distance and diameter of the model, whereas the y-axis represents the wind pressure coefficient. The locations of the pressure taps installed on the centerline are shown in Figure 5c. As shown in Figure 4, the normalized diameters 0 and 1 are the absolute values at wind pressure tap numbers #18 and #120, located on the roof edges of lines 1 and 7, respectively. In Figure 5a, Cpe,mean exhibits a rapid change in absolute value in the normalized diameter range of the windward zone of 0–0.15. This phenomenon is attributed to the separation of the approaching flow at the windward roof edge and reattachment at around the normalized diameter of 0.15; this is consistent with the results of previous studies on dome roofs with similar f/D ratios [15,16,17,18,19,20]. After reattachment, the absolute value gradually increased, and as the flow moved toward the leeward side, the absolute value gradually decreased. This is related to the influence of the boundary layer formed on the dome surface, pressure recovery in the leeward zone, and wake. As h/D increases, the absolute value increases in all areas, and the reattachment distance tends to increase with h/D in the windward area. This is because as h/D increases, the wind speed increases and the turbulence intensity decreases [13,15,16,17,18,19,20]. Figure 5b shows the Cpe,rms. As shown in the mean pressure coefficient in Figure 5a, a rapid change in the absolute value of the normalized diameter corresponding to the windward zone was observed in the range of 0–0.15. As previously described, this is because of the separation of the approaching flow from the windward roof edge and reattachment near a normalized diameter of 0.15. At the area after reattachment, the mean pressure coefficients changed gradually, and the variable fluctuating pressure coefficients also changed gradually below 0.2. This was also due to the boundary layer of the dome surface and influence of the wake, as previously described.
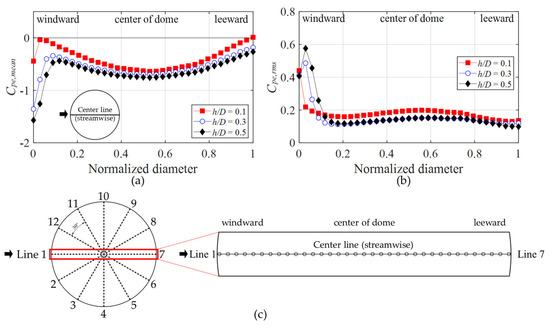
Figure 5.
Distribution of mean and fluctuating pressure coefficients: (a) Cpe,mean; (b) Cpe,rms; and (c) location of pressure taps installed on centerline.
Figure 6 shows the contours of Cpe,mean for different h/D values to present the overall mean pressure distribution acting on the roof surface. As mentioned above, as h/D increased, the overall absolute value increased, and the reattachment position (white dotted line) moved further from the windward roof edge. Moreover, significant changes in wind pressure were observed owing to the separation, reattachment, pressure recovery, and wake effects as the flow moved toward the leeward side along the streamwise centerline. However, similar wind pressures are observed in the spanwise direction.
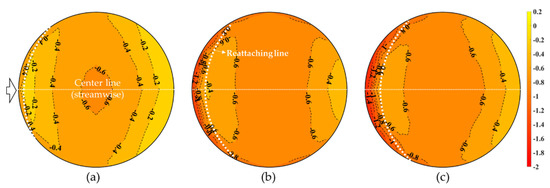
Figure 6.
Distribution of mean pressure coefficient: (a) h/D = 0.1; (b) h/D = 0.3; and (c) h/D = 0.5.
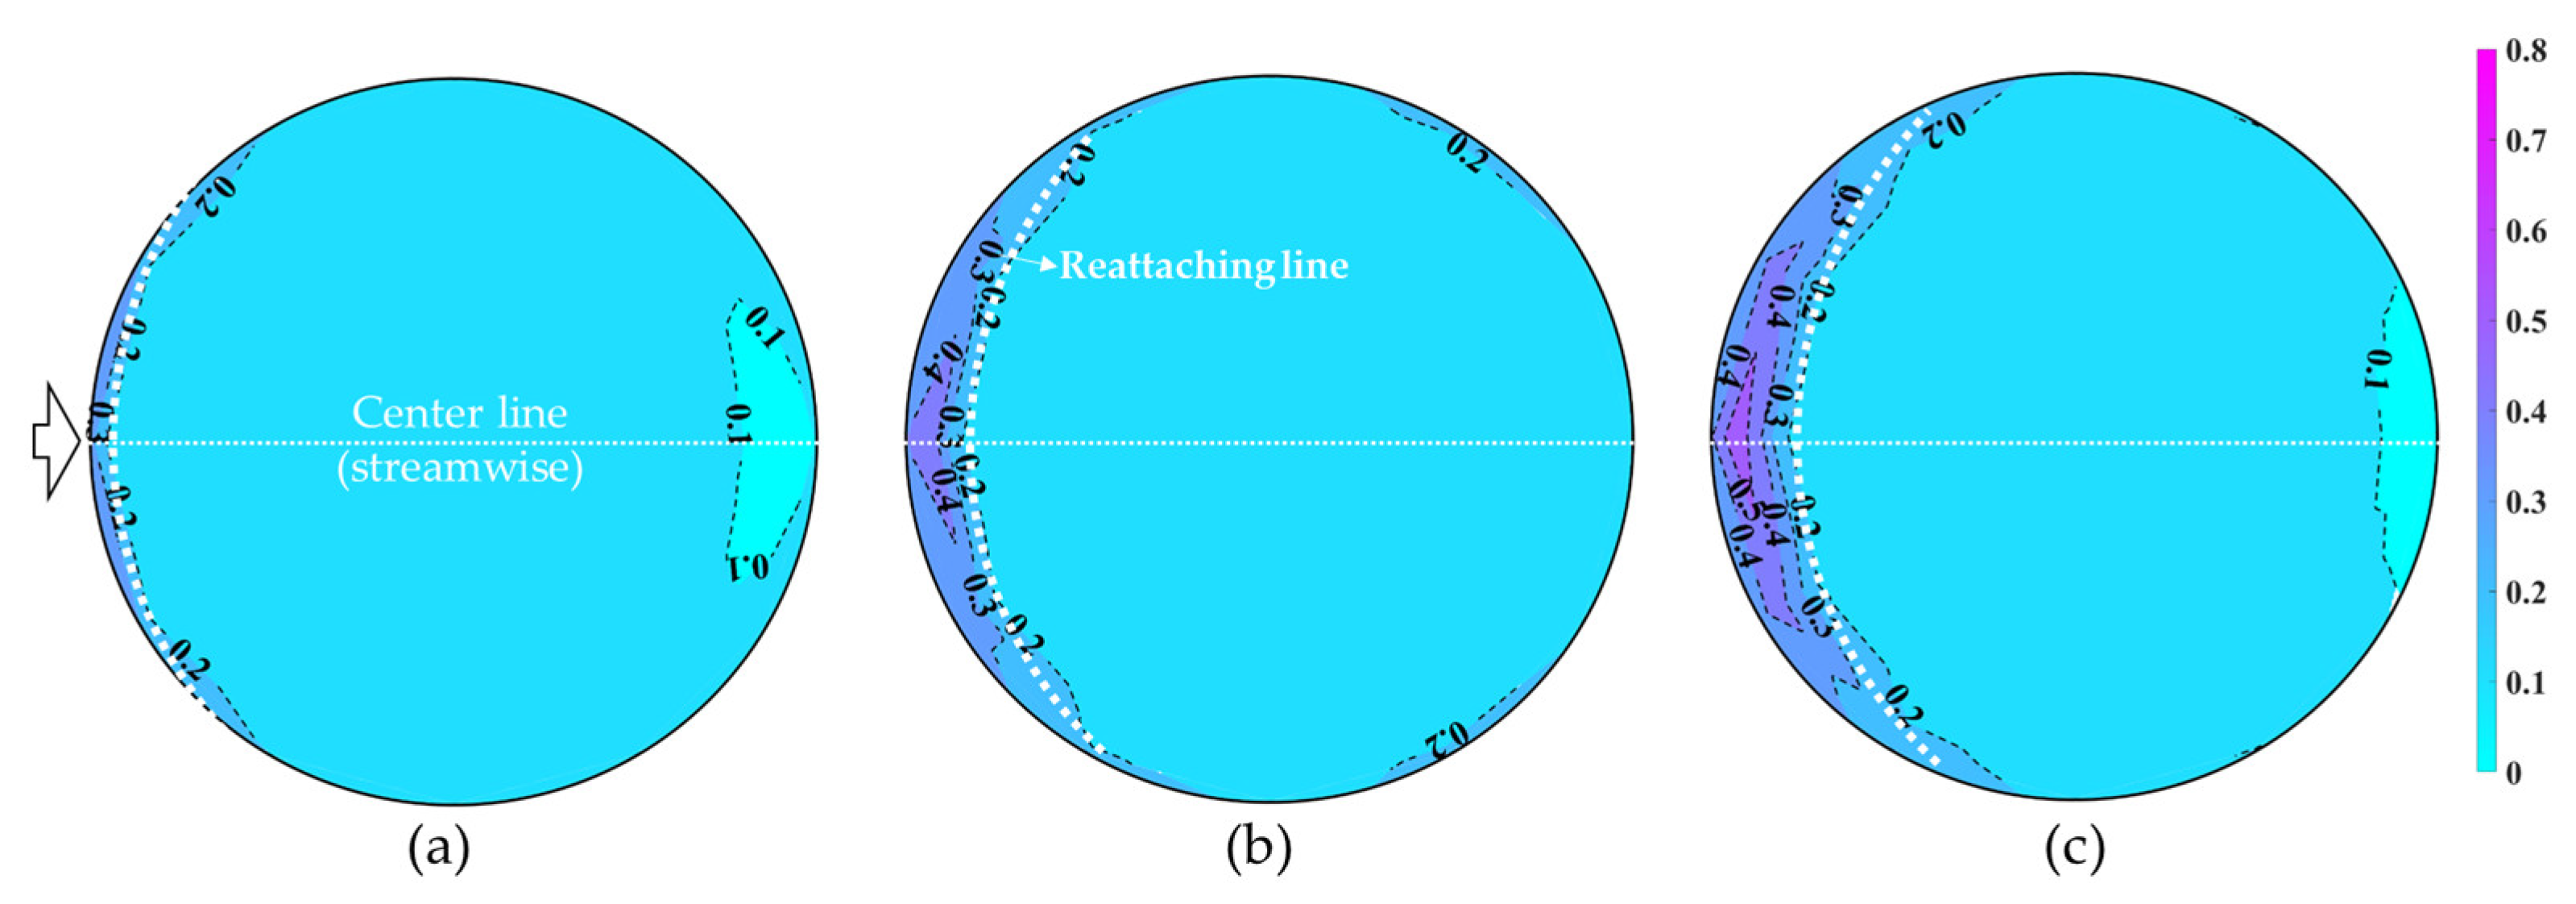
Figure 7 shows the contours of Cpe,rms for different h/D values, representing the overall fluctuating wind pressure distribution acting on the roof surface. As explained earlier, as h/D increases, a large absolute value is observed in the windward area affected by the separation. Excluding the windward area affected by the separation, Cpe,rms in the remaining zones exhibit similar absolute values.
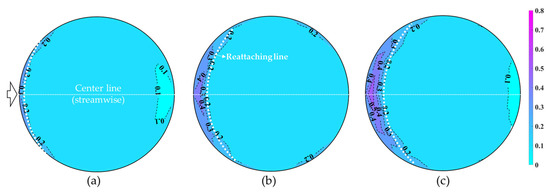
Figure 7.
Distribution of fluctuating pressure coefficient: (a) h/D = 0.1; (b) h/D = 0.3; and (c) h/D = 0.5.
Figure 8 shows correlation coefficients for the wind pressure coefficients of the wind pressure tap located along the centerline. Correlation coefficients were calculated as follows:
where is the covariance of the wind pressure coefficient at each pressure tap; and are the standard deviations of wind pressure coefficient, respectively. The x-axis represents the normalized diameter, which is the same as that in Figure 5. The locations of the standard pressure taps selected to calculate the correlation coefficients are shown in Figure 8c. Figure 8a shows the values calculated based on the second pressure tap in the windward area, which were influenced by the vortices caused by the windward separation. A relatively weak correlation was observed at the pressure tap located at a normalized diameter of zero on the windward edge of the roof. This phenomenon occurs because the windward edge of the roof is subjected to a separation influence and the slightly direct influence of the approaching flow [11]. This phenomenon was observed only at the first pressure tap located at the roof edge of Line 1. As the pressure tap moved toward the leeward side, the correlation rapidly decreased, reaching its lowest point at a normalized diameter of approximately 0.15, where reattachment occurred. Meanwhile, the correlation for h/D = 0.1 decreases more gradually, due to reattachment near the reference pressure tap caused by a lower h/D. Figure 8b shows the values calculated based on the pressure tap at the leeward edge of the roof. Between the normalized diameters of 0.8 and 1.0, the correlation coefficient was greater than 0.6, showing a relatively rapid increase compared to other areas, owing to the wake occurring in the leeward zone. Jang and Lee [22] investigated the flow around spherical dome roofs using particle image velocimetry (PIV) techniques and demonstrated the existence of small-scale vortices caused by wakes in the leeward area of the dome roof.
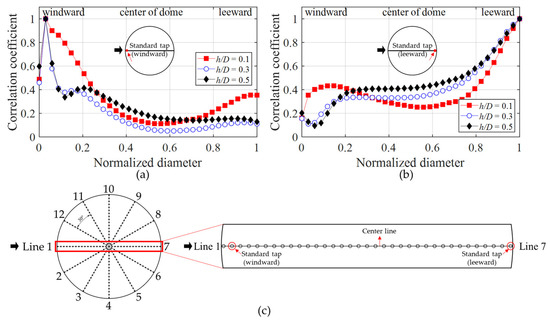
Figure 8.
Correlation coefficient according to the selected standard pressure tap: (a) pressure tap installed on the windward side; (b) pressure tap installed on the leeward side; and (c) location of the standard pressure tap.
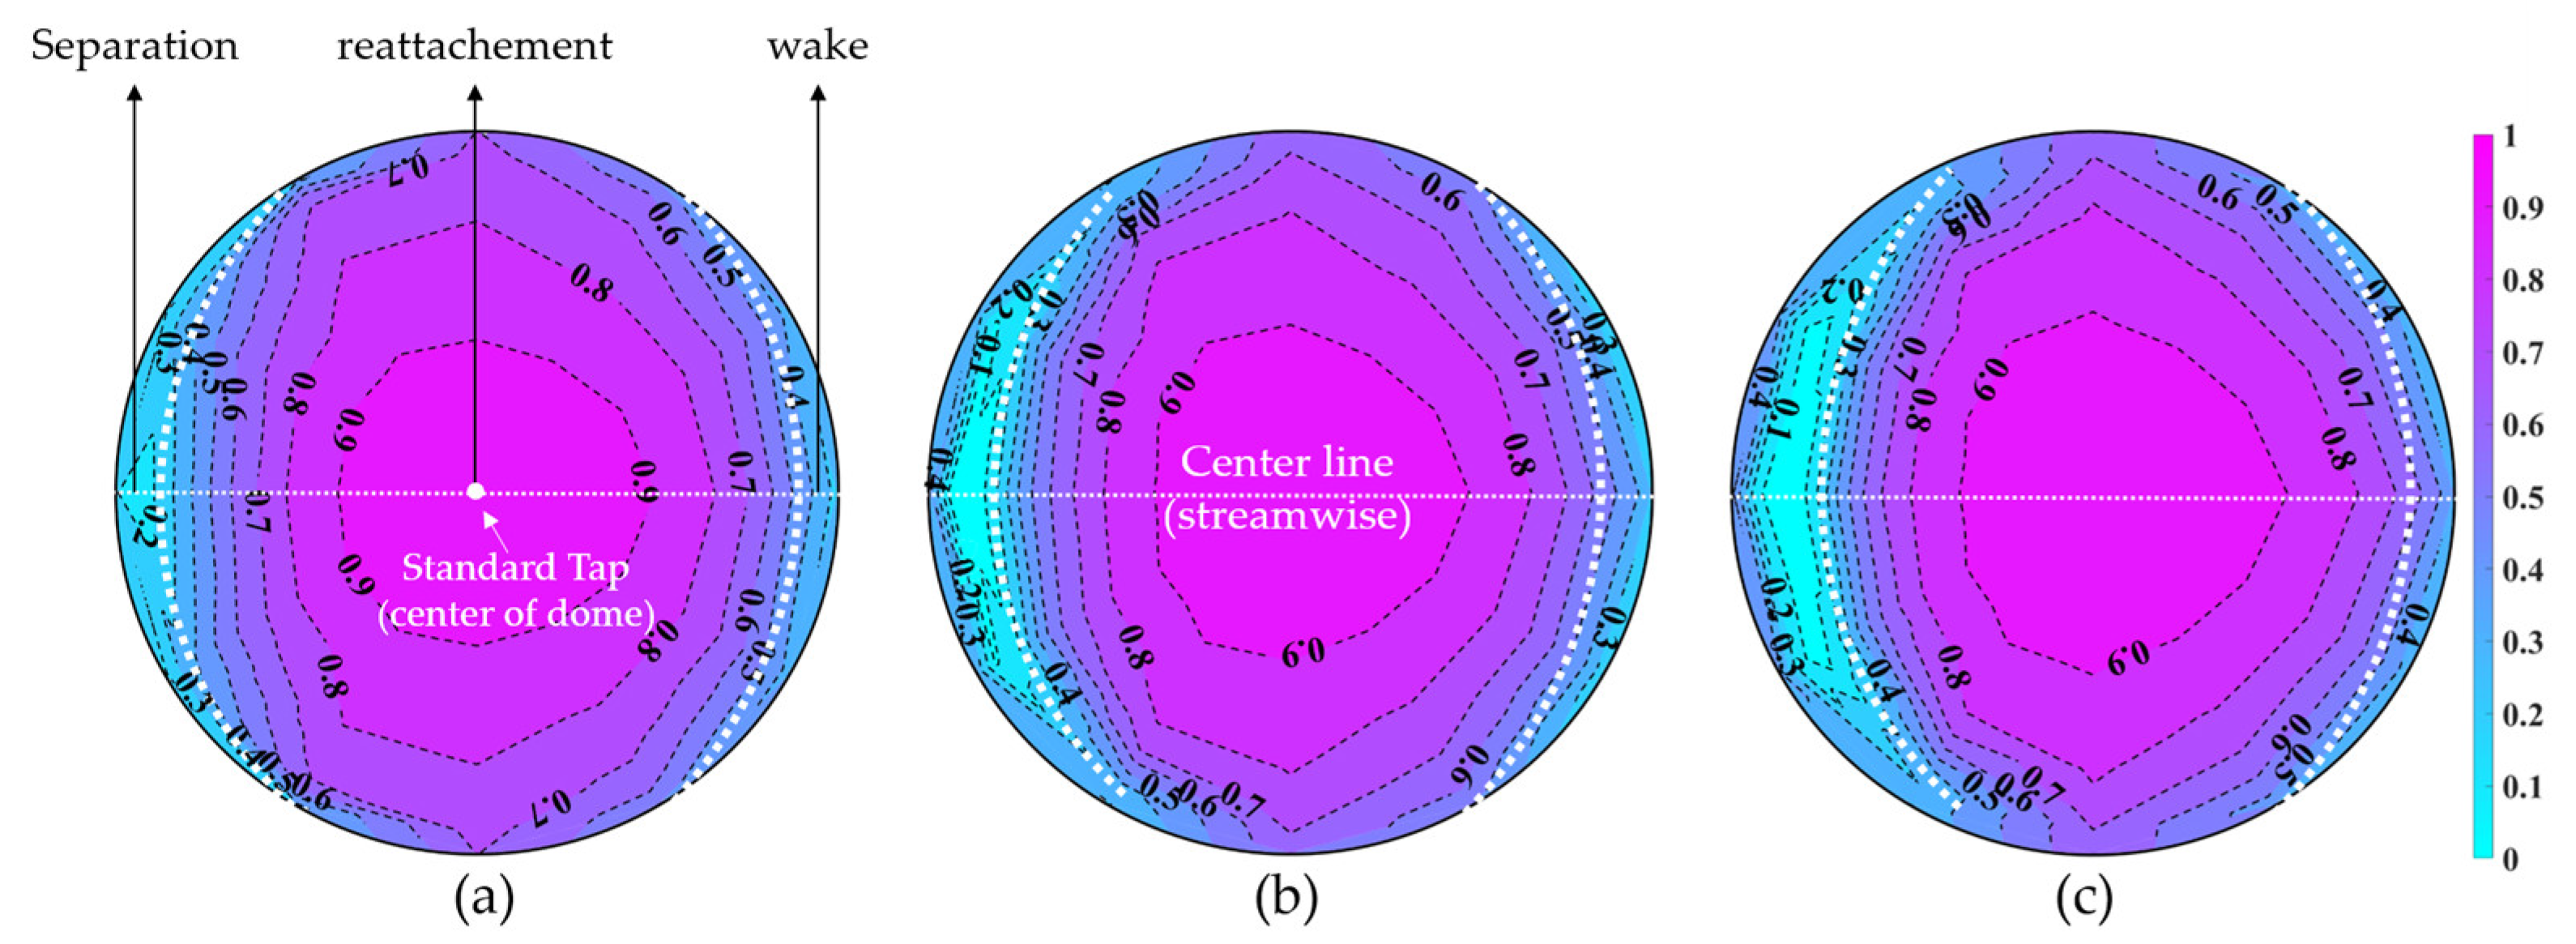
Figure 9 shows the correlation coefficients for the entire pressure tap of the dome roof, calculated based on the pressure tap at the dome center and represented as a contour. The zone corresponding to the dome center, indicated by the white dotted line on the contour, exhibited large correlation coefficients above 0.6. In contrast, as previously explained, the windward zone influenced by the separation and the leeward zone influenced by the wake showed correlation coefficients lower than 0.4.
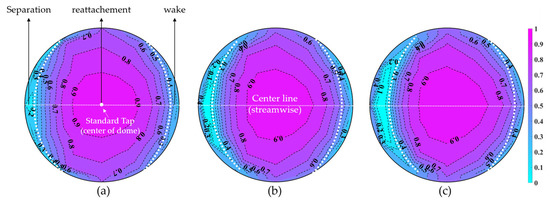
Figure 9.
Distribution of correlation coefficient: (a) h/D = 0.1; (b) h/D = 0.3; and (c) h/D = 0.5.
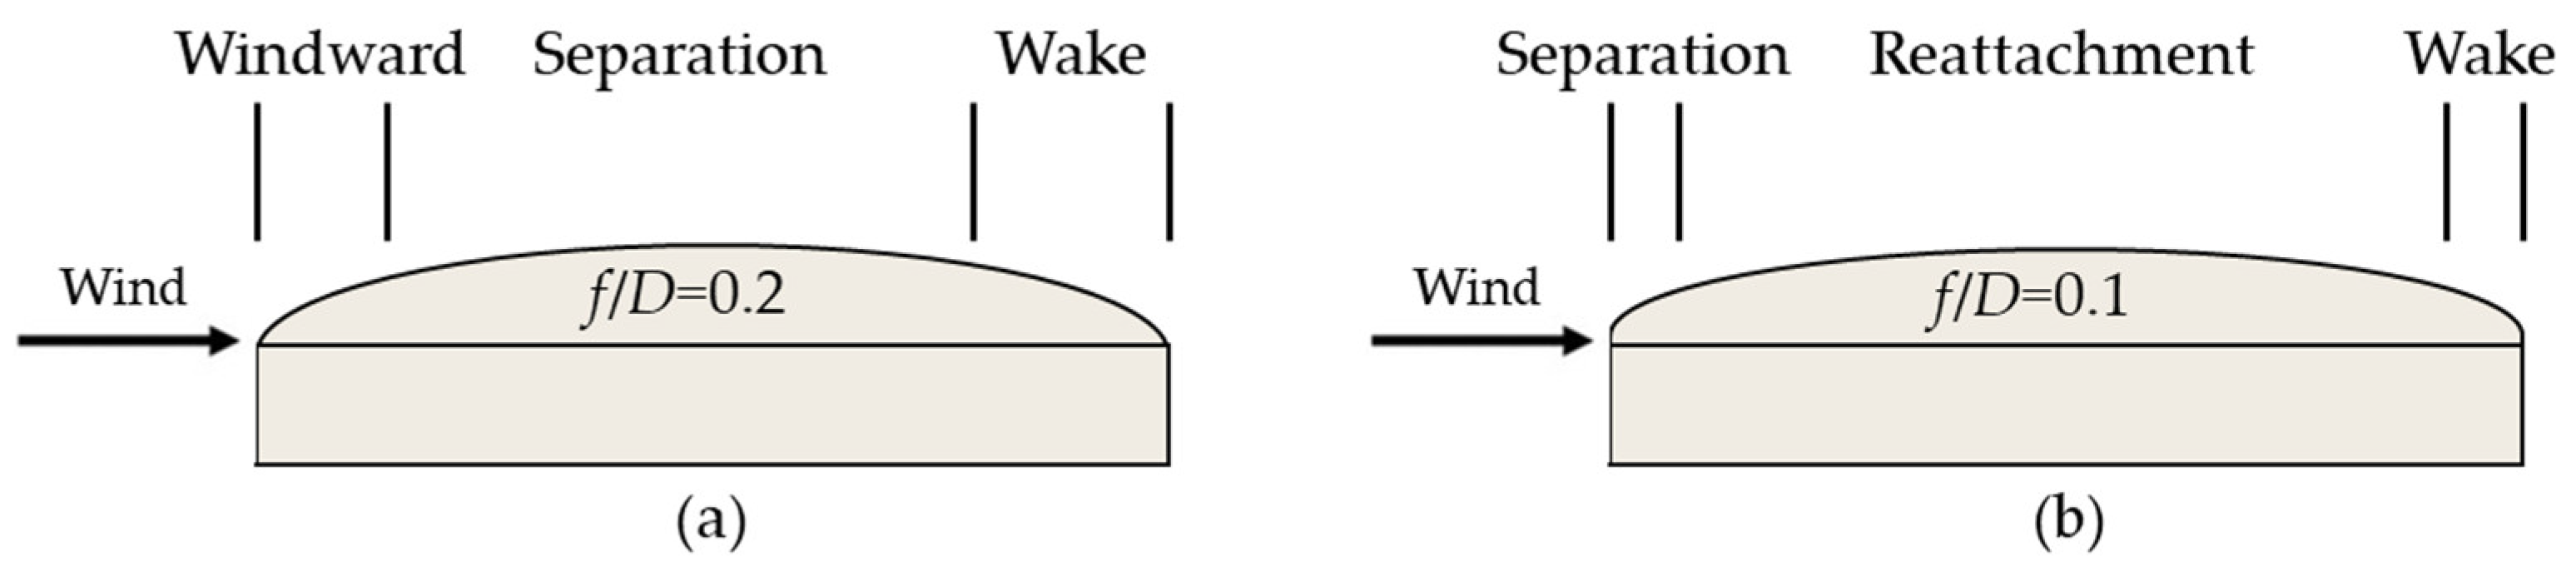
Based on the aforementioned pressure and correlation coefficients, the flow patterns in the different zones of a dome roof with f/D = 0.1 can be inferred. Figure 10 shows the zones divided according to the flow patterns on the dome roof. Figure 10a shows a conceptual diagram of the zones divided by Lo and Kanda [13] after analyzing the fluctuating pressure on a dome roof with f/D = 0.2. When f/D was greater than 0.1, the windward zone was directly affected by the approaching flow, with positive pressure acting predominantly. As the flow moved from the dome center to the leeward side, separation occurred, and the influence of the wake was divided into three zones: windward, separation, and wake. However, at relatively low f/D = 0.1, which is the subject of this study, the zones can be divided based on the analyzed pressure and correlation coefficients, as shown in Figure 10b. Based on Figure 6, Figure 7, Figure 8 and Figure 9, areas with a normalized diameter of 0.15 to 0.8 that show a relatively small correlation coefficient with gradual changes in pressure coefficient are classified as reattachment areas, while areas with a normalized diameter of 0 to 0.15 are classified as separation areas, and areas with a normalized diameter of 0.8 to 1.0 are classified as wake areas. To compare these areas under the same conditions, they were classified based on the pressure and correlation coefficient values of h/D = 0.5. Compared with previous studies conducted using f/D = 0.2, the most significant difference appears in the windward zone. For f/D = 0.2, the positive pressure dominated because of the direct influence of the approaching flow, whereas for f/D = 0.1, the negative pressure dominated because separation occurred at the windward edge of the roof. In addition, for the leeward side, the area affected by the wake was also reduced compared with f/D = 0.2, owing to the relatively low f/D. Park et al. (2022) [20] analyzed the wind pressure distribution characteristics for open dome roofs with f/D of 0.05 and 0.1 and confirmed that the space in which the wake occurred on the leeward side decreased as the inclination angle of the roof decreased when the rise of the dome roof was relatively low. Therefore, it can be inferred that the zones can be roughly divided into separation, reattachment, and wake zones along the centerline. Further details on the zone division are explained in the following section on pressure spectral analysis.
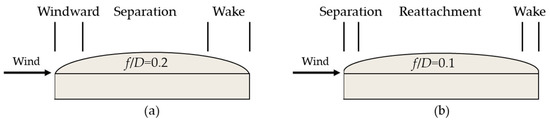
Figure 10.
Diagram of zoning concept of the spherical dome: (a) adapted from Ref. [13]; and (b) present study (h/D = 0.5).
3.2. Characteristics of Fluctuating Pressure Spectra
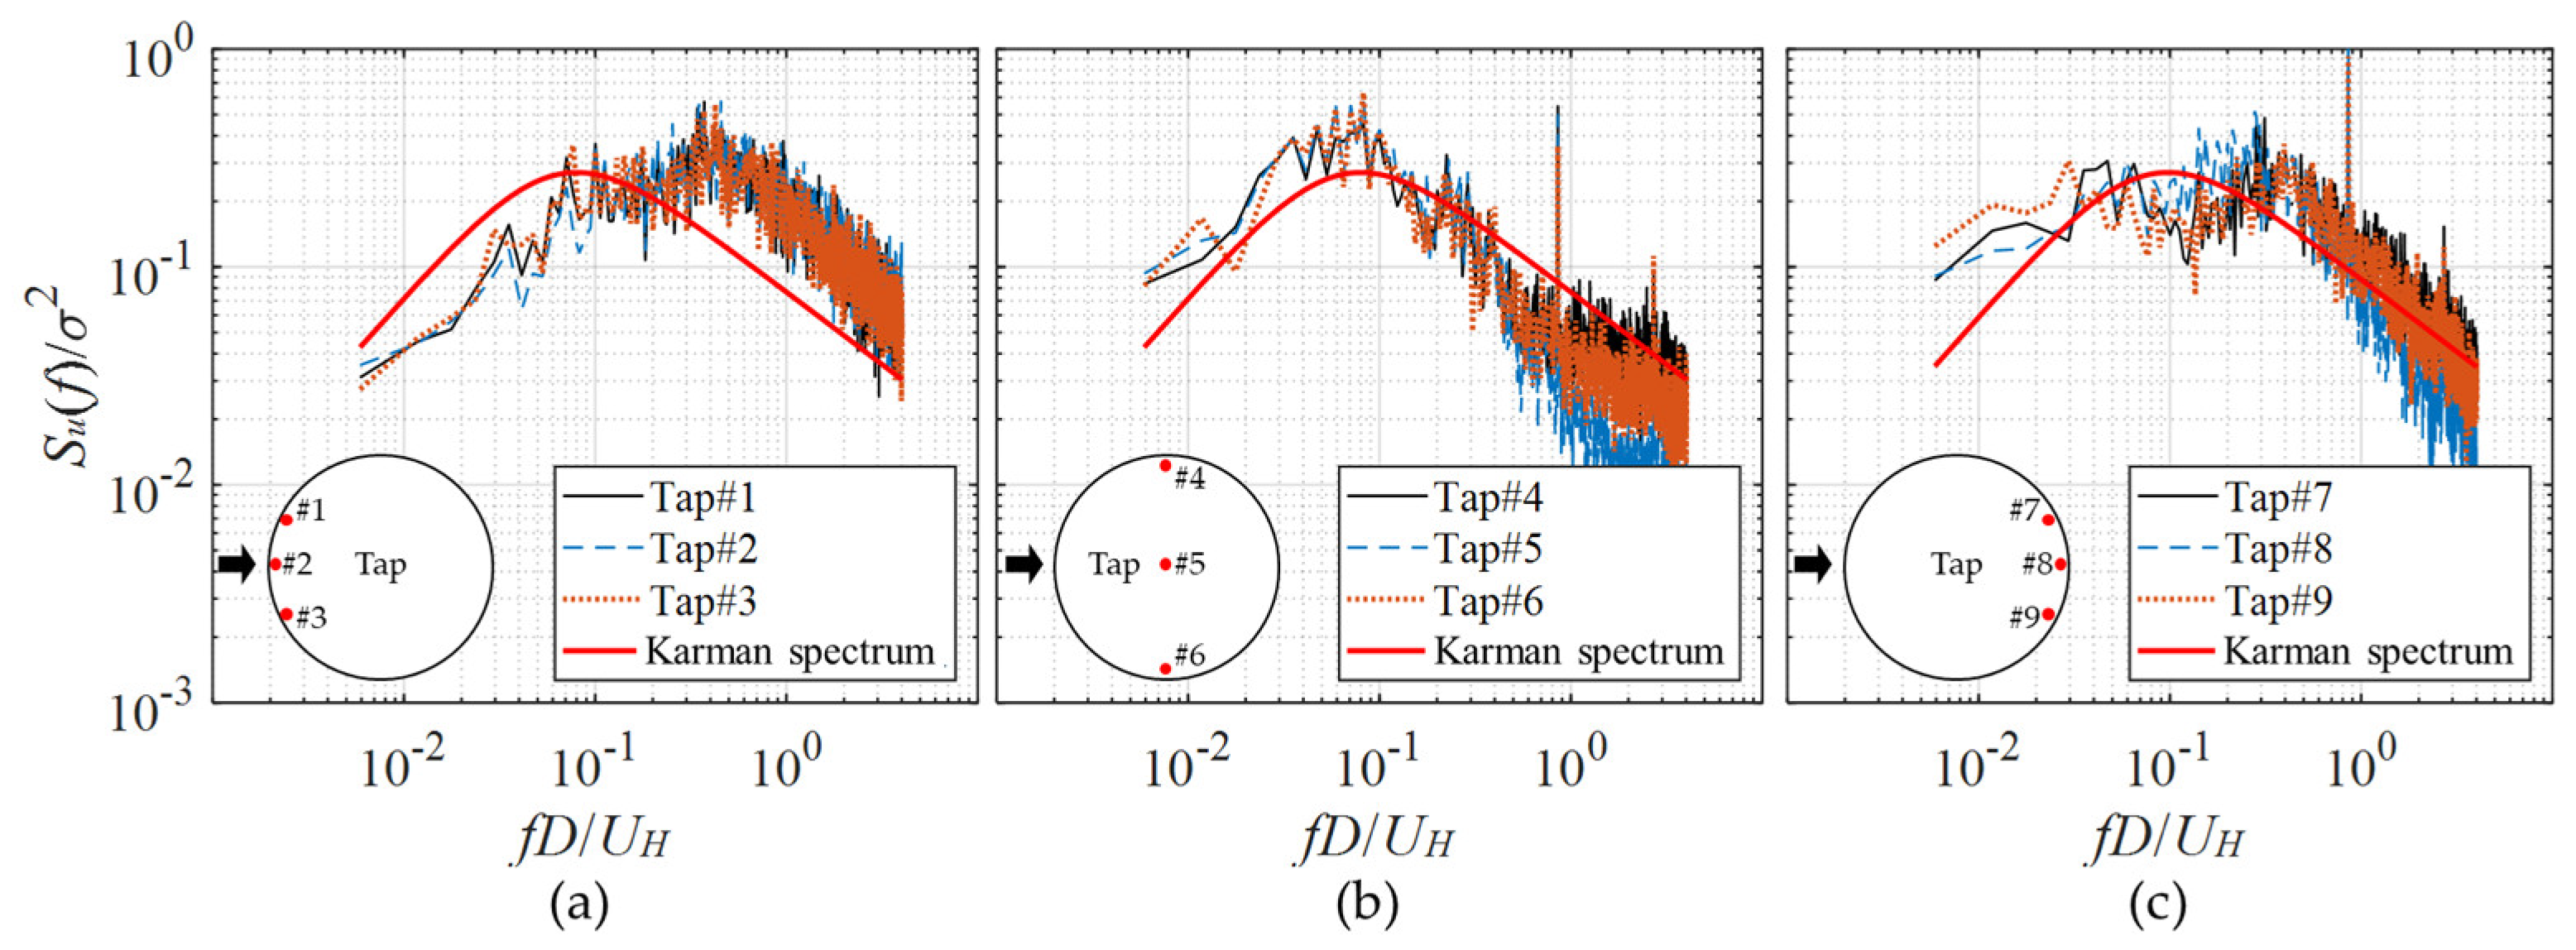
Figure 11 shows the pressure spectra of the pressure taps located in the spanwise direction. The y-axis represents the normalized pressure spectra, and the x-axis represents the normalized frequency. where f is the frequency, D is the dome diameter, UH is the mean wind speed at the maximum height of the roof, and σ is the standard deviation of pressure fluctuations. Various sized vortices included in the fluctuating wind speeds are converted into fluctuating pressures as the shape is maintained or deformed, depending on the size of the object. For comparison, the power spectrum of the fluctuating wind speed (Karman spectrum) was simultaneously represented in Figure 11. The distinct peaks appearing near the normalized frequencies of 1 and 3 were not considered in the analysis because they were believed to be caused by mechanical effects rather than aerodynamic characteristics.
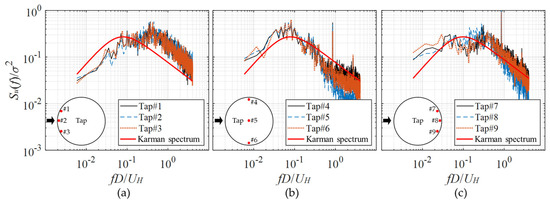
Figure 11.
Distribution of pressure spectra along the line in the spanwise direction (h/D = 0.5): (a) windward side; (b) center of dome; and (c) leeward side.
Figure 11a shows the pressure spectra in the windward area, which has relatively higher energy in the high-frequency range compared with the Karman spectrum, with peaks appearing around the normalized frequency of 0.3–0.4. This was attributed to the influence of the vortices caused by the separation, as explained in the pressure coefficient section. Figure 11b shows the pressure spectra in the dome center area, with a peak appearing around the normalized frequency of 0.08, similar to the Karman spectrum, and rapidly decreasing energy in the high-frequency range. Figure 11c shows the pressure spectra in the leeward area, with increased energy in the high-frequency range compared with that shown in Figure 11b, and an additional peak appearing around the normalized frequency of 0.2. This peak was attributed to the turbulence generated by the wake [10,19]. As shown in Figure 11, the shapes and amplitudes of the pressure spectra were similar at different tap locations in the spanwise direction.
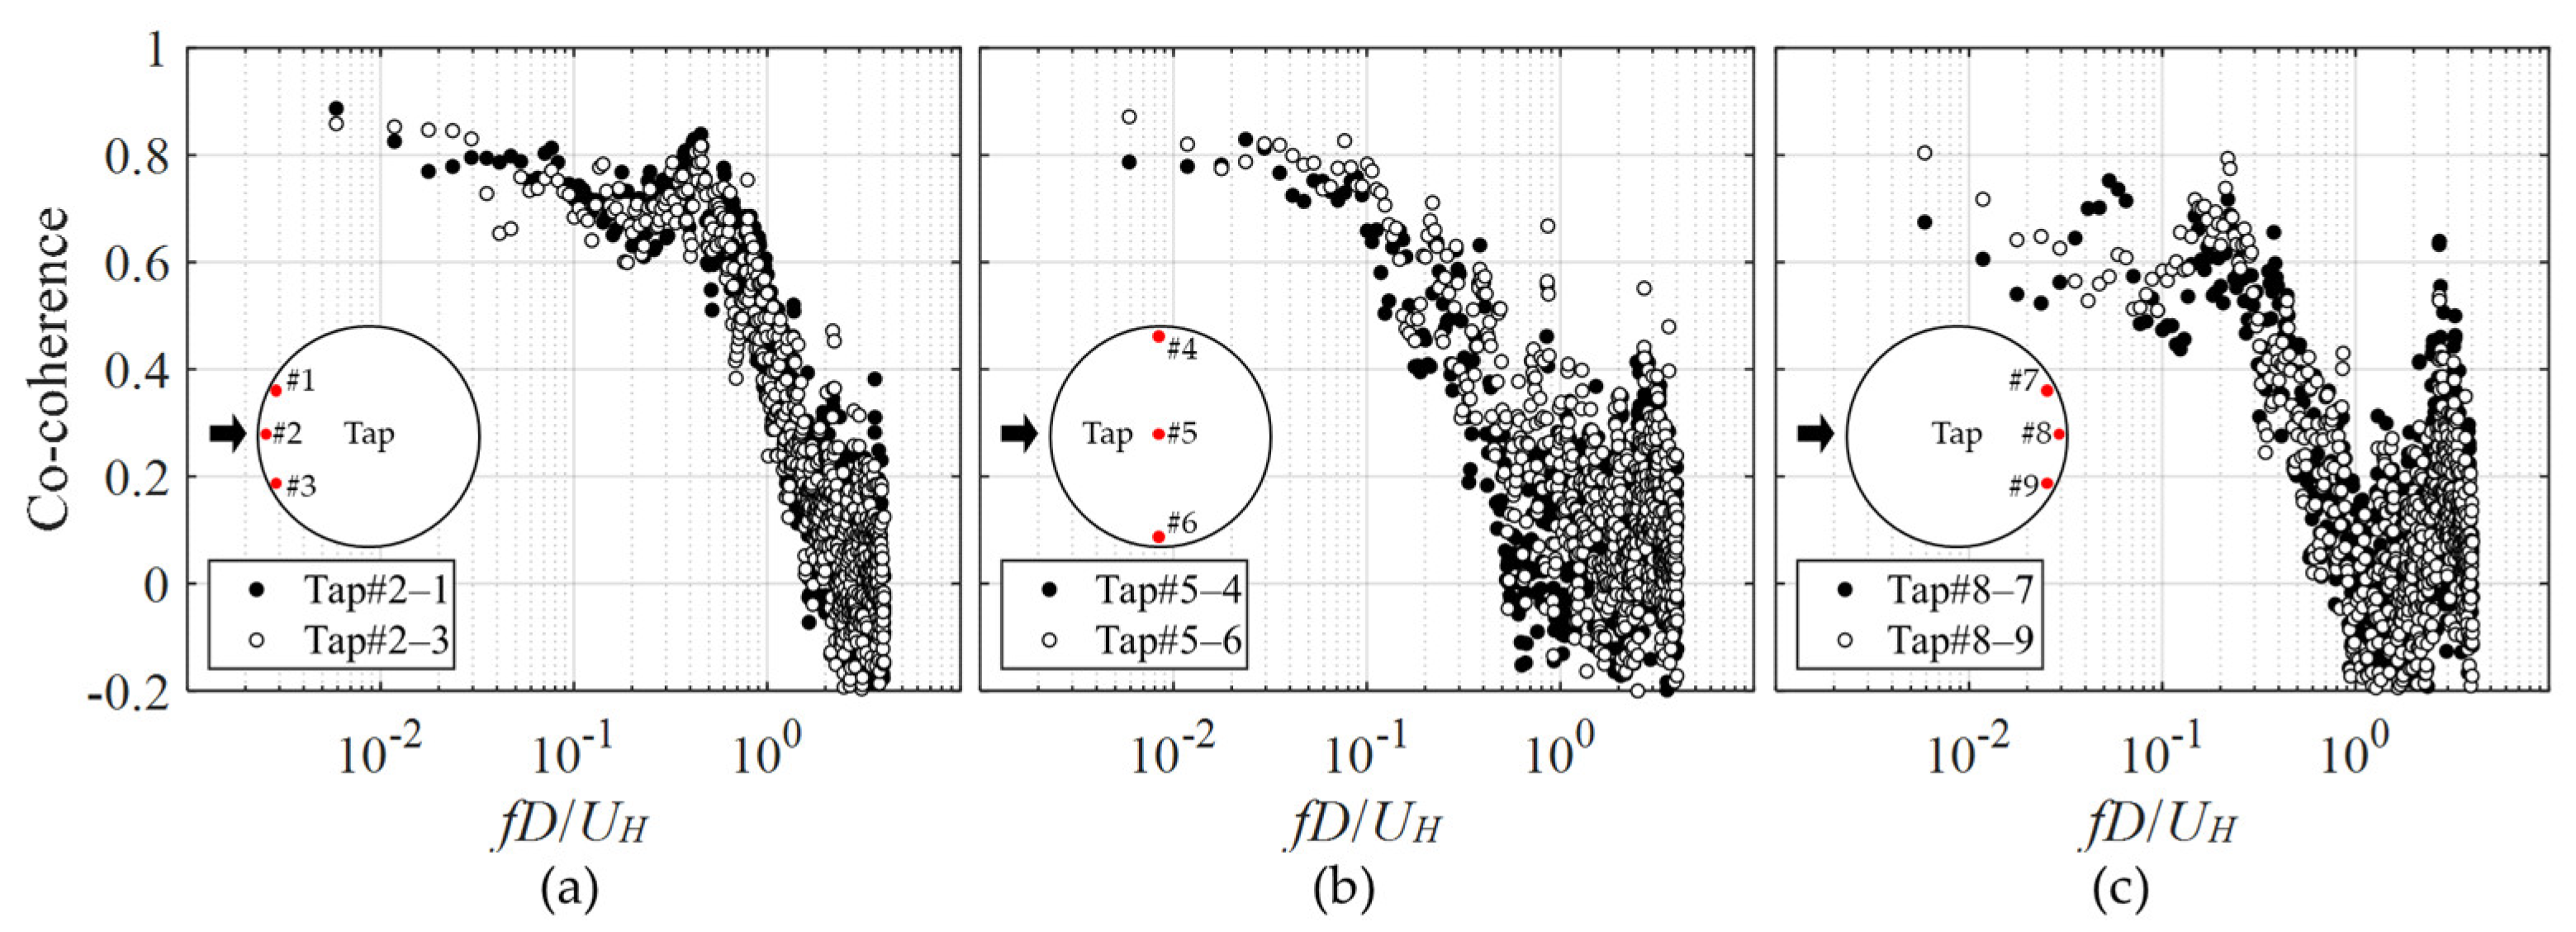
Figure 12 shows the co-coherence of the fluctuating wind pressures of the pressure taps located in the spanwise direction, corresponding to the pressure taps as illustrated in the pressure spectra in Figure 11. Co-coherence is defined as the real part of the cross-spectral density using the following equation:
where is the co-coherence of the wind pressure coefficient at each pressure tap; is the real part of cross-spectrum; and and are the power spectral densities of the wind pressure coefficient at each pressure tap. Figure 12a shows the co-coherence in the windward area, where a peak can be observed around the normalized frequency of 0.4, owing to the influence of the vortices caused by flow separation. Figure 12b shows the co-coherence in the dome center area, where the co-coherence decreased after a normalized frequency of 0.08. Figure 12c shows the co-coherence in the leeward zone, with two peaks observed around the normalized frequencies of 0.08 and 0.2. This indicated a strong correlation between the fluctuating pressures in the spanwise direction.
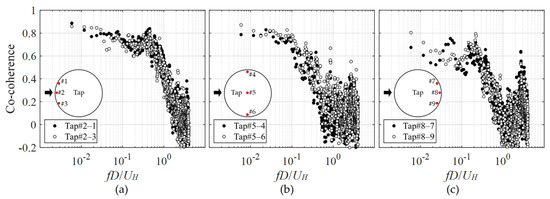
Figure 12.
Co-coherence along the line in the spanwise direction (h/D = 0.5): (a) windward side; (b) center of dome; and (c) leeward side.
Figure 13 shows the pressure spectra of the pressure taps located on the streamwise centerline. The pressure spectra for all h/D values are displayed to examine the effects of the variations in h/D on the spectra. The pressure spectra for h/D = 0.1 have relatively higher energy in the high-frequency range at pressure taps other than those at the windward and leeward roof edges. This is believed to be related to the turbulence generated from the ground surface due to the low h/D. However, the peak frequencies and spectral shapes were not significantly affected. Examining the changes in the pressure spectra according to the location of the pressure taps, the increased energy in the high-frequency range and the peaks in the windward area compared with the Karman spectra decreased as they approached the dome center, causing a decrease in the peak frequency. As the taps moved toward the leeward area, the energy in the high-frequency range increased again, and an additional peak appeared around the normalized frequency of 0.2. The clear peaks in the narrowband near the normalized frequencies 1 and 3, as shown in Figure 13, were not reflected in the analysis because they were caused by mechanical effects rather than aerodynamic characteristics.
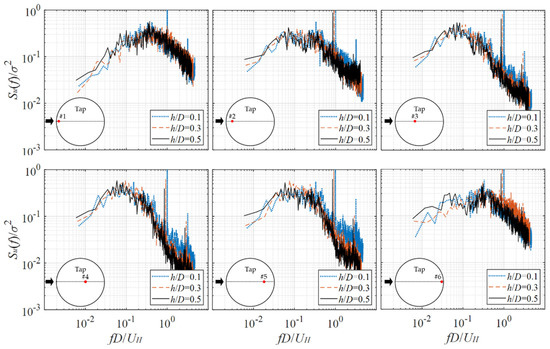
Figure 13.
Distribution of pressure spectra along the centerline in the streamwise direction.
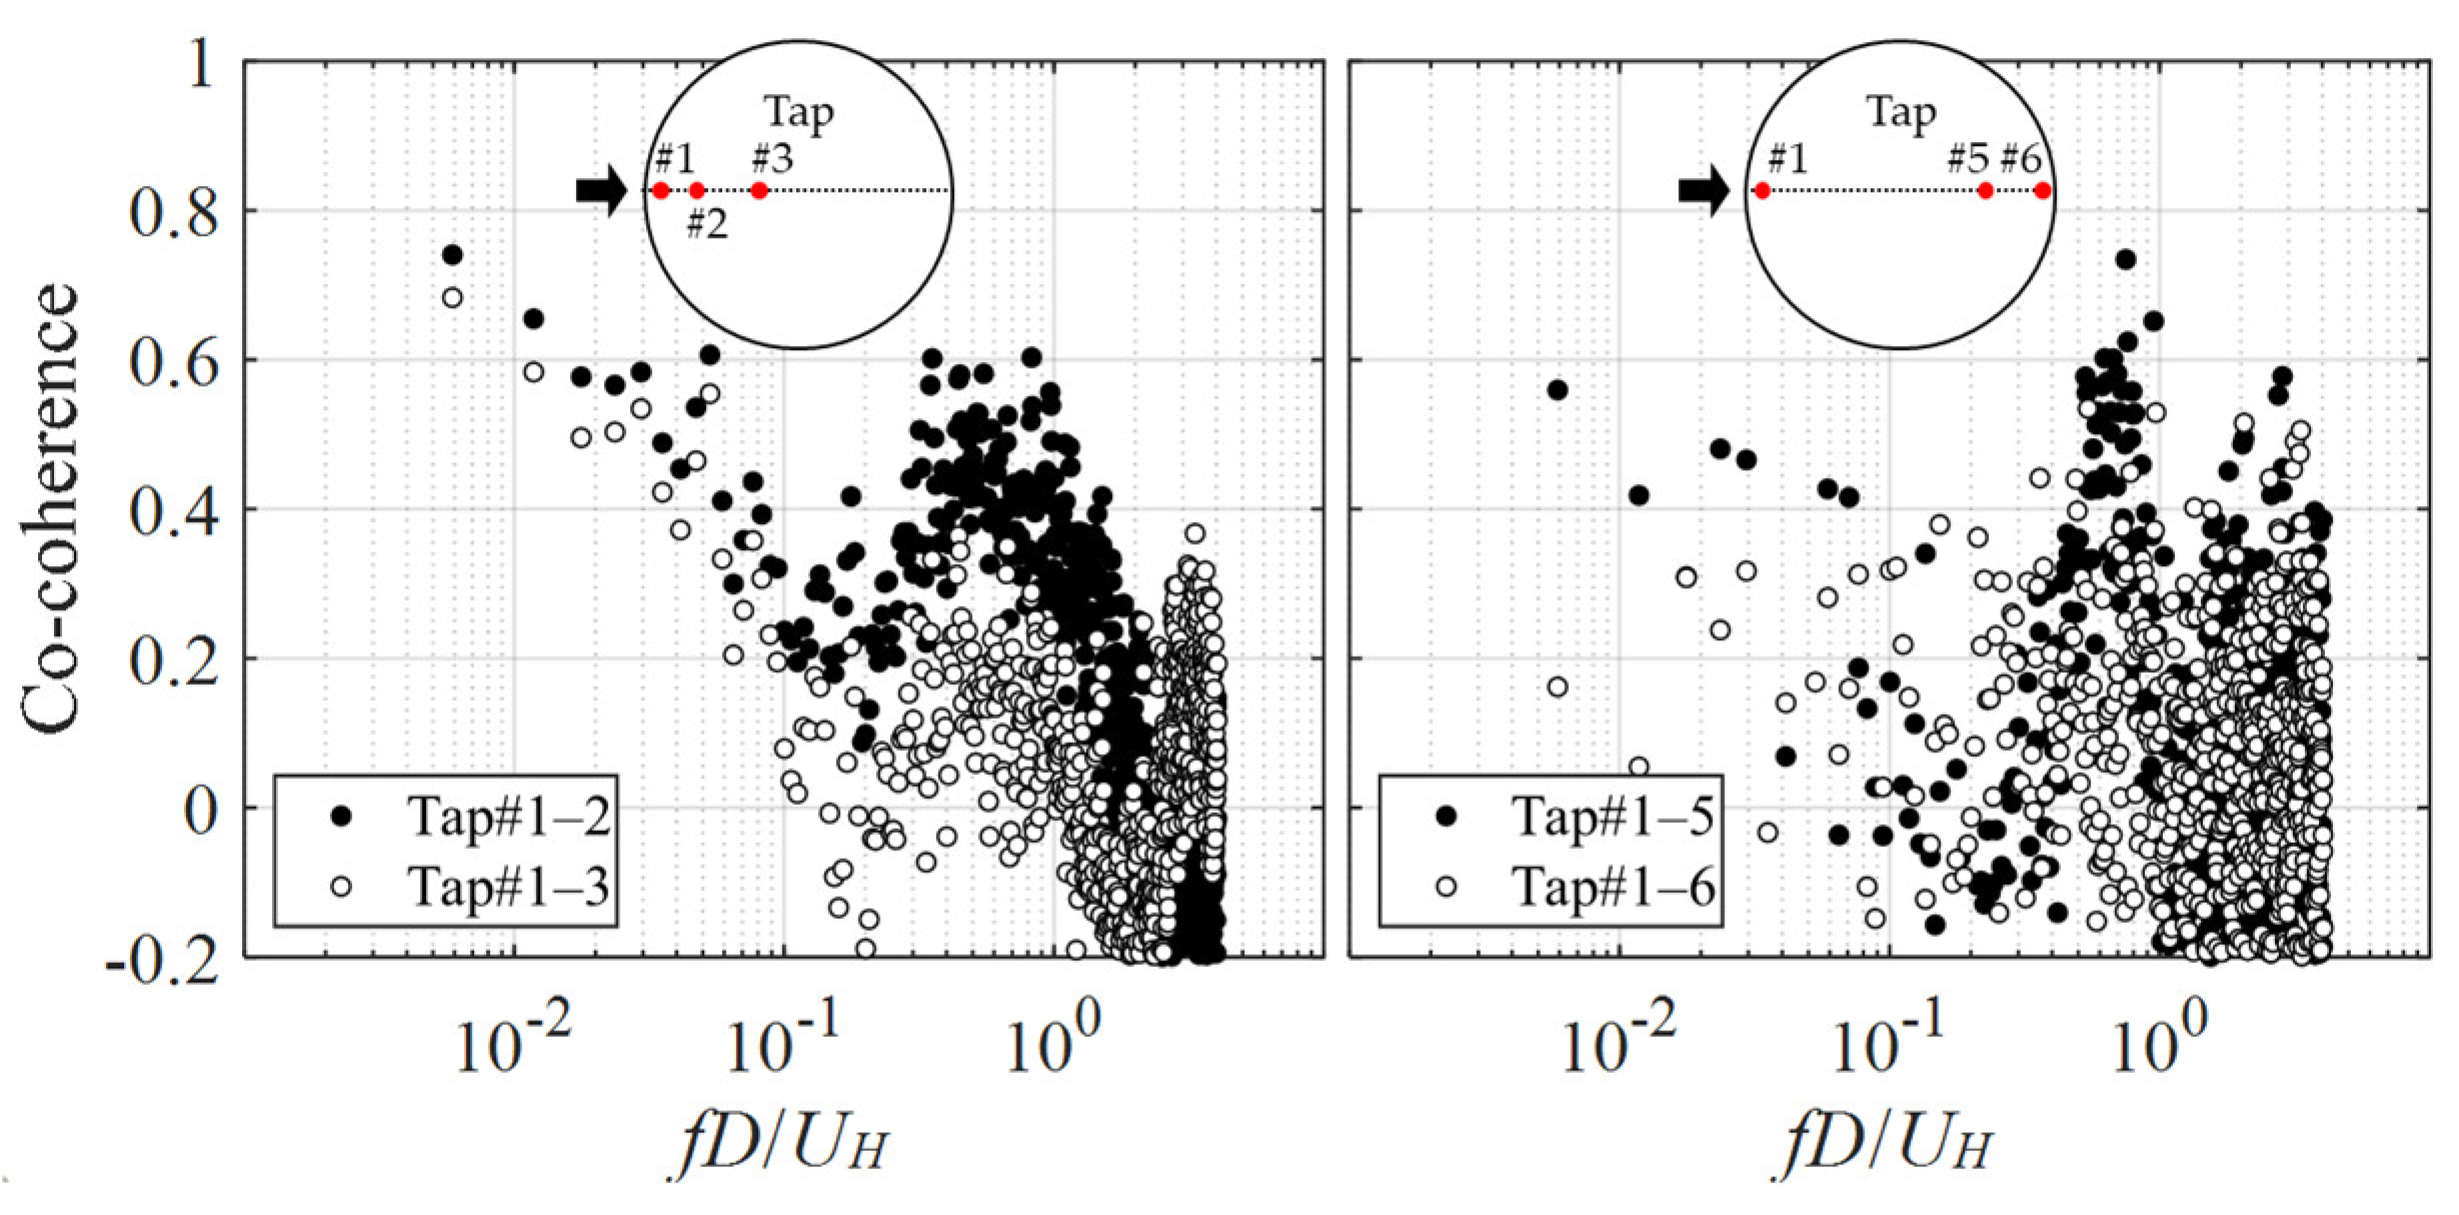
Figure 14 shows the co-coherence of the pressure taps located in the spanwise direction. The graph is plotted based on Tap# 1. Moving toward the leeward side, the peak at a normalized frequency of 0.4, which appeared on the windward side, gradually decreased, and the correlation in the leeward zone was confirmed to be very low. As previously explained, the peaks at the normalized frequencies of 1 and 3 in Figure 13 are not caused by aerodynamic characteristics but by mechanical influences.
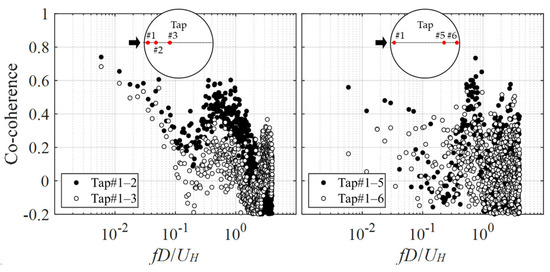
Figure 14.
Co-coherence at the pressure tap in the streamwise direction (h/D = 0.5).
Although the characteristics of the fluctuating pressure differ according to the position of the dome roof, zones can be divided based on the similarity of the previously explained pressure spectral changes, and the general spectra for each zone can be derived [14]. All pressure taps installed on the roof were targeted, and three zones were determined based on an analysis of the pressure coefficients, correlation coefficients, pressure spectra, and co-coherence. The zones were divided into those affected by the separation of the approaching turbulence, the approaching turbulence and boundary layer of the roof surface, and the wake.
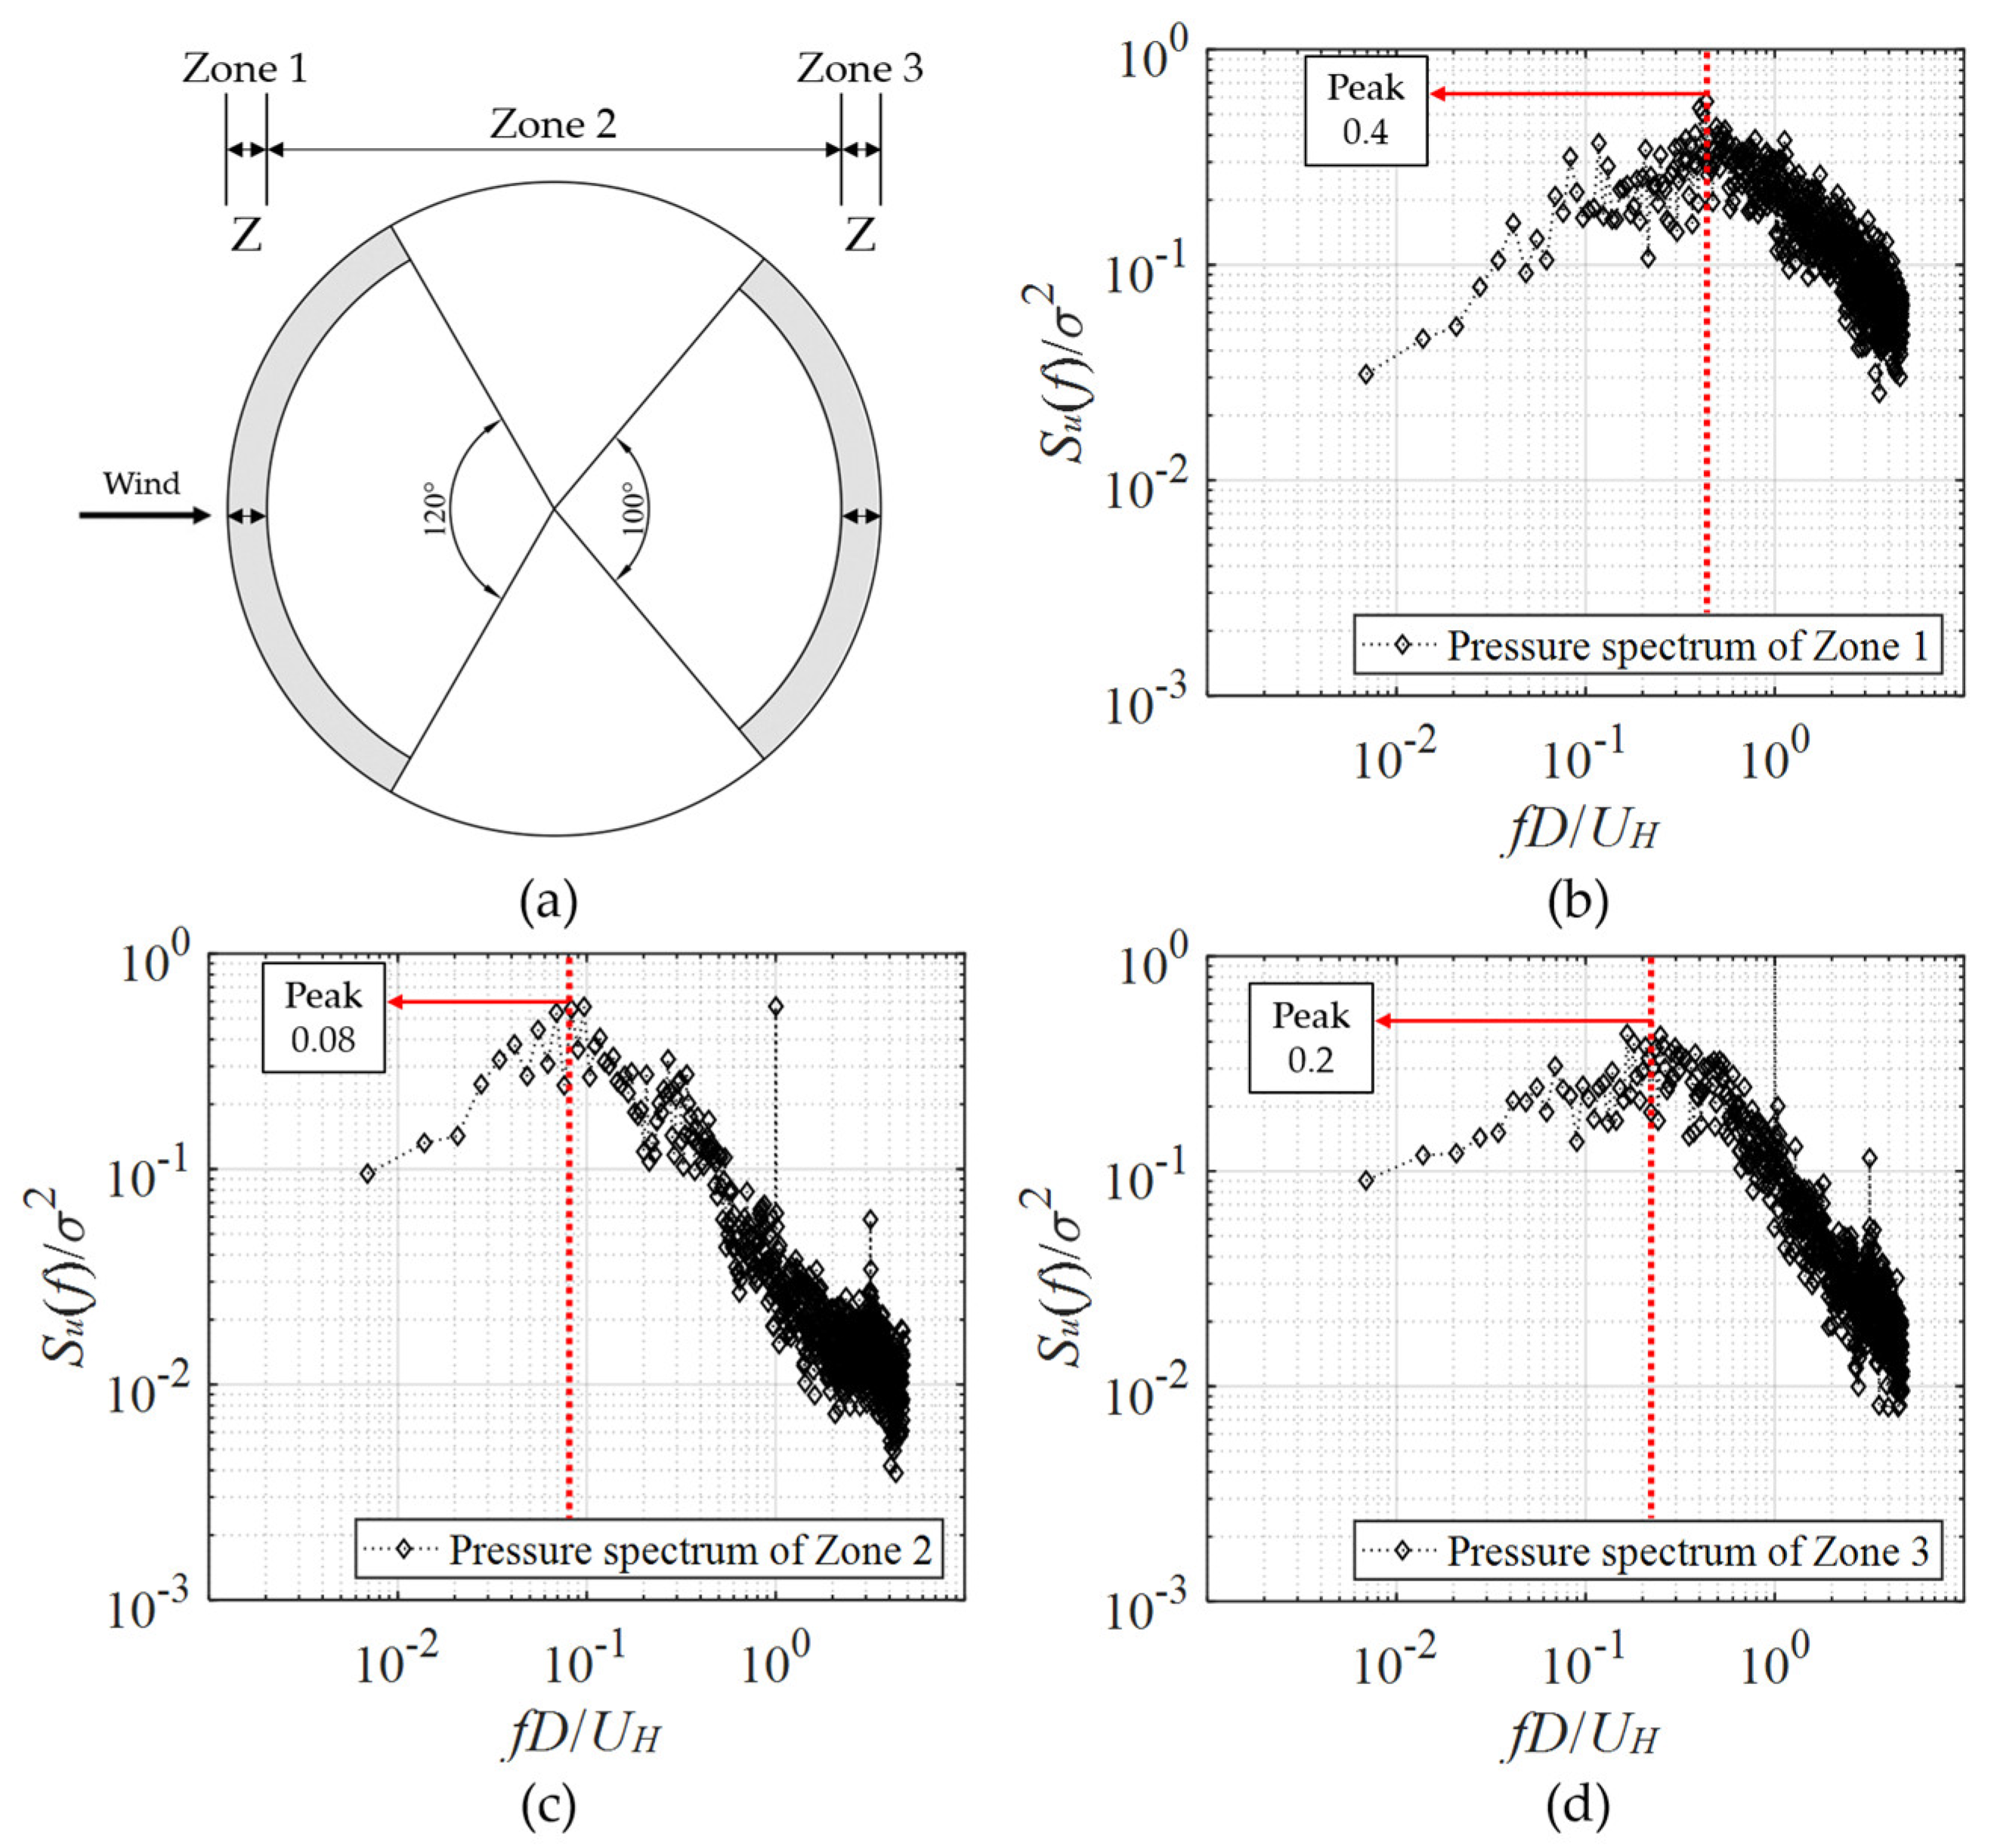
Figure 15 shows the three zones, calculation method, and general spectra for each zone. Figure 15a shows the divided zones and the division method. Z was assumed to be 12% of the span, with Zone 1 being the windward zone affected by the separation of the approaching turbulence, Zone 2 being the dome center affected by the approaching turbulence and the boundary layer of the roof surface, and Zone 3 being the leeward zone affected by wake turbulence. Representative pressure spectra of the divided zones are shown in Figure 15b–d. Zone 1 was classified as a windward zone spectrum with a peak at a normalized frequency of 0.4. Zone 2 was classified as the dome center spectrum with a peak at a normalized frequency of 0.08. Zone 3 was classified as the leeward zone spectrum with peaks at normalized frequencies of 0.08 and 0.2.

Figure 15.
Zoning classification method and typical spectra by zone: (a) Zoning classification method; (b) pressure spectra of Zone 1; (c) pressure spectra of Zone 2; and (d) pressure spectra of Zone 3.
4. Modeling of Fluctuating Pressure Spectra
4.1. Comparison with Pressure Spectra Models from Previous Studies
This section reviews the applicability of spectral models proposed in previous studies. The previous spectral model used in the comparison was the result of Uematsu et al. [12] for a circular flat roof and that of Sun et al. [14] for a spherical dome with f/D = 0.14. The experimental conditions of the previous studies were somewhat different from those of this study and are summarized in Table 3.
Table 3.
Comparison of experimental conditions (adapted from Refs. [12,14]).
Uematsu et al. [12] assumed that the pressure spectrum consisted of two parts, and , which were related to a single weighted coefficient.
where is the contribution of approaching turbulence to the total pressure fluctuation, is the pressure spectrum near the windward edge, is the pressure spectrum in the remaining area. Pressure spectra and are normalized using the following functions:
where denotes the Karman spectra; is used for normalizing ; is an aerodynamic admittance function that explains the transformation between velocity spectra and pressure spectra measured in wind tunnel tests; is the slope of the normalized pressure spectra in the high-frequency range; and and are the position and shape parameters on the dome roof, respectively. Table 4 presents the values of each parameter.
Table 4.
Fitted parameters of pressure spectra model (Uematsu et al. [12], adapted from Ref. [12]).
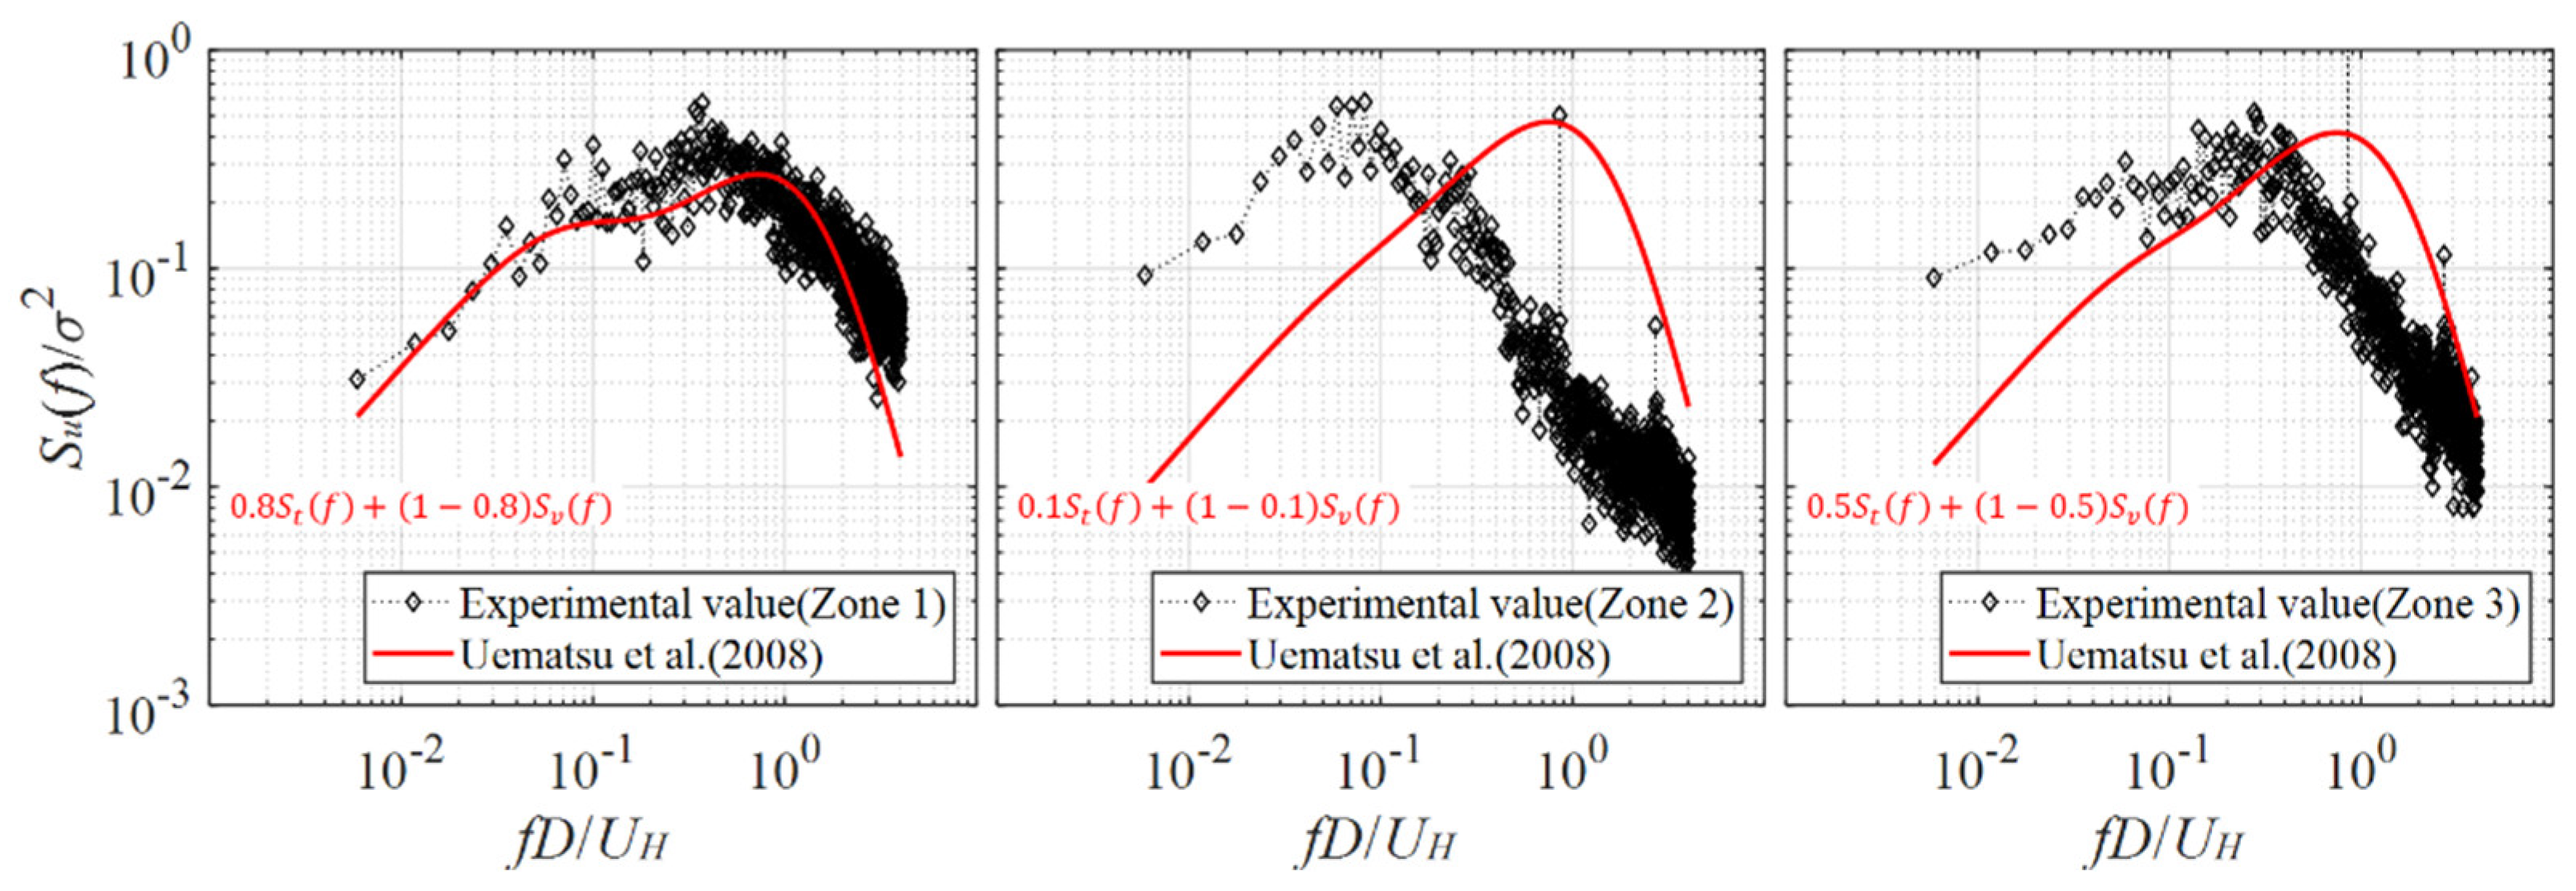
Figure 16 shows a comparison of the pressure spectra. The spectral model proposed by Uematsu et al. [12], which was used for comparison, is marked with a solid red line, and the weight coefficients used in the calculation are shown in the graph. Overall, it can be observed that the two spectra do not match in all the zones. This is because of the differences in the fluctuating wind–pressure characteristics according to the roof shape. As the rise of the dome roof decreased, the space where vortices were generated owing to separation increased, and the reattachment distance also increased, causing a greater impact of separation on flat roofs. Thus, the pressure spectra proposed by Uematsu et al. [12] exhibited a peak in the high-frequency range owing to the influence of the vortices caused by separation, thereby indicating limitations in their application to the target of this study: a dome roof with f/D = 0.1.
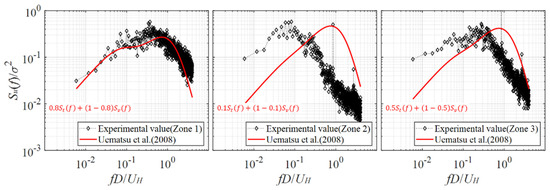
Figure 16.
Comparison with the spectra model proposed by Uematsu et al. [12] (adapted from Ref. [12]).
Sun et al. [14] conducted experiments on dome roofs with various f/D values, and proposed pressure spectral models for each f/D. This study compared the results of Sun et al. [10] for f/D = 0.14, which was the condition most similar to that used in this study. The pressure spectrum proposed by Sun et al. [10] was assumed to consist of three parts related to the two weight coefficients , , and .
where is the contribution of the approaching turbulence to the total pressure fluctuation; and (1 are the total contributions of the building-generated turbulence to the wind pressure fluctuations; is the pressure spectrum in Zone1 near the windward edge area; and are the pressure spectra in Zone2 at the center of the dome, and Zone3 is affected by the wake. The calculation methods for and are the same as those in Equations (7) and (9), respectively. Table 5 presents the values of each parameter.
Table 5.
Fitted parameters of the pressure spectra model (Sun et al. [14]. adapted from Ref. [14]).
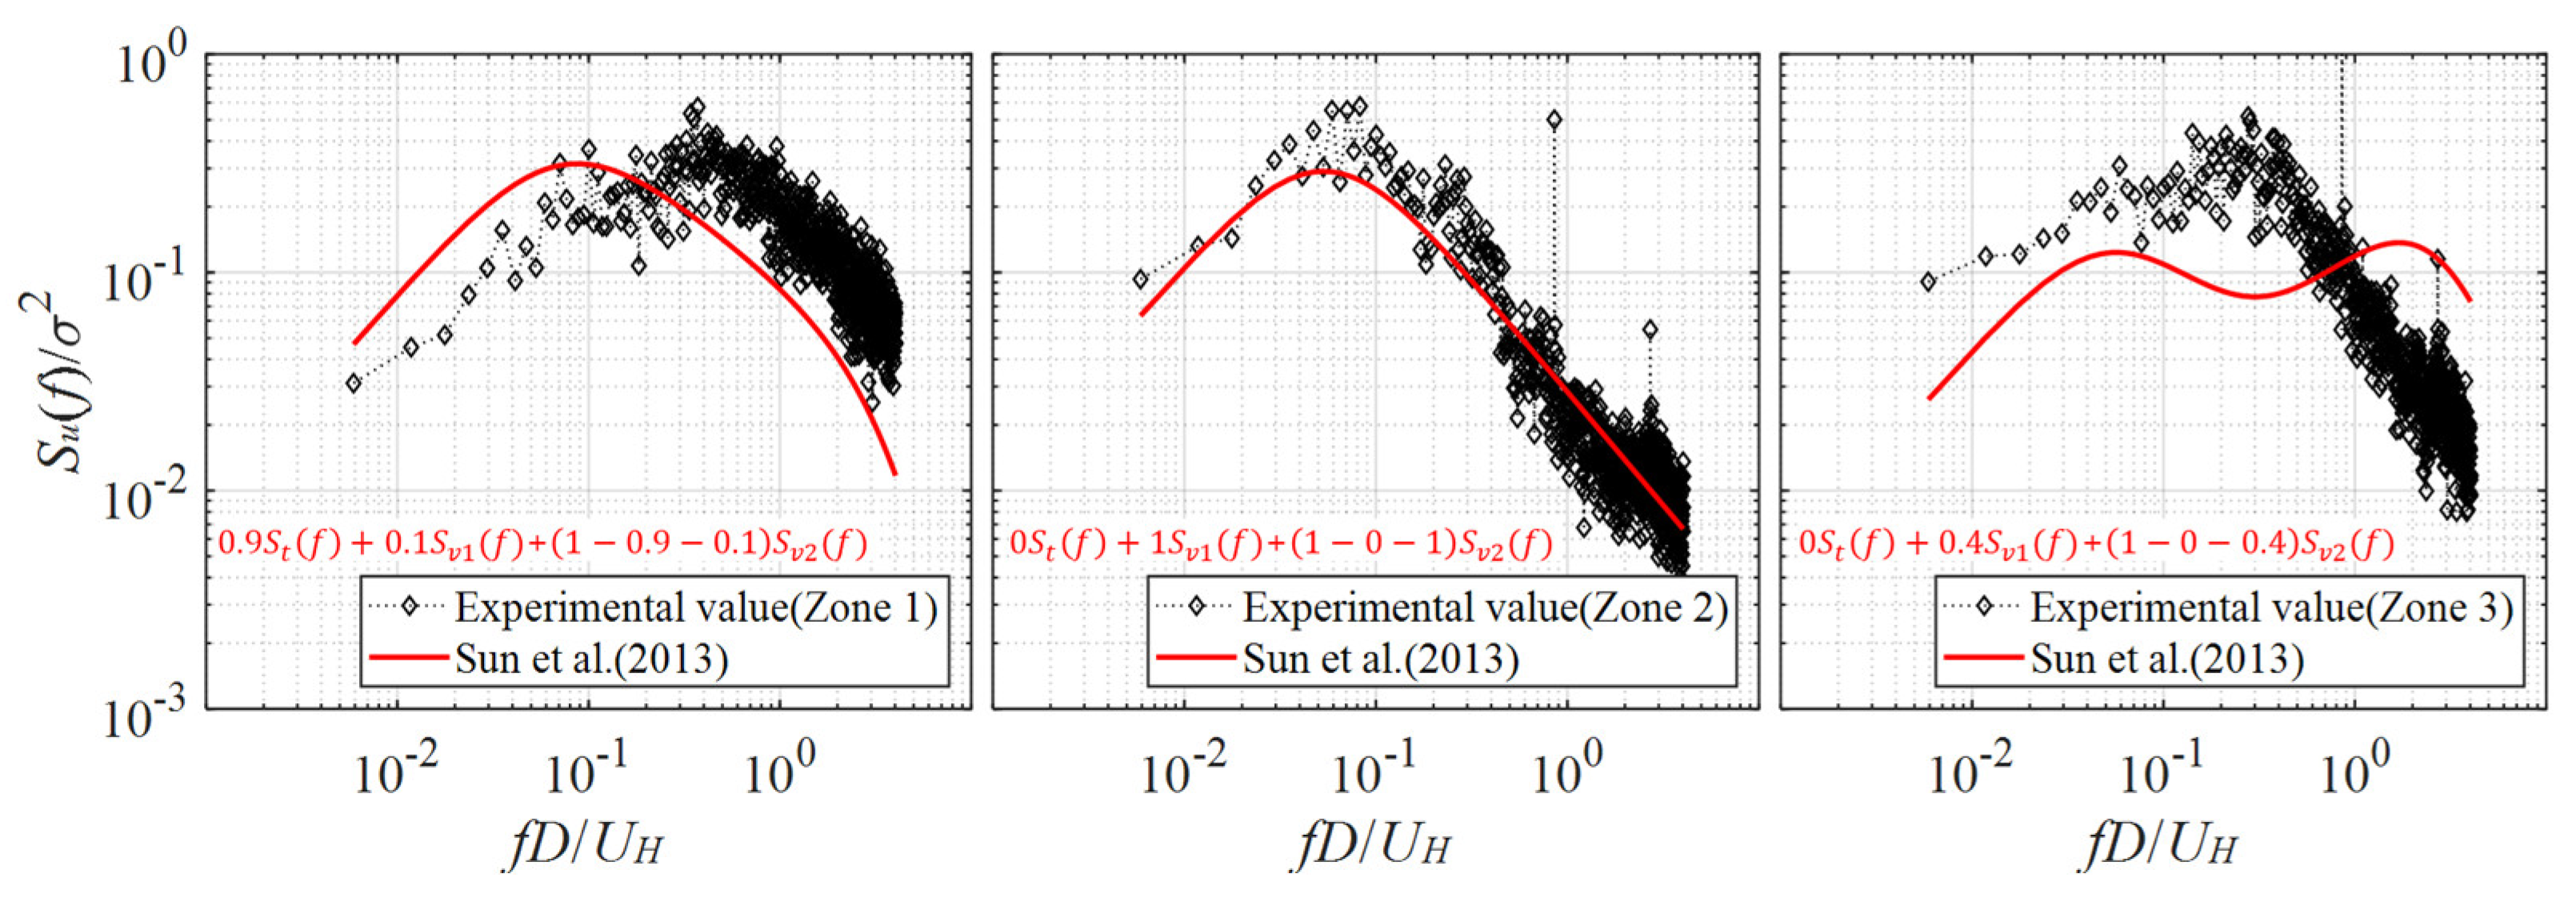
Figure 17 shows a comparison of the pressure spectra. The spectral model proposed by Sun et al. [14], which was used for comparison, is marked with a solid red line, and the weight coefficients used in the calculations are shown in the graph. Although the dome center showed relatively good agreement, there were significant differences between the two pressure spectra in Zones 1 and 3. For the target of this study, a dome roof with f/D = 0.1, the windward zone (Zone 1) is more affected by vortices owing to separation than by the turbulence in the approaching flow. However, for f/D = 0.14, as is evident from the weight coefficients, the turbulence of the approaching flow had a greater impact. Zone 3 was affected by wake turbulence, where the second peak frequency was lower and the energy was higher than those reported by Sun et al. [14]. This is attributed to the difference in the model dimensions and the low f/D. The pressure spectra proposed by Sun et al. [14] also have limitations in their application to the target of this study, that is, a dome roof with f/D = 0.1, because the flow patterns around the dome roof are different.
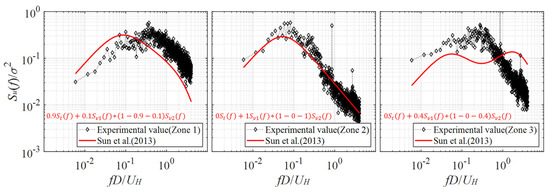
Figure 17.
Comparison with the spectra model proposed by Sun et al. [14] (adapted from Ref. [14]).
4.2. Modeling of Pressure Spectra for Dome Roofs with Low Rise–Span Ratio
By comparing the pressure spectral models proposed in previous studies, we discovered the following limitations in their application to the target of this study: a dome roof with f/D = 0.1. Therefore, this section presents a modified calculation formula and parameter values reflecting the characteristics of the fluctuating wind pressure on a dome roof with f/D = 0.1 based on the spectral models suggested in previous studies.
For a dome roof with f/D = 0.1, the pressure spectrum is assumed to consist of three parts related to two weight coefficients: , , and .
where and are the total contributions of the building-generated turbulence to the wind pressure fluctuations, is the contribution of the approaching turbulence to the total pressure fluctuation, is the pressure spectrum in Zone 1 of the windward area, is the pressure spectrum in Zone 2 at the center of the dome area, is the pressure spectrum in Zone 3 of the leeward area(Figure 15a). For dome roofs with a low f/D, the windward zone is dominated by the effect of the vortex caused by separation rather than the approaching turbulence, and the center of the dome is characterized by a spectral shape that is more similar to that of the approaching turbulence. In Section 4.1, Uematsu et al. [12] and Sun et al. [14] used the pressure spectrum in the windward area; however, in the modified proposed modeling function, the pressure spectrum was used in the windward area (Zone 1), and the pressure spectrum was used in the center of the dome (Zone 2). Consequently, the weighted coefficients of the spectra in each zone have different meanings. In other words, and represent the contributions of the vortices generated by the separation in Zone 1 and the wake in Zone 3, respectively. Additionally, because the wind speed and pressure spectra were similar at the dome center, Zones 2 and were defined as the contributions of the approaching turbulence. The weighted coefficient values of and were evaluated using a nonlinear least-squares program based on wind tunnel test results.
The calculation methods for the three parts of the pressure spectra, , , and , were the same as those described in Equations (7) and (9). The parameter values were derived using a nonlinear least-squares program based on the wind tunnel test results in the same manner as the weighted coefficients. The modified parameter values are shown in Table 6.
Table 6.
Fitted parameters for the pressure spectra model of f/D = 0.1.
Figure 18 shows the weighted coefficients , , and based on the wind pressure taps on the centerline. The x-axis represents the normalized diameter. Coefficient , representing the contribution of separation-induced turbulence in the approaching flow, was distributed over normalized diameters from 0 to 0.35, whereas , representing the contribution of wake-induced turbulence, was distributed only for normalized diameters greater than 0.75. Finally, the coefficient , which represents the contribution of the approaching flow turbulence, roughly shows a parabolic distribution over a wide range centered around the normalized diameter of 0.5, which is the dome center.
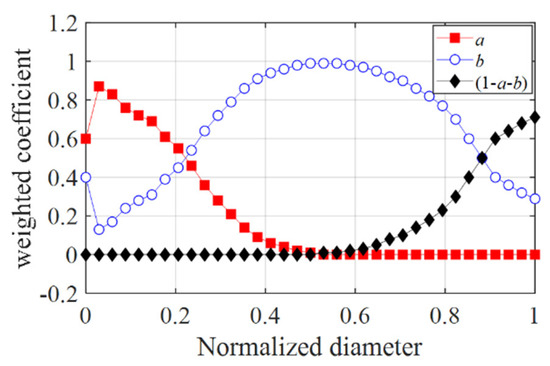
Figure 18.
Weighted coefficients.
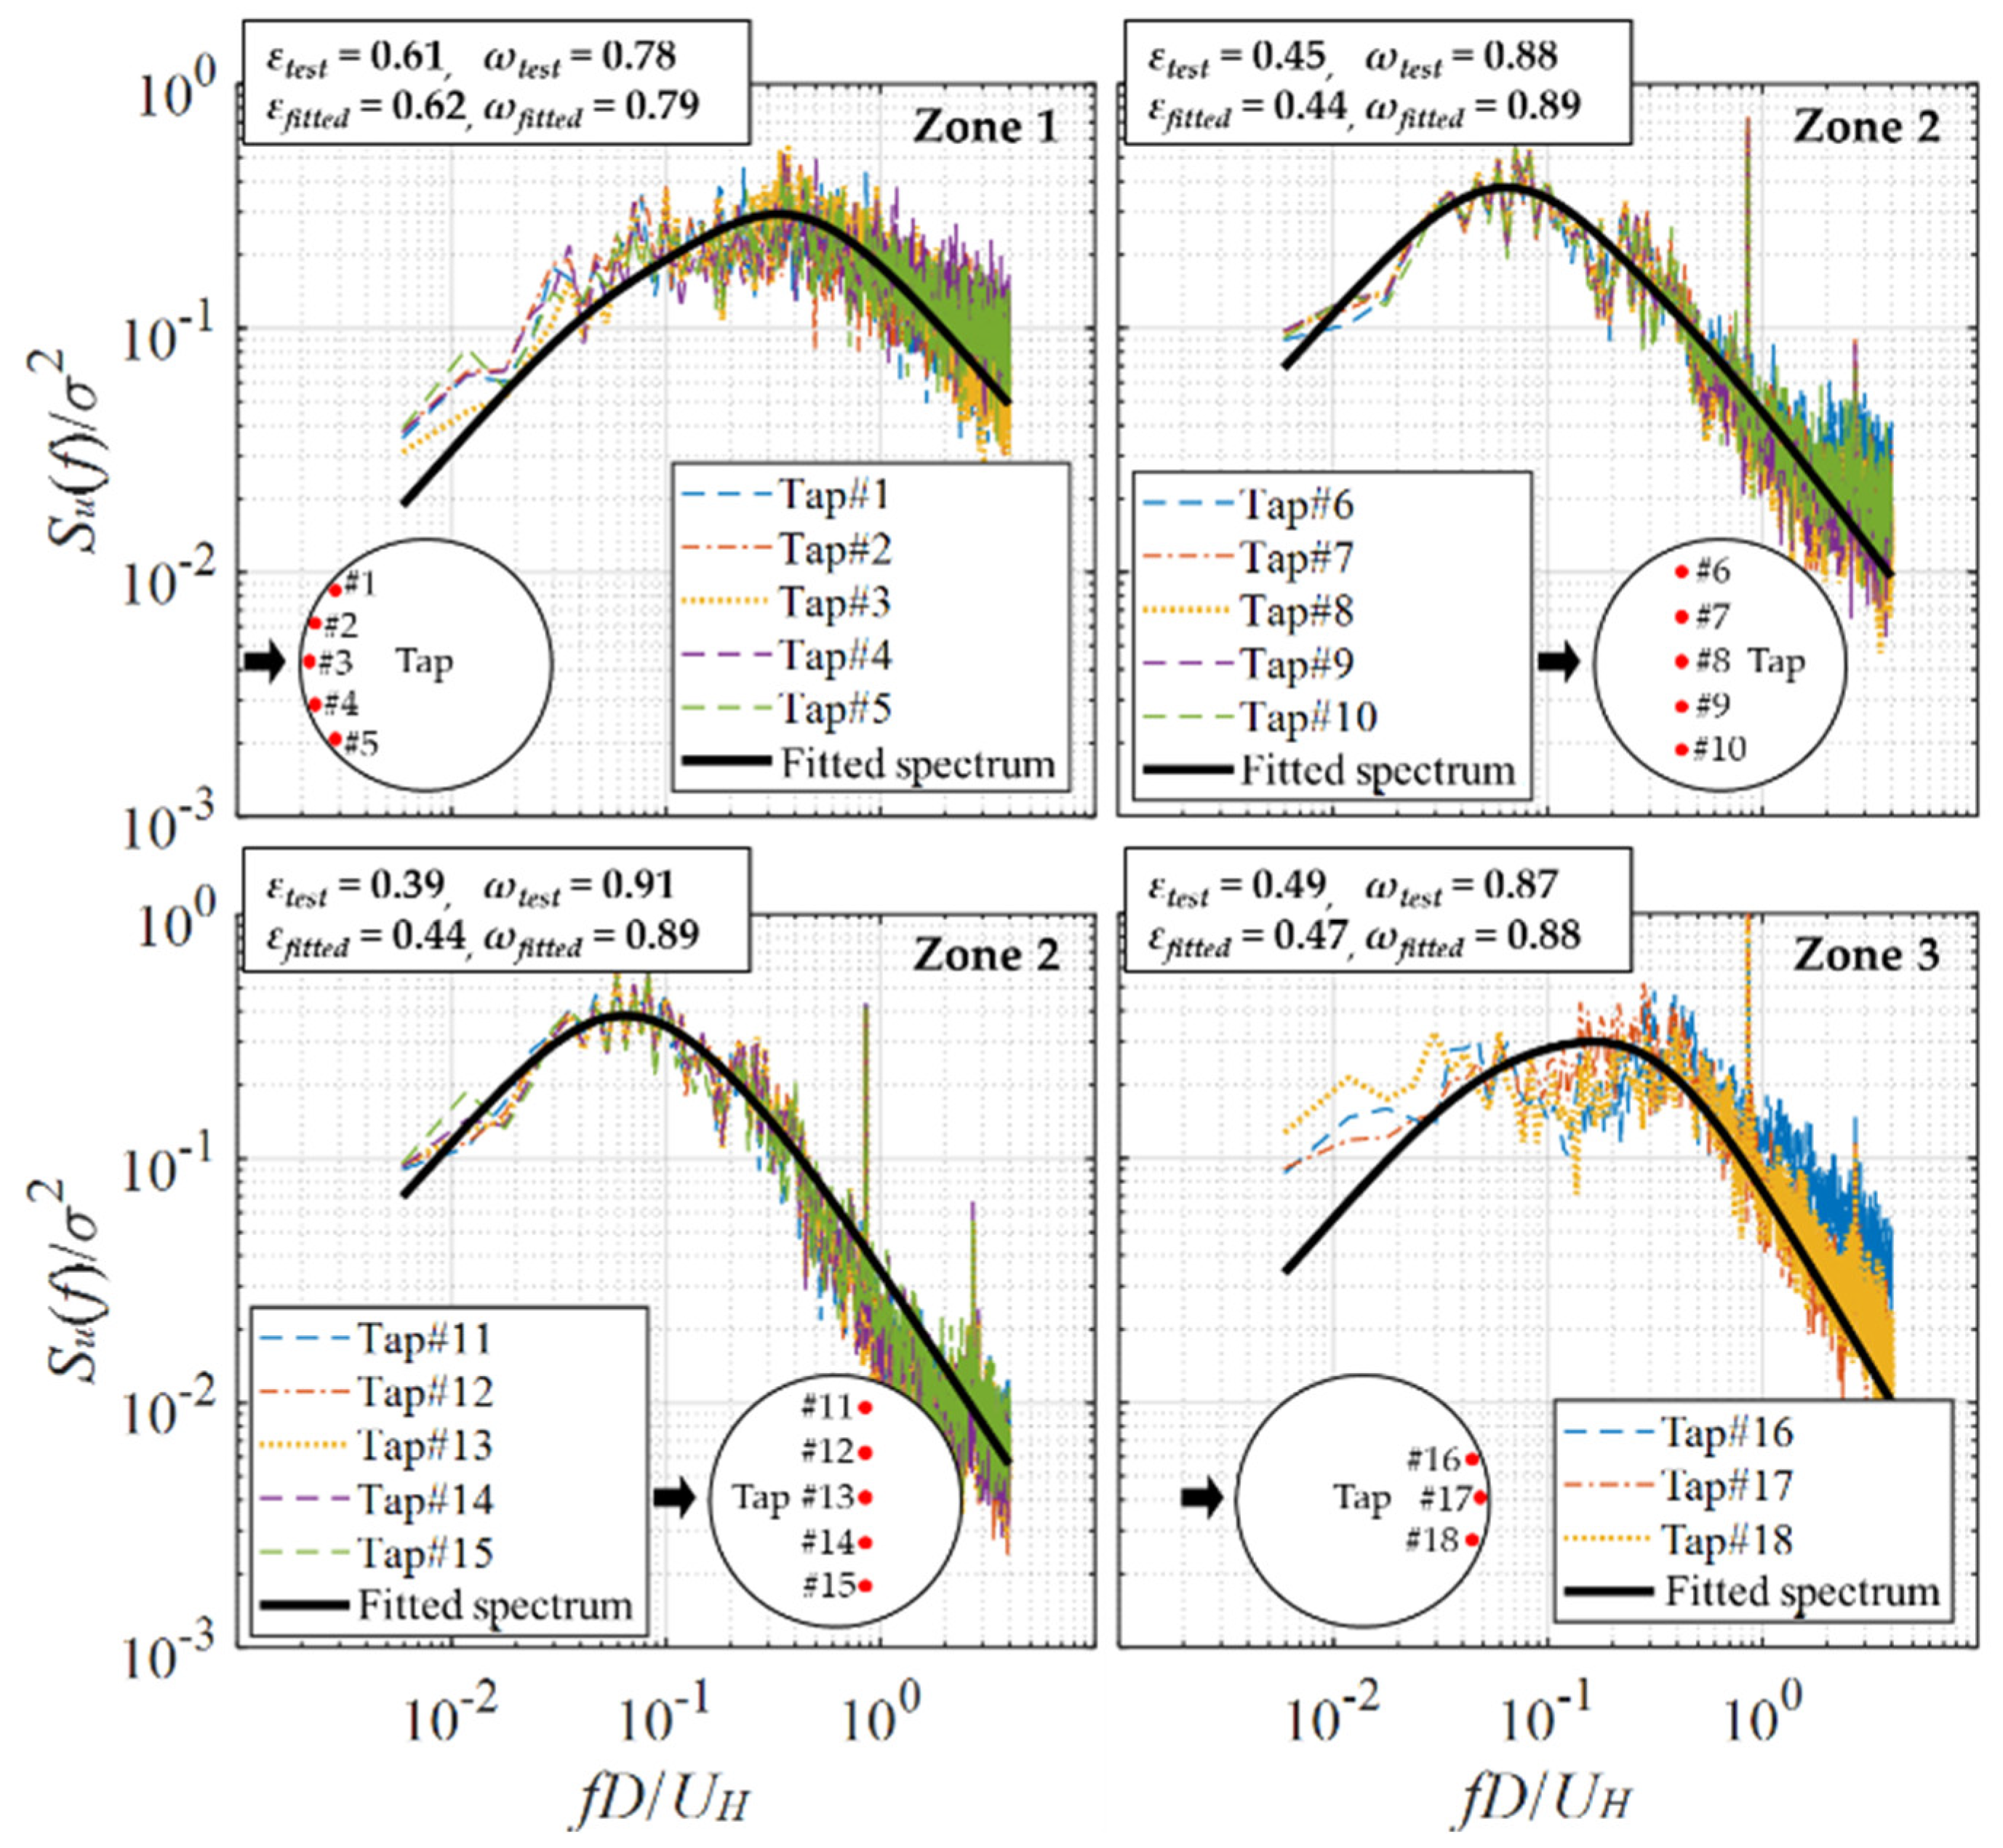
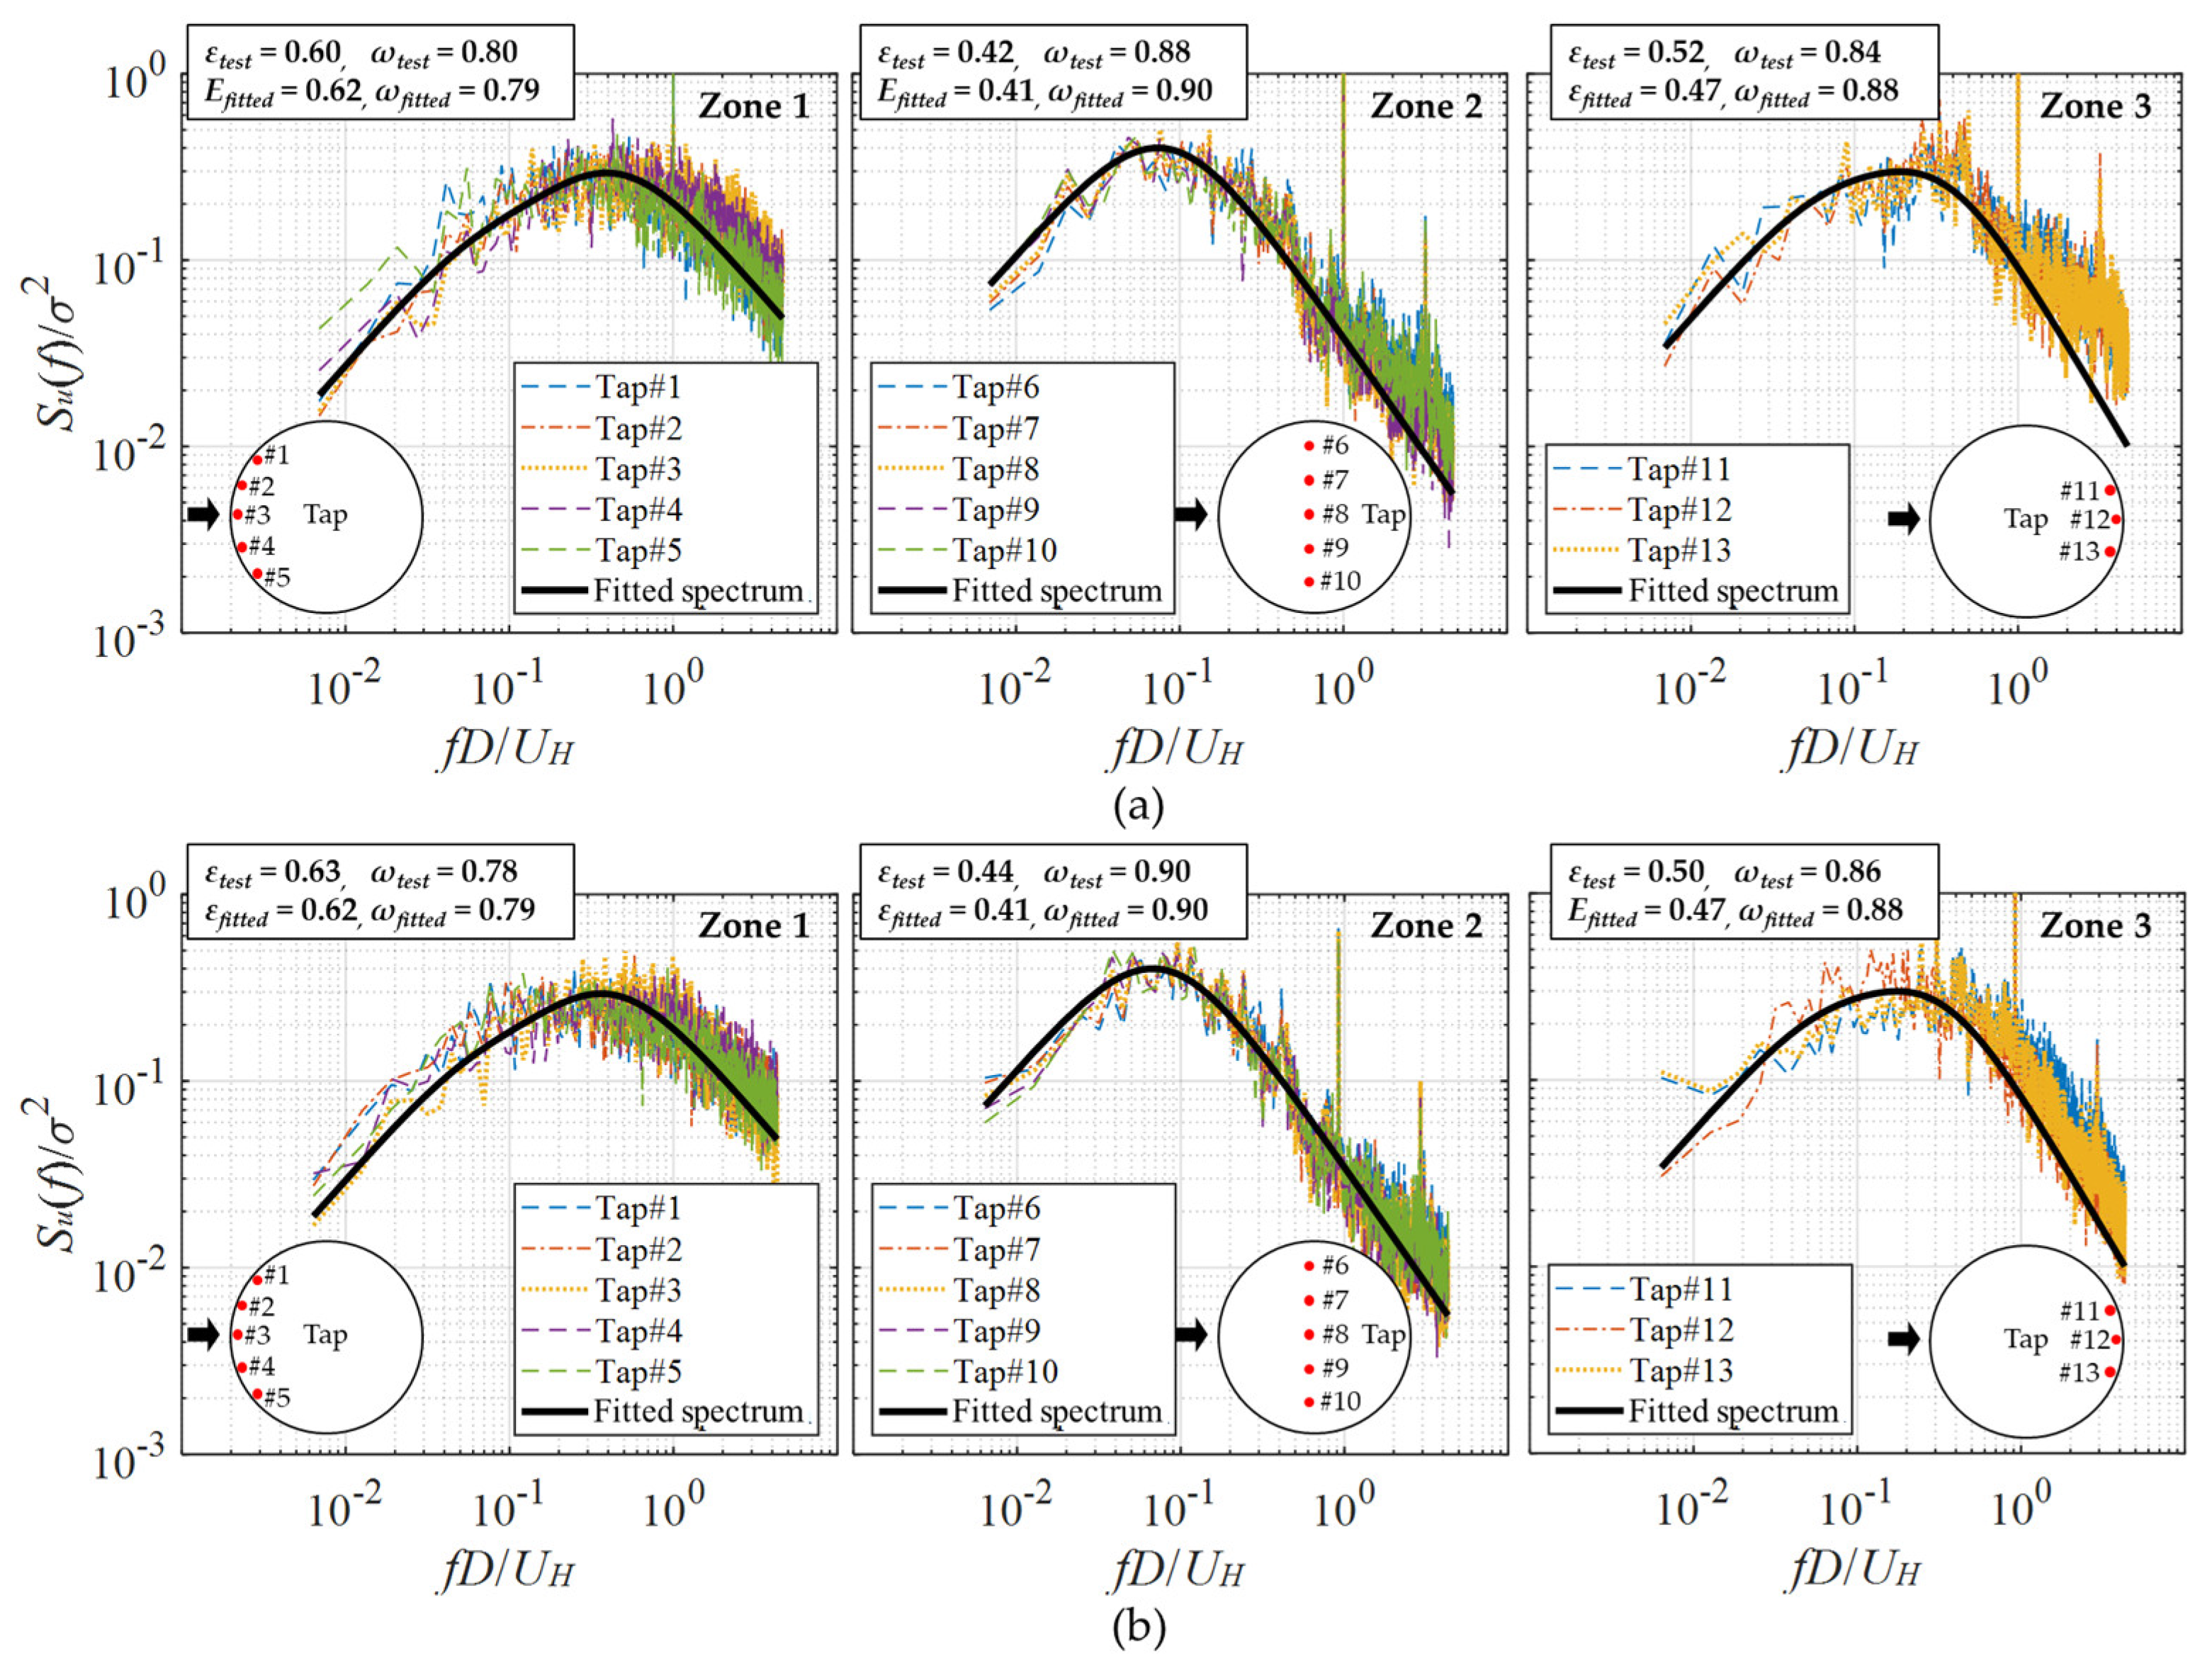
The target and simulated pressure spectra of the three zones (h/D = 0.5 and f/D = 0.1) are shown in Figure 19. The solid black line in the graph represents the proposed spectral model calculated using Equation (11). As observed in the graph, the pressure spectra modeling results were considered satisfactory. Additionally, the accuracy of the simulated pressure spectra was assessed based on spectral statistics. The ε and ω values marked at the top of the graph represent the irregularity factor and bandwidth parameter, respectively. Both the parameters have values between 0 and 1, with ε = 1 and ω = 0 representing a pure narrowband process and ε = 0 and ω = 1 representing a pure broadband process. The parameters were calculated using the expression proposed by Kumar and Stathopoulos [11], which indicated that the accuracy of the experimental values and simulated pressure spectra was very high.
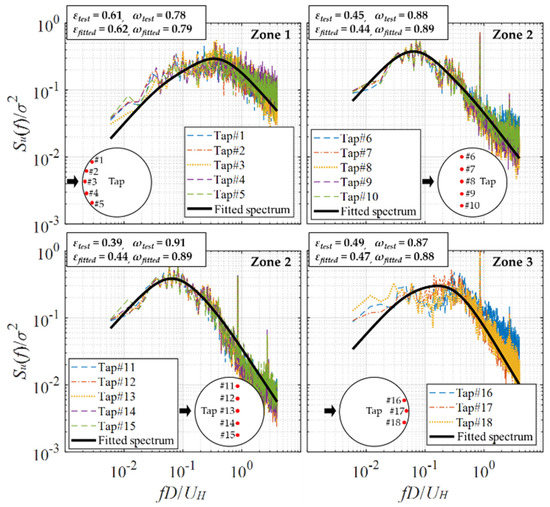
Figure 19.
Measured and fitted pressure spectra (h/D = 0.5).
The target and simulated pressure spectra for the three regions of h/D = 0.1 and 0.3 are shown in Figure 20. As previously explained in Figure 13, the target and simulated pressure spectra for both h/D values were in good agreement because the change in h/D did not significantly affect the peak or shape of the pressure spectrum.
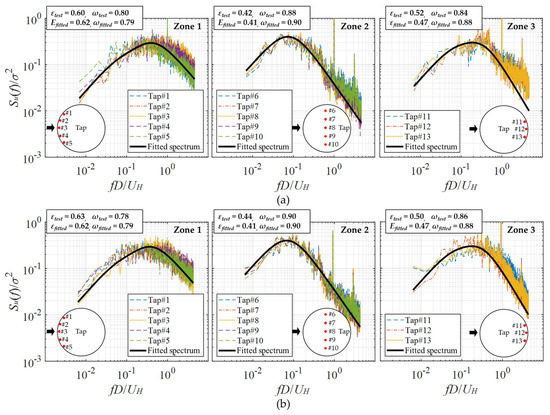
Figure 20.
Measured and fitted pressure spectra according to h/D: (a) h/D = 0.1; and (b) h/D = 0.3.
Furthermore, the average error between the simulated and target spectra was low. The error between the target and simulated pressure spectra for each wind pressure tap installed in the model was calculated using Equations (12) and (13). The average value of both errors for all pressure taps was less than 4%. Therefore, the modified pressure spectrum model proposed in this study indicates that it is practical to estimate pressure fluctuations in spherical dome roofs with low f/D values.
5. Conclusions
In this study, the characteristics of the fluctuating wind pressure on spherical dome roofs with low f/D values were investigated in detail using wind tunnel tests. The f/D of the roof was set to 0.1, and data for various h/D values were collected. The characteristics of the fluctuating pressure and flow patterns around the roof were analyzed using wind pressure coefficients and spectral analysis, and a pressure spectra model applicable to dome roofs with f/D = 0.1 was proposed compared with the pressure spectra model proposed in previous studies. The main conclusions of this study are summarized as follows:
- The experimental results confirmed that the flow patterns differed from the windward to the leeward side along the dome centerline. The windward zone was considerably influenced by the vortices generated by the separation of the approaching flow, whereas the leeward zone was influenced by the vortices caused by the wake.
- By comparing the wind pressure distribution and spectra of the dome roof with f/D = 0.1, which was the subject of this study, and those of previous studies with f/D = 0.14, the most significant difference was observed in the windward zone. When f/D = 0.14, the windward zone was directly influenced by the approaching flow. However, when f/D is reduced to 0.1, the approaching flow separates at the roof edge in the windward zone, and the windward zone is affected by the vortices generated by this separation.
- Although the pressure spectra varied according to tap location, similar spectral patterns were observed in the spanwise direction. Based on the characteristics observed in the wind pressure coefficients and pressure spectra, three zones were established according to the flow patterns and representative pressure spectra were derived for each zone. A comparison of the spectral model proposed in a previous study with the experimental results of the present study confirmed a significant difference between the experimental and spectral models owing to the difference in f/D.
- Finally, a modified pressure spectral model applicable to dome roofs with low f/D values was proposed. Based on spectral statistics, the average error between the measured and simulated spectra was less than 4%. This suggests that the modified pressure spectra model proposed in this study can effectively estimate the pressure fluctuations on spherical dome roofs with low f/D values, and can serve as a basis for the fatigue design of claddings and components.
Because the dome roof has a curved shape, the wind pressure acting on the roof varies depending on the characteristics of the approaching flow and the Reynolds number. As the results of this study targeted only one power-law index, future studies should consider more diverse wind environments and Reynolds numbers.
Author Contributions
Conceptualization, D.J.C., Y.C.K. and S.W.Y.; data curation, D.J.C., Y.C.K. and S.W.Y.; formal analysis, D.J.C. and Y.C.K.; funding acquisition, S.W.Y.; investigation, D.J.C. and Y.C.K.; methodology, D.J.C. and Y.C.K.; project administration, S.W.Y.; resources, Y.C.K.; software, D.J.C. and Y.C.K.; supervision, S.W.Y.; validation, Y.C.K.; visualization, Y.C.K. and S.W.Y.; writing—original draft, D.J.C. and S.W.Y.; writing—review & editing, Y.C.K. and S.W.Y. All authors have read and agreed to the published version of the manuscript.
Funding
This study was funded by Seoul National University of Science and Technology.
Data Availability Statement
The data presented in this study are available upon request from the corresponding author.
Conflicts of Interest
The authors declare no conflict of interest. The funders had no role in the study design, collection, analysis, and interpretation of data, the writing of the manuscript, or the decision to publish the results.
References
- Toy, N.; Moss, W.D.; Savory, E. Wind tunnel studies on a dome in turbulent boundary layers. J. Wind Eng. Ind. 1983, 11, 201–212. [Google Scholar] [CrossRef]
- Taylor, T.J. Wind pressures on a hemispherical dome. J. Wind Eng. Ind. Aerodyn. 1991, 40, 199–213. [Google Scholar] [CrossRef]
- Uematsu, Y.; Yamada, M.; Inoue, A.; Hongo, T. Wind loads and wind-induced dynamic behavior of a single-layer latticed dome. J. Wind Eng. Ind. 1997, 66, 227–248. [Google Scholar] [CrossRef]
- Letchford, C.W.; Sarkar, P.P. Mean and fluctuating wind loads on rough and smooth parabolic domes. J. Wind Eng. Ind. 2000, 88, 101–117. [Google Scholar] [CrossRef]
- Cheng, C.M.; Fu, C.L. Characteristic of wind loads on a hemispherical dome in smooth flow and turbulent boundary layer flow. J. Wind Eng. Ind. 2010, 98, 328–344. [Google Scholar] [CrossRef]
- Noguchi, M.; Uematsu, Y. Design wind pressure coefficients for spherical domes. In Proceedings of the Annual Meeting, Chicago, IL, USA, 21–25 April 2003; pp. 177–178. [Google Scholar]
- Lee, J.H.; Kim, Y.C.; Cheon, D.J.; Yoon, S.W. Wind pressure characteristics of elliptical retractable dome roofs. J. Asian Archit. Build. Eng. 2022, 21, 1561–1577. [Google Scholar] [CrossRef]
- Rizzo, F.; Sepe, V.; Avossa, A.M. Wind pressures on a large span canopy roof. Wind Struct. 2020, 30, 299–316. [Google Scholar] [CrossRef]
- Sun, X.; Yu, R.; Wu, Y. Investigation on wind tunnel experiments of ridge-valley tensile membrane structures. Eng. Struct. 2019, 187, 280–298. [Google Scholar] [CrossRef]
- Zhang, Q. Experimental study of wind pressure on a long-span canopy roof structure using a wind tunnel. Iran. J. Sci. Technol. Trans. Civ. Eng. 2021, 45, 197–206. [Google Scholar] [CrossRef]
- Kumar, K.S.; Stathopoulos, T. Power spectra of wind pressures on low building roofs. J. Wind Eng. Ind. Aerodyn. 1998, 74–76, 665–674. [Google Scholar] [CrossRef]
- Uematsu, Y.; Moteki, T.; Hongo, T. Model of wind pressure field on circular flat roofs and its application to load estimation. J. Wind Eng. Ind. 2008, 96, 1003–1014. [Google Scholar] [CrossRef]
- Lo, Y.L.; Kanda, J. Cross spectra of wind pressures on domed roofs in boundary layer wind tunnel. In Proceedings of the Seventh International Colloquium on Bluff Body Aerodynamics and Applications, Shanghai, China, 2–6 September 2012; pp. 20–23. [Google Scholar]
- Sun, Y.; Qiu, Y.; Wu, Y. Modeling of wind pressure spectra on spherical domes. Int. J. Space Struct. 2013, 28, 87–99. [Google Scholar] [CrossRef]
- Cheon, D.J.; Kim, Y.C.; Lee, J.H.; Yoon, S.W. Experimental Investigation of Wind Pressure Characteristics for Cladding of Dome Roofs. Materials 2021, 14, 5266. [Google Scholar] [CrossRef] [PubMed]
- Cheon, D.J.; Lee, J.H.; Kim, Y.C.; Yoon, S.W. Analysis of Wind Pressure Characteristics of Retractable Dome Roof by Opening Type through Wind Tunnel Test. J. Korean Assoc. Spat. Struct. 2021, 21, 41–49. [Google Scholar] [CrossRef]
- Cheon, D.J.; Kim, Y.C.; Lee, J.H.; Yoon, S.W. Wind Pressure Spectra for Circular Closed and Open Dome Roofs. J. Korean Assoc. Spat. Struct. 2020, 20, 69–76. [Google Scholar] [CrossRef]
- Cheon, D.J.; Kim, Y.C.; Lee, J.H.; Yoon, S.W. Mean and Fluctuating Pressure Coefficient Distributions for Circular Closed and Open Dome Roofs. J. Korean Assoc. Spat. Struct. 2020, 20, 69–77. [Google Scholar] [CrossRef]
- Kim, Y.C.; Yoon, S.W.; Cheon, D.J.; Song, J.Y. Characteristics of wind pressures on retractable dome roofs and external peak pressure coefficients for cladding design. J. Wind Eng. Ind. 2019, 188, 294–307. [Google Scholar] [CrossRef]
- Park, M.J.; Yoon, S.W.; Kim, Y.C.; Cheon, D.J. Wind pressure characteristics based on the rise–span ratio of spherical domes with openings on the roof. Buildings 2022, 12, 576. [Google Scholar] [CrossRef]
- AIJ (Architectural Institute of Japan). AIJ Recommendations for Loads on Buildings; AIJ: Tokyo, Japan, 2015. [Google Scholar]
- Jang, Y.I.; Lee, S.J. PIV analysis of near-wake behind a sphere at a subcritical Reynolds number. Exp. Fluids 2008, 44, 905–914. [Google Scholar] [CrossRef]


Disclaimer/Publisher’s Note: The statements, opinions and data contained in all publications are solely those of the individual author(s) and contributor(s) and not of MDPI and/or the editor(s). MDPI and/or the editor(s) disclaim responsibility for any injury to people or property resulting from any ideas, methods, instructions or products referred to in the content. |
© 2023 by the authors. Licensee MDPI, Basel, Switzerland. This article is an open access article distributed under the terms and conditions of the Creative Commons Attribution (CC BY) license (https://creativecommons.org/licenses/by/4.0/).