Article

Bearing Capacity of Transmission Poles under Combined Wind and Rain Excitations Based on the Deep Learning Method †

1
Key Laboratory of Earthquake Engineering and Engineering Vibration, Institute of Engineering Mechanics, China Earthquake Administration, Harbin 150086, China
2
Key Laboratory of Earthquake Disaster Mitigation, Ministry of Emergency Management, Harbin 150086, China
3
State Key Laboratory of Coastal and Offshore Engineering, Dalian University of Technology, Dalian 116023, China
4
School of Civil Engineering, Shandong Jianzhu University, Jinan 250102, China
5
Electric Power Research Institute, China Southern Power Grid Co., Ltd., Guangzhou 510663, China
*
Author to whom correspondence should be addressed.
This paper is an extension of the paper “Bearing Capacity of Transmission Poles under Combined Wind and Rain Excitations Based on the Deep Learning Method” presented to ACEM 2022 Conference, GECE, Seoul, Republic of Korea, 16–19 August 2022.
Buildings 2023, 13(7), 1717; https://doi.org/10.3390/buildings13071717
Submission received: 29 April 2023 / Revised: 27 June 2023 / Accepted: 29 June 2023 / Published: 5 July 2023
(This article belongs to the Special Issue Assessment and Retrofitting of Existing Infrastructure)

Abstract

:
Generally, only wind effect is considered in the collapse evaluation of transmission poles (TPs). However, during a typhoon landing, the rainfall is usually very heavy and the influence of the wind and rainfall should be considered simultaneously. To estimate the bearing capacity of TPs accurately during a typhoon, this paper proposes a method for predicting the water content distribution of soil based on the deep learning method. Then, the earth pressure distribution related to the rainfall is obtained. Furthermore, according to the static balance principle, the ultimate overturning moment of the TPs is obtained, and the corresponding critical wind speed is determined via a numerical simulation. Finally, a case study is tested and the collapse evaluation of TPs under the combined effects of wind and rainfall is obtained. The results show that the critical wind speed when considering rainfall is less than the value when ignoring the rainfall effect. The traditional method overestimates the structural safety of the TPs because the rainfall has a significant reduction on the bearing capacity of TPs.

1. Introduction

The electric power system is a crucial infrastructure in urban systems, which is composed of a power plant, a transmission network, a distribution network and power consumers [1]. The distribution network refers to the low and medium voltage electric power system, normally less than 10 kV, consisting of transmission poles (TPs), conductors and ground wires. It serves as the primary electricity transmission network for towns and suburbs.
Due to the rapid development of the economy, the demand for electric energy has increased significantly. The foundation of the TP is shallow and sensitive to rainfall, and the distribution system reliability indices show that around 80% of power outages are caused by the failure of the TPs [2]. The east of China is adjacent to the Pacific Ocean, and on average, 7.4 typhoons land in China every year, posing a frequent threat to the coastal power transmission system. As a coastal province, the Guangdong Province is susceptible to typhoons. On 16 September 2018, the Super Typhoon Mangkhut made landfall in Southeast China, leading to the collapse of a large number of TPs and cumulative direct economic losses of $710 million.
Most studies on power grids [3,4,5,6] have focused on transmission towers and transmission systems [7], while research related to TPs is limited. The distributions of TPs are usually linear with low safety redundancy [8]. In addition, during a typhoon landing, strong wind is usually accompanied by continuous rainfall. Therefore, it is necessary to carry out the collapse evaluation of TPs considering both wind and rainfall effects to guarantee their structural safety. Currently, a lot of probabilistic frameworks have been established for assessing the vulnerability of TPs under extreme wind conditions [9,10]. However, many of the relevant papers only considered the wind effect during the collapse evaluation of TPs, ignoring the effect of rainfall on earth pressure, which may overestimate the bearing capacity of TPs under combined wind and rain excitations. Based on the data of Super Typhoon Haiyan, Dai et al. [11] proposed a framework for designing a resilient power delivery system, demonstrating that establishing a sustainable power transmission system can help deter the effects of extreme weather disasters. Given that wind hazards pose a considerable damage to power systems in various countries, Hou et al. [12] studied the failure analysis procedure under the impact of wind hazards, considering the wind field generation method, and summarized the applications of data analysis in building outage prediction models. Nguyen et al. [13] developed an optimization model for optimizing the operation of distribution systems during hurricanes, and presented a comprehensive framework to analyze and assess the impacts of hurricane-induced outages on energy resources. For assessing the potential risk of the leaning utility pole, Lee et al. [14] developed a method to estimate the probability of failure of leaning utility poles under varying wind loading. The results showed that the single failure of a pole would likely propagate to neighboring poles and even to the entire power distribution network. Lee et al. [15] established a system analysis framework to analyze the resilience of the pole-wire system. Based on the results from the FEM and Monte Carlo simulations, the hardening priority was determined using risk achievement worth as the metric of importance measure. The proposed approach was found to be effective in identifying critical poles and provided guidance and recommendations for the design of the strength of the poles.
Rainfall can increase the water content of soil and decrease the shear strength of the soil. As a transmission pole is a kind of short and rigid structural member made of reinforced concrete, the main failure form is overall overturning. Due to the tension of the wires, the collapse of poles tends to be continuous and widespread. In the Unnao area of Uttar Pradesh, India, a large number of transmission poles overturned significantly after a storm. To investigate the reasons, Vivek et al. [16] built a full-scale model at the Institute of Technology Kanpur and performed a static pushover test to analyze the effects of various soil parameters on the bearing capacity. To analyze the moment behavior of leaning poles, Lee et al. [14] proposed a new probabilistic framework for computing three types of loads by wind pressure, overturning force, and conductor tension, which enables potentially vulnerable TPs that could threaten the power distribution system’s reliability under varying wind speeds to be analyzed.
It can be seen that most studies only focus on wind loads. Although extreme wind load is a major factor in the safe design of TPs, strong wind and continuous rainfall usually coexist during typhoon landings [17]. Therefore, a predictive model for the soil water content after rainfall is needed to evaluate the ultimate bearing capacity of the foundations after rainfall, making the safety assessment of the structure more realistic.
Based on this, a reasonable framework to evaluate the safety of TPs under combined wind and rain excitations is established. In Section 2, we systematically describe the research idea of the ultimate overturning moment after rainfall. And then, to predict the relationship between rainfall and soil water content, in Section 3 we perform neural network training and further derive the calculation formula of earth pressure considering rainfall. In Section 4, we obtain critical wind speeds for different cases through numerical simulation. Finally, in Section 5, we summarize the research and put forward a series of conclusions.

2. Ultimate Bearing Capacity of TPs under Combined Wind and Rainfall Effects

2.1. Ultimate Overturning Moment in the Current Code

Additionally, due to the bearing capacity of the foundation being related to the soil type, it is essential to determine the soil parameters of the focused area [18]. In this paper, we focus on the power distribution system of Guangdong Province, China, and use data from the National Earth System Science Date Center to identify the dominant soil type in the region; therefore, this paper conducted the study based on the mechanical properties of red soil. Red soil is highly hygroscopic due to its electric double layer structure, and is additionally fissile and has swell–shrink characteristics [19]. One study [20] shows that the cohesion of the red soil has a stepped relationship with the water content, and the internal friction angle of the red soil varies insignificantly with increasing water content. The internal friction angle of red soil in the natural environment generally ranges from 15% to 30%, with cohesion between 0 and 50 kPa, and a liquid limit greater than 50. The estimation of the lateral earth pressure along the retaining walls has always been a key point in engineering and academic fields [21]. The classical Rankine earth pressure theory [22] has been widely used to estimate lateral earth pressure. The Rankine theory assumes that the wall is rigid and the wall back is smooth. For red soil, the expression of earth pressure can be simplified as:
p z = γ s z K p + 2 c K p
where γ s denotes the calculated gravity of the soil; z is the depth of the soil; c denotes the cohesion; φ is the internal friction angle; and K p is the passive earth pressure coefficient defined by
K p = tan 2 ( 45 ° + φ 2 )
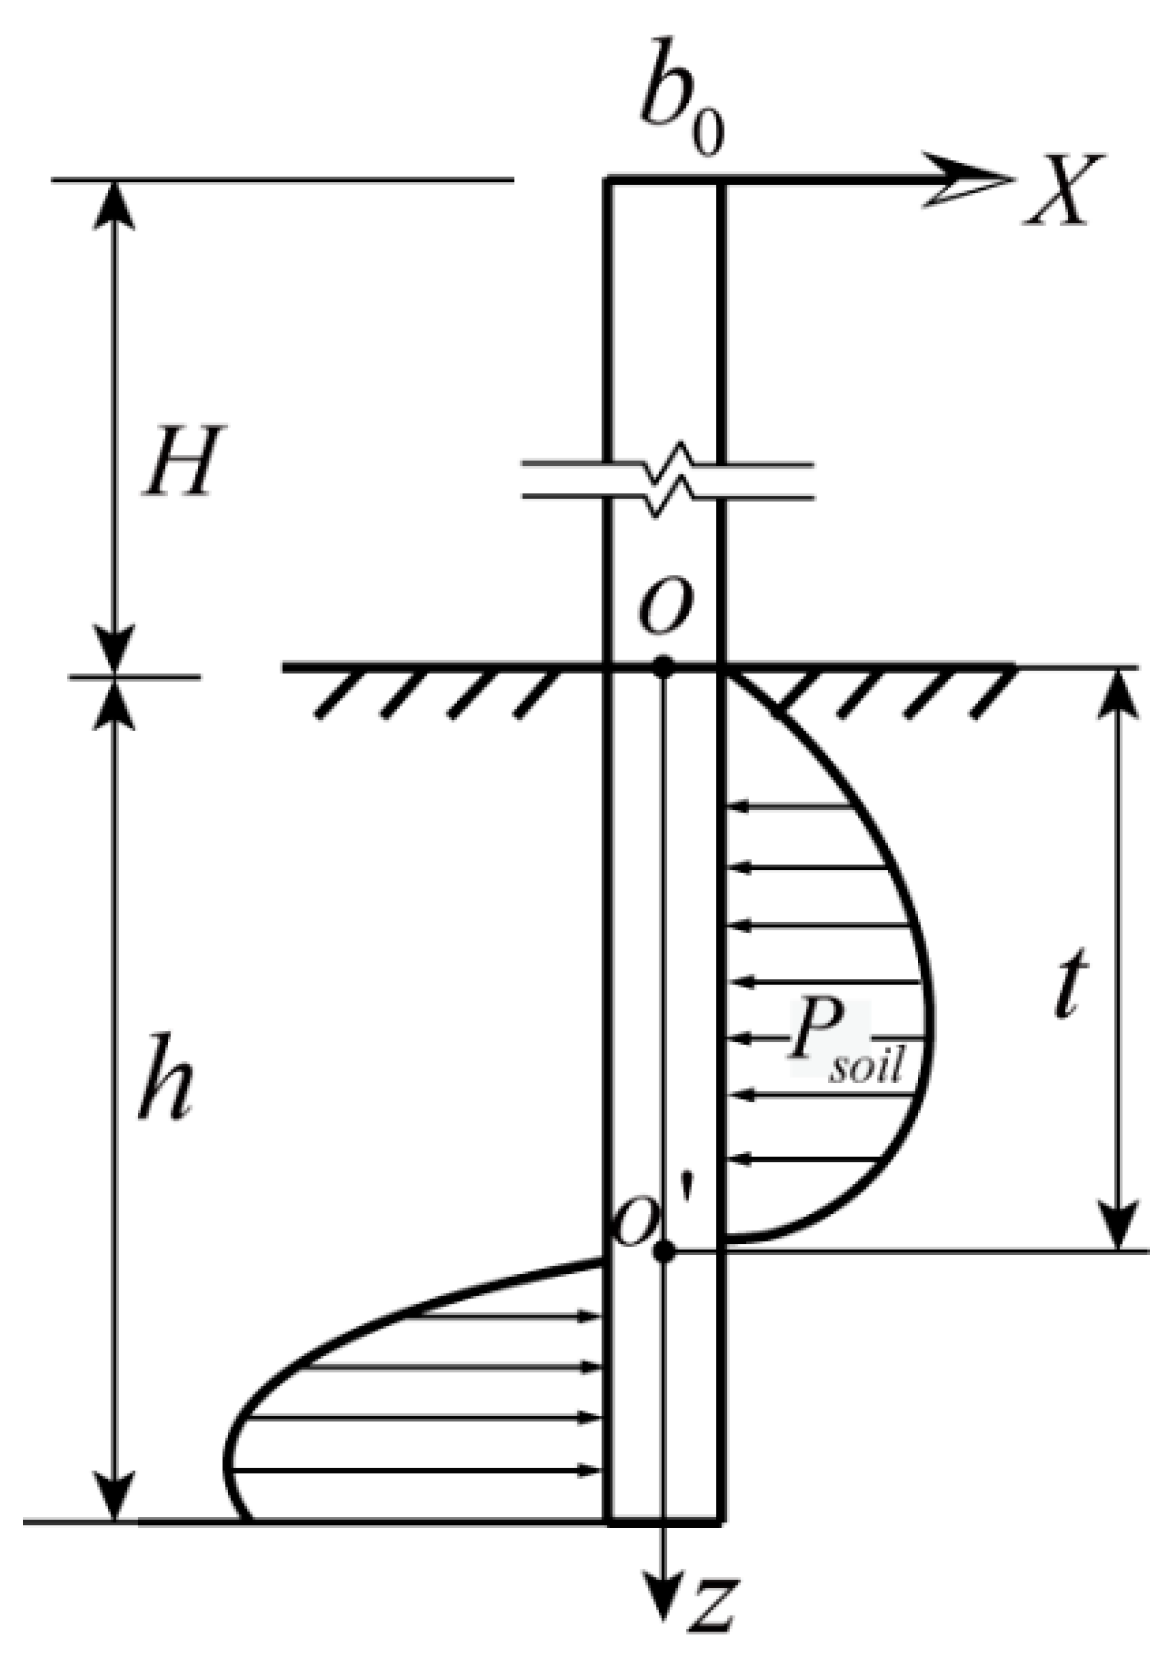
As can be seen from Figure 1, the earth pressure behind the wall appears to have a linear distribution. However, several experiments [23,24] found that the earth pressure of the retaining wall is not actually linear due to the soil arching effect. To investigate the influence of the soil arching effect, Yue et al. [25] designed a finite element model; the results show that pile spacing is the main factor influencing the soil arching effect. As pile spacing increases, the soil arching effect gradually weakens and finally the action of the barrier is no longer effective. Due to the spacing of transmission poles in this study being 50 m, the soil arching effect can be ignored and Rankine theory is appropriate for the TPs.
The internal friction angle φ and cohesion c in Equation (1) are two important parameters used to describe the mechanical properties of soil. The internal friction angle φ can be easily determined, but the cohesion c is known to vary even for the same soil type [26]. Therefore, the cohesion c in Equation (1) is ignored in the “Technical regulation for designing the foundation of overhead transmission line” (DL/T 5219-2017) [27] (referred to as the code hereinafter). And then, φ is appropriately increased as a supplement of c . The increased φ is referred to as the “equivalent friction angle” β .
Finally, the expression of earth pressure according to the code is expressed as
p z = γ s z K p
K p = tan 2 ( 45 ° + β 2 )
So far, the formula of β is not determined. The Code has established the reference value of β based on the soil type and engineering experience. According to static balance principle, the ultimate overturning moment M c o d e equals
M c o d e = 1 3 γ s K p b 0 h 3 1 2 θ 3
where b 0 denotes the calculated width; h denotes the buried depth; and θ is a constant taken from the code.

2.2. Evaluation Framework of the Pole-Line System under Rainfall

Due to the value of c for red soil decreasing significantly under natural water content and the relationship between φ and water content being more stable than c [28,29], the effect of c is ignored in this paper and the earth pressure considering rainfall is obtained based on Equation (2). The distribution of earth pressure is nonlinear, as shown in Figure 2.
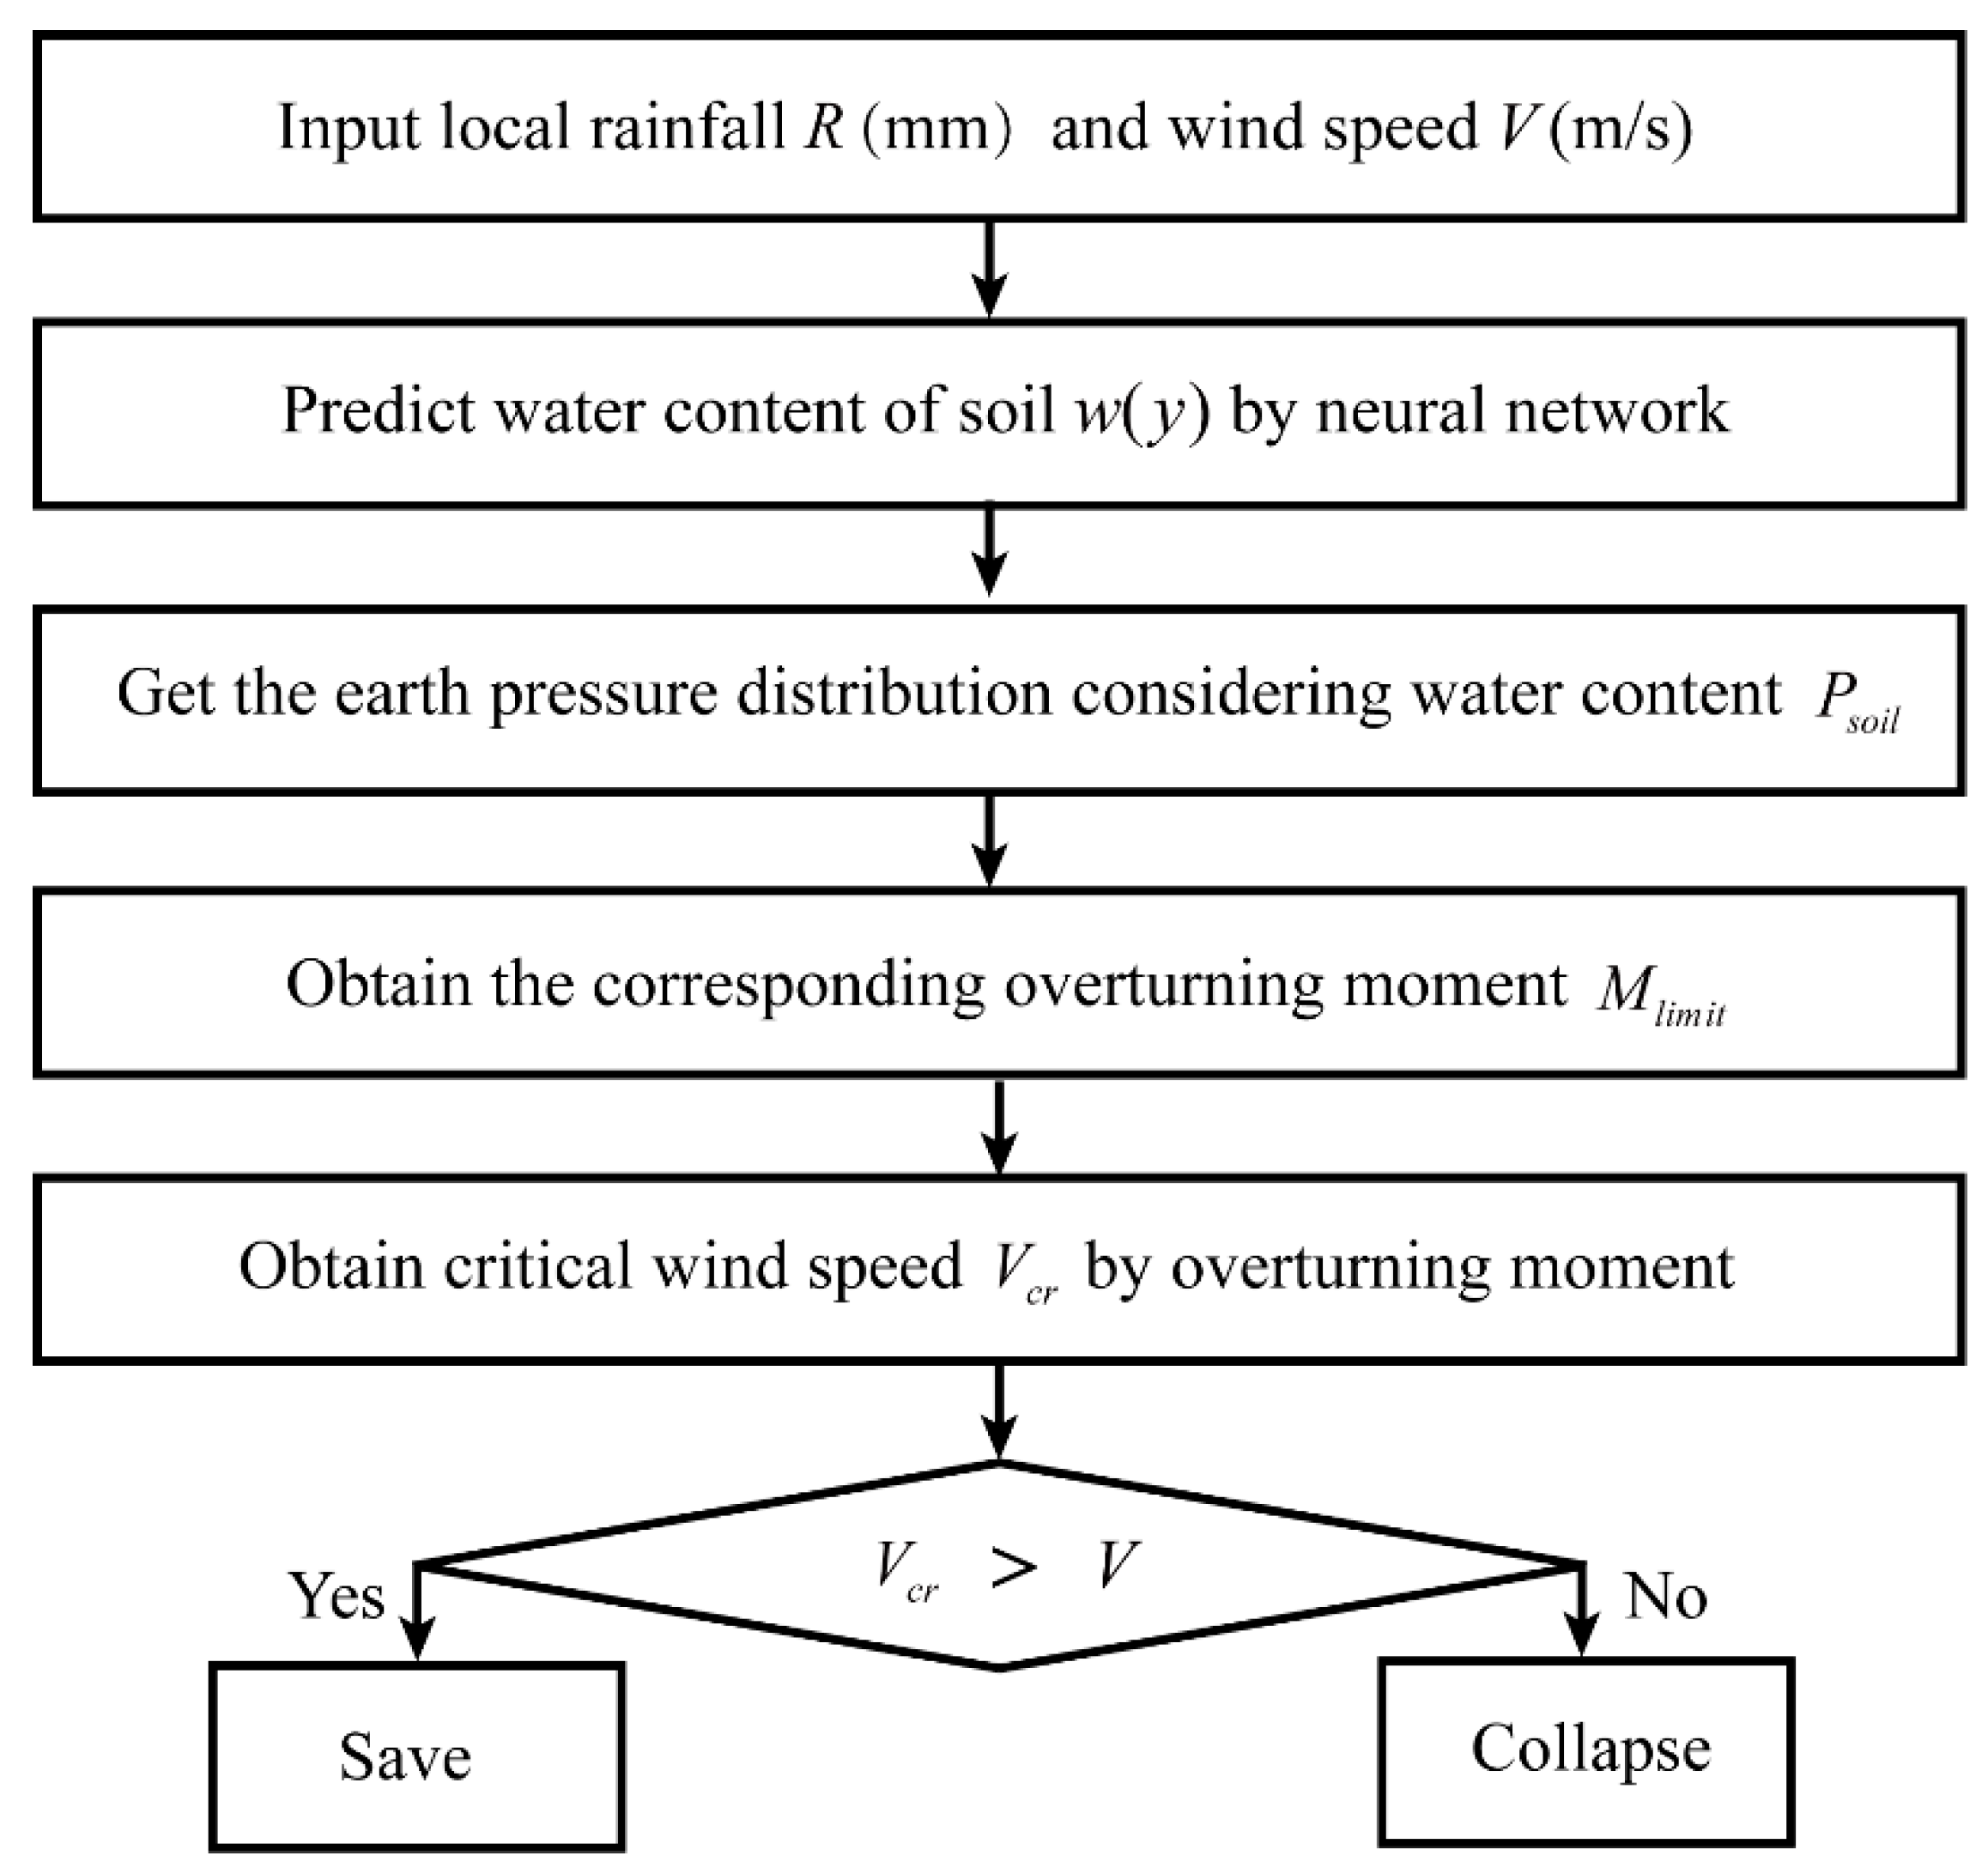
The evaluation framework for assessing the performance of TPs under combined wind and rainfall effects is illustrated in Figure 3. The first step is to clarify the correlation between local rainfall and wind speed. And then, the neural network is used to predict the soil water content after rainfall. The corresponding earth pressure can be obtained according to the soil mechanical properties under different water content. The second step is to calculate the ultimate overturning moment via the modified earth pressure and the static balance principle. Finally, the critical wind speed V c r can be determined via a finite element model, and the safe operation of TPs can be monitored through comparing the maximum measured wind speed and V c r .

3. Prediction of the Earth Pressure Distribution after Rainfall Based on the Deep Learning Theory

3.1. Neural Network Analysis for Rainfall and Water Content

Landslides occur commonly after heavy rainfall. Field tests are generally used to study the properties of soil [30]. To predict the landslides more accurately and immediately, Thumtuan et al. [31] conducted a real-time monitoring of soil water content at Prince of Songkhla University, Thailand. Geologically, the residual soil above the parent rock was mainly red soil with a thickness of 2–3 m. The soil slope at the test site was approximately 22 degrees. To monitor the soil water content, five time-domain reflectometers (TDRs), TDR1 (0.15 m), TDR2 (0.40 m), TDR3 (0.90 m), TDR4 (1.40 m) and TDR5 (1.90 m), were installed vertically in the test pit, distributed at depths from 0.15 to 1.9 m. The monitored data were automatically uploaded and stored on a web server (http://www.nadrec.psu.ac.th (accessed on 23 June 2023)) [32].
The neural network method [33] is used to predict the water content of soil in this paper. When training a neural network, the greater the amount of raw data, the more accurate the resulting correspondence. Based on the original limited sample data, with the help of white noise, the amount of measured data is extended, and the accuracy of the neural network training is improved. Due to the rainfall infiltration requiring a certain amount of time, the water content of the soil is not only related to the rainfall of the same day but is also affected by precipitation from several days prior. The continuity of rainfall should be considered in the neural network analysis. Before training the neural network, thirty-four days of rainfall data are split into 3-day, 5-day and 7-day segments to consider the duration of the rainfall.
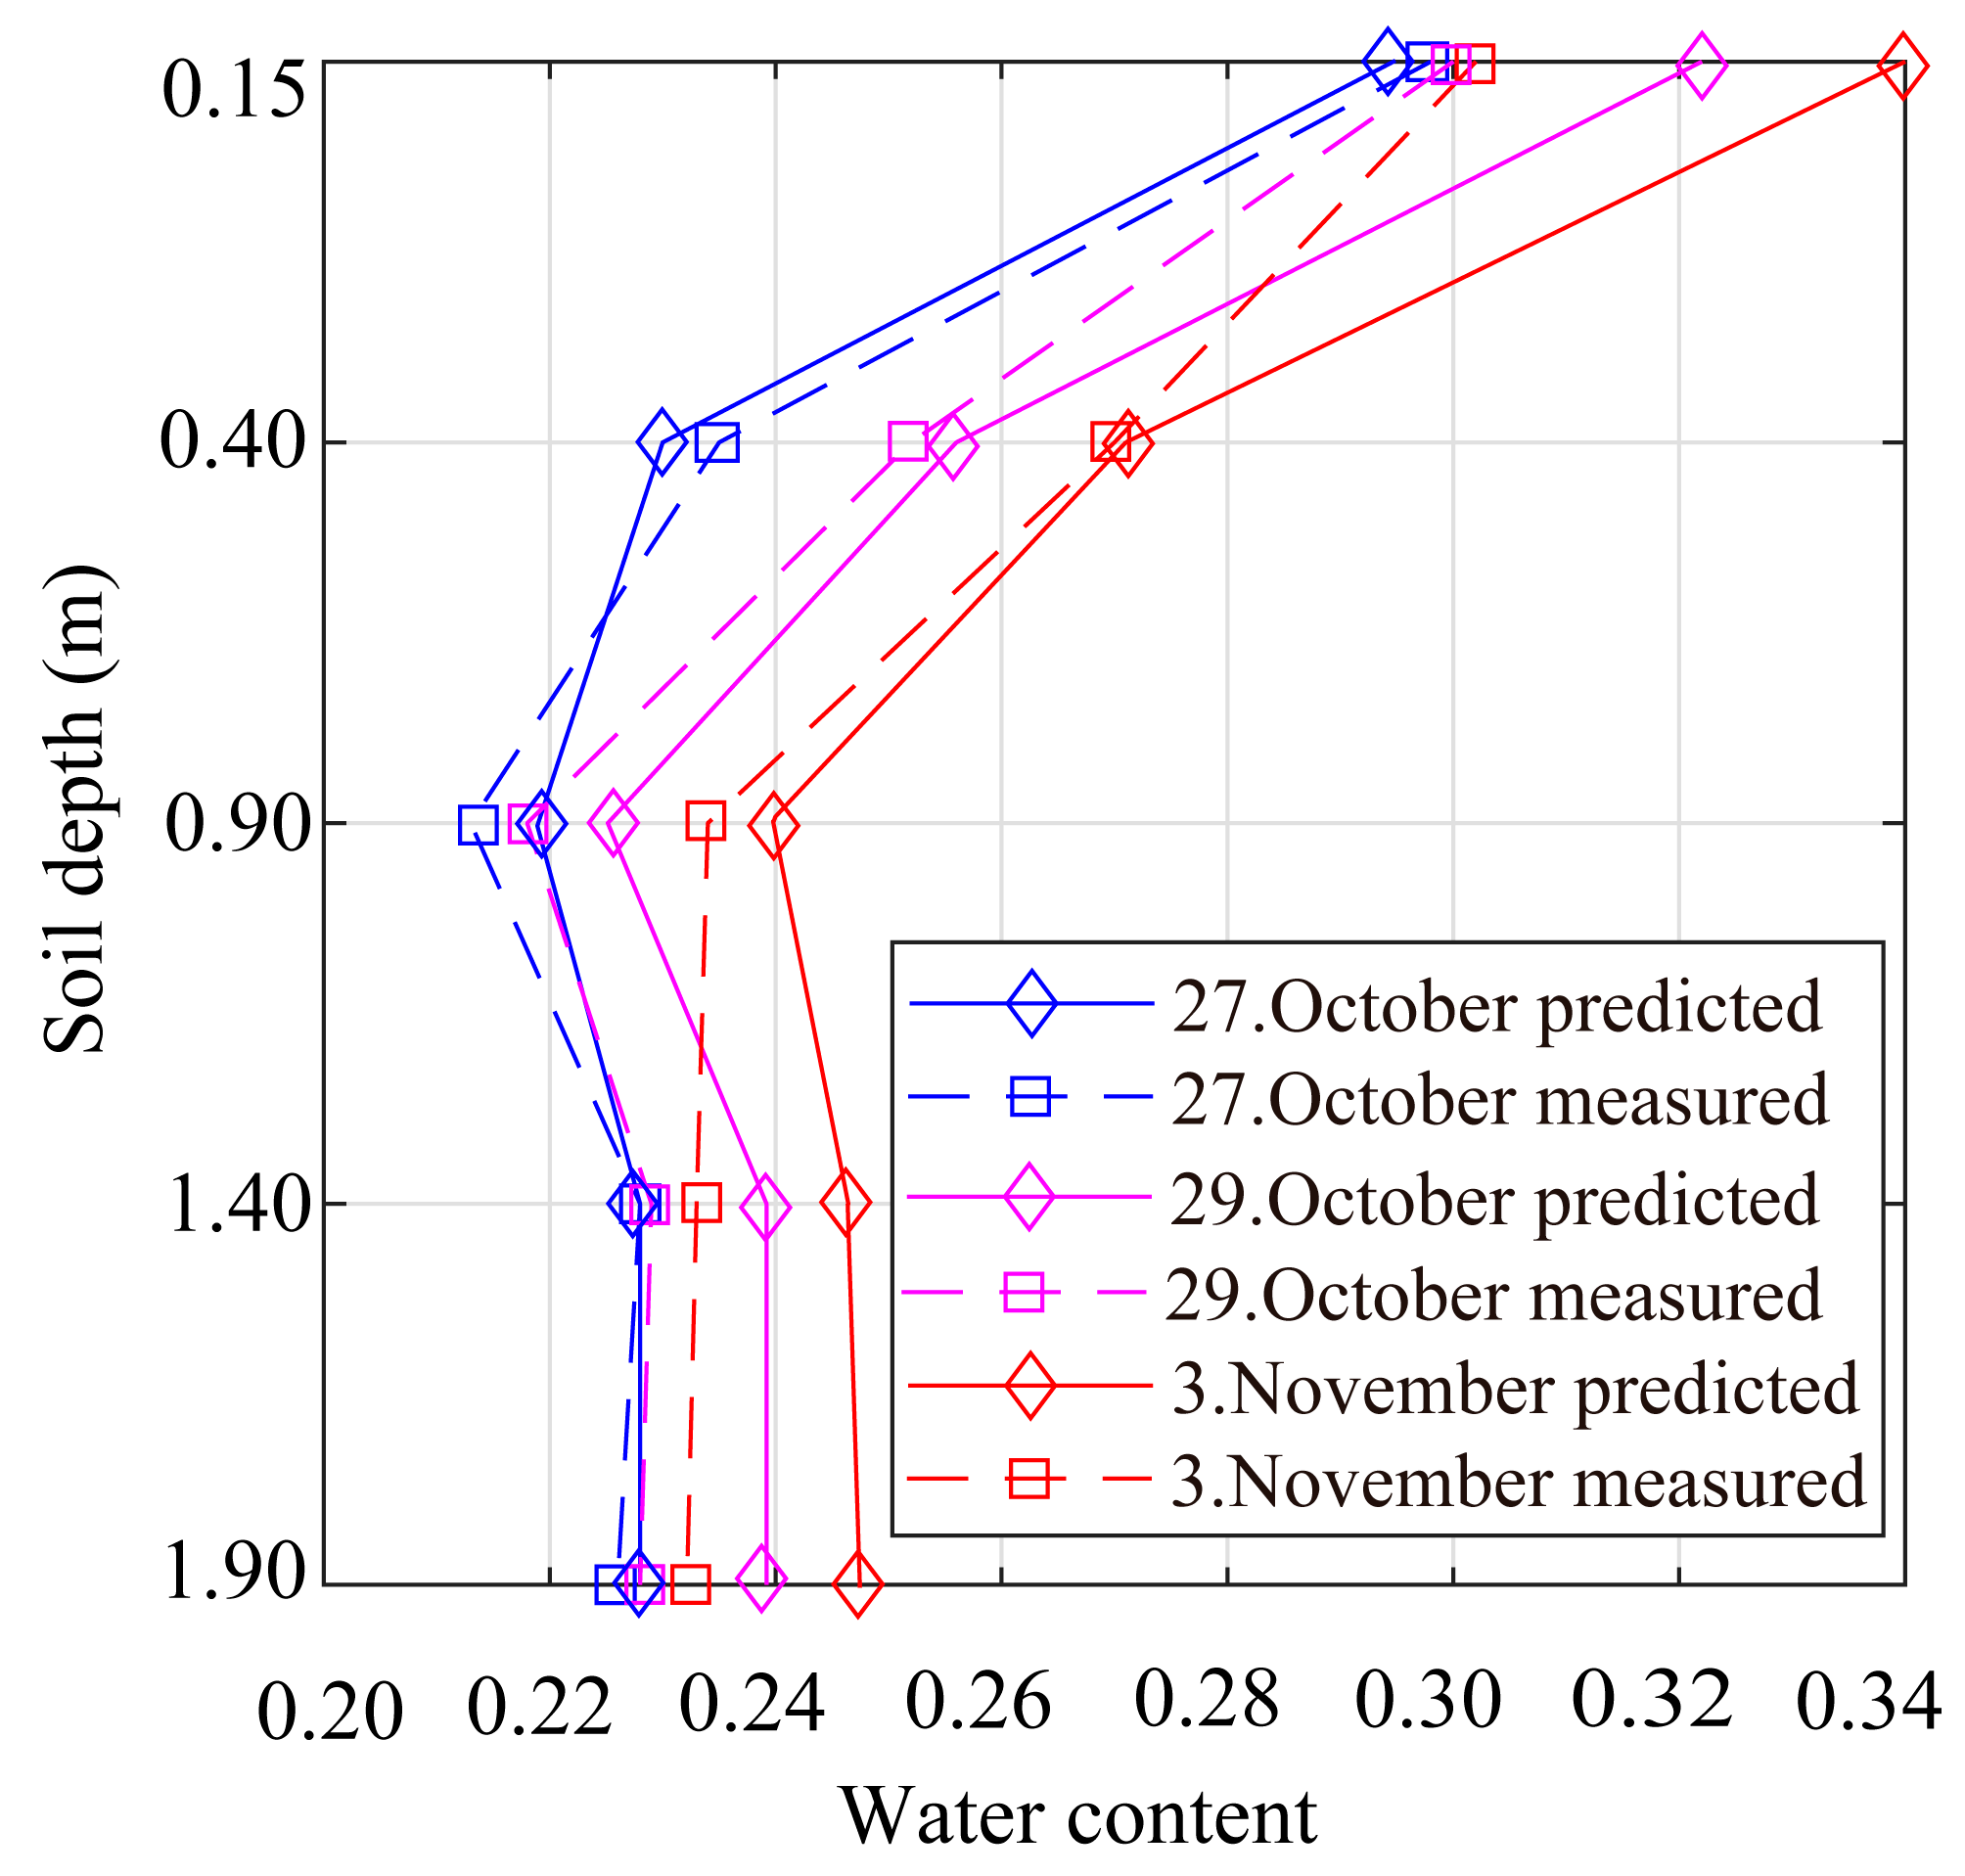
The input layer is the duration and amount of rainfall, and the output layer is the water content of the soil corresponding to the position of the five TDRs. To verify the accuracy of the training results derived from the self-programmed MATLAB program, the measured rainfall data are used to predict the soil water content. The rainfall for three days is 0 mm, 33 mm and 23 mm, respectively. The measured results and the predicted results of the neural network are shown in Figure 4. It is evident that each fold line consists of five points, the x-coordinate of which denotes the burial depth of the TDR in the soil. Moreover, the predicted and measured results are very close, indicating that the trained neural network is reliable.
As can be seen from Figure 4, the y-coordinate is soil depth and the x-coordinate is soil water content. Predicted and measured values are generally consistent.
The water content of the surface soil is highest at 0.15 m and then decreases rapidly in the shallow soil between 0.15 and 0.4 m. The reason for this phenomenon is that the shallow soil is in direct contact with rainwater. Subsequently, the water content decreases rapidly due to infiltration of rainwater. Ng et al. [34] found that due to the abundance of open cracks on the soil surface, rainwater flowed along these cracks to the deeper soil layers, leaving only a small amount of water. The surface soil layer is the most sensitive to precipitation, while the water content in the deeper soil layers shows a delayed response to precipitation [35]. Therefore, the reduction of water content gradually slows down at 0.5 m to 1 m. As the depth increases, the number of cracks gradually decreases until the appearance of an aquiclude [36]. Due to the accumulation of rainwater, there is a slight increase in water content from 1 m to 1.5 m. Finally, the water content becomes almost constant below 1.9 m. To simplify the calculations, we assume that the soil water content below 1.9 m remains constant.
Based on the predicted values of the five monitoring points, the equation of the water content is obtained using the linear interpolation method.
w ( z ) = w 1 + 2.5 w 2 w 1 z ( 0 z 0.4 ) w 2 + 2 w 3 w 2 ( z 0.4 ) ( 0.4 < z 0.9 ) w 3 + 2 w 2 w 1 ( z 0.9 ) ( 0.9 < z 1.4 ) w 4 + 2 w 2 w 1 ( z 1.4 ) ( 1.4 < z 1.9 ) w 5 ( z > 1.9 )
where w 1 , w 2 , w 3 , w 4 and w 5 are the predicted values of soil water content at the five monitoring points.

3.2. Mechanical Properties of the Soil after Rainfall

Friction angle and cohesion are the main parameters in soil mechanics. To research the regional characteristics and the water-sensitive shear strength of red clay, Wang et al. [19] selected the red clay located in the Guangdong Yunfu region and tested its physical properties at different water contents. The relationship between shear strength and water content of red clay is obtained, and the equation of the internal friction angle φ is expressed as
φ w = 50.5 w < 20 % 2226629.6 × e w 1.868 + 13 20 % w 27 %
From the monitored data [31], it is known that the water content of red soil is usually above 20%, and thus, only the second equation of Equation (7) is selected.
Substituting Equations (6) and (7) into Equation (2), yields the following equation, which can be used to determine the ultimate overturning moment considering the rainfall effect:
P soil = γ s z tan 2 45 ° + φ w 2

3.3. Ultimate Overturning Moment Considering the Rainfall Effect

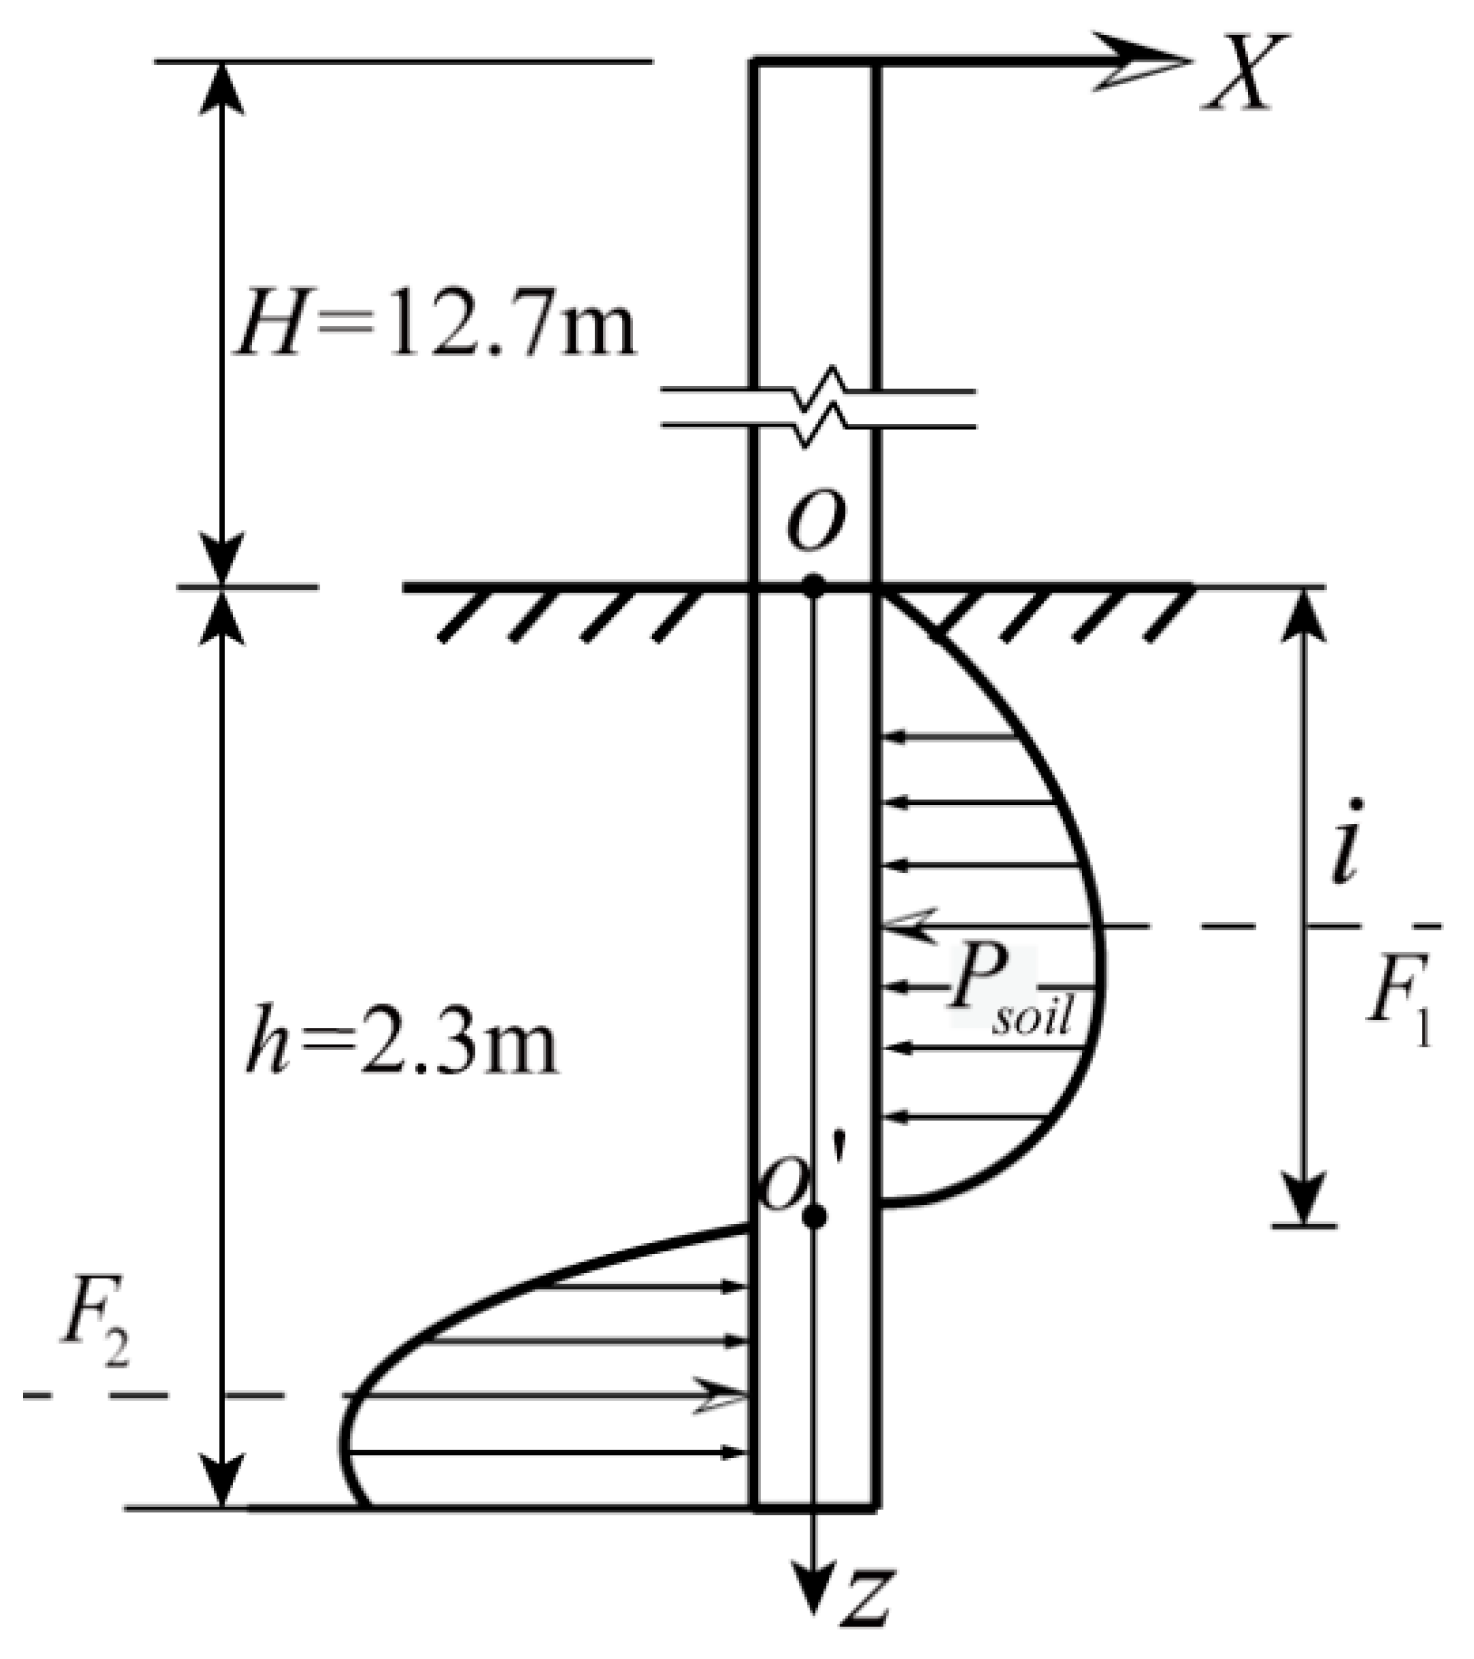
Figure 5 shows the calculation diagram for the ultimate overturning moment. The first step is to determine the position of inflection point O . It is supposed that the distance from the inflection point to the soil surface is i m. According to the static balance principle, the external force under the ultimate state is denoted as X:
X - 0 i b 0 p s o i l d z + i h b 0 p s o i l d z = 0
Then, the sum of moments M o at the point O is
M o = X H + 0 i z b 0 p s o i l d z i h z b 0 p s o i l d z
where X represents external force (kN); H denotes the height of the pole above the ground (m); and p s o i l is the modified earth pressure (kN/m2).
Change the variable i from 0 to 2.3 m with an increment of 0.01 m and calculate the corresponding moment. When the moment M o approaches 0, the corresponding i is the position of the inflection point. And then, the ultimate overturning moment M limit can be calculated based on the self-written MATLAB program.
M limit = i h z b 0 p s o i l d z 0 i z b 0 p s o i l d z
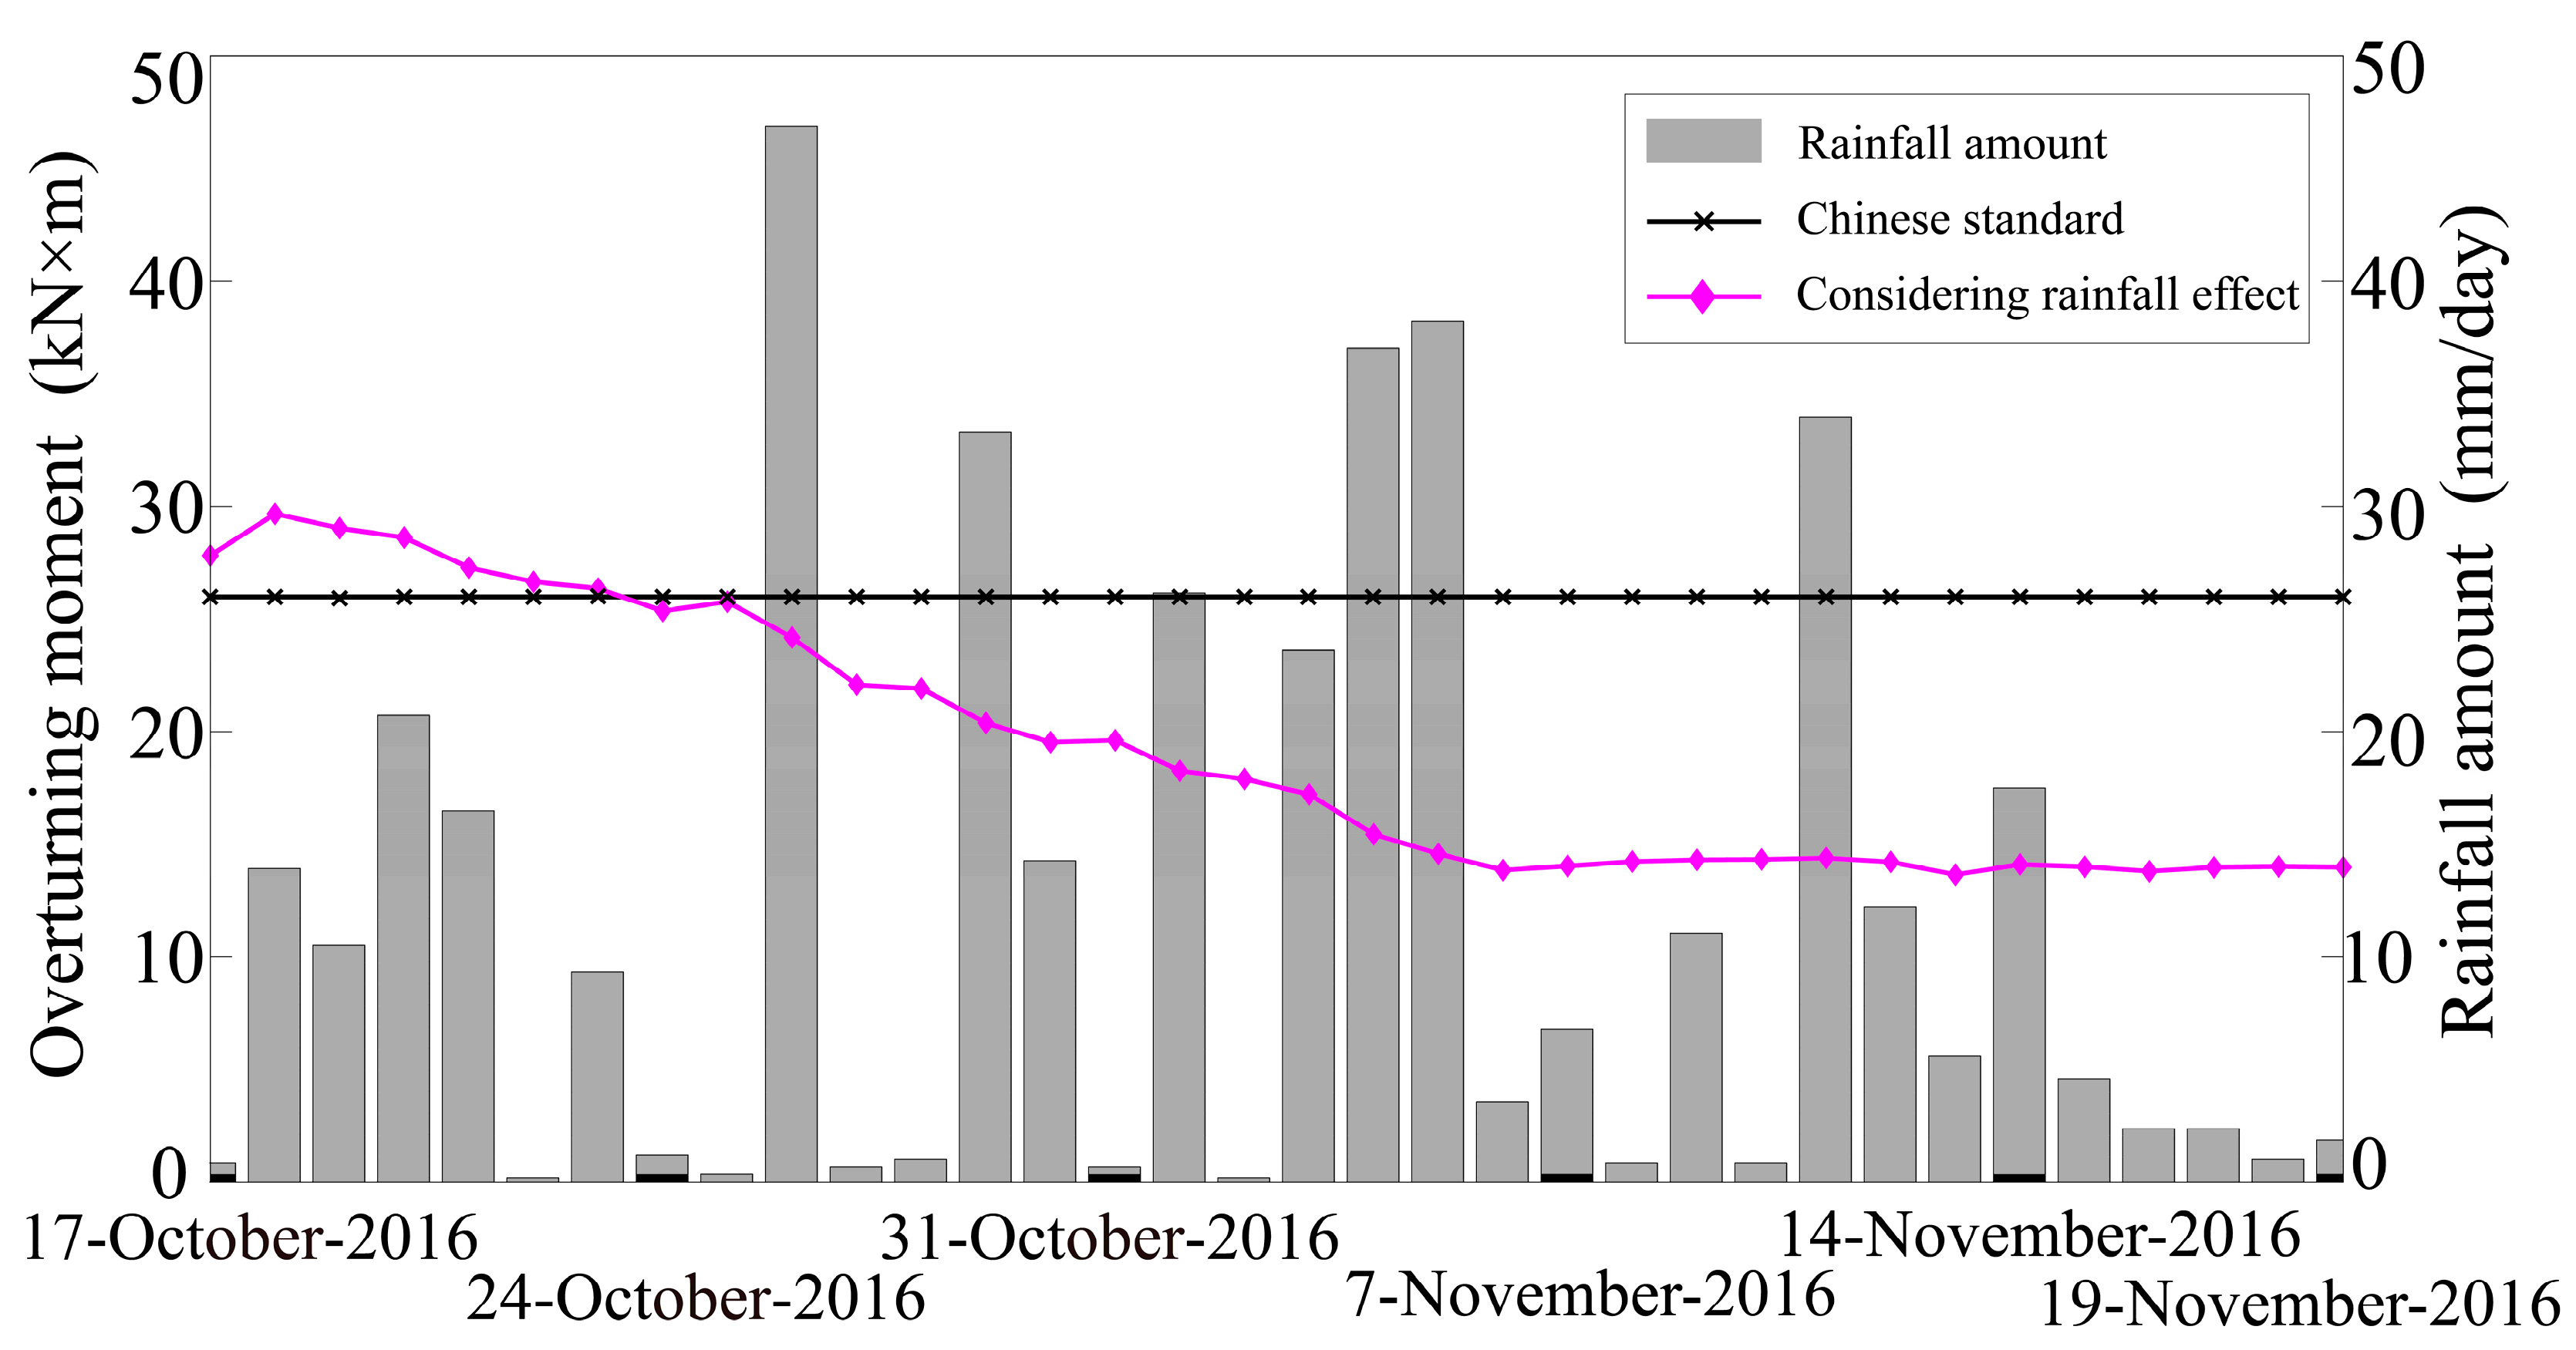
Figure 6 presents a comparison of the ultimate overturning moments obtained by the two methods and the relationship between the rainfall and water content. The “Chinese standard” curve represents ultimate overturning moments calculated according to the code, while the “Considering the rainfall effect” curve shows ultimate overturning moments considering the effect of rainfall. The y-axes on the left and right side denote the ultimate overturning moment and water content of the soil, respectively. The x-axis represents the duration of the rainy season, from the 1st day to the 34th day.
As can be seen from Figure 6, there is a time lag between the amount of rainfall and the water content of the deep soil. Through direct shear tests, Malizia et al. [37] found that highly plastic clay soils have strong intergranular bonding and require a sufficient amount of water to facilitate intergranular movement. Therefore, the ultimate overturning moment did not decrease at the beginning of the rainfall until the water content increased. Meanwhile, the bearing capacity of the soil decreased. The maximum bearing capacity of the pole gradually smoothed out after the water content reached the saturation value on the 18th day.
The results from the first day show that in the case of no rainfall, the ultimate overturning moments obtained by the two methods are very similar. The results of the Chinese standard are more conservative and lower than the modified method. The trend of the overall curve shows that there is a negative correlation between the ultimate overturning moment and rainfall. Therefore, to avoid overestimating the bearing capacity of the pole, it is crucial to consider the influence of rainfall on the foundation. The method proposed in this paper is more applicable to practical works than the Chinese standard method.

4. Performance Estimation of a TP under Combined Wind and Rain Excitations

4.1. Finite Element Model

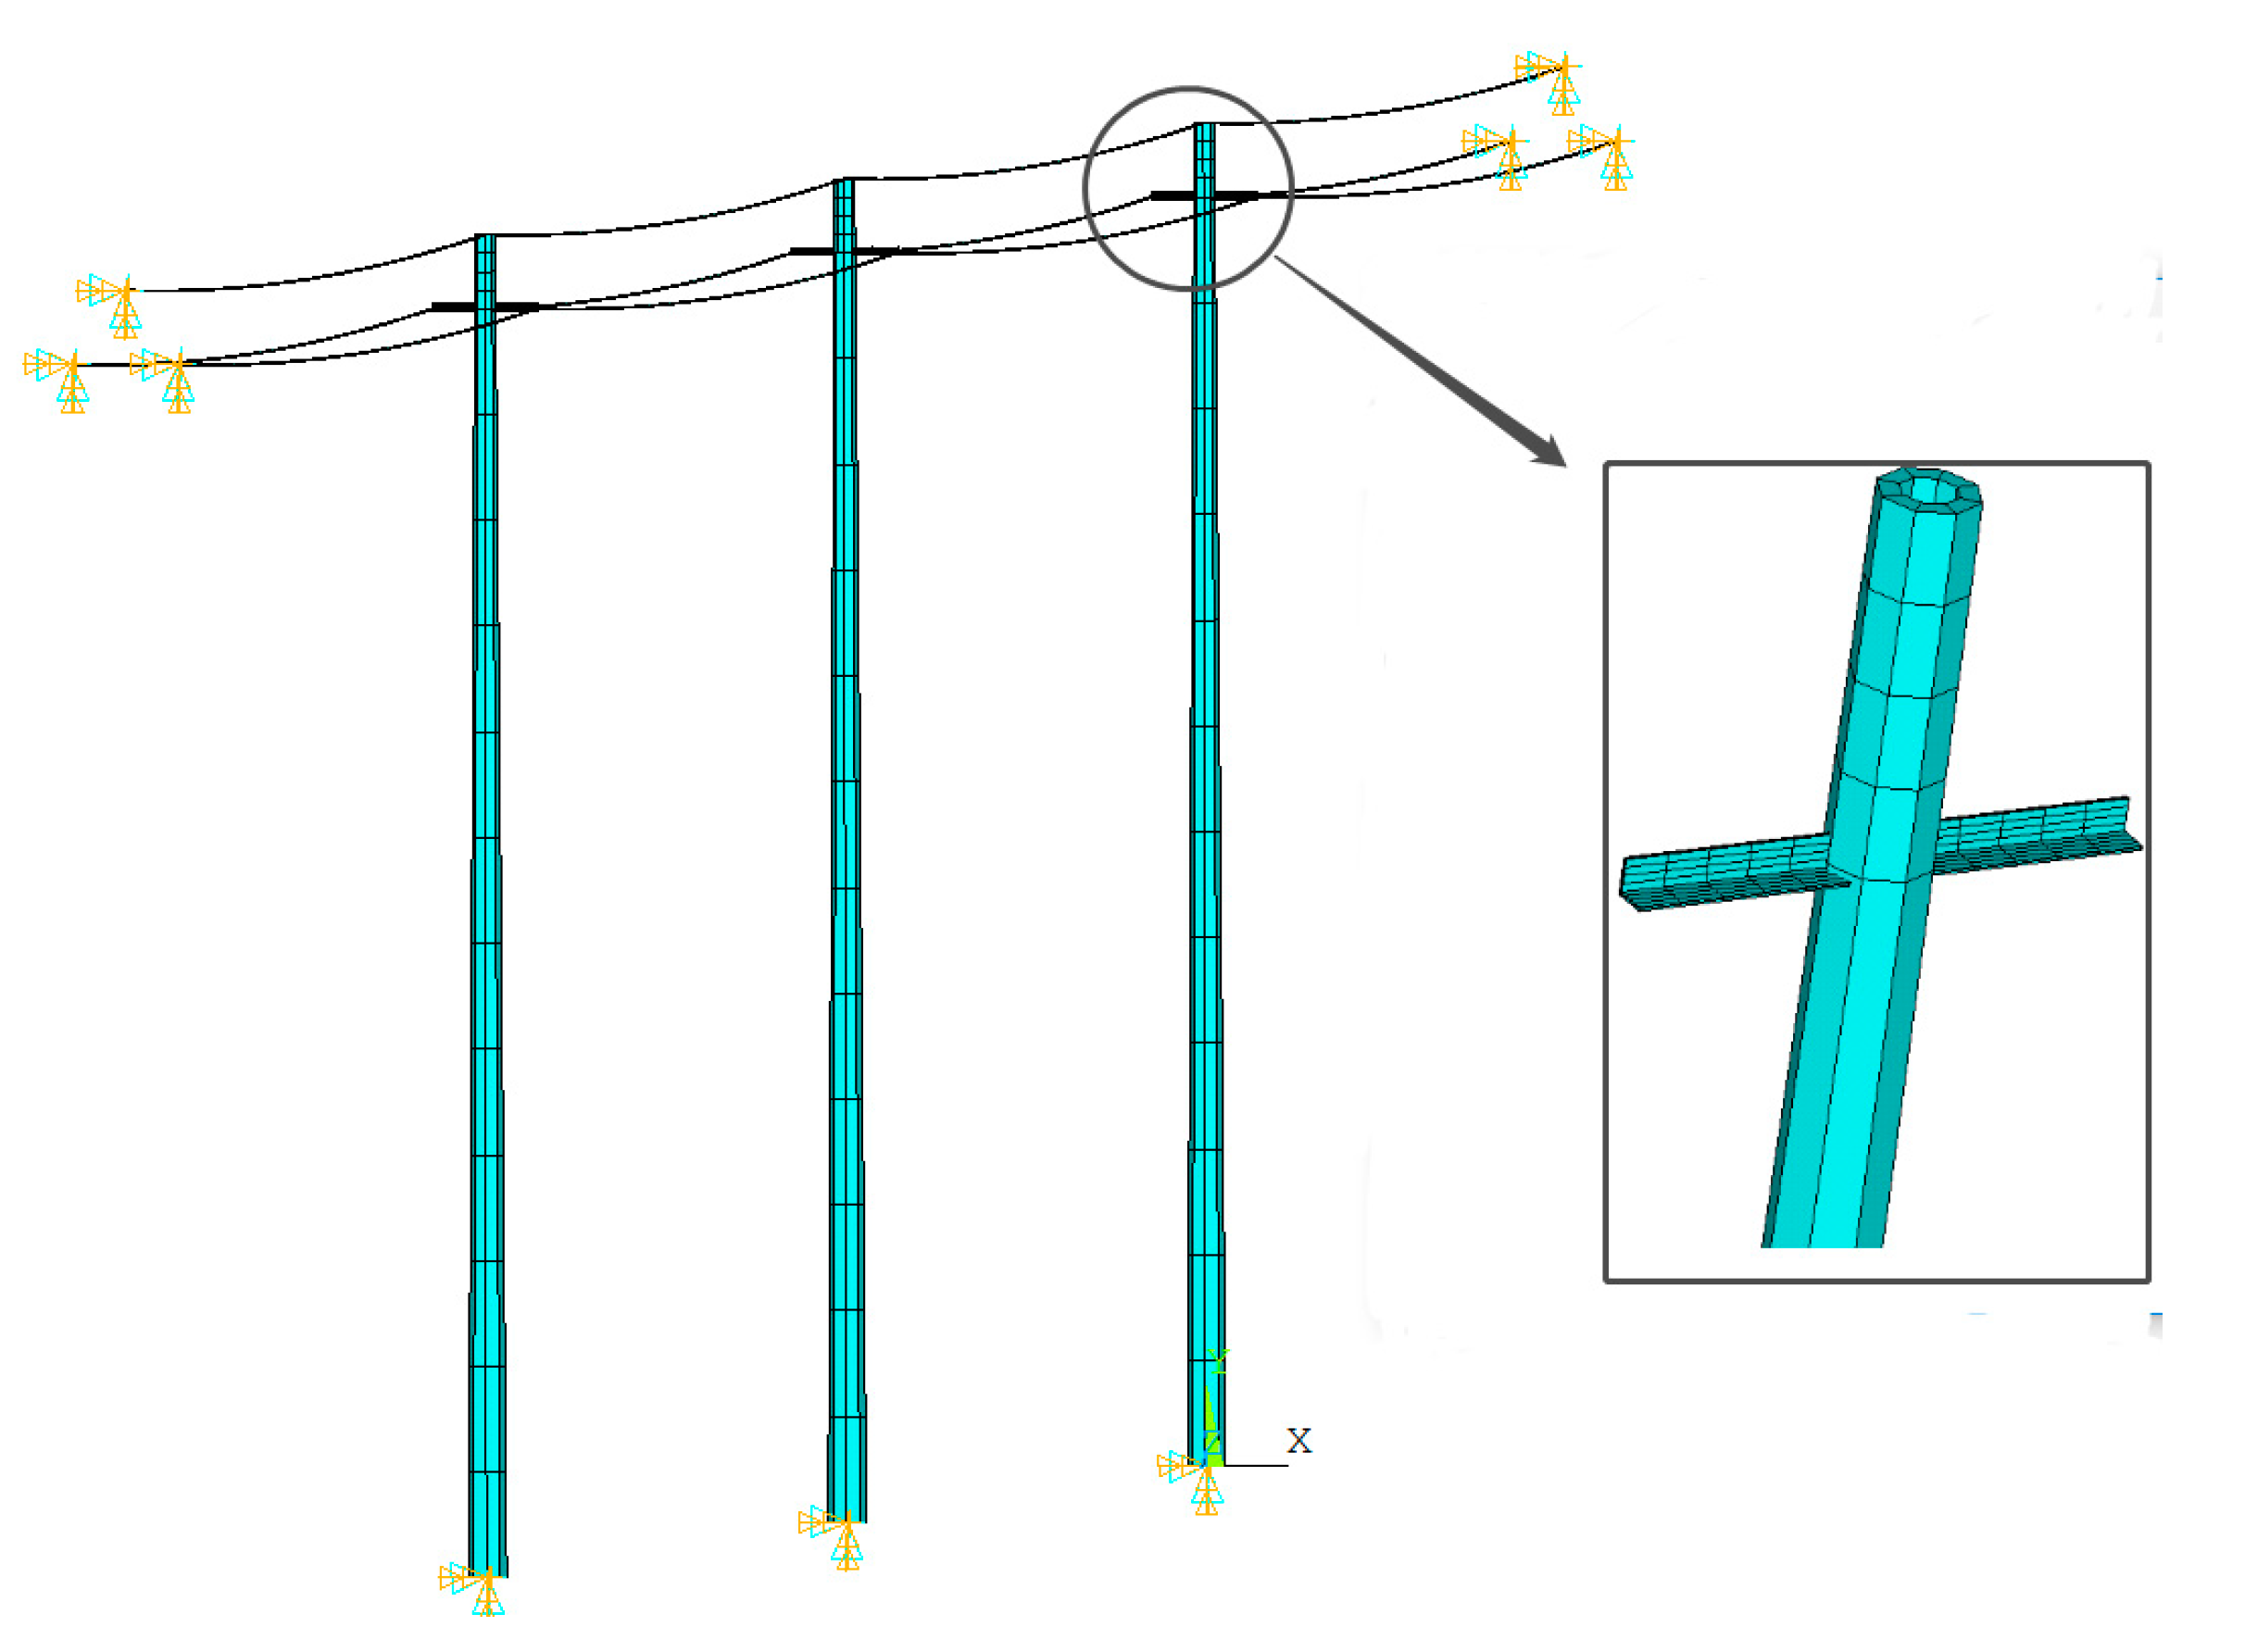
In this section, a numerical simulation is conducted to obtain the bending moment response at the bottom of the TPs under wind loads. The establishment of the finite element model for TPs is a commonly used configuration designed according to the code. The specific parameter values are based on reference [38]. Some existing studies [39,40,41] assumed that the failure of TPs is not affected by adjacent poles and only considered the response of a single pole under wind load. However, the interaction between poles cannot be neglected because of the wire tension [42] in actual engineering. Considering the practicality of the model, three tapered concrete poles of 15 m height and four lines have been adopted in the numerical simulation.
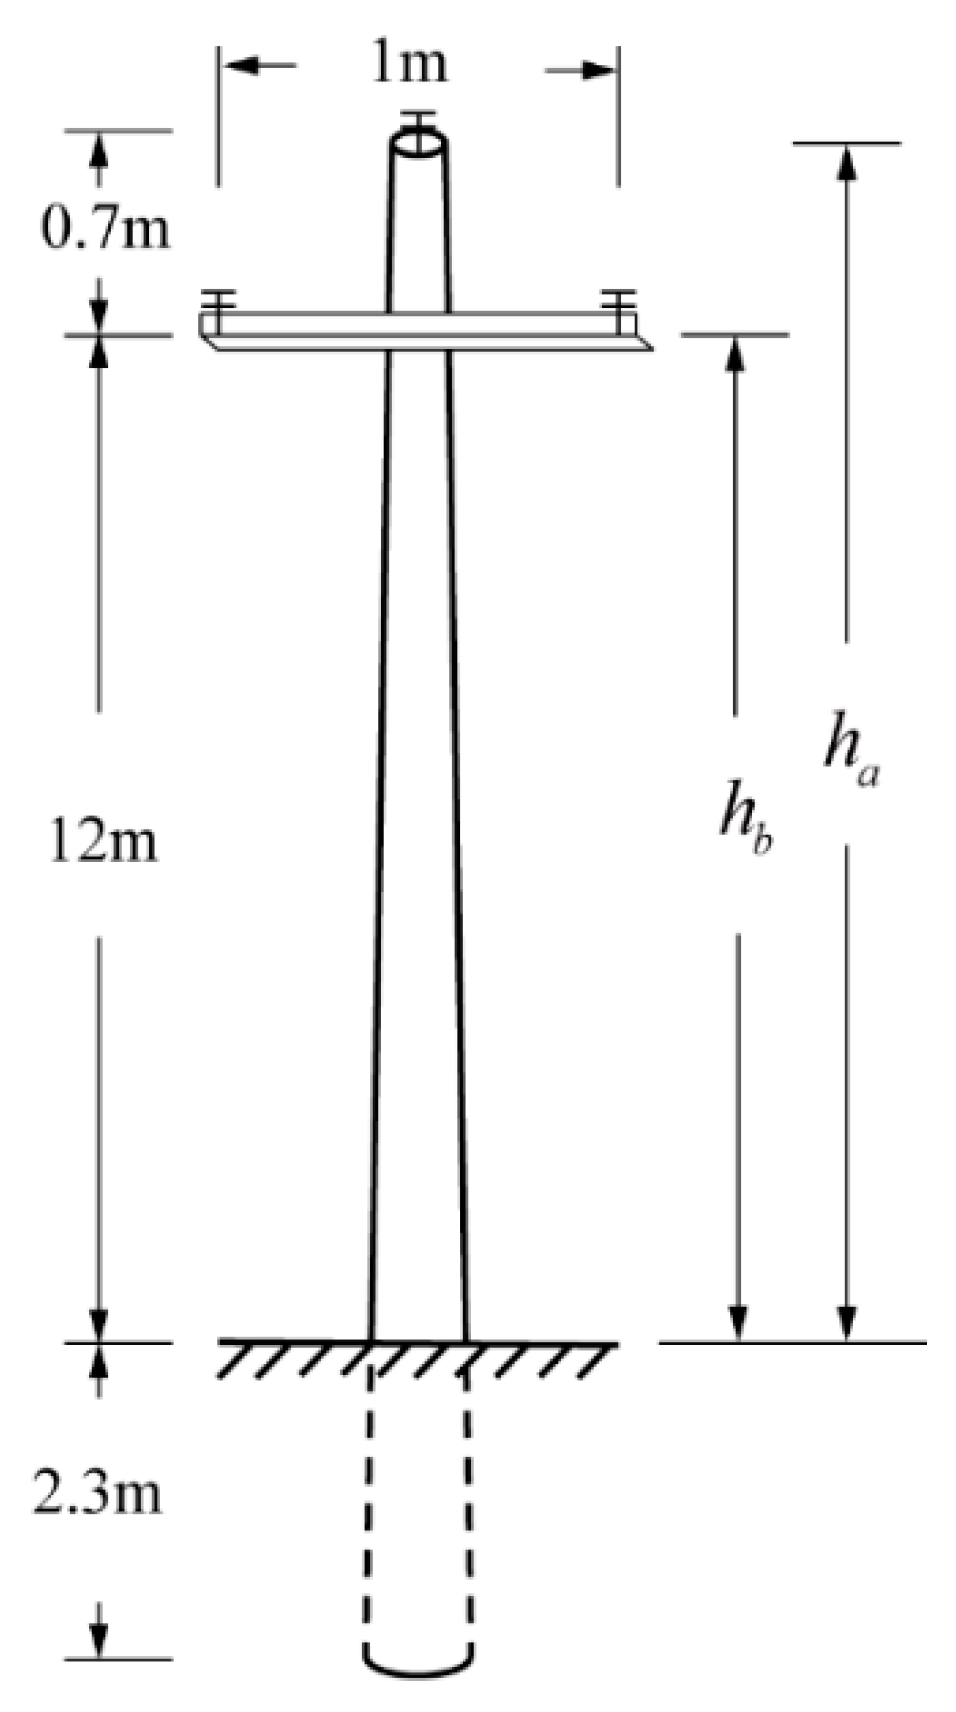
The power pole used in this study is a hollow pole with an outer diameter of 190 mm at the top and 360 mm at the bottom and a wall thickness of 40 mm. The weight of the pole is 1250 kg. There are two cross-arms, which are constructed by steel tube of type Q235, at 14.3 m elevation. The lines are three aluminum-stranded wires adopted by LJ-185, with a length of 50 m. The calculation section area of line is 182.8 mm2, and the breaking force is 28,440 N. The practical graph of the power pole is shown in Figure 7.
A detailed finite element model (FEM) of the system is established based on engineering data in ANSYS, as illustrated in Figure 8. The Beam188 and Link10 elements are used to simulate the poles and lines, respectively. The lines are hinged to the initial height position; meanwhile, the foundations of the poles are assumed to be fixed, and the interaction between the foundation and the pole is neglected. For convenience, the x-, y-, and z-axes of the model are defined as the transverse, longitudinal and vertical directions of the system, respectively. The material and mechanical parameters of TPs are determined according to the code [43] as listed in Table 1.
The modal analysis of the FEM is carried out to obtain the natural frequencies, and the first three order frequencies are 1.0748 Hz, 1.0875 Hz and 1.1005 Hz. The first six mode shapes are shown in Figure 9. It can be seen that the mode shapes of the poles and lines are very different, and there is almost no coupling between the pole and line vibrations.

4.2. Dynamic Structural Analysis

The methods for wind load simulation are mainly the harmony superposition method and the linear filter method [44]. The longitudinal fluctuating wind velocity at points on the electrical distribution system is simulated with a ground roughness of class B. According to the statistical data gathered during the typhoon landing, 20–38 m/s is selected as the average wind speed for generating a fluctuating wind. The fluctuating wind is generated based on the Davenport wind velocity spectrum and the Davenport coherence function. The power spectrum density of the fluctuating wind is as follows [45]:
S V n = 4 K V 10 2 x 2 f 1 + x 2 4 3
x = 1200 f / V 10
where K is the resistance coefficient; V 10 is the basic wind speed; and f is the fluctuation frequency.
To improve the calculation efficiency of the wind field simulation, the FFT technique is introduced to accelerate the calculation [46]. The bending moment M v ( t ) of the middle transmission pole is obtained after the dynamic analysis of the FEM. The gust response factor (GRF) method is introduced to quantify the effect of fluctuating wind [47]:
R total = β C R ¯
where β C represents the gust response factor and R ¯ represents the mean response.
The extreme value response M v is calculated by:
M v = M ¯ v + 2.5 M ¯ v M v ( 1 ) 2 + M ¯ v M v ( 2 ) 2 + + M ¯ v M v ( n ) 2 n
where M ¯ v is the average value of the instantaneous moment response in 10 min and M v ( i ) is the instantaneous moment response.
The corresponding critical wind speed is obtained according to the ultimate response of the bending moment of the electric distribution system. The overturning moment of the TPs is also calculated according to the “Load code for the design of overhead transmission line” [48] through a simple calculation.
Wind load on the transmission lines can be expressed as
W x = α μ s μ z d L w W o
W 0 = V 0 2 / 1600
where α denotes span reduction coefficient; μ s is the shape factor of lines; μ z is the height variation coefficient of wind pressure; d is the calculated outer diameter of the transmission line; L w is the wind span; W o is the basic wind pressure; and V 0 is the basic wind speed.
Wind load on transmission poles can be expressed as
W s = β z μ s μ z A W o
where β z is the wind vibration coefficient of the pole; μ s is the shape factor; and A is the projected area of the frontal pole.
The maximum overturning moment of the transmission poles at point O is calculated as follows:
M o = W x h a + 2 h b + W s h a 3 × 2 d + D d + D
where d is the tip diameter and D is the diameter at the ground of the pole; h a and h b are defined from Figure 7.
Due to the resonant response not being considered in the manual calculation, the numerical simulation results are greater than the manual results, as shown in Figure 10.
In this research, four types of rainfall are assumed according to the rainfall level, which represent no rainfall, light rainfall, moderate rainfall and heavy rainfall, respectively, as shown in Table 2.
The first case represents a reference group with no rainfall. The second case represents a continuous light precipitation. The third case is an increasing precipitation, which is the same as the trend of rainfall during a typhoon landfall. This increased rainfall will lead to an increased initial soil water content, which is more likely to reduce the bearing capacity of the foundation than a short period of heavy rain. In contrast, a large amount of rainfall in a short time can lead to the closure of cracks on the earth’s surface; most of the rainwater will flow away along the earth’s surface and only a small portion will infiltrate into the soil at the end of the rainfall [49]. The fourth case indicates continuous heavy rainfall, which is also one of the most dangerous working cases. Long periods of heavy rainfall can cause the water content of the soil to increase dramatically, leading the TPs to collapse very easily.
Since the effect of rainfall on the bearing capacity of the soil is not considered in the code [27], the critical wind speeds obtained in different working cases are the same. Figure 11 shows the critical wind speeds obtained by the evaluation system.
In the first case, the critical wind speed obtained by the evaluation system is higher than the code’s value, because the code is taken more conservatively to ensure the safety redundancy of the structure. In the second case, the critical wind speed initially increases and then decreases. Malizia et al. [37] found that the shear strength of soil follows a similar pattern of increasing and then decreasing with increasing water content. Thus, the soil shear strength reaches its maximum at the optimum water content, but it decreases as the water content continues to rise. The optimum water content appears on the third day in this case. Meanwhile, the critical wind speed is minimal.
In the third case, the rainfall gradually increases, the optimal water content appears earlier, and the maximum critical wind speed appears on the second day, but the whole critical wind speed is lower than in the second case. In the fourth case, the rainfall is so heavy that the optimum moisture content does not appear. Increasing water content can cause a sustained reduction in critical wind speed, which is the most dangerous of all cases.

4.3. Collapse Analysis of TPs during the Typhoon Landing

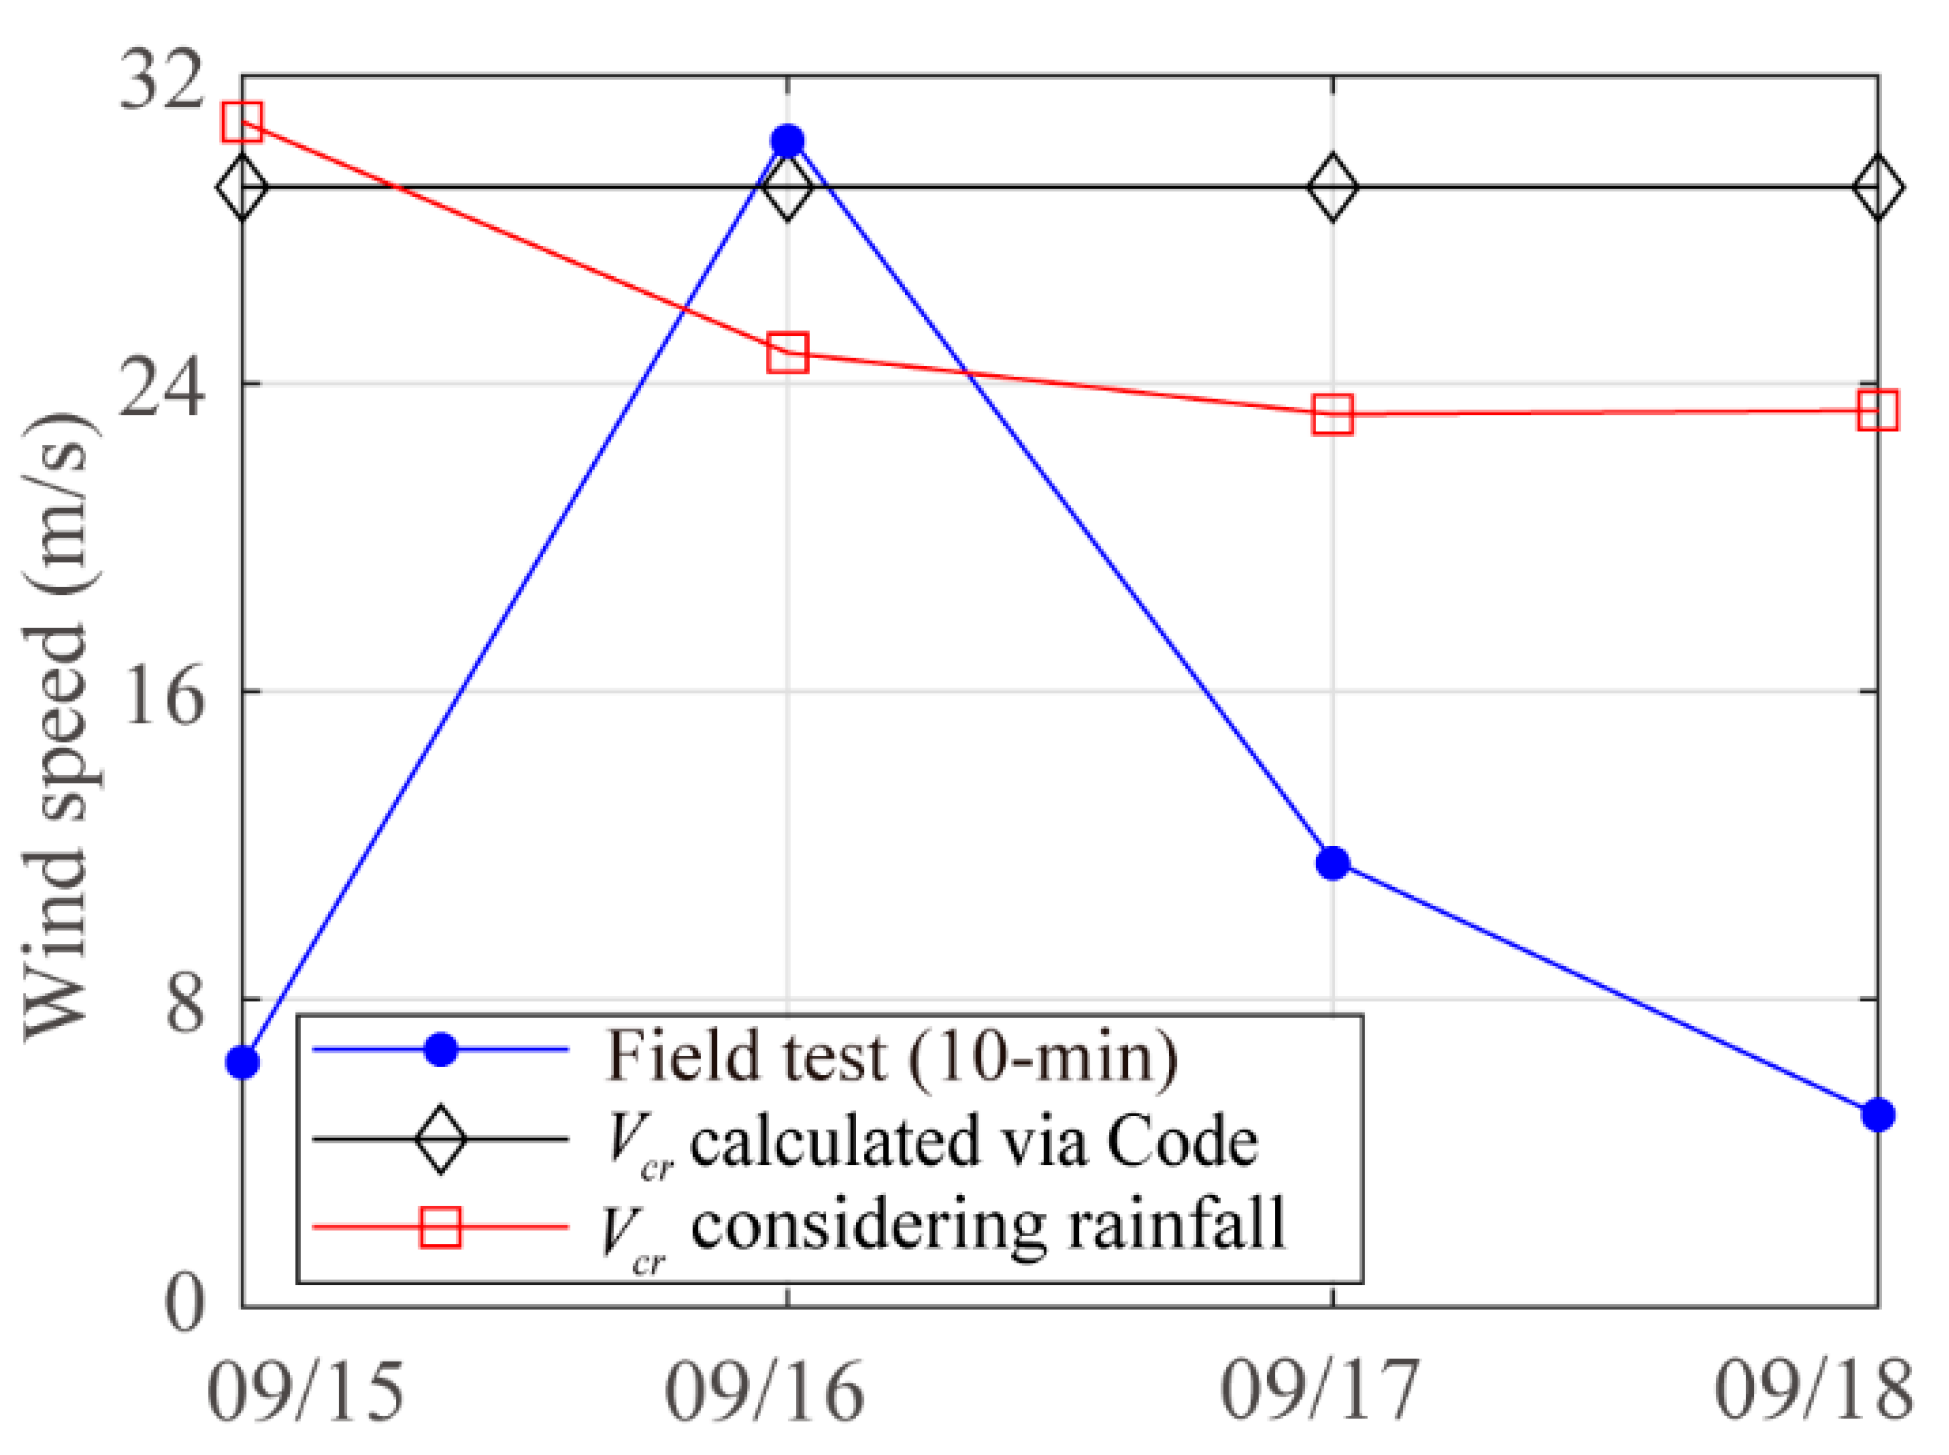
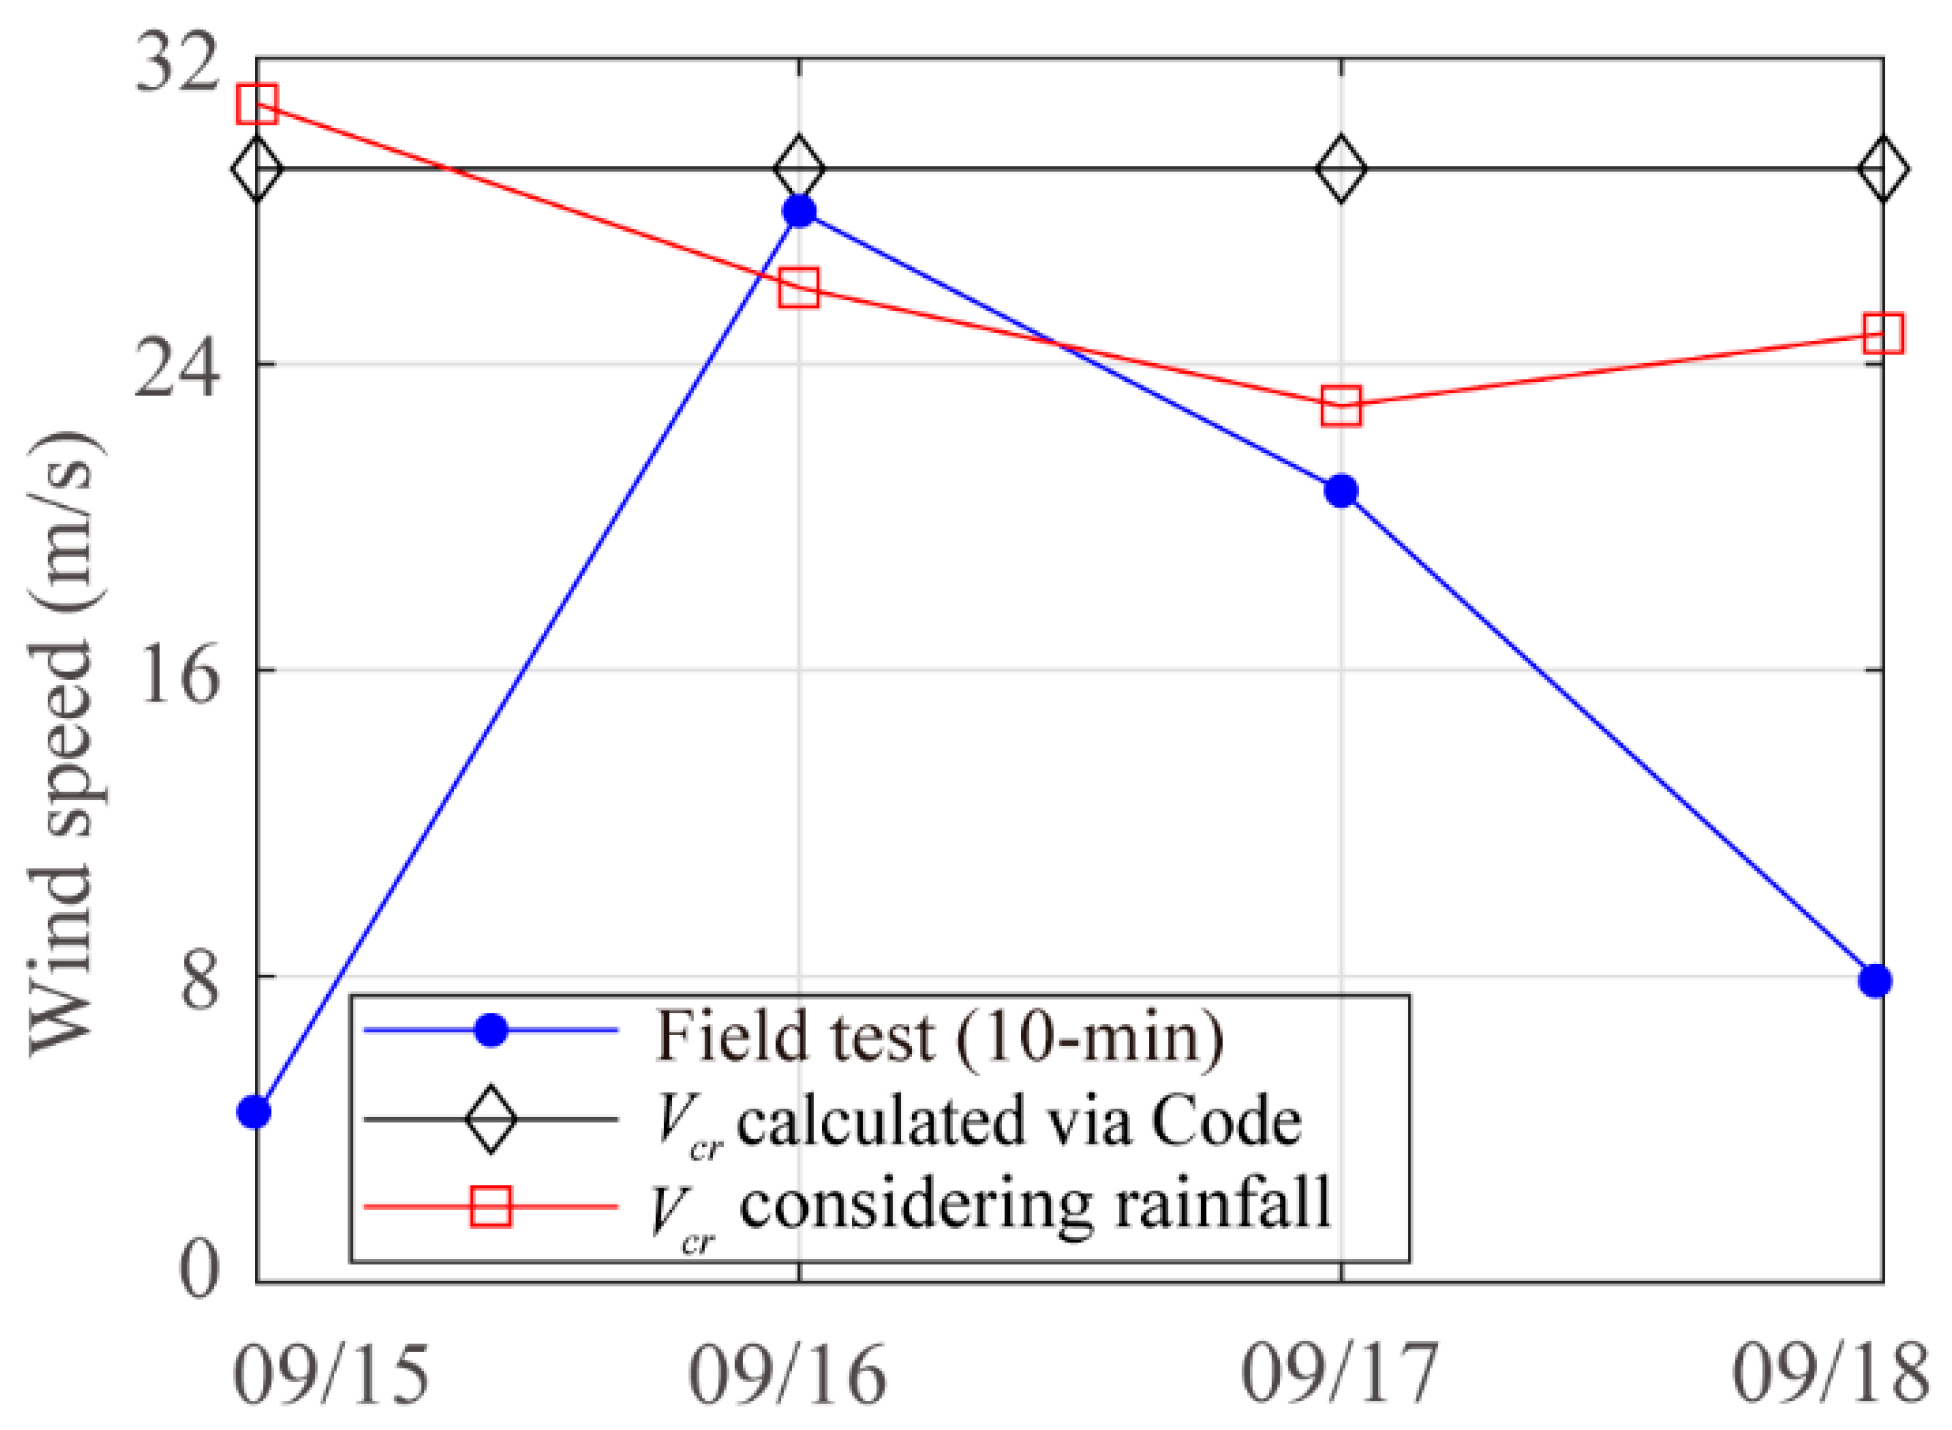
Super Typhoon Mangkhut struck Guangdong Province on 16 September 2018. Based on the wind speed and rainfall data from three meteorological monitoring stations, the collapse of TPs is evaluated based on the evaluation framework presented in this paper. The three stations are located in Jieyang, Shanwei and Jiangmen, respectively. By comparing the evaluation results, the superiority of the modified evaluation method in TPs is confirmed.
(1)
Collapse evaluation for G2990 station.
Based on the locally measured meteorological data from the G2990 station in Jieyang City, Guangdong Province, China, the precipitation during the typhoon landing was 0 mm/d, 39.6 mm/d, 12.6 mm/d and 0 mm/d. The measured 10 min wind speed and the critical wind speed V c r obtained by the two calculation methods is shown in Figure 12.
In Figure 12, when rainfall is not considered, the ultimate overturning moment only depends on the soil type and is constant. Thus, the corresponding calculated V c r is also constant and it is larger than the measured wind speed. Likewise, it can be found that the V c r predicted by the proposed method considering rainfall is larger than the measured wind speed, indicating that the structure is safe for the G2990 station.
(2)
Collapse evaluation for G1844 station.
Based on the locally measured meteorological data from the G1844 station in Shanwei City, Guangdong Province, China, the precipitation the during typhoon landing was 0 mm/d, 45 mm/d, 2.3 mm/d and 0 mm/d. The measured 10 min wind speed and the critical wind speed V c r obtained is shown in Figure 13. It can be seen from Figure 13 that V c r calculated by the current Code is less than the measured maximum wind speed, indicating that the structure is at risk of collapse for the G1844 station.
(3)
Collapse evaluation for G2133 station.
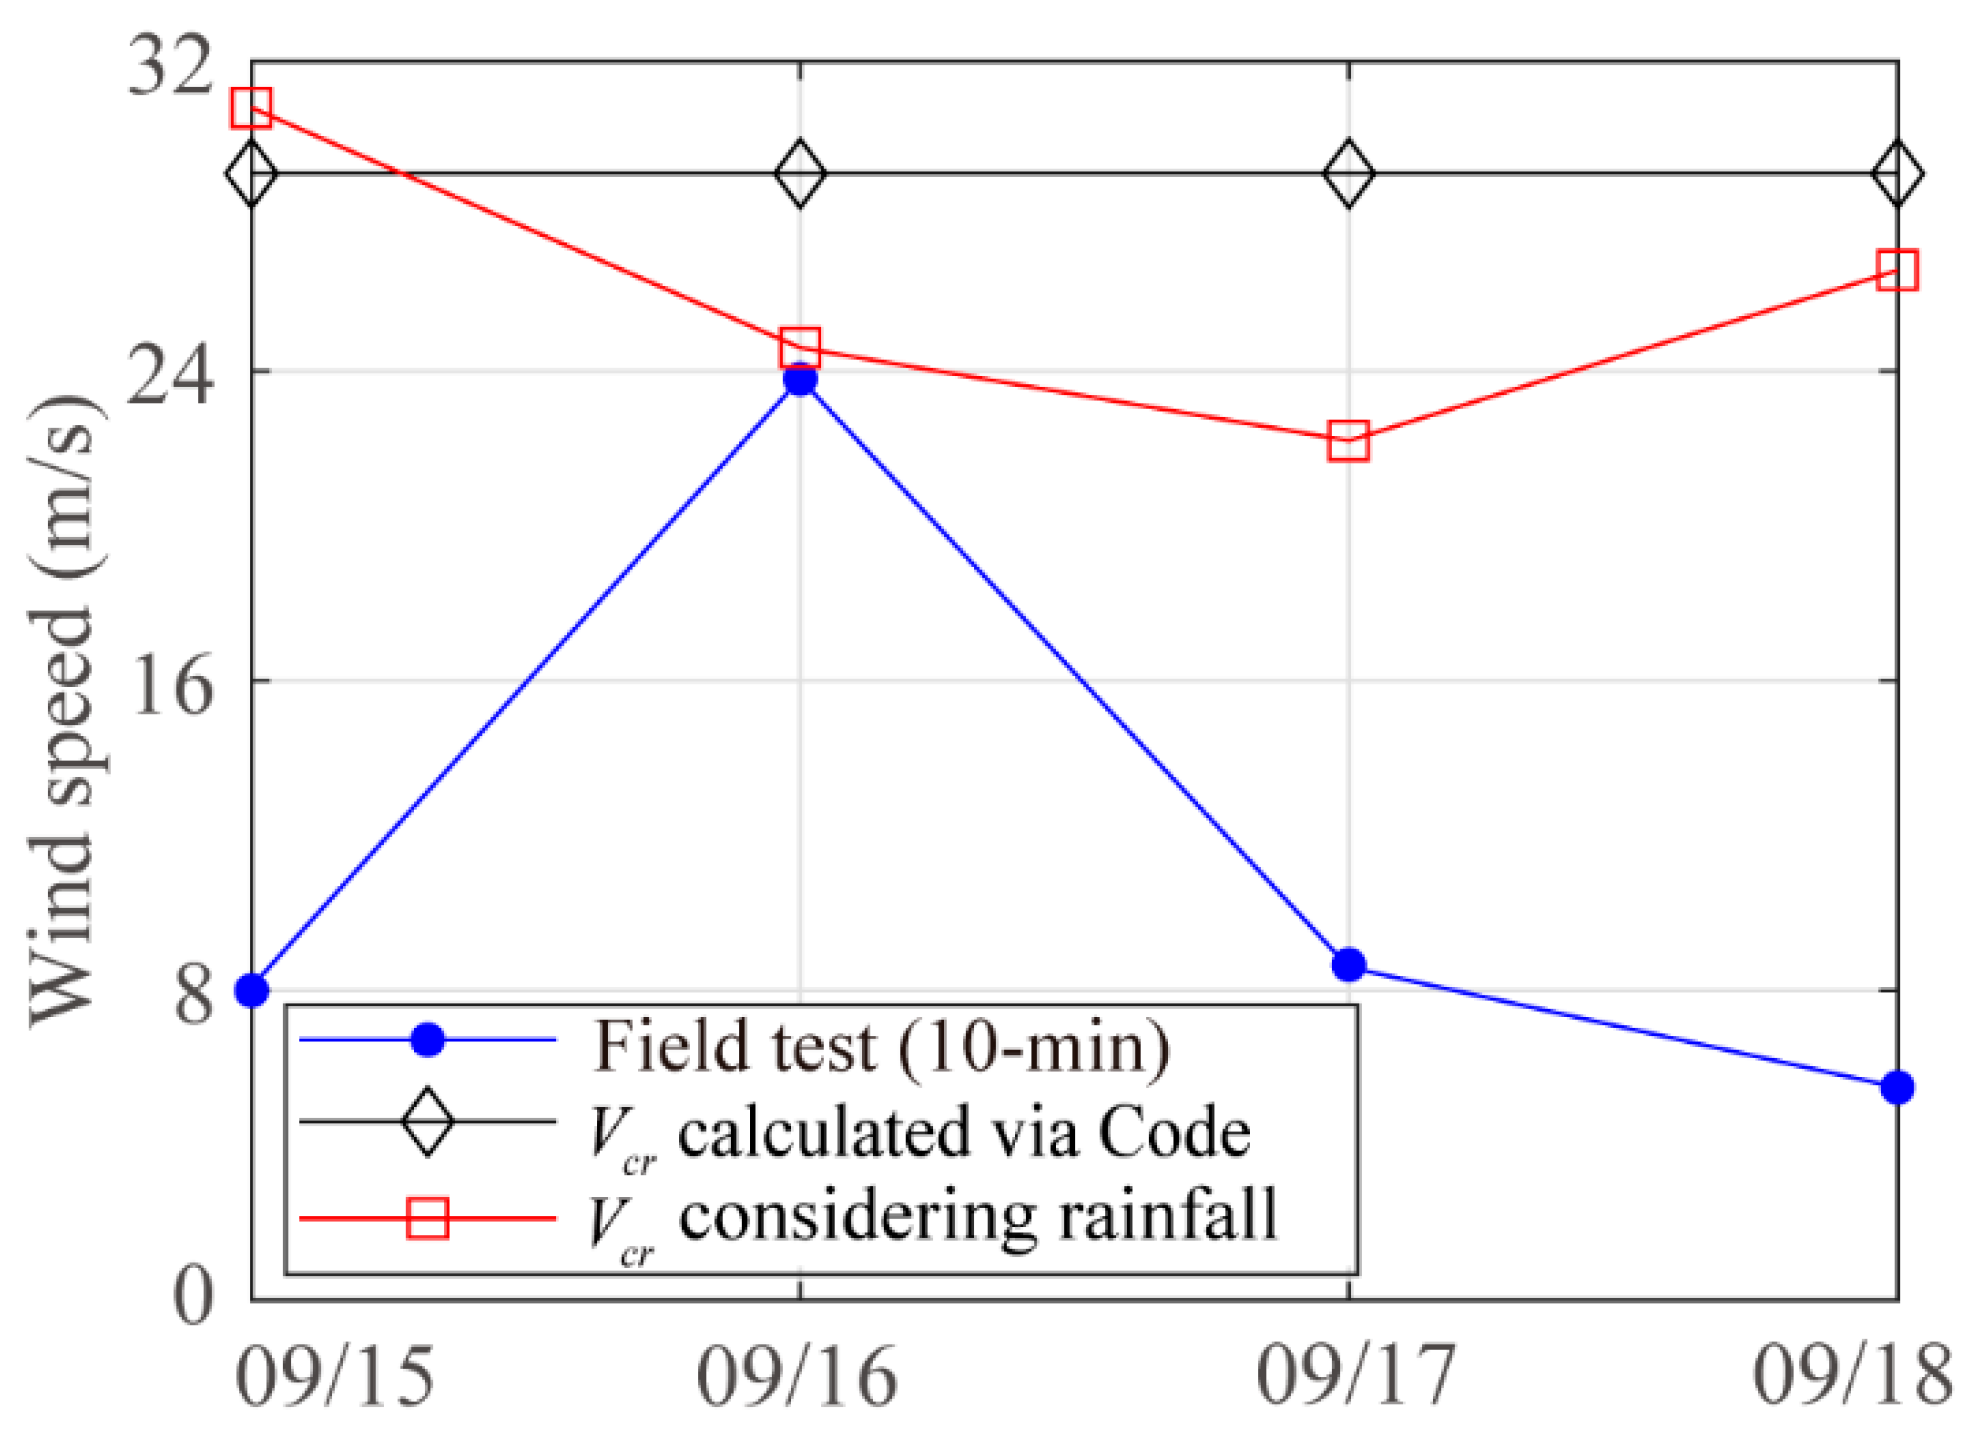
Based on the locally measured meteorological data of the G2133 station in Jiangmen City, Guangdong Province, China, the precipitation during the typhoon landing is 0 mm/d, 44.7 mm/d, 10.7 mm/d and 1.1 mm/d. The maximum measured 10 min average wind speed on September 16 is 28 m/s. The V c r calculated according to the code is 29.1 m/s, which is greater than the measured maximum wind speed. According to the code, it is judged that the structure has no risk of collapse at this time. However, the V c r considering rainfall is 26 m/s, which is lower than the measured maximum wind speed. The structure is judged to be in failure. As can be seen from the results, the code method overestimates the safety of TPs and the rainfall has a significant effect on the bearing capacity of TPs. The evaluation framework can be used to guide the emergency repair work and make the corresponding plans in advance. Critical wind speed at monitoring station G2133 is shown in Figure 14.

5. Summary and Conclusions

By training the neural network with measured data, a deep logical relationship between rainfall and soil water content is obtained in this paper, which can predict the change in soil water content during rainfall events in a given region. Based on the mechanical properties of the soil at various water contents, the effect of rainfall on earth pressure is quantified. The earth pressure calculation in the current code is supplemented, and the formula of earth pressure considering the rainfall is obtained and used to calculate the ultimate overturning moment of TPs under different rainfall. Finally, the critical wind speed of TPs under the combined effect of wind and rain is calculated through the case studies. The main conclusions drawn from the proposed framework and numerical simulation can be summarized as follows:
(1)
The soil water content is influenced by both the amount and duration of rainfall, which are negatively correlated with the bearing capacity of TPs.
(2)
The rainfall effect has a significant impact on the bearing capacity of TPs, and the critical wind speed of TPs will be overestimated if the effect of rainfall is ignored.
(3)
For the same typhoon event, different regions give different estimation results, which is mainly caused by the diversity of rainfall events in different locations.

Author Contributions

Conceptualization, X.F., X.X. and W.W.; methodology, X.F., X.X. and D.Z.; software, X.X. and X.F.; validation, X.F., X.X., W.W., D.Z. and H.L.; formal analysis, X.F., X.X. and H.L.; investigation, X.F.; resources, X.F.; data curation, X.F.; writing—original draft preparation, X.X., H.L. and X.F.; writing—review and editing, W.W.,X.X., H.L. and X.F.; visualization, X.X.; supervision, X.F.; project administration, X.F.; funding acquisition, X.F. All authors have read and agreed to the published version of the manuscript.

Funding

This research was supported by the Scientific Research Fund of the Institute of Engineering Mechanics, the China Earthquake Administration (Grant No. 2021D17) and the National Natural Science Foundation of China (Grant No. 52078104).

Institutional Review Board Statement

Not applicable.

Informed Consent Statement

Informed consent was obtained from all subjects involved in the study.

Data Availability Statement

The data are available from the first author on request.

Conflicts of Interest

The authors declare no conflict of interest.

References

  1. Fu, X.; Li, H.N.; Li, G.; Dong, Z.Q.; Zhao, M. Failure analysis of a transmission line considering the joint probability distribution of wind speed and rain intensity. Eng. Struct. 2021, 233, 11913. [Google Scholar] [CrossRef]
  2. Choi, M.-G.; Yun, S.; Choi, J.-H.; Ahn, S.-J. A study on the installation of automatic switches considering the characteristics of distribution feeder and importance of customer. Trans. Korean Inst. Electr. Eng. 2019, 68, 1176–1183. [Google Scholar] [CrossRef]
  3. Fu, X.; Li, H.N.; Wang, J. Failure analysis of a transmission tower subjected to combined wind and rainfall excitations. Struct. Des. Tall Spec. Build. 2019, 28, e1615. [Google Scholar] [CrossRef]
  4. Zhang, M.; Liu, Y.; Liu, H.; Zhao, G. Dynamic response of an overhead transmission tower-line system to high-speed train-induced wind. Wind Struct. 2022, 34, 335–353. [Google Scholar] [CrossRef]
  5. Lou, W.; Bai, H.; Huang, M.; Duan, Z.; Bian, R. Wind field generation for performance-based structural design of transmission lines in a mountainous area. Wind Struct. 2020, 31, 165–183. [Google Scholar]
  6. Yang, S.C.; Liu, T.J.; Hong, H.P. Reliability of tower and tower-Line systems under spatiotemporally varying wind or earthquake loads. J. Struct. Eng. 2017, 143, 04017137. [Google Scholar] [CrossRef]
  7. He, B.; Zhao, M.X.; Feng, W.T.; Xiu, Y.P.; Wang, Y.; Feng, L.J. A method for analyzing stability of tower-line system under strong winds. Adv. Eng. Softw. 2019, 127, 1–7. [Google Scholar] [CrossRef]
  8. Sharma, P.; Chen, Z.Q. Probabilistic resilience measurement for rural electric distribution system affected by hurricane events. ASCE-ASME J. Risk Uncertain. Eng. Syst. Part A Civ. Eng. 2020, 6, 04020021. [Google Scholar] [CrossRef]
  9. Bjarnadottir, S.; Li, Y.; Stewart, M.G. Hurricane risk assessment of power distribution poles considering impacts of a changing climate. J. Infrastruct. Syst. 2013, 19, 12–24. [Google Scholar] [CrossRef]
  10. Han, S.R.; Rosowsky, D.; Guikema, S. Integrating models and data to estimate the structural reliability of utility poles during hurricanes. Risk Anal. 2014, 34, 1079–1094. [Google Scholar] [CrossRef]
  11. Dai, K.S.; Chen, S.E.; Luo, M.Y.; Loflin, G., Jr. A framework for holistic designs of power line systems based on lessons learned from super typhoon Haiyan. Sustain. Cities Soc. 2017, 35, 350–364. [Google Scholar] [CrossRef]
  12. Hou, H.; Zhang, Z.W.; Wei, R.Z.; Huang, Y.; Liang, Y.C.; Li, X.Q. Review of failure risk and outage prediction in power system under wind hazards. Electr. Power Syst. Res. 2022, 210, 108098. [Google Scholar] [CrossRef]
  13. Nguyen, H.T.; Muhs, J.W.; Parvania, M. Assessing impacts of energy storage on resilience of distribution systems against hurricanes. J. Mod. Power Syst. Clean Energy 2019, 7, 731–740. [Google Scholar] [CrossRef] [Green Version]
  14. Lee, S.L.; Ham, Y. Probabilistic framework for assessing the vulnerability of power distribution infrastructures under extreme wind conditions. Sustain. Cities Soc. 2021, 65, 102587. [Google Scholar] [CrossRef]
  15. Yuan, H.; Zhang, W.; Zhu, J.; Bagtzoglou, A.C. Resilience assessment of overhead power distribution systems under strong winds for hardening prioritization. ASCE-ASME J. Risk Uncertain. Eng. Syst. Part A Civ. Eng. 2018, 4, 04018037. [Google Scholar] [CrossRef]
  16. Vivek, B.; Sharma, S.; Raychowdhury, P.; Ray-Chaudhri, S. A study on failure mechanism of self-supported electric poles through full-scale field testing. Eng. Fail. Anal. 2017, 77, 102–117. [Google Scholar] [CrossRef]
  17. Fu, X.; Xu, X.; Li, H.N.; Li, G. Bearing capacity of transmission poles under combined wind and rain excitations based on the deep learning method. In Proceedings of the 2022 World Congress on Advances in Structures Engineering and Mechanics, Seoul, Republic of Korea, 16–19 August 2022. [Google Scholar]
  18. Deng, Y.L.; Ge, S.X.; Lei, F. Effects of pounding and abutment behavior on seismic response of multi-span bridge considering abutment-soil-foundation-structure interactions. Buildings 2023, 13, 260. [Google Scholar] [CrossRef]
  19. Wang, Z.W.; Hong, B.N.; Liu, X.; Zhou, Q. Water-sensitive properties of shear strength of red clay. J. Sichuan Univ. Eng. Sci. Ed. 2011, 43, 17–22. [Google Scholar]
  20. Fu, X.H.; Wei, C.F.; Yan, R.T. Research on strength characteristics of unsaturated red clay. Rock Soil Mech. 2013, 34, 204–209. [Google Scholar]
  21. Cao, W.; Liu, T.; Xu, Z. Calculation of passive earth pressure using the simplified principal stress trajectory method on rigid retaining walls. Comput. Geotech. 2019, 109, 108–116. [Google Scholar] [CrossRef]
  22. Rankine, W.M. On the stability of loose earth. Proc. R. Soc. Lond. 1857, 147, 9–27. [Google Scholar]
  23. Fang, Y.S.; Chen, T.J.; Wu, B.F. Passive earth pressures with various wall movements. J. Geotech. Eng.-ASCE 1994, 120, 1307–1323. [Google Scholar] [CrossRef]
  24. Fang, Y.S.; Ishibashi, I. Static earth pressures with various wall movements. J. Geotech. Eng. 1986, 112, 317–333. [Google Scholar] [CrossRef]
  25. Yue, G.W.; Feng, F.; Jia, H.N. Numerical simulation of soil arching effect in deep foundation pit with different influencing factors. In Proceedings of the 2011 International Conference on Electrical and Control Engineering, Yichang, China, 16–18 September 2011. [Google Scholar]
  26. Xie, Y.; Zhang, B.; Liu, B.; Zeng, Z.; Zhang, Y.; Zheng, Y. Shrinkage cracking and strength deterioration of red clay under cyclic drying and wetting. Alex. Eng. J. 2022, 61, 2574–2588. [Google Scholar] [CrossRef]
  27. DL/T 5219-2014; Technical Regulation for Designing Foundation of Overhead Transmission Line. China Planning Press: Beijing, China, 2014.
  28. Long, W.X.; Chen, K.S.; Xiao, T.; Peng, X.P. Research of general triaxial test for unsaturated red clay. Rock Soil Mech. 2009, 30, 28–33. [Google Scholar]
  29. Shen, C.N.; Fang, X.W.; Wang, H.W.; Sun, S.G.; Guo, J.F. Research on effects of suction, water content and dry density on shear strength of remolded unsaturated soils. Rock Soil Mech. 2009, 30, 1347–1351. [Google Scholar]
  30. Gu, M.X.; Cai, X.C.; Fu, Q.; Li, H.B.; Wang, X.; Mao, B.B. Numerical analysis of passive piles under surcharge load in extensively deep soft soil. Buildings 2022, 12, 1988. [Google Scholar] [CrossRef]
  31. Thumtuan, P.; Chub Uppakarn, T.; Chalermyanont, T. Real time monitoring of soil moisture content for landslide early warning: Wn experimental study. MATEC Web Conf. 2018, 192, 02032. [Google Scholar] [CrossRef] [Green Version]
  32. Thumtuan, P. Southern Natural Disaster Research Center 2018. Available online: https://www.nadrec.psu.ac.th/ (accessed on 23 June 2023).
  33. Wang, J.S.; Xie, Y.Z.; Guo, T.; Du, Z.Y. Predicting the influence of soil-structure interaction on seismic responses of reinforced concrete frame buildings using convolutional neural network. Buildings 2023, 13, 564. [Google Scholar] [CrossRef]
  34. Ng, C.W.W.; Zhan, L.T.; Bao, C.G.; Fredlund, D.G.; Gong, B.W. Performance of an unsaturated expansive soil slope subjected to artificial rainfall infiltration. Geotechnique 2003, 53, 143–157. [Google Scholar] [CrossRef]
  35. Zhang, G.; Zhou, G.S.; Yang, F.L. Dynamics of sensible and latent heat fluxes over a temperate desert steppe ecosystem in Inner Mongolia. J. Appl. Ecol. 2010, 21, 597–603. [Google Scholar]
  36. Huang, Q.X.; Zhang, W.Z. Research on downward crack closing of clay aquiclude in shallow coal seam safety mining. J. Coal Sci. Eng. 2011, 17, 349–354. [Google Scholar] [CrossRef]
  37. Malizia, J.P.; Shakoor, A. Effect of water content and density on strength and deformation behavior of clay soils. Eng. Geol. 2018, 244, 125–131. [Google Scholar] [CrossRef] [Green Version]
  38. Ning, Q. Practical Technology for Overhead Distribution Lines; China Water Resources and Hydropower Publishing House: Beijing, China, 2009. [Google Scholar]
  39. Ryan, P.C.; Stewart, M.G.; Spencer, N.; Li, Y. Probabilistic analysis of climate change impacts on timber power pole networks. Int. J. Electr. Power Energy Syst. 2016, 78, 513–523. [Google Scholar] [CrossRef] [Green Version]
  40. Rao, N.P.; Gopal, R.B.; Rokade, R.P.; Mohan, S.J. Analytical and experimental studies on 400 and 132 kV steel transmission poles. Eng. Fail. Anal. 2011, 18, 1018–1029. [Google Scholar]
  41. Raychowdhury, P.; Hutchinson, T.C. Performance evaluation of a nonlinear Winkler-based shallow foundation model using centrifuge test results. Earthq. Eng. Struct. Dyn. 2009, 38, 679–698. [Google Scholar] [CrossRef]
  42. Ma, X.L.; Zhang, W.; Bagtzoglou, A.; Zhu, J. Local system modeling method for resilience assessment of overhead power distribution system under strong winds. ASCE-ASME J. Risk Uncertain. Eng. Syst. Part A Civ. Eng. 2021, 7, 04020053. [Google Scholar] [CrossRef]
  43. GB 4623-2014; Circular Concrete Pole. China Planning Press: Beijing, China, 2014.
  44. Ballaben, J.S.; Sampaio, R.; Rosales, M.B. Uncertainty quantification in the dynamics of a guyed mast subjected to wind load. Eng. Struct. 2017, 132, 456–470. [Google Scholar] [CrossRef]
  45. Davenport, A.G.; Stagg, J.M. The spectrum of horizontal gustiness near the ground in high winds. Q. J. R. Meteorol. Soc. 1962, 88, 197–198. [Google Scholar] [CrossRef]
  46. Fu, X.; Zhang, X.H.; Li, H.N.; Li, G.; Liu, H.J. A high-efficiency simulation method of wind field and its application on transmission line. Wind Struct. 2021, 33, 277–288. [Google Scholar] [CrossRef]
  47. Davenport, A.G.; Sparling, B.F. Dynamic gust response factors for guyed towers. J. Wind Eng. Ind. Aerodyn. 1992, 43, 2237–2248. [Google Scholar] [CrossRef]
  48. DL/T 5551-2018; Load Code for the Design of Overhead Transmission Line. China Planning Press: Beijing, China, 2018.
  49. Zhang, S.; Xu, Q.; Zhang, Q. Failure characteristics of gently inclined shallow landslides in Nanjiang, southwest of China. Eng. Geol. 2017, 217, 1–11. [Google Scholar] [CrossRef]
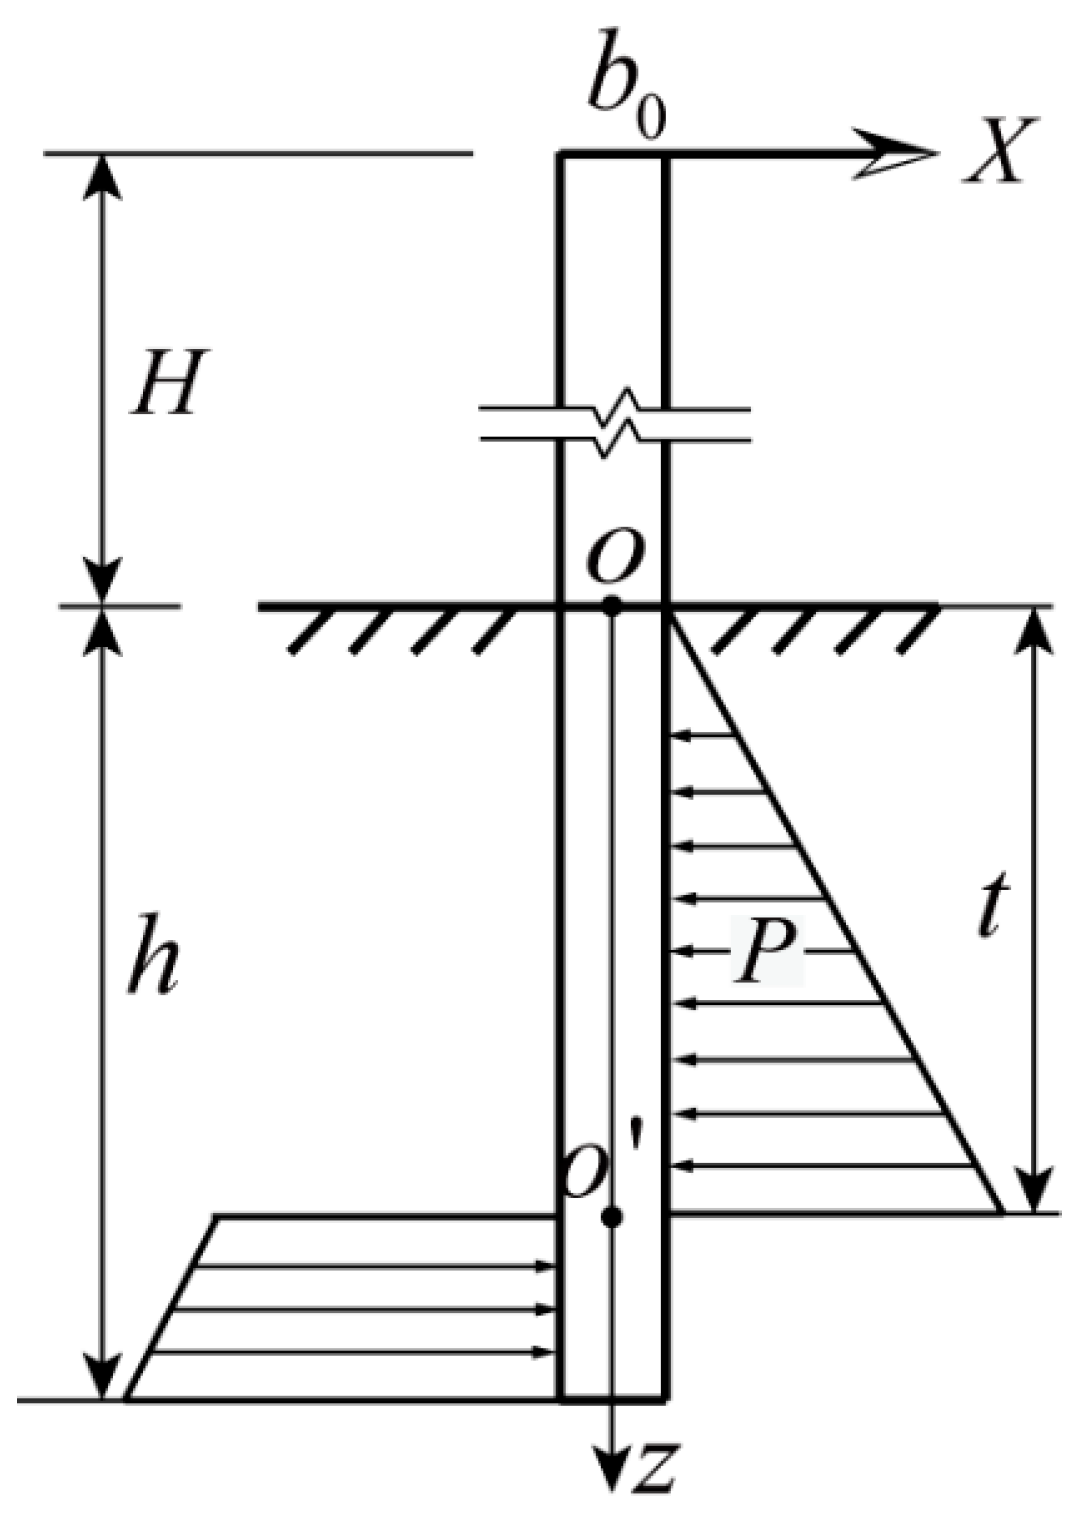
Figure 1. Schematic of the earth pressure.
Buildings 13 01717 g001
Figure 2. Earth pressure distribution obtained using the modified method.
Buildings 13 01717 g002
Figure 3. The safety evaluation framework of transmission poles under the wind load considering rainfall effect.
Buildings 13 01717 g003
Figure 4. Comparison of predicted and measured water content.
Buildings 13 01717 g004
Figure 5. Calculation diagram of the ultimate overturning moment.
Buildings 13 01717 g005
Figure 6. Monitoring data and the corresponding ultimate overturning moments obtained by different methods.
Buildings 13 01717 g006
Figure 7. Geometric model.
Buildings 13 01717 g007
Figure 8. Finite element model.
Buildings 13 01717 g008
Figure 9. The first six order mode shapes of pole-line system. The colors represent the displacement amplitude, with blue being smaller and red being larger. (a) First mode shape. (b) Second mode shape. (c) Third mode shape. (d) Fourth mode shape. (e) Fifth mode shape. (f) Sixth mode shape.
Buildings 13 01717 g009
Figure 10. Ultimate response of bending moment.
Buildings 13 01717 g010
Figure 11. Critical wind speed under variable cases.
Buildings 13 01717 g011
Figure 12. Critical wind speed at monitoring station G2990.
Buildings 13 01717 g012
Figure 13. Critical wind speed at monitoring station G1844.
Buildings 13 01717 g013
Figure 14. Critical wind speed at monitoring station G2133.
Buildings 13 01717 g014
Table 1. Calculation parameters of components.
Material ρ (kg/m3) E (GPa) ν
Pole250032.50.2
Cross-arm78502000.31
Line2751560.31
Table 2. Hypothetical cases.
Case No.First Day (mm)Second Day (mm)Third Day (mm)Fourth Day (mm)
Case 10000
Case 210101010
Case 310203040
Case 440404040
Disclaimer/Publisher’s Note: The statements, opinions and data contained in all publications are solely those of the individual author(s) and contributor(s) and not of MDPI and/or the editor(s). MDPI and/or the editor(s) disclaim responsibility for any injury to people or property resulting from any ideas, methods, instructions or products referred to in the content.