Article

Developing a Model for Analyzing Risks Affecting Machinery Tunnel Execution

1
Civil Engineering Department, Faculty of Engineering, Minia University, Minia 61519, Egypt
2
Department of Civil and Environmental Engineering, Incheon National University, Incheon 22022, Republic of Korea
3
Incheon Disaster Prevention Research Center, Incheon National University, Incheon 22022, Republic of Korea
4
Civil Engineering Department, College of Engineering, Taif University, P.O. Box 11099, Taif 21944, Saudi Arabia
*
Authors to whom correspondence should be addressed.
Buildings 2023, 13(7), 1757; https://doi.org/10.3390/buildings13071757
Submission received: 9 June 2023 / Revised: 1 July 2023 / Accepted: 7 July 2023 / Published: 11 July 2023
(This article belongs to the Special Issue Advances and Applications in Geotechnical and Structural Engineering)

Abstract

:
Tunneling projects face several risks during the execution stage that affect the execution objectives (cost, time, quality, and safety). This study aimed to define the main execution activities of machinery tunnels with the associated risk factors and to develop a model for evaluating and analyzing the effects of the risk factors on the execution stage. The recognized activities of executing tunnels included the following: (A01) thrust and reception shaft installation; (A02) machine setup and break-in; (A03) machine progression and lining placing; and (A04) machine break-out and removal. Additionally, thirty-two risk factors associated with these activities were identified. Risk factor probability of occurrence and impacts on cost, time, quality, and safety were determined. Due to this risky and uncertain environment, the fuzzy logic method was applied for developing a model to analyze the effects of the risks on the tunneling process. The model was applied and verified using data collected in Egypt. Many correlations were determined among risk factors that affected tunneling execution objectives, resulting in close relationships with each other. The results emphasized many significant risk factors, such as “conflict between technical geological report and the ground nature”, and “shaft wall damage during break-out”. A03, which is related to machine progression and lining placing, was declared the riskiest activity group during tunneling execution. Further, safety was rated as the objective most affected by risks. The risk model presented in this study can be modified and applied to other cases, while the results and key risks can support the decision-makers who deal with tunneling construction.

1. Introduction

Tunnels are defined as underground structures which deliver a space for many purposes, such as storage, transportation, and hydraulic structures [1]. The use of machinery tunnels is considered the most common tunneling technique, as indicated by its fast progression rate [2]. Machinery tunnel execution involves four main activities: (A01) thrust and reception shaft installation; (A02) machine Setup and break-in; (A03) machine progression and lining placing; and (A04) machine break-out and removal.
During tunnel construction, shafts are the entrance and departure gates for tunneling tools and materials [3]. Even after construction, shafts may have further roles to play—they can be used for ventilation or inspection or they can continue their primary job as an access and exit for tunnel users. Shaft design and construction are very specific tasks that consider many parameters: shaft permanent job, groundwater level, geological conditions, tunneling depth, etc. [4,5]. One of the most advanced shaft construction techniques, which is considered in this study, is caisson. The technique is feasible for applications in complex soil conditions, in wet ground, or at underground water level. Caissons are usually cast in situ above the ground surface. The shaft’s internal space is excavated, and the caisson sinks under its weight to reach the target depth. Then, forms are added to the top, and concrete is placed to create the next top section of the shaft [3]. The process is repeated until the shaft depth reaches the target value. For machinery tunnels, thrust and reception shaft successful installation is considered the key to a successful tunneling project.
Break-in/out, also named breakthrough, is the machine transition from the shaft to the ground media and vice versa. It is a critical operation requiring special design considerations and construction procedures [6]. Special face pressure control is needed when the machine starts its breakthrough (in or out). After the breakthrough, a part of the shaft wall is demolished to offer space for machine passage. Herein, the risk of instability takes place, and the situation of instability can cause the breaking of the ground in the excavation chamber [7]. This risk seems to be improbable in the case of solid rock media. However, the break-in remains a critical operation that requires particular machine settings for thrust and power to allow for successful penetration [8]. In the case of fractured rock or soil, it may require extra precaution in addition to face pressure control. Uncontrolled groundwater seepage into the shafts could result in ground collapse with groundwater and soil inflow. In such cases, lowering of groundwater level around the site may be considered. However, ground settlement associated with groundwater drainage can cause structural damage to adjacent buildings. Ground improvement techniques may be utilized to minimize permeability and/or improve the strength of ground media during the breakthrough [9,10]. Safe break-in is considered an indicator of a successful machine trip while safe break-out is considered an approval for this success.
Structural analysis and design process are performed for the after-construction phase for most structures, considering the structural system, construction material properties, and applied loads. For tunnels, it is performed for all construction phases with additional special consideration of the surrounding ground media properties and nearby underground and surface structure stability. In the presented tunneling stages, the structural worries are focused on limited construction areas. A machine trip between the shafts from break-in to break-out is the widest range step. The machine moves near or under lots of structures and explores various ground media profiles [1,6].
Many factors affect machine progression under the ground surface. The major factors are geological properties, operating conditions, and the machine’s structural characteristics. Thus, mechanics interaction with the ground is analyzed [11]. The face balancing pressure certifies the ground stability and, thus, controls the surface settlements. Missing the balancing pressure may cause instabilities at the machine face, resulting in surface settlement or even surface collapse if the ground is of poor quality [7,12]. Even structures founded on deep foundations may be disturbed by nearby tunneling machine movement and face pressure adjustment. Therefore, an accurate case-study structural analysis is required before construction, depending on the monitoring system records [13,14,15].
In the case of soft ground or weak rock, the tunnel lining is formed by precast concrete segments. These segments are designed to resist the loads from the ground and the temporary production and transportation loads. The tunnel’s inner dimensions are determined according to the intended use of the tunnel [16]. The precast concrete lining is an efficient and economical system when compared with other cast in situ supporting systems. This lining is suitable for different ground conditions [17]. Concrete cracks and damage are classified as the most possible defects in machinery tunnels [18]. Many researchers investigated these defects and their risk effects during the construction stage, and many reasons were assigned to these effects, such as inappropriate transportation and placement and excessive stresses due to the machine jacking forces [19].
Tunneling projects, in general, may face unexpected conditions that threaten their continuity [1]. Machinery tunnel projects particularly suffer from high uncertainty induced mainly by the interaction between the machine and the geological conditions [20]. Thus, risk analysis and management play essential roles in such projects. However, tunnel risk analysis is still in the development stage [21].
Fuzzy logic became one of the most popular modeling approaches recently, and its techniques have a wide range of successful applications. When risk analysis needs to consider parameters with quantification complexity, fuzzy logic presents a solid method to model this vagueness [22]. Fuzzy logic involves many applications in tunneling project execution. A risk assessment model using fuzzy logic to evaluate risk during tunnel construction has been developed [1]. Fuzzy Bayesian networks have also been used to develop a decision tool for safety assurance and management in tunneling projects [23]. Fuzzy logic is also used to develop a machinery tunneling utilization predictor, which is applied to planning the projects and estimating the total construction time and cost [24]. More details for applying fuzzy techniques in tunneling projects will be explained later.
Regarding the demonstrated steps of the tunneling process, many risk factors affect tunnel execution projects. One of the main qualitative risk analysis steps is combining the probability of occurrence with the risk impacts of these factors on the project objectives, which has had limited investigation in tunneling research. Considering the complexity of this combination and associated uncertainties, this type of analysis may be performed only through modeling.
This study aimed to investigate the effect of risks on the most important objectives for tunneling projects—cost, time, quality, and safety—by combining the probability of occurrences and impacts of the risk factors. Thus, developing a new model to analyze risks and assess their effects on tunnel execution objectives was a must. A fuzzy logic-based risk analysis model was presented to evaluate and quantify risk factors’ influence. The proposed model is regarded as a crucial tool for assisting decision-makers in tunnel construction. Further study objectives can be summarized in the following points:
(1)
To define the main execution activities and risk factors affecting them through the tunnel execution stage;
(2)
To evaluate the risk factors’ probability of occurrence and their different impacts on the cost, time, quality, and safety;
(3)
To highlight the risk factors with effective indices that influence the execution of tunnel projects in Egypt;
(4)
To determine the cost, time, quality, and safety impacts of tunnel execution activities.

2. Research Methodology

The methodology used in this research included identifying the activities of machinery tunnel execution and risk factors affecting these activities. The cost, time, quality, and safety were selected as the most important objectives for these projects. Conducting and verifying a risk analysis model, as a main objective of this study, was considered one of the methodological steps, which depend on combining the probability of occurrences and impacts of the risk factors. In order to apply and test the required model, data based on field surveys were collected using two steps.
In the first step, a comprehensive literature review and brainstorming sessions with professionals in the field of machinery tunnel execution were conducted in order to define the main activities in these projects and effective risks. The number of specialists participating in these sessions was fifteen, with an average of eighteen years of experience in the field of machinery tunnel execution in Egypt. A list of the main activities and risks affecting them was obtained. Based on brainstorming sessions, this stage aimed to affirm the risk factors affecting the tunneling execution process by amending the initial list to match the existing situation in tunneling processes. This step resulted in a final list of risks affecting tunneling activities (thirty-two risk factors) and four activity groups. In this step of data collection, several logical rules in the proposed model were also explained to the participants to confirm these rules and the relations between inputs and outputs. Furthermore, the model outputs represented the significance of a certain risk factor based on conjoining the effects of the associated two inputs.
In the second step of the field survey, the semi-structured interviews were directed to allow respondents to express suggestions for improving survey results [25]. The main objective of these interviews was to select the most appropriate term for each risk characteristic related to probability and impacts on cost, time, quality, and safety due to their experiences.

3. Identifying Risk Factors Affecting Machinery Tunnel Execution

There is limited research on handling and identifying challenges and barriers that influence the execution of tunnels. For example, twelve main influencing factors involving subjective and objective factors were identified as well as four actual indices to assess the deformation risk of tunneling in soft rock [26]. An assessment for delay risk was conducted to predict delays in tunneling boring machine (TBM) projects and to assign the causing critical risk factors [20]. Using a geological study confirmed by the contribution of experienced technicians, eight levels of risks were considered in mechanized tunneling probability and impact factors in the ideal risk analysis [27]. Another study introduced the potential risks associated with shield TBM application and categorized them into groups that can systematically assess overall risk levels [28]. The authors of [29] concluded the risk analysis of submerged floating tunnels and combined the characteristics of submerged floating tunnels and surrounding environmental risks. The authors of [30] conducted a study related to deep tunneling projects and proved that the geological and settlement risks were increased proportionally to tunneling depth. They also concluded that unexpected actions had a high impact on machinery projects and unexpected events might have a remarkable delaying effect on such projects.
Differential settlement is considered a high risk that threatens tunnel structure stability. A tunnel settlement monitoring system was developed with intelligent functions to evaluate tunnel structural conditions and guarantee construction sustainability. This monitoring system can help prevent hazards and support decision-making [31]. A new ground settlement index was presented to evaluate displacement risk during tunneling. The index comprises fifteen parameters affecting induced settlements in tunnel execution. The new index has great significance to ground settlement owing to tunneling [32].
Regarding the outlined review concerning risks related to the tunneling process, several risk factors were explored and grouped according to tunnel execution activities. The final list of risk factors was established by filtering the initial list, as explained in the Section 2. This final list included thirty-two risk factors affecting tunnel execution distributed in four activity groups as demonstrated in Table 1.

4. Risk Analysis and Management in Tunnels

Risk analysis and management approaches made significant contributions to minimizing tunnel construction problems. Risk analysis was introduced to determine tunnel construction time and cost using the decision aids for tunneling concerning factors affecting surface settlement problems [33]. Risk analysis and management were also introduced through an aeronautics method in tunnels for the purpose of minimizing building and refurbishing costs [34]. Risk investigation techniques, including qualitative, semi-quantitative, and quantitative approaches, were developed to assess risks in road tunnels [35]. A pragmatic risk analysis system described in [36] focused on mortality risks in the case of a road tunnel accident. Another risk analysis was conducted according to technical conditions for the safe operation of road tunnels [37]. A risk analysis-based methodology was applied to optimize support patterns and advance rates for tunneling in rock. It proved quantitatively that tunnels became more stable and the reliability index was higher if the tunnel support was increased [38].
Risk assessment and analysis of urban utility tunnels were introduced through dynamic hazard scenario identification for the worst-case scenarios of tunnel accidents; they were modeled using the Bayesian network method. It was verified that the incorporated quantitative risk evaluation can effectively support the safety assessment and planning of such tunneling projects [39]. An approach that combined building information modeling (BIM), and the Dempster–Shafer (D–S) evidence techniques was presented to aid risk assessment and visualization in tunnels. BIM was applied to conduct three-dimensional models, while the D–S evidence was used to identify the risk presence [21]. Further, the D–S evidence theory and advanced geological prediction were presented to control the collapse risk of drill-and-blast tunnels [40]. Using event trees, fault trees, and consequence estimation models, an approach for developing a quantitative risk assessment software tool was applied considering unique road tunnel characteristics [41].
Different probabilistic models for the prediction of tunnel construction risk were introduced, taking into consideration a simple probabilistic model to estimate tunnel construction failures that induced damage, to aid the decision-making under uncertainty in construction projects, and to create stochastic models for specified tunneling projects problems, such as the influence of tunnel excavation on the surface structure integrity [42]. A quantified risk assessment for highway tunnel construction was introduced to determine occupational risk at hazard, activity, and job levels, as well as overall company risk [43].
A maintenance strategy for the tunnel structure was developed to ensure its safe and serviceable operation during its lifespan with the intent to minimize the total risk [44]. Through a case study, an application of the nonparametric Bayesian networks method, which integrates expert knowledge, was used to assess the risk for common failures in shield tunnel execution [45]. A discussion was introduced to present a more suitable framework for the assessment and management of risks and uncertainties in the design phase of the world’s longest and deepest undersea road tunnel [46].
Using the analytic hierarchy process (AHP), the weight values of major risk factors of undersea tunnel area conditions were calculated, and the risk control measures were proposed using a hierarchical structure model of risks for the purpose of providing a reference for decision-makers [47]. Based on analyzing different impact factors, a risk index system for the public safety of a submerged floating tunnel was determined. Additionally, the construction safety risk was evaluated by the AHP method [48]. A risk assessment framework combining the Bayesian network and D–S evidence theory was established to evaluate sewer pipeline accidents in a utility tunnel, aiming to prevent and mitigate these accidents [49]. A general uncertainty analysis utilizing the risk assessment method for damage in hard-rock tunnels was suggested considering risk probability, loss estimation, and risk level evaluation [50]. Based on a generic bow-tie method, a new risk analysis methodology was presented to assess and manage TBM tunnel risks in difficult ground conditions [2].
Safety risk management in road tunnels was studied considering the probabilistic approaches associated with dangerous goods transportation and human behavior, safety arrangements, and the varying safety standards among different countries [51]. Another safety risk assessment approach, which combined the D–S evidence theory and the Monte Carlo simulation technique, was developed to evaluate the safety risk of surface buildings due to tunneling under uncertain conditions [52]. A risk assessment study presented twenty-five recommendations intending to introduce a system of tunnel safety decision-making and risk assessment [53]. Finally, a one-dimensional soil–structure interaction model, which integrated an estimation tool for ground movements during tunneling, was used to assess the risks of tunneling-induced building damage [54].

5. Using Fuzzy Logic Technique in Tunneling Projects

The fuzzy logic technique was introduced to evaluate and solve many problems in tunneling projects. Fuzzy logic was used for developing a TBM utilization predictor in the planning phase. It was applied to planning the machine advance rate and estimating related excavation time and cost [24]. A fuzzy inference analysis was used in the assessment of lane-changing behavior in undersea tunnels according to the characteristics of traffic flow [55]. Combining neural, neuro-fuzzy, and analytical solutions, a new strategy was proposed to assess the stability of tunnels during the design and construction phases while its efficiency and validity were verified with two examples of actual tunnels [56]. Factors affecting rock mass classification were applied as evaluation indices of fuzzy AHP, which was developed with tunnel seismic prediction as a classification method to accurately predict the surrounding rock classification [57]. The potential applications of fuzzy methodology in geological problems and tunneling problems were discussed taking into account professional expertise and judgment of expert systems, which included many approaches, such as fuzzy decision-making, fuzzy pattern recognition, and fuzzy clustering [58].
A fuzzy risk assessment model was introduced to evaluate risk events during tunnel construction operations [1]. A novel integrated risk assessment method that applies multistate fuzzy Bayesian networks was developed to assess the collapse probability of a certain tunnel [59]. Another multistate fuzzy Bayesian network-based method was proposed to evaluate and control the collapse risk in drill-and-blast tunnels [60]. A decision tool based on fuzzy Bayesian networks was developed to support safety assurance and management in tunneling projects. The model consisted of risk mechanism analysis, establishing model, fuzzification, model-based inference, defuzzification, and decision-making [23].
Tunnel ventilation control is to provide a safe and comfortable environment for users [61]. The tunnel ventilation system aims mainly to keep carbon monoxide pollutant concentration and visibility indicators at a certain level to ensure a comfortable and safe driving environment. Fuzzy logic control methods are usually utilized due to the complexity and nonlinearity of tunnel ventilation systems [62]. A fuzzy control method for longitudinal ventilation by predicting the number of jet fans of road tunnels to control pollutant levels was presented [63]. A fuzzy logic control model was applied to the ventilation system in a large road tunnel taking into consideration higher visibility and lower concentration of carbon monoxide. A dynamic equation to describe the air pollution concentration was combined with the fuzzy logic rules [64]. A predictive fuzzy control was introduced to quantify tunnel ventilation control problems involving many elements; this approach could minimize electric power consumption by maintaining pollution below the allowable limit [61]. Fuzzy logic control was redesigned using the genetic algorithm to maintain a limited level of pollutants and reduce power consumption in tunnels. Using this approach, the pollutant level was kept within the acceptable limit, and the energy efficiency was enhanced compared with conventional control approaches [62]. According to mathematical dynamical system theory, a predictive fuzzy control scheme was presented for road tunnels’ ventilation control system using a set of fuzzy dynamical equations to regulate the air quality in the tunnel and reduce the ventilation electrical energy consumption [65].
The fuzzy logic was also used in solving many problems related to machinery tunnels. A novel hybrid fuzzy decision-making approach was developed to improve construction efficiency as well as decrease the cost of the TBM project [66]. Fuzzy set theory, fuzzy logic, and neural network techniques showed good performance in geological engineering applications [67]. An algorithm based on fuzzy c-means, which assesses the alterations among the clusters using the attributes of a data relationship, was applied to real dataset collection from machinery tunnel operation [68]. On the other hand, fuzzy logic was used for supporting decisions related to machinery tunnels. A fuzzy-based technique for order performance by similarity to ideal solution (TOPSIS) was established to support the TBM tunneling decision-makers in the process of selection [69]. A new fuzzy-based decision-making technique, which considers the distance between the joint segments, was proposed to determine the proper number of segments [70].
To overcome the uncertainty of tunnel fire, the fuzzy logic technique was applied to solve several difficulties related to this issue. A model of tunnel fire using fuzzy fault tree analysis was developed for causes of tunnels fire [71]. A different model based on a fault tree was established for fire accidents in tunnels considering the uncertainty and fuzziness of accidents. It was developed and applied to reduce the occurrence of fire in tunnels [72]. A fuzzy AHP model that combines the fuzzy consistent matrix and AHP was proposed to assess the subway tunnel fire risk [73]. A quantitative risk assessment method for road tunnel fire was developed, and a Monte Carlo-based estimation technique was directed to address parameter uncertainty in the risk assessment model depending on event tree analysis and consequence estimation models. The risk indices were very helpful for tunnel operators with distinct risk modes to consider the safety level for road tunnels [74].

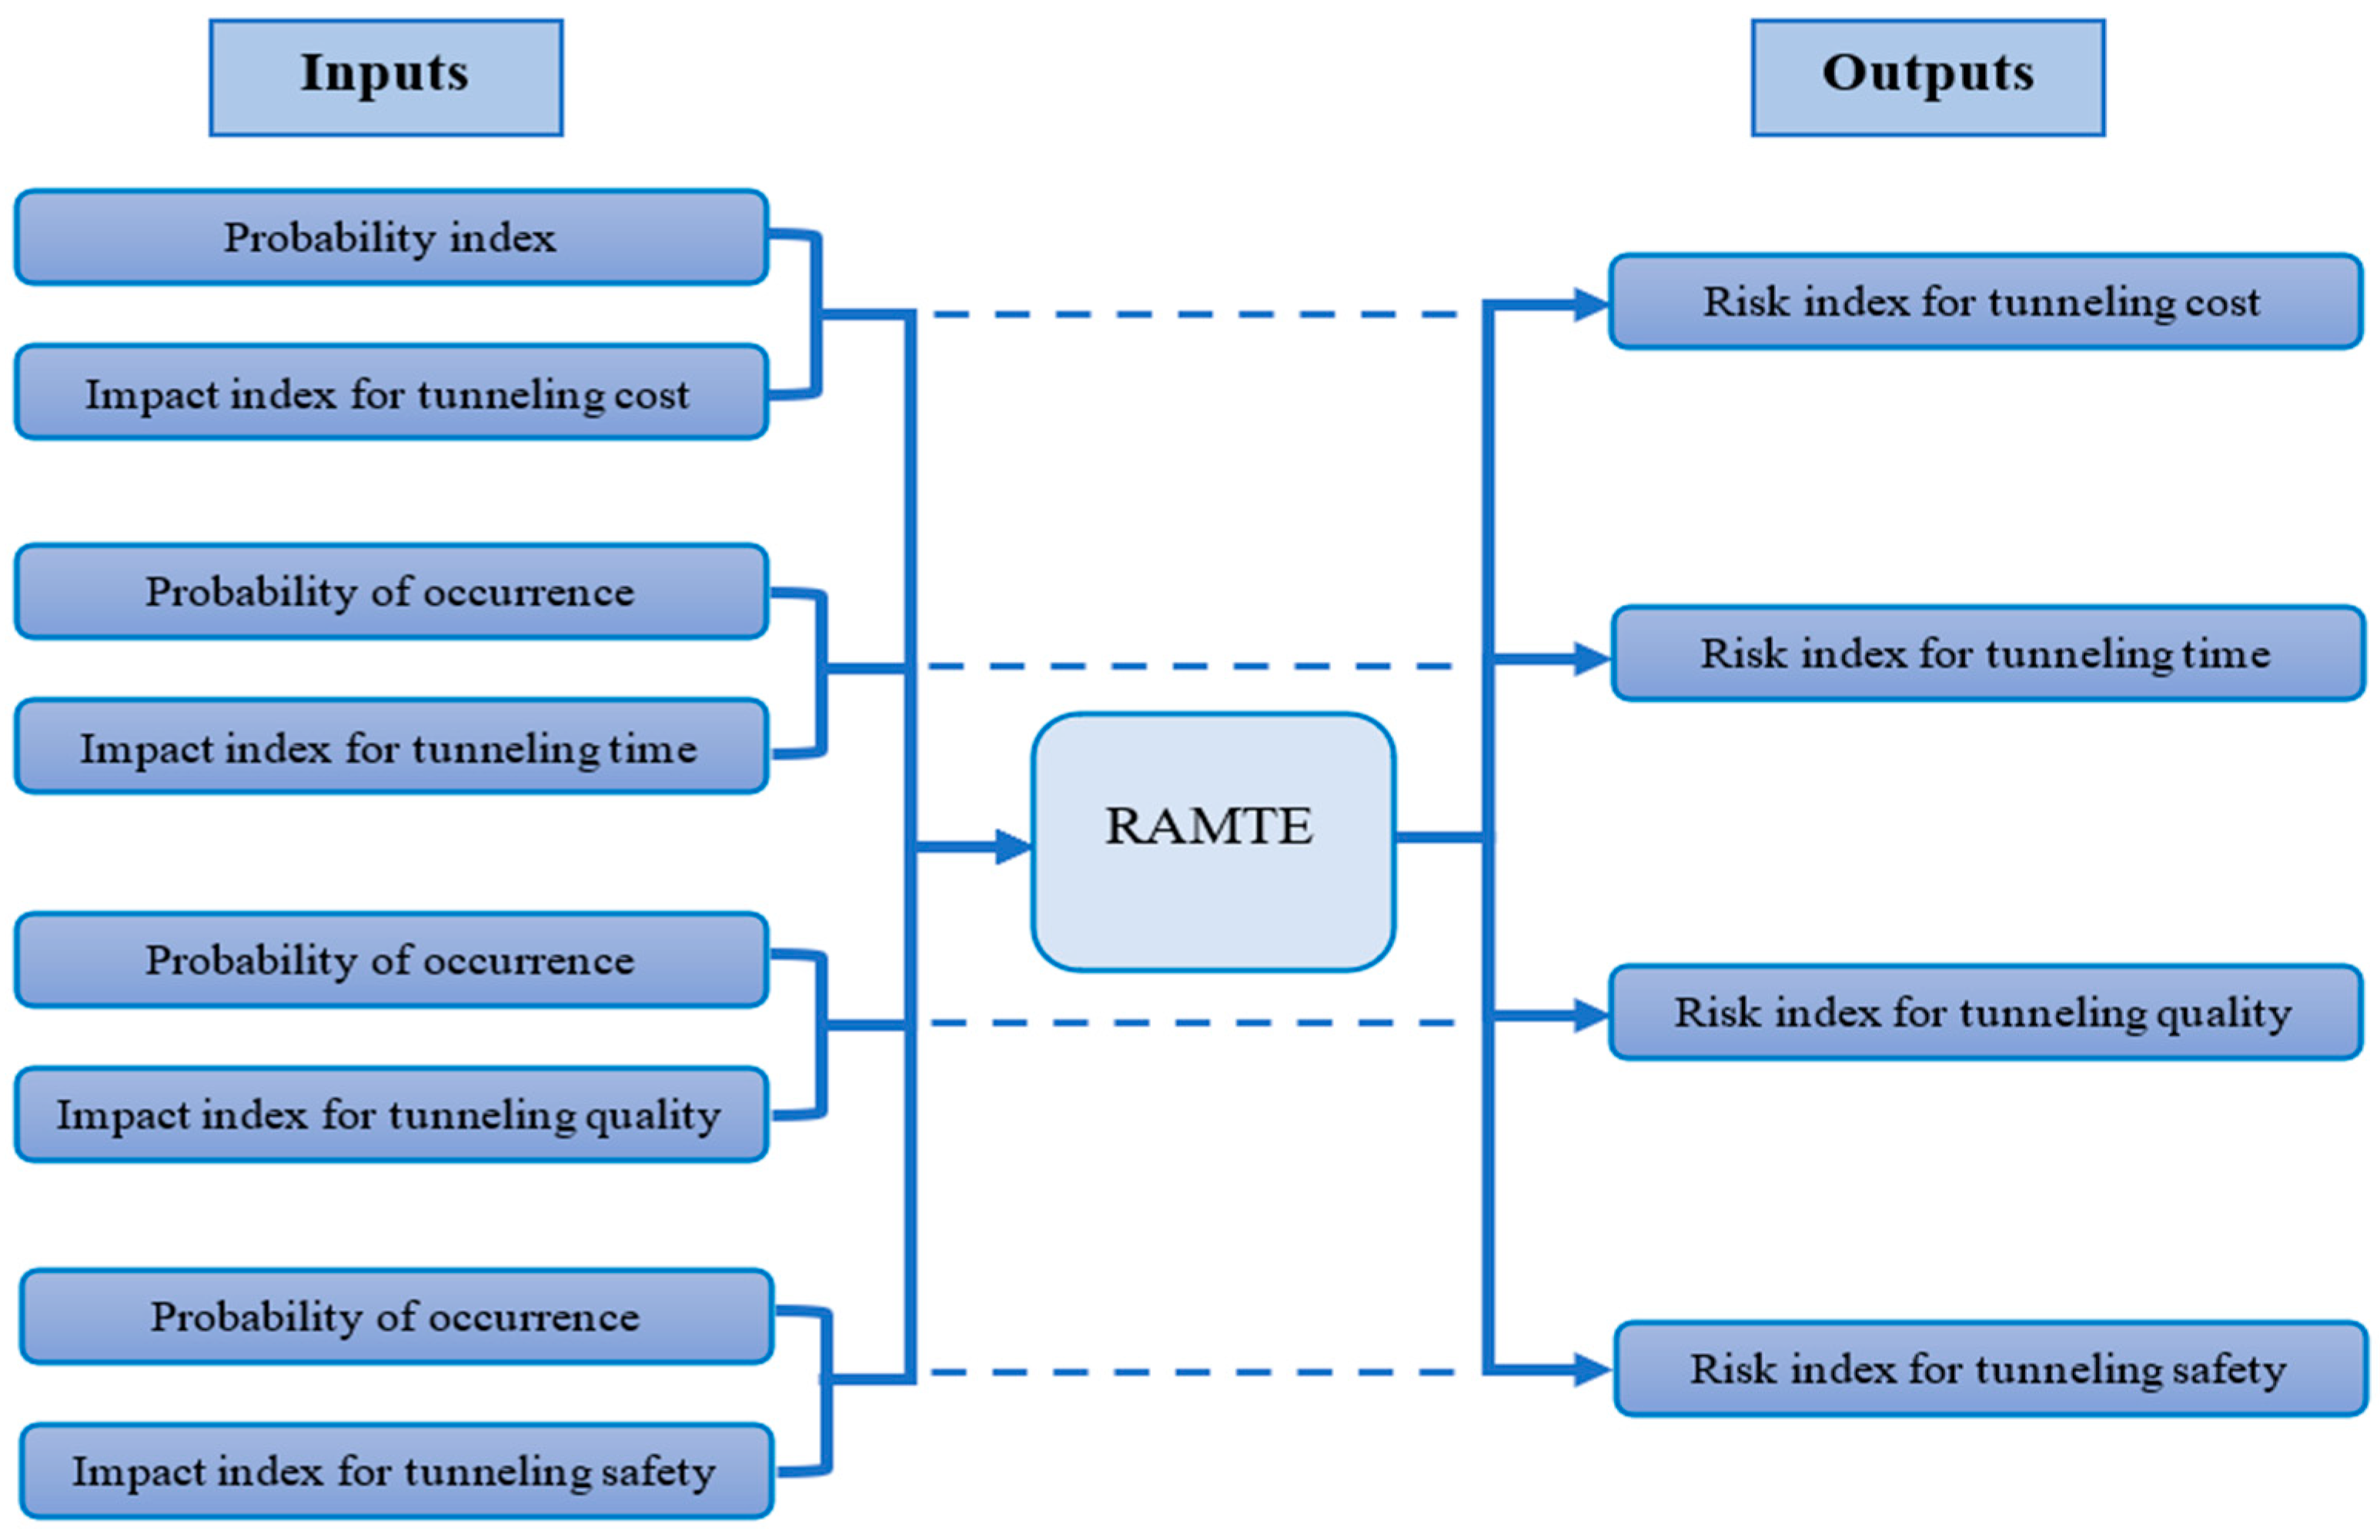
6. Risk Analysis Model for Tunnel Execution (RAMTE)

A proposed new risk analysis model was developed for addressing the main activities of tunneling processes and the associated risks using the fuzzy logic technique. It was created in three stages, including selecting the appropriate membership function, defining the rule base, and determining the inference mechanism. The crisp inputs in the current fuzzy logic model contained five indices: risk factor probability of occurrence (PI), impact index for tunneling cost (IITC), impact index for tunneling time (IITT), impact index for tunneling quality (IITQ), and finally, impact index for tunneling safety (IITS). For assessing the risk factors affecting tunnel execution activities, four new risk indices were created as the model outputs. Each index combined the probability of occurrence of each risk factor with an impact index. For example, the risk index for tunneling cost (RITC) combined the effect of both PI and IITC. The new index specified the overall importance related to cost. In the same way, the remaining three indices—risk index for tunneling time (RITT), risk index for tunneling quality (RITQ), and risk index for tunneling safety (RITS—represented the combined effect for the probability of occurrence with IITT, IITQ, and IITS, respectively. The layout for the proposed model is shown in Figure 1.
For each case (cost, time, quality, and safety), there were two inputs and one output, and twenty-five logical rules were introduced to associate the model inputs with outputs. The selected linguistic terms to express the probability of occurrence are presented in Table 2 and range from rare to very likely, while the impacts are described from very low to very high, and the output is determined by a range from trivial to extreme. The proposed logical rules correlating RAMTE inputs and outputs are recognized based on the fuzzy associated memories (FAMs), as shown in Table 3.
The significance of a risk factor as a model output resulted in a combined influence of two inputs. The authors introduced the rules according to the relations shown in Table 3, which were validated by the specialists in the brainstorming session. Two examples of the suggested logical rules are as follows:
Example 1. 
If the risk factor probability of occurrence is Unlikely and its impact on cost is Medium, then the risk factor significance related to cost is Minor.
Example 2. 
If the risk factor probability of occurrence is Moderate and its impact on safety is Very high, then the risk factor significance related to safety is Major.
Linguistic variables used in fuzzy logic can represent the fuzziness degree through several membership functions. These membership functions represent a numerical meaning for each linguistic term, and researchers should select the most suitable one according to the problem [75]. The membership functions signify input and output value ranges associated with each label. The triangular membership function was proposed to be applied in RAMTE for inputs and outputs. This selection is supported due to several uses of this membership function in risk management and civil engineering projects in several situations similar to the presented study [76]. The proposed membership function is depicted in Figure 2.

6.1. Model Application

To assess risk factors affecting the tunneling process by applying RAMTE, many field surveys were conducted as explained in the Section 2 to collect data on five characteristics concerning the identified thirty-two risk factors in Egypt (PI, IITC, IITT, IITQ, and IITS). The inputs of the model are briefed in the first five columns in Table 4 as outputs of the field survey. These indices were calculated according to the following equations using linguistic terms. The probability of occurrence is represented in Equation (1) while the impact indices are represented by Equations (2) to (5). These new indices were applied for rating risk factors as introduced based on the participant’s opinion.
P I = I = 1 5 P i · N i i = 1 5 N i  
I I T C = I = 1 5 l i t c i · N i i = 1 5 N i  
I I T S = i = 1 5 I i t s i · N i i = 1 5 N i  
I I T Q = i = 1 5 I i t q i · N i i = 1 5 N i
I I T S = i = 1 5 I i t s i · N i i = 1 5 N i
PI: the probability of accuracy;
  • Pi: the probability weight;
  • Ni: number of participants who reacted to option i;
  • IITC: the impact index for tunneling cost;
  • Iitci: the impact weight;
  • IITT: the impact index for tunneling time;
  • Iitti: the impact weight;
  • IITQ: the impact index for tunneling quality;
  • Iitqi: the impact weight;
  • IITS: the impact index for tunneling safety; and
  • Iitsi: the impact weight.
The weight of Pi, Iitci, Iitti, Iitqi, and Iitsi was represented as 0.1, 0.3, 0.5, 0.7, and 0.9 for (i = 1, 2, 3, 4, and 5, respectively).
The four model outputs (RITC, RITT, RITQ, and RITS) were determined and are summarized in Table 4. All factors are also ranked in the same table. It can be noted from this table that RF21 (conflict between technical geological report and the ground nature) was regarded as the most significant risk factor based on its important effect on both cost and safety and represented the third and eighth orders due to its significant effect on time and quality, respectively. Furthermore, this factor, RF21, had the highest value of probability of occurrence (PI = 0.78). RF15 (groundwater or soil inflow during break-in) was ranked first due to its significant effect on time. On the other hand, RF28 (shaft wall damage during break-out) was considered the most important risk factor due to its significant effect on quality.

6.2. Verification of RAMTE

The defined risk factors can be classified according to the values of severity indices, which can be determined by applying the following equations [77]:
SIC = PI × IITC
SIT = PI × IITT
SIQ = PI × IITQ
SIS = PI × IITS
where SIC, SIT, SIQ, and SIS are the severity indices for tunneling cost, time, quality, and safety, respectively. The RAMTE was applied to all risk factors affecting tunneling in Egypt, resulting in IITC, IITT, IITQ, and IITS. Spearman’s test was applied and the correlation coefficient was calculated to rank the factors in the four cases. The values of the correlation coefficient are summarized in Table 5. It can be noted that all values are positive and above 95%, which verifies the model results.
The proposed model can be applied to other risk analysis cases associated with execution activities using the same methodology explained in this research, which includes the following: (1) collecting data concerning the execution of main activities and risk factors affecting them; (2) determining the most important objectives related to the case study, such as cost, safety, sustainability, etc.; (3) developing the risk model based on available data, which may include some risk characteristics, such as the probability of existence and the influence of each risk factor on the selected objectives; the model can relate these characteristics to determine the overall significance of each risk factor by using suggested logical rules; (4) applying the model for each case study according to the collected data.

7. Model Results and Discussion

7.1. Inputs and Outputs Correlations

A Spearman test was applied to specify the relationship between probability and impact indices and between the indices and each other. In general, the intensity of the relationship is expressed by a value. The positive value points to a consonance while the negative value points to an inverse proportion. A higher value indicates a stronger relationship. Figure 3 illustrates these relations in a simple bar chart. The correlation coefficient between the probability and impact indices ranges from 0.153 to 0.518. The relationship with the time index is the weakest while the relationship with the safety index is the strongest. On the other hand, the correlation coefficient between the impact indices ranges from 0.068 to 0.778. Time and quality indices have the weakest relationship, while cost and safety indices have the strongest relationship. The bar chart in Figure 4 demonstrates the relationship strength between risk impact indices and each other according to the explained criteria. The correlation coefficients show strong relations between all indices as all values are higher than 0.6. However, time and quality risk indices have the least coefficient value and the weakest relationship. Contrariwise, cost and time indices have the strongest relationship with a coefficient value of 0.863.

7.2. Analysis of RAMTE Inputs and Outputs

The boxplot diagram represents several statistical appearances, such as the center, spread, range, and outlier points, which appear out of range. The box signifies 50% of the investigated statistics, while the 75th percentile and 25th percentile represent the upper and lower ends of the box, respectively. The median is represented by a line in the middle of the box [78].
Figure 5 compares the probability of occurrence with other impact indices. The safety index has the widest distribution space while the cost index has the narrowest distribution space among the impact indices. The difference in these distribution space lengths refers to the difference in lower limit values, as all impact indices have close to upper limit values. The probability index has a distribution space length almost equal to the cost’s space length with lower values. For all plotted parameters, the values are converged around to the median value without any outliers.
The boxplot chart shown in Figure 6 compares different output risk indices. The safety risk index has the widest distribution space, highest upper limit value, and smallest lower limit value. Cost, time, and quality indices have close distribution spaces with slight differences in upper and lower limits. No outlier exists in all risk plots in this case.
It is noted that the safety index has the widest distribution space among the inputs and outputs, which implies that the safety issue is the most influenced object by the investigated risk factors.
The relationship between each risk index and different activity groups was retained and plotted in Figure 7. It is clear that the cost risk has an extended relationship with all activities with the widest distribution space for activities A02 and A03 (including outliers in A02). The time risk index has the widest distribution space with activity A03. Activities A04 and A01 come in second place with higher values in A04. Both activities, A02 and A04, have the widest distribution space for the quality index with very close values. Activity A03 has the widest distribution space in relation to the safety risk index. Activities A04, A02, and A03 come next in descending order (including outliers).

7.3. Analysis of Risk Activities Groups

Table 6 summarizes the risk indices’ mean values for the different activities. The time risk index has the highest mean value for all activities except activity A03, in which, it comes in second place after the cost risk index. The safety risk index has relatively low mean values. It has the lowest value for activities A01 and A04. It is slightly higher than the quality risk index in activities A02 and A03.
Figure 8 shows a comparison among different risk indices associated with activity A01. The activity considers nine different construction factors. In the shown boxplot chart, the cost risk index has the widest distribution space. The safety index comes second, and the quality index comes third with slight differences compared with the cost index. The time index plot is the only one with outliers, which represent the factors RF04, RF05, and RF07. Excluding these outliers, the index has the narrowest distribution space; while considering these outliers, the index has the same distribution space as the cost index.
Figure 9 shows a comparison among different risk indices associated with activity A02. The activity considers seven different construction factors. All risk plots have outliers except for the quality index plot. Neglecting outliers, the quality index has the widest distribution space. Considering the outliers, both cost and safety indices have overall higher values and wider distribution space than the quality index. Cost and safety indices have similar distribution spaces with or without outliers. They even have the same outlier factor, RF10. The time index has the narrowest distribution space with or without outliers.
Figure 10 illustrates a comparison among different risk indices associated with activity A03. The activity considers nine different construction factors. The safety risk index has the widest distribution space, highest upper limit value, and smallest lower limit value. Cost, time, and quality indices come after that in descending order. The time index plot is the only one with outliers, which represent RF18 and RF24.
Figure 11 presents a comparison between different risk indices associated with activity A04. The activity considers seven different construction factors. The safety index plot is the only plot with an outlier that represents RF29. Eliminating the outlier, the safety index has the narrowest distribution space. Considering the outlier, it has the widest space followed by the quality, cost, and time indices in descending order. Indices have close upper limit values and different lower limit values.

7.4. Key Risk Factors

Table 7 illustrates the top ten key risk factors that control the risk indices according to qualitative analysis for risks affecting the tunnel execution process. Among thirty-two risk factors, only sixteen factors formed the top ten records for all indices. Four factors are repeated with all indices and two of them are among the top three effective factors for all indices: RF15 (groundwater or soil inflow during break-in) and RF29 (groundwater or soil inflow during break-out) while RF21 (conflict between technical geological report and the ground nature) comes in the top three for three indices. RF28 (shaft wall damage during break-out) came in the first place with the highest value in the quality index and it was repeated in two other lists. In the cost risk index list, nine of ten factors were repeated four or three times in other lists. In the time risk index list, eight of ten factors were repeated three or four times in other lists while quality and safety index lists had fewer repeated factors. The safety risk index list had the widest distribution range (from 0.615 to 0.87). On the other hand, the quality risk index list had the narrowest distribution range (from 0.615 to 0.777). Among the sixteen appointed factors, four factors belonged to activity A01, four factors were represented by activity A02, five factors came from activity A03, and three factors belonged to activity A04.

8. Conclusions

Tunneling construction is considered a major component of evolving infrastructure projects while it faces uncertainty and many risks influencing execution objectives, such as cost, time, quality, and safety. In this study, practical surveys were conducted to identify the tunnel execution activities in addition to the risk factors related to these activities. A fuzzy logic risk analysis model was constructed and applied to assess these risks and their effects on the tunneling process. Thirty-two risk factors were categorized under four main execution activities, including thrust and reception shaft installation, machine setup and break-in, machine progression and lining placing, and machine break-out and removal. Five indices, calculated based on the field surveys, represented the model inputs, and four new fuzzy risk indices, which established a relationship between the probability and the impact of the objectives, were developed and applied. Several linguistic variables were used by the application of various logical rules to achieve various relations among the inputs and outputs. The model was verified by an application in the context of Egypt as a case study. Specific conclusions related to the model application are summarized in the following points:
  • The risk factor RF21 (conflict between technical geological report and the ground nature (was considered the most frequent factor; in addition, it had a significant effect on cost, safety, and time. On the other hand, RF28 (shaft wall damage during break-out) was considered the biggest influence on quality. Risk factors (RF15 and RF29), which related to groundwater or soil inflow during break-in and break-out, appeared to be the most important factors that had significant effects on the four objectives.
  • The correlations for the risk model inputs showed that the relation between probability and time index was the weakest while its relationship with the safety index was the strongest. On the impact level, time and quality indices had the weakest relationship while cost and safety indices had the strongest. The correlations for model outputs showed strong relations among all indices. The safety objective was regarded as the objective that may be most affected by risks.
  • Results of risk activity groups showed the maximum number of key risk factors appearing in group A03 (five factors), which was considered the most imperative activity that depends on machine progression and lining placing, followed by activities A01 and A02, which contained four key risk factors each, while activity A04 had only three key risk factors.
  • The proposed model, which used the fuzzy logic technique, had many advantages, such as its flexibility and simplicity in solving similar problems as well as its capability for application in other case studies by conducting slight modifications. Furthermore, the proposed model can help decision-makers in the tunneling execution field.

Author Contributions

Conceptualization, M.A.E.; data curation, U.I.; formal analysis, M.A.E.; funding acquisition, J.W.H.; investigation, U.I.; methodology, M.A.E. and U.I.; project administration, J.W.H.; software, M.A.E. and U.I.; validation, J.W.H.; writing—original draft, M.A.E. and U.I.; writing—review and editing, M.A.E. and J.W.H. All authors have read and agreed to the published version of the manuscript.

Funding

This research was funded by the Korea Agency for Infrastructure Technology Advancement (KAIA) grant funded by the Ministry of Land, Infrastructure, and Transport (Grant RS-2022-00143541).

Data Availability Statement

All relevant data are included within the manuscript.

Acknowledgments

The researchers would like to acknowledge the Deanship of Scientific Research, Taif University, for funding this work. This research is supported by the Korea Agency for Infrastructure Technology Advancement (KAIA) grant funded by the Ministry of Land, Infrastructure, and Transport (Grant RS-2022-00143541).

Conflicts of Interest

The author declares no conflict of interest.

References

  1. Yazdani-Chamzini, A. Proposing a new methodology based on fuzzy logic for tunnelling risk assessment. J. Civ. Eng. Manag. 2014, 20, 82–94. [Google Scholar] [CrossRef]
  2. Sharafat, A.; Latif, K.; Seo, J. Risk analysis of TBM tunneling projects based on generic bow-tie risk analysis approach in difficult ground conditions. Tunn. Undergr. Sp. Technol. 2021, 111, 103860. [Google Scholar] [CrossRef]
  3. Rush, J. Shaft Design and Construction. Tunnel Business Magazine, 5 April 2012. Available online: https://tunnelingonline.com/shaft-design-and-construction/(accessed on 8 June 2023).
  4. Zhou, F.; AbouRizk, S.M.; Fernando, S. A simulation template for modeling tunnel shaft construction. In Proceedings of the 2008 Winter Simulation Conference, Miami, FL, USA, 7–10 December 2008; pp. 2455–2461. [Google Scholar]
  5. An, Y.P.; Ouyang, L.; Peng, B.; Wu, W. Hu Construction Techniques and Safety Analysis for a Deep Vertical Shaft and Vertical Shaft Shifting to Main Tunnel. Mod. Tunn. Technol. 2018, 55, 164–173. [Google Scholar]
  6. Richards, D.P.; Burchell, A.J.; Campo, D.W.; Ramond, P. Review of Break-in and Break-out Concepts for Tunnel Boring Shields in Saturated Soft Ground. Geotech. Eng. Bull. 1997, 6, 79–98. [Google Scholar]
  7. Valle, N.D.; Haro, P.G.D.; Gatón, I.S.D.S.M. TBM Shield Machines Break in and Break out. In Proceedings of the International Tunneling Symposium in Turkey: Challenges of Tunneling, TunnelTurkey, Istanbul, 2–3 December 2017. [Google Scholar]
  8. Yagiz, S.; Merguerian, C.; Kim, T. Geological controls on the breakthrough of tunnel boring machines in hard rock crystalline terrains. In Rock Mechanics in Civil and Environmental Engineering; Taylor & Francis Group: Oxfordshire, UK, 2010. [Google Scholar]
  9. Duangsano, O.; Jangjit, W.; Asanprakit, A.; Chanchaya, C.; Muangsaen, K. Application of Ground Improvement for Launching and Receiving of TBM Shield Machines on MRT Orange Line (Last Section) Project. In Proceedings of the 26th National Convention on Civil Engineering, Online, 23–25 June 2021. [Google Scholar]
  10. El-Nahhas, F.M.; Iskander, G.M.; Abdel-Rahman, M.T.; Iskander, G.M. Utilization of Grouting Techniques for Construction of Underground Structures in Urban Areas. In Proceedings of the International Symposium on: Utilization of Underground Space in Urban Areas, Sharm El-Sheikh, Egypt, 6–7 November 2006. [Google Scholar]
  11. Zhou, S. Prediction of Thrust Force Requirements for TBMs Based on Mechanical Analysis. J. Mech. Eng. 2016, 52, 52–76. [Google Scholar] [CrossRef]
  12. Patrizi, P. The Line 3 of the Metro of Cairo. In Geotechnical Aspects of Underground Construction in Soft Ground; Taylor & Francis Group: Oxfordshire, UK, 2012. [Google Scholar]
  13. Soomro, M.A.; Khan Bangwar, D.; Soomro, M.A.; Keerio, M.A. 3D Numerical Analysis of the Effects of an Advancing Tunnel on an Existing Loaded Pile Group. Eng. Technol. Appl. Sci. Res. 2018, 8, 2520–2525. [Google Scholar] [CrossRef]
  14. Ayasrah, M.M.; Qiu, H.; Zhang, X. Influence of cairo metro tunnel excavation on pile deep foundation of the adjacent underground structures: Numerical study. Symmetry 2021, 13, 426. [Google Scholar] [CrossRef]
  15. Soomro, M.A.; Mangi, N.; Memon, A.H.; Mangnejo, D.A. Responses of high-rise building resting on piled raft to adjacent tunnel at different depths relative to piles. Geomech. Eng. 2022, 29, 25–50. [Google Scholar]
  16. ACI Committee 533. Guide for Precast Concrete Tunnel Segments; American Concrete Institute: Farmington Hills, MI, USA, 2020. [Google Scholar]
  17. Elliott, K. Precast Concrete Structures; CRC Press: Boca Raton, FL, USA, 2002. [Google Scholar]
  18. Yang, Y.; Zhou, B.; Xie, X.; Liu, C. Characteristics and causes of cracking and damage of shield tunnel segmented lining in construction stage–a case study in Shanghai soft soil. Eur. J. Environ. Civ. Eng. 2019, 22 (Suppl. S1), s213–s227. [Google Scholar] [CrossRef]
  19. Sharghi, M.; Chakeri, H.; Afshin, H.; Dias, D. Analysis of the Possible Cracking and Damages of Tunnel Lining Segments during Installing Stage. Soil Mech. Found. Eng. 2021, 58, 287–294. [Google Scholar] [CrossRef]
  20. Balta, G.K.; Dikmen, I.; Birgonul, M.T. Bayesian network based decision support for predicting and mitigating delay risk in TBM tunnel projects. Autom. Constr. 2021, 129, 103819. [Google Scholar] [CrossRef]
  21. Guo, K.; Zhang, L. Multi-source information fusion for safety risk assessment in underground tunnels. Knowl.-Based Syst. 2021, 227, 107210. [Google Scholar] [CrossRef]
  22. de Ru, W.G.; Eloff, J.H.P. Risk analysis modelling with the use of fuzzy logic. Comput. Secur. 1996, 15, 239–248. [Google Scholar]
  23. Zhang, L.; Wu, X.; Qin, Y.; Skibniewski, M.J.; Liu, W. Towards a Fuzzy Bayesian Network Based Approach for Safety Risk Analysis of Tunnel-Induced Pipeline Damage. Risk Anal. 2016, 36, 278–301. [Google Scholar] [CrossRef] [PubMed]
  24. Simoes, M.G.; Kim, T. Fuzzy Modeling Approaches for the Prediction of Machine Utilization in Hard Rock Tunnel Boring Machines. In Proceedings of the 2006 IEEE Industry Applications Conference Forty-First IAS Annual Meeting, Tampa, FL, USA, 8–12 October 2006; Volume 2, pp. 947–954. [Google Scholar]
  25. Mosaad, S.A.A.; Issa, U.H.; Hassan, M.S. Risks affecting the delivery of HVAC systems: Identifying and analysis. J. Build. Eng. 2018, 16, 20–30. [Google Scholar] [CrossRef]
  26. Bai, C.; Xue, Y.; Qiu, D.; Su, M.; Ma, X.; Liu, H. Analysis of factors affecting the deformation of soft rock tunnels by data envelopment analysis and a risk assessment model. Tunn. Undergr. Sp. Technol. 2021, 116, 104111. [Google Scholar] [CrossRef]
  27. Nezarat, H.; Sereshki, F.; Ataei, M. Ranking of geological risks in mechanized tunneling by using Fuzzy Analytical Hierarchy Process (FAHP). Tunn. Undergr. Sp. Technol. 2015, 50, 358–364. [Google Scholar] [CrossRef]
  28. Hyun, K.C.; Min, S.; Choi, H.; Park, J.; Lee, I.M. Risk analysis using fault-tree analysis (FTA) and analytic hierarchy process (AHP) applicable to shield TBM tunnels. Tunn. Undergr. Sp. Technol. 2015, 49, 121–129. [Google Scholar] [CrossRef]
  29. Xiang, Y.; Liu, C.; Zhang, K.; Wu, Q. Risk analysis and management of submerged floating tunnel and its application. Procedia Eng. 2010, 4, 107–116. [Google Scholar] [CrossRef] [Green Version]
  30. Barton, N. Reducing risk in long deep tunnels by using TBM and drill-and-blast methods in the same project–the hybrid solution. J. Rock Mech. Geotech. Eng. 2012, 4, 115–126. [Google Scholar] [CrossRef] [Green Version]
  31. Fan, S.; Zhou, Q. Multi-agent system for tunnel-settlement monitoring: A case study in Shanghai. Displays 2021, 69, 102041. [Google Scholar] [CrossRef]
  32. Mohammadi, H.; Azad, A. Prediction of ground settlement and the corresponding risk induced by tunneling: An application of rock engineering system paradigm. Tunn. Undergr. Sp. Technol. 2021, 110, 103828. [Google Scholar] [CrossRef]
  33. Naghadehi, M.Z.; Benardos, A.; Javdan, R.; Tavakoli, H.; Rojhani, M. The probabilistic time and cost risk analysis of a challenging part of an urban tunneling project. Tunn. Undergr. Sp. Technol. 2016, 58, 11–29. [Google Scholar] [CrossRef]
  34. Nývlt, O.; Prívara, S.; Ferkl, L. Probabilistic risk assessment of highway tunnels. Tunn. Undergr. Sp. Technol. 2011, 26, 71–82. [Google Scholar] [CrossRef]
  35. Benekos, I.; Diamantidis, D. On risk assessment and risk acceptance of dangerous goods transportation through road tunnels in Greece. Saf. Sci. 2017, 91, 1–10. [Google Scholar] [CrossRef]
  36. Pribyl, O.; Pribyl, P.; Horak, T. System for Deterministic Risk Assessment in Road Tunnels. Procedia Eng. 2017, 192, 336–341. [Google Scholar] [CrossRef]
  37. Schlosser, F.; Rázga, M.; Danišovič, P. Risk Analysis in Road Tunnels. Procedia Eng. 2014, 91, 469–474. [Google Scholar] [CrossRef] [Green Version]
  38. You, K.; Park, Y.; Lee, J.S. Risk analysis for determination of a tunnel support pattern. Tunn. Undergr. Sp. Technol. 2005, 20, 479–486. [Google Scholar] [CrossRef]
  39. Wu, J.; Bai, Y.; Fang, W.; Zhou, R.; Reniers, G.; Khakzad, N. An Integrated Quantitative Risk Assessment Method for Urban Underground Utility Tunnels. Reliab. Eng. Syst. Saf. 2021, 213, 107792. [Google Scholar] [CrossRef]
  40. Ou, G.Z.; Jiao, Y.Y.; Zhang, G.H.; Zou, J.P.; Tan, F.; Zhang, W.S. Collapse risk assessment of deep-buried tunnel during construction and its application. Tunn. Undergr. Sp. Technol. 2021, 115, 104019. [Google Scholar] [CrossRef]
  41. Qu, X.; Meng, Q.; Yuanita, V.; Wong, Y.H. Design and implementation of a quantitative risk assessment software tool for Singapore road tunnels. Expert Syst. Appl. 2011, 38, 13827–13834. [Google Scholar] [CrossRef]
  42. Špačková, O.; Novotná, E.; Šejnoha, M.; Šejnoha, J. Probabilistic models for tunnel construction risk assessment. Adv. Eng. Softw. 2013, 62, 72–84. [Google Scholar] [CrossRef]
  43. Aneziris, O.N.; Papazoglou, I.A.; Kallianiotis, D. Occupational risk of tunneling construction. Saf. Sci. 2010, 48, 964–972. [Google Scholar] [CrossRef]
  44. Baji, H.; Li, C.Q.; Scicluna, S.; Dauth, J. Risk-cost optimised maintenance strategy for tunnel structures. Tunn. Undergr. Sp. Technol. 2017, 69, 72–84. [Google Scholar] [CrossRef]
  45. Wang, F.; Li, H.; Dong, C.; Ding, L. Knowledge representation using non-parametric Bayesian networks for tunneling risk analysis. Reliab. Eng. Syst. Saf. 2019, 191, 106529. [Google Scholar] [CrossRef]
  46. Bjelland, H.; Aven, T. Treatment of uncertainty in risk assessments in the Rogfast road tunnel project. Saf. Sci. 2013, 55, 34–44. [Google Scholar] [CrossRef]
  47. Shuping, J.; Qinxi, L.; Jianjun, L.; Gengren, C.; Xiang, C. Research on Risk Sensitivity of Submerged Floating Tunnel Based on Analytic Hierarchy Process. Procedia Eng. 2016, 166, 255–265. [Google Scholar] [CrossRef]
  48. Xiang, Y.; Liu, C.; Chao, C.; Liu, H. Risk analysis and assessment of public safety of Submerged Floating Tunnel. Procedia Eng. 2010, 4, 117–125. [Google Scholar] [CrossRef] [Green Version]
  49. Zhou, R.; Fang, W.; Wu, J. A risk assessment model of a sewer pipeline in an underground utility tunnel based on a Bayesian network. Tunn. Undergr. Sp. Technol. 2020, 103, 103473. [Google Scholar] [CrossRef]
  50. Wu, Z.; Wu, S.; Cheng, Z. Discussion and application of a risk assessment method for spalling damage in a deep hard-rock tunnel. Comput. Geotech. 2020, 124, 103632. [Google Scholar] [CrossRef]
  51. Kirytopoulos, K.; Ntzeremes, P.; Kazaras, K. Tunnels, Safety, and Security Issues—Risk Assessment for Road Tunnels: State-of-the-Art Practices and Challenges. In International Encyclopedia of Transportation; Vickerman, R., Ed.; Elsevier: Oxford, UK, 2021; pp. 713–718. [Google Scholar]
  52. Zhang, L.; Wu, X.; Zhu, H.; AbouRizk, S.M. Perceiving safety risk of buildings adjacent to tunneling excavation: An information fusion approach. Autom. Constr. 2017, 73, 88–101. [Google Scholar] [CrossRef]
  53. Beard, A.N. Tunnel safety, risk assessment and decision-making. Tunn. Undergr. Sp. Technol. 2010, 25, 91–94. [Google Scholar] [CrossRef]
  54. Burd, H.J.; Yiu, W.N.; Acikgoz, S.; Martin, C.M. Soil-foundation interaction model for the assessment of tunnelling-induced damage to masonry buildings. Tunn. Undergr. Sp. Technol. 2022, 119, 104208. [Google Scholar] [CrossRef]
  55. Pan, F.; Zhang, L.; Wang, J.; Ma, C.; Yang, J.; Qi, J. Lane-Changing Risk Analysis in Undersea Tunnels Based on Fuzzy Inference. IEEE Access 2022, 8, 19512–19520. [Google Scholar] [CrossRef]
  56. Luis Rangel, J.; Iturrarán-Viveros, U.; Gustavo Ayala, A.; Cervantes, F. Tunnel stability analysis during construction using a neuro-fuzzy system. Int. J. Numer. Anal. Methods Geomech. 2005, 29, 1433–1456. [Google Scholar] [CrossRef]
  57. Shi, S.S.; Li, S.C.; Li, L.P.; Zhou, Z.Q.; Wang, J. Advance optimized classification and application of surrounding rock based on fuzzy analytic hierarchy process and Tunnel Seismic Prediction. Autom. Constr. 2014, 37, 217–222. [Google Scholar] [CrossRef]
  58. Fairhurst, C.; Lin, D. Fuzzy Methodology in Tunnel Support Design. In Proceedings of the 26th US Symposium on Rock Mechanics (USRMS), Rapid City, SD, USA, 26–28 June 1985. [Google Scholar]
  59. Sun, J.; Liu, B.; Chu, Z.; Chen, L.; Li, X. Tunnel collapse risk assessment based on multistate fuzzy Bayesian networks. Qual. Reliab. Eng. Int. 2018, 34, 1646–1662. [Google Scholar] [CrossRef]
  60. Zhang, G.H.; Chen, W.; Jiao, Y.Y.; Wang, H.; Wang, C.T. A failure probability evaluation method for collapse of drill-and-blast tunnels based on multistate fuzzy Bayesian network. Eng. Geol. 2020, 276, 105752. [Google Scholar] [CrossRef]
  61. Karakaş, E. The control of highway tunnel ventilation using fuzzy logic. Eng. Appl. Artif. Intell. 2003, 16, 717–721. [Google Scholar] [CrossRef]
  62. Chu, B.; Kim, D.; Hong, D.; Park, J.; Chung, J.T.; Chung, J.-H.; Kim, T.-H. GA-based fuzzy controller design for tunnel ventilation systems. Autom. Constr. 2008, 17, 130–136. [Google Scholar] [CrossRef]
  63. Bogdan, S.; Birgmajer, B.; Kovačić, Z. Model predictive and fuzzy control of a road tunnel ventilation system. Transp. Res. Part C Emerg. Technol. 2008, 16, 574–592. [Google Scholar] [CrossRef]
  64. Chen, P.H.; Lai, J.H.; Lin, C.T. Application of fuzzy control to a road tunnel ventilation system. Fuzzy Sets Syst. 1998, 100, 9–28. [Google Scholar] [CrossRef]
  65. Funabashi, M.; Aoki, I.; Yahiro, M.; Inoue, H. A fuzzy model based control scheme and its application to a road tunnel ventilation system. In Proceedings of the IECON ’91: 1991 International Conference on Industrial Electronics, Control and Instrumentation, Kobe, Japan, 28 October–1 November 1991; Volume 2, pp. 1596–1601. [Google Scholar]
  66. Lin, L.; Xia, Y.; Wu, D. A hybrid fuzzy multiple criteria decision-making approach for comprehensive performance evaluation of tunnel boring machine disc cutter. Comput. Ind. Eng. 2020, 149, 106793. [Google Scholar] [CrossRef]
  67. Grima, M.A.; Bruines, P.A.; Verhoef, P.N.W. Modeling tunnel boring machine performance by neuro-fuzzy methods. Tunn. Undergr. Sp. Technol. 2000, 15, 259–269. [Google Scholar] [CrossRef]
  68. Shi, M.; Zhang, T.; Zhang, L.; Sun, W.; Song, X. A fuzzy c-means algorithm based on the relationship among attributes of data and its application in tunnel boring machine. Knowl.-Based Syst. 2020, 191, 105229. [Google Scholar] [CrossRef]
  69. Yazdani-Chamzini, A.; Yakhchali, S.H. Tunnel Boring Machine (TBM) selection using fuzzy multicriteria decision making methods. Tunn. Undergr. Sp. Technol. 2012, 30, 194–204. [Google Scholar] [CrossRef]
  70. Song, X.; Shi, M.; Wu, J.; Sun, W. A new fuzzy c-means clustering-based time series segmentation approach and its application on tunnel boring machine analysis. Mech. Syst. Signal Process. 2019, 133, 106279. [Google Scholar] [CrossRef]
  71. Xu, Z.S.; Wu, A.Y.; Shi, S.L.; Li, X.K.; Li, G.H. Analysis of road tunnel fire risk based on Fuzzy Fault Tree method. In Proceedings of the 2011 International Conference on Electric Information and Control Engineering, Wuhan, China, 15–17 April 2011. [Google Scholar]
  72. Zhang, C.Y.; Tao, G.; Zhang, L.J. Fire Safety Analysis of Nanjing Yangtze River Tunnel Based on Fault Tree and Triangle Fuzzy Theory. Procedia Eng. 2018, 211, 979–985. [Google Scholar] [CrossRef]
  73. Gao, J.P.; Xu, Z.S.; Liu, D.L.; Cao, H.H. Application of the Model based on Fuzzy Consistent Matrix and AHP in the Assessment of Fire Risk of Subway Tunnel. Procedia Eng. 2014, 71, 591–596. [Google Scholar] [CrossRef] [Green Version]
  74. Meng, Q.; Qu, X. Uncertainty Propagation in Quantitative Risk Assessment Modeling for Fire in Road Tunnels. IEEE Trans. Syst. Man. Cybern. Part C Appl. Rev. 2012, 42, 1454–1464. [Google Scholar] [CrossRef]
  75. Issa, U.H.; Mosaad, S.A.; Hassan, M.S. Evaluation and selection of construction projects based on risk analysis. Structures 2020, 27, 361–370. [Google Scholar] [CrossRef]
  76. Issa, U.H. Developing an Assessment Model for Factors Affecting the Quality in the Construction Industry. J. Civ. Eng. Archit. 2012, 6, 364–371. [Google Scholar]
  77. Issa, U.; Sharaky, I.; Alwetaishi, M.; Balabel, A.; Shamseldin, A.; Abdelhafiz, A.; Al-Surf, M.; Al-Harthi, M.; Osman, M.M.A. Developing and Applying a Model for Evaluating Risks Affecting Greening Existing Buildings. Sustainability 2021, 13, 6403. [Google Scholar] [CrossRef]
  78. Tukey, J.W. Exploratory Data Analysis; Addison-Wesley Publishing Company: Boston, MA, USA, 1977. [Google Scholar]
Figure 1. RAMTE Model layout.
Buildings 13 01757 g001
Figure 2. The proposed membership function for RAMTE.
Buildings 13 01757 g002
Figure 3. The values of the correlation coefficient for RAMTE input indices.
Buildings 13 01757 g003
Figure 4. The values of the correlation coefficient for RAMTE output indices.
Buildings 13 01757 g004
Figure 5. Boxplot analysis comparing the inputs.
Buildings 13 01757 g005
Figure 6. Boxplot analysis comparing the outputs.
Buildings 13 01757 g006
Figure 7. Boxplot analysis comparing the risk indices for different activity groups. (a) Cost risk index values for different activity groups; (b) Time risk index values for different activity groups; (c) Quality risk index values for different activity groups; (d) Safety risk index values for different activity groups.
Buildings 13 01757 g007
Figure 8. Boxplot analysis comparing the risk indices for activity A01.
Buildings 13 01757 g008
Figure 9. Boxplot analysis comparing the risk indices for activity A02.
Buildings 13 01757 g009
Figure 10. Boxplot analysis comparing the risk indices for activity A03.
Buildings 13 01757 g010
Figure 11. Boxplot analysis comparing the risk indices for activity A04.
Buildings 13 01757 g011
Table 1. Risk factors and risk activity groups related to the tunneling execution process.
Risk Factor No.Activity (1): Thrust and Reception Shaft Installation.
RF01Errors and omissions in the structural analysis and design phase
RF02Hiring unqualified laborers for the shaft sinking process
RF03Inaccurate surveying work for shaft steering
RF04Structural damage of the shaft’s walls during handling
RF05Obstacles in the shaft driving path
RF06Inappropriate sinking due to applied force magnitude
RF07The collapse of the shaft’s unprotected cutting edge due to soil resistance
RF08Soil boiling during shaft internal space excavation
RF09Complexity in bottom sealing concrete casting under groundwater level
Risk Factor No. Activity (2): Machine Setup and Break-in.
RF10Complicated submittal approval process
RF11Shortage in power resources for machine break-in
RF12Complicated site conditions (railways existence or other dynamic source)
RF13Hiring inexperienced workers with the break-in complexity
RF14Shaft wall damage during break-in
RF15Groundwater or soil inflow during break-in
RF16Insufficient supporting wall stiffness
Risk Factor No. Activity (3): Machine Progression and Lining Placing.
RF17Inadequate inspection procedures for the rings
RF18Insufficient storage space for rings and equipment
RF19Violation of instructions and standards during rings installation
RF20Deficient inspection procedure for insulation
RF21Conflict between technical geological report and the ground nature
RF22Errors and omissions in the tunnel structural design
RF23Inappropriate machine face pressure exertion
RF24Behind-schedule material delivering
RF25Machine breakdown
Risk Factor No. Activity (4): Machine Break-out and Removal.
RF26Inexact surveying work for machine steering
RF27Hiring inexperienced workers with the break-out complexity
RF28Shaft wall damage during break-out
RF29Groundwater or soil inflow during break-out
RF30Inadequate thrusting power for the machine break-out
RF31Insufficient space for machine exit
RF32Handling errors during machine removal
Table 2. Input and output linguistic terms used in the RAMTE.
Inputs/Output Selected Linguistic Terms
PIRareUnlikelyModerateLikelyVery Likely
IITC/IITT/IITQ/IITSVery LowLowMediumHighVery High
RITC/RITT/RITQ/RITSTrivialMinorModerateMajorExtreme
Table 3. FAMs used in RAMTE.
ScaleImpact on Tunnelling COST/TIME/QUALITY/SAFETY of
Very LowLowMediumHighVery High
Probability RareTrivialTrivialMinorMinorModerate
UnlikelyTrivialMinorMinorModerateModerate
ModerateMinorMinorModerateModerateMajor
LikelyMinorModerateModerateMajorExtreme
very likelyModerateModerateMajorExtremeExtreme
Table 4. Input and output indices values for RAMTE and risk factor rankings.
Risk Fcator No.Model InputsModel OutputsRanking Due to
PIIITCIITTIITQIITSRITCRITTRITQRITScost TimeQualitySafety
10.60.710.60.470.730.6050.60.4520.61512162410
20.60.530.610.730.390.5480.60.6150.416151024
30.420.670.830.60.330.4570.6040.410.34324132527
40.370.530.480.730.630.3760.3760.530.42429311721
50.380.480.560.510.410.3840.3840.3840.38728302826
60.660.70.690.660.530.6520.6520.6520.53976616
70.570.870.870.760.80.7120.7120.6090.64544116
80.510.690.810.50.780.5140.60.50.57519141913
90.540.570.550.620.520.5520.5490.5540.52715191517
100.320.460.770.460.260.3270.530.3270.28132213029
110.660.630.640.550.760.6240.6330.5580.679118135
120.70.550.540.370.550.5580.5480.50.55814202014
130.710.660.650.70.570.6560.6470.7050.58167512
140.630.730.680.860.640.6390.6240.730.62410947
150.730.840.860.80.820.7930.820.7550.7722123
160.490.710.760.460.760.510.550.4520.5520182215
170.470.540.520.770.240.4610.4620.5580.27823241430
180.360.470.580.280.190.3670.3840.290.23730293132
190.510.730.320.830.810.5370.3270.6190.61732911
200.430.510.580.750.390.4240.4220.5450.39225271625
210.780.850.740.570.890.8060.7410.6240.871381
220.460.870.840.520.840.6450.620.4520.62910238
230.550.610.50.670.870.5660.50.5580.6971322124
240.350.380.60.240.220.3630.40.2710.25931283231
250.470.90.90.730.70.6590.6590.5270.5551818
260.40.580.760.580.450.40.5590.40.427172623
270.680.520.620.630.350.5270.6160.6240.4721812719
280.620.770.680.890.680.6510.6160.7770.61681119
290.760.830.840.780.860.7820.7930.7410.823232
300.480.640.620.530.630.4710.4690.4730.4722232120
310.260.610.660.520.270.4080.4520.3270.28126252928
320.40.70.660.520.470.50.4410.40.421262722
Table 5. Correlation coefficient factors for RAMTE verification process.
Correlated IndicesSIC and IITCSIT and IITTSIQ and IITQSIS and IITS
Correlation
Coefficient Factors
0.9650.9610.9820.984
Table 6. Mean values for all risk indices.
ActivityMean Value
RITCRITTRITQRITS
Activity A010.5330.5640.5230.495
Activity A020.5870.6210.5750.578
Activity A030.5360.5020.4940.495
Activity A040.5340.5640.5350.494
Table 7. Top ten key risk factors affecting tunnel execution activities.
RankFactor No.RITCActivityFactor No.RITTActivityFactor No.RITQActivityFactor No.RITSActivity
1210.806(3)150.82(2)280.777(4)210.87(3)
2150.793(2)290.793(4)150.755(2)290.82(4)
3290.782(4)210.741(3)290.741(4)150.772(2)
470.712(1)70.712(1)140.73(2)230.697(3)
5250.659(3)250.659(3)130.705(2)110.679(2)
6130.656(2)60.652(1)60.652(1)70.645(1)
760.652(1)130.647(2)270.624(4)140.624(2)
8280.651(4)110.633(2)210.624(3)220.62(3)
9220.645(3)140.624(2)190.619(3)280.616(4)
10140.639(2)220.62(3)20.615(1)10.615(1)
Disclaimer/Publisher’s Note: The statements, opinions and data contained in all publications are solely those of the individual author(s) and contributor(s) and not of MDPI and/or the editor(s). MDPI and/or the editor(s) disclaim responsibility for any injury to people or property resulting from any ideas, methods, instructions or products referred to in the content.

