Article

Experimental and DIC Study of Reinforced Concrete Beams Strengthened by Basalt and Carbon Textile Reinforced Mortars in Flexure

Department of Civil Engineering, Xi’an Jiaotong-Liverpool University, Suzhou 215123, China
*
Author to whom correspondence should be addressed.
Buildings 2023, 13(7), 1765; https://doi.org/10.3390/buildings13071765
Submission received: 20 May 2023 / Revised: 1 July 2023 / Accepted: 6 July 2023 / Published: 11 July 2023
(This article belongs to the Section Building Structures)

Abstract

:
This paper presents an experimental study to strengthen flexure-deficient reinforced concrete beams using textile-reinforced mortars (TRMs). A set of seven reinforced concrete beams were strengthened using basalt and carbon TRMs. The current study utilised textiles with almost similar physical properties to strengthen reinforced concrete (RC) beams. All the studied beams were strengthened at their soffit to evaluate the effectiveness of textile fibres, the number of layers and the strengthening configuration. The experimental results showed that beams strengthened using carbon and basalt textile-reinforced mortar performed equally better in terms of overall performance with inherent textile slippage after the peak load. The flexural load capacities of the beams were strengthened with one layer, and three layers were higher when compared to the control beam. For the basalt TRM one, three and five layers registered an increment of 8.3%, 20.7% and 30.3% of ultimate strengths over the unstrengthened specimen. Similarly, for the carbon TRM one, three and five layers recorded an increment of 14.2%, 15.3% and 32.3% of ultimate strengths over the control specimen. Five-layered specimens with end U-wraps successfully mitigated premature debonding, along with registering maximum load capacity, and digital image correlation (DIC) was performed to monitor real-time crack width, crack patterns and spacing and to compare the load and displacement responses from all the tested specimens.

1. Introduction and Background

Aging infrastructure and structures affected by natural calamities like earthquakes and fire require strengthening and restoration practices to keep them in working conditions. Structural strengthening plays a vital role in maintaining existing structures safe and sound so that they serve the function for which they were built and, at the same time, contribute to the sustainable utilisation of natural resources. Textile-reinforced mortars are popular strengthening composites that have received more focus in recent years, mainly due to their excellent characteristics such as heat resistance, ease of handling and compatibility with strengthening substrates. Textile-reinforced mortars (TRMs), textile-reinforced concrete (TRC) and fabric-reinforced cementitious composites (FRCM) are similar in functionality but different in terminology. In this paper, TRM is preferred, and the same will be used subsequently. Several studies have been conducted on concrete structures using TRM as a strengthening technique [1,2,3,4,5,6,7,8]. TRMs have been applied to strengthen reinforced concrete structures that have undergone corrosion [9,10,11,12,13], flexure-deficient beams, cracked beams [14] and continuous beams [15,16]. All of these studies have highlighted the ability of TRMs to be effectively used as an alternative strengthening technique over conventional composites like fibre-reinforced polymers (FRPs). The textile fibres mainly reported in the literature are usually polyparaphenylene benzobisoxazole (PBO) [17,18,19], carbon [20,21,22], glass [23,24,25] and basalt [26,27,28]. Of the many studies reported on fibres, basalt fibres have received little attention, especially strengthening applications on concrete structures like beams, columns and slabs, as more focus is found on masonry elements. Gopinath et al. [29] conducted monotonic and fatigue tests on concrete beams strengthened using basalt textile-reinforced concrete. Their study showed little improvement in ultimate loads, whereas the strengthened beam ductility increased to 162%. It is mostly evident from studies that a strengthened member will increase the initial cracking load owing to the improved stiffness from the external strengthening composite. Generally, when concrete beams are strengthened in flexure using FRPs, the ultimate load capacity increases, and ductility is reduced significantly. However, basalt textile-reinforced mortar (BTRM) strengthening can impart significant ductility to the strengthened member, and this aspect has been studied, e.g., Elsanadeddy et al. [30]. The study reported that BTRMs were less efficient in increasing loads, but ductility was significantly enhanced compared to control beams.
Full-scale testing of BTRM strengthening was carried out by Christian Escrig et al. [31]; two beams out of their experimental campaign were strengthened using BTRM. Their study sheds light on the applicability of BTRM despite its minimal contribution to flexural moment, as mentioned before. Irshidat et al. [32] carried out studies on reinforced concrete beams strengthened with carbon nanotube mortar and reinforced with single-layered carbon and basalt textiles. They pointed out that one-layer textile-reinforced mortar led to a slight improvement in flexure capacity, while initial stiffness increased along with the textile’s rupture failure mode. BTRM was applied to strengthen one-way slabs by Lee et al. [33]. In this study, the textile fibres failed due to slippage, and sixty percent ruptured, similar to any other textile fibre. Gao et al. [34] studied the efficiency of two and three layers of basalt textile-reinforced shotcrete strengthened slabs pre-exposed to ISO fire durations. Their study reported that the ultimate strength of the strengthened slab after fire exposure increased to 68.9–193.4%.
Raoof et al. [35] strengthened medium-scaled reinforced beams deficient in tensile steel to mimic the need for strengthening, they found that basalt textiles played an important role in contributing to the flexural capacity. Recently, Koutas et al. [36] investigated medium-scale reinforced concrete beams strengthened with BTRM consisting of three and six layers of basalt textile reinforcement and two types of mortar reinforcement. The three- and six-layered specimens exhibited two kinds of failure, debonding at the concrete surface and shearing across the textile layers. Larringa et al. [37] explored using basalt textiles to strengthen low-grade concrete beams revealing a 30–200% increase in bending moment capacities.
An important cue here is that basalt textile has been applied in various numbers of layers but not systematically. An orderly study of the layer effect is required to thoroughly understand the effect of basalt textiles to develop strengthening design guidelines. Another takeaway from this short survey of the literature on BTRMs is that when they are applied on concrete members, it will generally result in less increase in ultimate load capacity. In contrast, this deficiency can be offset by its superior ductility. Hence, to understand this aspect better, the current study applied different layers on the flexural member to carry out a thorough research of basalt textile-strengthened concrete beams, which is lacking in the studies coupled with the application of digital image correlation (DIC).
The available studies on carbon textile-reinforced mortars (CTRMs) applied on reinforced concrete beams showed some interesting results, e.g., in [38,39,40] where different layers, one, two, three and through U-wrap, were applied on specimens. The one- and three-layered specimens failed due to extensive slippage, whereas the three-layered specimens debonded. The single-layered U-wrap specimens generally performed better. In another study, the layer effects of carbon textiles were studied, and the stiffness improvement was apparent post-cracking with no significant improvement before cracking [41]. In addition, the crack widths of CTRM-strengthened beams were finer and narrower due to the contribution from the external strengthening layer, which is also noticed in the current study. Similarly, CTRM, when combined with geopolymeric matrices, behaves more or less in the same manner, with textile slip noticeable in one-layered strengthened specimens and debonding at the concrete/TRM interface as the percentage of carbon textile increases [42]. Carbon textile owing to superior tensile strength debonds at the interface of concrete, but this kind of premature debonding can be eliminated with the provision of end wraps. CTRM was applied using the idea of near-surface mounting, resulting in better utilisation of the material [43,44]. The provision of bonded anchors and studs was studied to derive the full benefit of the axial stiffness of carbon textile-reinforced concrete (CTRC) strengthened at the soffit, and mixing fibres in the matrix led to the prevention of inter-laminar shearing, which is also a common failure with the TRM composite [45].
All these studies showed that under-reinforced concrete beams, when strengthened with more than three layers, resulted in debonding. Hence, an idea of limiting the textile layers according to practical needs can be sought, which cannot be observed in the studies carried out in BTRM specimens. However, this has not been confirmed for CTRM/CTRC-strengthened specimens. From that perspective, this study adds to the current knowledge on the crack morphology of TRM strengthening. In addition, BTRM- and CTRM-strengthened beam cracking patterns, crack width and crack location were studied using digital image correlation, which is also less reported in the literature. This study aims to provide new insights on basalt and carbon textile fibres as strengthening agents applied on under-reinforced reinforced concrete beams in flexure. The parameters studied were (i) the layer effect (one layer, three layers and five layers), (ii) strengthening configuration (soffit strengthening, soffit strengthened with end U-wraps), (iii) the type of textile (basalt and carbon), (iv) crack widths, spacing, location and distribution using DIC and (v) experimental load versus displacement validation using DIC.

2. Experimental Programme

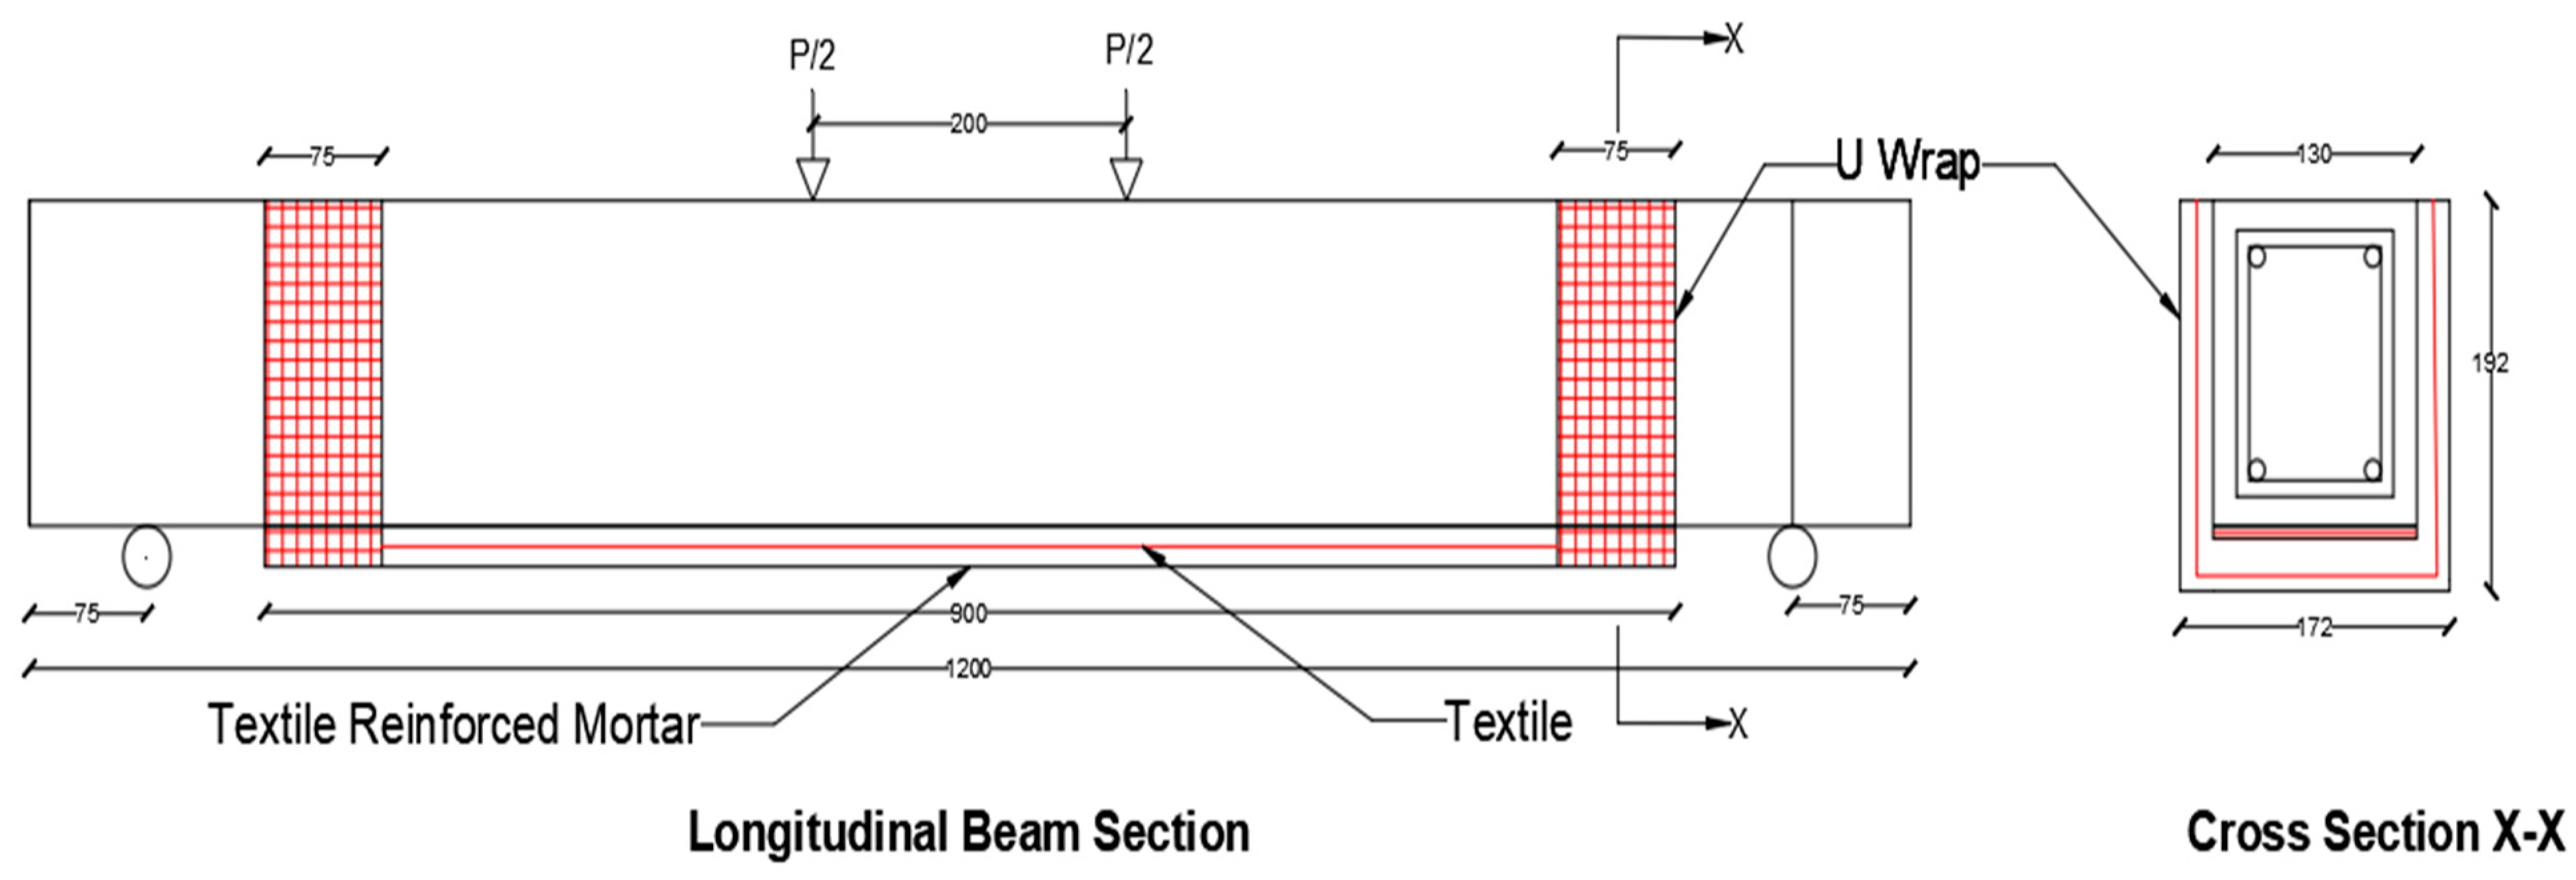
2.1. Description of the Test Specimens

A set of seven reinforced concrete beams was cast with a deficiency in flexure as per Eurocode provisions. The design tensile reinforcement required was determined to be 1.7%, but only 0.9% was provided. A concrete cover of 25 mm was adopted all around the cross-section of the reinforcement bars. Two bars of 10 mm diameter bars acted as bottom and top reinforcements, with 8 mm diameter shear links in the shear span spaced closely at 75 mm centre-to-centre (c/c) to ensure shear failure was not encountered. The constant moment region had stirrups spaced at 150 mm c/c. Figure 1 shows the typical longitudinal and cross-section of the test specimens adopted. A concrete mix design with a target compressive strength of 35 MPa resulted in 32.04 MPa (coefficient of variation (COV) 0.2) tested according to Eurocode recommendations [12]. The tensile properties of 10 mm bars were 550 MPa at yield strength and 690 MPa at ultimate strength with a 2% strain.
A soffit length of 900 mm of the beam was selected to be strengthened with BTRM and CTRM. The support bearing length was 75 mm on the sides and 75 mm unbonded length from the support to the end of TRM, ensuring the TRMs did not butt against the support after slipping, as shown in Figure 1. The TRM casting process is reported in Section 2.2. The test specimens are labelled T-LU, where T stands for the nature of the textile, L stands for the number of layers, and U indicates the presence of U-wraps.

2.2. Textile-Reinforced Mortar Properties

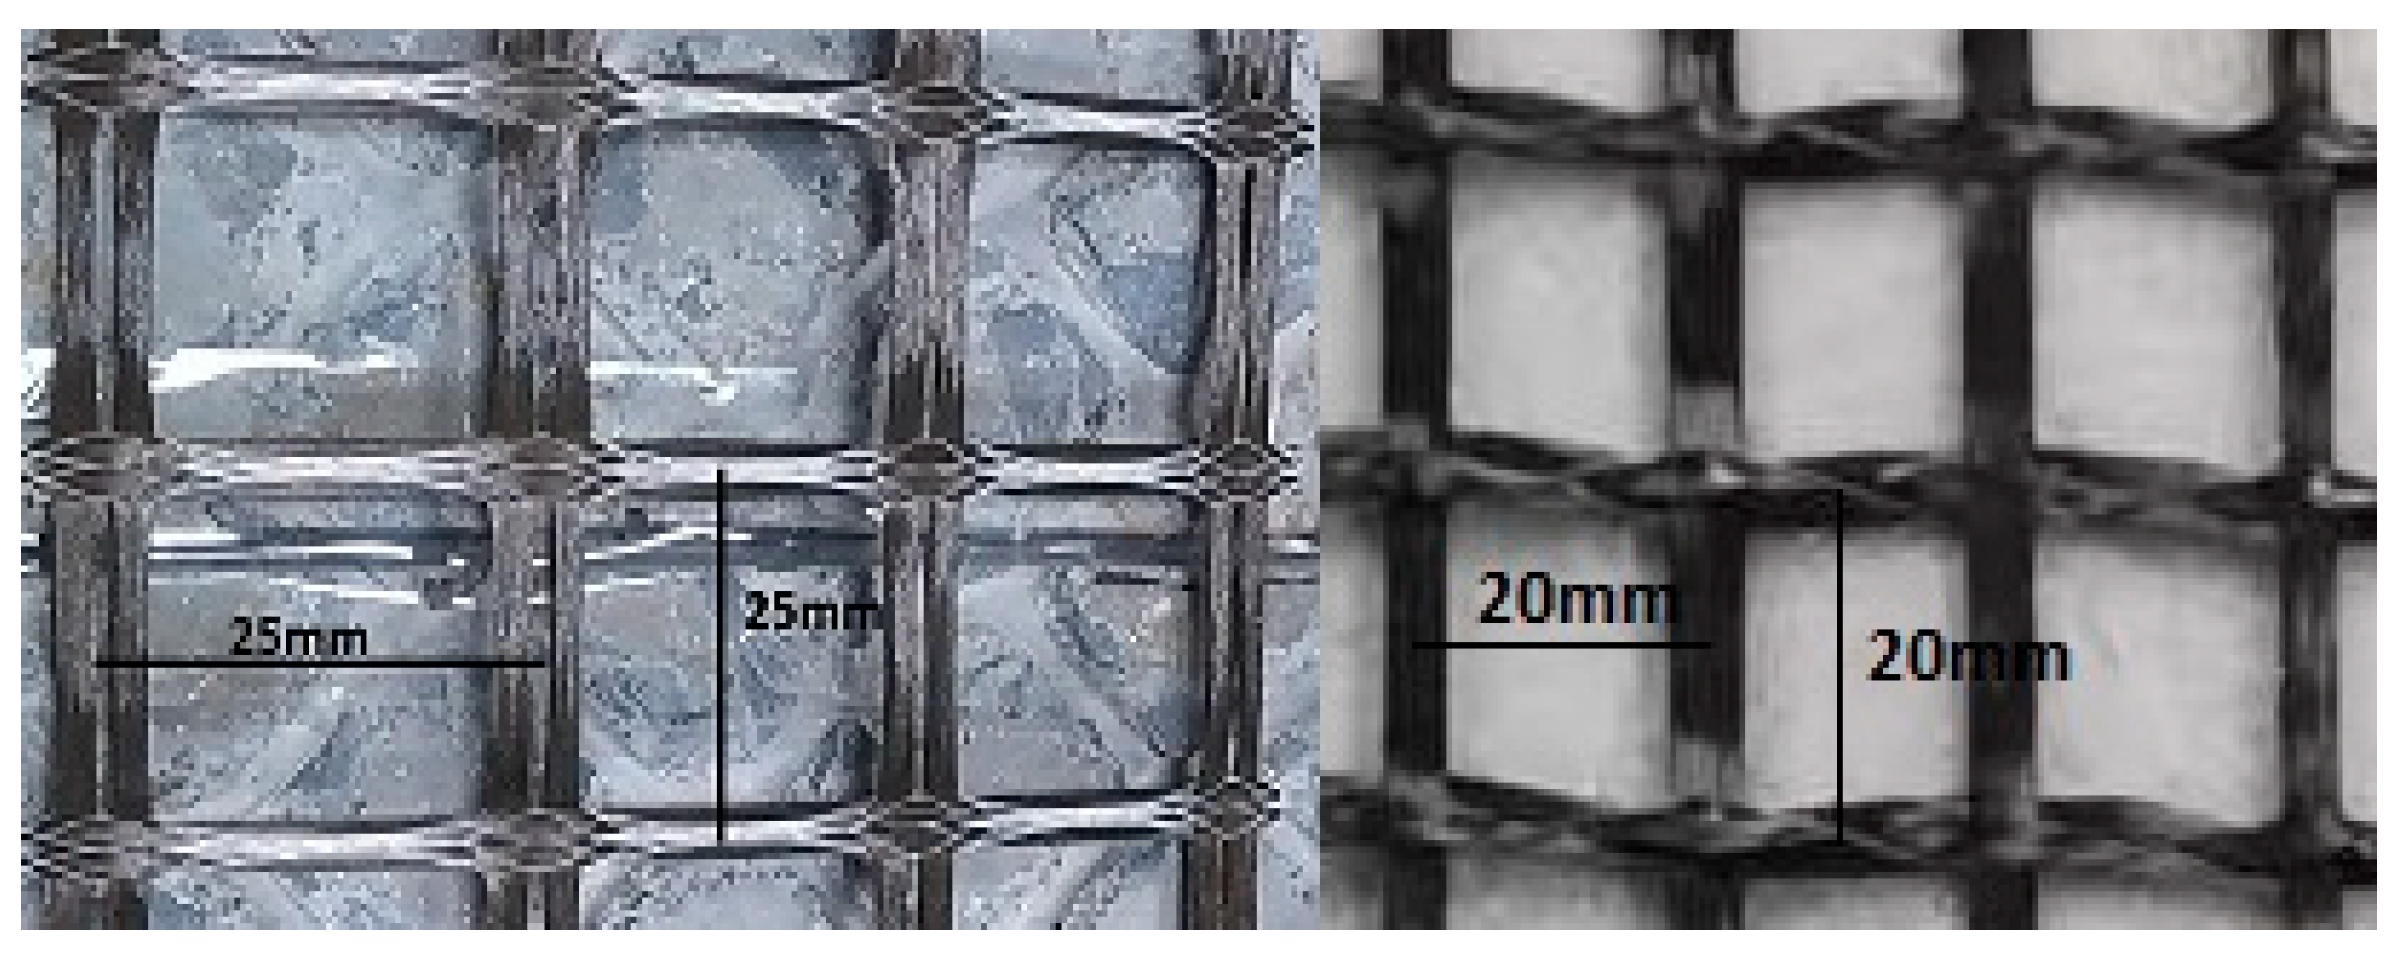
2.2.1. Textile Fibres

An uncoated carbon and a coated basalt textile fibres were chosen in this experiment to study the effect of the nature of the fibre. Textile fibre properties are reported as provided by the supplier in Table 1. Figure 2 shows the two textiles used. Basalt textile fibres came coated with SBR Latex procured from GBF manufacturers in China. The textiles were used as they were procured from the manufacturers, and the two textile grids come in different sizes, which was inevitable.

2.2.2. Polymer Cement Mortar

A commercial-polymer-based cement mortar was used as a matrix to cast the TRMs, and a water/cement (w/c) ratio of 0.19 was adopted to obtain adequate workability. The polymer mortar used had a compressive strength of 16.3 MPa (COV 0.18) and flexural strength of 5.22 MPa (COV 0.1) measured from 100 (diameter) × 200 (height) mm mortar cylinders and 160 × 40 × 40 mm mortar prisms. Finely distributed polymeric fibres were also part of polymer mortar to restrain shrinkage effects whose properties were unknown.

2.3. TRM Casting Method

Surface Preparation

Strengthened reinforced concrete beams were subjected to roughening initially with a scabber as sand-blasting option was unavailable. The rough scabbed surface was grooved with a hand-held grinder to form better grips between TRMs and concrete substrate. Finally, the treated surface was cleaned with a pressurised water jet to remove dust and loose mortar-aggregate debris before applying TRMs. The application procedure is illustrated in Figure 3a–e.
The prepared surface was pre-wetted with water, and the first layer of mortar of about 3 mm thickness was applied. Plywood guides attached with calculated TRM thickness on either side of the beam served in holding the applied mortar, as seen in Figure 3(c-1,c-2). The textile was placed on the first layer, slightly pressed so that mortar would rise up throughout the textile grid (Figure 3d,e). After this final layer of the mortar was applied, the surface was levelled off with a trowel. Thin plastic sheets covered the freshly laid TRMs to keep moisture from escaping. The TRM layers were cured with a wet cotton cloth for 28 days. Textile U-wraps were applied on five-layered specimens on the two far ends of the soffit of the strengthened beams, a 75 mm wide U-wrap was chosen, making sure at least four textile rovings were present during load transfer as shown in Figure 3(c-2). U-wraps were applied similarly to soffit textiles, and vertical plywood guides ensured the TRM stayed straight, as shown in Figure 3(c-2). A typical arrangement of a specimen strengthened with U-wrap is shown in Figure 4.

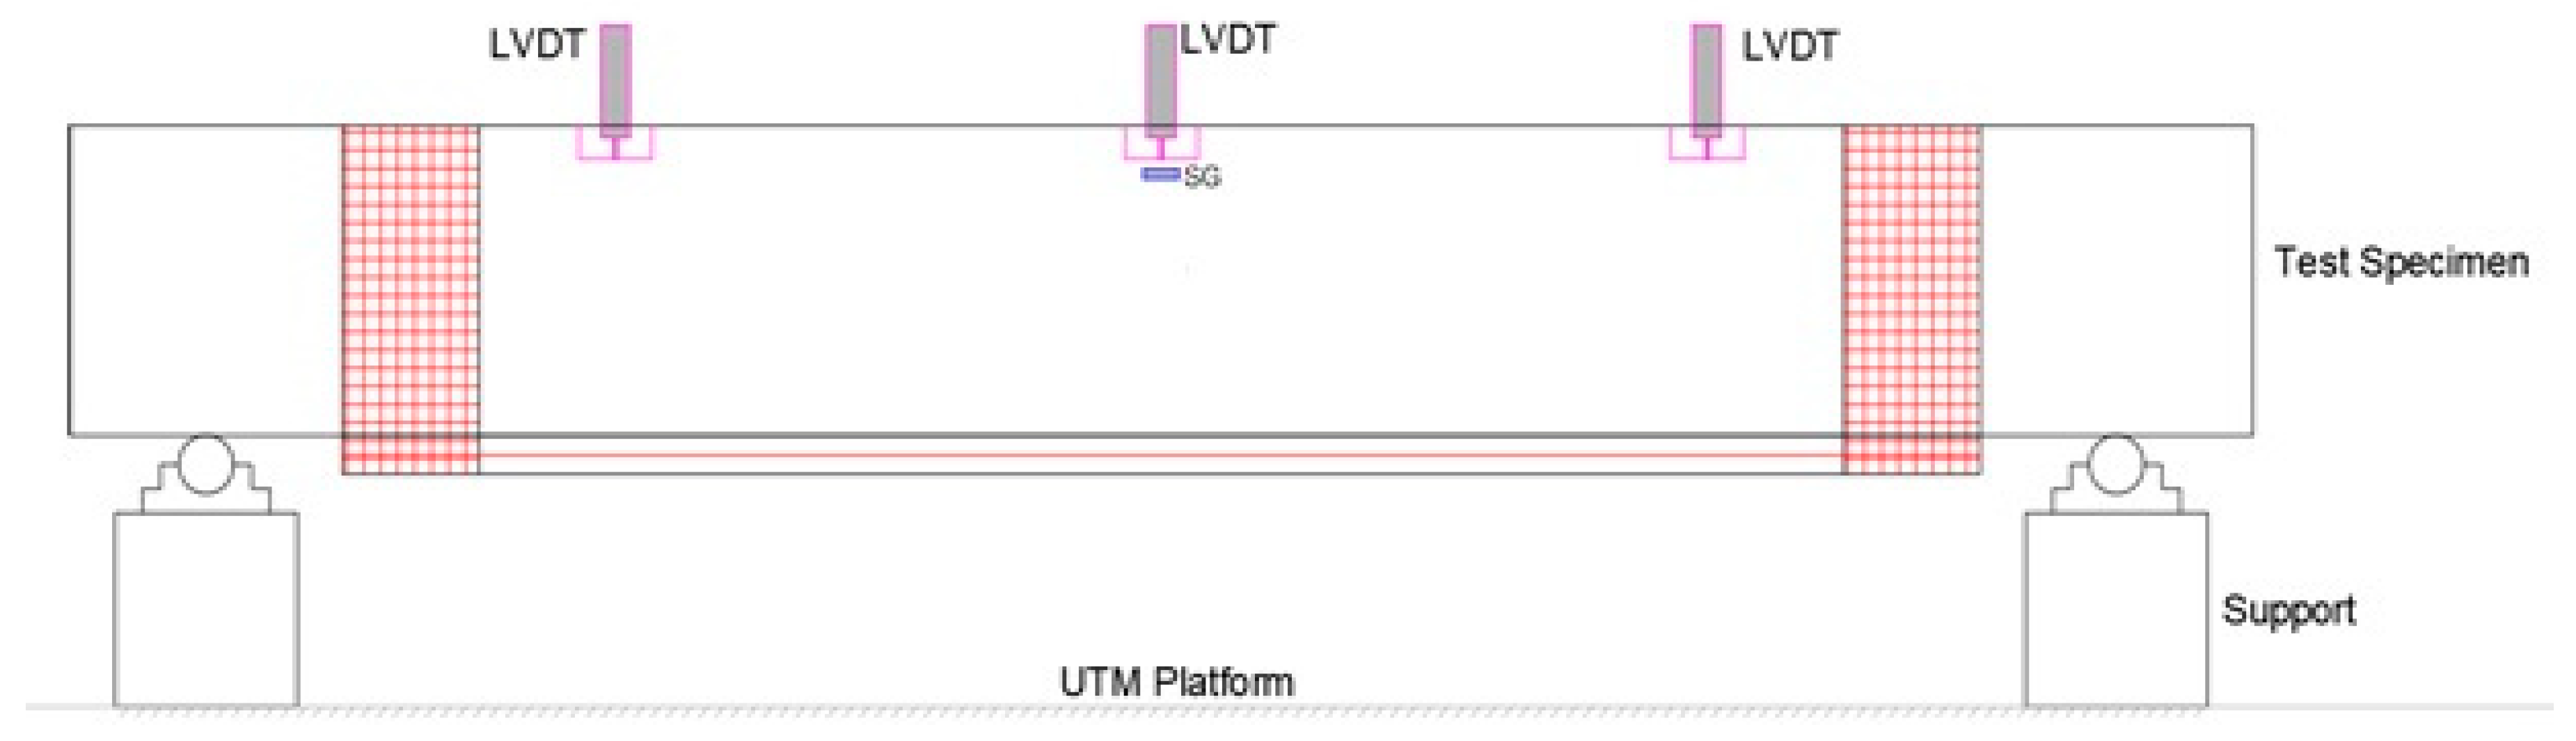
3. Experimental Setup and Loading Method

A 30 T universal testing machine was used to test the control and strengthened beams under four-point bending, as shown in Figure 4. The beams cast were 1200 mm in length and 130 mm × 165 mm deep in cross-section. The support span was 1050 mm with 75 mm bearing length, and the total length of TRMs applied was 900 mm. The applied loading span was 200 mm. Three LVDTs were used to record displacement sustained by the specimens during loading, spaced at the middle and at one-third length of the beam span, as shown in Figure 5. A 5 mm length strain gauge was attached to the tensile reinforcement bars to record strain measurements during loading, but the strain output was not consistent. Loading on the specimens was applied monotonically at a speed of 0.5 mm/second, and the corresponding load-displacement data were continuously recorded at a 5 Hz frequency using a digital data logger. In addition to this arrangement, DIC was carried out and is reported in Section 3.1.

3.1. Digital Image Correlation

Digital image correlation was carried out to study the crack pattern, width and spacing along with the load response of the tested beams. A speckle pattern was created using black and white matte spray paint to obtain a random distribution of black dots, as shown in Figure 6. One surface of the beam with nearly plain surfaces with less honeycomb was selected to apply the speckle pattern. In contrast, the other side of the beam was instrumented with LVDTs. The chosen surface was cleaned with a wire brush to remove dust, followed by cleaning with a cloth. White matte paint was first applied evenly over the selected surface, and another coat of white matte paint was applied to make the surface well-coated. When using the white paint, black matte paint was sprayed almost 500 mm from the surface to ensure enough speckles were created and well distributed throughout the selected surface. The speckled surface was allowed to dry for about half an hour. A 24.2 MegaPixel Sony Alpha ILCE-6600 mirrorless DSLR camera (Japan) was used to capture pictures of the test specimens at an interval of 10 s throughout the experiment. The camera was placed at 1.2 m from the test specimen to obtain a sharp focus supported on a tripod. The experimental time was recorded to match the picture-snapping time, and the start time of the experiment was synchronised with the applied load from the UTM, the displacements measured from LVDTs and the captured pictures. The captured images were transferred directly to a laptop using ImagingEdge, a software from Sony, to transfer photos from the camera instantaneously after snapping them. Two artificial light sources were used to provide white light during the testing period. The light sources were placed in front of the specimens, and a thin opaque plastic sheet was used to prevent glare on the specimen surface and to spread the light on the region of interest; Figure 7 illustrates the loading and DIC setup utilised.

4. Results and Discussion

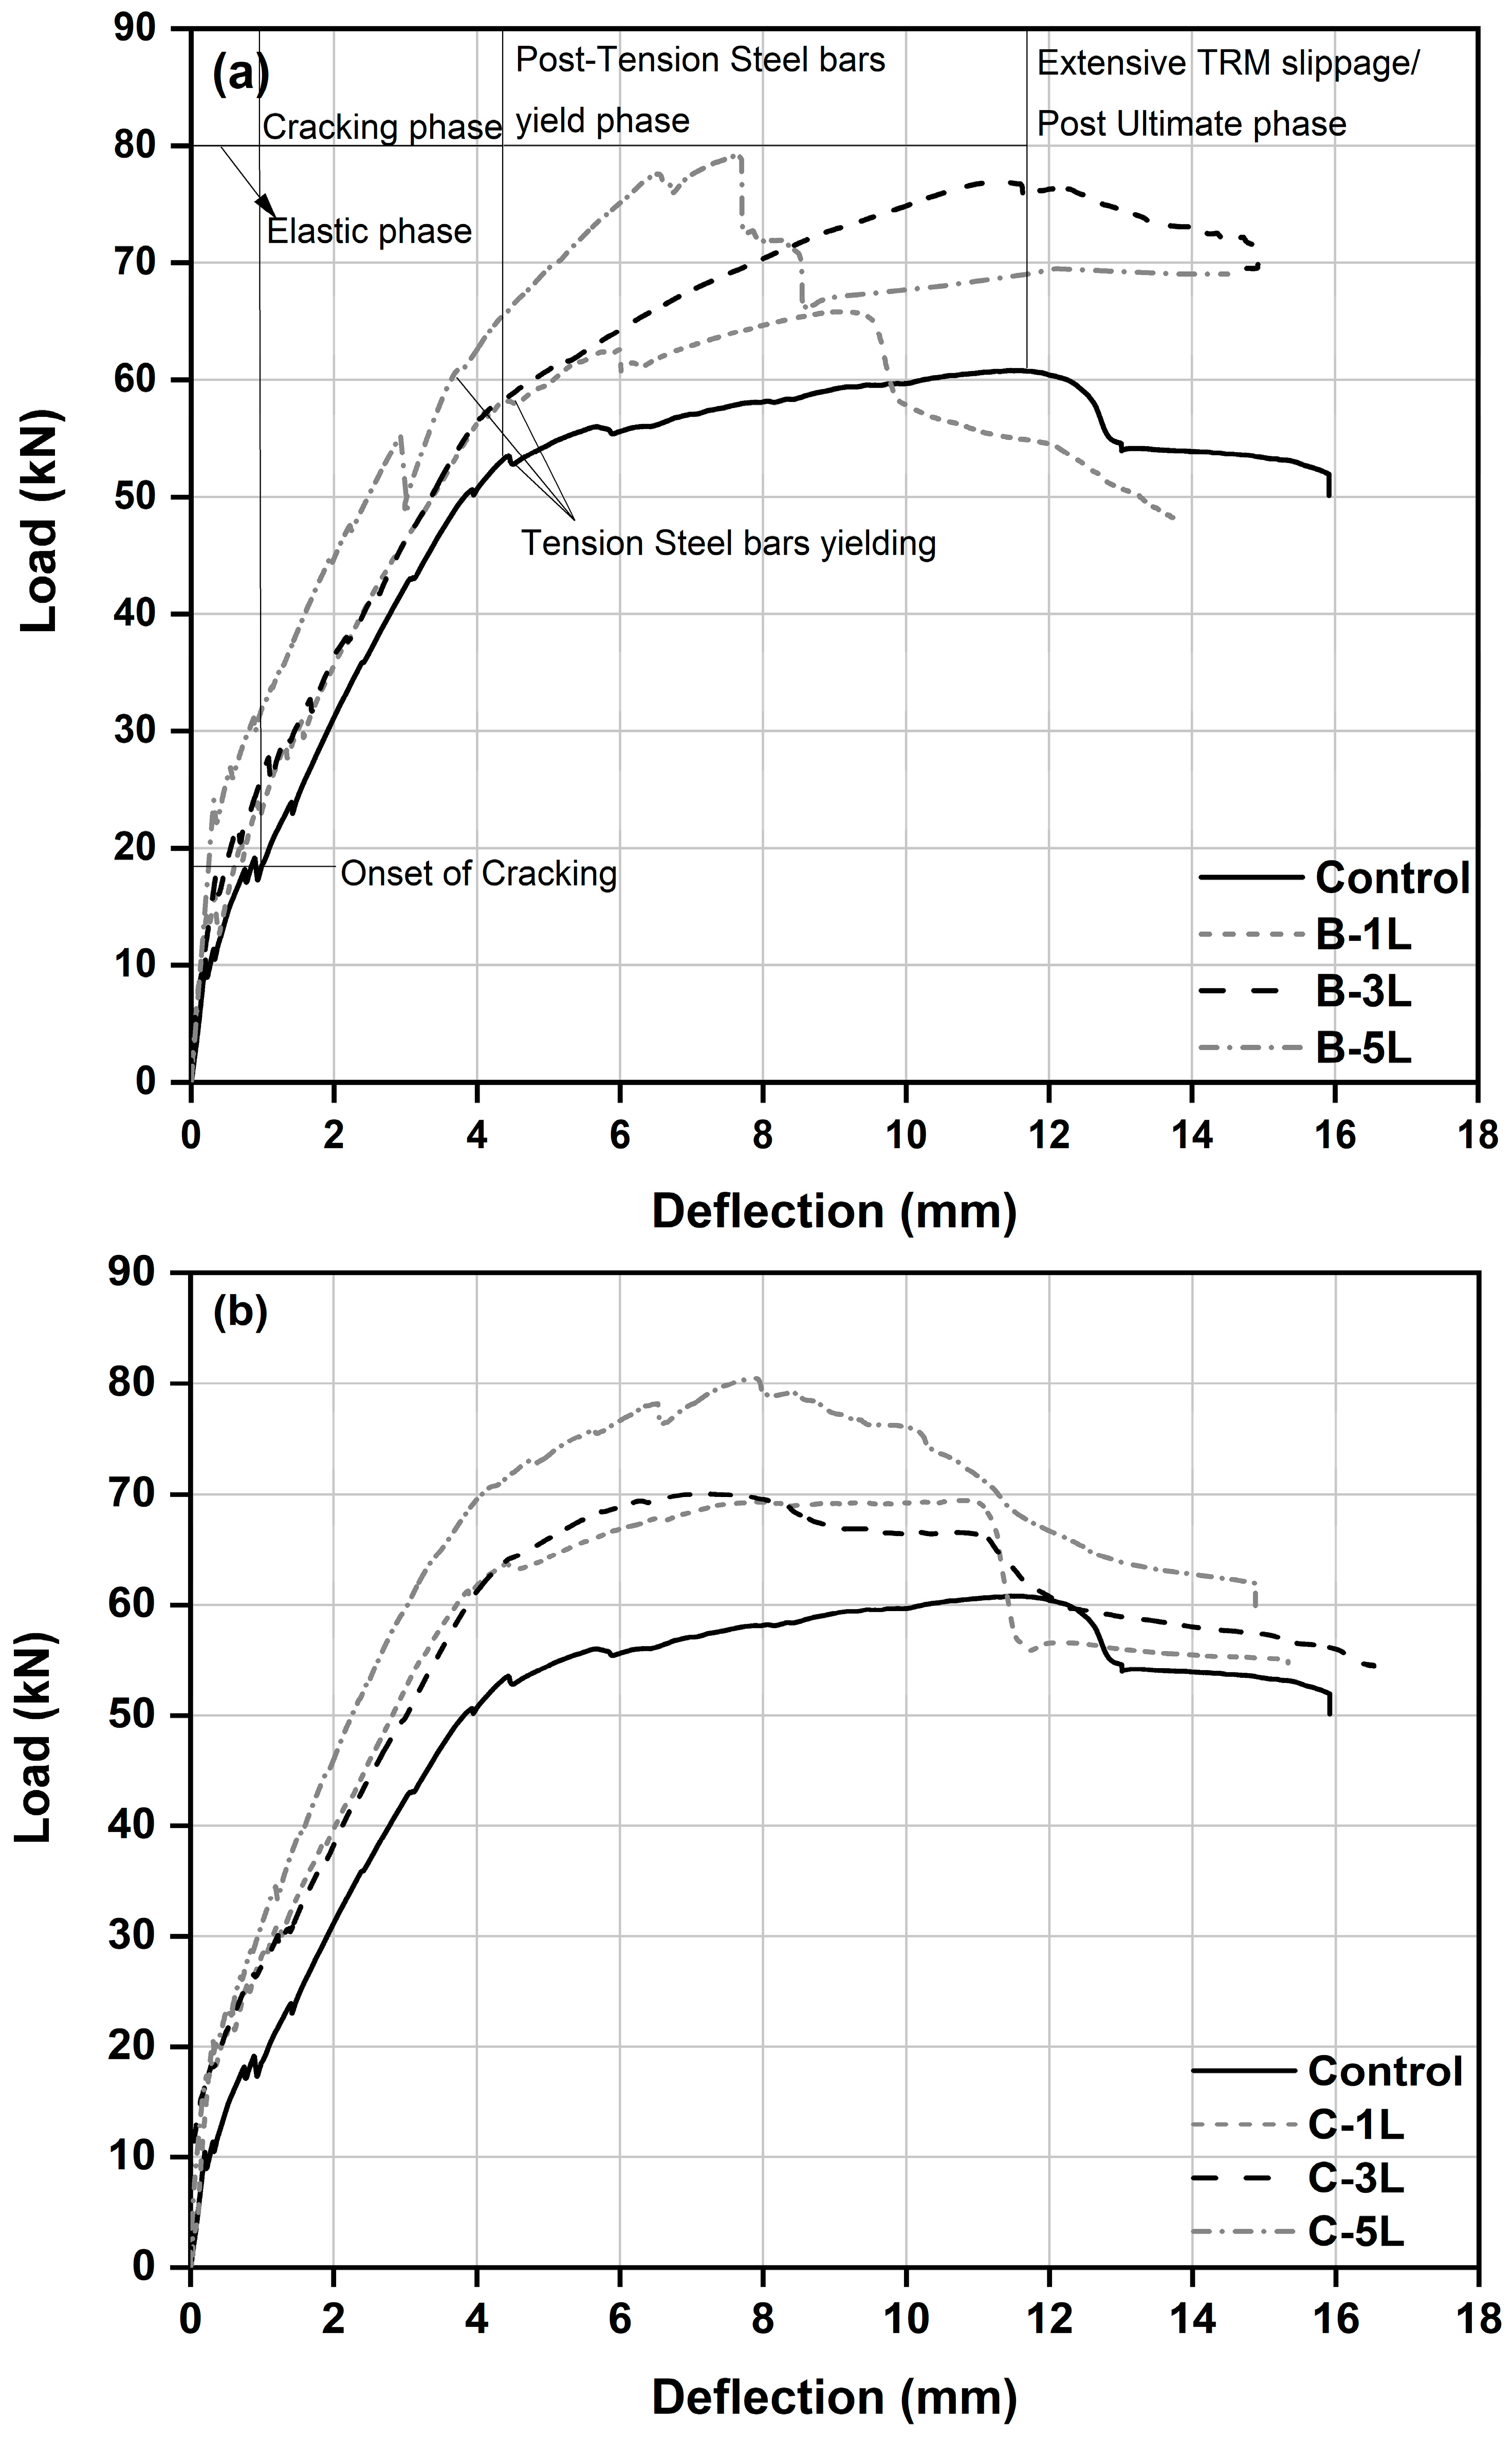
4.1. Load-Deflection Characteristics of the Tested Specimens

The load-deflection response of the control and strengthened reinforced concrete beams is reported in Figure 8a,b. The BTRM- and CTRM-strengthened specimen plots are presented separately as a direct comparison is not the primary target. As mentioned before, the deflections of the specimens were recorded at three different locations along the length of the beam. The plots reported in the figures present the load recorded versus (v/s) deflection measured at the mid-span of the specimen. The general trend of the load-deflection response can be divided into three segments: pre-cracked, reinforcement yield and ultimate load stages. The control beam exhibited typical reinforced concrete beam failure in flexure with a major crack in the constant moment region and concrete crushing at the top of the constant moment region. Table 2 summarises the cracking, yield and ultimate loads and their corresponding deflections recorded by central LVDTs of all the specimens tested. Both BTRM- and CTRM-strengthened beams showed similar responses with an initial crack followed by multiple tiny drops in the load-deflection curves before and after the first/initial cracking. The appearance of the first crack and their corresponding load in strengthened beams gradually increase, showing the flexural strengthening effects as the number of layers increases. Escrig et al. [31] reported similar findings with a methodology to categorise the cracking.
The effect of textile fibres is seen in the load-deflection curves initially before cracking and post-yield load with a stiffer slope, indicating that textile fibres sustain loads during these stages. The basalt fibres get fully activated with a crackling sound just before and post ultimate loads in the case of one- and three-layered specimens. However, carbon textile fibre did not emit such sound post-yield load, which could be attributed to the dry nature of the carbon fibre used. The BTRM-strengthened beams with one and three layers exhibited a similar trend in the load-deflection response post-cracking and before steel rebar yield. After the post-yield load, the layer effect can be observed with an increment in the slope of the load-deflection curves with the three-layered specimen over the two-layered basalt specimen. In contrast, the five-layered basalt specimens showed a sudden drop at post-peak loads due to debonding between BTRM and concrete beam soffit, which started near the junction of U-wrap and horizontal strengthening layers. The basalt textile slip within the mortar in single- and three-layered specimens can be visualised clearly in the post-ultimate load stage on the load-deflection curves in the form of tiny steps and ridges. All the specimens strengthened with CTRM specimens showed similar behaviour before crack, after crack and at yield point like BTRM specimens. At post-ultimate load, the one-layered specimen shows a sudden dip before gradual load capacity reduction, whereas the three- and five-layered specimens’ load capacity dropped gradually.

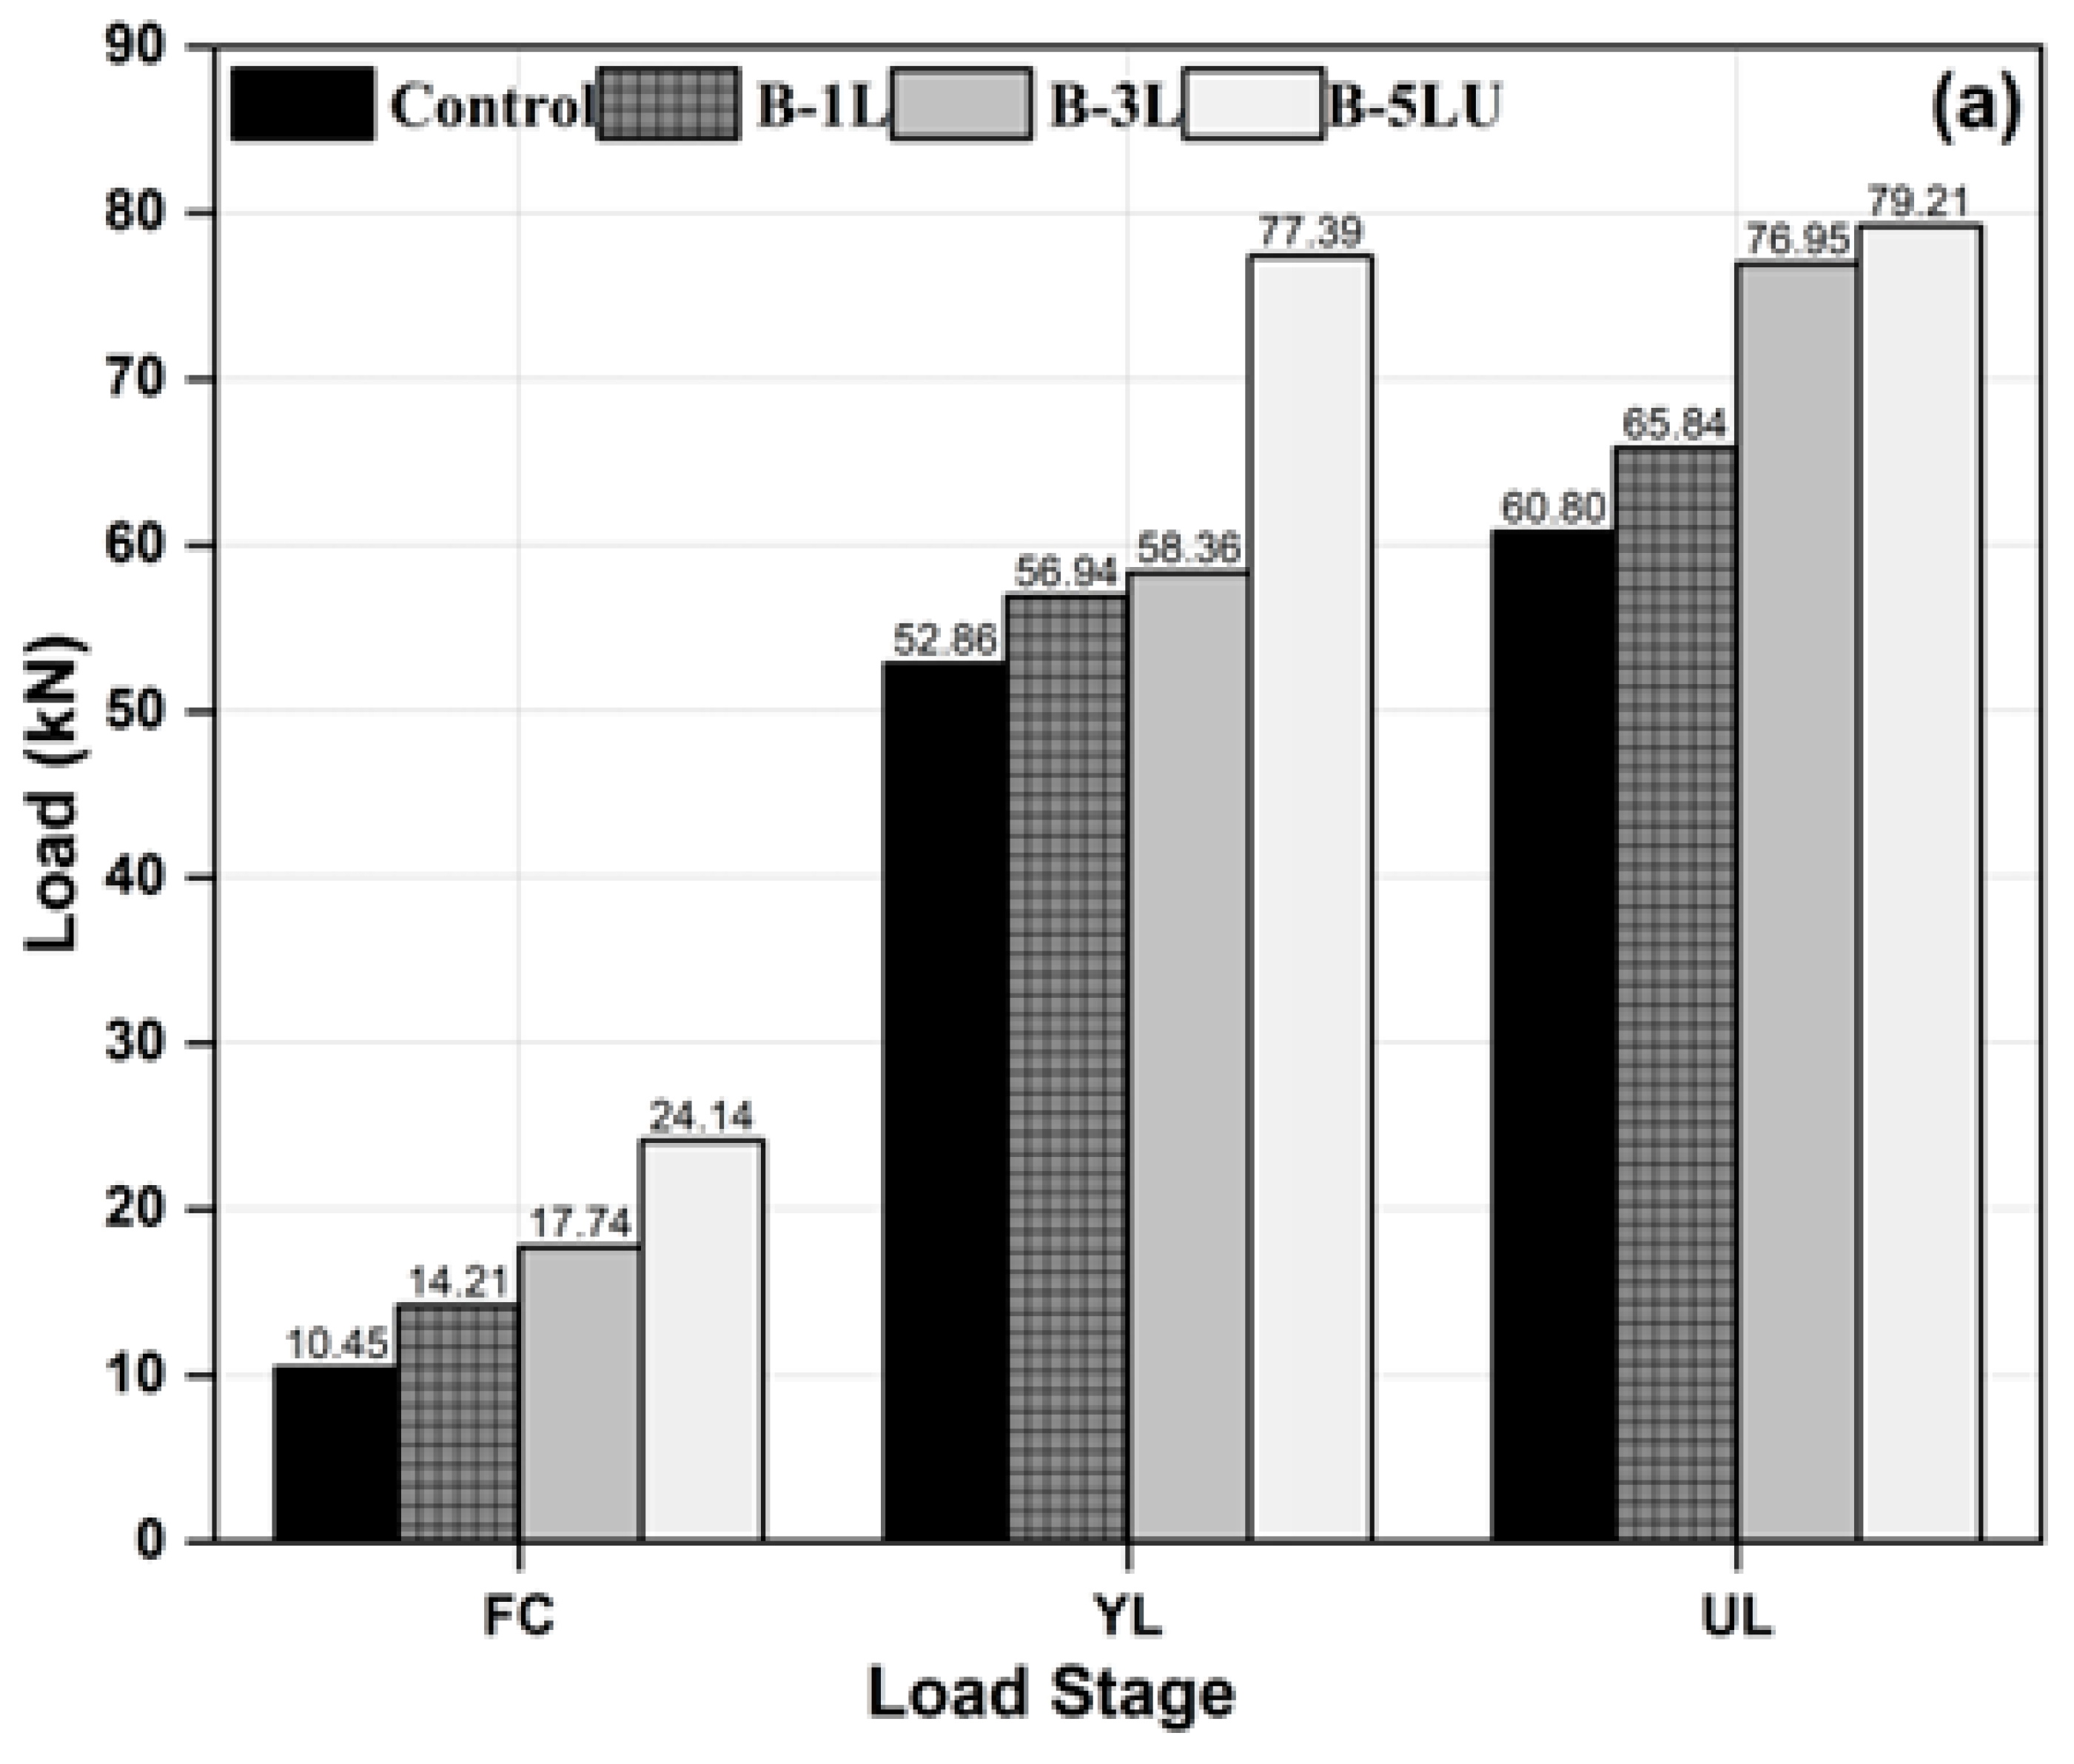
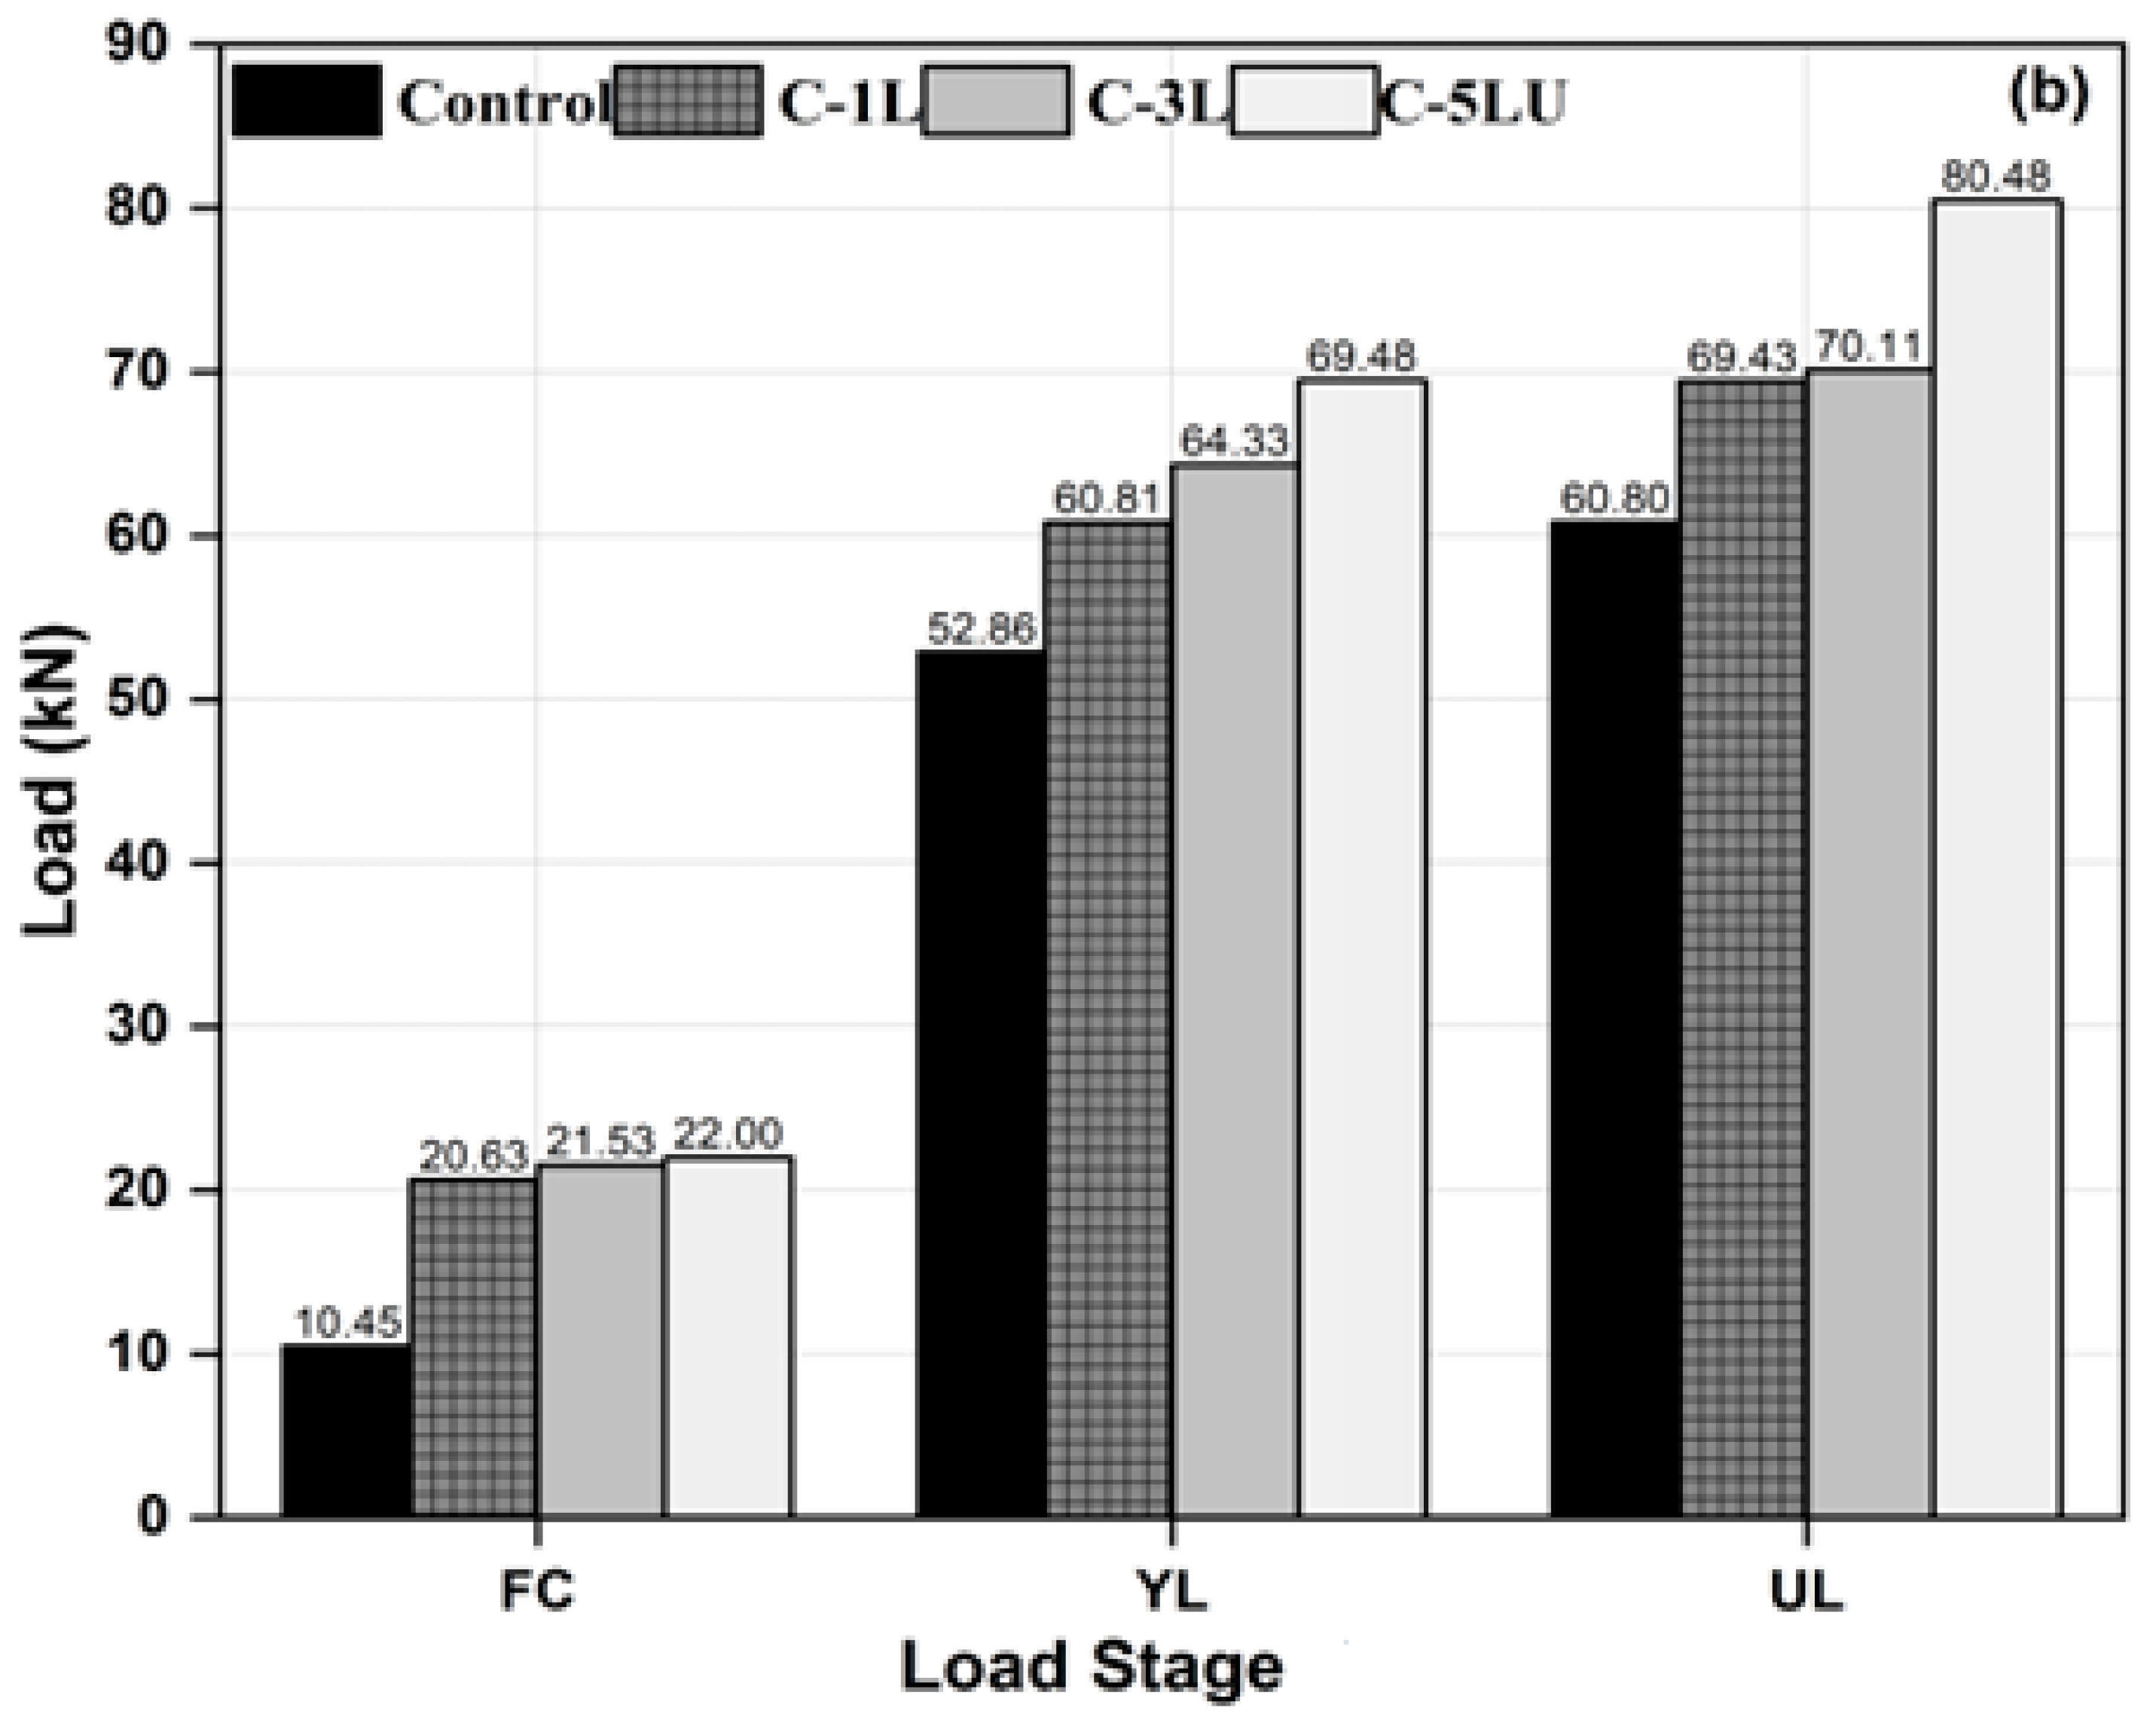
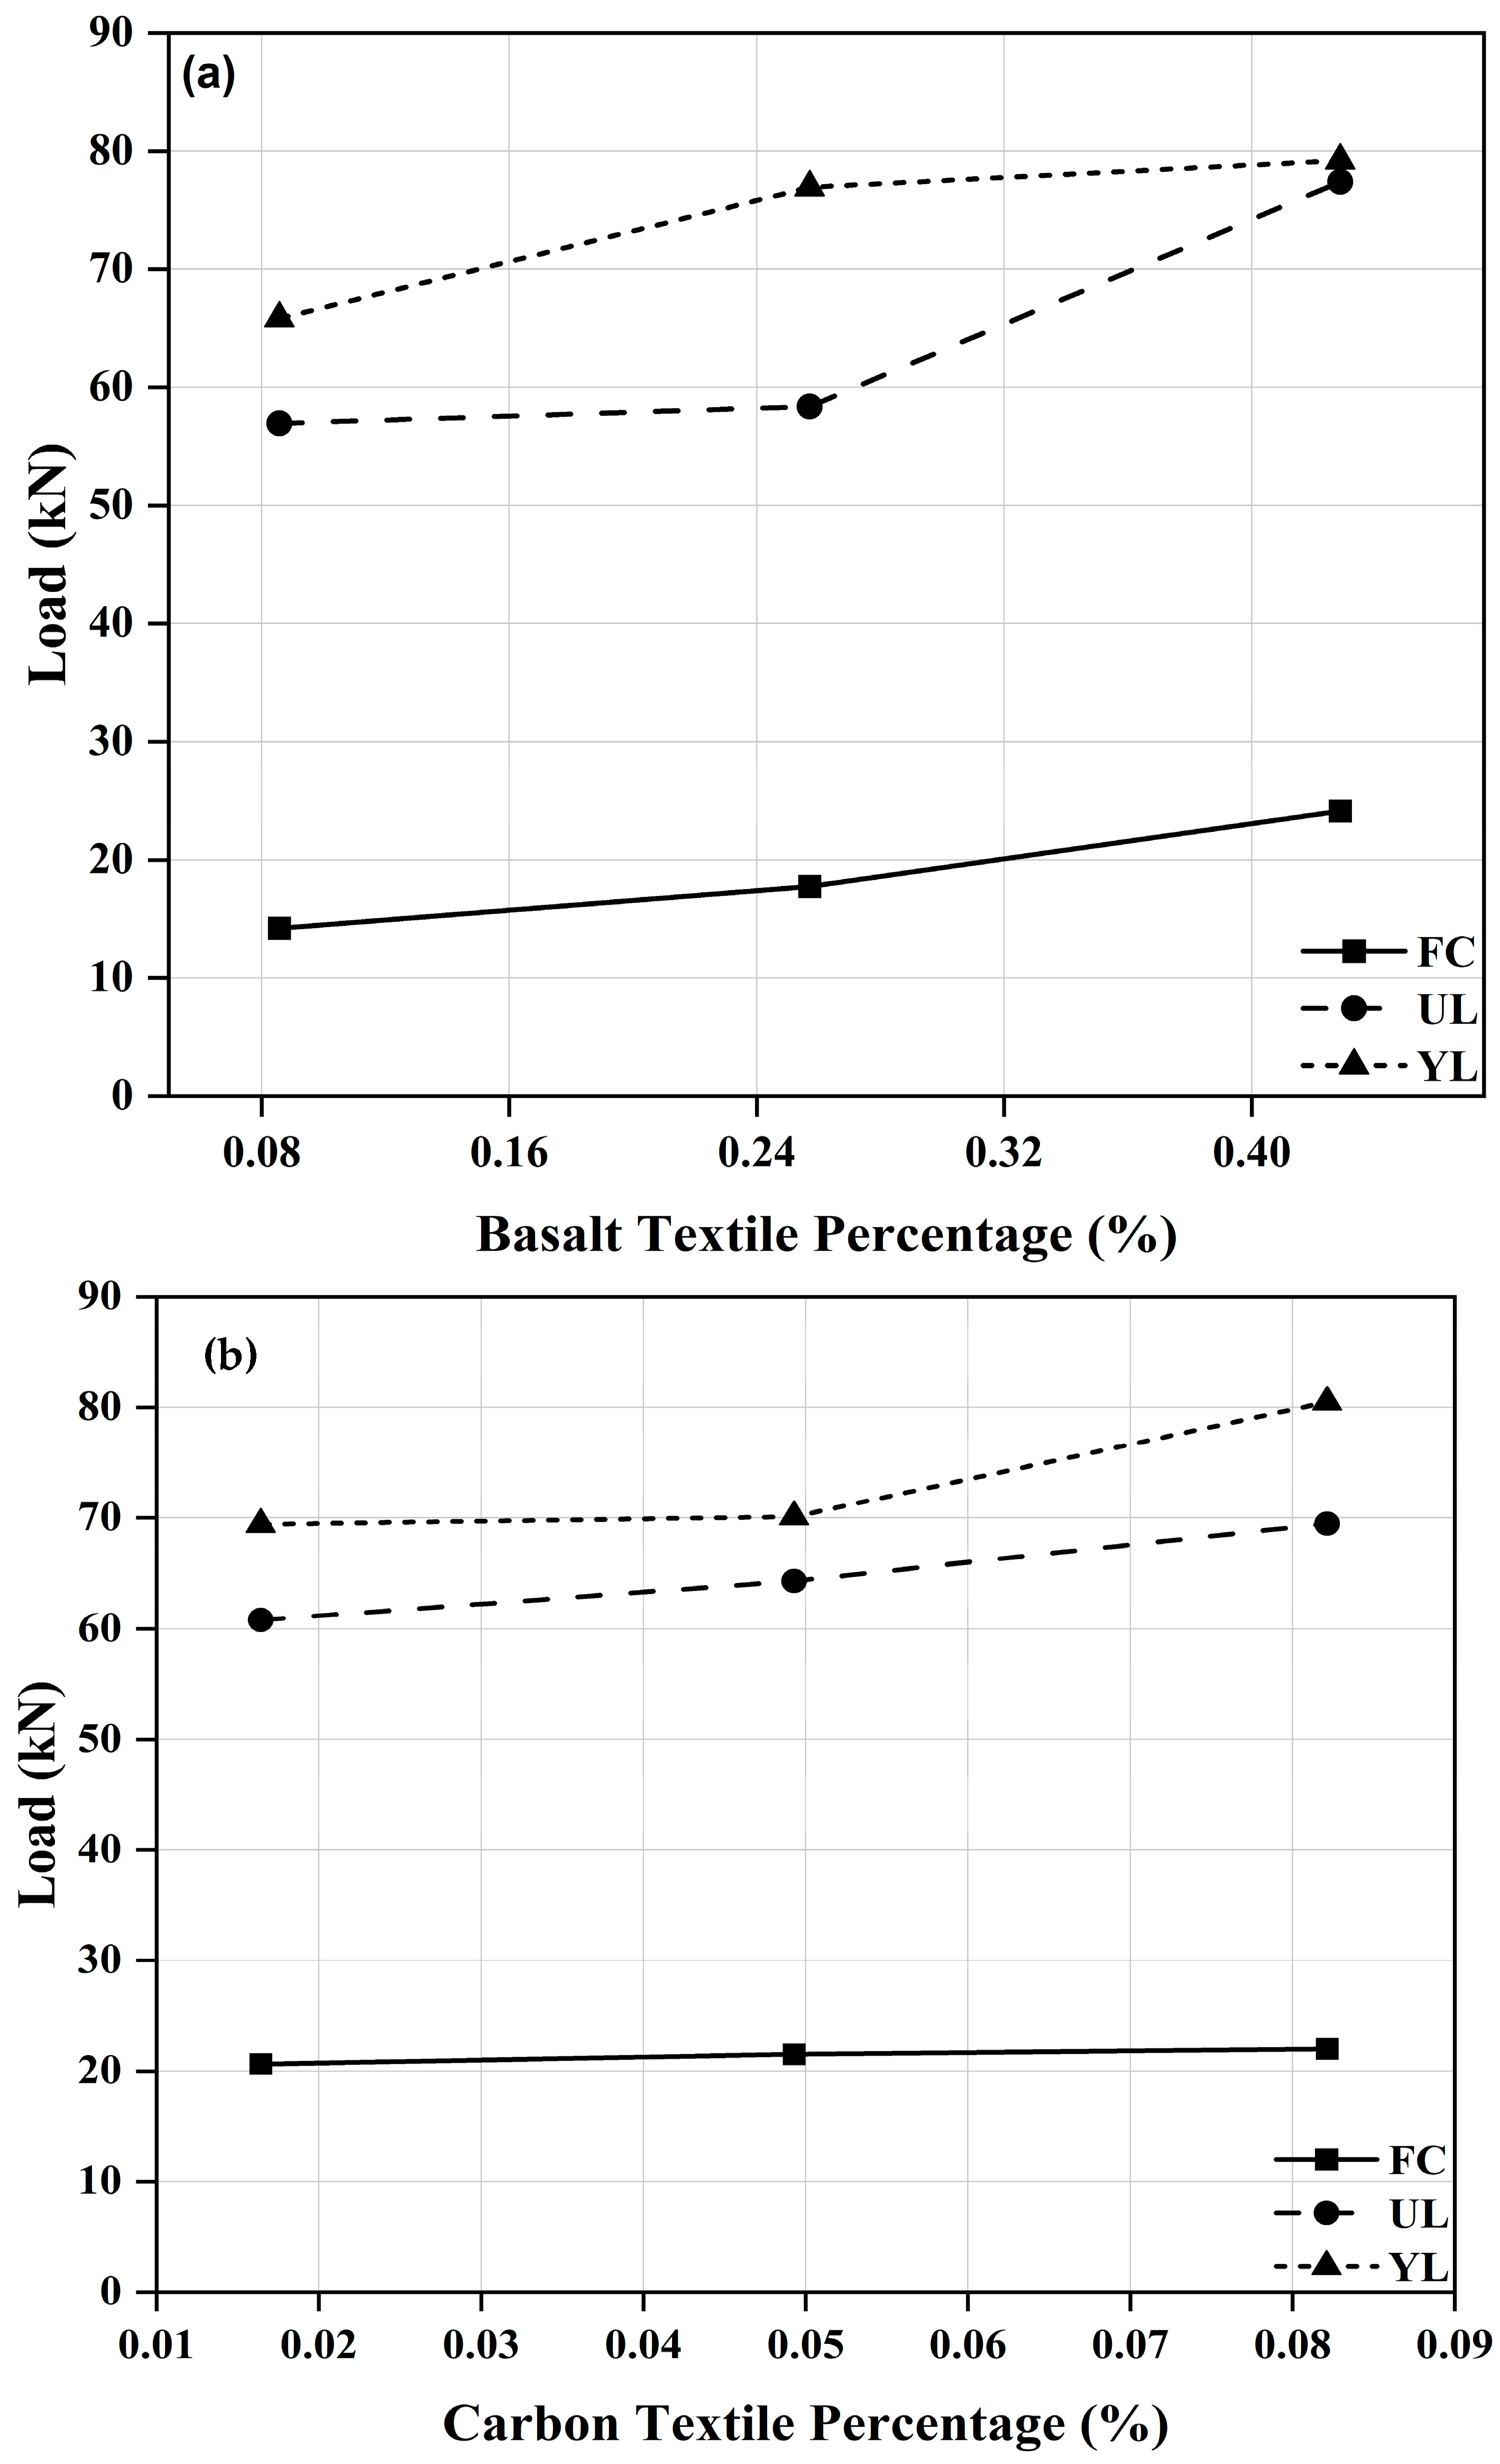
4.2. Load Capacity Improvement from Basalt and Carbon TRMs

Uncoated carbon and coated basalt textile fibres were used to cast TRMs as received from the supplier. This can lead to the utilisation of the textile with less tempering, and hence the results obtained can be better interpreted. The load capacity contribution was calculated by comparing the strengthened beam load to the control beam. Figure 9a,b show the load capacity contribution from basalt and carbon TRMs, respectively. The first crack improvement is linear in the case of BTRM specimens as the number of layers increases. CTRM specimens showed a similar trend but a less pronounced difference between different layers. In addition, the load comparison at all the stages can be seen as increasing.
Similarly, load capacity increments provided by basalt and carbon TRMs over the control beam are reported in Figure 10a,b. It is interesting to note that B-3L shows better performance over five-layered specimens at the ultimate stage. In the case of CTRM-strengthened specimens, the load increment increases at all stages, with the maximum contribution in the first crack stage. The obtained load capacity is also plotted against the textile reinforcement percentage in Figure 11a,b to study its effect. The trend obtained is similar to the load increment observations, with the first crack curve being linear. The yield load increases with increasing textile percentage. However, the ultimate load drops in the case of the five-layered BTRM specimen, whereas an increasing trend can be observed in the five-layered CTRM specimen.

4.3. Ductility Index

The plastic deformation before the ultimate failure is measured using an important parameter called the ductility index (DI), calculated using the below expression.
DI = Δu/Δy
The calculated ductility indices are reported in Table 2 and are graphically presented in Figure 12a,b, which were calculated as the ultimate deflection over yield deflection. As commonly seen in strengthened reinforced beams, ductility indices reduce as the flexural stiffness increases. Similar trends can be observed for all the CTRM-strengthened beams, whereas BTRM specimens’ behaviours differed for the different samples. B-1L shows a decrease of 16.47% in ductility compared to the control beam, whereas B-3L shows a 3% decrease. B-5LU exhibited a 55.43% reduction in the ductility index. The basalt textile has the ability to impart ductility to strengthened beams. However, an optimum percentage of textiles needs to be calculated when multilayered textiles are used to strengthen structures. The current study showed that the ductility offered by the three-layered textile nearly provided the same amount of ductility as seen in the control beam. The ductility offered by the C-1L and C-3L specimens is nearly the same due to the slippage of carbon textile owing to the nature of the textile. A reduction of 40% in ductility in both one- and three-layered carbon textiles over the control beam is observed. The C-5LU five-layered carbon textile specimen registered a reduction of 29.6% compared to the control beam.

4.4. Energy Absorption Capacity

Energy absorption capacity was calculated as the area under the load-deflection curve up to the ultimate load [40] and is reported as ‘ψ’ in Table 2. B-3L, C-5LU and B-5LU showed maximum energy absorption capacities owing to the maximum utilisation of the textile fibres. However, the provision of U-wraps can also be a factor for the increased energy absorption in five-layered specimens, especially in C-5LU. The energy absorption capacity is the highest in the three-layered BTRM specimen, B-3L, indicating full utilisation of basalt textile axial stiffness contributed by textile coating. On the contrary, the debonding of BTRM in the B-5LU specimen resulted in less energy absorption.

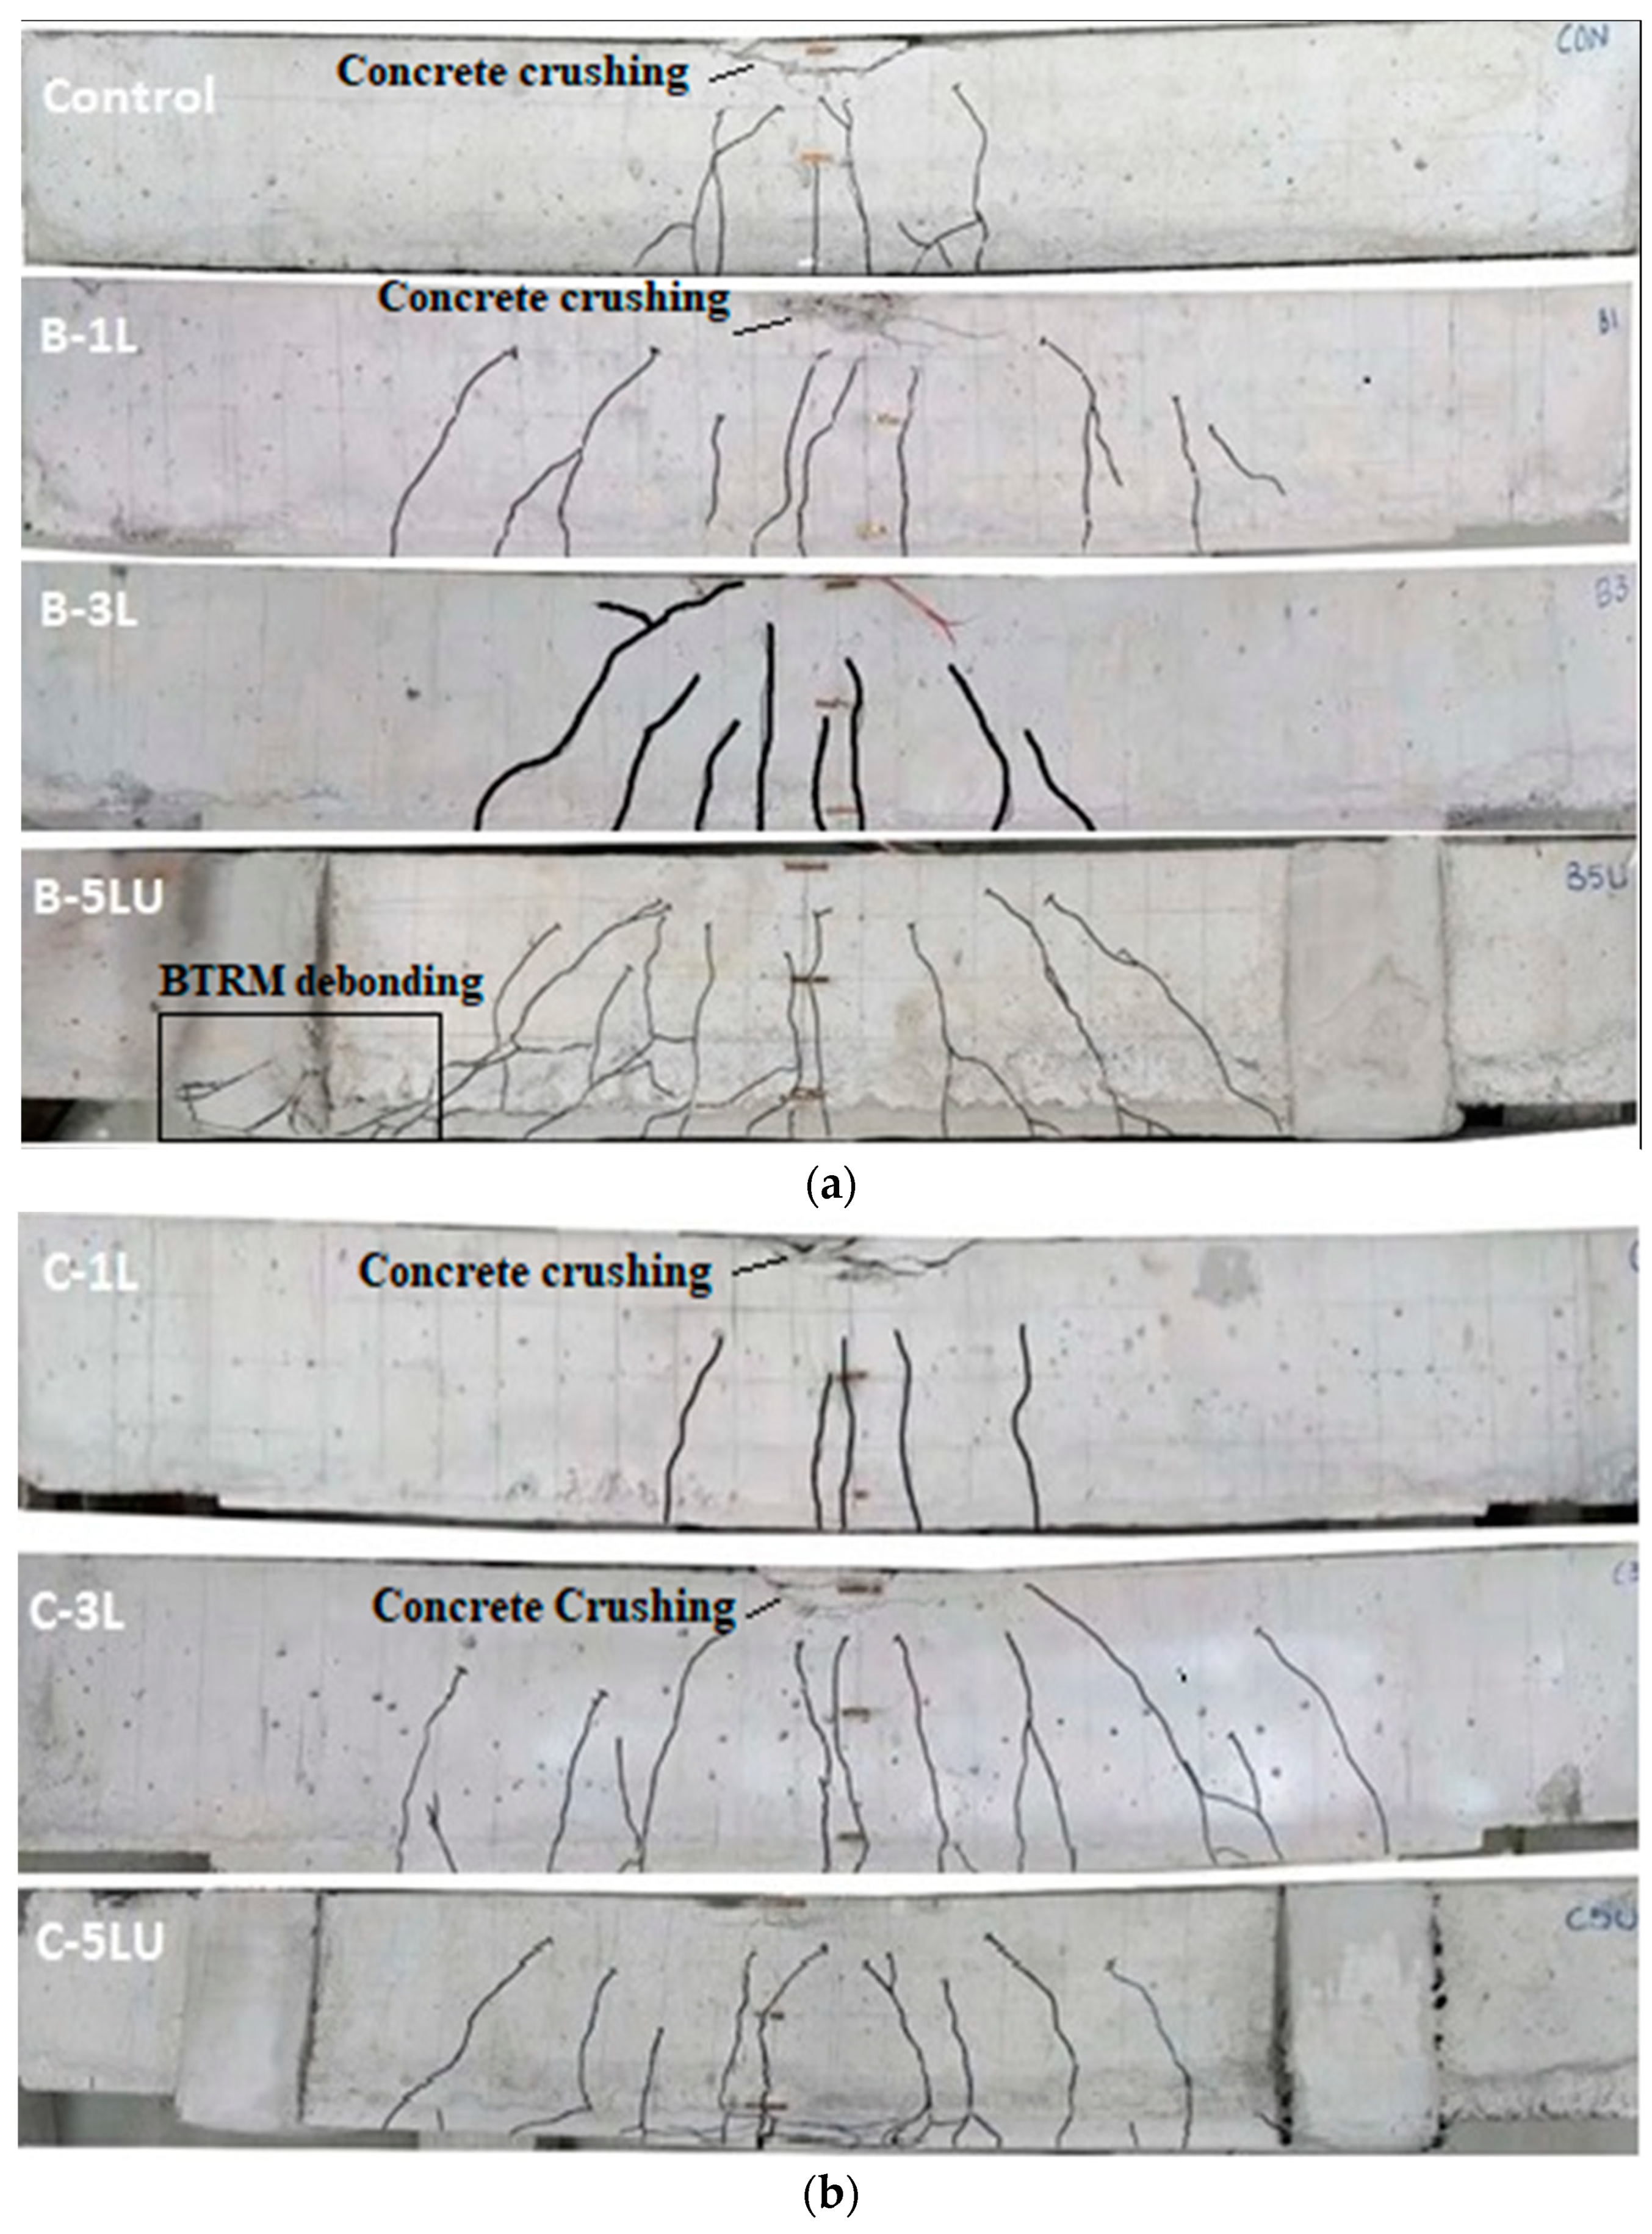
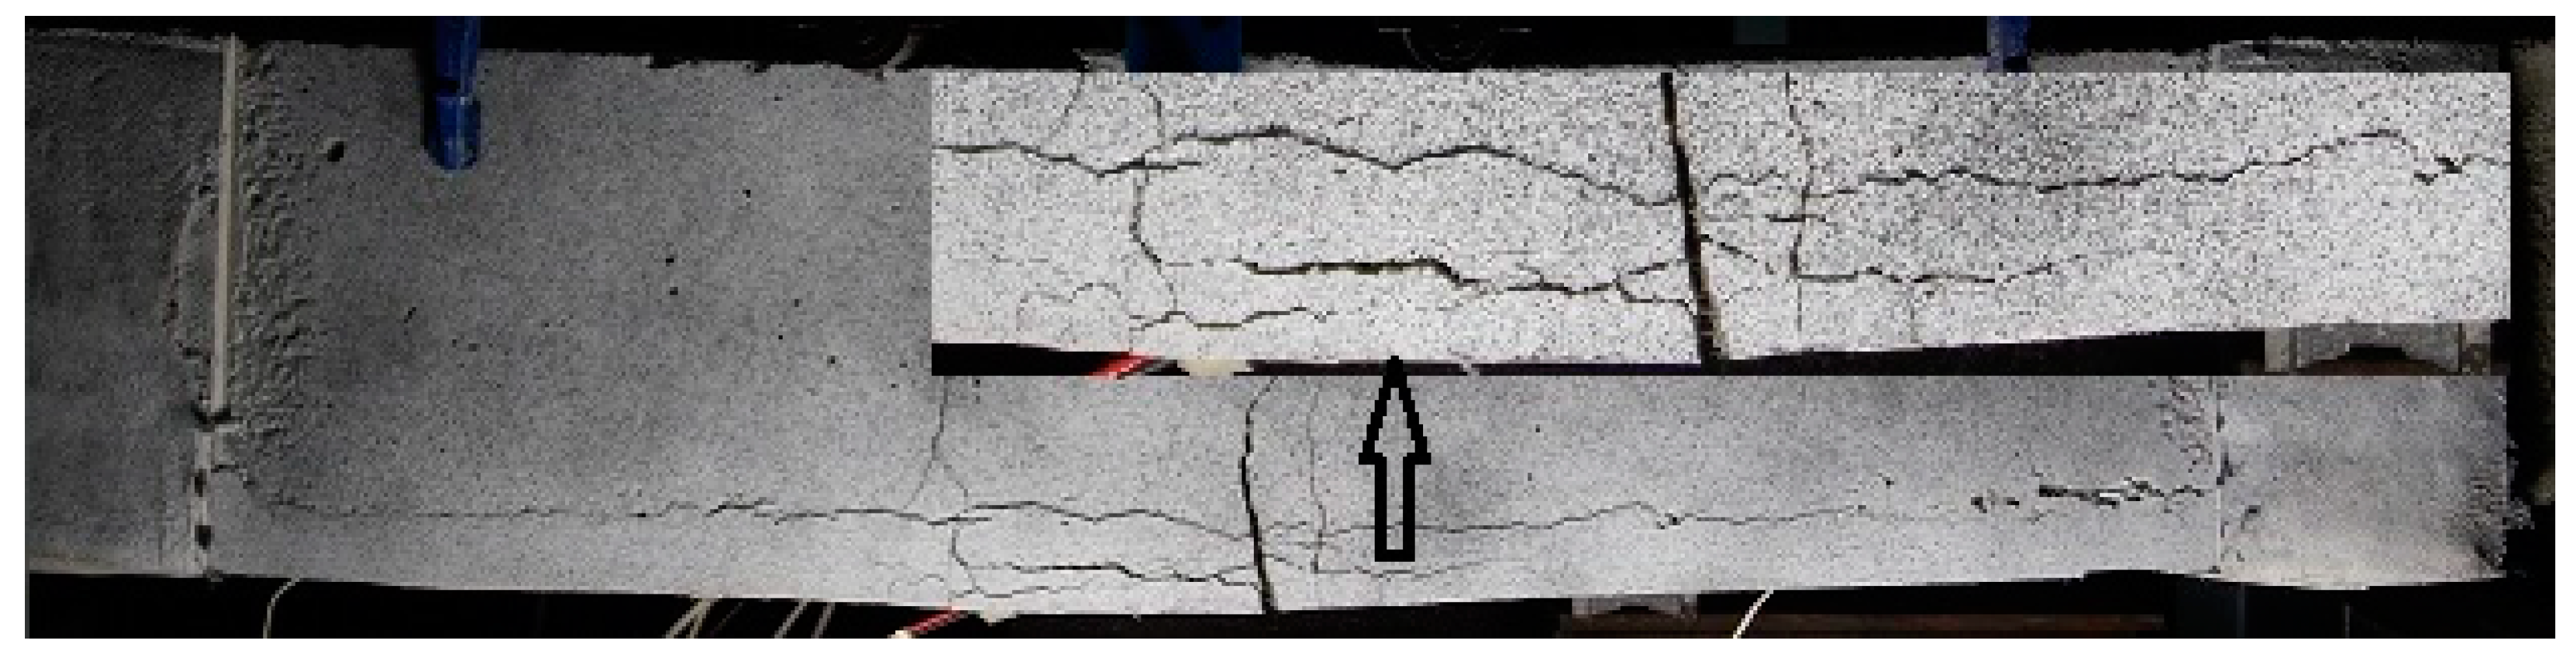
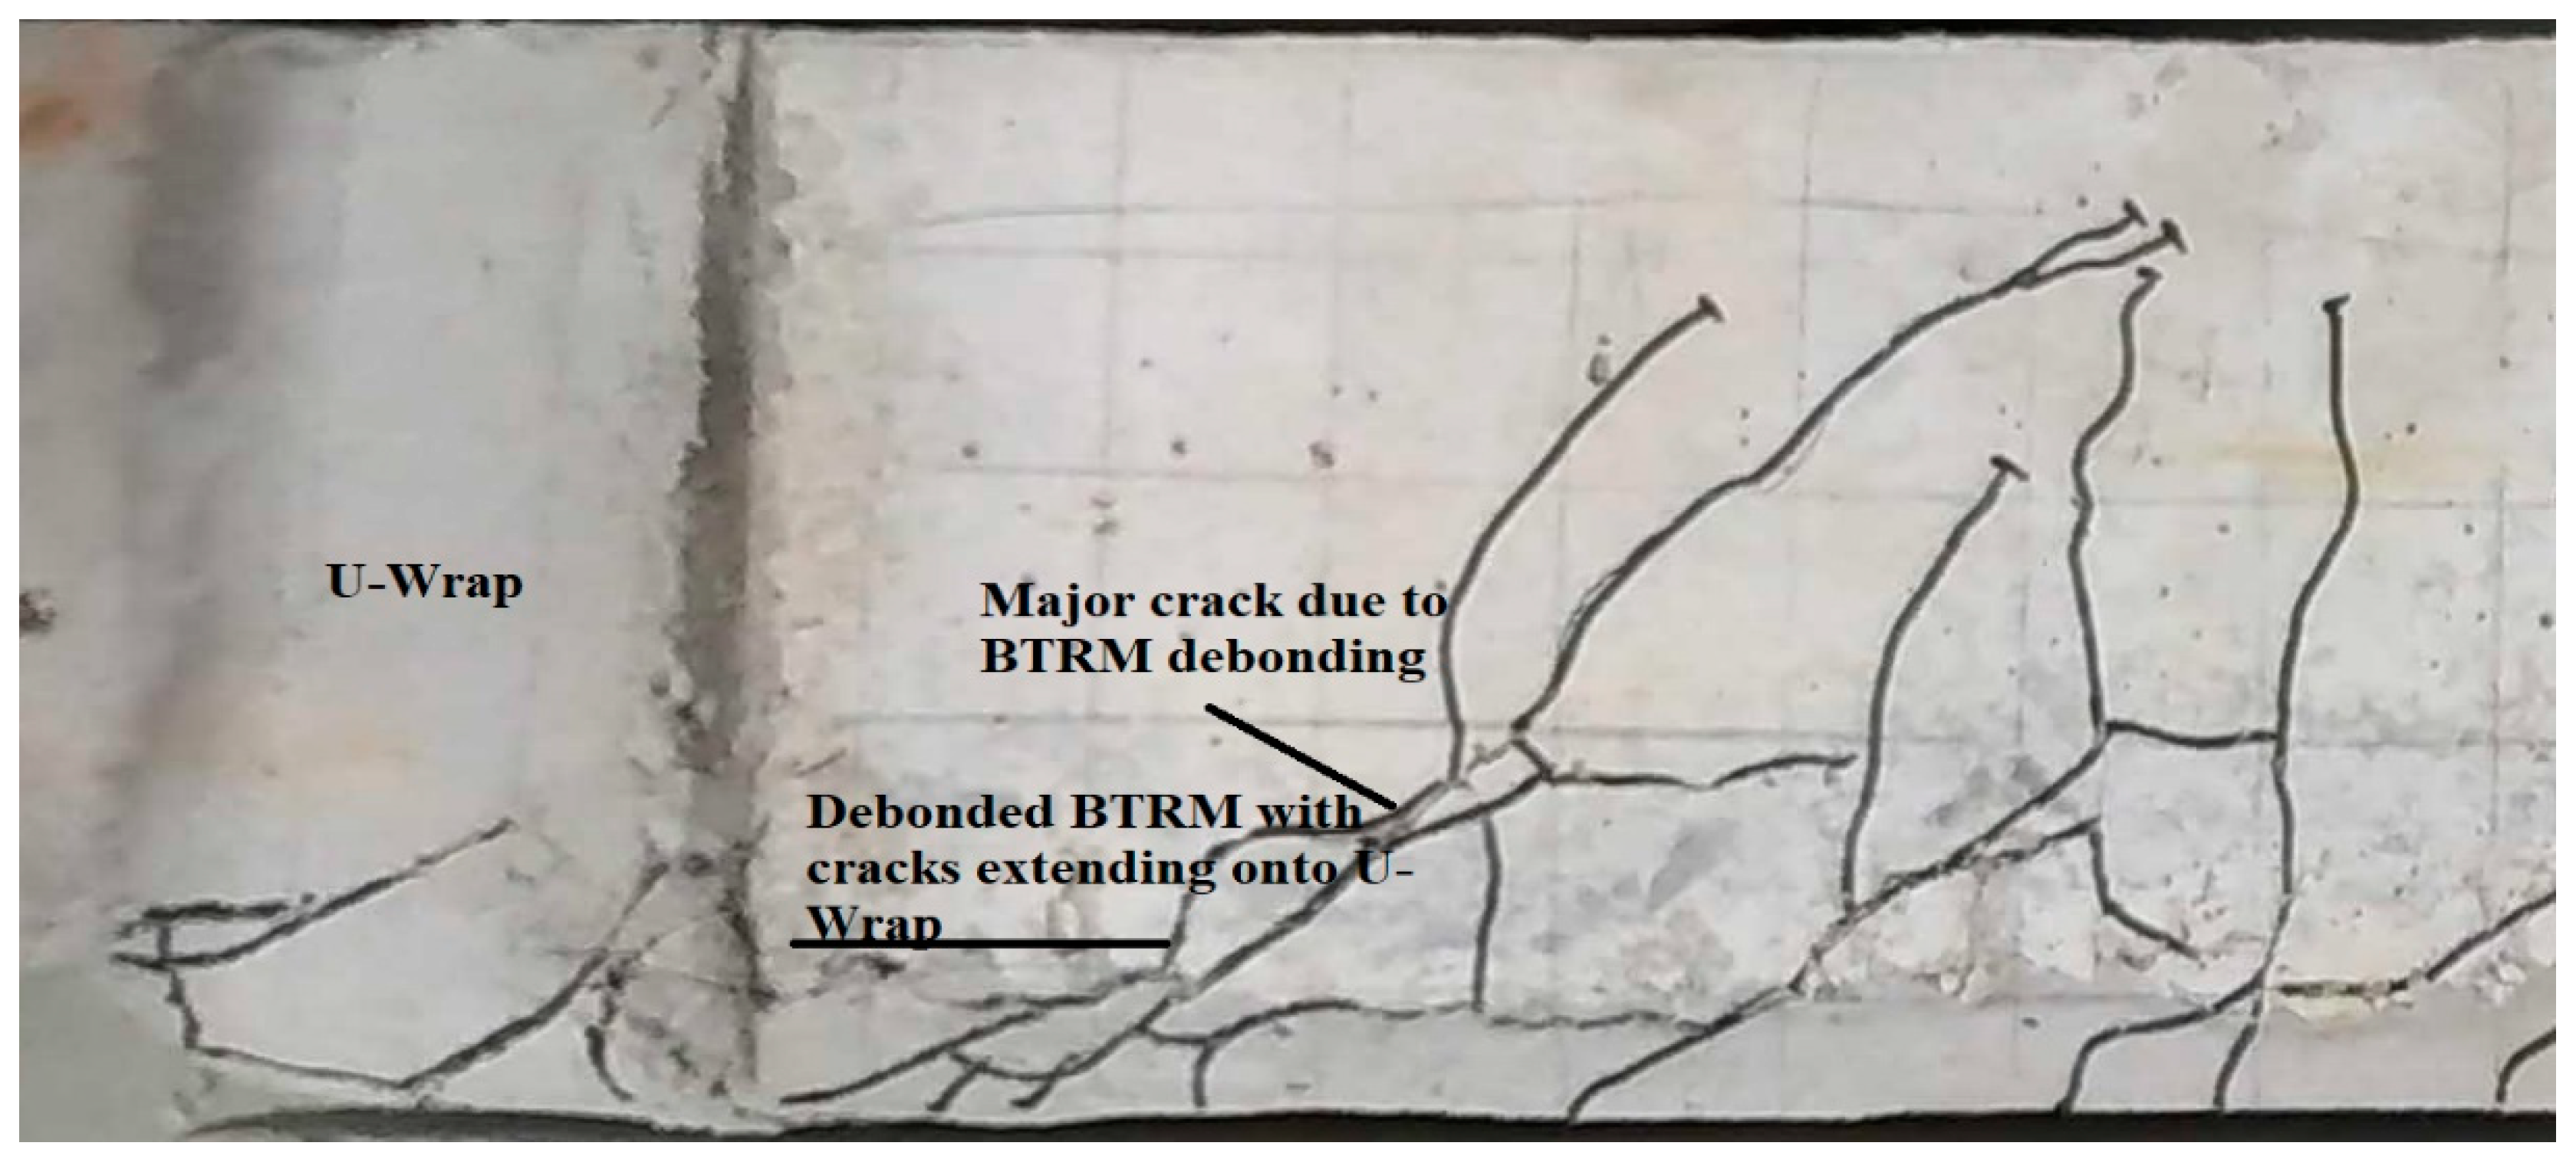
4.5. Cracking and Failure Modes

The crack pattern observed from all the specimens is briefly described here and is shown in Figure 13a,b; the control beam showed major crack development within the constant moment region at the ultimate load stage, along with concrete crushing in the compression zone. On the other hand, strengthened beams showed a spread of cracks on either side of the constant moment region. CTRM-strengthened specimens showed cracks in the constant moment region along with concrete crushing in the compression zone. U-wraps applied on C-5LU successfully mitigated end debonding by concentrating cracks in the constant moment region. Another failure mode recorded within the C-5LU specimen was the inter-laminar cracks between different layers, as shown in the zoomed-in part of Figure 14, similar to tensile coupon cracking in another study [46]. This kind of failure can be attributed to the number of layers, i.e., more than two. This failure clearly shows that carbon fibres are in tension resulting in debonding from the surrounding cementitious matrix.
BTRM-strengthened beams with one layer, three layers and five layers develop major cracks in the constant moment regions, with concrete crushing noticed only in one- and three-layered specimens, which is evidence of bottom steel rebar yields followed by textile slippage and rupture. Only the five-layered specimen failed by debonding at the junction of the U-wrap and TRM soffit which is shown in Figure 15. A similar failure mode is reported in Raoof et al.’s study [35]. Hence, the beneficial effect of U-wraps is only to avoid premature debonding, whereas debonding caused next to the U-wrap due to stress concentration can be avoided by providing a series of U-wraps along the length of the beams.

4.6. Flexural Stiffness

Flexural stiffnesses were calculated as the load applied on the beam to the deflection measured at mid-span using Equation (2). In this equation, EI refers to the flexural stiffness, a is the shear span, L is the full length of the member, and F is the total load applied on the beam, which is calculated from Equation (2) [47] and is reported in Table 2. The flexural stiffness recorded for all the strengthened beams increased, which is an obvious trend. B-1L showed a 36.86% increased stiffness compared to the control beam, B-3L showed a 29.12% increase, and B-5LU showed a 95.25% increase owing to the number of layers and reduced deflection recorded. C-1L, C-3L and C-5LU recorded 21.50%, 83.28% and 92.95%, respectively.
E I = ( F δ ) ( a 48 ) ( 3 L 2 4 a 2 )
In addition to the flexural stiffness at ultimate load, plots of flexural stiffness reduction are presented in Figure 16a,b to understand the stiffness degradation of the strengthened beams. The stiffness degradation can be distinguished into three segments: onset of cracking, prior to rebar yield region and post rebar yield region. This presentation provides an understanding of the stiffness imparted to the specimens and their degradation. It can be seen in the plots that the curves with the highest stiffness are placed above, whereas the curves below represent specimens with reducing strengthening layers.

4.7. Digital Image Correlation

Digital image correlation (DIC) was applied in this study to mainly study the crack patterns and widths. It was also used to derive the displacement fields of the specimens. The images were correlated using NCorr [48], an open-source 2D digital image correlation programme running in a Matlab environment. The obtained displacement and strain can be further set by choosing the plot option, displacement can be obtained by correlating actual specimen dimensions, and strain plots are obtained by selecting the appropriate strain radius. In this study, downward displacement of the specimens was obtained using the procedure described above.

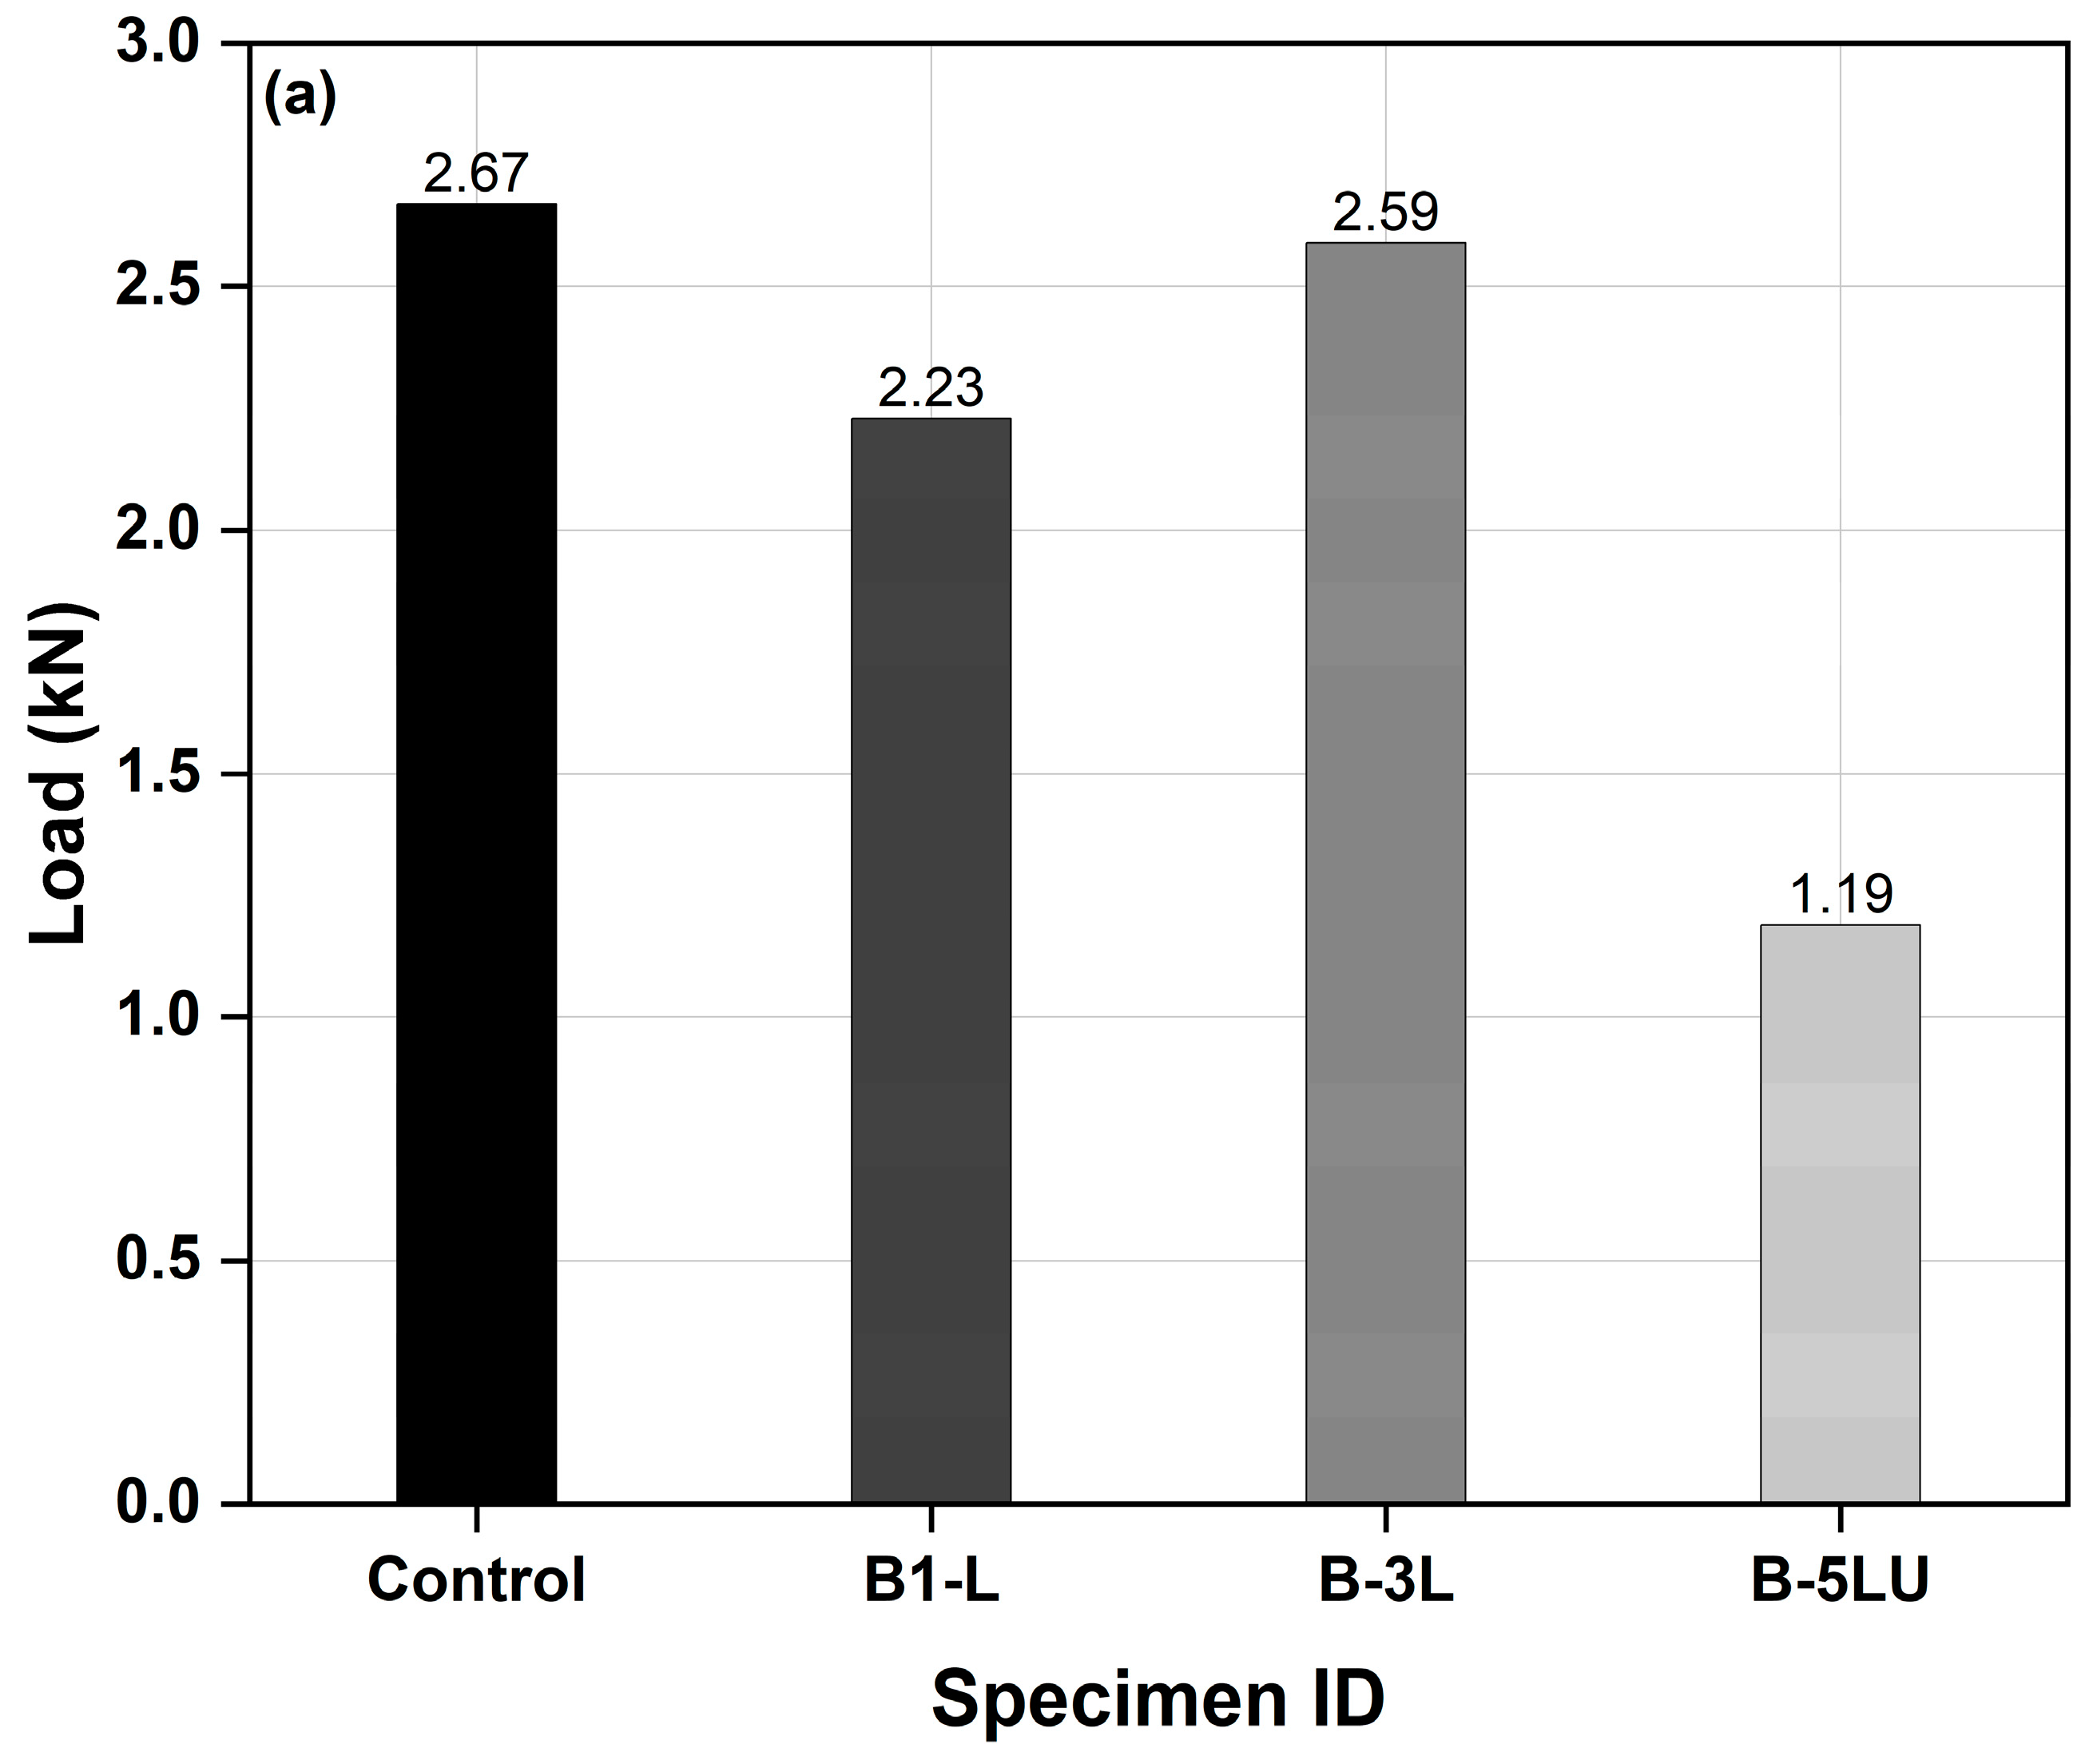
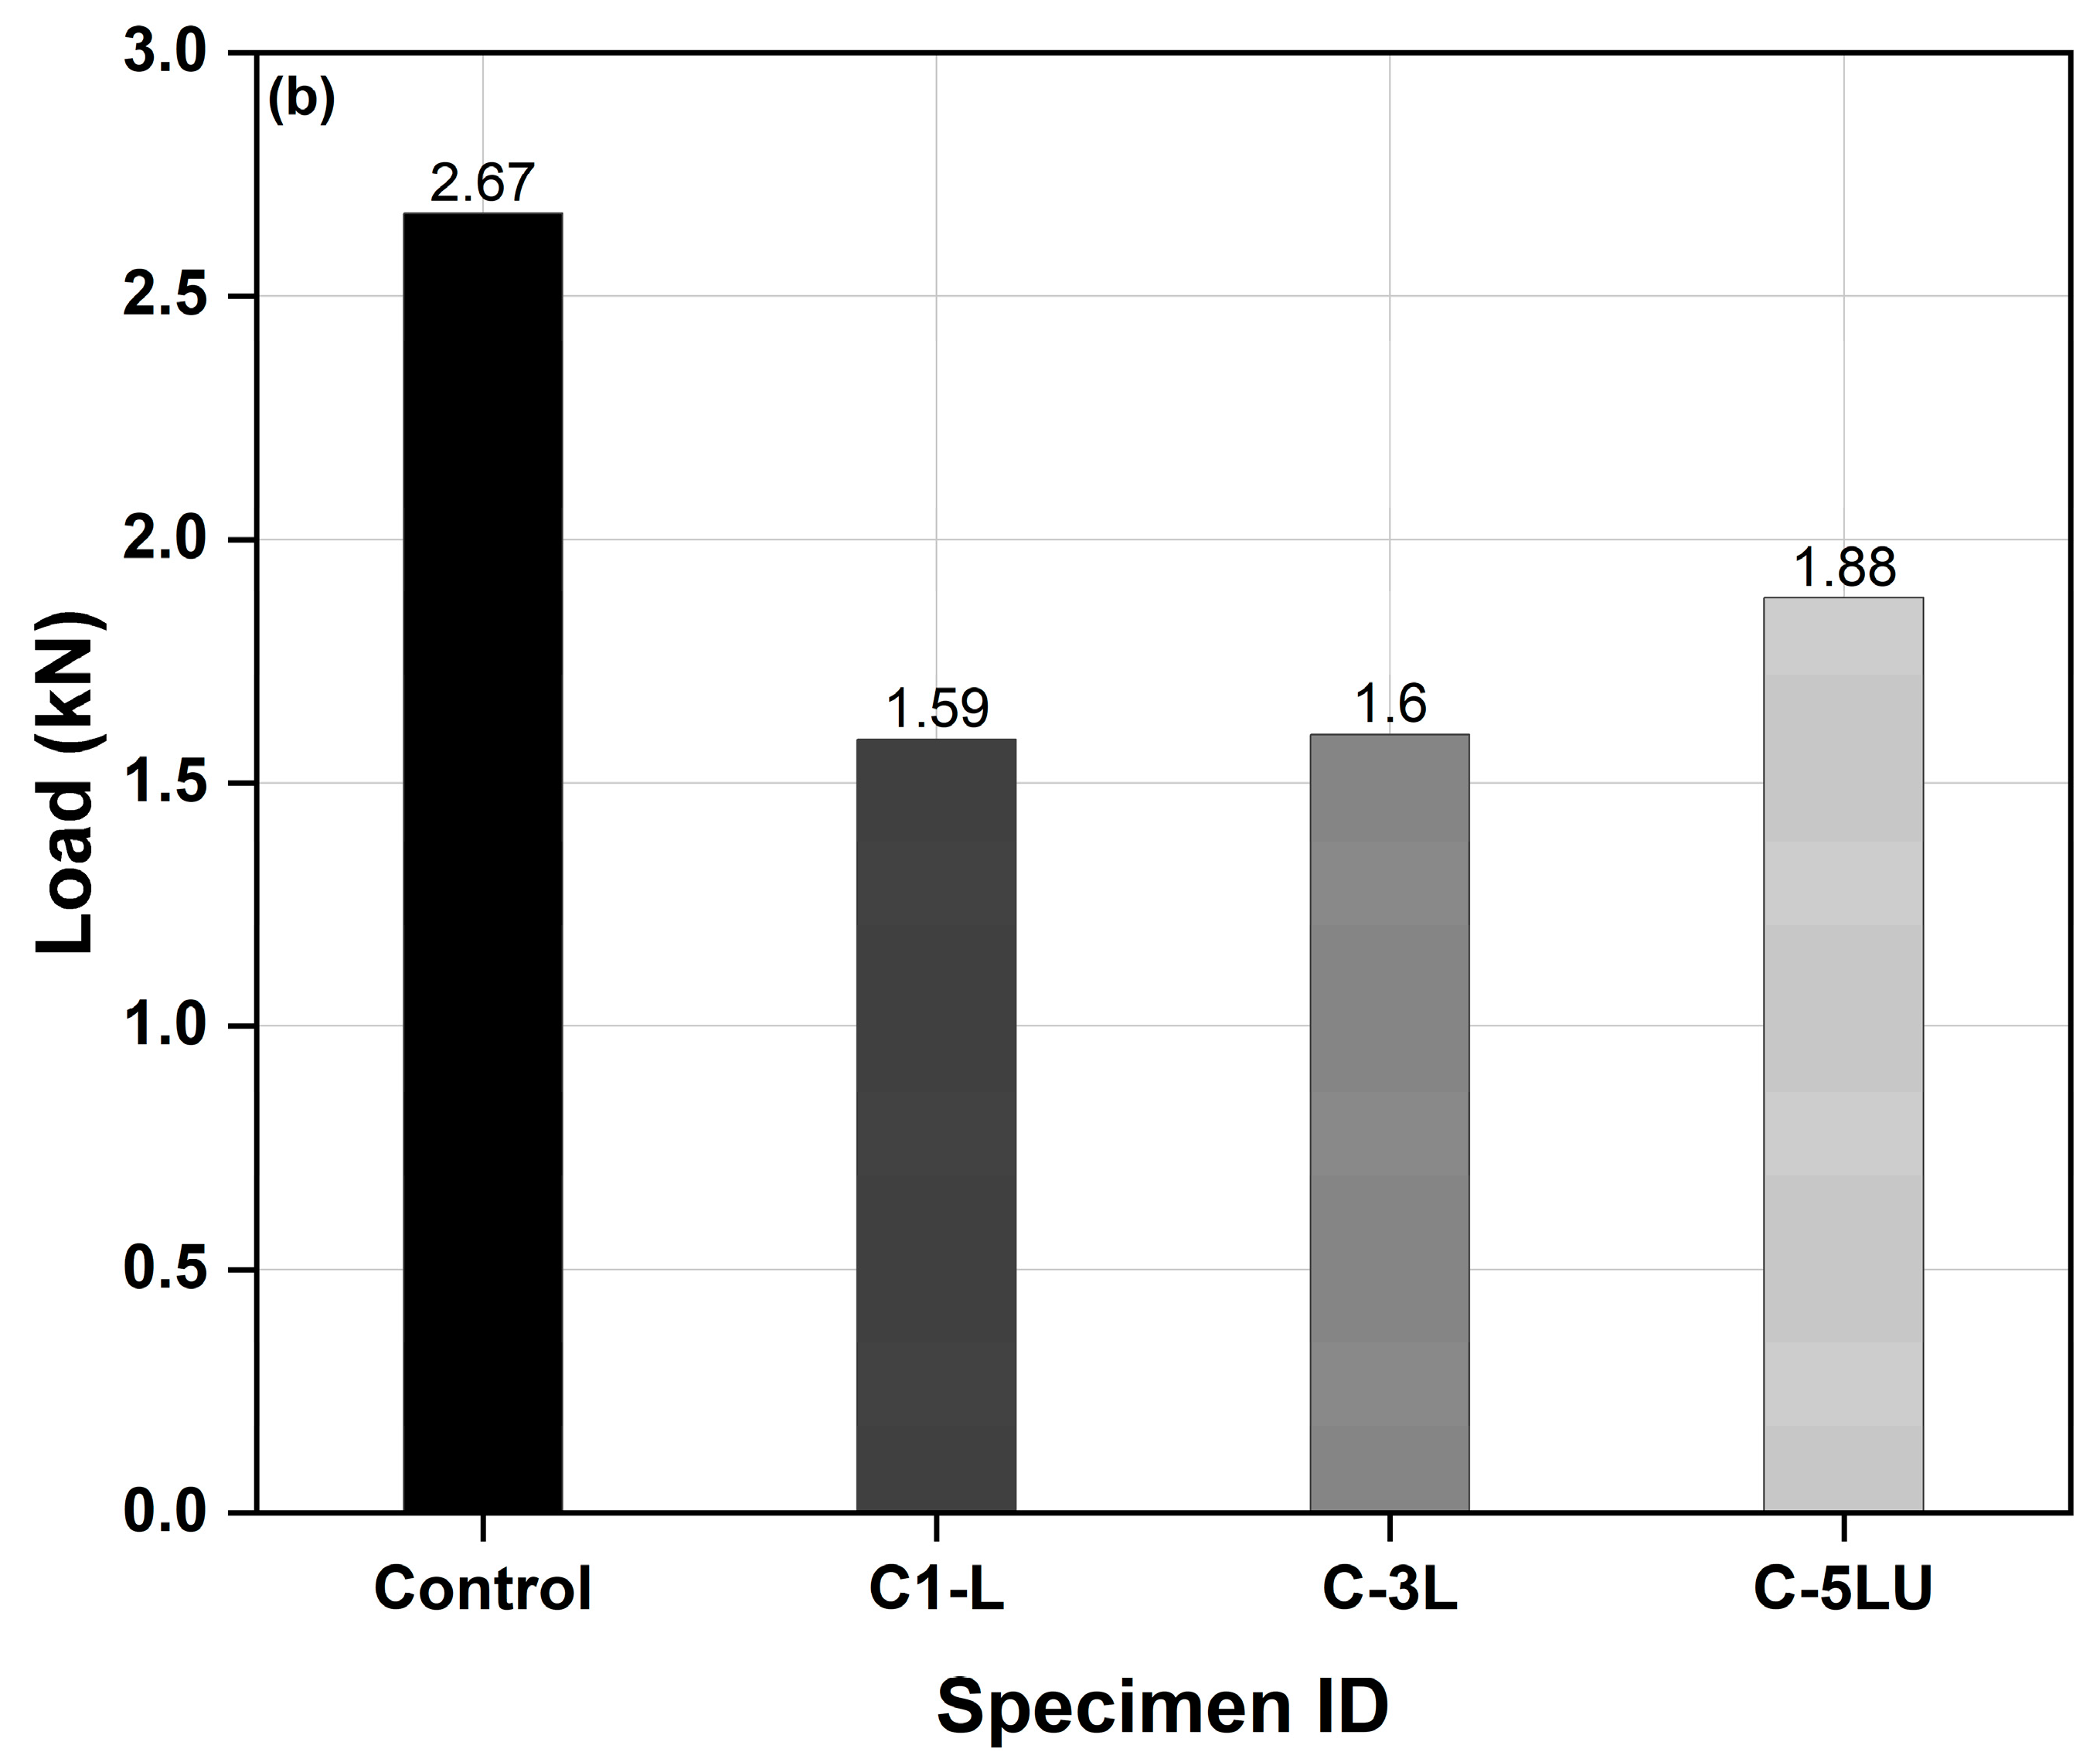
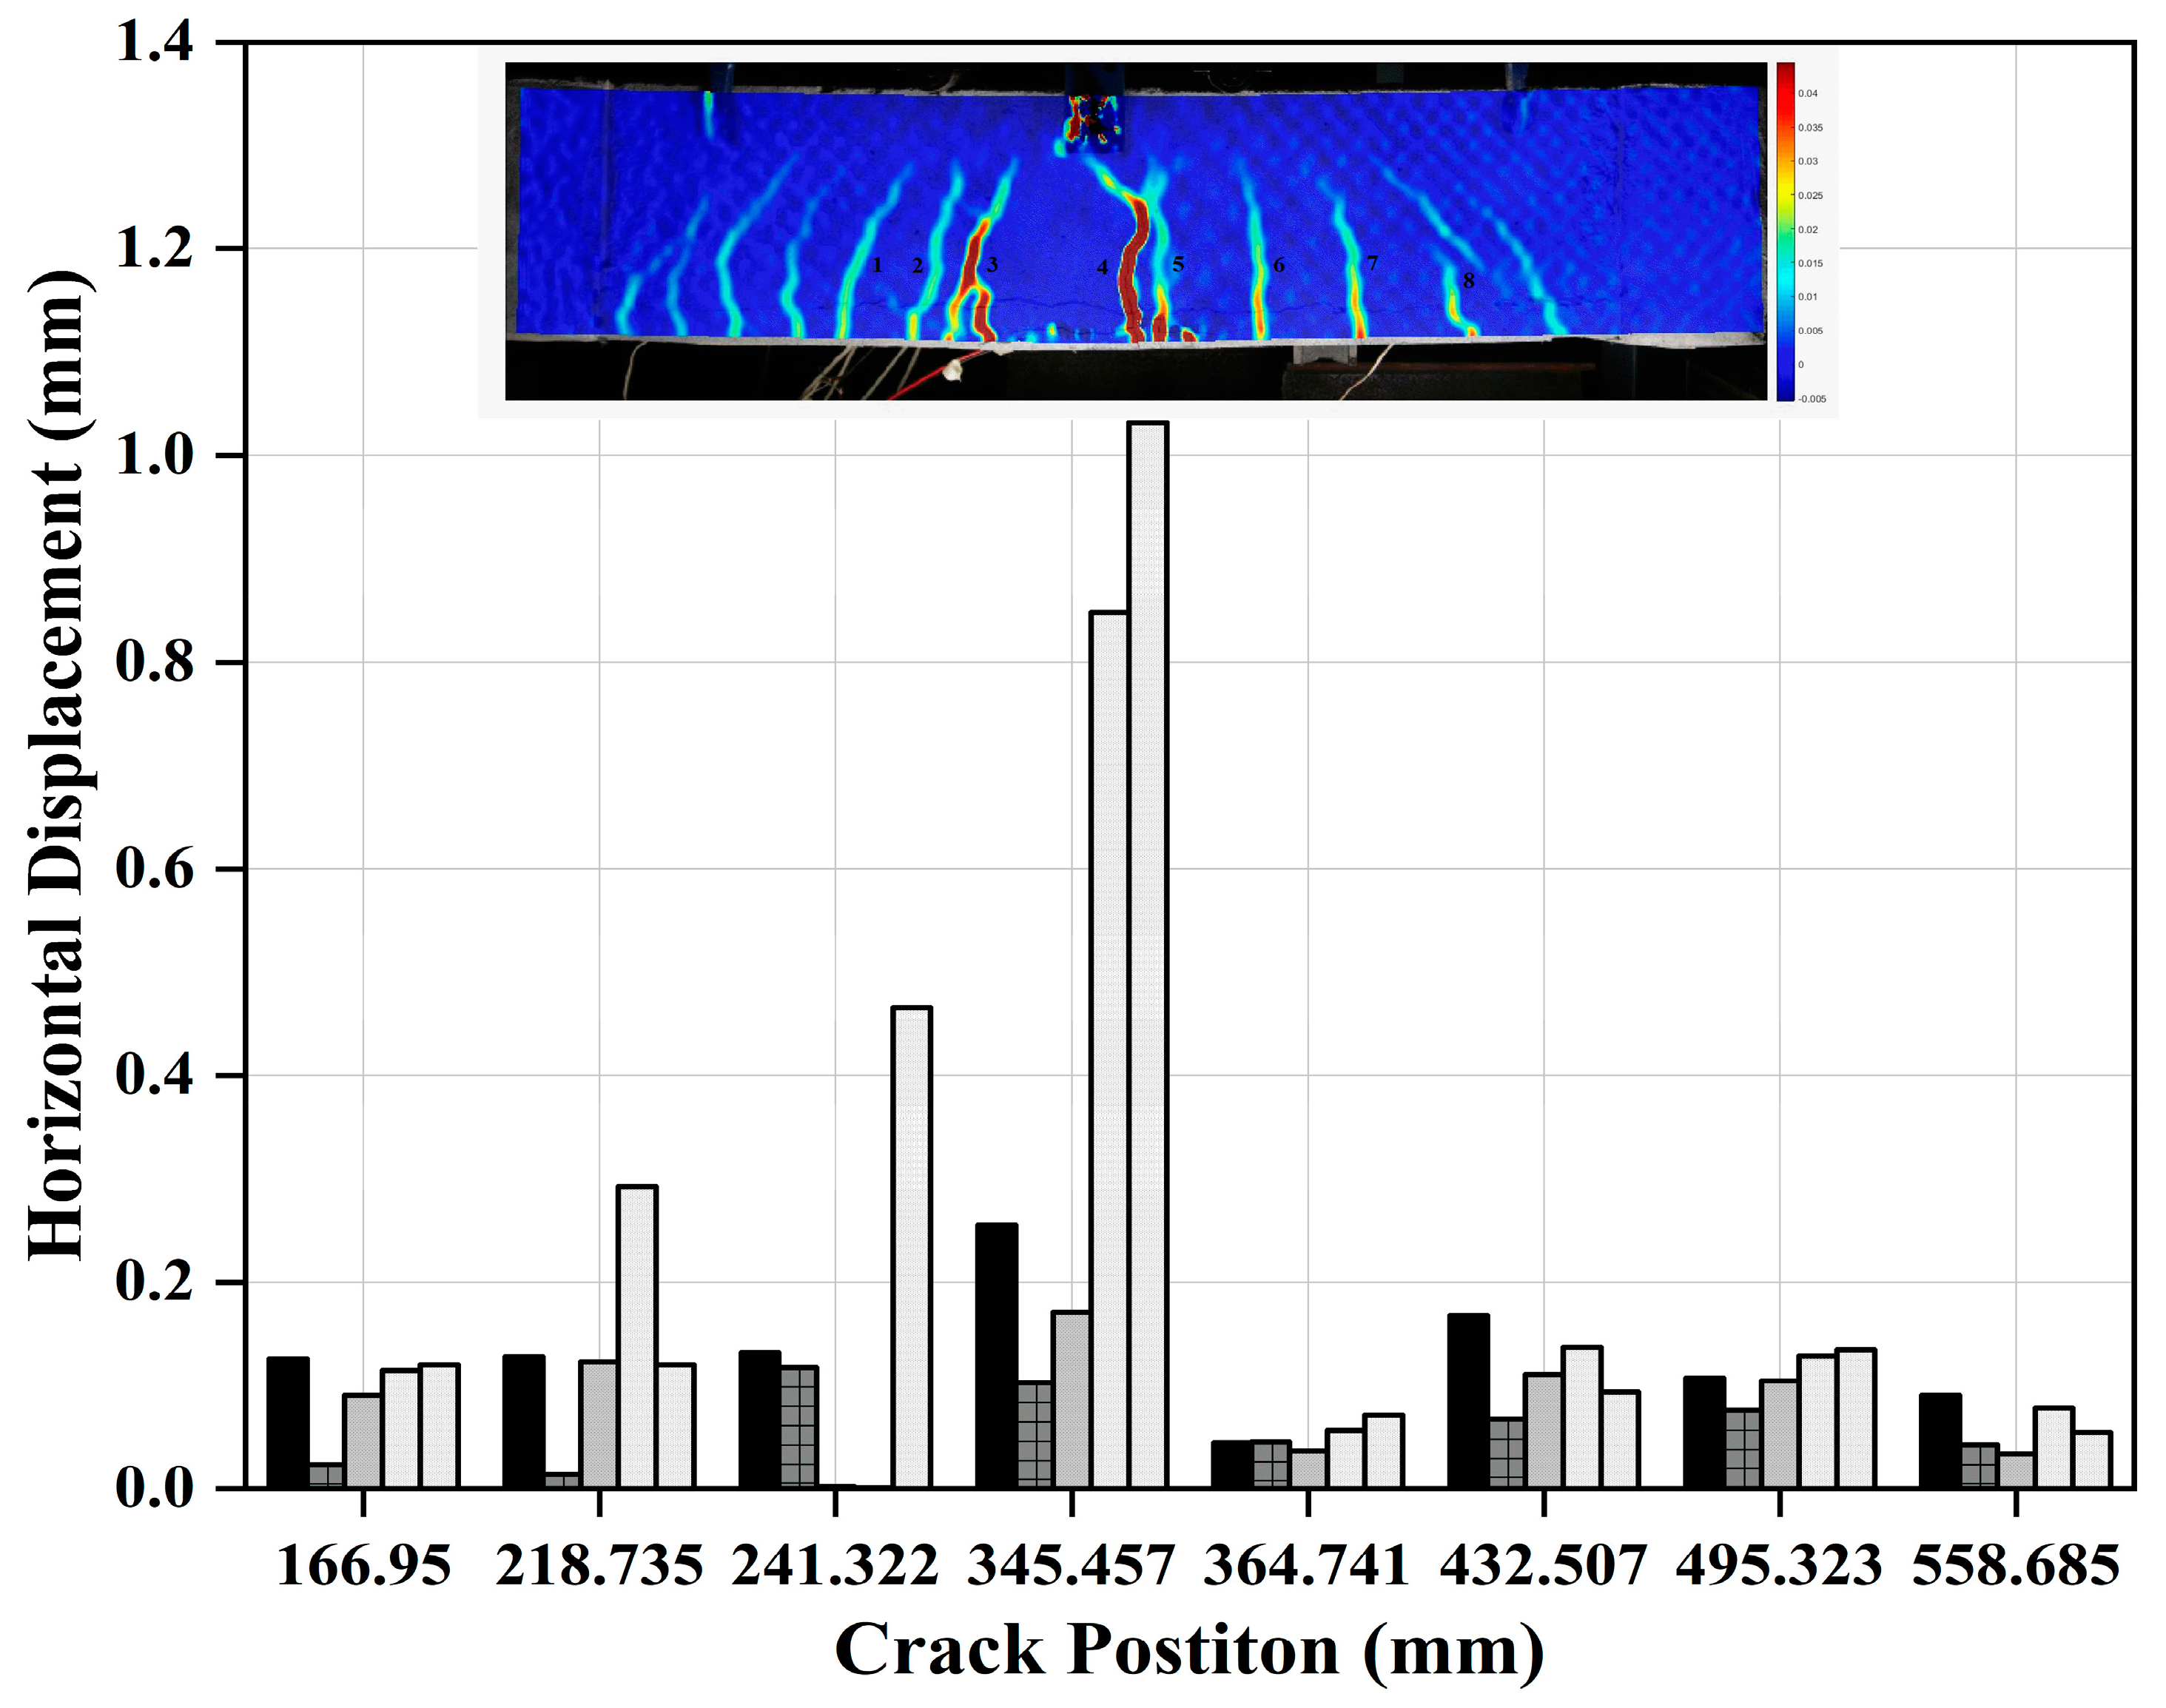
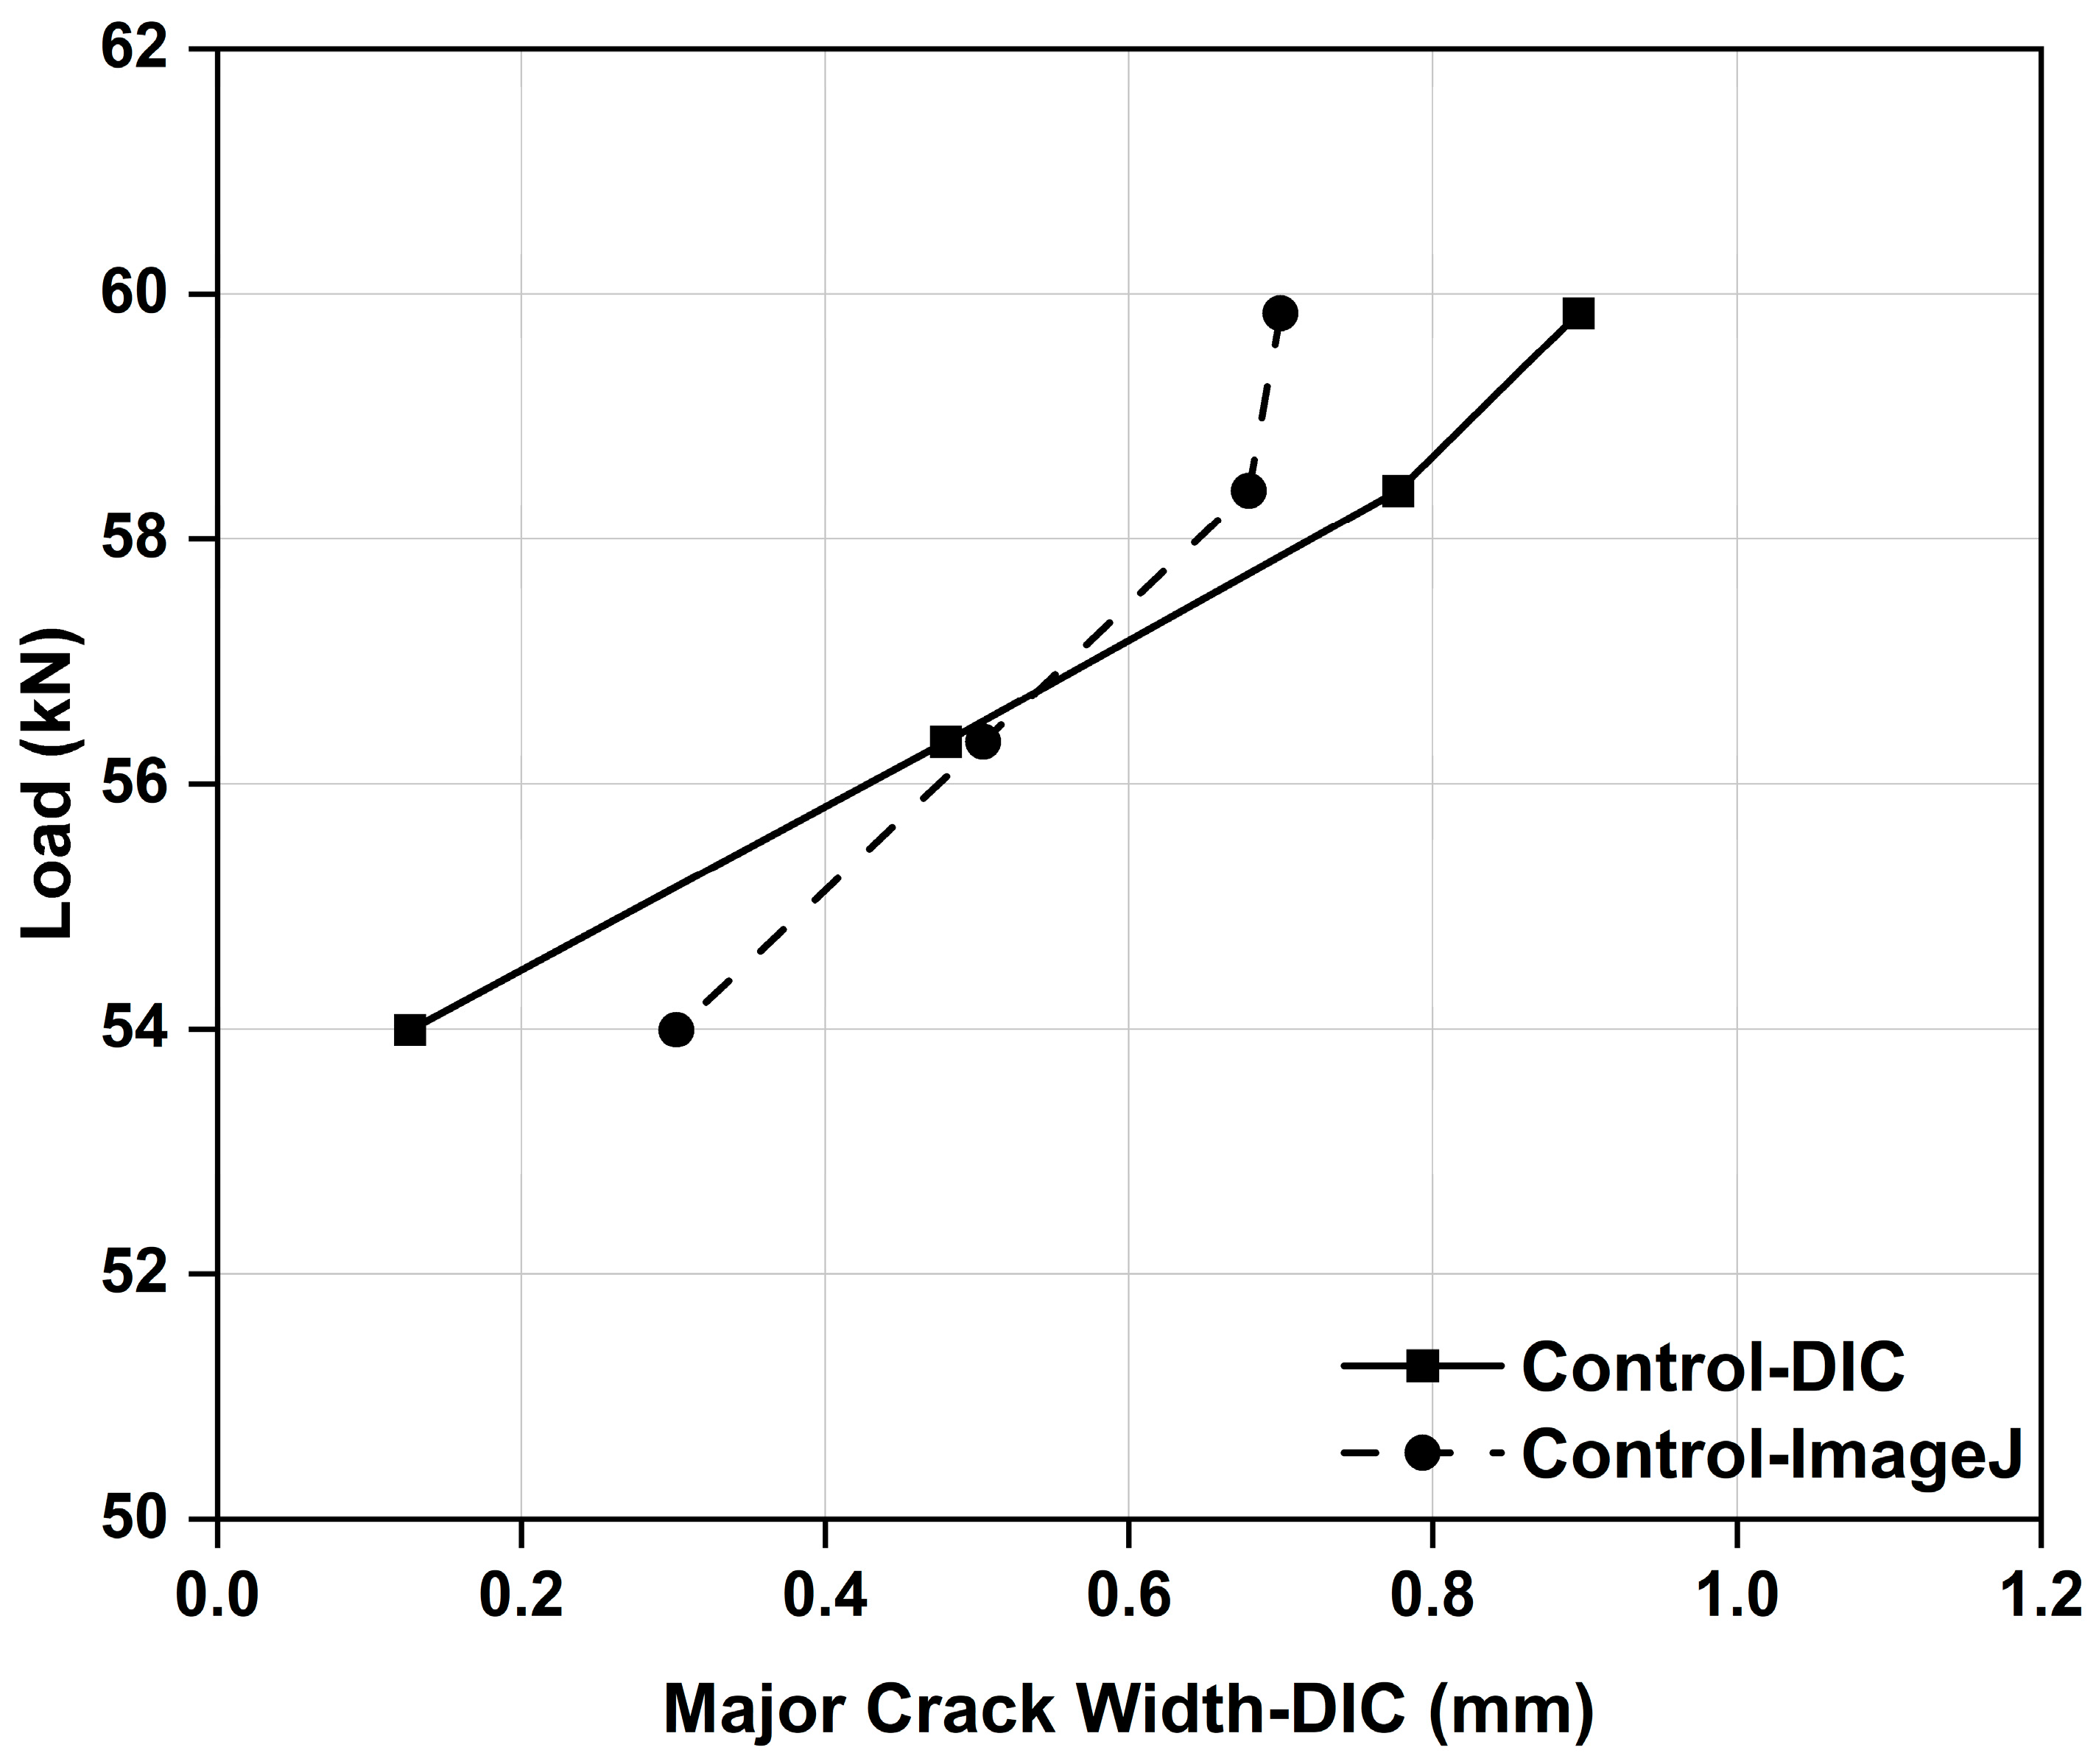
4.7.1. DIC Crack Width

A crack width analysis was carried out on all the tested beams. A major crack was identified, and its crack width was tracked at various load levels for BTRM- and CTRM-strengthened beams. A plot of the crack position against the horizontal position on the specimen is reported in Figure 17. Also, the idea behind presenting this figure is to understand the crack pattern and its location along the length of a specimen. For ease of understanding, only one specimen, i.e., C-5LU, was considered to show this method of crack location. From this plot, the location of the major crack can easily be located, which is within the constant moment region in comparison with the DIC crack contour [49,50]. This plot provides valuable information on the major crack widths and the minor cracks spread throughout. The highest value of the bar chart corresponds to a major crack observed in the test specimen. The idea of presenting crack widths in the form of a bar chart was to locate the major crack from the graph. It can be pointed out that the major crack is concentrated around the constant moment region, and its easy identification can be achieved by looking at the highest value of the bar in the chart. The captured images were cropped to the required resolution of 4710 × 1104 pixels so that the entire RC beam image was processed. Crack widths were extracted by locating two pixels on either side of the major crack at the rebar, and its evolution was tracked throughout the experiment. The same procedure was compared with ImageJ software to verify the method used on DIC images, and a decent agreement was found, as reported in Figure 18. The crack width measurement from DIC and ImageJ differs as the load increases; however, this measurement error is evident as the crack widths were measured using two different software programmes.
To understand the major crack development, Figure 19a,b are plotted. In these figures, it is quite obvious that the control beam shows larger crack widths at all stages of loading. The contribution from BTRM and CTRM can be clearly identified above control specimens due to smaller crack widths, especially as the number of layers increases. Similar observations were made in some studies in the literature. However, in the case of the B-3L specimen which consisted of three layers of textile reinforcement formation of a smaller crack width is possible at ultimate load. On the contrary, in the case of B-5L, the crack widths were much more exaggerated in the B-5L specimen at ultimate load due to debonding at the ends. A crack width of 0.2 mm was observed in the control specimen around the yield load, and in a similar fashion, all the strengthened beams show a crack width of less than 0.2 mm in the case of BTRM and CTRM before the yield load. Although it is intuitive to assume strengthened beams would contribute to smaller crack widths, as seen post-yield load in the case of BTMR- and CTRM-strengthened specimens, the process of looking into this aspect using DIC was missing in some of the studies in the literature. Hence, this study uses a practical example to strengthen the crack width reduction notion in strengthened beams.

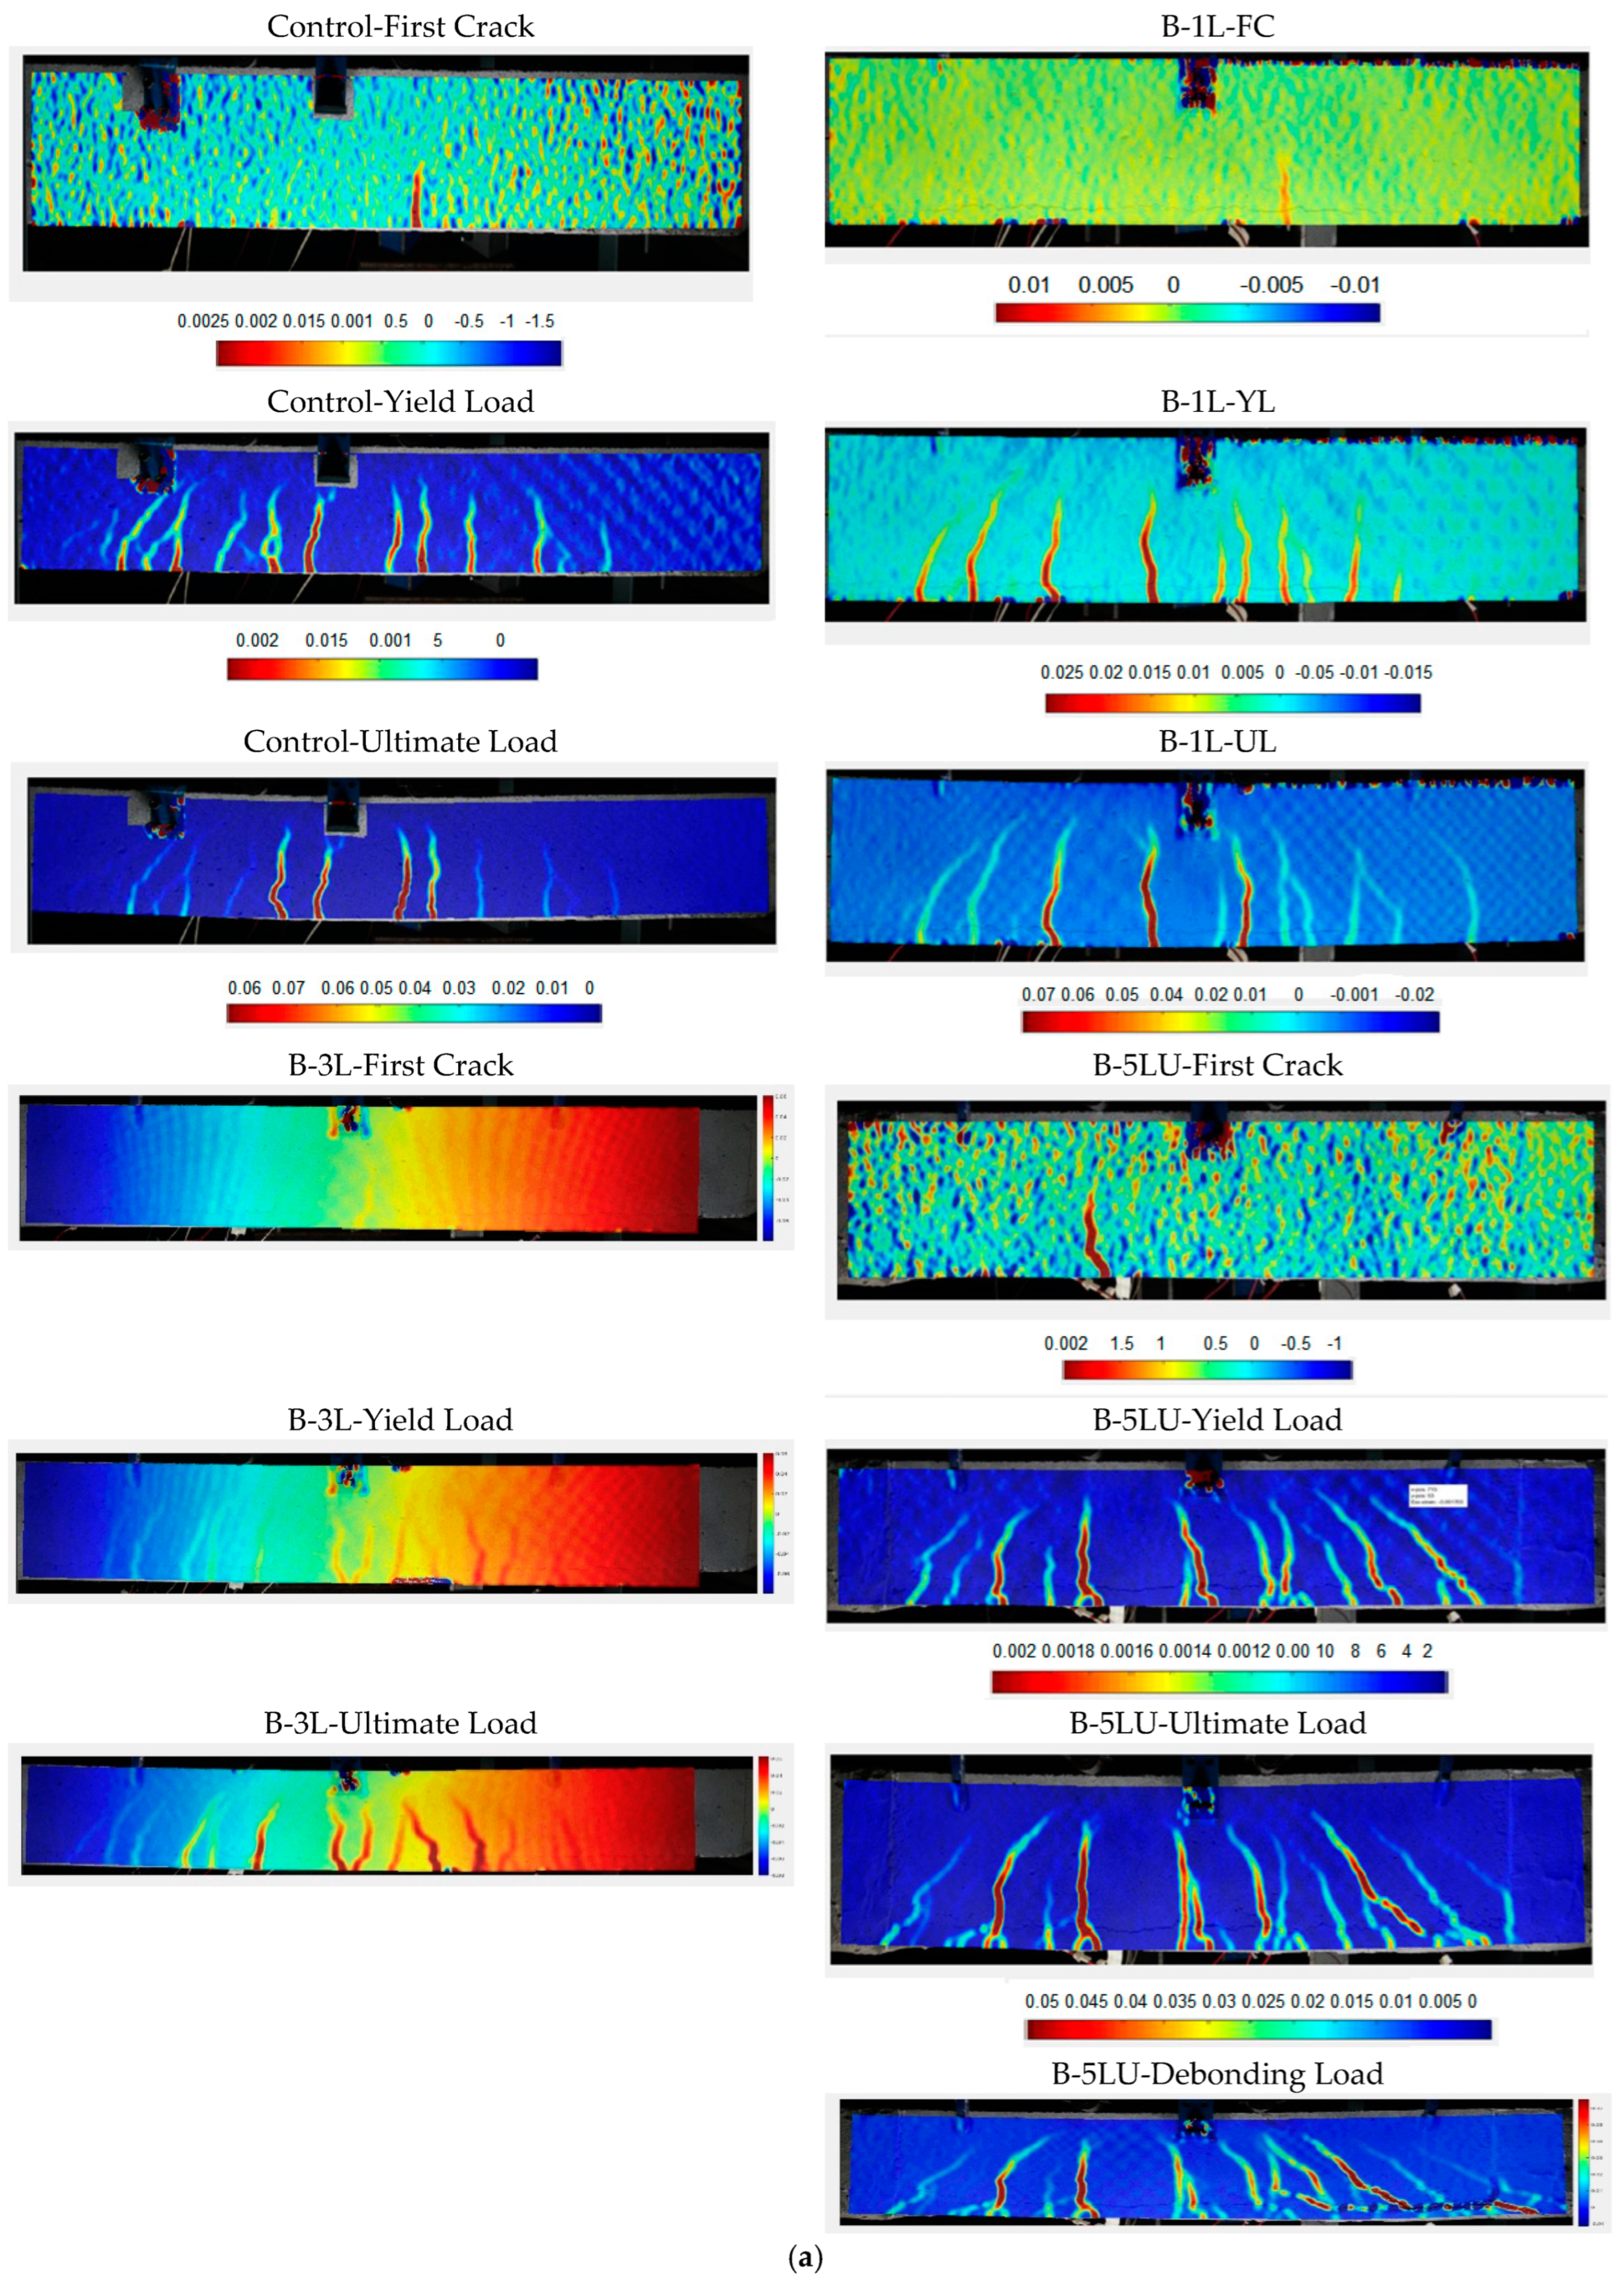
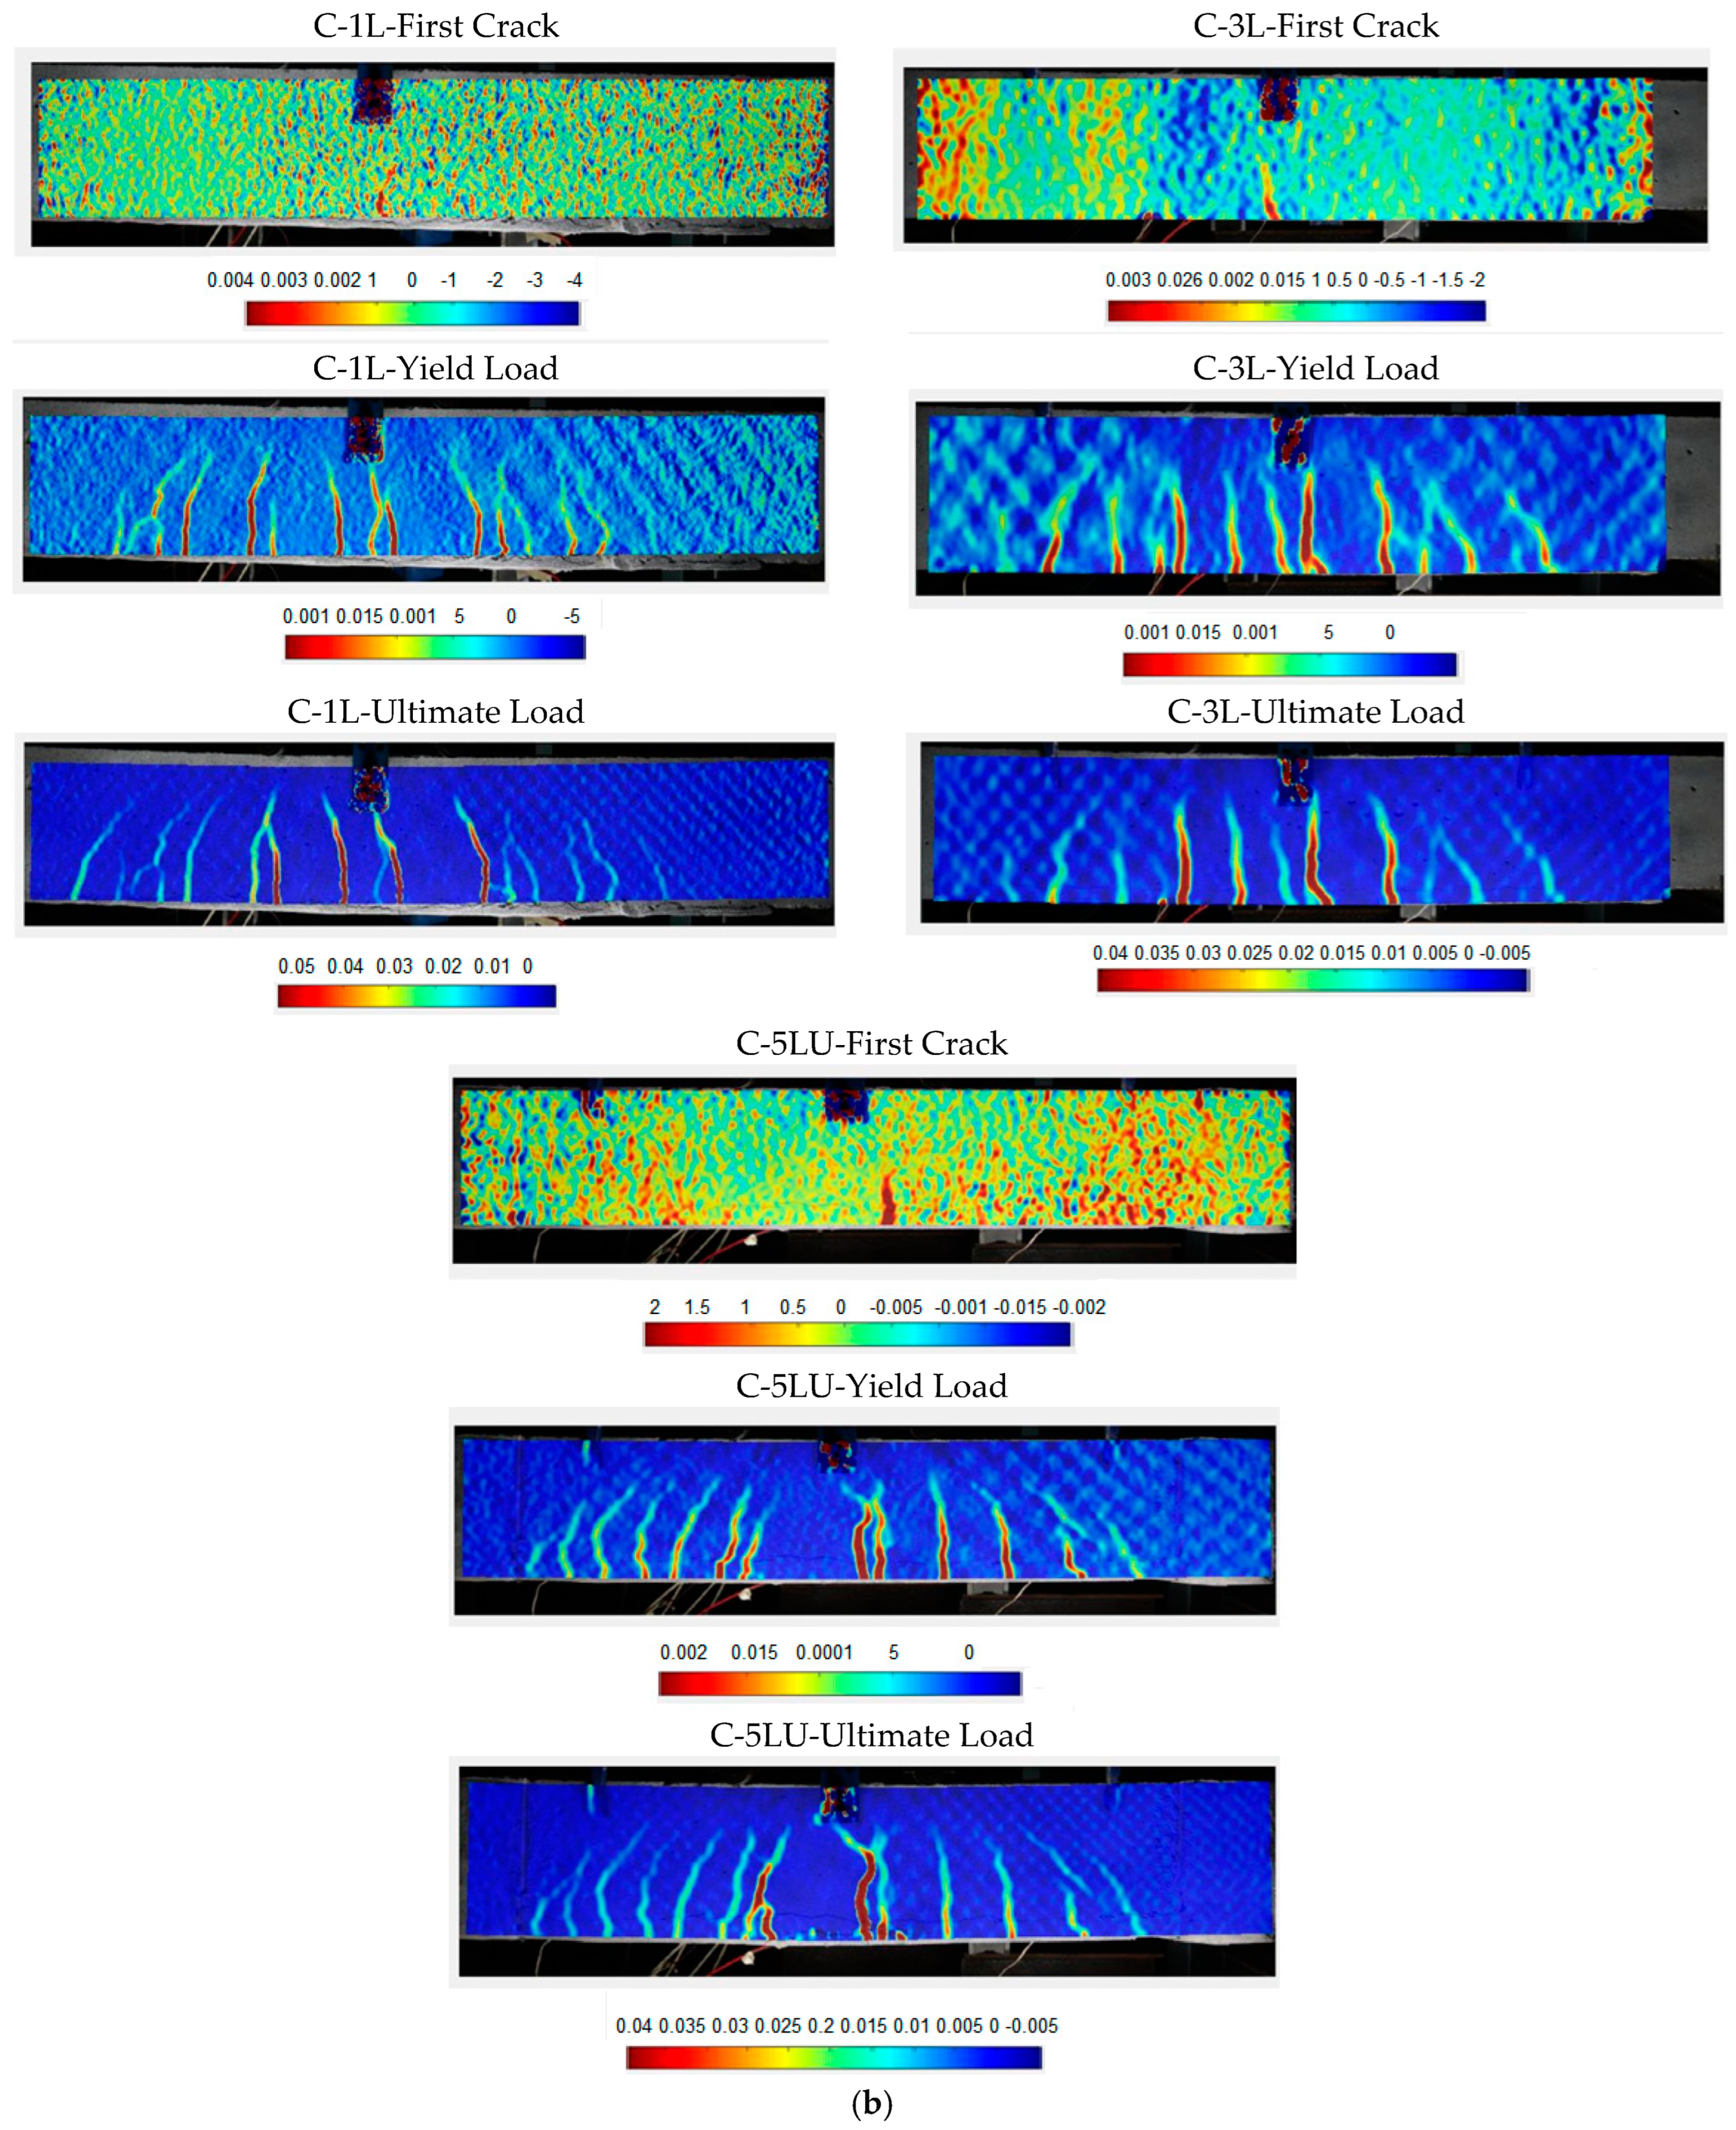
4.7.2. DIC Crack Pattern

The analysed DIC images provide a lot of information on the crack location, crack spacing and its propagation. Only the major cracks, especially in the central constant moment regions, can be identified from the experimental crack patterns recorded. In contrast, multiple hairline cracks almost invisible to the naked eye can be probed using DIC. Although the clear-cut distinction between different load stages, i.e., first crack, yield and ultimate loads, could not be well defined from the DIC plots, the typical three-stage trend of the strengthened beam can be identified from the load versus deflection curves. The Lagrangian strain εxx crack pattern plots are reported in Figure 20a,b. They are categorically grouped according to the first crack, yield and ultimate load values.
The control beam sustained three major cracks, whereas the strengthened beams exhibited between two to four cracks. Different crack patterns can be observed in beams strengthened with basalt and carbon TRMs. BTRM beams with one layer show three major cracks. A similar trend can be observed in BTRM with three- and five-layered textiles [41,51]. On the other hand, CTRM-strengthened beams showed smaller crack spacing compared to BTRM beams. This difference could be attributed to textile grid spacing, as the basalt textile had a 5 × 5 mm larger grid size than the carbon textile. Owing to the presence of U-wraps in the C-5LU specimen, the cracks congregate within the U-wrap span, and the major cracks could be seen closely under point loads. B-5LU specimens developed wider crack spacing before debonding, but later-stage cracks concentrated in the debonding region, narrowing the crack spacing.

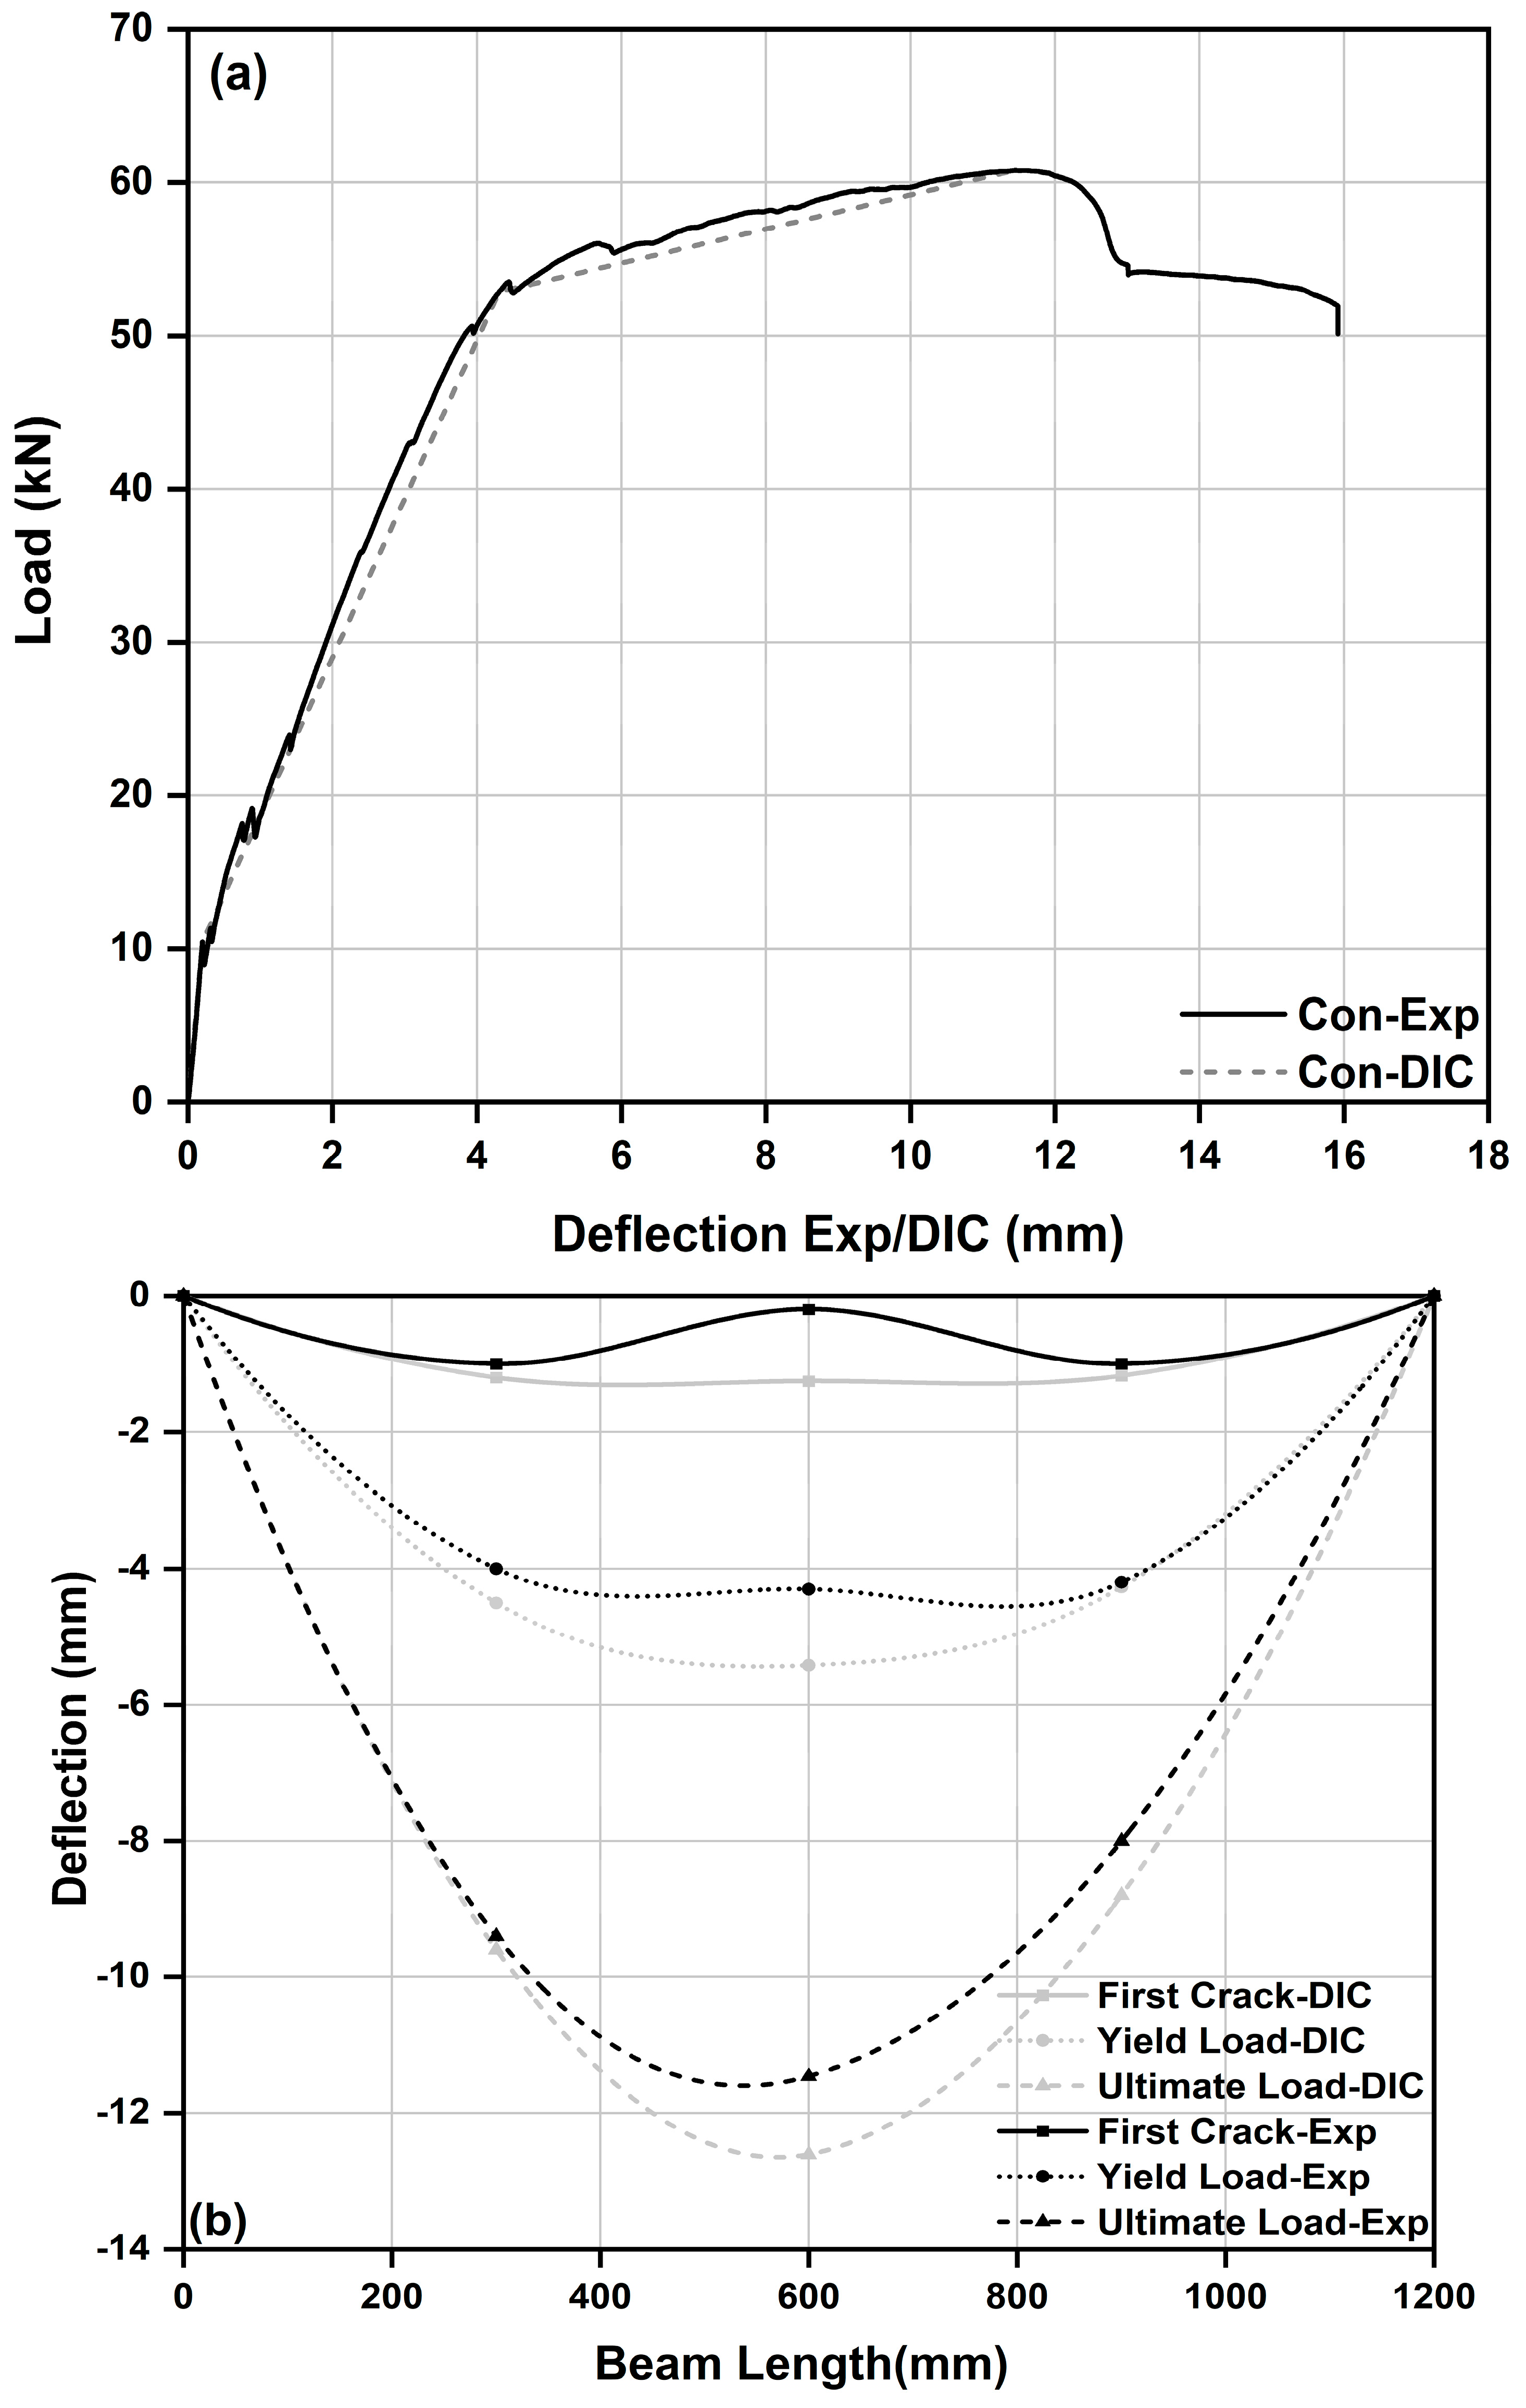
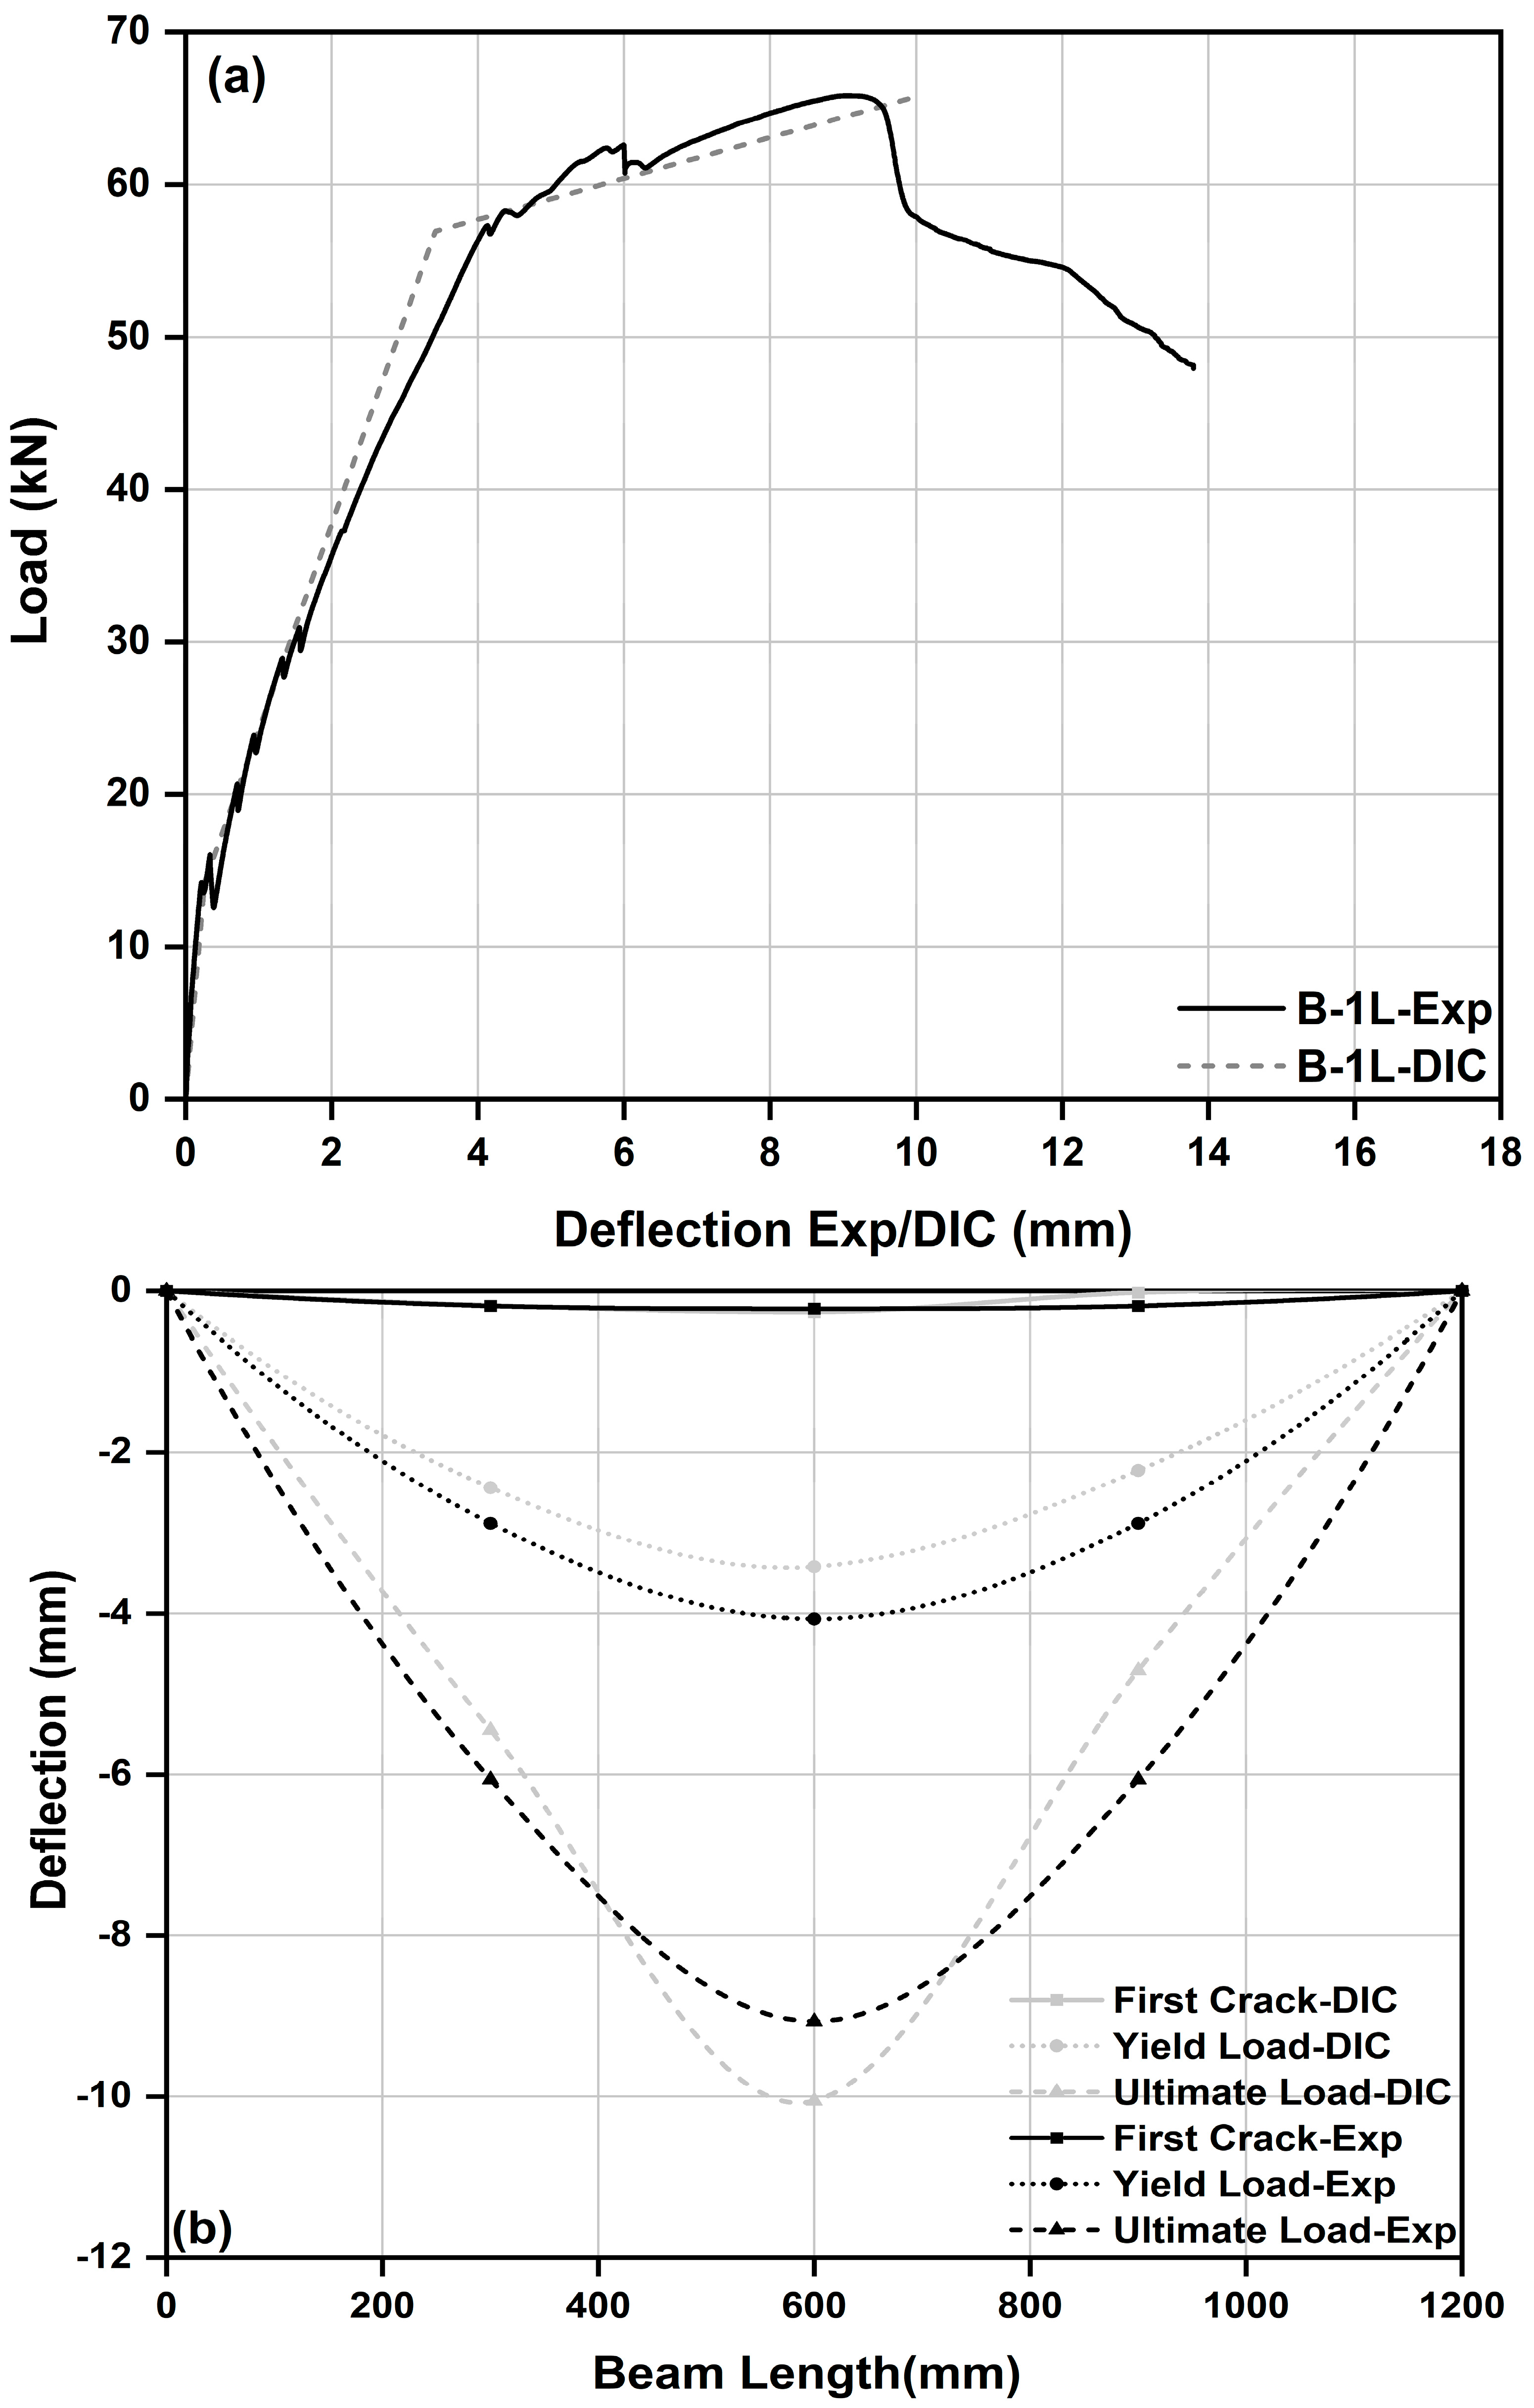
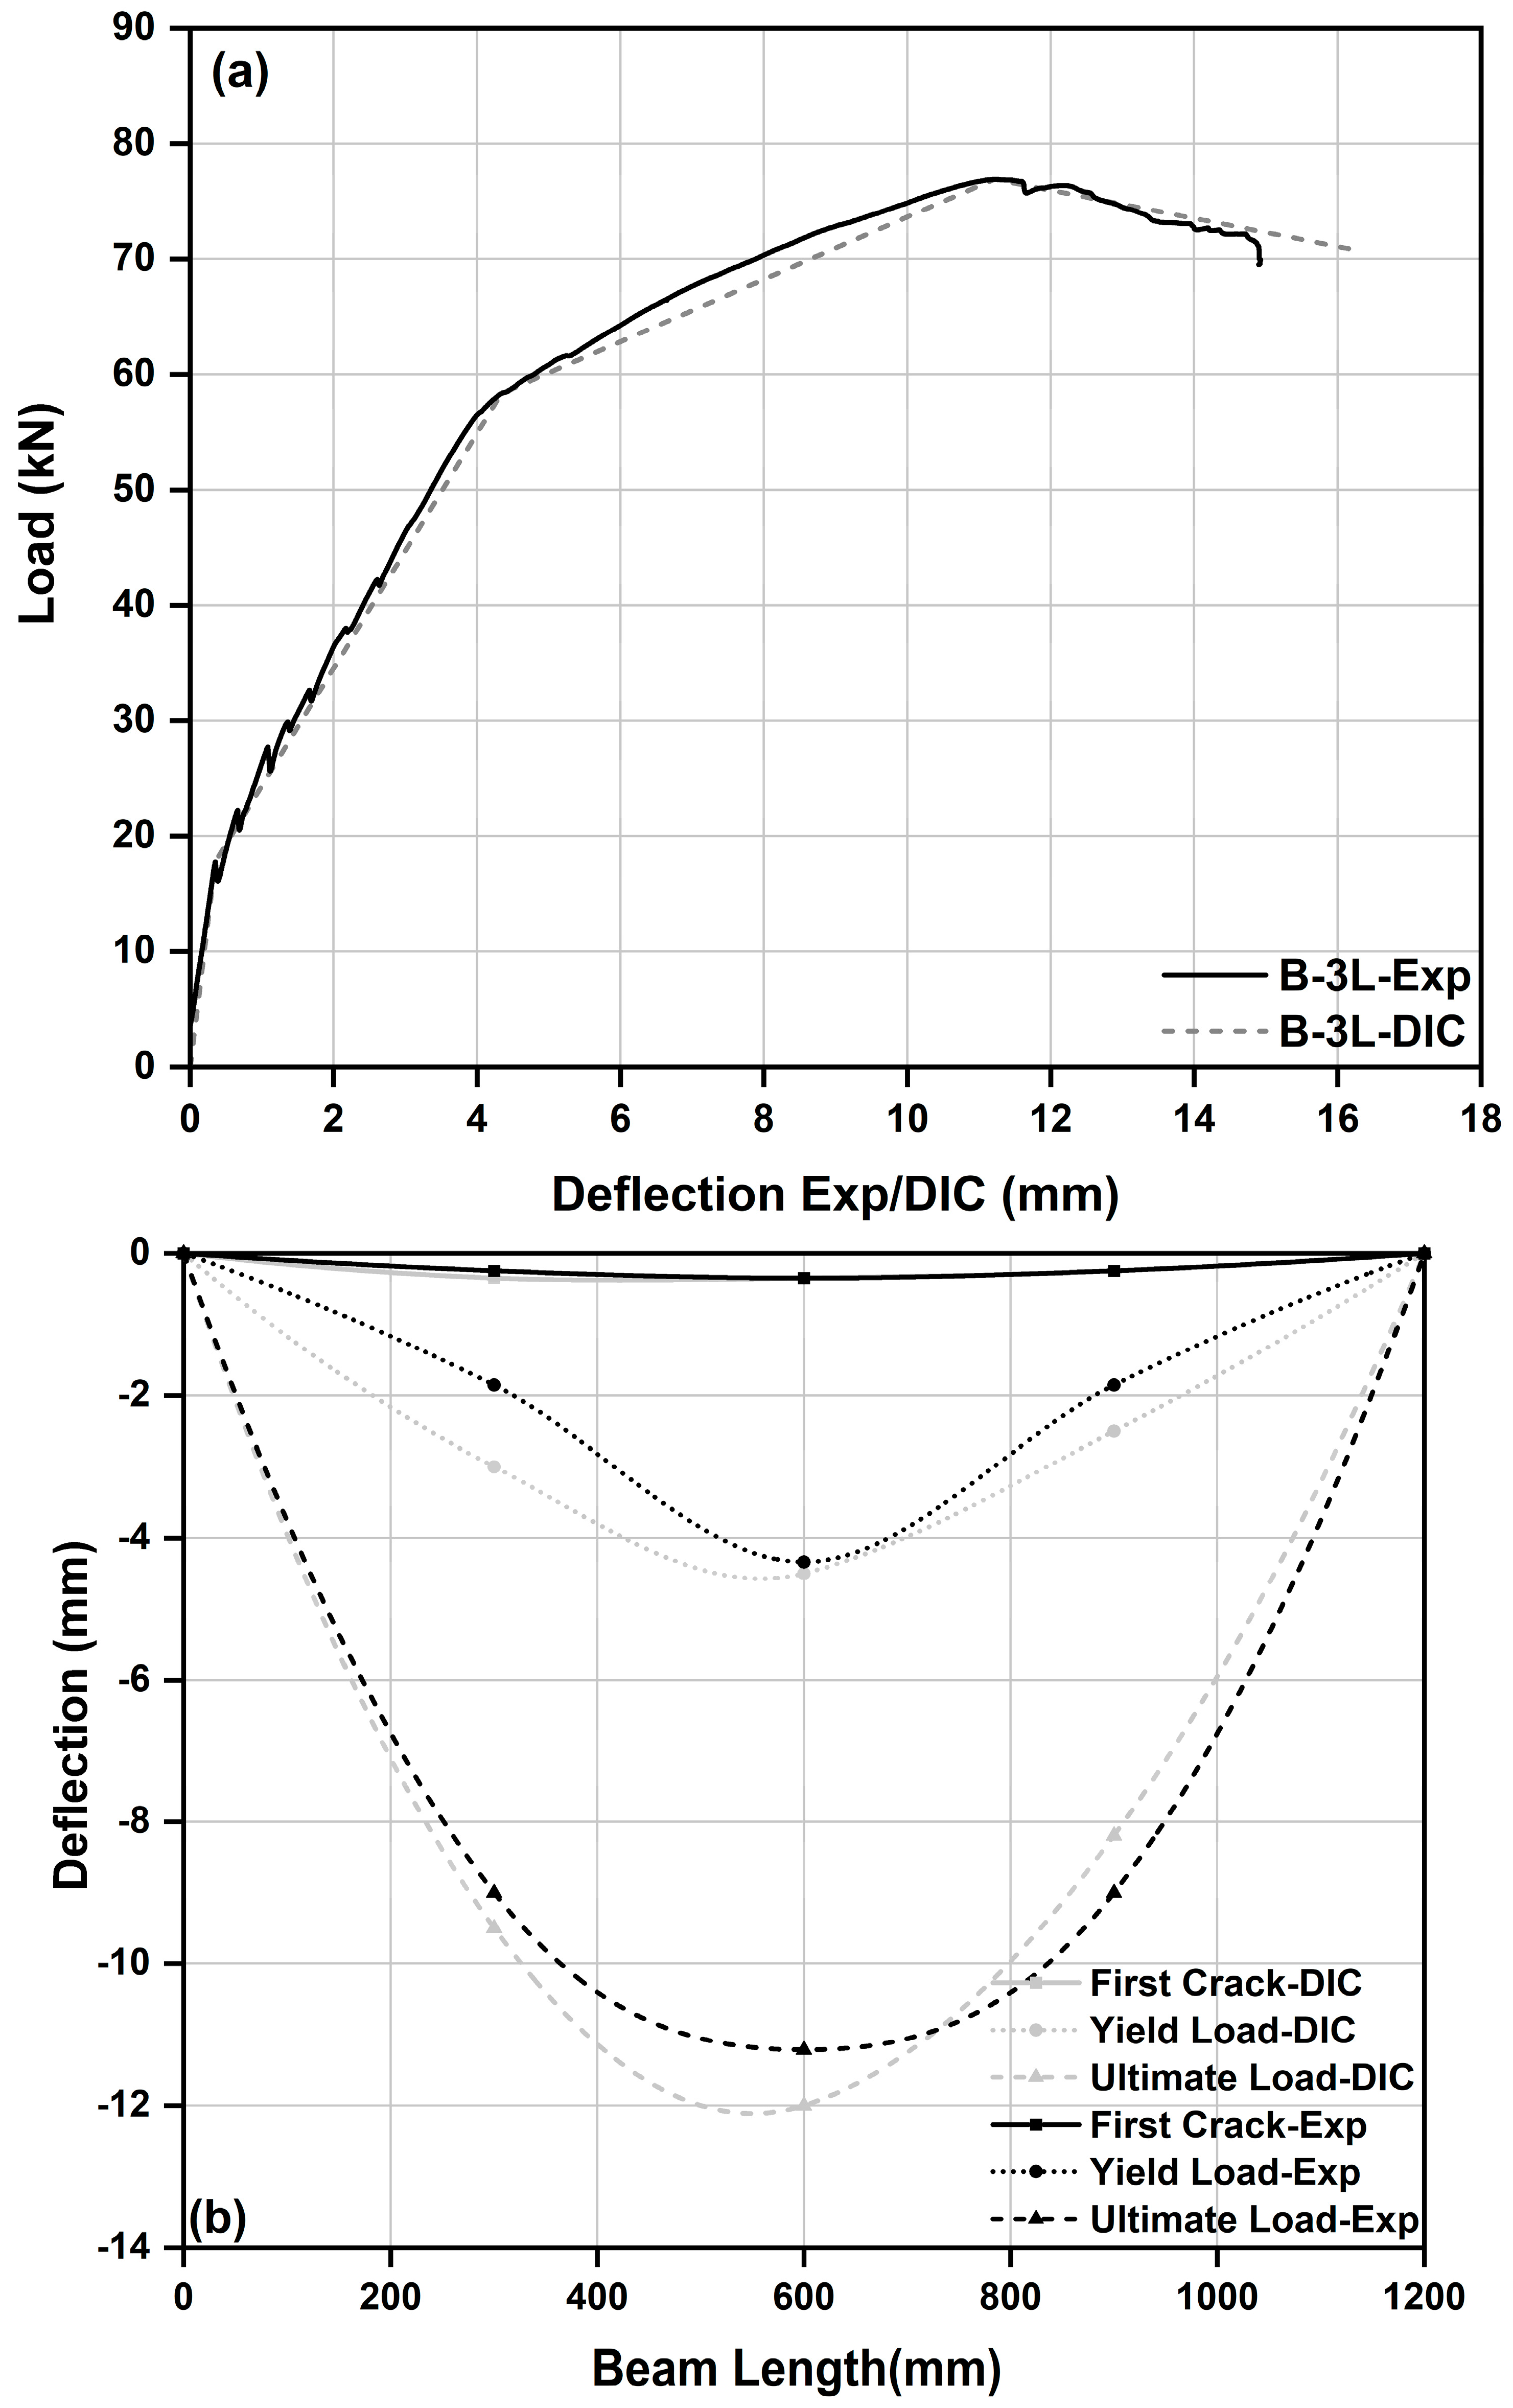
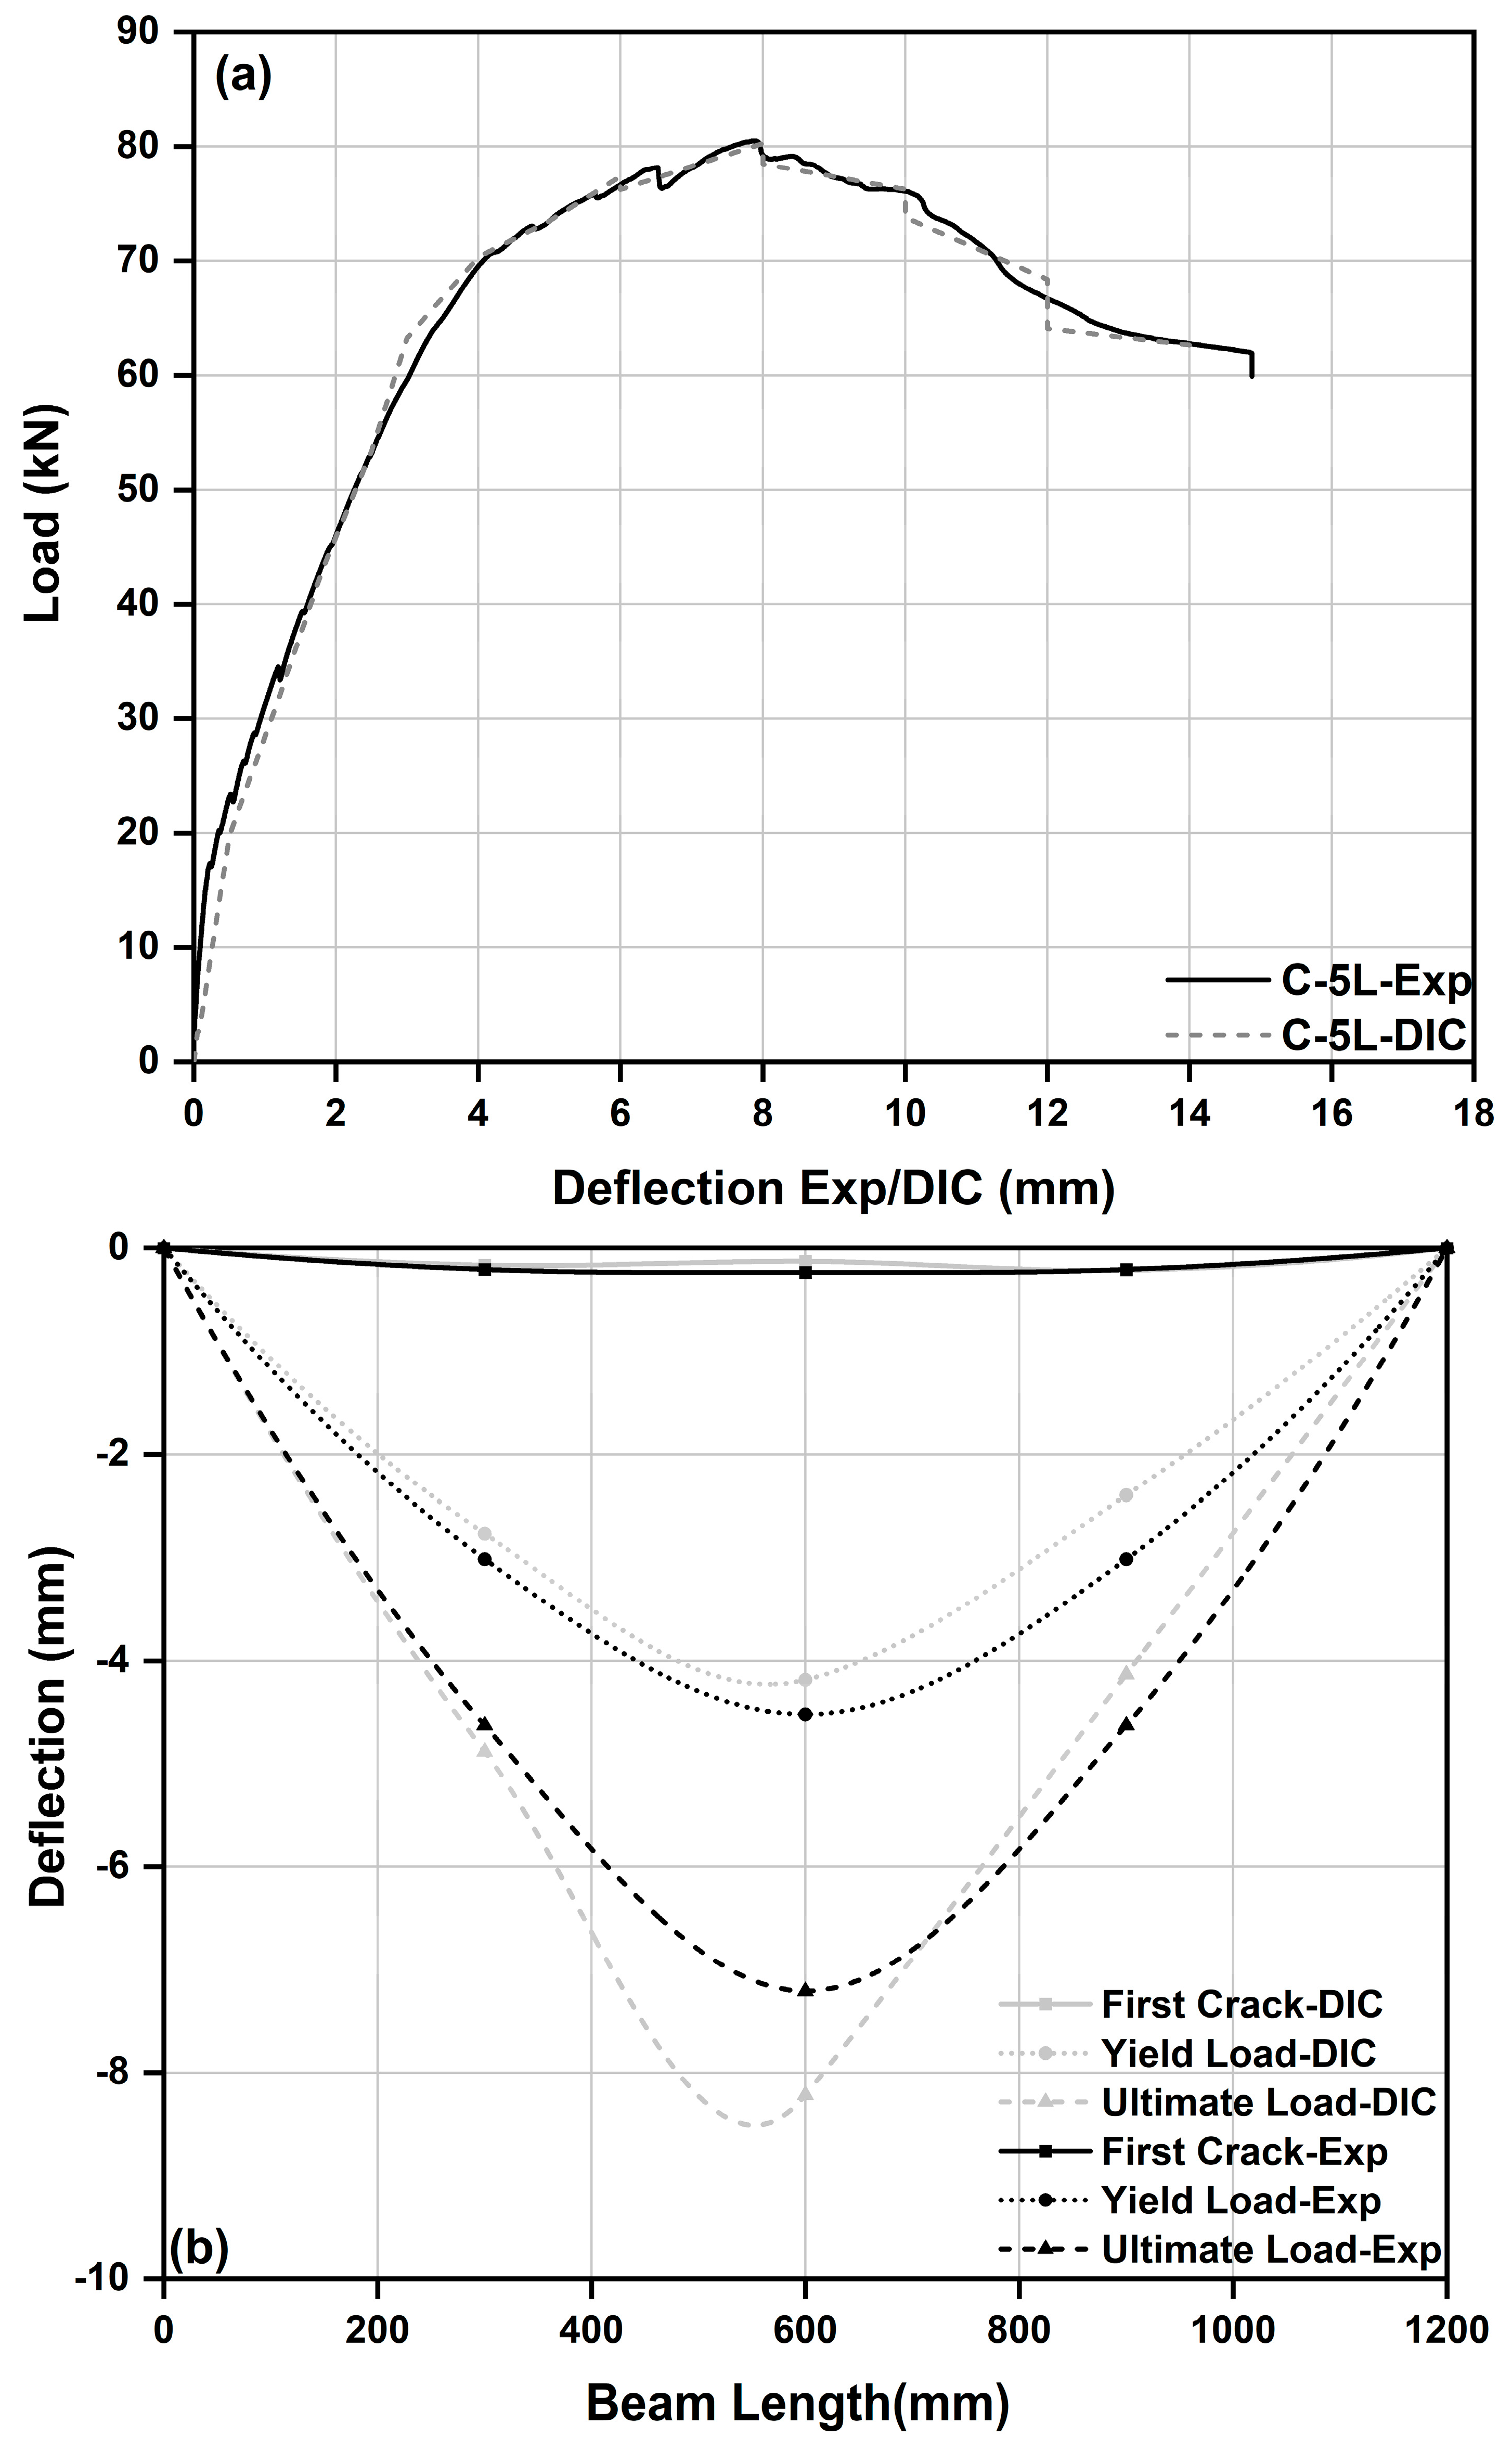
4.7.3. Experimental Deflection versus DIC Deflection

Although theoretical crack width validation and an analytical method would have added more to the experimental results, they were not part of the current study. In addition to crack width, position location and spacing, DIC was used as a non-contact displacement measurement technique to confirm the displacements obtained using LVDTs. This concept has been applied in the literature to obtain the strain, curvature and deflections of tested specimens [45,49,51,52,53,54,55,56,57]. The DIC displacements measured were recorded at the same point where LVDTs were placed in the experiment. Three load levels, the first crack, yield and ultimate loads, were selected and compared to verify the experimental results. As images were captured at a 10-s time interval, a collection of almost 250–300 images was made which helped in plotting the entire load versus displacement curves. Once the DIC was finished, multiple data points were used to plot the entire load-displacement curves. The displacement correlations obtained from DIC and experiments were nearly equal to the goodness of fit, as shown in Figure 21a,b and Figure 27a,b. In addition to the central deflection measured, deflections recorded at quarter spans were also plotted as deflection profiles to visualise the bending curvature along the length of the beam. The control beam, B-1L, in Figure 21a,b and Figure 22a,b shows that the central deflection and deflection profile obtained is similar to the experimental curve, whereas the B-3L specimen showed a clear match with the central experimental deflection in Figure 23a,b. In contrast, minimal offsets in the deflection profile observed are reported in Figure 24b. The reason could be attributed to manual error arising out of choosing the deflection measurement point while noting DIC quarter deflections. The B-5LU specimen deflection profile shifted in Figure 24a, and its effects are seen on the deflection profile presented in Figure 24b. This could also be attributed to sudden non-uniform movement at the post-first crack and debonding stage. The C-1L beam shows similar behaviour to B-1L in the deflection profile as reported in Figure 25a,b. The load-deflection curve was terminated at the ultimate stage as no match could be obtained post ultimate load. Similarly, the C-3L and C-5LU beams showed a consistent match between experimental and DIC recording in terms of central and deflection profile as shown in Figure 26a,b and Figure 27a,b. The idea of plotting quarter-span deflections was to obtain more understanding of the deflection. The results plotted in the figures showed that the obtained DIC quarter deflection values were slightly more conservative.
The current study showcases the effect of BTRM- and CTRM-strengthened reinforced beams in flexure. The study clarifies that BTRMs and CTRMs can successfully increase first crack loads. The first crack load increment is almost proportional to the textile reinforcement percentage. As only seven specimens were tested in the current experimental campaign this result should be treated carefully. The influence of basalt textile layers, especially one and three, shows a similar response until yield point, and thereafter, the layer effect occurs resulting in ductile behaviour in the case of the B-1L and B-3L specimens. In the case of B-5LU, the initial response is stiffer, whereas ductility greatly reduces post yield load. In the case of C-1L and C-3L, there is no marked improvement in either stiffness or ductility. Therefore, from the current study, it is clear that to achieve the required serviceability requirements in a strengthened reinforced member textile layers that go into TRM must be designed with utmost care. The current experimental results need further validation in terms of analytical and FE modelling, which is underway. Also, the performance of the two textile systems is being studied by the same research team. Overall, the parameters studied, such as load capacity improvement, ductility indices and energy absorption indices, evidence the benefits of the BTRM and CTRM strengthening technique. In addition, the present experimental study throws light on the application of DIC to study strengthened reinforced concrete beams. Therefore, with the evaluation of experimental results, the following section presents concluding remarks.
The limitations of the current study are as follows: A real-time experimental crack width evaluation can be compared to DIC and ImageJ crack widths. As the results from the current study are from a small group of specimens, the observations and results must be carefully considered. An analytical and FE modelling can further increase the credibility of the current experimental results.

5. Conclusions

This study presented on strengthening reinforced concrete beams using basalt and carbon textiles provides an understanding of the flexural behaviour of strengthened flexural members at various load stages.
The first crack loads of the BTRM- and CTRM-strengthened specimens show linear trends suggesting that cracking loads can be easily calculated for the required strengthening jobs.
Yield load and ultimate loads demonstrated improvement in overall load capacities. The ratios of strengthened specimens’ ultimate loads to that of the control specimen for BTRM and CTRM ranged between 1.08 and 1.32. Therefore, basalt and carbon textiles successfully contributed to the flexural strengthening of the tested specimens. The flexural stiffness provided by CTRM specimens was better than BTRM specimens in the initial stages of loading as CTRM specimens registered higher first crack loads of 20.63 kN and 21.53 kN in the case of one- and two-layered specimens suggesting that the serviceability requirements of strengthened beams can easily be met with appropriate design considering the textile reinforcement percentage. On the other hand, BTRM specimens were more ductile than CTRM. Hence, the ductility lost in a strengthening member can be compensated with the application/design of an adequate number of BTRM layers.
The provision of end U-wraps mitigated the early debonding of BTRM five-layered specimens resulting in an increase of 18.4 kN and 19.68 kN in ultimate loads in BTRM and CTRM, respectively. In addition, in the case of CTRM-strengthened beams, the end U-wraps constrained the crack in the pure bending region.
DIC presented the ease of studying the crack patterns, widths, crack spacing and distribution using NCorr. The crack widths calculated showed that strengthened beams sustained smaller crack widths of ~0.2 mm at the yield load stage for both BTRM and CTRM members. Although the analysis takes more computing power, the DIC results were useful in understanding the overall behaviour of the test specimens. The effect of different layers on cracking could be well understood from DIC. In addition, the benefit of non-contact displacement measurement was explored, which provides an opportunity to double-check the real-time deflections measured in the tested specimens.
Noting the above points from the current study, more studies on the applications of basalt and carbon textile need to be performed to understand the complete nature of these composites. Moreover, as textile reinforcements are generally available in rolls with limited width, the efficient use of lap splices can be studied to understand the effect of TRM splices, especially in flexure.

Author Contributions

Conceptualization, C.K.S.M.; Methodology, N.R.; Formal analysis, N.R.; Investigation, N.R.; Writing—original draft, N.R.; Writing —review & editing, C.K.S.M.; Supervision, C.K.S.M.; Project administration, C.K.S.M.; Funding acquisition, C.K.S.M. All authors have read and agreed to the published version of the manuscript.

Funding

RDF 16-01-17 and XJTLU Key Program Special Fund KSF-E-27.

Data Availability Statement

All the data generated from this study is already presented in the paper.

Acknowledgments

The authors acknowledge the financial support from XJTLU under the RDF 16-01-17 project and KSF-E-27. The first author gratefully expresses his gratitude for the financial support in the form of a PhD studentship. The technical assistance in casting and handling specimens from the Lab technicians of the Department of Civil Engineering at XJTLU is appreciated.

Conflicts of Interest

The authors declare no conflict of interest.

Notations and Abbreviations

U-WrapTRM shaped into U to strengthen beam ends
TRCTextile-reinforced concrete
FRCMFibre-reinforced cementitious matrix
TRMTextile-reinforced mortar
PBOPolyparaphenylene benzobisoxazole
BTRM/CTRMBasalt/Carbon textile-reinforced mortar
DICDigital image correlation
B-1L,3L,5LBasalt TRM with one, three and five layers of textile
C-1L,3L-5LCarbon TRM with one, three and five layers of textile
DIDuctility index
εxxDIC strain
EIFlexural stiffness
ΨEnergy absorption index

References

  1. Park, J.; You, J.; Park, S.-K.; Hong, S. Flexural Behavior of Textile Reinforced Mortar-Strengthened Reinforced Concrete Beams Subjected to Cyclic Loading. Buildings 2022, 12, 1738. [Google Scholar] [CrossRef]
  2. Cai, G.; Tsavdaridis, K.D.; Si Larbi, A.; Purnell, P. A simplified design approach for predicting the flexural behavior of TRM-strengthened RC beams under cyclic loads. Constr. Build. Mater. 2021, 285, 122799. [Google Scholar] [CrossRef]
  3. Du, Y.X.; Shao, X.; Chu, S.H.; Zhou, F.; Su, R.K.L. Strengthening of preloaded RC beams using prestressed carbon textile reinforced mortar plates. Structures 2021, 30, 735–744. [Google Scholar] [CrossRef]
  4. Koutas Lampros, N.; Bournas Dionysios, A. Flexural Strengthening of Two-Way RC Slabs with Cut Openings Using Textile-Reinforced Mortar Composites. J. Compos. Constr. 2021, 25, 04021018. [Google Scholar] [CrossRef]
  5. Ombres, L. Flexural analysis of reinforced concrete beams strengthened with a cement based high strength composite material. Compos. Struct. 2011, 94, 143–155. [Google Scholar] [CrossRef]
  6. Ombres, L. Debonding analysis of reinforced concrete beams strengthened with fibre reinforced cementitious mortar. Eng. Fract. Mech. 2012, 81, 94–109. [Google Scholar] [CrossRef]
  7. Brückner, A.; Ortlepp, R.; Curbach, M. Textile reinforced concrete for strengthening in bending and shear. Mater. Struct. 2006, 39, 741–748. [Google Scholar] [CrossRef]
  8. Triantafillou, T.; Papanicolaou, C. Shear Strengthening of RC Members with Textile Reinforced Mortar (TRM) Jackets. Mater. Struct. 2006, 39, 93–103. [Google Scholar] [CrossRef]
  9. Oluwadahunsi, S.; Moy, C.K.S. Performance of Corroded Reinforced-Concrete Beams in Flexure Strengthened Using Different Basalt Fiber Textile-Reinforced Mortar Schemes. J. Compos. Constr. 2020, 24, 04020061. [Google Scholar] [CrossRef]
  10. Elghazy, M.; El Refai, A.; Ebead, U.; Nanni, A. Effect of corrosion damage on the flexural performance of RC beams strengthened with FRCM composites. Compos. Struct. 2017, 180, 994–1006. [Google Scholar] [CrossRef]
  11. Elghazy, M.; El Refai, A.; Ebead, U.; Nanni, A. Post-repair flexural performance of corrosion-damaged beams rehabilitated with fabric-reinforced cementitious matrix (FRCM). Constr. Build. Mater. 2018, 166, 732–744. [Google Scholar] [CrossRef]
  12. Elghazy, M.; El Refai, A.; Ebead, U.; Nanni, A. Experimental results and modelling of corrosion-damaged concrete beams strengthened with externally-bonded composites. Eng. Struct. 2018, 172, 172–186. [Google Scholar] [CrossRef]
  13. Elghazy, M.; Refai, A.E.; Ebead, U.; Nanni, A. Corrosion-Damaged RC Beams Repaired with Fabric-Reinforced Cementitious Matrix. J. Compos. Constr. 2018, 22, 04018039. [Google Scholar] [CrossRef]
  14. Giese, A.C.H.; Giese, D.N.; Dutra, V.F.P.; Da Silva Filho, L.C.P. Flexural behavior of reinforced concrete beams strengthened with textile reinforced mortar. J. Build. Eng. 2021, 33, 101873. [Google Scholar] [CrossRef]
  15. Mandor, A.; El Refai, A. Strengthening the hogging and sagging regions in continuous beams with fiber-reinforced cementitious matrix (FRCM): Experimental and analytical investigations. Constr. Build. Mater. 2022, 321, 126341. [Google Scholar] [CrossRef]
  16. Mandor, A.; El Refai, A. Flexural response of reinforced concrete continuous beams strengthened with fiber-reinforced cementitious matrix (FRCM). Eng. Struct. 2022, 251, 113557. [Google Scholar] [CrossRef]
  17. Ombres, L. Structural performances of reinforced concrete beams strengthened in shear with a cement based fiber composite material. Compos. Struct. 2015, 122, 316–329. [Google Scholar] [CrossRef]
  18. Alabdulhady, M.Y.; Sneed, L.H.; Carloni, C. Torsional behavior of RC beams strengthened with PBO-FRCM composite—An experimental study. Eng. Struct. 2017, 136, 393–405. [Google Scholar] [CrossRef]
  19. Aljazaeri, Z.R.; Janke, M.A.; Myers, J.J. A novel and effective anchorage system for enhancing the flexural capacity of rc beams strengthened with frcm composites. Compos. Struct. 2019, 210, 20–28. [Google Scholar] [CrossRef]
  20. Hashemi, S.; Al-Mahaidi, R. Experimental and finite element analysis of flexural behavior of FRP-strengthened RC beams using cement-based adhesives. Constr. Build. Mater. 2012, 26, 268–273. [Google Scholar] [CrossRef]
  21. Hadad, H.A.; Nanni, A.; Ebead, U.A.; Refai, A.E. Static and Fatigue Performance of FRCM-Strengthened Concrete Beams. J. Compos. Constr. 2018, 22, 04018033. [Google Scholar] [CrossRef]
  22. Schladitz, F.; Frenzel, M.; Ehlig, D.; Curbach, M. Bending load capacity of reinforced concrete slabs strengthened with textile reinforced concrete. Eng. Struct. 2012, 40, 317–326. [Google Scholar] [CrossRef]
  23. Contamine, R.; Junes, A.; Si Larbi, A. Tensile and in-plane shear behaviour of textile reinforced concrete: Analysis of a new multiscale reinforcement. Constr. Build. Mater. 2014, 51, 405–413. [Google Scholar] [CrossRef]
  24. Alhorani, R.A.; Rabayah, H.S.; Abendeh, R.M.; Salman, D.G. Assessment of Flexural Performance of Reinforced Concrete Beams Strengthened with Internal and External AR-Glass Textile Systems. Buildings 2023, 13, 1135. [Google Scholar] [CrossRef]
  25. Park, J.; Park, S.-K.; Hong, S. Evaluation of Flexural Behavior of Textile-Reinforced Mortar-Strengthened RC Beam Considering Strengthening Limit. Materials 2021, 14, 6473. [Google Scholar] [CrossRef]
  26. Al-Gemeel, A.N.; Zhuge, Y. Experimental investigation of textile reinforced engineered cementitious composite (ECC) for square concrete column confinement. Constr. Build. Mater. 2018, 174, 594–602. [Google Scholar] [CrossRef]
  27. Al-Gemeel, A.N.; Zhuge, Y. Using textile reinforced engineered cementitious composite for concrete columns confinement. Compos. Struct. 2019, 210, 695–706. [Google Scholar] [CrossRef]
  28. Zheng, Y.-Z.; Wang, W.-W.; Brigham, J.C. Flexural behaviour of reinforced concrete beams strengthened with a composite reinforcement layer: BFRP grid and ECC. Constr. Build. Mater. 2016, 115, 424–437. [Google Scholar] [CrossRef] [Green Version]
  29. Gopinath, S.; Murthy, A.R.; Iyer, N.R.; Prabha, M. Behaviour of reinforced concrete beams strengthened with basalt textile reinforced concrete. J. Ind. Text. 2014, 44, 924–933. [Google Scholar] [CrossRef]
  30. Elsanadedy, H.M.; Almusallam, T.H.; Alsayed, S.H.; Al-Salloum, Y.A. Flexural strengthening of RC beams using textile reinforced mortar–Experimental and numerical study. Compos. Struct. 2013, 97, 40–55. [Google Scholar] [CrossRef]
  31. Escrig, C.; Gil, L.; Bernat-Maso, E. Experimental comparison of reinforced concrete beams strengthened against bending with different types of cementitious-matrix composite materials. Constr. Build. Mater. 2017, 137, 317–329. [Google Scholar] [CrossRef]
  32. Irshidat, M.R.; Al-Shannaq, A. Using textile reinforced mortar modified with carbon nano tubes to improve flexural performance of RC beams. Compos. Struct. 2018, 200, 127–134. [Google Scholar] [CrossRef]
  33. Lee, S.; Hong, K.; Yeon, Y.; Jung, K. Flexural Behavior of RC Slabs Strengthened in Flexure with Basalt Fabric-Reinforced Cementitious Matrix. Adv. Mater. Sci. Eng. 2018, 2018, 2982784. [Google Scholar] [CrossRef] [Green Version]
  34. Gao, W.-Y.; Hu, K.-X.; Dai, J.-G.; Dong, K.; Yu, K.-Q.; Fang, L.-J. Repair of fire-damaged RC slabs with basalt fabric-reinforced shotcrete. Constr. Build. Mater. 2018, 185, 79–92. [Google Scholar] [CrossRef]
  35. Raoof, S.M.; Koutas, L.N.; Bournas, D.A. Textile-reinforced mortar (TRM) versus fibre-reinforced polymers (FRP) in flexural strengthening of RC beams. Constr. Build. Mater. 2017, 151, 279–291. [Google Scholar] [CrossRef]
  36. Koutas, L.N.; Papakonstantinou, C.G. Flexural strengthening of RC beams with textile-reinforced mortar composites focusing on the influence of the mortar type. Eng. Struct. 2021, 246, 113060. [Google Scholar] [CrossRef]
  37. Larrinaga, P.; Garmendia, L.; Chastre, C.; San-José, J.-T. Low-grade RC beams strengthened with TRM composite based on basalt, carbon and steel textiles: Experimental and analytical study. Case Stud. Constr. Mater. 2022, 16, e00906. [Google Scholar] [CrossRef]
  38. D’Ambrisi, A.; Focacci, F. Flexural Strengthening of RC Beams with Cement-Based Composites. J. Compos. Constr. 2011, 15, 707–720. [Google Scholar] [CrossRef]
  39. Usama Ebead, A.E.R.K.S.; Antonio, N. Soffit and U-Wrap Fabric-Reinforced Cementitious Matrix Strengthening for Reinforced Concrete Beams. Struct. J. 2019, 116, 267–278. [Google Scholar] [CrossRef]
  40. Ebead, U.; Shrestha Kshitij, C.; Afzal Muhammad, S.; El Refai, A.; Nanni, A. Effectiveness of Fabric-Reinforced Cementitious Matrix in Strengthening Reinforced Concrete Beams. J. Compos. Constr. 2017, 21, 04016084. [Google Scholar] [CrossRef]
  41. Yin, S.; Xu, S.; Lv, H. Flexural Behavior of Reinforced Concrete Beams with TRC Tension Zone Cover. J. Mater. Civ. Eng. 2014, 26, 320–330. [Google Scholar] [CrossRef]
  42. Shen, X.; Chen, W.; Li, B.; Hancock, C.M.; Xu, Y. Flexural Strengthening of Reinforced Concrete Beams Using Fabric Reinforced Alkali-Activated Slag Matrix. J. Build. Eng. 2020, 33, 101865. [Google Scholar] [CrossRef]
  43. Ebead, U.; El-Sherif, H. Near surface embedded-FRCM for flexural strengthening of reinforced concrete beams. Constr. Build. Mater. 2019, 204, 166–176. [Google Scholar] [CrossRef]
  44. El-Sherif, H.; Wakjira, T.G.; Ebead, U. Flexural strengthening of reinforced concrete beams using hybrid near-surface embedded/externally bonded fabric-reinforced cementitious matrix. Constr. Build. Mater. 2020, 238, 117748. [Google Scholar] [CrossRef]
  45. Edoardo Rossi, N.R.T.M.; Peter, H. Flexural Strengthening with Fiber-/Textile-Reinforced Concrete. ACI Struct. J. 2021, 118, 97–107. [Google Scholar] [CrossRef]
  46. Pham, H.H.; Dinh, N.H.; Kim, S.-H.; Park, S.-H.; Choi, K.-K. Tensile behavioral characteristics of lightweight carbon textile-reinforced cementitious composites. J. Build. Eng. 2022, 57, 104848. [Google Scholar] [CrossRef]
  47. Escrig, C.; Gil, L.; Bernat-Maso, E.; Puigvert, F. Experimental and analytical study of reinforced concrete beams shear strengthened with different types of textile-reinforced mortar. Constr. Build. Mater. 2015, 83, 248–260. [Google Scholar] [CrossRef] [Green Version]
  48. Blaber, J.; Adair, B.; Antoniou, A. Ncorr: Open-Source 2D Digital Image Correlation Matlab Software. Exp. Mech. 2015, 55, 1105–1122. [Google Scholar] [CrossRef]
  49. Destrebecq, J.F.; Toussaint, E.; Ferrier, E. Analysis of Cracks and Deformations in a Full Scale Reinforced Concrete Beam Using a Digital Image Correlation Technique. Exp. Mech. 2011, 51, 879–890. [Google Scholar] [CrossRef]
  50. Liu, B.; Huang, J.; Xing, G. Crack behavior of concrete beam in flexure strengthened with NSM prestressing screw-thread steel bars. Mater. Struct. 2020, 53, 80. [Google Scholar] [CrossRef]
  51. Verbruggen, S.; Tysmans, T.; Wastiels, J. TRC or CFRP strengthening for reinforced concrete beams: An experimental study of the cracking behaviour. Eng. Struct. 2014, 77, 49–56. [Google Scholar] [CrossRef]
  52. Dutton, M.; Take, W.A.; Hoult, N.A. Curvature Monitoring of Beams Using Digital Image Correlation. J. Bridge Eng. 2014, 19, 05013001. [Google Scholar] [CrossRef] [Green Version]
  53. Thermou, G.E.; Papanikolaou, V.K.; Lioupis, C.; Hajirasouliha, I. Steel-Reinforced Grout (SRG) strengthening of shear-critical RC beams. Constr. Build. Mater. 2019, 216, 68–83. [Google Scholar] [CrossRef]
  54. Caggegi, C.; Sciuto, D.; Cuomo, M. Experimental Study on Effective Bond Length of Basalt Textile Reinforced Mortar Strengthening System: Contributions of Digital Image Correlation. Measurement 2018, 129, 119–127. [Google Scholar] [CrossRef]
  55. Tekieli, M.; De Santis, S.; de Felice, G.; Kwiecień, A.; Roscini, F. Application of Digital Image Correlation to composite reinforcements testing. Compos. Struct. 2017, 160, 670–688. [Google Scholar] [CrossRef]
  56. D’Anna, J.; Amato, G.; Chen, J.F.; Minafò, G.; La Mendola, L. Experimental application of digital image correlation for the tensile characterization of basalt FRCM composites. Constr. Build. Mater. 2021, 271, 121770. [Google Scholar] [CrossRef]
  57. Mahal, M.; Blanksvärd, T.; Täljsten, B.; Sas, G. Using digital image correlation to evaluate fatigue behavior of strengthened reinforced concrete beams. Eng. Struct. 2015, 105, 277–288. [Google Scholar] [CrossRef]
Figure 1. Strengthened reinforced concrete beam cross-section dimensions and reinforcement details.
Buildings 13 01765 g001
Figure 2. Basalt and carbon textiles used.
Buildings 13 01765 g002
Figure 3. TRM casting method: (a) roughened surface, (b) roughened surface after cleaning with water, (c) TRM cast formwork in place and (d,e) TRM application.
Buildings 13 01765 g003
Figure 4. Strengthened RC beam section with U-wrap details.
Buildings 13 01765 g004
Figure 5. Position of LVDTs.
Buildings 13 01765 g005
Figure 6. Speckle pattern applied.
Buildings 13 01765 g006
Figure 7. Loading and DIC setup.
Buildings 13 01765 g007
Figure 8. (a) BTRM load mid-span deflection curves. (b) CTRM load mid-span deflection curves.
Buildings 13 01765 g008
Figure 9. (a) BTRM–Control versus strengthened beam load capacity comparison. (b) CTRM–Control versus strengthened beam load capacity comparison.
Buildings 13 01765 g009aBuildings 13 01765 g009b
Figure 10. (a) BTRM-strengthened beam load increment. (b) CTRM-strengthened beam load increment.
Buildings 13 01765 g010
Figure 11. (a) Ultimate load versus basalt textile percentage at different load stages. (b) Ultimate load versus carbon textile percentage at different load stages.
Buildings 13 01765 g011
Figure 12. (a) Ductility indices of BTRM-strengthened beams. (b) Ductility indices of CTRM-strengthened beams.
Buildings 13 01765 g012aBuildings 13 01765 g012b
Figure 13. (a) Control and BTRM crack patterns of the strengthened beams after testing. (b) CTRM crack patterns of the strengthened beams after testing.
Buildings 13 01765 g013
Figure 14. Inter-laminar crack pattern in five-layered CTRM specimen.
Buildings 13 01765 g014
Figure 15. TRM debonding in five-layered BTRM specimen.
Buildings 13 01765 g015
Figure 16. (a) BTRM-strengthened beam flexural stiffness degradation version applied load. (b) CTRM-strengthened beam flexural stiffness degradation version applied load.
Buildings 13 01765 g016
Figure 17. Crack pattern in five-layered CTRM specimen.
Buildings 13 01765 g017
Figure 18. Control specimen major crack width measure using ImageJ and DIC.
Buildings 13 01765 g018
Figure 19. (a) BTRM major crack width measure using DIC. (b) CTRM major crack width measure using DIC.
Buildings 13 01765 g019
Figure 20. (a) DIC crack pattern (εxx): control and BTRM-strengthened beams. (b) DIC crack pattern (εxx): control and CTRM-strengthened beams.
Buildings 13 01765 g020aBuildings 13 01765 g020b
Figure 21. (a) Control specimen load-deflection curves, experiment versus DIC. (b) Control specimen load-deflection profiles, experiment versus DIC.
Buildings 13 01765 g021
Figure 22. (a) B-1L load-deflection curves, experiment versus DIC. (b) B-1L load-deflection profiles, experiment versus DIC.
Buildings 13 01765 g022
Figure 23. (a) B-3L load-deflection curves, experiment versus DIC. (b) B-3L load-deflection profiles, experiment versus DIC.
Buildings 13 01765 g023
Figure 24. (a) B-5L load-deflection curves, experiment versus DIC. (b) B-5L load-deflection profiles, experiment versus DIC.
Buildings 13 01765 g024
Figure 25. (a) C-1L load-deflection curves, experiment versus DIC. (b) C-1L load-deflection profiles, experiment versus DIC.
Buildings 13 01765 g025
Figure 26. (a) C-3L load-deflection curves, experiment versus DIC. (b) C-3L load-deflection profiles, experiment versus DIC.
Buildings 13 01765 g026
Figure 27. (a) C-5LU load-deflection curves, experiment versus DIC. (b) C-5LU load-deflection profiles, experiment versus DIC.
Buildings 13 01765 g027
Table 1. Properties of the textiles.
Basalt Carbon
Weight (without coating) (g/m2)350200
CoatedYesNo
Mesh spacing (mm)25 × 2520 × 20
Tensile strength (longitudinal) (kN/m)5058
Tensile strength (transverse) (kN/m)5058
Rupture strain (%)0.030.02
Elastic modulus (GPa)89240
Table 2. Properties of tested specimens.
Beam IDPcr
(kN)
Py
(kN)
Pu
(kN)
Δcr
(mm)
Δy
(mm)
Δu
(mm)
Mcr
kN-mm
My
kN-mm
Mu
kN-mm
ψ
kNmm
DI
Δu/Δy
EI
kN-mm
FM
Control10.9752.9660.800.294.5511.462.3311.2312.92146.232.52121.43NA
B-1L14.2156.0965.840.224.079.723.0211.9214.84143.372.39166.20FSR
B-3L17.7856.4473.370.353.9811.213.7812.0015.60227.722.82156.80FSR
B-5LU24.1461.4879.200.323.887.645.1313.0616.83170.551.97237.10ED
C-1L20.6360.8169.430.605.027.994.3813.4414.75134.111.60147.54FSR
C-3L21.5364.3370.110.244.527.214.5714.0314.90136.401.60222.56FSR
C-5LU22.0069.4880.480.654.428.304.6714.4516.83161.501.88234.30FSR
Note: FM, failure mode; FSR, fibre slippage and rupture; ED, end debonding.
Disclaimer/Publisher’s Note: The statements, opinions and data contained in all publications are solely those of the individual author(s) and contributor(s) and not of MDPI and/or the editor(s). MDPI and/or the editor(s) disclaim responsibility for any injury to people or property resulting from any ideas, methods, instructions or products referred to in the content.

