Article

Investigation of RC Buildings after 6 February 2023, Kahramanmaraş, Türkiye Earthquakes

Department of Civil Engineering, Atılım University, 06830 Ankara, Türkiye
*
Author to whom correspondence should be addressed.
Buildings 2023, 13(7), 1789; https://doi.org/10.3390/buildings13071789
Submission received: 14 June 2023 / Revised: 10 July 2023 / Accepted: 11 July 2023 / Published: 13 July 2023
(This article belongs to the Section Building Structures)

Abstract

:
Two major earthquakes struck Pazarcık and Elbistan, towns in Kahramanmaraş, Türkiye, on 6 February 2023, approximately 9 h apart. The first earthquake, recorded at 04:17 local time, had a Mw = 7.7, with a focal depth of 8.6 km. At 13:24 local time, a second earthquake occurred with Mw = 7.6 at a focal depth of 7 km, approximately 90 km north of the first one. A total of 11 provinces were severely affected by these earthquakes. As of 15 April 2023, they caused close to 51,000 deaths and almost 215,000 completely destroyed/severely damaged buildings. At some locations, the largest horizontal peak ground acceleration (PGA) values of the first and second earthquakes exceeded the code-generated PGAs by almost 3 and 1.75 times, respectively. A technical team visited these areas within 15 h of the first earthquake. The purpose of this article is to present their observations, findings, and the characteristics of the two earthquakes, with comprehensive site survey results supported by photographs. This study concludes that most of the collapsed and severely/moderately damaged buildings in the region were built between 1975 and 2000, when site inspections were rare or non-existent. In addition to the high PGAs recorded in these earthquakes, it was verified that the design and construction of these buildings did not fully comply with the earthquake codes valid at the time. The collapsed buildings and their damage patterns confirm inadequate development length, violation of bending stirrup ends at 135°, deficiencies in construction materials and reinforcement configuration, noncompliance with confinement zones, violation of the strong beam-stronger column analogy, and issues related to building inspection. Based on the extent of the damage, it is strongly recommended that the structural performance inspection of all other buildings located near major fault lines, specifically those constructed between 1975 and 2000, should be completed. Since these earthquakes generated much higher PGAs, which is believed to be one of the main reasons for the extensive damage, a re-evaluation of all other PGAs along major fault lines is also recommended.

1. Introduction

Türkiye is located in one of the most active earthquake zones. According to a statistical study, a severe earthquake with a magnitude of Mw = 6.0 to 6.9 occurs every two years, and a very severe one with a magnitude of Mw = 6.9 and above occurs every three years [1]. The country’s fault lines (zones) have the potential to trigger very severe earthquakes. As illustrated in Figure 1, the most important of these fault lines are the North Anatolian Fault (NAF) and the East Anatolian Fault (EAF) zones [2]. The NAF zone runs from west to east along the northern region of the country and has a length of approximately 1500 km. The EAF zone, which has the shape of a half-moon in the region, extends from the Iskenderun Bay to Hakkari and continues through the Eastern and Southeastern Anatolian regions. In the western region, all the fault lines are gathered under one name, the West Anatolian Fault (WAF) zone.
As shown in Figure 2, the Pazarcık district of Kahramanmaraş was struck by a severe earthquake with a magnitude of Mw = 7.7 at 04:17 on 6 February 2023 [3]. The focal depth of the earthquake was 8.6 km. A second earthquake with a magnitude of Mw = 7.6 and a focal depth of 7 km occurred at 13:24 on the same day in the Elbistan district of Kahramanmaraş, approximately 90 km north of the first event [3]. The two earthquakes caused light to severe damage and heavy destruction in a total of 11 provinces (Adana, Adıyaman, Diyarbakır, Elazığ, Gaziantep, Hatay, Kahramanmaraş, Kilis, Malatya, Osmaniye, and Şanlıurfa). The direct distances of centers of these provinces to the epicenters of the earthquakes are shown in Table 1. These earthquakes directly affected an area of approximately 110,000 km2 (14% of the country’s total land area) and more than 14 million people (16.5% of the total population) living in the region [4]. The 11 provinces constitute about 10% of the country’s gross domestic product (GDP) [4].
According to official statements made by the Disaster and Emergency Management Authority (AFAD), which is affiliated with the Ministrsy of the Interior, on 22 April 2023, a total of 50,783 citizens lost their lives due to the Pazarcık and Elbistan earthquakes [5]. Following the two events, 214,577 buildings out of a total of 1,442,656 that were inspected, (14.8%) were either completely destroyed or severely damaged [6]. Based on the data, it was determined that 439,437 buildings suffered moderate to minor damage (30%) while the rest, 788,642 buildings, were found to be intact.
Immediately after these earthquakes, a technical team visited the region and examined the destroyed and damaged buildings. This article presents the characteristics of these earthquakes and the technical team’s findings, observations, and evaluations. The purpose of this study is to reveal the common mistakes in the buildings’ design and construction stages and to provide solutions that eliminate, or at least diminish, the significant impact of earthquakes. This study, therefore, first examines the earthquake characteristics of the region and provides an in-depth discussion of the two earthquakes. Then, the impact of soil conditions is introduced to better understand the deadly features of these two earthquakes. Thus, the intent of this study is to expose the immense intensities that these two earthquakes imposed on the structures. To that end, the existing building stock is also examined in order to assess the extent of the damage to the structures. The comprehensive site survey is used as an important tool to further identify mistakes related to the structures’ design and construction. As a result, this study’s final goal is to help those in the field establish better design requirements and construction practices to benefit both users and government actors.

2. Characteristics of the Kahramanmaraş Earthquakes

2.1. History

According to seismologists, plate movements (Figure 3) were the result of continental drift that occurred in the Neotectonic period about 12 million years ago. The movement of these plates is the main cause of all severe earthquakes in Türkiye, as the larger Arabian plate collides with the smaller Anatolian plate in the north–south direction [7].
The region where the Kahramanmaraş earthquakes occurred is located at the junction of the African, Arabian, and Anatolian plates. The section where the Arabian and African plates are adjacent to each other is the Dead Sea Fault (DSF) zone, an extension of the EAF zone that separates the African and Anatolian plates from each other. Large earthquakes in the region are caused by plate movements along the fault lines of these large contact surfaces [8,9,10,11].
In Figure 4a, the distribution of non-instrumental time period earthquakes in the region, with a surface magnitude of 6.0 and above, is mapped for the time period between 131 BC and 1900. Based on the data, it is evident that most of the earthquakes occurred along the EAF zone [11,12,13,14,15,16,17,18]. In Figure 4b, the earthquakes that occurred in the instrumental time period are provided on the map based on their magnitudes. As illustrated, the large magnitude earthquakes are mostly concentrated on the northern tip of the active fault line, the EAF zone, which is closer to the epicenter of the second earthquake (Mw = 7.6) [11,19,20].

2.2. Earthquake Hazard Map

Figure 5 displays the Earthquake Hazard Map of Türkiye with a probability of exceeding 10% in 50 years, or a recurrence period of 475 years [22]. As the map demonstrates, the NAF, EAF, and WAF zones are all located in bands where the maximum peak ground accelerations (PGA) are expected to be larger than or equal to 0.4 g.
Figure 6 includes the detailed earthquake hazard map of the region under consideration. The contours in the figure represent the maximum PGA values [22]. According to this map, the largest PGA near the first epicenter is expected to be around 0.4 g; this value is predicted to be around 0.3 g near the second epicenter. As displayed on the map, the maximum PGA in this region is around 0.6 g and expected to occur in the north–east direction, roughly 122 km away from the first earthquake’s epicenter, or 70 km east of the second earthquake’s epicenter.

2.3. Local Soil Types

The effect of local soil types is investigated separately for the Mw = 7.7 and Mw = 7.6 earthquakes. Figure 7 illustrates the detailed geological formation of the region [23]. In this article, this formation is examined for city centers and towns near the earthquake epicenters. A detailed geological study of the earthquake area is beyond the scope of this study.
The Mw = 7.7 earthquake affected mostly the south and southeastern parts of Türkiye. As illustrated in Figure 7, extensive destruction mainly occurred in the cities of Kahramanmaraş, Osmaniye, Adıyaman, and Hatay since the majority of these cities contain alluvial soil, which amplified the magnitudes and durations of the earthquakes. In most of Hatay, mainly Antakya, Samandağ, İskenderun and parts of Dörtyol, a large number of buildings collapsed and severe structural damage was observed. Once again, this destruction was the result of the alluvial soil that dominates most of the area. Southern Kahramanmaraş also has a similar soil type. However, in other areas of Kahramanmaraş, limestone, clasts, and carbonates exist. Limestone also exists in a large portion of Gaziantep’s city center. Two towns in the province of Gaziantep, İslahiye and Nurdağı, where the first earthquake caused substantial amount of damage due to its close proximity to the epicenter, have basalt type volcanic rocks and undifferentiated harzburgite, dunite and serpentine types of ophiolitic rocks, respectively. Like İslahiye, Kilis’s city center also contains basalt. Although, İslahiye and Kilis share the same type of soil, the buildings in Kilis had relatively less damage due to (a) the directionality effect of the first earthquake (it was in the south–west direction, which was further away from Kilis) and (b) distance to the epicenter (İslahiye is 24 km away from the first earthquake’s epicenter and is situated in the south–west direction, while Kilis is 55 km away and situated in the south–east direction). Alluvial soil is also dominant in Şanlıurfa’s east, south–east, and north–east regions; limestone dominates in the west, north–west, and south–west directions. As illustrated in Figure 7, Diyarbakır has two types of geological formations: undifferentiated continental clastic rock in the east and north–south directions, and basalt type volcanic rock in the west. Like most of Hatay, alluvial soil is also observed in the north and west directions of Malatya city center, while limestone dominates the city’s south and east directions.
The local soil in the region near the second earthquake with Mw = 7.6 is also examined. Elbistan, a town in Kahramanmaraş province, contains undifferentiated continental clastic rock geological formations in its east–west and north directions, while limestone exists in the south. The soil data indicate that alluvial soil dominates most of Adana city center. However, a travertine geological formation is encountered in the northern parts of the city. Unlike the soil types of other cities affected by these earthquakes, Elazığ has the most variety of soil types (alluvial, clastic and carbonate rock, and limestone). A more detailed examination of the city’s soil and its impact on buildings can be found in other studies [1,24].

2.4. Kahramanmaraş Earthquakes

Two very severe earthquakes with magnitudes of Mw = 7.7 and Mw = 7.6 occurred at 04:17:34 and 13:24:47 local time on 6 February 2023 within the provincial borders of Kahramanmaraş [3]. The epicenter of the first earthquake was located in the Pazarcık district; the second earthquake was in Elbistan. According to AFAD, the focal depths of the first and second earthquakes were calculated as 8.6 and 7 km, respectively [3]. The characteristics of these two earthquakes are provided in Table 2.
The Pazarcık (Mw = 7.7) and Elbistan (Mw = 7.6) earthquakes both occurred due to a left lateral strike-slip fault rupture. The focal mechanism solutions for the earthquakes showed that Pazarcık was in the north–south and Elbistan was in the east–west direction. The first earthquake occurred along the intersection of the Anatolian, Arabian, and African plates (see Figure 3). The fault caused by this earthquake was approximately 190 km long and 25 km wide [26]. The second earthquake, 9 h later at approximately 90 km northeast of the first event, occurred along the intersection boundaries of the same plates. The rupture caused by the second earthquake was approximately 120 km long and 18 km wide [26].
A total of 4760 aftershocks with magnitudes ranging from 1.0 to 6.7 were recorded in the region over the following 10 days [3]. The distribution of these aftershocks is displayed in Figure 8a–c.
According to 2023 AFAD data, the total number of stations with accelerometers measuring strong ground motion in Türkiye is 857 [29]. Approximately 100 of these stations (12% of the total) are located in the earthquake-affected areas (Figure 9). In this article, 30 of these stations are examined first in terms of the recorded PGA values. Then, out of the 30 stations, 12 are examined further to evaluate the spectral acceleration values for varying local soil classes.
Table 3 contains the horizontal and vertical PGA values recorded during the Mw = 7.7 earthquake at a total of 30 strong ground motion stations. The PGA values of some stations in the table were left blank since their values could not be accessed through the AFAD system. A detailed map of the locations of these stations is shown in Figure 10. The largest recorded horizontal and vertical PGAs were reached at the following station numbers: 3125, 3129, and 3135 in Antakya, Defne, and Arsuz, all towns in Hatay province (these are marked in red in Table 3). According to the data, the largest PGA in the north–south direction was approximately 1.379 g (1353.023 cm/s2), and was recorded at station number 3129 in Defne-Hatay. The largest PGA in the east–west direction, 1.399 g (1372.071 cm/s2), was recorded at station number 3135, located in Arsuz-Hatay. According to the data in Table 3, the vertical components of the earthquake were as effective as its horizontal components. The largest PGA in the vertical direction was recorded as 1.174 g (1151.556 cm/s2), at station number 3125, in Antakya-Hatay.
The horizontal and vertical PGAs of the second earthquake (Mw = 7.6) were presented in Table 4 for the same 30 strong ground motion stations. The PGA values of some stations in Table 4 were also left blank since their acceleration values could not be accessed through the AFAD system. The largest PGAs in the north–south, east–west, and vertical directions were all recorded at station number 4612, located in Göksun-Kahramanmaraş (these values are marked in red in Table 4). The PGA values in the north–south, east–west, and vertical directions were approximately 0.648 g (635.447 cm/s2), 0.533 g (523.212 cm/s2), and 0.505 g (494.909 cm/s2), respectively.
As the data from Table 3 indicate, the resultant PGAs of the first earthquake (Mw = 7.7), far exceeded 1.000 g close to its epicenter, the threshold for a severe magnitude earthquake. These values clearly verify the intensity of the first earthquake and the widespread structural damage associated with it.
According to the PGA values in Table 3, the directivity of the Pazarcık earthquake is an important parameter. The data measured along station numbers 2712, 2718, 3137, 3142, 3146, 3125, 3129, 3141, and 3140, listed based on their proximity to the epicenter and located in the south–west direction, verified the extent of the structural damage (see path 1 in Figure 10). The second earthquake (Mw = 7.6) followed a different path as a result of the directivity effect along the south–west and north–east directions, away from the epicenter (see paths 2–1, 2–2, and 2–3 in Figure 10).

2.5. Evaluation of Strong Ground Motion

In this section, the PGA values obtained from the 12 stations are examined for both earthquakes to examine their characteristic features. The locations of these 12 stations are displayed in Figure 11. As explained in the previous section, during the two earthquakes, some stations, specifically those closer to the epicenters, malfunctioned (station numbers 4614 for the first, and 0201, 2712, and 3117, for the second earthquake), probably due to structural destruction. Therefore, they were excluded from this evaluation.
Figure 12 shows the PGAs of the Kahramanmaraş earthquakes in the north–south and the east–west directions at these 12 stations. According to the acceleration values of the Mw = 7.7 earthquake, the largest horizontal PGA was recorded in the east–west direction as 1.399 g (1372.071 cm/s2) at station number 3135, in Arsuz-Hatay. The largest vertical component of the PGA was 1.174 g (1151.556 cm/s2), and it was measured at station number 3125, in Antakya-Hatay. For the Mw = 7.6 earthquake, the largest PGA values in the horizontal and vertical directions were all obtained at the same station, station number 4612, in Göksun-Kahramanmaraş. The maximum horizontal PGA, 0.648 g (635.447 cm/s2), was in the north–south direction. The maximum vertical PGA was 0.505 g (494.909 cm/s2).
The PGA values were scaled based on a constant 5% damping ratio [30] and compared with the design spectrum acceleration values of the Turkish Building Earthquake Specifications, TBES (2018), [31]. According to this specification, a total of six local soil classes exist, designated by ZA to ZF. While ZA defines solid and hard rock soil types, ZF is used to define clay type soils with high organic content, which has the risk of liquefaction, and therefore requires site-specific research and evaluation. In this article, the acceleration design spectrum curves were prepared for a total of five soil types, excluding ZF. Figure 13 illustrates the acceleration time history records in the north–south, east–west, and vertical directions, along with the response spectrum curves prepared in the horizontal (north–south and east–west) directions for the stations with recordings. The graphs were not drawn for the stations whose PGA values were very low (station numbers 3135 and 3142 for the second earthquake) and stations having no recordings (station numbers 4614 for the first earthquake and 0201, 2712, and 3117 for the second).
Based on the data plotted in Figure 13, the following observations and evaluations have been made regarding the ground motion records obtained during the Mw = 7.7 earthquake.
  • Based on the acceleration values measured at stations such as 0201, 2718, and 3129, it is clear that data transfer was partially interrupted during the first earthquake (Mw = 7.7), which might be a result of a failure in the recording system. Because of this interruption, the response could not be captured accurately. The same issue was also observed during the second earthquake, Mw = 7.6, as illustrated in the acceleration time history plot of station number 4612.
  • During the Mw = 7.7 magnitude earthquake, it was observed that the acceleration time history records at some stations followed the pattern of two successive earthquakes, as if they occurred back-to-back, one after the other (for example, station numbers 2712, 2718, and 4616).
  • The acceleration time history records of some stations (for example, station numbers 3135, 4612, and 4616) exhibited somewhat unusual earthquake patterns during the first event (Mw = 7.7). This could have happened due to recording issues caused by possible structural damage at these stations.
  • It was observed that during the first earthquake, the 5% damped spectral acceleration values of all 11 stations exceeded earthquake specifications, TBES (2018) [31], and prescribed design acceleration values for almost all five different soil types. For station numbers 3129 and 3135, this difference was more pronounced, since actual acceleration values exceeded code-generated ones by as much as 3.5 times. Larger acceleration values were also observed during the second earthquake, as illustrated in the plots of the spectrum acceleration values of station numbers 4406 and 4612.
  • The severe destructive effect of the Mw = 7.7 earthquake in the south–west direction was evident from the measurements at the following stations, arranged based on their locations from north to south: 2712, 2718, 3142, 3125, and 3129.
  • The results in Figure 13 indicate that the severe destruction caused by the Mw = 7.7 earthquake, particularly in the province of Hatay, is linked to the soil amplification effect of the alluvial soil that exists in the region. This outcome is evident from the delay in the fading of the spectral acceleration values at stations 3125, 3129, and 3142, even though their period values increased.

2.6. Duration of Strong Ground Motion

The two earthquakes were also examined based on their durations. In this article, the following three methods were evaluated: (a) uniform duration, (b) bracketed duration, and (c) significant duration. Figure 14 illustrates the variation of duration at these 12 strong ground motion stations. Since data were not available at some stations, 3117 and 4614 for the Mw = 7.7 earthquake and 0201, 2712, and 3117 for the Mw = 7.6 one, their associated durations were left blank.
As illustrated in Figure 14, during the Mw = 7.7 earthquake, the largest bracketed duration in the north–south direction was calculated as 91.4 sec at station number 3125 (Antakya-Hatay). The largest one in the east–west direction was 91.2 s, at station number 3142 (Kırıkhan-Hatay). For the second earthquake (Mw = 7.6), the largest bracketed durations in the north–south and east–west directions were all recorded at the same station, (4612 in Göksun-Kahramanmaraş) as 74.6 and 74.9 s, respectively. As expected, the data for the uniform duration were smaller than for the bracketed duration. At the stations located in Hatay (3125, 3129, and 3142), where damage was significantly higher, the bracketed durations for the first earthquake were almost twice as high as those of the uniform durations. This suggests that the existing soil extended the total duration and caused a large number of repeated cycles, resulting in more collapsed or severely damaged buildings (see Figure 14a,b). A similar pattern was also observed during the second earthquake, but in the vicinity of its epicenter near Kahramanmaraş, as exemplified by the data extracted from station numbers 4406, 4612, 4614, and 4616 (see Figure 14c,d).
Another parameter in determining the impact of damage is significant duration. For the first earthquake, the maximum significant duration in the north–south direction was recorded as 50.2 s at station number 4612. The maximum significant duration in the east–west direction was 50.7 s, obtained at the same station. For the second earthquake, the largest significant durations in the north–south and east–west directions were 74.5 and 87.7 s, at station numbers 3125 (Antakya-Hatay) and 3135 (Arsuz-Hatay), respectively.
The total durations of both earthquakes were much larger than those recorded during other major earthquakes in the region, such as Bingöl (2003), Van (2011), and Sivrice-Elazığ (2020) [1,32,33]. These higher values contributed to the widespread building damage observed in the aftermath of the 2023 earthquakes.

3. Building Inventory in the Earthquake Affected Region

The Kahramanmaraş earthquakes affected a total of 11 provinces covering an area of approximately 110,000 km2, the equivalent of 14% of Türkiye’s total land area. Based on 2021 data, the total number of buildings in the region was 2,618,697 [34]. Figure 15 displays the number of buildings for each of these 11 provinces and the percentile distribution of materials used to construct these buildings. Based on the data, it is evident that most of the buildings in the region were constructed using reinforced concrete (RC), which is very commonly used in Türkiye. The most buildings were found in Adana and Hatay, accounting for 17.2% and 15.5% of the total number of buildings in the region, respectively. The fewest number of buildings was in Kilis (1.4% of the total).
The buildings in the earthquake-affected region were also classified based on their construction years. Figure 16 shows this distribution for each province, categorized as follows: (a) prior to 1980, (b) between 1981 and 2000, (c) after 2000, and (d) those whose construction years could not be determined. These time periods were purposely selected in order to examine the impact of older earthquake codes and building inspection laws, both of which are examined in the next section. As illustrated in Figure 16, just over half the buildings were constructed after 2001 (roughly 51%). If 2001 is considered a major benchmark since construction quality substantially improved around that time due to the enforcement of the building inspection law, then theoretically the earthquake would have mostly impacted buildings constructed before 2001, thus accounting for the other 49% [1].
Figure 17 illustrates the buildings in the earthquake zone, based on the number of floors. This parameter is considered to be important during the post-earthquake evaluation process. For this purpose, the buildings were classified into three categories: (a) one to two story buildings, (b) three to six story buildings, and (c) six and above story buildings. According to the data, the highest percentages with 1-to-2 story, 3-to-6 story, and six story and above were encountered respectively in Osmaniye (60.5%), Elazığ (35%), and Diyarbakır (49%). The data in Figure 17 indicate that the majority of the buildings in the earthquake zone are 1-to-2 story.
After the Kahramanmaraş earthquakes, some of the buildings collapsed immediately, experiencing various types of damage, while the rest were intact. Figure 18 displays the overall damage level in the 11 provinces. The data in this figure is based on information recorded on 3 March 2023. The evaluation of the buildings is in progress and the final totals have not yet been released by AFAD. As the data indicate, the most collapsed buildings were in Hatay (64,729), followed by Kahramanmaraş (48,756). According to the data, the minimum amount of building damage was observed in Adana, Kilis, and Diyarbakır.

4. Damage Observed in RC Buildings

The observed effects of the strong ground motions of the Kahramanmaraş earthquakes on RC buildings are explained in this section. A reconnaissance team consisting of the authors of this article reached the earthquake zone 15 h after the first earthquake (Pazarcık, Mw = 7.7). The team’s 5-day visit included six of the provinces (Adana, Adıyaman, Gaziantep, Hatay, Kahramanmaraş, and Osmaniye) that experienced relatively more severe damage due to the earthquakes. Examples of collapsed buildings, before and after the earthquakes, are shown in Figure 19.
The damage observed in RC buildings and their causes are explained in this section, with a consideration of the specifications that were in effect during their construction.

4.1. Specifications in Türkiye

In Türkiye, RC structures are designed based on TS 500 Specification [36]. The first edition was published in 1969 [37] and was inspired by the German RC Specifications valid at that time. This specification was updated three times in 1975 [38], 1984 [39], and 2000 [36]. Minor revisions were made to the latest version (TS 500, 2000) [36] in 2001, 2002, and 2014.
The first earthquake specification published in Türkiye was mainly a translation of the Italian Structure Guidelines in 1940 [1,40]. It has undergone nine revisions to date. Special attention shall be provided to the last four articles published in 1975 [41], 1998 [42], 2007 [43], and 2018 [31] since only approximately 10% of the buildings in the earthquake zone were constructed before 1980 (Figure 16). These specifications are shown in Table 5. The 1975 version [41] was ahead of its time. Thus, many of its requirements remain today. The building damage in the earthquake zone (Figure 18) could have been far less had they been constructed according to the specifications in effect at the time they were built.

4.2. Issues Related to Building Damage

The basic issues related to the extensive damage and collapse of RC buildings in the Kahramanmaraş earthquakes are explained in this section as shown in Figure 20.
It should be noted that the issues listed above are common problems encountered during earthquake site investigations here, and elsewhere, in Türkiye [1,44,45]. The damage and failure of many RC buildings can be explained using these basic problems, among others. The behavior of buildings during these earthquakes can also be affected by other parameters such as short-column effect, pounding effect, liquefaction, soil issues, and the design of load-carrying systems.

4.2.1. Inadequate Development Lengths

Sufficient development lengths shall be provided for the beam longitudinal reinforcement at the beam-column connections to satisfy the integrity of the joints, especially external ones. Since the column width is limited to satisfy this development length at the outside joints, the ends of longitudinal reinforcement of beam shall be bent 90° to avoid pull-out of the beam longitudinal reinforcement from the joint. This phenomenon was known in 1975 and included in the SSCDR (1975) [41], as shown in Figure 21a. Detailed drawings and additional requirements related to the development lengths of longitudinal reinforcement beams were introduced in later versions of the specification. The latest requirements related to this concept in TBES (2018) [31] are shown in Figure 21b. It can be concluded that no buildings constructed after 1975 should suffer from damage related to inadequate development length if the requirements in SSCDR (1975) [41] were satisfied. Yet, inadequate development length was one of the reasons for collapse during these earthquakes, as shown in Figure 22.

4.2.2. Violation of Bending Stirrup Ends at 135°

Both ends of rectangular stirrups shall be bent 135° and anchored to the core concrete to avoid opening of the stirrups after the spalling of cover concrete. This phenomenon was known in 1975 and included in the SSCDR (1975) [41], as shown in Figure 23a. Detailed drawings and additional requirements related to the bending of the ends of the stirrups into core concrete were introduced in later versions of the specification. The latest requirements related to this concept in TBES (2018) [31] are shown in Figure 23b. It can be concluded that no buildings constructed after 1975 should suffer from damage related to the opening of the stirrups due to the violation of bending the stirrup ends at 135° if the requirements in SSCDR (1975) [41] were satisfied. However, it was observed that bending the ends of the stirrups 90° was one of the reasons for collapse during these earthquakes, as shown in Figure 24. None of the collapsed buildings investigated by the reconnaissance team exhibited a situation in which both ends of the stirrups bent 135°.

4.2.3. Deficiencies in Construction Materials and Reinforcement Configuration

There was no concrete compressive strength requirement for residential buildings in SSCDR (1975) [41]. Minimum concrete compressive strengths were later specified as 16, 20, and 25 MPa for residential buildings in SSCDR (1998) [42], SBCER (2007) [43], and TBES (2018) [31], respectively. In addition, the granulometry of concrete aggregates was specified; the maximum aggregate size was determined as ¾ of the minimum distance between longitudinal reinforcement bars (TS 500, 1984) [39].
Based on the site observations of the structural elements of the collapsed and heavily damaged buildings, it was concluded that the quality of concrete was poor. Most of the concrete in structural elements contained round-shaped aggregates (Figure 25a), which reduces strength and bonding with reinforcements. Large-sized aggregates with diameters between 50 and 100 mm were observed in the concrete of some of the collapsed buildings, as shown in Figure 25b. In a few buildings, materials such as wood pieces were embedded in the concrete, as shown in Figure 25c.
Corrosion is a very important issue related to steel reinforcement. It reduces the cross-sectional area of the reinforcement due to loss of material, which results in a lower tensile capacity of steel reinforcement. In some of the heavily damaged or collapsed buildings, extensive corrosion was observed in both longitudinal and transverse reinforcements, as shown in Figure 26.
The placement of steel reinforcement bars plays an important role in the bonding between concrete and reinforcement. Steel reinforcement shall be surrounded by sufficient amount of concrete for full bonding. Therefore, specifications usually define minimum distances between two reinforcing bars. Based on TS 500 (2000) [36], the clear distance between two steel reinforcement bars shall not be less than 25 mm or 4/3 of the largest aggregate size for beams and 40 mm or 4/3 of the largest aggregate size for columns. It was observed that the distance requirement was not met in the elements of some of the heavily damaged or collapsed buildings, as shown in Figure 27.

4.2.4. Noncompliance with Confinement Zones

The ends of beams and columns are critical regions, since the highest load effects are produced at these locations during an earthquake. As a result, the ends of beams and columns shall be confined with closely spaced stirrups, so that the spacing of stirrups at the mid-regions are wider. This phenomenon was known in 1975 and included in the SSCDR (1975) [41], as shown in Figure 28a. Detailed drawings and additional requirements related to the confinement of the ends of beams and columns were introduced in later versions of the specification. The latest requirements related to this concept in TBES (2018) [31] are shown in Figure 28b. It can be concluded that no buildings constructed after 1975 would have suffered from damage related to the confinement of the ends of beams and columns had the requirements in SSCDR (1975) [41] been satisfied. However, it was observed in most of the collapsed buildings that the ends of the beams and columns were not confined, as shown in Figure 29. Moreover, it was observed that the spacing of the stirrups in some of the collapsed buildings were more than 300 mm.

4.2.5. Violation of Strong Beam-Stronger Column Analogy

Buildings shall be designed to absorb the highest energy without collapse during an earthquake. This energy is absorbed at locations where the structural elements are damaged. The damage occurs at locations where the highest load effects are produced, namely the ends of beams and columns. Therefore, the ends of beams and columns are confined using stirrups (as explained in Section 4.2.4) to achieve plastic hinge behavior after damage occurs. The plastic hinges shall be formed only at the ends of the beams to achieve the greatest energy absorption capacity before the collapse [1]. Therefore, at a joint where columns and beams are connected, the moment capacities of columns shall be greater than those of beams. This concept is known as the “Strong Beam-Stronger Column” analogy and was added to the SSCDR in 1998 [42], as shown in Figure 30. It can be concluded that no buildings constructed after 1998 would have suffered from damage related to strong beam-stronger column analogy had the requirements in SSCDR (1998) [42] been satisfied.
Buildings not designed using this concept would have first plastic hinges at the top and bottom ends of the first story columns and the system is converted into a mechanism with the collapse of the first story as shown in Figure 31a. The buildings designed according to this concept have a vast amount of energy absorption capacity without collapse, as shown in Figure 31b.

4.2.6. Issues Related to Building Inspection

One of the main reasons for this level of damage in buildings during the Kahramanmaraş earthquakes was a lack of inspection. Construction inspection of privately owned buildings was not required in Türkiye until 2001 since the responsibility for ensuring their safety was solely left to their owners. Therefore, the reports on soil conditions and structural designs were not always reviewed. Additionally, the strength of the materials used in construction was not always tested and the accuracy of the structural drawings was not always verified. Initially, the mandatory inspection of construction processes was introduced in 19 provinces (including Adana, Gaziantep, and Hatay). Private firms were established to perform the inspection procedures required by the government. In 2011, mandatory inspection became required nationwide, thereby covering the rest of the provinces in Türkiye (including Adıyaman, Diyarbakır, Elazığ, Kahramanmaraş, Kilis, Malatya, Osmaniye, and Şanlıurfa). Many problems were encountered between 2001 and 2019 since the selection of and payment to inspecting companies were made directly by the contractor. In other words, if the contractor did not like the inspection results of the company that s/he has chosen, s/he might not pay for the services of the inspecting company and search for another company for the desired inspection results. Better inspection enforcement was achieved after 2019 with the introduction of a new type of system in which the inspecting company was randomly assigned from a pool of inspection firms. Payments were also made to the pool and the inspecting company was paid from this pool. Therefore, it can be concluded that the inspection services of construction work in Türkiye became more reliable after 2019 [1,45].
During the site investigations for the Kahramanmaraş earthquakes, buildings that were under construction were also examined. Unfortunately, there is a continuing problem with respect to site inspections. It was observed in some of the construction that both ends of the stirrups were not bent 135°, as shown in Figure 32a. However, both ends of the stirrups were bent 90° in most of buildings under construction in the earthquake zone (Figure 32b).
It is important to mention that not all the buildings in the region were damaged during the Kahramanmaraş earthquakes. Examples of such buildings are shown in Figure 33. Only hairline cracks were observed in these buildings, even though the buildings surrounding these buildings had damage levels ranging from major to collapsed. It can be concluded that buildings that are constructed based on the regulations of specifications may resist earthquakes with minor or no damage.

5. Conclusions and Recommendations

Two major earthquakes struck Pazarcık and Elbistan, towns in Kahramanmaraş, Türkiye, on 6 February 2023, approximately 9 h apart. The first earthquake, recorded early in the morning at 04:17 local time, had a 7.7 moment magnitude. At 13:24 local time, a second earthquake occurred in another town in the same province, approximately 90 km north of the first earthquake. The second event had a moment magnitude of 7.6. A total of 11 provinces (Adana, Adıyaman, Diyarbakır, Elazığ, Gaziantep, Hatay, Kahramanmaraş, Kilis, Malatya, Osmaniye, and Şanlıurfa), or 16.5% of the country’s total population (approximately 14 million people), were severely affected by the two earthquakes. A reconnaissance team consisting of the authors of this manuscript reached the earthquake affected regions 15 h after the first earthquake (Pazarcık, Mw = 7.7). The team’s 5-day visit included six of the provinces (Adana, Adıyaman, Gaziantep, Hatay, Kahramanmaraş, and Osmaniye) that experienced relatively more severe damage due to the earthquakes. The following conclusions and recommendations can be made based on the evaluation of the strong ground motion characteristics of the earthquakes and findings of the site investigations.
  • The largest horizontal and vertical PGA values of the Pazarcık earthquake with Mw = 7.7 were recorded respectively in Arsuz and Antakya (station numbers 3135 and 3125, see Table 3), towns in Hatay province, as 1.40 g and 1.17 g (or 1372.071 cm/s2 and 1151.556 cm/s2). According to TBES (2018) [31], the largest horizontal PGA value for residential and office type buildings located in local soil class ZC, which is the most common soil class in the region, is calculated as 0.51 g. It is evident that the code-generated PGA was exceeded by almost three times its typical value. Similar patterns were observed at the strong ground motion stations located along the south and south–west path extending from the epicenter. Therefore, the buildings in the region were exposed to much higher PGAs, which is believed to be the main reason for the extensive damage. It is recommended to re-evaluate the PGA values along all major fault lines in Türkiye.
  • The PGAs of the Mw = 7.6 earthquake were also similar to those of the Mw = 7.7 earthquake. The largest horizontal and vertical PGA values were recorded at station number 4612 (see Table 4), located in Göksun-Kahramanmaraş, as 0.65 g and 0.50 g (or 635.447 cm/s2 and 494.909 cm/s2), respectively. TBES (2018) [31] generated the largest PGA value calculated for residential and office building types located in a local class of ZC based on an earthquake with a return period of 475 years as 0.37 g. Similar to the first earthquake, the actual PGAs well-exceeded the code-generated ones by as high as 75%. These much higher PGAs are believed to be main reason behind the extent of the structural damage in the buildings.
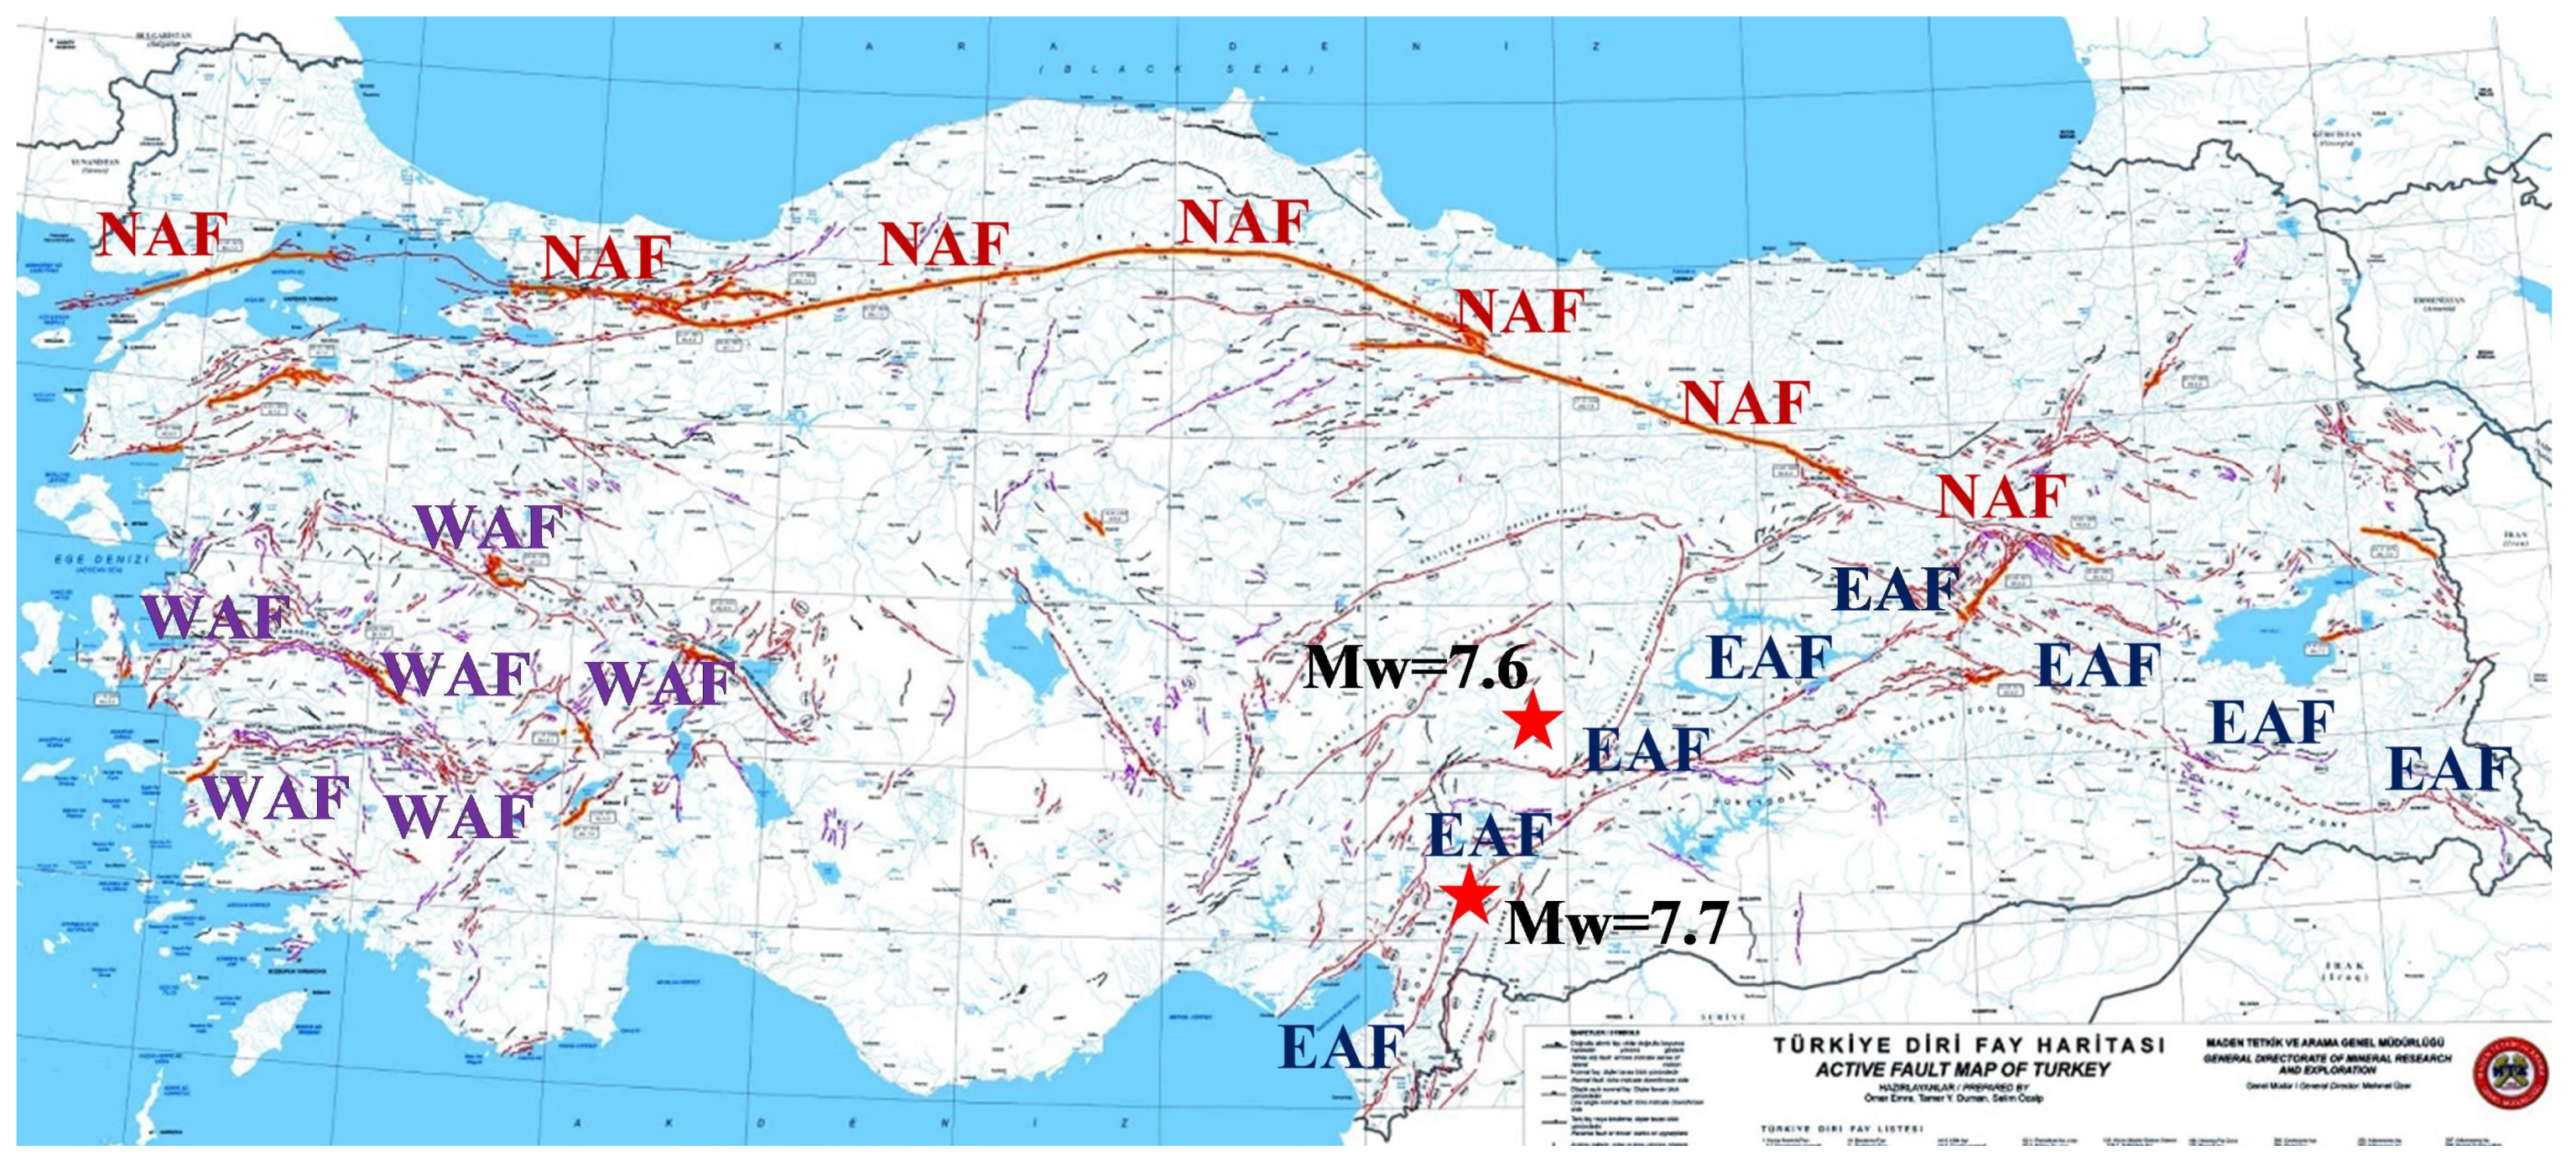
  • The directionality impact of the Mw = 7.7 magnitude earthquake that occurred along the intersection surfaces of the Anatolian, Arabian, and African plates was the cause of the damage on the structures, starting from the epicenter and propagating in the south–west direction following a path along Hassa, Kırıkhan, and Antakya, towns in Hatay province (see Figure 10).
  • The extent of structural damage on the buildings of Hatay was much more pronounced than those in the other cities since the alluvial soil type that exists in this region amplified the ground acceleration and the duration of the earthquake (see Figure 7 and Figure 14). Although the impact of soil amplification is considered in determining the PGA values according to the current Turkish earthquake code, TBES (2018) [31], both earthquakes exhibited much higher PGA values. Therefore, it is recommended to re-evaluate these parameters specifically in regions with alluvial soil, which are located in and around the major fault lines.
  • The total durations of both earthquakes resulted in much higher values than those from other major earthquakes that happened in the region, such as the 2003 Bingöl earthquake, Van (2011) and Sivrice, Elazığ (2020). These higher duration values undeniably contributed to the widespread level of damage that was observed in the buildings of the region.
  • It was observed that most of the regulations of the earthquake specifications valid at the time of construction of the majority of the collapsed buildings were not followed during the construction process.
  • In addition to the high levels of PGAs in these earthquakes, other major issues related to this level of damage in RC buildings are inadequate development lengths, violation of bending stirrup ends at 135°, deficiencies in construction materials and reinforcement configuration, noncompliance with confinement zones, violation of strong beam-stronger column analogy, and issues related to building inspection.
  • None of the collapsed buildings investigated by the reconnaissance team had both ends of the stirrups bent 135°. It was also observed that the spacing of the stirrups in some of the collapsed buildings was more than 300 mm.
  • Some strategically important structures such as bridges, hospitals, and airports should not experience any damage or collapse during earthquakes. The serviceability of these structures after earthquakes is very critical for emergency management, mitigation, and response. Therefore, special importance shall be provided to their design and construction, as required by current earthquake specifications.
  • The extent of the damage resulting from these earthquakes showed us that an in-depth site survey of buildings located in and around major fault lines in Türkiye should be conducted immediately. Due to the number of buildings in large quantity, an extensive collaboration is needed that will include the help of public and non-public institutions. Once this survey is complete, then relatively easy and effective strengthening methods should be recommended for these buildings. Therefore, the outcome of recent studies in strengthening should be carefully evaluated to determine the most applicable ones. These strengthening methods should be standardized in a way that the use of each building during its operation is not entirely obstructed. Based on the building stock, the majority of the buildings in the fault zone areas are residential, therefore it is important to utilize strengthening methods that would cause less obstruction to their residents.
  • The vast number of buildings located in the fault zone areas creates another challenge in determining their structural performance since their original shop drawings are not accessible due to their early construction years. Therefore, these buildings should be provided priority in determining their current conditions since they are likely to be more susceptible to earthquake events.

Author Contributions

Conceptualization, H.C.M., G.T. and T.A.; methodology, H.C.M., T.A. and G.T.; software, G.T.; validation, H.C.M., G.T. and T.A.; formal analysis, H.C.M. and G.T.; investigation, H.C.M., T.A., G.T., Y.K., İ.C.A.; resources, H.C.M., G.T. and T.A.; data curation, H.C.M. and G.T.; writing—original draft preparation, H.C.M. and G.T.; writing—review and editing, H.C.M., G.T., T.A., Y.K. and İ.C.A.; supervision, H.C.M., G.T. and T.A.; project administration, H.C.M. and T.A. All authors have read and agreed to the published version of the manuscript.

Funding

This research received no external funding.

Institutional Review Board Statement

Not applicable.

Informed Consent Statement

Not applicable.

Data Availability Statement

The data presented in this study are available on request from the corresponding author.

Acknowledgments

The authors acknowledge Atılım University’s support of the technical team. We also thank Nebil Yengüner and Vahide Nazar Yengüner for their guidance in Adana.

Conflicts of Interest

The authors declare no conflict of interest.

References

  1. Mertol, H.C.; Tunc, G.; Akış, T. Damage observation of reinforced concrete buildings after 2020 Sivrice (Elazığ) earthquake, Turkey. J. Perform. Constr. Fac. 2021, 35, 04021053. [Google Scholar] [CrossRef]
  2. Active Fault Maps. Available online: https://www.mta.gov.tr/v3.0/hizmetler/yenilenmis-diri-fay-haritalari (accessed on 17 February 2023).
  3. 06 Şubat 2023 Pazarcık (Kahramanmaraş) Mw 7.7 ve Elbistan (Kahramanmaraş) Mw 7.6 Depremlerine Ilişkin ön Değerlendirme Raporu; Disaster and Emergency Management Authority, AFAD: Ankara, Türkiye, 2023. Available online: https://deprem.afad.gov.tr/assets/pdf/Kahramanmaras%20%20Depremleri_%20On%20Degerlendirme%20Raporu.pdf (accessed on 17 February 2023).
  4. Address Based Population Registration System Results. 2022. Available online: https://data.tuik.gov.tr/Bulten/Index?p=Adrese-Dayal%C4%B1-N%C3%BCfus-Kay%C4%B1t-Sistemi-Sonu%C3%A7lar%C4%B1-2022-49685&dil=1 (accessed on 19 February 2023).
  5. Kahramanmaraş Depremlerinde Can Kaybı 50 Bin 783’e Yükseldi. Available online: https://www.dunya.com/gundem/kahramanmaras-depremlerinde-can-kaybi-50-bin-783e-yukseldi-haberi-692002 (accessed on 1 May 2023).
  6. Ulusal Risk Planı Toplantısı Sonrası Bakan Kurum’dan Önemli Açıklamalar: Deprem Bölgesine 405 Bin Konut. Available online: https://www.sabah.com.tr/galeri/gundem/ulusal-risk-plani-toplantisi-sonrasi-bakan-kurumdan-onemli-aciklamalar-deprem-bolgesine-405-bin-konut/12 (accessed on 9 March 2023).
  7. Okay, A.I.; Zattın, M.; Cavazza, W. Apatite fission-track data for the miocene Arabia-Eurasia collision. Geology 2010, 38, 35–38. [Google Scholar] [CrossRef]
  8. Barka, A.A.; Reilinger, R. Active tectonics of the Mediterranean region: Deduced from GPS, neotectonic and seismicity data. Ann. Geofis. 1997, 40, 587–610. [Google Scholar] [CrossRef]
  9. McClusky, S.; Balassanian, S.; Barka, A.; Demir, C.; Ergintav, S.; Georgiev, I.; Gürkan, O.; Hamburger, M.; Hurst, K.; Kahle, H.; et al. Global positioning system constraints on plate kinematics and dynamics in the eastern Mediterranean and Caucasus. J. Geophys. Res. 2000, 105, 5695–5719. [Google Scholar] [CrossRef]
  10. Reilinger, R.; McClusky, S.; Vernant, P.; Lawrence, S.; Ergintav, S.; Cakmak, R.; Ozener, H.; Kadirov, F.; Guliev, I.; Stepanyan, R.; et al. GPS constraints on continental deformation in the Africa-Arabia-Eurasia continental collision zone and implications for the dynamics of plate interactions. J. Geophys. Res. 2006, 111, B05411. [Google Scholar] [CrossRef]
  11. 06 Şubat 2023 Kahramanmaraş Depremleri Genişletilmiş Bilgi Notu; General Directorate of Mineral Exploration and Research (MTA), Department of Geological Studies: Ankara, Türkiye, 2023.
  12. Ambraseys, N.N.; Finkel, C. Seismicity of Turkey and neighbouring regions, 1899–1915. Ann. Geophys. 1987, 5B, 701–726. [Google Scholar]
  13. Ambraseys, N.N. Engineering seismology. J. Earthq. Eng. Struct. Dyn. 1988, 17, 1–105. [Google Scholar] [CrossRef]
  14. Ambraseys, N.N. Temporary seismic quiescence: SE Turkey. Geophys. J. 1989, 96, 311–331. [Google Scholar] [CrossRef] [Green Version]
  15. Ambraseys, N.N.; Finkel, C.F. The Seismicity of Turkey and Adjacent Areas-A Historical Review, 1500–1800, 1st ed.; Eren Press: İstanbul, Turkey, 1995. [Google Scholar]
  16. Stiros, S. The AD 365 Crete earthquake and possible seismic clustering during the 4–6th centuries AD in the Eastern Mediterranean: A review of historical and archaeological data. J. Struct. Geol. 2001, 23, 545–562. [Google Scholar] [CrossRef]
  17. Tan, O.; Tapırdamaz, C.; Yörük, A. The Earthquake catalogues for Turkey. Turk. J. Earth Sci. 2008, 17, 405–418. [Google Scholar]
  18. Ambraseys, N. Earthquakes in the Mediterranean and Middle East, A Multidisciplinary Study of Seismicity up to 1900, 1st ed.; Cambridge University Press: London, UK, 2009. [Google Scholar]
  19. Kadirioğlu, F.T.; Kartal, R.F.; Kılıç, T.; Kalafat, D.; Duman, T.Y.; Eroğlu Azak, T.; Özalp, S.; Emre, Ö. Türkiye ve yakın çevresi için geliştirilmiş aletsel dönem (1900–2012) deprem kataloğu (M ≥ 4.0). In Türkiye Sismotektonik Haritası Ölçek 1:500.000, Special Publication No:34, 1st ed.; Duman, T.Y., Ed.; Maden Tetkik ve Arama Genel Müdürlüğü: Ankara, Türkiye, 2017; pp. 59–83. [Google Scholar]
  20. Kadirioğlu, F.T.; Kartal, R.F.; Kılıç, T.; Kalafat, D.; Duman, T.Y.; Eroğlu Azak, T.; Özalp, S.; Emre, Ö. An improved earthquake catalogue (M ≥ 4.0) for Turkey and its near Vicinity (1900–2012). Bull. Earthq. Eng. 2018, 16, 3317–3338. [Google Scholar] [CrossRef]
  21. Emre, Ö.; Duman, T.Y.; Özalp, S.; Elmacı, H.; Olgun, Ş.; Şaroğlu, F. Açıklamalı Türkiye Diri Fay Haritası Ölçek 1:1.250.000, Special Publication No:30, 1st ed.; Maden Tetkik ve Arama Genel Müdürlüğü: Ankara, Türkiye, 2013.
  22. Türkiye Earthquake Hazard Map, Disaster and Emergency Management Authority, AFAD. Available online: https://tdth.afad.gov.tr/ (accessed on 21 February 2023).
  23. Türkiye’s Geology Maps Based on 1/500,000 Scale. Available online: https://www.mta.gov.tr/v3.0/hizmetler/500bas (accessed on 23 February 2023).
  24. Mertol, H.C.; Tunc, G.; Akış, T. Evaluation of masonry buildings and mosques after Sivrice earthquake. Gradevinar 2021, 73, 881–892. [Google Scholar] [CrossRef]
  25. Boğaziçi University, Kandilli Observatory and Earthquake Research Institute (KOERI) Regional Earthquake-Tsunami Monitoring Center. Available online: http://www.koeri.boun.edu.tr/sismo/2/tr/ (accessed on 24 February 2023).
  26. The 2023 Kahramanmaraş, Turkey, Earthquake Sequence. Available online: https://earthquake.usgs.gov/storymap/index-turkey2023.html (accessed on 25 February 2023).
  27. Global CMT Web Page. Available online: https://www.globalcmt.org/ (accessed on 22 February 2023).
  28. Geofon. Available online: https://geofon.gfz-potsdam.de/ (accessed on 21 February 2023).
  29. Turkish Accelerometric Database and Analysis System. Available online: https://tadas.afad.gov.tr/ (accessed on 20 February 2023).
  30. Paolucci, R.; Pacor, F.; Puglia, R.; Ameri, G.; Cauzzi, C.; Massa, M. Record processing in ITACA, the new Italian strong-motion database. In Earthquake Data in Engineering Seismology, Geotechnical, Geological and Earthquake Engineering Series, 1st ed.; Akkar, S., Gulkan, P., Van Eck, T., Eds.; Springer: Berlin/Heidelberg, Germany, 2011; Volume 14, pp. 99–113. [Google Scholar]
  31. Turkish Building Earthquake Specifications, 2018; Disaster and Emergency Management Authority, AFAD: Ankara, Türkiye, 2018.
  32. Taskin, B.; Sezen, A.; Tugsal, U.M.; Erken, A. The aftermath of 2011 Van earthquakes: Evaluation of strong motion, geotechnical and structural issues. Bull. Earthq. Eng. 2013, 11, 285–312. [Google Scholar] [CrossRef]
  33. Doğangün, A. Performance of reinforced concrete buildings during the 1 May 2003 Bingol earthquake in Turkey. Eng. Struct. 2004, 26, 841–856. [Google Scholar] [CrossRef]
  34. 2023, Kahramanmaraş and Hatay Earthquake Reports; Türkiye Presidency of Strategy and Budget: Ankara, Türkiye, 2023. Available online: https://www.sbb.gov.tr/2023-kahramanmaras-ve-hatay-depremleri-raporu/ (accessed on 10 May 2023).
  35. Building and Housing Survey. 2021. Available online: https://data.tuik.gov.tr/Bulten/Index?p=Bina-ve-Konut-Nitelikleri-Ara%C5%9Ft%C4%B1rmas%C4%B1-2021-45870&dil=1 (accessed on 1 May 2023).
  36. TS 500 Design and Construction Rules of Reinforced Concrete Structures, 2000; Turkish Standards Institute: Ankara, Türkiye, 2000.
  37. TS 500 Design and Construction Rules of Reinforced Concrete Structures, 1969; Turkish Standards Institute: Ankara, Türkiye, 1969.
  38. TS 500 Design and Construction Rules of Reinforced Concrete Structures, 1975; Turkish Standards Institute: Ankara, Türkiye, 1975.
  39. TS 500 Design and Construction Rules of Reinforced Concrete Structures, 1984; Turkish Standards Institute: Ankara, Türkiye, 1984.
  40. Tunc, T.E.; Tunc, G. Transferring Technical Knowledge to Turkey: American Engineers, Scientific Experts, and the Erzincan Earthquake of 1939. Notes Rec. Roy. Soc. J. Hist. Sci. 2022, 76, 387–406. [Google Scholar] [CrossRef]
  41. Specifications on Structures Constructed in Disaster Regions, 1975; Ministry of Construction and Settlement: Ankara, Türkiye, 1975.
  42. Specifications on Structures Constructed in Disaster Regions, 1998; Ministry of Public Works and Settlement: Ankara, Türkiye, 1998.
  43. Specifications on Buildings Constructed in Earthquake Regions, 2007; Ministry of Public Works and Settlement: Ankara, Türkiye, 2007.
  44. Baran, E.; Mertol, H.C.; Gunes, B. Damage in reinforced-concrete buildings during the 2011 Van, Turkey, earthquakes. J. Perform. Constr. Fac. 2014, 28, 466–479. [Google Scholar] [CrossRef]
  45. Mertol, H.C.; Tunc, G.; Akış, T. A site survey of damaged RC buildings in İzmir after the Aegean Sea earthquake on 30 October 2020. Gradevinar 2023, 75, 451–470. [Google Scholar] [CrossRef]
Figure 1. Türkiye’s active fault lines and Kahramanmaraş earthquakes’ epicenters (adapted from [2] and map data © Google Maps, 2023).
Buildings 13 01789 g001
Figure 2. Magnitudes and epicenters of two earthquakes in Kahramanmaraş (map data © Google Maps, 2023).
Buildings 13 01789 g002
Figure 3. Intercontinental plate movements in and around Türkiye (adapted from [7]).
Buildings 13 01789 g003
Figure 4. Active fault lines of earthquake region with: (a) non-instrumental time period earthquakes; (b) instrumental time period earthquakes (adapted from [21]).
Buildings 13 01789 g004
Figure 5. Türkiye’s earthquake hazard map (recurrence period 475 years) (adapted from [22]).
Buildings 13 01789 g005
Figure 6. Peak ground acceleration (PGA) values around region for a recurrence period of 475 years (adapted from [22]).
Buildings 13 01789 g006
Figure 7. Detailed geological map of region (adapted from [23]).
Buildings 13 01789 g007
Figure 8. Daily distribution of aftershocks recorded in region between 6 and 16 February 2023: (a) on map (adapted from [29]); (b) sorted by their number of occurrences; (c) sorted by their magnitudes.
Buildings 13 01789 g008
Figure 9. Locations of strong ground motion stations in earthquake affected area (adapted from [29]).
Buildings 13 01789 g009
Figure 10. Locations of 30 strong ground motion stations (Map data © Google Maps, 2023).
Buildings 13 01789 g010
Figure 11. Locations of 12 strong ground motion stations (Map data © Google Maps, 2023).
Buildings 13 01789 g011
Figure 12. PGAs in g measured at 12 strong ground motion stations for Mw = 7.7 and Mw = 7.6 earthquakes (Map data © Google Maps, 2023).
Buildings 13 01789 g012
Figure 13. Acceleration time history records and spectrum acceleration values of 12 stations plotted with design acceleration spectrum values (data for Mw = 7.7 are marked with green circles, while data for Mw = 7.6 are marked with blue circles).
Buildings 13 01789 g013aBuildings 13 01789 g013b
Figure 14. Variation of earthquake duration at 12 stations: (a) north–south direction for Mw = 7.7 earthquake; (b) east–west direction for Mw = 7.7 earthquake; (c) north–south direction for Mw = 7.6 earthquake; (d) east–west direction for Mw = 7.6 earthquake.
Buildings 13 01789 g014
Figure 15. Total number of buildings and percentile distribution based on their construction materials (data extracted from [34]).
Buildings 13 01789 g015
Figure 16. Percentile distribution of buildings based on their construction years (data extracted from [34]).
Buildings 13 01789 g016
Figure 17. Percentage of buildings based on their number of floors (data extracted from [35]).
Buildings 13 01789 g017
Figure 18. Amount of building damage in 11 provinces after Kahramanmaraş earthquakes (data extracted from [6]).
Buildings 13 01789 g018
Figure 19. Examples of collapsed buildings in various provinces: (a) before earthquakes (Photo © Google Maps, 2023); (b) after earthquakes.
Buildings 13 01789 g019
Figure 20. Common issues explained in this section.
Buildings 13 01789 g020
Figure 21. Photographs of requirements related to development lengths based on: (a) SSCDR (1975) [41]; (b) TBES (2018) [31].
Buildings 13 01789 g021
Figure 22. Examples of inadequate development lengths in: (a) Hatay-1; (b) Hatay-2; (c) Kahramanmaraş.
Buildings 13 01789 g022
Figure 23. Photographs of requirements related to bending of stirrup ends based on: (a) SSCDR (1975) [41]; (b) TBES (2018) [31].
Buildings 13 01789 g023
Figure 24. Examples of bending of stirrup ends at 90° in: (a) Kahramanmaraş; (b) Gaziantep; (c) Hatay.
Buildings 13 01789 g024
Figure 25. Poor concrete quality (a) aggregates having round shapes; (b) large-sized aggregates; (c) wooden pieces in concrete.
Buildings 13 01789 g025
Figure 26. Extensive corrosion of steel reinforcement in Hatay.
Buildings 13 01789 g026
Figure 27. Closely spaced longitudinal reinforcement placement in Hatay.
Buildings 13 01789 g027
Figure 28. Photographs of requirements related to confinement zones based on: (a) SSCDR (1975) [41]; (b) TBES (2018) [31].
Buildings 13 01789 g028
Figure 29. Examples of noncompliance with confinement zones in: (a) Kahramanmaraş; (b) Hatay.
Buildings 13 01789 g029
Figure 30. Strong beam-stronger column concept based on SSCDR (1998) [42].
Buildings 13 01789 g030
Figure 31. Strong beam-stronger column concept: (a) building not designed using this concept in Adıyaman; (b) building designed using this concept in Hatay.
Buildings 13 01789 g031
Figure 32. Examples of bending of stirrup ends in buildings under construction: (a) one end was bent 135° and other was bent 90°; (b) both ends were bent 135°.
Buildings 13 01789 g032
Figure 33. Undamaged buildings in: (a) Kahramanmaraş; (b) Adıyaman.
Buildings 13 01789 g033
Table 1. Direct distances of centers of affected provinces to epicenters of earthquakes.
Center of
Province
Pazarcık Earthquake (Mw = 7.7)
(km)
Elbistan Earthquake (Mw = 7.6)
(km)
Adana155208
Adıyaman12298
Diyarbakır288260
Elazığ245185
Gaziantep39114
Hatay145230
Kahramanmaraş3464
Kilis64153
Malatya160100
Osmaniye75142
Şanlıurfa156170
Table 2. Characteristics of Pazarcık and Elbistan earthquakes, 6 February 2023, with Mw = 7.7 and Mw = 7.6, respectively.
Source *Magnitude (Mw)Local TimeGPS CoordinatesFocal Depth (km)
AFAD [3] 7.704:17:3437.288 N–37.043 E8.6
7.613:24:4738.089 N–37.239 E7.0
KOERI [25] 7.704:17:3237.161 N–37.097 E5.9
7.713:24:4638.072 N–37.206 E5.0
USGS [26] 7.804:17:3237.166 N–37.042 E17.9
7.513:24:4638.024 N–37.203 E10.0
CMT [27]7.804:18:1037.560 N–37.470 E14.9
7.713:24:5938.110 N–37.220 E12.0
GFZ [28]7.804:17:3537.230 N–37.050 E10.0
7.613:24:5038.110 N–37.230 E10.0
* AFAD: Disaster and Emergency Management Authority in Türkiye; KOERI: Kandilli Observatory and Earthquake Research Institute; USGS: The United States Geological Survey; CMT: The Centroid-Moment-Tensor Project; GFZ: GeoForschungsZentrum, Germany.
Table 3. Mw = 7.7 Pazarcık earthquake information recorded at 30 strong ground motion measurement stations.
Station NumberProvinceTownLatitude
(°)
Longitude
(°)
PGA (cm/s2)Repi
(km)
NSEWVertical
4610KahramanmaraşElbistan38.203737.1977--------
4614KahramanmaraşPazarcık37.485137.2978--------
4612KahramanmaraşGöksun38.023936.4819140.970122.22254.30895.587
4616KahramanmaraşTürkoğlu-137.375536.8384652.757502.870397.26920.542
4617KahramanmaraşOnikişubat37.585536.8303145.326115.156110.59038.040
4629KahramanmaraşTürkoğlu-237.287436.7887338.935248.195124.36422.500
3117Hatayİskenderun36.557136.1747968.9041093.2451111.024112.082
3125HatayAntakya36.238136.1326822.6161121.9481151.556142.146
3129HatayDefne36.191236.13431353.0231209.572826.359146.392
3134 HatayDörtyol36.827636.2049246.107203.909141.51090.288
3135HatayArsuz36.408935.8831740.9711372.071588.966142.154
3137HatayHassa36.802636.5112453.091848.012501.97952.480
3140HataySamandağ36.081635.9498194.687218.709176.666165.825
3141HatayAntakya36.372636.2197961.116868.819722.660125.417
3142HatayKırıkhan36.497936.3661646.630749.514505.895106.490
3146HatayBelen36.490736.2269483.846346.931341.394114.566
2703GaziantepŞahinbey37.058037.3500156.634165.06480.10537.336
2712GaziantepNurdağı37.184036.7328554.850602.658346.12229.794
2718GaziantepIslahiye37.007836.6266702.422644.970585.78848.301
0125AdanaCeyhan37.015235.7958128.55183.12335.149114.624
0131AdanaSaimbeyli37.856636.1153155.715159.76549.399103.350
8003OsmaniyeCity Center37.084236.2694141.567185.738139.89472.184
0201AdıyamanCity Center37.761238.2674474.121879.950318.965120.116
0213AdıyamanTut37.796637.9295242.279171.695291.29196.480
4404MalatyaPütürge38.195838.8738136.244137.41696.942190.015
4406MalatyaAkçadağ38.343937.9738108.738131.34449.998143.070
6305ŞanlıurfaHaliliye37.168138.8014126.659104.09059.921155.060
7901KilisCity Center36.708837.112353.11416.55250.13964.697
2308ElazığSivrice38.450639.3102327.332185.201424.178237.303
2101DiyarbakırBağlar37.930940.202877.07971.42433.527287.353
Table 4. Mw = 7.6 Elbistan earthquake information recorded at 30 strong ground motion measurement stations.
Station NumberProvinceTownLatitude
(°)
Longitude
(°)
PGA (cm/s2)Repi
(km)
NSEWVertical
4610KahramanmaraşElbistan38.203737.1977--------
4614KahramanmaraşPazarcık37.485137.2978160.8168206.047389.206767.346
4612KahramanmaraşGöksun38.023936.4819635.4467523.2124494.908666.684
4616KahramanmaraşTürkoğlu-137.375536.838457.546253.503128.054286.812
4617KahramanmaraşOnikişubat37.585536.830355.974082.694654.789166.502
4629KahramanmaraşTürkoğlu-237.287436.7887--------
3117Hatayİskenderun36.557136.1747--------
3125HatayAntakya36.238136.132625.627521.047618.8865227.965
3129HatayDefne36.191236.134322.784826.620612.2487232.636
3134HatayDörtyol36.827636.204930.571140.040018.0138167.342
3135HatayArsuz36.408935.883118.146915.501513.1047222.043
3137HatayHassa36.802636.51120.11030.06550.0664156.805
3140HataySamandağ36.081635.949829.102730.200114.8747250.799
3141HatayAntakya36.372636.219725.712723.117014.4710211.109
3142HatayKırıkhan36.497936.366110.380921.28706.9431193.028
3146HatayBelen36.490736.226917.674418.287813.0075198.991
2703GaziantepŞahinbey37.058037.350093.682363.449227.6500115.059
2712GaziantepNurdağı37.184036.7328--------
2718GaziantepIslahiye37.007836.626634.472850.575921.7643131.792
0125AdanaCeyhan37.015235.795870.094150.676823.0598174.477
0131AdanaSaimbeyli37.856636.1153402.3211331.689785.2904101.827
8003OsmaniyeCity Center37.084236.269448.696966.602128.9820140.653
0201AdıyamanCity Center37.761238.2674--------
0213AdıyamanTut37.796637.9295121.2970126.618671.346968.729
4404MalatyaPütürge38.195838.873845.362348.540139.3300143.463
4406MalatyaAkçadağ38.343937.9738467.2015409.3123318.751070.171
6305ŞanlıurfaHaliliye37.168138.8014--------
7901KilisCity Center36.708837.112350.909949.814322.4084153.879
2308ElazığSivrice38.450639.310269.798148.524133.7963185.227
2101DiyarbakırBağlar37.930940.202825.765621.590713.3491260.243
Table 5. Last four earthquake specifications published in Türkiye.
YearSpecification
1975Specifications on Structures Constructed in Disaster Regions (SSCDR, 1975) [41]
1998Specifications on Structures Constructed in Disaster Regions (SSCDR, 1998) [42]
2007Specifications on Buildings Constructed in Earthquake Regions (SBCER, 2007) [43]
2018Turkish Building Earthquake Specifications (TBES, 2018) [31]
Disclaimer/Publisher’s Note: The statements, opinions and data contained in all publications are solely those of the individual author(s) and contributor(s) and not of MDPI and/or the editor(s). MDPI and/or the editor(s) disclaim responsibility for any injury to people or property resulting from any ideas, methods, instructions or products referred to in the content.

