Article

Improvement in the Seismic Performance of a Super-Long-Span Concrete-Filled Steel-Tube-Arch Bridge

1
State Key Laboratory of Mountain Bridge and Tunnel Engineering, Chongqing Jiaotong University, Chongqing 400074, China
2
School of Tourism and Service Management, Chongqing University of Education, Chongqing 400065, China
*
Author to whom correspondence should be addressed.
Buildings 2023, 13(7), 1811; https://doi.org/10.3390/buildings13071811
Submission received: 9 June 2023 / Revised: 27 June 2023 / Accepted: 12 July 2023 / Published: 16 July 2023
(This article belongs to the Special Issue Intelligent Building Health Monitoring and Assessment)

Abstract

:
The applicability of current seismic-performance-improvement technologies needs to be studied. This research took a super-long-span CFST arch bridge with a total length of 788 m as the object on which to perform a non-linear time-history analysis and a seismic-check calculation according to the seismic response, so as to reveal the seismic weak points of the arch bridge. After the completion of the bridge’s construction, we arranged and utilized the stayed buckle cables (SBCs) reasonably. The seismic performance of the super-long-span CFST arch bridge was improved through friction-pendulum bearings (FPBs) and SBCs. The research shows that FPBs can solve the problem of the insufficient shear resistance of bearings, and SBCs can address the problem whereby the compressive stress of the transverse connection of the main arch exceeds the allowable stress. Moreover, SBCs can increase the transverse stiffness of arch bridges and reduce their seismic responses. Finally, a combination of FPBs and SBCs was adopted to improve the overall seismic performance of the arch bridge and obtain the best seismic-performance-improvement effect.

1. Introduction

The long-span deck-type concrete-filled steel tube (CFST) arch bridge has good terrain adaptability, while being economical and providing high levels of structural stiffness [1,2,3,4,5,6]. It is suitable for building in the mountainous area of southwest China. It is also one of the most cost-competitive bridge types in the 300-to-600-meter-span range. However, China is a country subject to frequent earthquakes, especially in the south-west region. All the earthquakes in recent years have caused severe losses.
Under the effects of earthquakes, the inertial force of a deck-type CFST arch bridge is mainly concentrated in the upper part, and excessive inertial force of the upper structure directly leads to the shear failure of the bearings between the upper and lower structures. The placement of an isolation device between the upper and lower structures can reduce the inertial force of the upper structure, which not only overcomes the problem of the insufficient shear resistance of the bearings, but also achieves the purpose of protecting the lower structure. The technique of base isolation originated in the 1960s and 1970s [7,8,9]. Its main purpose is to introduce a flexible bottom layer into the structure, so that the structure can be isolated from the ground motion induced by the earthquake, thus protecting the superstructure from earthquake damage. In the 1960s, Li Li, a Chinese scholar, proposed and studied the idea and method of using a sand layer and a rubber layer for isolation [10]. At the same time, Kelly, an American scholar, proposed the use of laminated rubber bearings as a method of isolation [11]. Later, Ali and others used the finite element method to conduct numerical simulations and calculated and evaluated the damping effect of lead–rubber bearings applied to long-span cable-stayed bridges [12]. Since then, foundation-isolation technology has developed rapidly; isolation technology has matured, the design theory has been refined, and the application of isolation technology has become increasingly widespread [13]. The friction-pendulum bearing (FPB) is a promising new type of seismic isolation device, which converts seismic energy into heat energy through friction-energy dissipation. Its unique circular sliding surface gives it a self-resetting function [14,15,16]; in recent years, research into this feature has increased. Many scholars [17,18,19,20,21,22,23,24,25,26,27] studied the seismic responses of FPBs applied to beam bridges and cable-stayed bridges, among others. The economical and structural efficiency of FPBs for the retrofitting of continuous beam bridges in the State of Illinois was studied by Dicleli et al. [17]. Almazán et al. [18] presented a physical model for frictional pendulum isolators (FPS) that was ready to be implemented in most commercial software, and the physical model was validated by studying the earthquake response of a continuous beam bridge. Murat et al. [19,20] proposed a new model for the FPS and examined the effects of modeling parameters on the response of a three-dimensional multi-span continuous (MSC) steel-girder-bridge model seismically isolated with the FPS. Jun Gao et al. [22] assessed the damping performance of frictional pendulum bearings in long-span cable-stayed bridge bearings. Zhiqiang Li et al. [23] explored vibration mitigation and isolation for a long-span cable-stayed bridge with double-arch pylons based on FPBs. Jing Li et al. [24] studied the parametric optimization of vibration mitigation and isolation scheme for a railway cable-stayed bridge. A global non-linear time-history analysis of the Benicia–Martinez Bridge, which is a long-span truss bridge, was conducted using ADINA by Mutobe et al. [25]. Ingham [26] presented a non-linear time-history analysis undertaken in support of the seismic retrofitting of the bridge, and the work included the installation of friction-pendulum-isolation bearings. Marin-Artieda et al. [27] proposed an XY-FPB that consisted of two perpendicular steel rails with opposing concave surfaces and a connector and applied it to a truss bridge. At present, isolation technology is mainly applied to the seismic resistance of medium- and small-span continuous beam bridges, cable-stayed bridges, and truss bridges in areas of high seismic intensity. However, the application of isolation technology in long-span CFST arch bridges requires further research.
The transverse connecting system of the main arch is a vulnerable component; because of the high level of stiffness of the lateral connection system, there a large internal force response and buckling instability occur under earthquake conditions [28,29]. Of the existing seismic performance-improvement technologies, buckling-restrained brace (BRB) may be the only type that can effectively address the buckling instability of the transverse connection system of the main arch [30,31,32,33,34,35,36,37]. However, compared with buildings, the super-long-span CFST arch bridge has the characteristics of large internal force and small displacement. As a displacement-type energy-dissipation device, the BRB is applied to a super-long-span CFST arch bridge, and it is very likely that the energy-dissipation effect is lower than the expected effect, making it necessary to find another way in which to improve the seismic performance of the transverse connection system of the main arch.
The cable-hoisting-and-inclined-pulling-and-fastening method (CHIPFM) is the most commonly used method of construction for long-span CFST arch bridges. The associated construction process is as follows. First, a temporary buckle tower and cable tower are built before the installation of the arch rib. At the same time, the arch rib is divided according to the hoisting capacity of the cable-hoisting system (CHS). Next, the CHS is used to hoist the arch rib to the designated position section by section for cantilever assembly. At the same time, each arch-rib section is buckled onto the buckle tower with the help of an anchor cable until the arch rib is closed. Finally, the CHS is removed. The stayed buckle cable (SBC) is the main item of equipment in the CHS. It is often used in such work; it is only a temporary facility, and it is removed after construction. The CHIPFM has been vigorously promoted and used in the construction of large-span DCFST arch bridges because of its mature construction technology, fast construction speed, convenient transportation of materials, strong spanning ability, and applicability to canyons and rivers with complex terrain and harsh environments [38,39,40,41]. Scholars have conducted significant research into the CHIPFM, to good effect [42,43,44]. The existing research mainly focuses on the calculation of the cable forces of SBCs and construction control [42,43,44,45]. However, relevant research on the impact of SBCs on the seismic performance of arch bridges has not been performed. As a temporary measure in the CHIPFM, SBCs complete missions after the arch rib is closed and cannot be reused, resulting in a waste of resources. Since SBCs show the characteristics of convenient installation, easy replacement after earthquake damage, and reasonable arrangement to increase the transverse stiffness of arch bridges, they can be retained after the completion of bridge construction to improve the transverse seismic performance of super-large-span arch bridges, providing a new way of improving the seismic performances of these bridges.
The existing research still lacks evidence that can guide the seismic-performance-improvement design of super-long-span CFST arch bridges. Therefore, this research took a super-long-span CFST arch bridge with a total length of 788 m as the object on which to perform a non-linear time-history analysis and a seismic-checking calculation according to its seismic response, so as to reveal the seismic weak points of the arch bridge. The seismic performance of the arch bridge was improved through FPBs and SBCs, making it possible to propose a more suitable seismic-performance-improvement technology for super-long-span concrete-filled steel-tube arch bridges. Finally, the seismic-performance-improvement effects of the FPBs, SBCs, and combination schemes were compared, and the optimal scheme was established.

2. Seismic-Response Analysis of Original Model

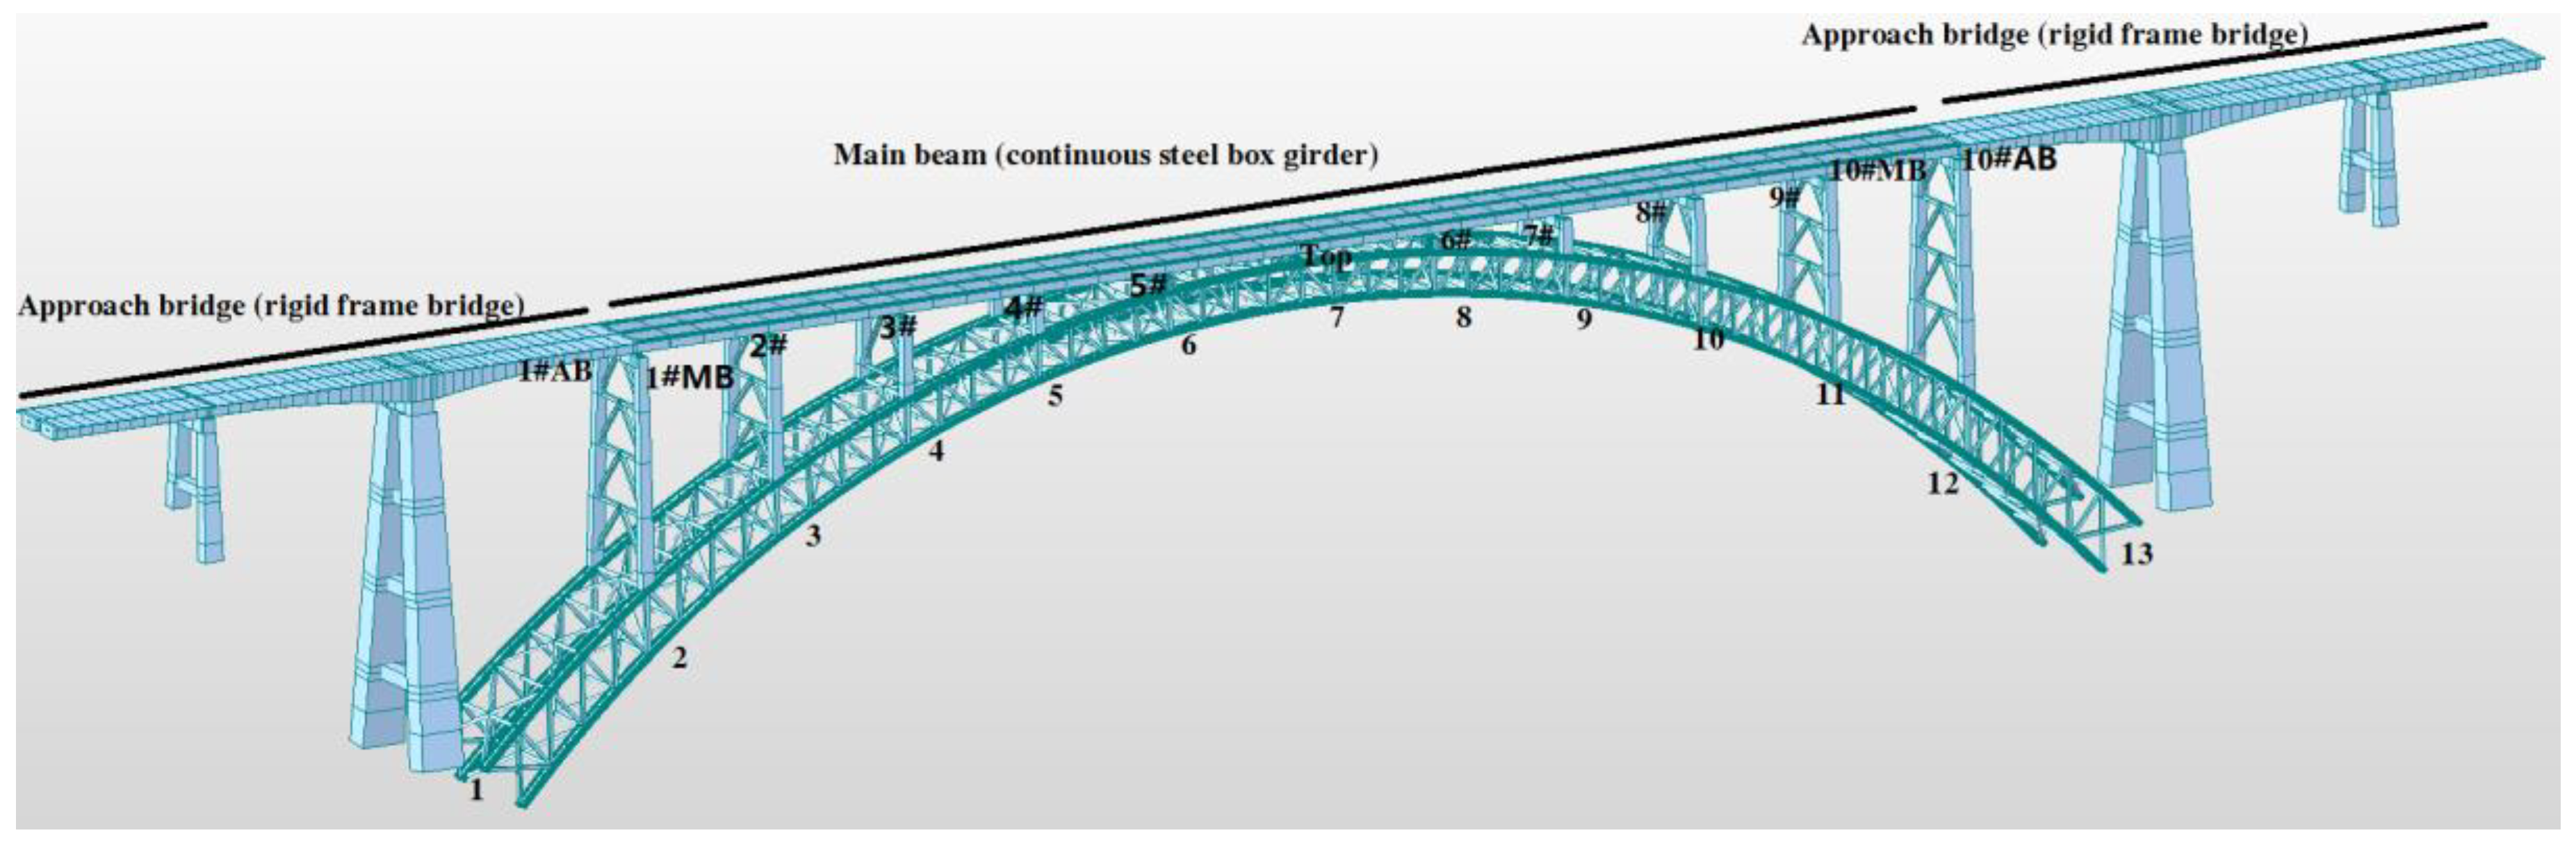
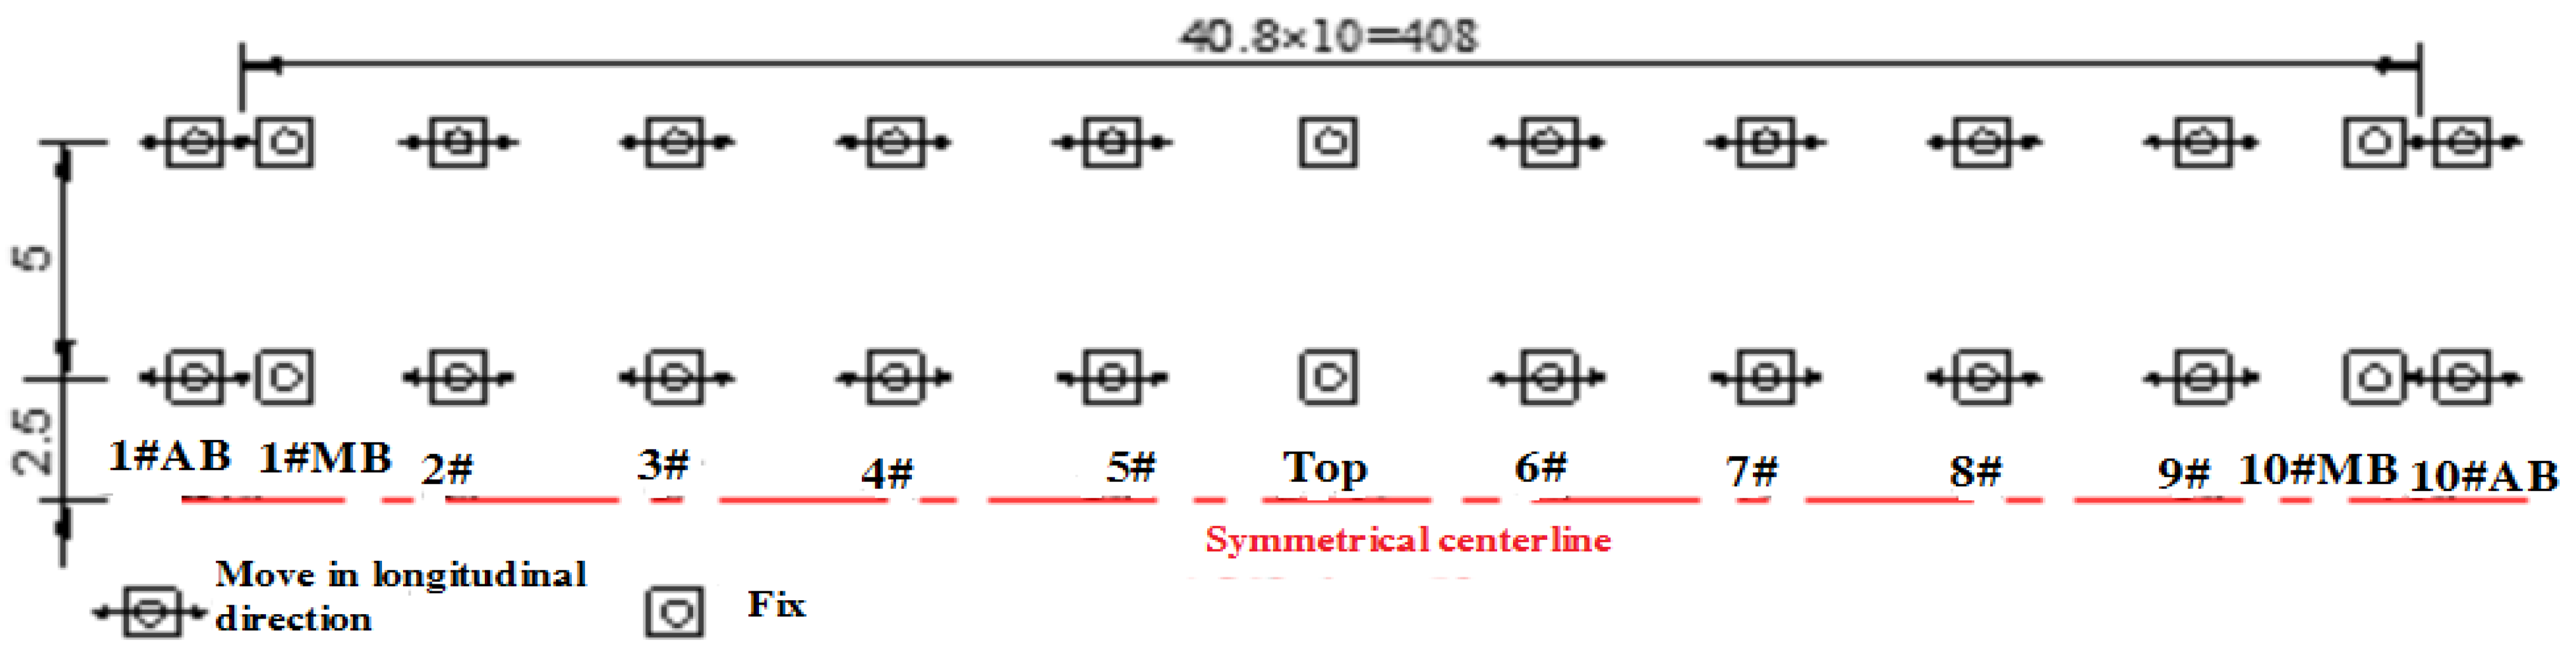
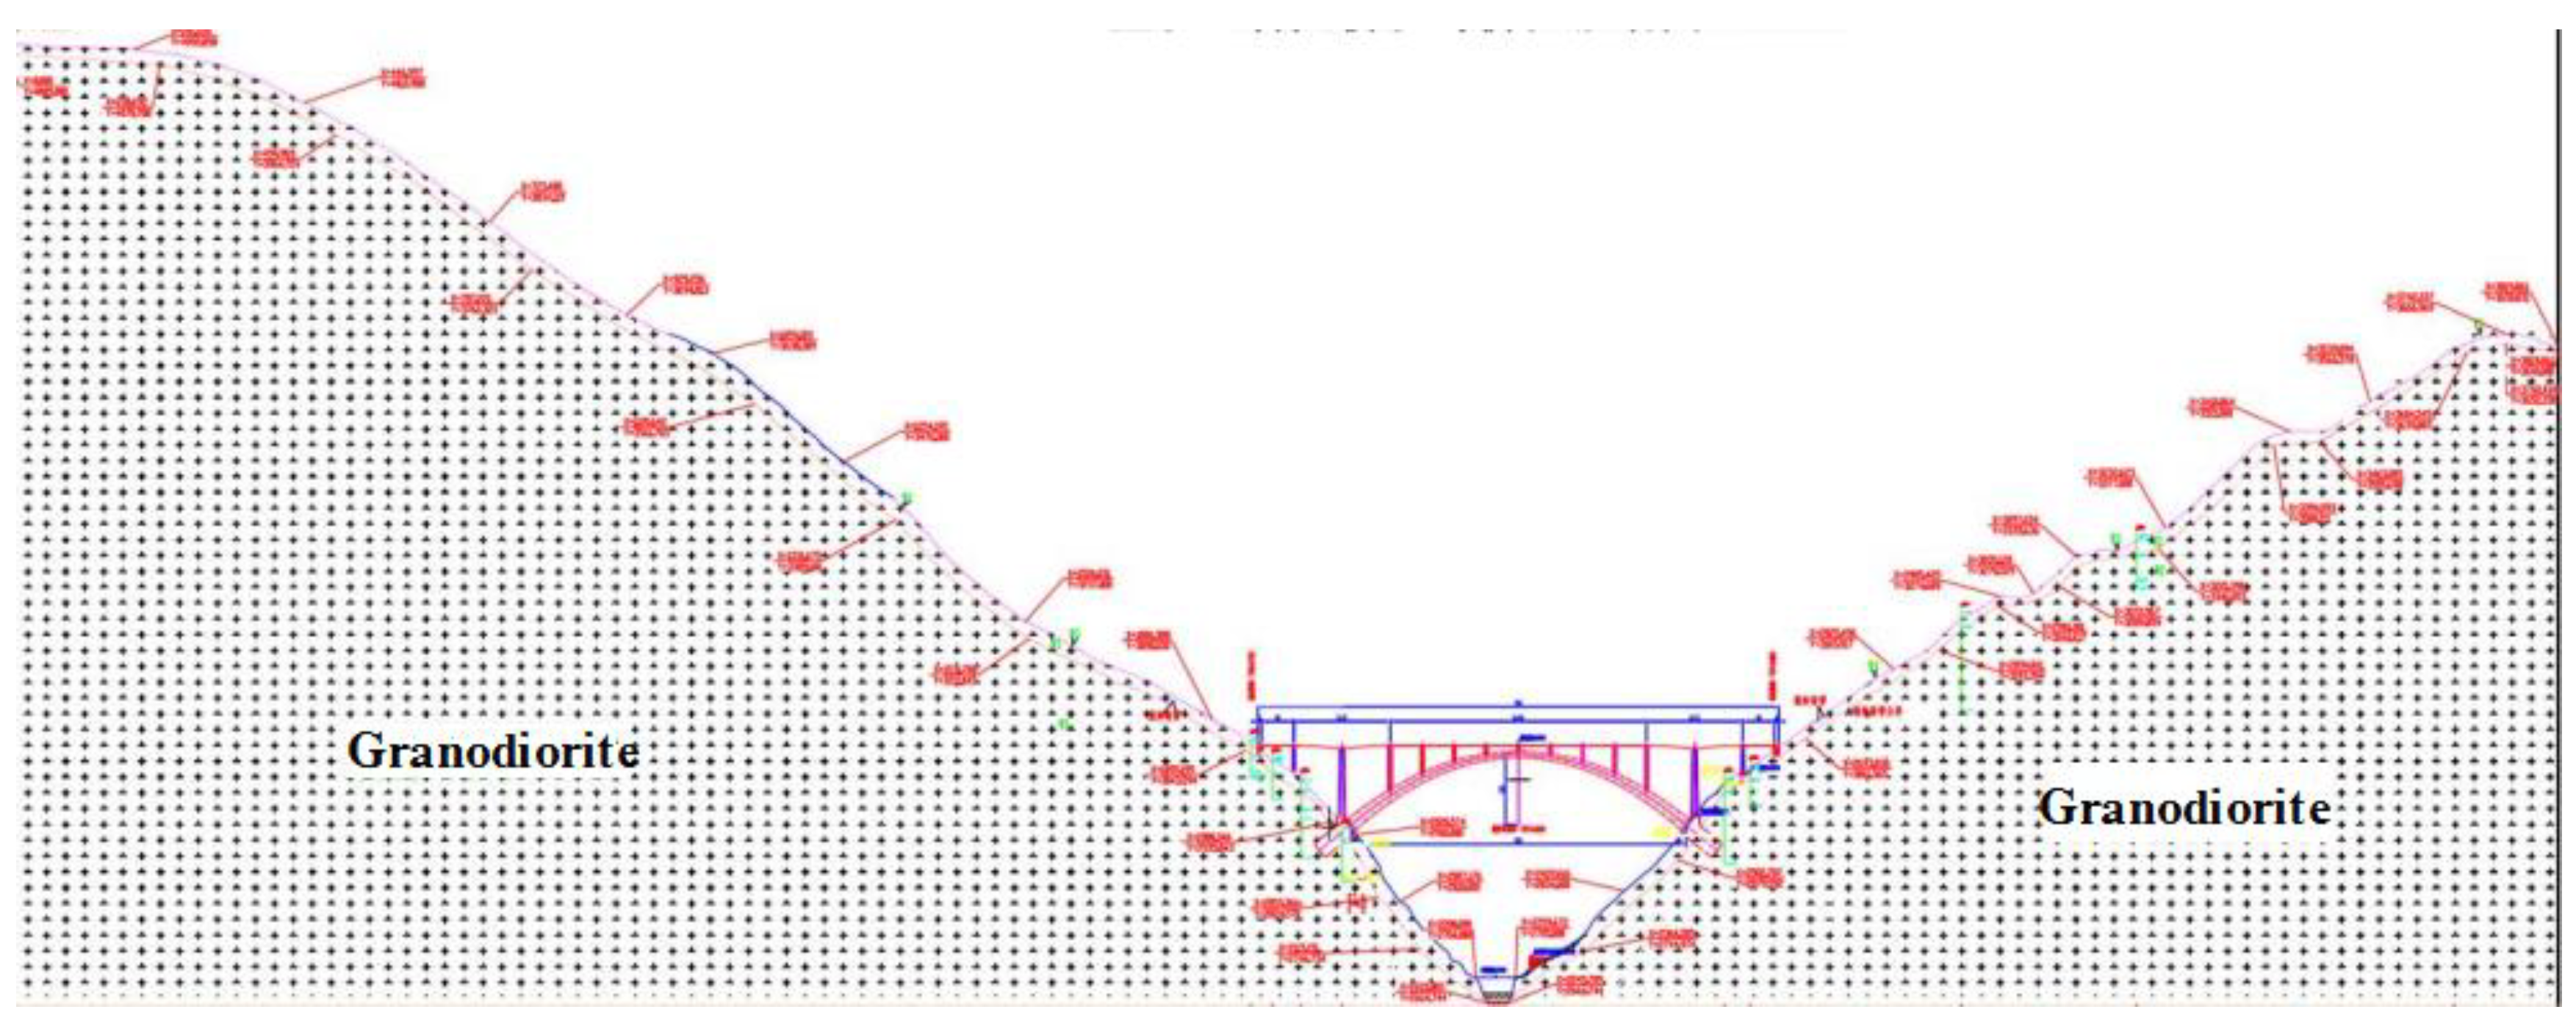
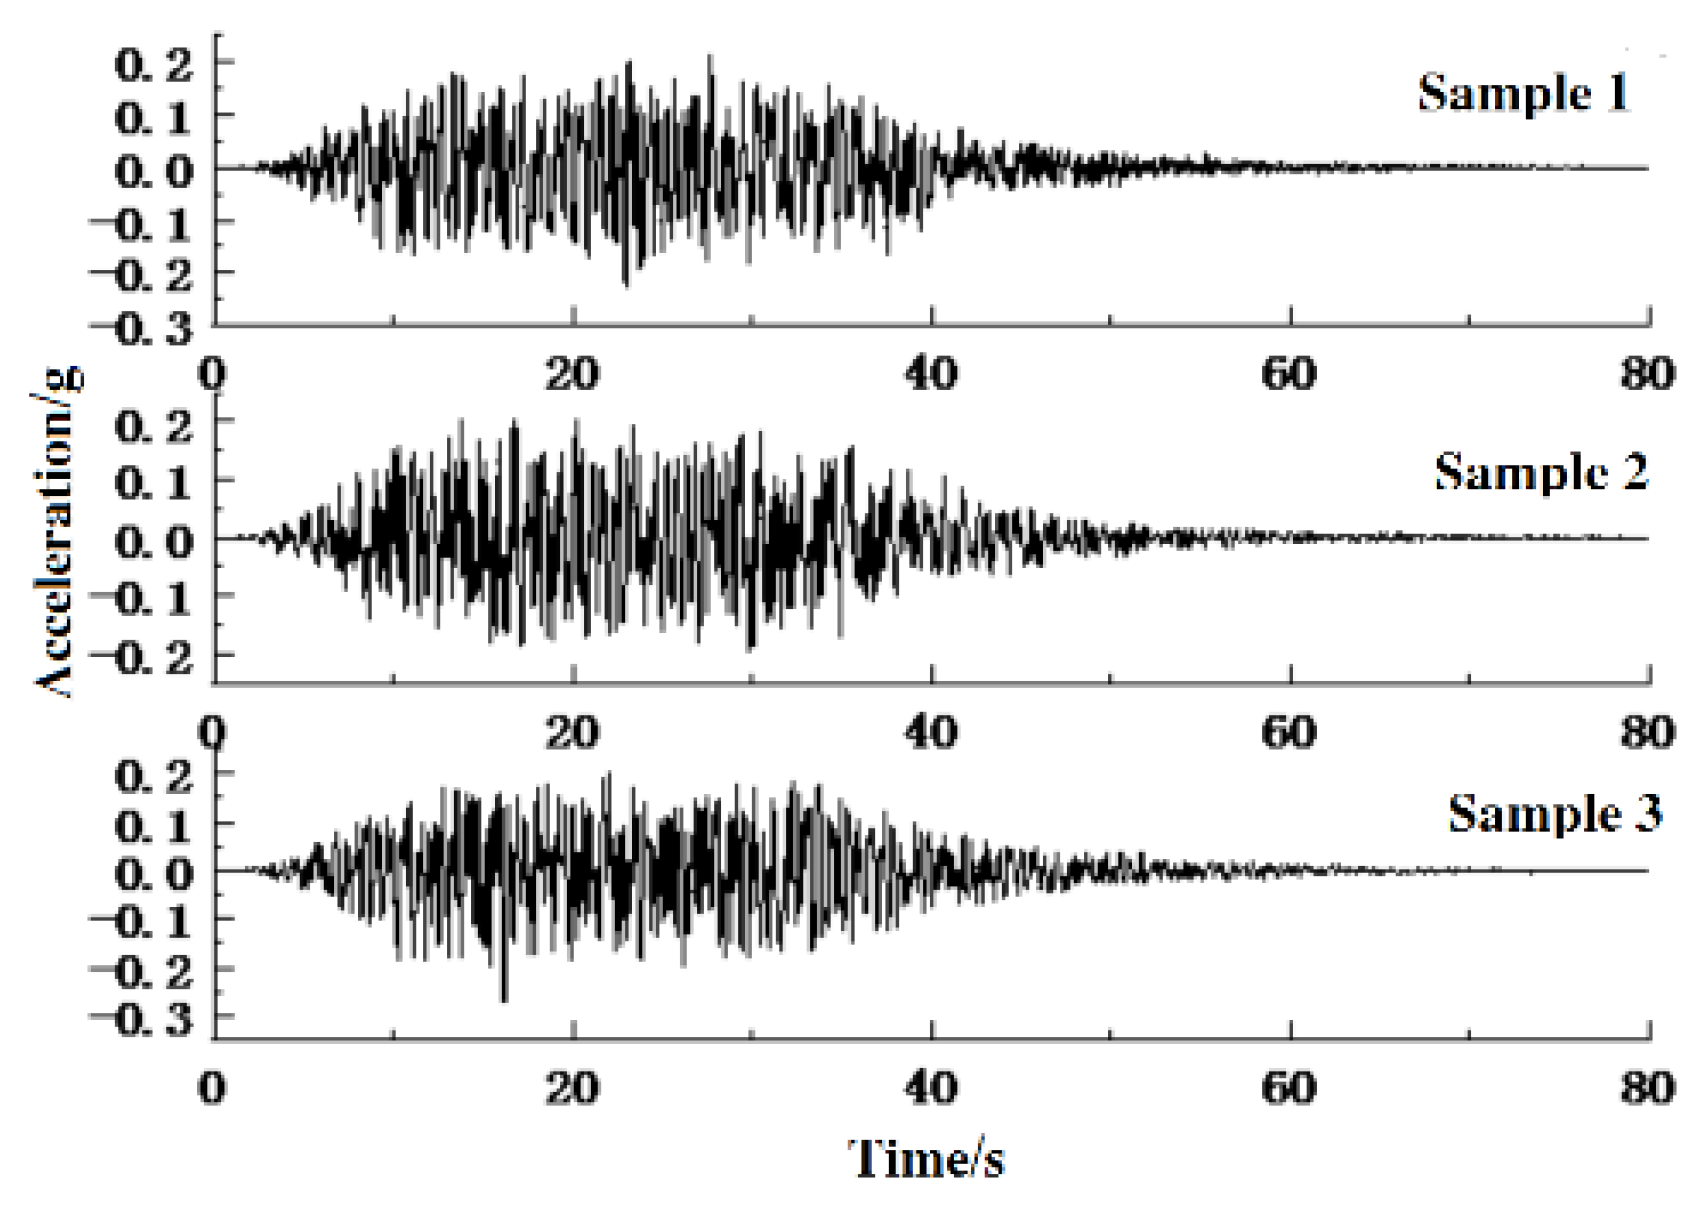
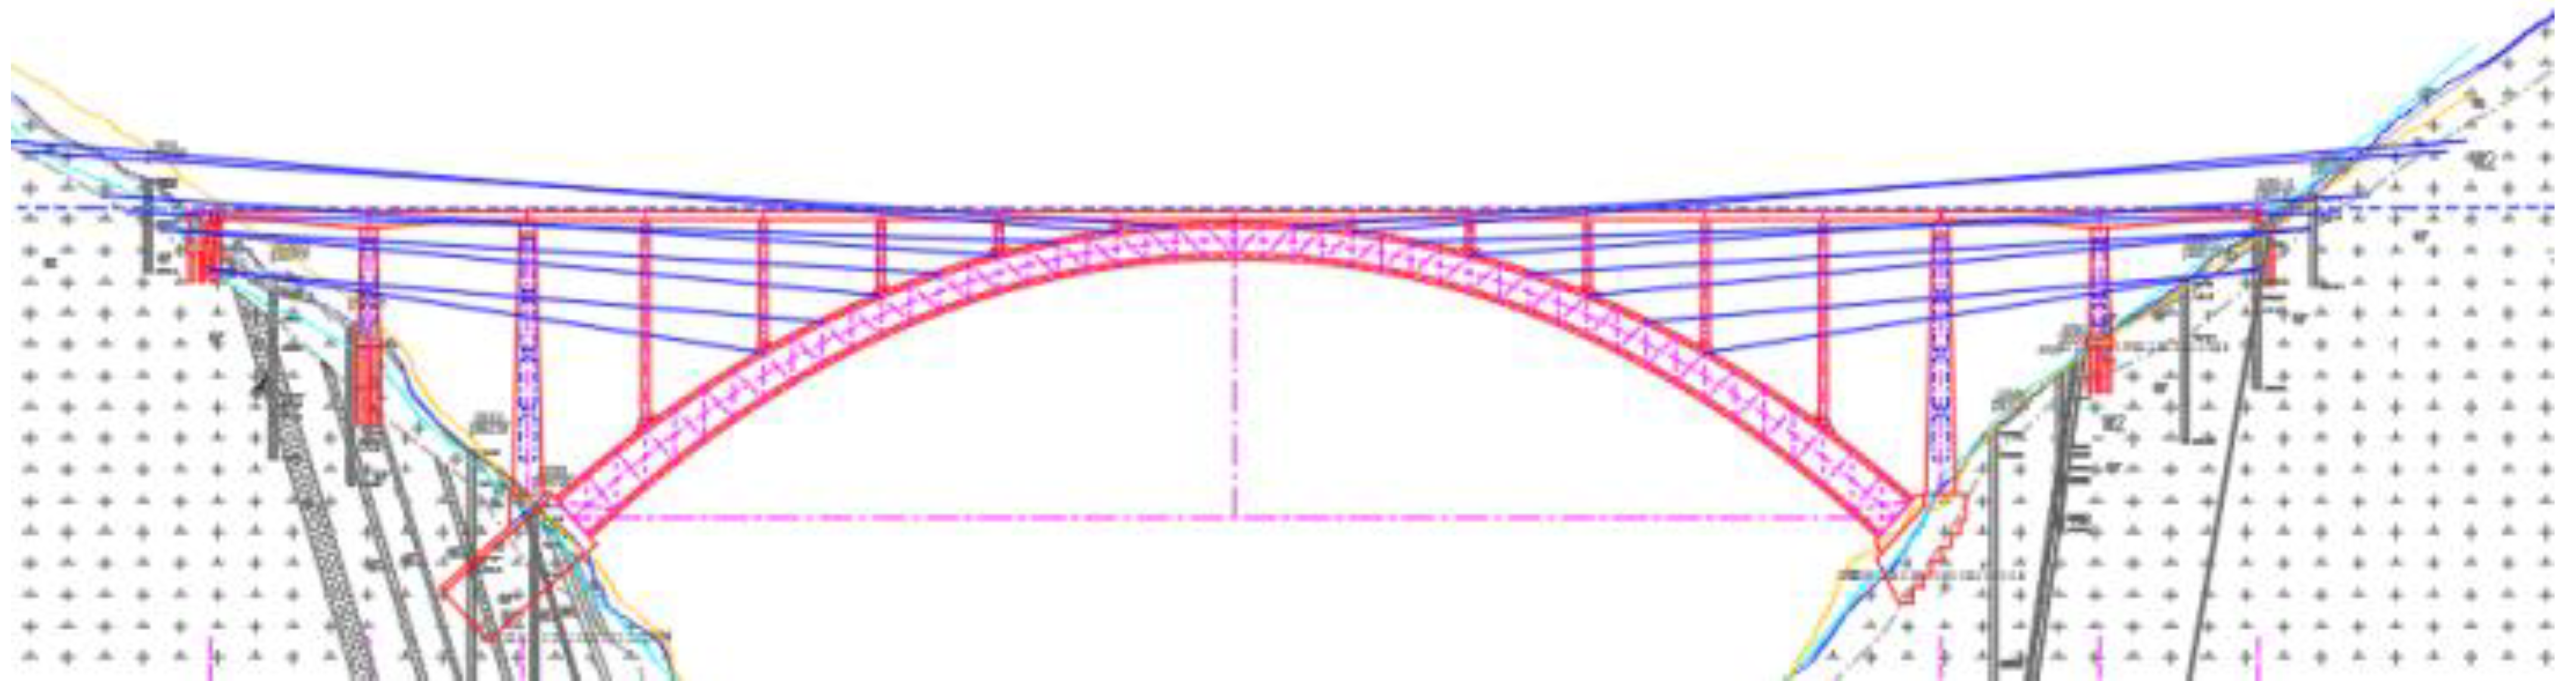
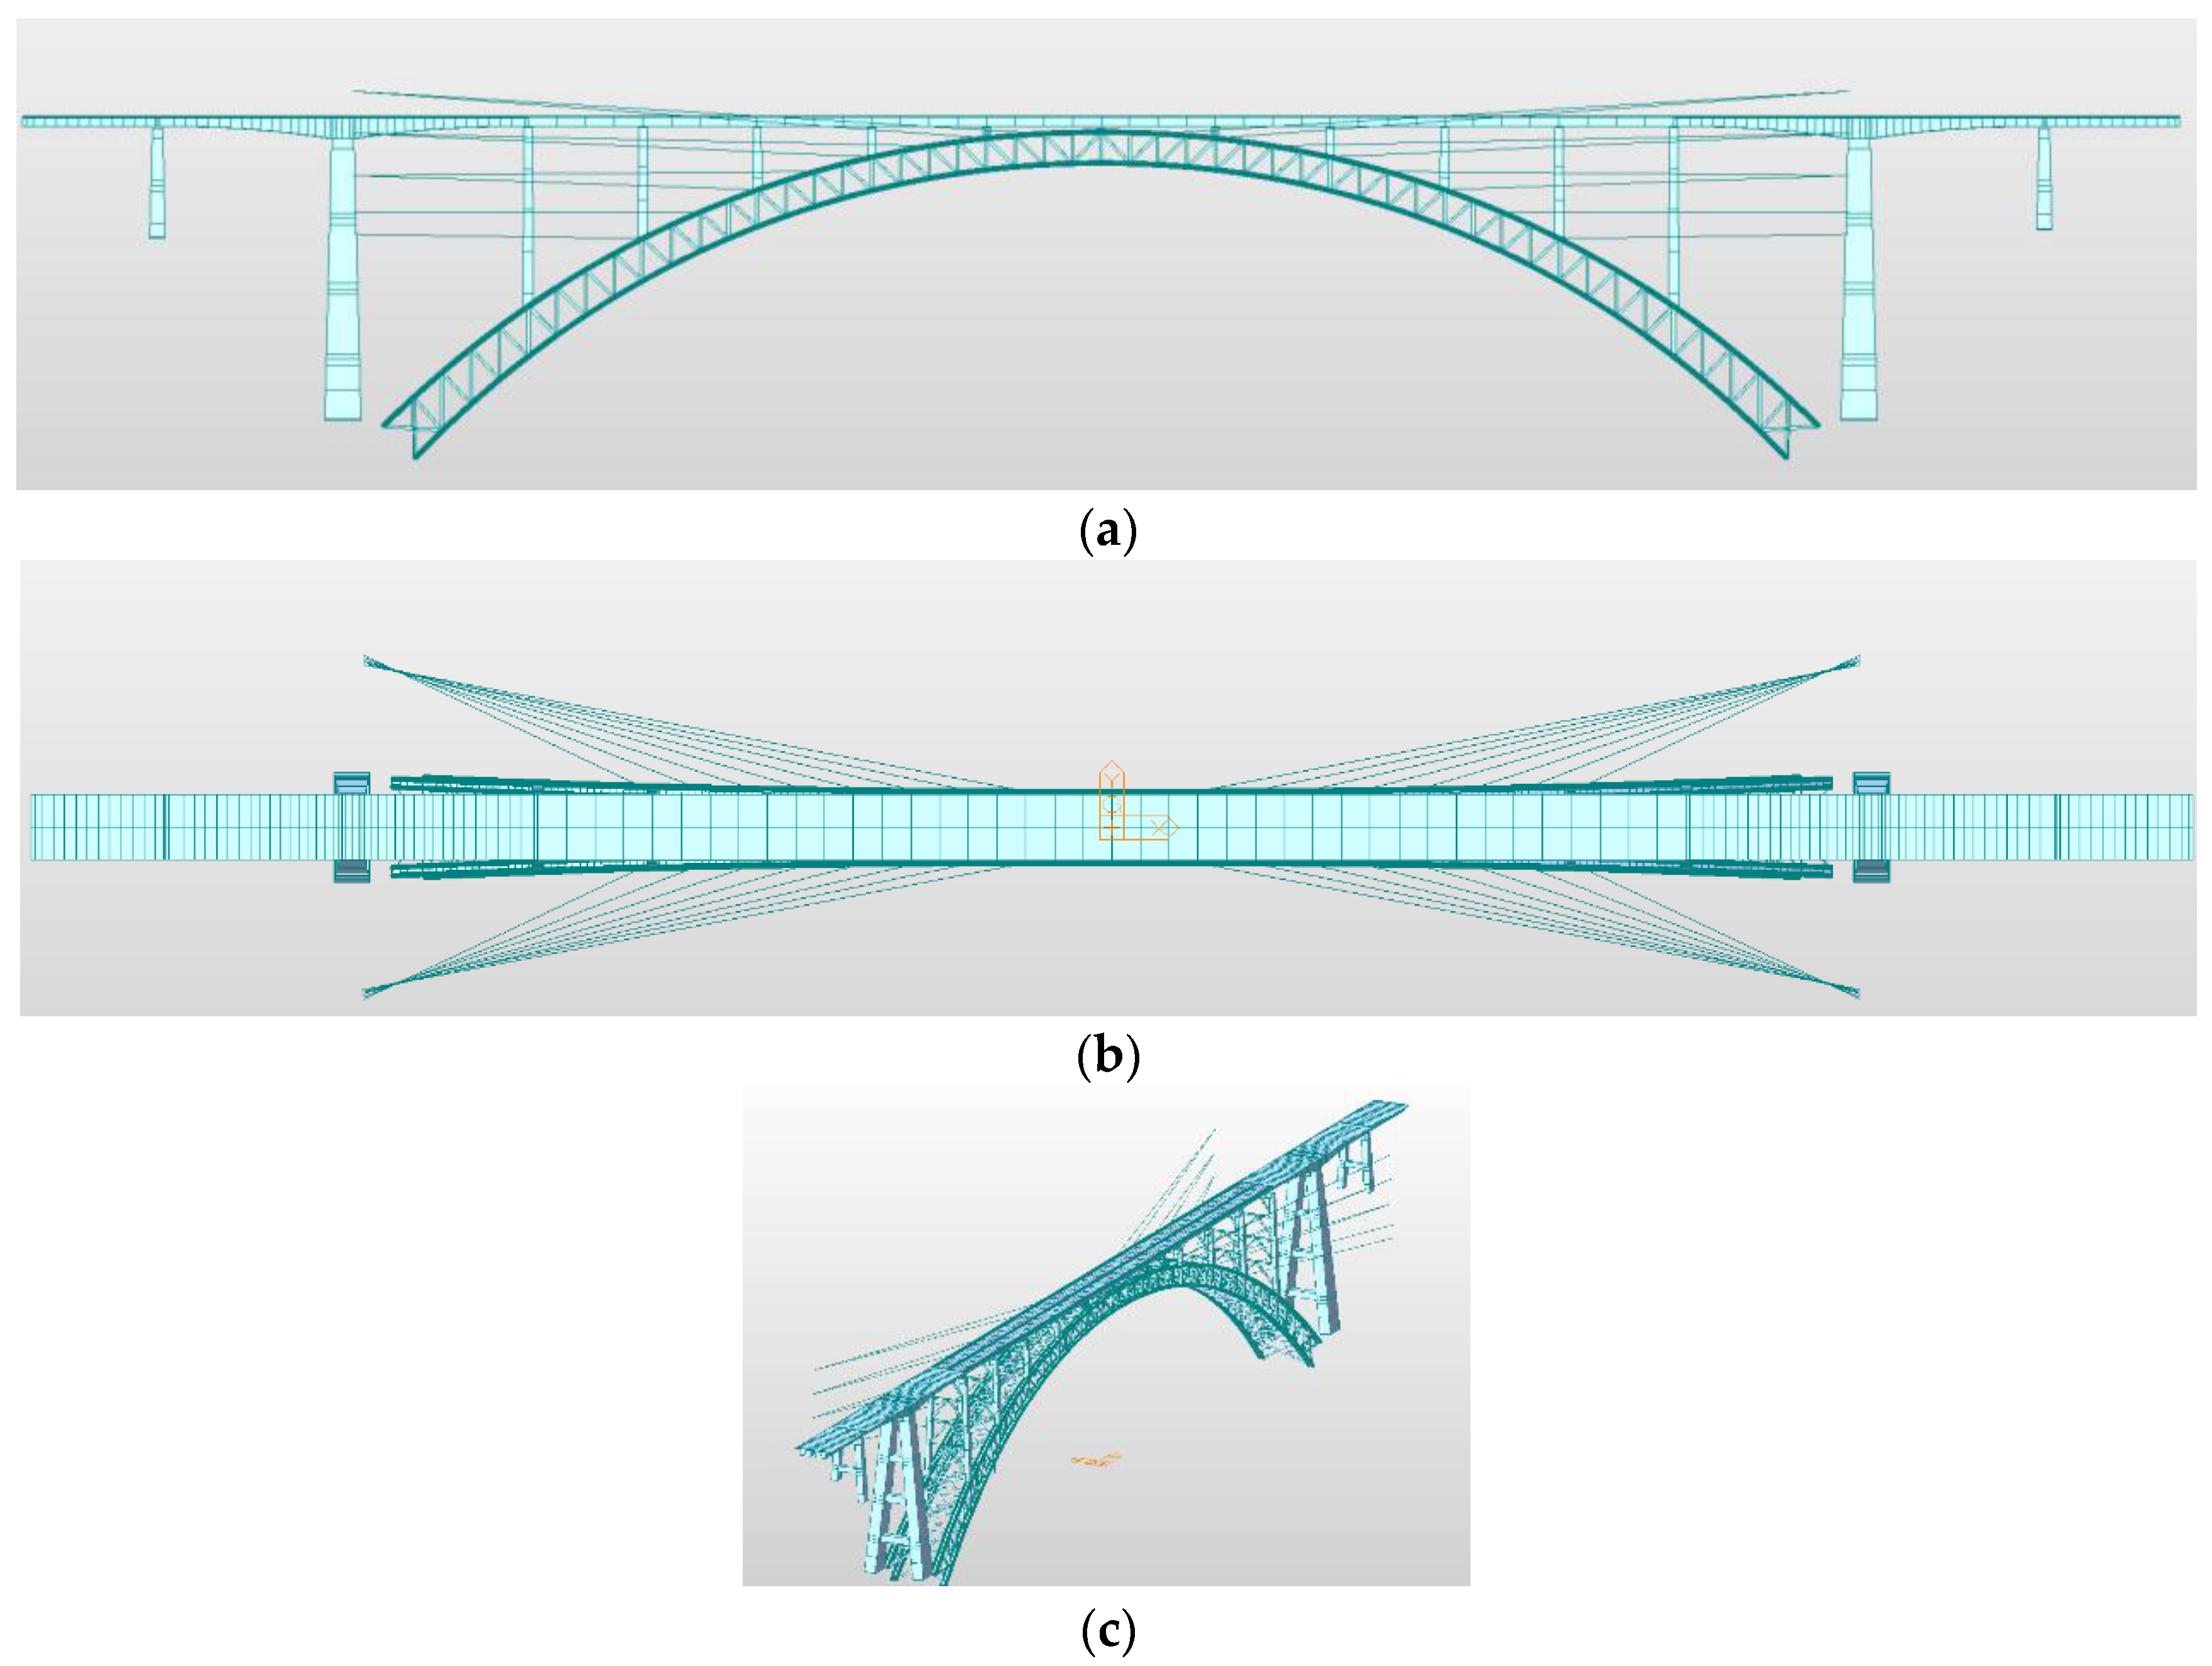
2.1. Project Overview and Modeling Method

The background bridge is a prestressed-concrete continuous rigid-frame bridge with a CFST arch bridge, with a length of 788 m. The construction-drawing model of the arch bridge was taken as the research object to improve its seismic performance. The main bridge is a CFST arch bridge with a span of 500 m, and the rise-span ratio is 1/4.76. The arch axis adopts a catenary, with an arch-axis coefficient of m = 2.0, and the bridge deck is horizontally arranged, with four lines of railway track. The main arch ring adopts a CFST transverse dumbbell-shaped four-limb truss-basket arch, with two arch ribs on the left and right. The main beam of the main bridge adopts 10 × 40.8-m steel-box continuous beams arranged on left and right sections. Spherical steel bearings are used to support the main beam. The left and right approaches are (51 + 66 + 66)-meter prestressed-concrete continuous rigid-frame bridges. The piers are variable-cross-section reinforced-concrete-frame piers, which show an inverted V shape when viewed horizontally.
The dynamic calculation model established by bridge-finite-element software is shown in Figure 1. The CFST arch rib was established by the double-element method. Apart from the spherical steel bearings, which feature elastic connection elements, the other components of the bridge were submitted to a beam-element-simulation analysis. The finite element-calculation mesh contained 2780 beam elements, and the number of nodes was 1442. According to the design data, the bridge site is on bedrock, so the interaction between the foundation and the structure did not need to be considered [44]. In the model, the pier bottom and arch foot of the approach bridge were set as the consolidation-constraint boundary.
The main pier and main beam of the approach bridge adopt consolidation, while the tops of each pier (column) of the whole bridge adopt four bearings. Specifically, the longitudinal movable bearings of model TJQZ-10000 were used at the approach-bridge side of columns 1 # and 10 #, and the fixed bearings of model TJQZ-7000 were used at the main bridge side. The vault adopted the fixed bearings of model TJQZ-12500. The tops of columns 2–10 # used the longitudinal movable bearings of model TJQZ-12500. As the bearings were arranged transversely and symmetrically, the layout plan of the main bridge bearings along the longitudinal direction of the bridge is shown in Figure 2.
The bridge site of the project is a mountain-canyon landform, with high mountains and deep valleys, steep slopes, and a V-shaped river valley. The ground elevation on both banks of the river valley is 2700–4700 m, and the maximum elevation difference exceeds 2000 m. The topographic map of the site is shown in Figure 3. The intention of the project was to use CHIPFM to construct arch ribs.
According to the seismic-safety-assessment report, the seismic fortification intensity of the bridge site is 7 degrees, the basic acceleration is 0.15 g, the site’s characteristic period is 0.65 s, and the site is classified as Class I. Through the seismic analysis, the bridge was still in the elastic stage under Level-I earthquake excitation (E1), the internal force of the section passed the checking calculation, and the transverse seismic performance of the arch bridge was worse than the longitudinal seismic performance. Therefore, this paper focuses on the transverse seismic performance under Level-II earthquake excitation (E2) of the arch bridge. Three artificial seismic waves with a 50-year exceedance probability of 2% provided in the bridge’s site-safety-assessment report were used for the non-linear time-history analysis. The peak accelerations of the three waves were 0.23 g, 0.21 g, and 0.27 g, respectively, after considering the terrain effect. In the non-linear time-history analysis, the transverse + vertical input mode was adopted for the ground motion, without considering the influence of the longitudinal earthquake excitation. The vertical ground-motion input was obtained by reducing the transverse seismic wave, and the reduction coefficient was 0.65. The acceleration-time-history curves of the three artificial seismic waves are shown in Figure 4. To ensure the clarity of the discussion, the envelope values of the calculated results of the three waves are discussed later.

2.2. Analysis of Transverse Seismic Performances of Bearings of the Original Model

For the through-arch basket-handle bridge, the inclination angle of the arch rib did not increase constantly. Geometrically, the inclination angle was limited by the span, the width and height of the bridge deck, the sagitta, and other factors at the crown of the arch, as shown in Figure 5. The relationship between the inclination angle of the arch rib and these parameters was derived as follows.
The bearings, as the key components connecting the substructure and the superstructure, may be the seismic weak points of the deck-arch bridge. The safety of the bearings was evaluated through the capacity–demand ratio (CDR). The CDR method evaluates the seismic safety of bridges by comparing the seismic demands and capacities of each key component in the bridge-structure system [46,47]:
R Q = Q c / ( Q s d max + Q d d )
R Δ = Δ c / ( Δ s d max + Δ d d )
where R Q and R Δ are the CDR of bearings’ shear resistance and deformation, respectively; and Q c , Q s d max , and Q d d are the shear bearing capacity, seismic shear demand, and dead-load shear demand on the bearings, respectively; Δ c , Δ s d max , and Δ d d are the deformation capacity of the bearings, the seismic-deformation demand, and the dead-load deformation-demand, respectively. Formula (1) is applicable to the fixed direction of the spherical steel bearings, and Formula (2) is applicable to the FPBs and the moving direction of the spherical steel bearings. The shear capacity of the fixed direction of the spherical steel bearings is taken as 30% of the designed vertical-bearing capacity.
When the CDR is greater than 1, the system is safe. When the CDR is less than 1, the system is not safe. As the top of each pier (column) of the bridge adopts four bearings, the maximum seismic-shear force in each row of bearings was used for a checking calculation when analyzing the transverse seismic performance of the bearings. The CDRs of the bearings of the main bridge are listed in Table 1.
Table 1 shows that the CDR of the bearings of the vault was 0.99, and the CDRs of the bearings of columns 1# and 10# were 0.79, 0.65, 0.63, and 0.80, respectively, which were less than 1; the CDR of the bearings at the tops of the other columns was greater than 1. This shows that the shear capacity of the arch crown and the 1# and 10# spherical steel bearings was insufficient, and that seismic measurements in the transverse direction needed to be undertaken. It is worth noting that these findings were affected by the high and low columns on one side of the side pier of the approach bridge; there was no symmetry in the curves with respect to the arch crown.

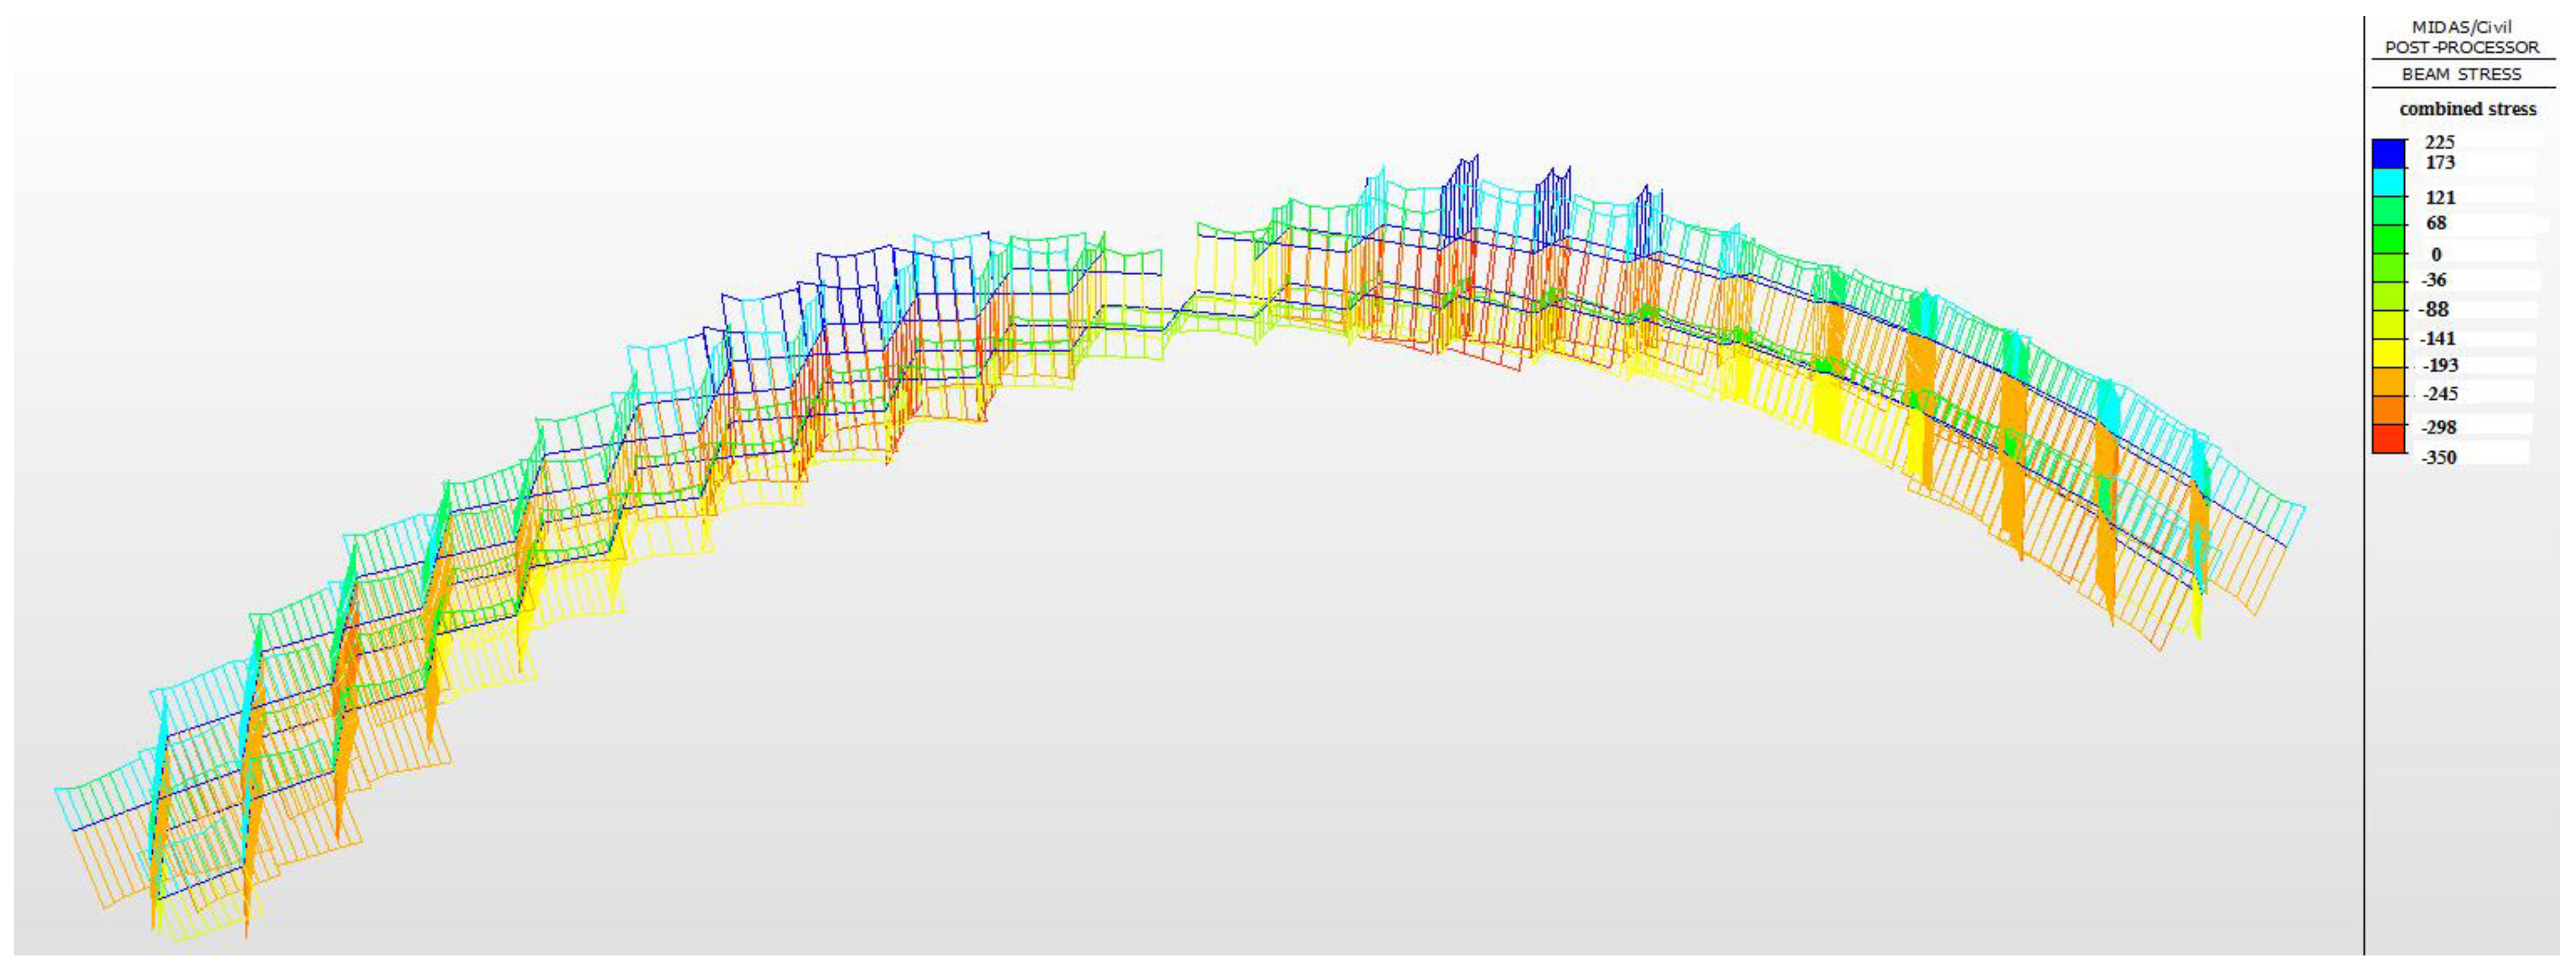
2.3. Stress-Seismic-Response Analysis of the Transverse Connection System of the Main Arch in the Original Model

Due to the high level of rigidity of the transverse connection system of the main arch, stability is easily lost due to the large internal forces imposed during an earthquake. Therefore, the stress seismic response of the transverse connection system of the main arch was assessed.
Through this analysis, it was found that the transverse connection system of the main arch with the highest stress in the original model took the form of horizontal diagonal bracing. As shown in Figure 5, the maximum combined tensile stress on the horizontal diagonal braces was 225 MPa, and the maximum combined compressive stress was 350 MPa. The stress capacity of the members in the elastoplastic state under seismic action was calculated by using the basic allowable stress method and considering the improvement of various factors. According to the basic allowable stress method, the allowable tensile stress of the horizontal diagonal brace was 350 MPa, and the allowable compressive stress was 297 MPa. The compressive stress on the horizontal diagonal brace of the original model was greater than the allowable compressive stress; that is, the horizontal diagonal brace of the main arch entered the elastic–plastic stage, in which it was likely to buckle and lose stability, and transverse-vibration-reduction measures needed to be implemented.

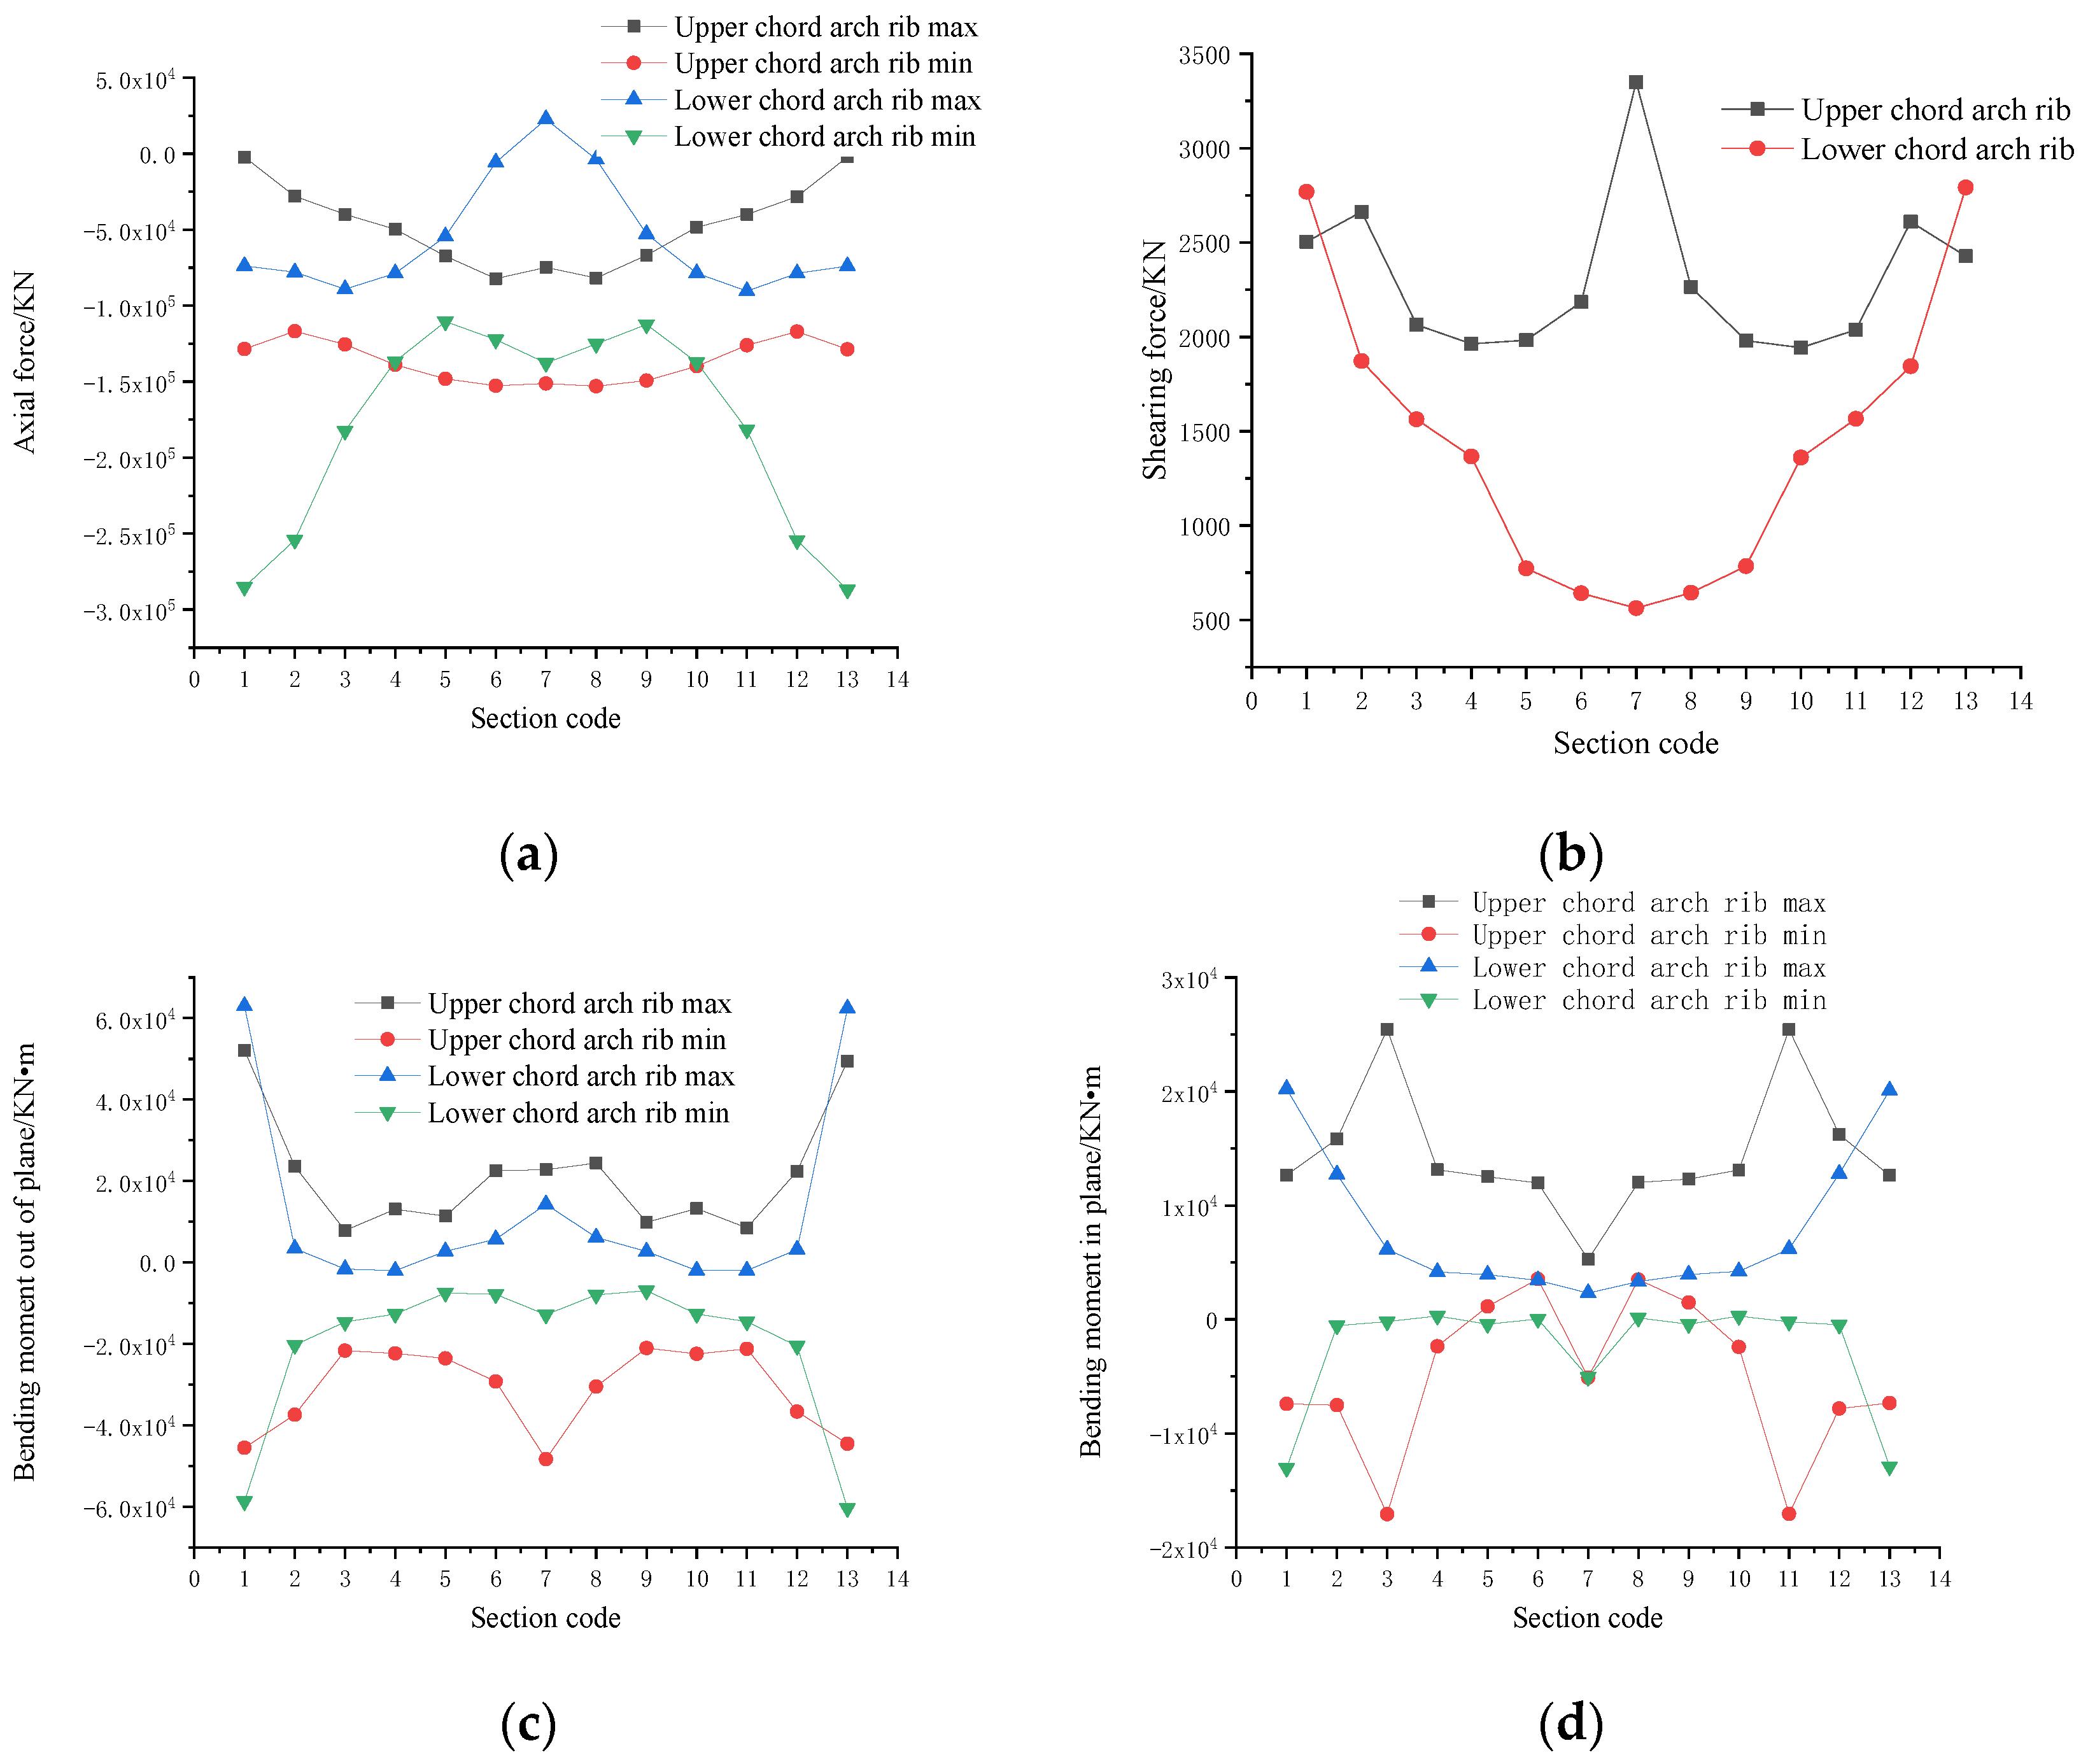
2.4. Seismic Internal Force Response Analysis of Arch Rib Section

The seismic performance of the CFST arch bridge first depends on the seismic performance of the CFST main arch ring, so this paper focuses on the internal force of the arch-rib section. As the left and right arch ribs are symmetrical and their internal forces are similar, to save space, only the internal-force response of the right arch rib section was analyzed. When studying the axial force and the out-of-plane bending moment and in-plane bending moment of the arch-rib section, the maximum and minimum internal forces were considered and expressed in maximum and minimum working conditions, respectively. When analyzing the shear force on an arch rib section, only the most unfavorable situation was considered. The calculated results of internal-force seismic response of the arch rib are shown in Figure 6.
Figure 6a illustrates that the axial-force difference between the arch foot of the upper-chord arch rib and the crown section of the upper-chord arch rib was small, and that the axial-force distribution was relatively uniform; the axial force of the arch-foot section of the lower-chord arch rib was greater than that of the arch-crown section of the lower-chord arch rib. It can be seen from Figure 6b that, except at the arch foot, the shear force on the upper-chord arch-rib section was greater than that on the lower-chord arch-rib section, and the shear force at the arch crown of the upper-chord arch rib was much larger than that at the arch crown of the lower-chord arch rib. Figure 6c,d indicate that the bending moment in the upper-chord arch -rib section was greater than that -n the lower-chord arch-rib section, except at the arch foot.
Transverse seismic conditions mainly affect the out-of-plane bending moment of arch-bridge structures, so we focus on the out-of-plane bending performance here. The axial force affects the flexural capacity of the member, and the out-of-plane bending moment of the section determines the flexural demand of the section. In this paper, a CDR method is used to evaluate the out-of-plane bending performance of the arch-rib section:
R M = M c min / ( M e max + M d max )
In Formula (3), RM is the CDR of the bending resistance of the arch rib, M c min is the bending capacity of the section, and M e max and M d max are the bending-moment demands of the section under the combined working conditions of seismic and dead loads, respectively. The fiber model in XTRACT software was used to calculate the bending capacity of the section. The steel-structure material adopted the strain-hardening model, and the confined concrete used a Mander model.
The CDRs of the out-of-plane bending of key sections of the main arch rib were calculated, and the results are shown in Table 2.
The CDRs of key arch sections under the most unfavorable working conditions are shown in Table 2. The CDRs of the upper-chord arch-rib section were much smaller than those of the lower-chord arch-rib section, and the CDRs of the arch crown and arch foot were smaller than those of the other sections. Therefore, the arch-rib sections of the upper chord, the arch crown of the lower chord, and the arch foot are the weak points in this arch bridge. The CDRs of the upper-chord arch-rib section, the arch crown of the lower chord, and the arch foot of the lower chord should be increased through the implementation of seismic measures.

3. Seismic-Performance-Improvement Schemes

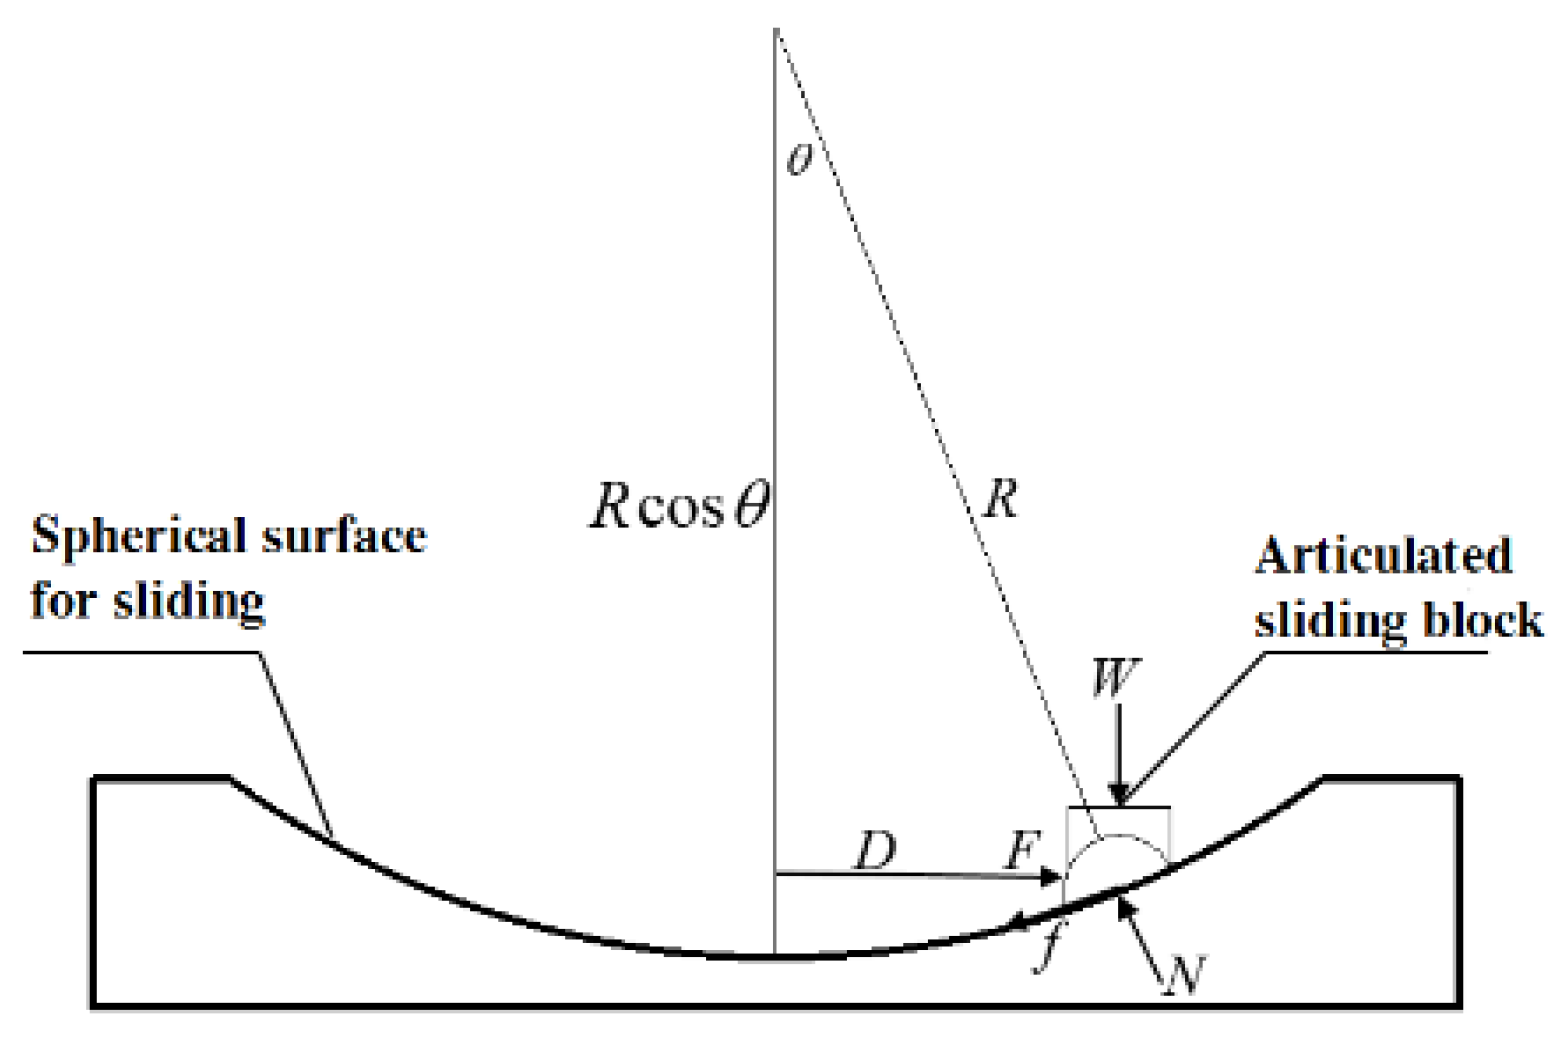
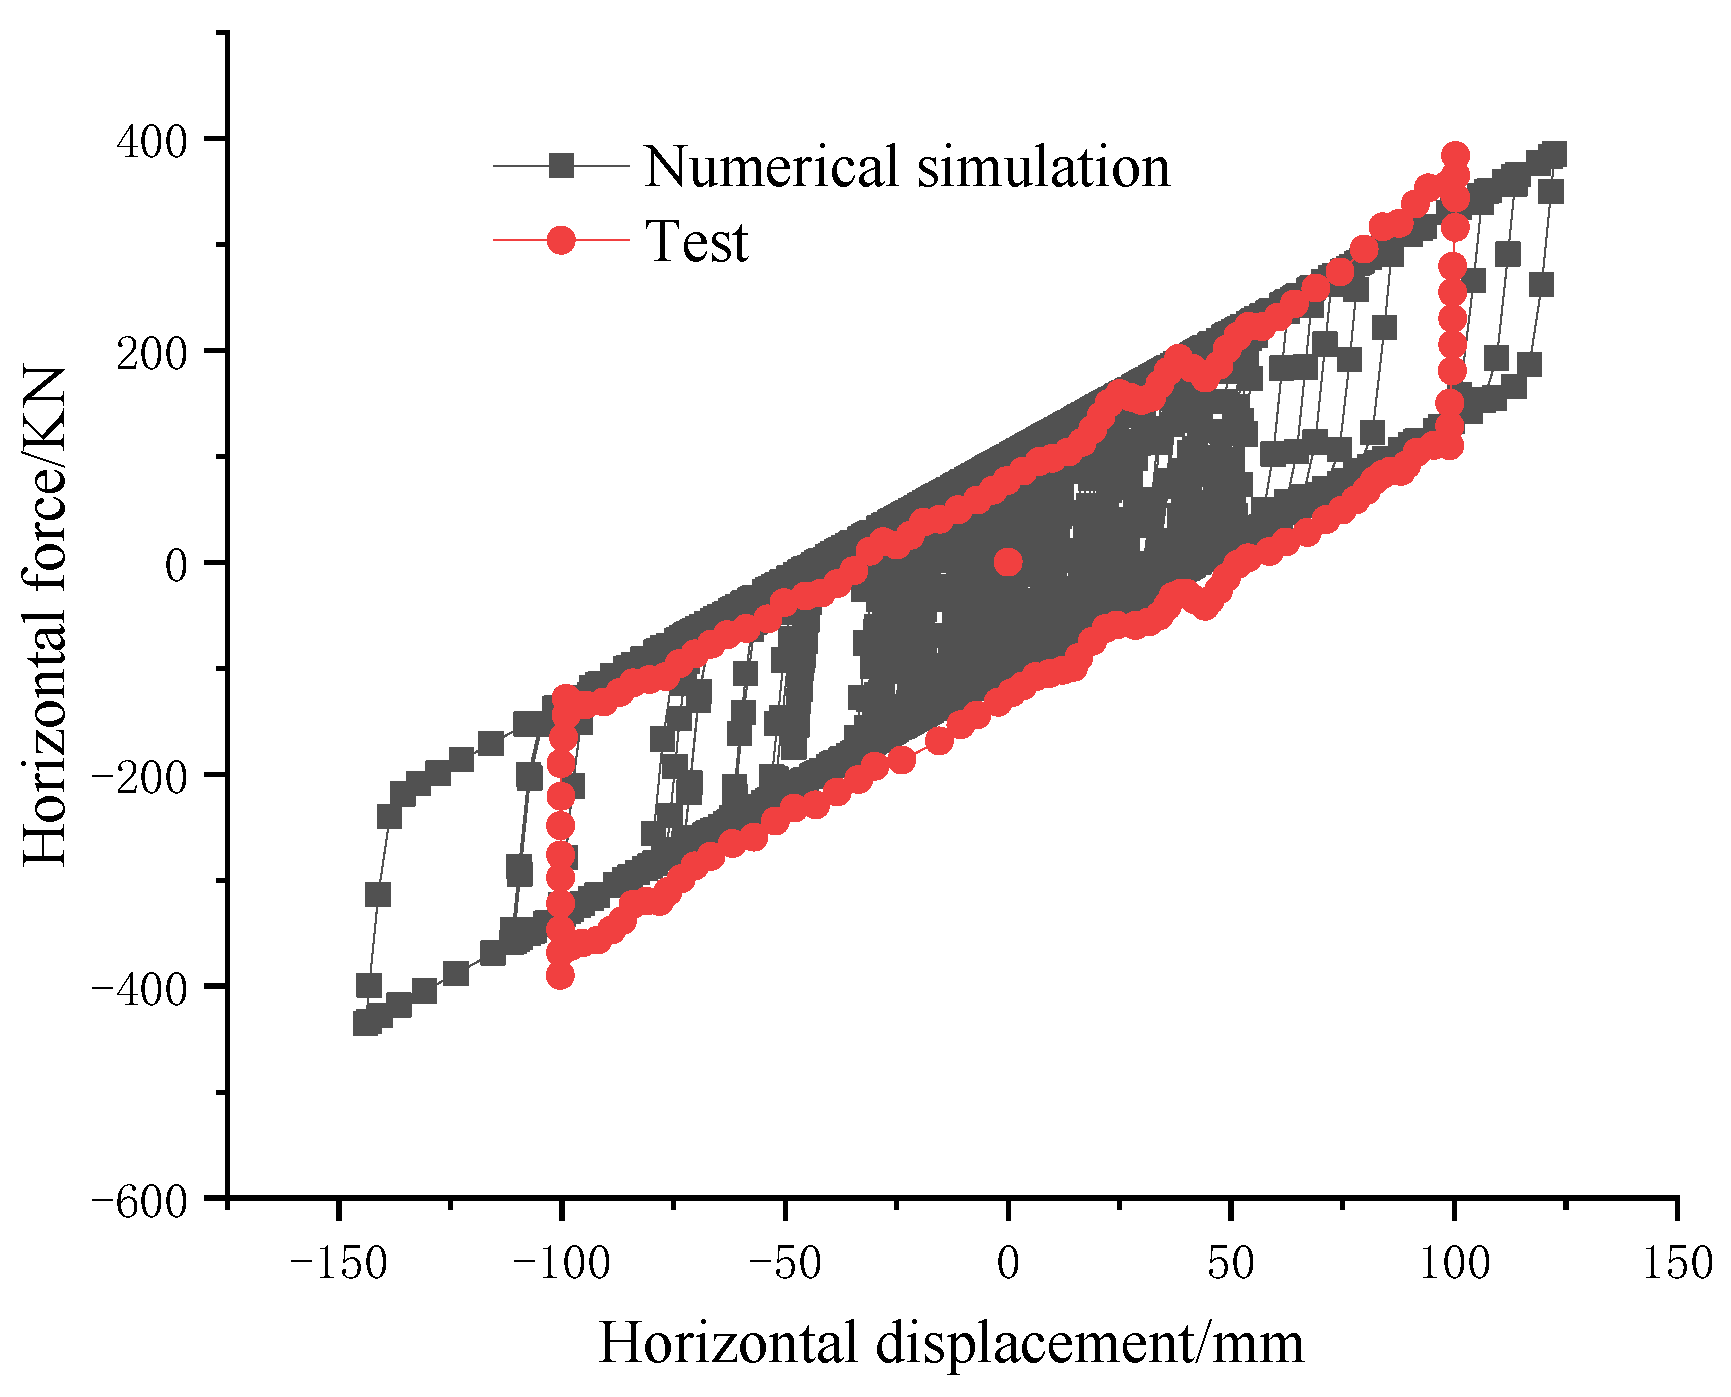
3.1. The FPBs Scheme

The analysis in Section 2.4 indicated that the shear resistance of the spherical steel bearings on the arch crown and the tops of columns 1 # and 10 # was insufficient; that is, the anti-seismic calculation of the bearings failed, and transverse anti-seismic measures needed to be taken. The seismic isolation’s design using FPBs is mainly discussed in this paper.
The FPBs adopt lag-system simulation, and the simplified calculation model for FPBs is shown in Figure 7. The main design parameters of each FPB obtained through repeated optimization calculations and verifications are presented in Table 3.
To verify the reliability of the FPB parameters, a testing company was entrusted to conduct a pseudo-static test on the FPB-7000, and the measured hysteresis curve of the FPB-7000 was obtained. The test results were compared with the finite element simulation results, as shown in Figure 8; the hysteresis curve of the FPBs in the finite element analysis was very close to the experimental results, which verified that the parameters of the FPBs in this paper were set accurately and that the mechanical properties of the FPBs were simulated accurately.
To study the effect of the FPBs on the seismic performance of the long-span deck CFST arch bridge and the influence of its layout on the seismic performance of the bridge, a variety of layout schemes were developed, and the isolation effects were compared to obtain the optimal scheme. Due to space constraints, the results are presented here directly. Considering the excessive displacements of the FPBs under E2 excitation in the full bridge-isolation scheme, the optimal plan involves replacing only the spherical steel bearings with shear failure in the original plan; that is, the spherical steel bearings at the top of the vault and on the side column are replaced by FPBs. The bearing-layout scheme is summarized in Table 4, where TJQZ is a spherical steel bearing. The spherical steel bearings passing the shear-resistance-checking calculation in Table 1 are retained in this scheme. This scheme is called Model 1. It should be noted that because the main beams at the junction of the main approach bridge are not connected, the main beams at the junction of the main approach bridge suffer a high level of relative displacement under earthquake excitation. To prevent the relative displacement between the main beams from leading to dislocation between the tracks, which would affect traffic safety, the structural measures that limit the relative displacement in the transverse direction were adopted between the main beams of the main approach bridge, and the elastic connection was used in the finite element model to simulate the displacement-limiting effect of the structural measures.

3.2. The SBC Scheme

It can be seen from Section 2.2 that the compressive stress of the horizontal diagonal brace of the transverse connection system of the main arch exceeds the allowable compressive stress, which may lead to buckling instability. Therefore, it is necessary to implement seismic lateral measures to improve the seismic performance of this arch bridge in the transverse direction.
In this project, CHIPFM is proposed for the arch-rib construction. After an arch-rib construction is completed, the buckle tower and all SBCs are removed. The SBCs used can only assist in the construction, and the SBCs removed after the completion of the construction cannot assist in the construction of other arch bridges again. The SBCs are discarded, causing a certain level of waste. Therefore, the SBCs removed after the construction were reused in the present work. After the completion of the bridge’s construction, the SBCs are not removed directly, but remain as the “fuses” to support the arch bridge’s seismic resistance. The specific method is as follows: the end of SBC connected with the arch rib (called the A end) does not need to be moved, but the other end of the SBC (called the B end) is anchored in the canyon bedrock, and the arch bridge’s transverse stiffness is increased through the reasonable arrangement of SBCs, so as to improve the arch bridge’s transverse seismic performance. Moreover, SBCs are easy to replace and can be replaced directly in case of damage after an earthquake. The schematic diagram of the SBC scheme is shown in Figure 9.
The seismic-performance-improvement effects of several SBCs layout schemes were compared, and the best scheme was obtained, as illustrated in Figure 10. This scheme is called Model 2. Compared with the construction-layout scheme, the SBCs near the arch foot in Model 2 are removed, leaving only the SBCs of the ¼-arch-to-¾-arch-rib section. The nodes (called the A end) connecting the remaining SBC and the arch rib remain unchanged, but the other end of the SBC (called the B end) needs to be adjusted, as follows. The B ends of the six SBCs at the top of each side are moved 50 m to the lateral outer side, and the B ends of the other SBCs are moved 30–40 m in the vertical downward direction. The B ends of the SBCs move a certain distance in the vertical downward direction to prevent the SBCs from bearing the self-weight of the structure as far as possible, so as not to change the structural system of the original model, while endowing the arch0bridge structure with greater lateral stiffness and better seismic-performance improvements.

3.3. Combination of SBCs and FPBs

The combined scheme of SBCs and FPBs was adopted to improve the seismic performance of the arch bridge. In this scheme, FPBs are only set on column 1# and column 10#. The bearing layout is shown in Table 5, and the reader is referred to Section 3.2 for details of the SBC layout: this scheme is called Model 3.

4. Results and Analysis

4.1. Analysis of Natural Vibration Characteristics

The first three natural periods of all the models are shown in Table 6. Due to the influence of the fixed bearings of columns 2#–9#, the first three natural periods in Model 1 demonstrated little change compared with the original model. Compared with the original model, the first-order natural periods of vibration of Model 2 and Model 3 varied greatly. The first-order natural vibration period of Model 2 decreased by 12.2%, and the first-order natural vibration period of Model 3 decreased by 12%, which was closely related to the increased lateral stiffness when using the SBCs.

4.2. Comparative Analysis of Overall Displacement Response

The overall transverse displacement responses of all the models are shown in Table 7. The maximum overall displacement in all the models occurred on the main beam at the corresponding position of the vault. Compared with the original model, the overall displacement envelope of Model 1 changed little. Compared with the original model, the overall displacement envelope of Model 2 changed greatly, with the maximum displacement decreasing by 28.6% and the minimum displacement decreasing by 36.2%. The SBCs greatly reduced the seismic-displacement response of the arch-bridge structure; this was largely related to the increase in the transverse stiffness of the arch bridge structure by the SBCs. Compared with the original model, the overall displacement envelope in Model 3 changed greatly, with the maximum displacement decreasing by 30.3% and the minimum displacement decreasing by 40.2%. Model 3 had the highest rate of reduction in overall displacement response of all the models.

4.3. Seismic-Performance Check of Bearings

The safety-factor CDR was obtained by using the CDR method to evaluate the safety status of the bearings under the E2 earthquake excitation of transverse bridge direction. The CDRs of the bearings were calculated by using Formula (1) and Formula (2). The safety factor needed be greater than 1 to pass the design check. The CDRs of the bearings at the top of each column are listed in Table 8.
As shown in Table 8, after replacing the spherical steel bearings at column 1# with the FPBs in Model 1, the CDR of the adjacent spherical steel bearings (corresponding to the position of column 2#) decrease. The same rule can be observed at the vault. However, since the shear resistance of the spherical steel bearings at columns 2 # and 5# in the original model has a certain margin, the CDR value is still greater than 1 after it decreases. Similarly, the bearings of columns 3 #–9 # passed the design check. Table 8 demonstrates that after replacing columns 1 # and 10 # with the FPBs in Model 1, the displacement demand of the FPBs under E2 earthquake excitation is less than the design displacement of the FPBs (300 mm), and the CDR value is greater than 1. Therefore, FPBs passed the seismic-calculation check.
As shown in Table 8, the shear CDR of the spherical steel bearings of the arch crown increased from 0.99 to 1.2 when using the SBC in Model 2. That is, after the seismic response of the arch crown in Model 2 reduced, the shear demand of the spherical steel bearing in the arch crown also reduced. However, the shear CDRs of the spherical steel bearings at the corresponding positions of columns 1 # and 10 # remained below 1. The shear-check calculations for the spherical steel bearings at the corresponding positions of columns 1 # and 10 # still failed, and transverse-vibration-reduction measures should be taken.
As shown in Table 8, the CDR of all the bearings in Model 3 is greater than 1. Therefore, it can be concluded that all the bearings in the combination scheme passed the seismic-design checks.

4.4. Comparative Analysis of Stress Response of the Transverse Connection System of the Main Arch

Through analysis, it was found that the transverse connection system of the main arch with the highest stress of all the models was that of the horizontal diagonal bracings, and the stress-response-envelope values of the horizontal diagonal bracings are shown in Table 9.
Compared with the original model, the maximum tensile stress of the horizontal diagonal bracings in Model 1 decreased by 16%, and the maximum compressive stress of the horizontal diagonal bracings in Model 1 reduced by 10%. However, the horizontal diagonal bracings in Model 1 still bear a stress that is greater than the allowable compressive stress, which may lead to buckling instability.
Compared with the original model, the maximum tensile stress on the horizontal diagonal bracings in Model 2 decreased by 25%, and the maximum compressive stress reduced by 17%. The maximum tensile stress and maximum compressive stress of the horizontal diagonal bracings in Model 2 do not exceed the allowable stress, and the check was thus passed. Therefore, the application of SBCs to the CFST arch bridge can reduce the stress response of the transverse connection system of the main arch.
Compared with the original model, the maximum tensile stress on the horizontal diagonal bracings in Model 3 decreased by 38%, and the maximum compressive stress on the horizontal diagonal bracings in Model 3 reduced by 26%. The maximum tensile stress and maximum compressive stress on the horizontal diagonal bracings in Model 3 do not exceed the allowable stress, and the check on the transverse connection system of the main arch was passed. Compared with the other schemes, the combination scheme had the highest seismic-reduction rate and the best seismic-performance-improvement effect.

4.5. Comparative Analysis of Internal-Force Response of Arch Rib

The CDR is an index to visually express the internal-force response of a section. The CDRs of the out-of-plane bending of the arch rib in the models are shown in Figure 11, and the lifting factor of the safety factor of the arch rib in the models is shown in Table 10, where positive values mean the CDRs increase and negative values suggest that the CDRs decrease.
Figure 11 and Table 10 show that after the FPB was set, the CDRs of the corresponding sections (section codes 1, 2, 7, 12, and 13) greatly improved, regardless of the upper or lower chord, but the CDRs of the adjacent sections (section codes 3, 6, 8, and 11) decreased to a certain extent. That is, the CDRs at the corresponding arch-rib location where the FPB was set rose, but this had an adverse effect on the arch-rib section at the adjacent location of the FPB. In particular, after the FPB was set at the vault, the CDRs of the arch0rib sections at adjacent locations decreased by at least 17%.
As shown in Figure 11 and Table 10, the CDRs of the upper-chord arch-rib section improved by at least 5%, and the CDRs of the 77% section increased by more than 10%. The CDRs of most of the sections of the lower-chord arch rib increased. The arch-foot and arch-crown sections of the upper-chord arch rib and the lower-chord arch rib were the seismic weak points of the arch rib. The CDRs of the arch-rib weak points were improved through the reasonable arrangement of the SBCs.
Figure 11 and Table 10 demonstrate that the CDR of the upper-chord arch-rib section was greatly improved. The CDRs of all the sections increased by more than 8%, and the CDRs of 92% of the sections increased by more than 11%. The CDRs of most of the sections of the lower-chord arch rib increased. Compared with Models 1 and 2, the CDRs of arch-rib weak points can be better improved through the reasonable arrangement of SBCs and FPBs.

5. Conclusions

Taking a super-long-span CFST with a total length of 788 m as the research object, a non-linear time-history analysis was conducted under E2 excitation in the cross-bridge direction, plus dead-load conditions, and the seismic-design-check calculation was performed according to the seismic response. As a result, the seismic weak points were revealed and the seismic-performance-improvement scheme was explored with a view to proposing a better seismic-performance0improvement scheme for this long-span CFST arch bridge.
(1)
The seismic-response analysis of the original model shows that the shear resistance of spherical steel bearings is insufficient and that the compressive stress of the horizontal diagonal brace in the transverse connection of the main arch exceeds the allowable compressive stress. The arch-rib section of the upper chord, the arch crown of the lower chord, and the arch foot of the lower chord are the weak points of this arch bridge.
(2)
The seismic-response-analysis results for Model 1 (the FPBs scheme) show that the FPB layout and the setting parameters of the model are reasonable, and the seismic checks for all the bearings were passed. However, the horizontal diagonal brace still failed to pass the seismic-design checks.
(3)
The seismic-response analysis of Model 2 (the SBCs scheme) showed that the horizontal diagonal bracing of Model 2 passed the design checks. The first natural vibration period of Model 2 decreased by 12%, indicating that the SBCs increased the transverse stiffness of the arch bridge. The internal-force response of the upper-chord arch-rib section was greatly reduced, and the internal force of the arch-crown and arch-foot sections of the lower-chord arch-rib section reduced to a certain extent. However, the shear-checking calculations of the spherical steel bearings at the corresponding positions of columns 1 # and 10 # still failed
(4)
The seismic-response analysis of the combined scheme of SBCs and FPBs (Model 3) showed that the horizontal braces and bearings in the transverse connection of the main arch passed the seismic-design checks. The maximum tensile stress of the horizontal brace decreased by 38%, and the maximum compressive stress decreased by 26%. The internal-force responses of most of the sections of the arch rib in Model 3 reduced to varying degrees, and the CDR of the upper-chord arch rib-section greatly improved. The CDRs of all the sections increased by more than 8%, and the CDRs of 92% of the sections increased by more than 11%. Compared with Models 1 and 2, Model 3 had the best seismic-performance-improvement effect.

Author Contributions

D.Y., methodology and finite element analysis; Y.T., drawing and translation; L.G., review and finite element analysis; Z.T., editing and finite element analysis; R.Z., methodology and concepting. All authors have read and agreed to the published version of the manuscript.

Funding

This study was supported by the Key research and development plans of Guangxi Province (grant no. Guike AB22036007), the Talent Program Project of Chongqing (grant no. cstc2022ycjh bgzxm0133), the Natural Science Foundation of Chongqing (grant no. CSTB2022TIAD-KPX0205), The Natural Science Foundation of China (grant no. 52008064); The Science and Technology Research Program of Chongqing Municipal Education Commission of China (grant no. KJQN202000737); The Postdoctoral Research Program of Chongqing (grant no. 2022CQBSHTB3082); The Postgraduate Research and Innovation Project of Chongqing Jiaotong University (grant no. CYB23247).

Data Availability Statement

Data available on request due to restrictions.

Conflicts of Interest

The authors declare no conflict of interest.

References

  1. Lu, Z.; Guo, C.; Li, G. Air void and ring gap effect on CFST arch bridges dynamic performance. J. Constr. Steel Res. 2020, 177, 106418. [Google Scholar] [CrossRef]
  2. Geng, Y.; Ranzi, G.; Wang, Y.-T. Out-of-plane creep buckling analysis on slender concrete-filled steel tubular arches. J. Constr. Steel Res. 2018, 140, 174–190. [Google Scholar] [CrossRef]
  3. Tang, Q.; Xin, J.; Jiang, Y.; Zhou, J.; Li, S.; Fu, L. Fast identification of random loads using the transmissibility of power spectral density and improved adaptive multiplicative regularization. J. Sound Vib. 2022, 534, 117033. [Google Scholar] [CrossRef]
  4. Xin, J.; Zhou, C.; Jiang, Y.; Tang, Q.; Yang, X.; Zhou, J. A signal recovery method for bridge monitoring system using TVFEMD and encoder-decoder aided LSTM. Measurement 2023, 214, 112797. [Google Scholar] [CrossRef]
  5. Zeng, Y.; He, H.; Qu, Y.; Sun, X.; Tan, H.; Zhou, J. Numerical Simulation of Fatigue Cracking of Diaphragm Notch in Orthotropic Steel Deck Model. Materials 2023, 16, 467. [Google Scholar] [CrossRef]
  6. Zeng, Y.; Qiu, Z.; Yang, C.; Haozheng, S.; Xiang, Z.; Zhou, J. Fatigue experimental study on full-scale large sectional model of orthotropic steel deck of urban rail bridge. Adv. Mech. Eng. 2023, 15, 16878132231155271. [Google Scholar] [CrossRef]
  7. Aydin, E.; Öztürk, B.; Kebeli, Y.E.; Gültepe, G. An Experimental Study on the Effects of Different Pendulum Damper Designs on Structural Behavior. In Seismic Isolation, Energy Dissipation and Active Vibration Control of Structures; WCSI 2022. Lecture Notes in Civil Engineering; Springer: Cham, Switzerland, 2023; Volume 309, pp. 240–253. [Google Scholar] [CrossRef]
  8. Ozturk, B.; Cetin, H.; Aydin, E. Optimum vertical location and design of multiple tuned mass dampers under seismic excitations. Structures 2022, 41, 1141–1163. [Google Scholar] [CrossRef]
  9. Makris, N. Seismic isolation: Early history. Earthq. Eng. Struct. Dyn. 2018, 48, 269–283. [Google Scholar] [CrossRef]
  10. Li, L. Isolation and Damping Technology; Beijing Seismological Publishing House: Beijing, China, 1989; pp. 5–32. [Google Scholar]
  11. Kelly, J. Aseismic Base Isolation. Shock. Vib. Dig. 1985, 17, 3–14. [Google Scholar] [CrossRef]
  12. Ali, H.-E.M.; Abdel-Ghaffar, A.M. Modeling of Rubber and Lead Passive-Control Bearings for Seismic Analysis. J. Struct. Eng. 1995, 121, 1134–1144. [Google Scholar] [CrossRef]
  13. Deringöl, A.H.; Güneyisi, E.M. Single and combined use of friction-damped and base-isolated systems in ordinary buildings. J. Constr. Steel Res. 2020, 174, 106308. [Google Scholar] [CrossRef]
  14. Zayas, V.A.; Low, S.S.; Mahin, S.A.; Zayas, S.S.L.V.A. A Simple Pendulum Technique for Achieving Seismic Isolation. Earthq. Spectra 1990, 6, 317–333. [Google Scholar] [CrossRef]
  15. Su, L.; Ahmadi, G.; Tadjbakhsh, I.G. A comparative study of performances of various base isolation systems, part I: Shear beam structures. Earthq. Eng. Struct. Dyn. 1989, 18, 11–32. [Google Scholar] [CrossRef]
  16. Constantinou, M.; Mokha, A.; Reinhorn, A. Teflon Bearings in Base Isolation II: Modeling. J. Struct. Eng. 1990, 116, 455–474. [Google Scholar] [CrossRef]
  17. Dicleli, M.; Mansour, M. Seismic retrofitting of highway bridges in Illinois using friction pendulum seismic isolation bearings and modeling procedures. Eng. Struct. 2003, 25, 1139–1156. [Google Scholar] [CrossRef]
  18. Almazán, J.L.; De la Llera, J.C. Physical model for dynamic analysis of structures with FPS isolators. Earthq. Eng. Struct. Dyn. 2003, 32, 1157–1184. [Google Scholar] [CrossRef]
  19. Eröz, M.; DesRoches, R. Bridge seismic response as a function of the Friction Pendulum System (FPS) modeling assumptions. Eng. Struct. 2008, 30, 3204–3212. [Google Scholar] [CrossRef]
  20. Eröz, M.; DesRoches, R. The influence of design parameters on the response of bridges seismically isolated with the Friction Pendulum System (FPS). Eng. Struct. 2013, 56, 585–599. [Google Scholar] [CrossRef]
  21. Brito, M.B.; Ishibashi, H.; Akiyama, M. Shaking table tests of a reinforced concrete bridge pier with a low-cost sliding pendulum system. Earthq. Eng. Struct. Dyn. 2018, 48, 366–386. [Google Scholar] [CrossRef]
  22. Gao, J.; Lin, X. Analysis of Damping Performance of Frictional Pendulum Bearings in Long Span Cable Stayed Bridge Bearings in Long Span Cable-Stayed Bridge. Bridge Constr. 2020, 50, 55–60. (In Chinese) [Google Scholar]
  23. Li, Z.; Wang, H.; Wang, D. Study of Vibration Mitigation and Isolation for Long-Span Cable-Stayed Bridge with Double Arch Pylons Based on FPBs. World Bridges 2018, 46, 36–40. (In Chinese) [Google Scholar]
  24. Li, J.; Qian, Y.; Yang, H.; Jin, C. Study of Parametric Optimization of Vibration Mitigation and Isolation Scheme for Railway Cable-Stayed Bridge. Bridge Constr. 2019, 49, 45–50. (In Chinese) [Google Scholar]
  25. Mutobe, R.; Cooper, T. Nonlinear analysis of a large bridge with isolation bearings. Comput. Struct. 1999, 72, 279–292. [Google Scholar] [CrossRef]
  26. Ingham, T.J. Analysis of the Million Dollar Bridge for seismic retrofit. Comput. Struct. 2003, 81, 673–679. [Google Scholar] [CrossRef]
  27. Marin-Artieda, C.C.; Whittaker, A.S.; Constantinou, M.C. Experimental Study of the XY-Friction Pendulum Bearing for Bridge Applications. J. Bridg. Eng. 2009, 14, 193–202. [Google Scholar] [CrossRef]
  28. Xiaoli, L.; Zou, Y.; Wang, D. Seismic damage characteristics and research of arch bridges under strong earthquake. World Earthq. Eng. 2018, 34, 33–43. (In Chinese) [Google Scholar]
  29. Bruneau, M. Performance of steel bridges during the 1995 Hyogo-ken Nanbu (Kobe, Japan) earthquake. Can. J. Civ. Eng. 1996, 23, 678–713. (In Canadian) [Google Scholar] [CrossRef]
  30. Usami, T.; Lu, Z.; Ge, H. A seismic upgrading method for steel arch bridges using buckling-restrained braces. Earthq. Eng. Struct. Dyn. 2005, 34, 471–496. [Google Scholar] [CrossRef]
  31. El-Bahey, S.; Bruneau, M. Buckling restrained braces as structural fuses for the seismic retrofit of reinforced concrete bridge bents. Eng. Struct. 2011, 33, 1052–1061. [Google Scholar] [CrossRef]
  32. Bazaez, R.; Dusicka, P. Cyclic behavior of reinforced concrete bridge bent retrofitted with buckling restrained braces. Eng. Struct. 2016, 119, 34–48. [Google Scholar] [CrossRef]
  33. Dong, H.; Du, X.; Han, Q.; Hao, H.; Bi, K.; Wang, X. Performance of an innovative self-centering buckling restrained brace for mitigating seismic responses of bridge structures with double-column piers. Eng. Struct. 2017, 148, 47–62. [Google Scholar] [CrossRef]
  34. Jin, S.; Ai, P.; Zhou, J.; Bai, J. Seismic performance of an assembled self-centering buckling-restrained brace and its application in arch bridge structures. J. Constr. Steel Res. 2022, 199, 107600. [Google Scholar] [CrossRef]
  35. Shi, Y.; Zhong, Z.; Qin, H.; Han, J.; Sun, Z. Toggle buckling-restrained brace systems and a corresponding design method for the seismic retrofit of bridge bents. Eng. Struct. 2020, 221, 110996. [Google Scholar] [CrossRef]
  36. Wang, Y.; Ibarra, L.; Pantelides, C. Effect of incidence angle on the seismic performance of skewed bridges retrofitted with buckling-restrained braces. Eng. Struct. 2020, 211, 110411. [Google Scholar] [CrossRef]
  37. Zheng, J.; Wang, J. Concrete-Filled Steel Tube Arch Bridges in China. Engineering 2017, 4, 143–155. [Google Scholar] [CrossRef]
  38. Bai, J.; He, J.; Li, C.; Jin, S.; Yang, H. Experimental investigation on the seismic performance of a novel damage-control replaceable RC beam-to-column joint. Eng. Struct. 2022, 267, 114692. [Google Scholar] [CrossRef]
  39. Chen, B.-C.; Wang, T.-L. Overview of Concrete Filled Steel Tube Arch Bridges in China. Pract. Period. Struct. Des. Constr. 2009, 14, 70–80. [Google Scholar] [CrossRef]
  40. Han, L.-H.; Li, W.; Bjorhovde, R. Developments and advanced applications of concrete-filled steel tubular (CFST) structures: Members. J. Constr. Steel Res. 2014, 100, 211–228. [Google Scholar] [CrossRef]
  41. Gao, X.; Liu, L.J.; Yao, S.K.; Yang, J.W.; Li, Y. Commonly Encountered Damages in Cable Members of CFST Arch Bridge and Detection Methods. Key Eng. Mater. 2012, 619, 71–80. [Google Scholar] [CrossRef]
  42. Hong, X.; Renzhong, T.; Yaodong, C. Calculation of SBC forces for concrete-filled steel tubular arch bridge with long span in process of lifting. J. Zhejiang Univ. Eng. Sci. 2004, 38, 5. (In Chinese) [Google Scholar]
  43. Qian, Z.H.; Jian-ting, Z.H.; Hu, M.A.; Xiao-gang, L.I.; Lan, Z.H. Improved algorithm of cable force for one time cable tensioning on steel tube arch ribs with segmental hoisting. J. Traffic Transp. Eng. 2020, 20, 92–101. [Google Scholar] [CrossRef]
  44. Zhou, Q.; Zhou, J.; Chen, J.; Feng, Y. Improved algorithm of cable force optimization of one-time tensioning for arch bridge. J. Fuzhou Univ. Nat. Sci. Ed. 2019, 47, 412–416. [Google Scholar]
  45. Wang, H.; Yang, Y.D.; Li, A.Q.; Qiao, J.D.; Chen, Z.Q. Influences of soil-pile-structure interaction on seismic response of long span CFST arch bridge. J. Southeast Univ. Nat. Sci. Ed. 2005, 3, 433–437. (In Chinese) [Google Scholar]
  46. Priestley, M.J.N.; Seible, F.; Calvi, G.M. Seismic Design and Retrofit of Bridges; John Wiley & Sons, Inc.: New York, NY, USA, 1996. [Google Scholar]
  47. Susantha, K.; Ge, H.; Usami, T. Uniaxial stress–strain relationship of concrete confined by various shaped steel tubes. Eng. Struct. 2001, 23, 1331–1347. [Google Scholar] [CrossRef]
Figure 1. Finite element calculation model.
Buildings 13 01811 g001
Figure 2. Layout plan of main bridge bearings (unit: m).
Buildings 13 01811 g002
Figure 3. Topographic map of project site.
Buildings 13 01811 g003
Figure 4. Time-history curve of seismic-wave acceleration.
Buildings 13 01811 g004
Figure 5. Axial-stress-envelope diagram of horizontal diagonal bracing between arch ribs of the original model.
Buildings 13 01811 g005
Figure 6. Internal-force envelope of an arch-rib section of the original model. (a) Axial-force demand. (b) Shear demand. (c) Out-of-plane bending-moment demand. (d) In-plane bending -moment demand.
Buildings 13 01811 g006
Figure 7. Simplified calculation model for FPB.
Buildings 13 01811 g007
Figure 8. Hysteretic curve of FPBs.
Buildings 13 01811 g008
Figure 9. Schematic diagram of SBC scheme.
Buildings 13 01811 g009
Figure 10. Layout of SBC. (a) Front view. (b) Top view. (c) Stereogram.
Buildings 13 01811 g010
Figure 11. CDR comparison of out-of-plane bending of arch-rib sections of models. (a) Upper chord-arch-rib section. (b) Lower-chord arch-rib section.
Buildings 13 01811 g011
Table 1. CDRs of main bridge bearings.
Location of Bearings1#AB1#MB2#3#4#5#top6#7#8#9#10#MB10#AB
Shear bearing capacity/kN3000210037503750375037503750375037503750375021003000
Shear demand/kN3792324427653069328014153717135932633169276833213745
CDR0.790.651.361.221.142.650.992.761.151.181.350.630.8
Table 2. CDR of out-of-plane bending of arch-rib section of the original model.
Section Code12345678910111213
Upper chord7.59.718.715.415.413.28.012.717.215.319.09.87.9
Lower chord10.428.526.929.443.840.013.736.747.129.427.128.28.6
Table 3. Design parameters of FPBs.
PositionModel and SpecificationVertical Load (kN)Yield Displacement (mm)Design Displacement (mm)Slideway Radius (m)Static Friction CoefficientDynamic Friction CoefficientShear Equivalent Stiffness (kN/m)Initial Stiffness (kN/m)
1#AB/10#ABFPB-1000010,000230050.040.033000150,000
1#MB/10#MBFPB-70007000230050.040.032100105,000
TopFPB-1250012,500230050.040.033750187,500
Table 4. Layout scheme of the bearings in Model 1.
Location of Bearings1#AB1#MB2#3#4#5#Top6~10#
Type of bearingsFPB-10000FPB-7000TJQZ-12500TJQZ-12500TJQZ-12500TJQZ-12500FPB-12500Symmetrical arrangement
Table 5. Layout of the bearings in Model 3.
Location of Bearings1#AB/10#AB1#MB/10#MB2#3#4#5#top6~10#
Type of bearingFPB-10000FPB-7000TJQZ-12500TJQZ-12500TJQZ-12500TJQZ-12500TJQZ-12500Symmetrical arrangement
Table 6. Comparison of the first three natural periods of models.
Natural Vibration Period/sFirst-OrderSecond-OrderThird-Order
Original model3.913 2.424 2.296
Model 13.935 2.479 2.424
Model 23.437 2.304 2.290
Model 33.444 2.304 2.290
Reduction RateFirst-OrderSecond-OrderThird-Order
Model 1−0.6%−2.3%−5.6%
Model 212.2%5.0%0.3%
Model 312.0%5.0%0.3%
Table 7. Comparison of overall displacement responses of Models.
Displacement Responses/mmOriginal ModelModel 1Model 2Model 3
Maximum535534382373
Minimum−577−577−368−345
Reduction RateOriginal ModelModel 1Model 2Model 3
Maximum0.0%0.2%28.6%30.3%
Minimum0.0%0.0%36.2%40.2%
Table 8. CDRs of bearings of all models.
Location of Bearings1#
AB
1#
MB
2#3#4#5#top6#7#8#9#10#MB10#
AB
Original Model0.790.651.361.221.142.650.992.761.151.181.350.630.8
Model 11.161.161.031.421.161.24.111.211.141.381.021.441.44
Model 20.870.641.441.191.132.861.22.761.131.161.440.620.8
Model 31.161.161.141.381.212.751.342.831.201.351.181.761.79
Table 9. The stress response envelope values of the horizontal diagonal bracings.
IndexAllowable
Stress
Original ModelModel 1Model 2Model 3
Maximum tensile stress330225189170141
Maximum compressive stress297350316290261
Table 10. CDR-lifting factors for the out-of-plane bending moment.
Section Code12345678910111213
Upper
chord
model 122%6%−3%12%5%−17%39%−18%2%13%−2%9%21%
model 212%20%13%5%22%20%14%14%22%5%10%22%9%
model 332%42%11%16%28%37%26%31%29%16%8%50%30%
Lower
chord
model 18%1%−4%−3%3%−21%63%−21%−1%−3%−4%5%26%
model 215%5%−6%−9%9%7%7%7%8%−9%−7%5%39%
model 318%7%−10%−10%11%17%20%17%9%−8%−11%10%41%
Disclaimer/Publisher’s Note: The statements, opinions and data contained in all publications are solely those of the individual author(s) and contributor(s) and not of MDPI and/or the editor(s). MDPI and/or the editor(s) disclaim responsibility for any injury to people or property resulting from any ideas, methods, instructions or products referred to in the content.

