Abstract
The use of glass waste in the construction industry has a high potential of leading to a higher recycling percentage. Foam glass aggregate (FGA) is around 98% recycled glass waste of various origins and has good insulation properties with big grain size distributions ranging between 10 mm and 60 mm. FGA has a wide range of applicability in the construction industry, which significantly differs from each implementation in the case of built-in conditions of the material. Therefore, investigating the impact of different compaction ratios, temperature, and relative humidity conditions on the thermal performance of such material is very important. In the present work, the samples of foam glass aggregates have been prepared with four different compaction ratios (10%, 20%, 30%, and 40%) to measure their impact on the material’s mechanical and thermal insulation properties. The obtained results revealed that the dry density property of the material linearly increased with elevated compaction ratios. In contrast, the submergence density did not follow the same trend behaviour under the same circumstances. The vertical strain of the foam glass aggregates decreased with increased compaction ratios, and a significant correlation behaviour was observed between the vertical strain and increased compaction ratios at high compressional loads. The material’s thermal conductivity increased with increasing compaction ratios in both 50% relative humidity and 95% relative humidity, while for the submergence condition, a significant decrease in their values was observed after compacting the material by 40%. The thermal conductivity is tested at 10 °C and 30 °C using the TLS and GHP methods. The thermal resistance of foam glass aggregate layers was calculated based on the measured results, showing an approximately linear decreasing trend with increasing compaction ratios. While the submerged foam glass aggregate samples demonstrated stable thermal resistance values at 30% compaction, by raising the compaction ratio to 40%, the material’s thermal resistance increased once again. The experimental results also found the temperature conversion coefficients, which can be used to convert the compacted FGA materials’ thermal conductivity to the temperature experienced in a different built-in state than the laboratory measurements. Our study demonstrates the broad usability of foam glass aggregate as a compacted thermal insulating layer in the building industry.
1. Introduction
Due to the apparent challenges in executing many civil engineering applications and new environmental restrictions, diversifying ways of achieving energy efficiency through proper thermal insulation materials has become a worldwide issue. Therefore, the need to produce manufacturing materials as an alternative to natural materials increased dramatically in developed countries, especially with the availability of high amounts of municipal wastes such as metal, paper, glass, etc. Glass is a broadly utilised material in a variety of purposes resulting in a considerable amount of glass waste generated and obsoleted on a daily basis [1]. According to statistical data, in 2018, the European Union generated almost 17 million tons of glass packaging and collected about 13 million tons to recycle. While the average recycling rate was 76%, in Hungary, it had reached 35% [2]. Reusing recycled glass waste leads to significant ecological rewards, utilising fewer raw materials and reducing energy consumption and CO2 emissions [3]. According to the study of Mallum et al. [4], incorporating waste glass into construction materials can decrease production expenses while alleviating the strain on landfill sites.
Foam glass comprises about 98% recycled glass waste of various origins and 2% foaming agent [5]. It consists of two main parts: gas, which fills the material’s pores, and glass, which represents the solid part of the material [6]. Sintering glass powders foamed by producing gases from the breakdown or oxidation process of foaming agents is one of the most prevalent processes for manufacturing glass foams [7]. The release of gas in the thermally softened bulk of the material is the fundamental basis for making glass foam. The gas stays blocked in the form of bubbles due to its appropriate viscosity, and as it cools, it produces spores, which form the porous structure of the glass foam [8]. The porosity of foam glass materials reaches around 59.4% [9], 60% [10], 77% [11], 88% [12], 89.1% [13], 89.5% [9], and 96% [14] of the total volume depending on the type of raw materials and foaming technology used.
Foam glass is considered an effective artificial product used for various construction purposes. Foam glass offers outstanding technical qualities such as low density, fire resistance, rodent resistance, acoustic insulation, non-toxicity, and non-water absorption resistance [15]. Some foam glass materials resist insects and bacterial acts [16]. According to some research, foam glass does not lose its thermal insulation over time [17,18]. The pore size, distribution nature, and type of gas that fills the pore mainly consist of CO2, which controls many properties of the material, including density, thermal conductivity, high surface area, permeability, and chemical and thermal stability [10]. Numerous studies have been conducted on factors affecting the engineering properties of glass foam, such as type of glass [19,20,21,22,23,24], amount of waste glass used [25], types and amounts of foaming agents [22,26], gas composition [27], sintering temperature and rate of temperature [23,26,28]. Zhai et al. [29] successfully developed a type of foam glass with exceptional properties. They demonstrated that foam glass samples with smaller pores and a more uniform pore structure enhance mechanical properties. To investigate the effects of different foaming agents, Zhai et al. [30] studied the physical and mechanical properties of foam glass materials at the molecular level. This approach provided a deeper understanding of the mechanism’s characteristics associated with the foaming process. Besides experimental research, some numerical analysis studies have been performed on foam glass to predict the material’s thermal properties [14,31].
Generally, foam glass is produced in two forms: foam glass panels (FGP) and foam glass aggregates (FGA). Floor and wall tiles, architectural panels, filters, absorbers, and gas sensors are all made of foam glass in the shape of panels. Foam glass aggregate, as another production type, is recommended for different construction purposes such as insulation fill in foundations of buildings, parking decks, roofs of the car park or perimeter insulation, infrastructure constructions, insulation for long-distance heating pipelines, insulation of underground storage tanks [32] or large-scale thermal energy storages (TES) [33]. Foam glass aggregates with significant compressive strengths can be utilised for lightweight concrete, infrastructural foundations, and sports fields [8,15,34,35,36]. Foam glass aggregates have also shown the potential to be used as sub-ballast layers in road construction applications [37,38]
Regarding the broad applicability of foam glass aggregates, the built-in conditions could differ significantly in terms of compaction, temperature, and relative humidity of the environment, see Figure 1. However, manufacturers usually offer technical data in a single design state.
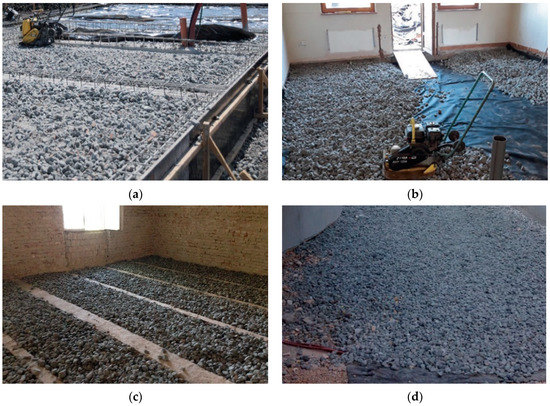
Figure 1.
Different applications of foam glass aggregates: (a) thermal insulation of buildings’ ground contact slabs, (b) thermal insulation of buildings’ slabs in case of refurbishment, (c) thermal insulation of buildings’ intermediate slabs in case of refurbishments, (d) insulation and base layer of a heated ramp of an underground garage.
Studying the thermal conductivity of foam glass aggregates is crucial for their insulating performance and usability in the building industry. To obtain the thermal performance of foam glass aggregates, researchers used different measurement methods to test the thermal conductivity through lab- and field-experimental measurements [5,31,39,40,41,42,43,44,45].
Through a big-size lab scale (1 m3), a group of researchers [42] performed laboratory thermal tests on foam glass aggregate with different size distributions ranging from 20 mm to 60 mm. They found that the effective thermal conductivity of the material was 0.0612 W/m·K at 20 °C. To compare the thermal conductivity of foam glass aggregate with the XPS layer and traditional aggregate (limestone, granite, gneiss) materials, Ghafari et al. [5] conducted laboratory test pits and field tests to evaluate different materials’ thermal and mechanical properties. They found that the measured effective thermal conductivity using the transient line source method was within the range of values reported in the lab on compacted foam glass aggregates in dry and wet circumstances, 0.15 to 0.25 W/m·K, while from the test pits’ temperature profiles for a freezing index (FI) of 250 °C-day, which is defined as the accumulation of the number of degrees per day below 0 °C during a specific period of time, the calculated effective thermal conductivity of the foam glass layer was 0.20 W/m·K at around 20% and a density of 165 kg/m3. Due to the availability of high demands on roads caused by frost actions which led to severe problems, Øiseth et al. [28] conducted a comparative field test for four different types of materials, including FGA, and the thermal conductivity of FGA was about 0.155 W/m·K at 10 °C when the typical loose bulk density was between 180 and 250 kg/m3, and the moisture content was 6% by volume. The findings of Emersleben et al. [46] showed that foam glass aggregate could be used in various civil engineering applications to offer thermal insulation and frost protection due to the measured value of the thermal conductivity of compacted foam glass aggregate, which was found to be around 0.085 W/m·K. A series of lab and field tests were conducted by Zegowitz [39] to investigate the thermal properties of foam glass aggregates at different moisture contents and 30% compaction. From the laboratory test results, depending on the guarded hot plate apparatus, the thermal conductivity of the dry foam glass aggregates ranges from about 0.08 W/m·K to 0.095 W/m·K. At the same time, the maximum thermal conductivity values reached about 0.17 W/m·K after submerging the material for 28 days underwater. For the field samples, he took them at different locations (outside, boundary, and middle) of the floor slab. He found that the thermal conductivity was about 0.1 W/m·K in the middle area and up to about 0.12 W/m·K at the boundary area, with a moisture content ranging between 2% and 6%. Semenov et al. [39] aimed to determine the properties of foam glass gravels and calculate the roadbed’s thermal characteristics and temperature distribution. They found that the compression strength of foam glass aggregate varied depending on the degree of compaction, ranging from 0.90 to 1.58 MPa, and the thermal conductivity coefficient ranged from 0.087 to 0.099 W/m·K depending on the compaction rate of the material. The water absorption of the aggregate by volume was below 1.8%, and the sorption humidity did not exceed 4.2%.
The previously mentioned literature illustrated that factors such as compaction ratio, temperature, and moisture content primarily affect the results of the thermal performance of foam glass aggregates which is considered the aim of this study. Insufficient knowledge about the boundary conditions (groundwater level and moisture contents) may contribute to missing the estimates of the thermal insulation properties of the material. Increased moisture content, particularly at higher temperatures, decreases the insulation’s thermal resistance and, consequently, increases losses of a building or heat storage. The assumption of constant material properties (thermal conductivity of insulation) leads to incorrect results [40]. The relative humidity of the insulation material might rise because of diffusion processes caused by temperature or humidity differences resulting in a significant rise in effective thermal conductivity [47]. Furthermore, the size distribution nature of foam glass aggregate is substantial; therefore, increasing compaction ratios are expected to affect the material’s thermal performance and mechanical properties due to density increase.
Considering the significant influences discussed above based on the available scientific literature, it was essential to conduct an extensive research study to investigate the impact of these factors on the thermal performance of foam glass aggregates to prove the material’s broad usability in the mentioned building construction applications, where the built-in conditions are significantly different to each other. This study aims to fill the available gap in the literature by providing the thermal performance of FGA at different compaction ratios, and different temperatures and relative humidities, and the results could be highly valuable for practical applications involving foam glass aggregates as thermal insulation materials.
For this reason, laboratory experiments have been conducted on foam glass aggregate samples prepared with four different compaction ratios (10%, 20%, 30%, and 40%) using two different temperatures (10 °C and 30 °C). Different relative humidity percentages were selected to obtain the measurements of 50%, 95%, and fully submerged to simulate various environmental conditions the material could face during its service life and impact its thermal conductivity. Furthermore, besides the thermal tests, the impact of static loads ranging between 50 kPa and 300 kPa with 50 kPa intervals and the effect of increased compaction ratios on dry and submerged densities are also presented.
2. Materials and Methods
2.1. Material
The only used material in this study is foam glass aggregate developed by a Hungarian company (Energocell Ltd., Debrecen, Hungary) [48]. The used foam glass is grey and has a sharp-grained, broken-edge surface as crushed stone. The morphology of the used foam glass aggregate with different aperture sizes is shown in Figure 2. The used foam glass aggregate in the present study was previously characterised and analysed for its atomic and weight concentration [12]. The loose bulk density is around 170 kg/m3, with high porosity reaching 92.7%.
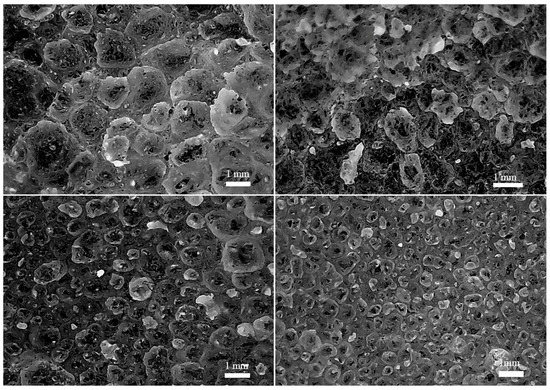
Figure 2.
The morphology of used foam glass aggregates with different aperture sizes.
From the particle size distribution curve (shown in Figure 3) of the initial foam glass aggregate appeared that the material mainly contained gravel-sized particles, and by depending on the coefficient of uniformity Cu = 1.66 and coefficient of curvature Cc = 1.13 for the as-received foam glass aggregate, the material is classified as poorly graded, with one major grain size range between 10 mm and 60 mm.
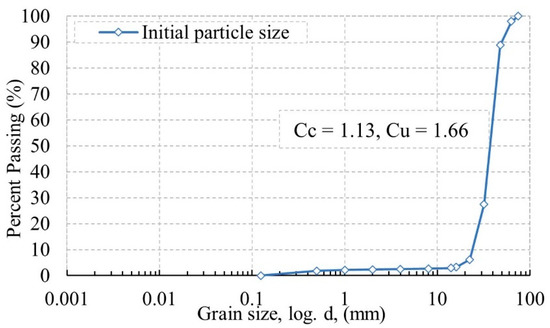
Figure 3.
Grain size distributions of foam glass aggregate at initial condition.
2.2. Methods
2.2.1. Bulk Density and Compression of the Compacted Aggregate
A customised testing setup designed for conducting static compression tests on foam glass aggregate has been developed. This setup adheres to the 5D (largest particle diameter) size criterion to satisfy the standard regulation mentioned in the ASTM D698–12 [49], as illustrated in Figure 4a. Utilising a conventional geotechnical apparatus for static compression tests on foam glass aggregate samples is not feasible due to the impracticality of accommodating the individual particle size, which may exceed the conventional sample size range of 10 to 60 mm in diameter [12]. Regarding the compaction process, to reach 10% and 20% compaction ratios, the material was compacted in one layer, and to obtain the 30% and 40% compaction ratios, the material was compacted into the moulds in two layers using a heavy-load plate. The mass of the compacted samples was measured using a 150AS laboratory scale (CAS Co. Ltd., Seoul, Republic of Korea), see Figure 4b, then, using the volume of the sample (300 mm in diameter and the compressed height), the density of the samples was obtained.
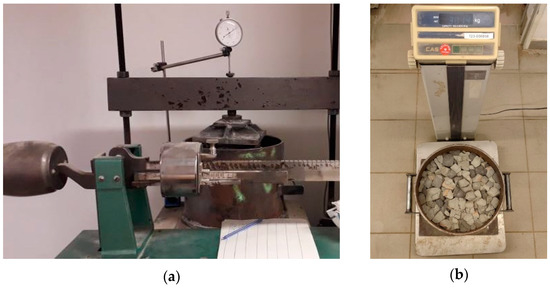
Figure 4.
(a) Special test frame for static compression tests, (b) laboratory scale and steel mould used for measuring the mass of the compacted samples.
During the static compression test, different static loads were tested starting at 50 kPa to 300 kPa with 50 kPa intervals applied on samples prepared with four compaction ratios (10%, 20%, 30%, and 40%), respectively. Each loading stage was performed until the vertical strain reached the 0.01 mm/min strain value. During the tests, five trials were conducted on foam glass aggregate samples to show the diversity in the obtained results of each trial and to evaluate the behaviour of such materials under the same amount of static loads. In the case of using different static loads, we were able to analyse the effect of static compression loads at different compaction ratios and evaluate the impact of individual compressional loads on strain values of foam glass aggregates at different compaction ratios.
Various sets of static loads were employed during the static compression test, ranging from 50 kPa to 300 kPa, with 50 kPa intervals. These loads were applied to samples prepared with four compaction ratios (10%, 20%, 30%, and 40%). The vertical strain was monitored during each loading stage until it reached a strain value of 0.01 mm/min. Five trials were conducted on foam glass aggregate samples to demonstrate the variability in the results and assess the material’s behaviour under identical static loads. The impact of static compression loads on foam glass aggregate behaviour at different compaction ratios has been examined using various static loads, allowing us to evaluate the influence of individual compressional loads on the strain values of foam glass aggregates at varying compaction ratios.
2.2.2. Thermal Conductivity Measurements
Different measurement techniques were used to measure the thermal conductivity of the insulation materials, in which their accuracy varied depending on the steady-state and transient-state methods of measuring thermal conductivity [50]. In the case of foam glass aggregates, mostly the transient line source method [5,44,51,52], heat flow meter [43,45,53], or guarded hot plate method [31,40] were used.
In our comprehensive study, the thermal conductivity of foam glass aggregate samples was measured in three different moisture conditions (50% RH, 95% RH and submerged). The samples were tested using two different methods, which were later compared. The first method was the transient line source (TLS) procedure, following ASTM D5334-22 [54]. The measurement procedure involves inserting a needle probe to a depth of at least 5 cm into a circular cylindrical test specimen of at least 5 cm radius. The needle probes were equipped with a thermocouple for precise temperature measurement and a heating rod for controlled probe heating and heating power input measurement. Therefore, the TLS thermal conductivity measurement method is based on inserting a needle probe with a defined electrical resistance into the compacted foam glass aggregate sample under test, through which a direct current of known intensity is passed. The electric current heats the needle probe, becoming a linear heat source in the sample. During the test, the heat flux emitted by the needle probe is constant.
The thermal conductivity of the measured sample is obtained indirectly by determining the heating rate of the sample under test so that the measurement is not perfectly steady-state but quasi-steady-state in a transient state. The thermocouple in the needle probe determines the sample’s temperature increase or decrease after the heating is turned off. According to ASTM D5334-22 [54], the temperature change in the samples from the initial time can be described by a long-time measurement procedure at constant heating power during the heating-up phase, where the radial distance from the heat source is sufficiently small, and the heat diffusion is sufficiently large, using the following simplified relationship:
where —heat rate measured per unit length (W/m), —thermal conductivity (W/m·K), —heating time (s), and —calibration constant.
Thus, the thermal conductivity is determined by plotting the temperature change of the sample near the line heat source as a function of time on a logarithmic basis, from which the slope of the temperature change can be determined in the short quasi-steady-state during transient measurement, as visualised in Figure 5.
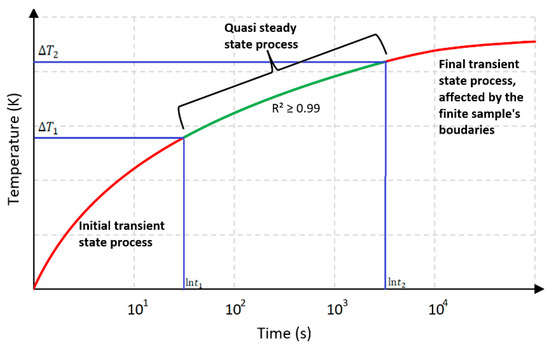
Figure 5.
Temperature change in the ideal heating condition.
Based on the principles described in ASTM D5334-22 [54], the thermal conductivity can be determined by the following relationship using the temperature change of the quasi-steady state linear warm-up phase during the measurement and its slope as a function of time plotted on a logarithmic basis following Equation (2):
A portable heat transfer analyser device, ISOMET 2114 (Applied Precision s.r.o, Bratislava, Slovakia), and its calibrated IPN 1100 transient needle probes were used for the TLS method measurements. The measuring range of the calibrated IPN 1100 needle probes is 0.015–0.2 W/m·K and 0.2–2.0 W/m·K. The minimum measurement accuracy for the thermal conductivity is ±10%, and the measurement repeatability is ±3%.
The tests were conducted on approximately 25 cm high and 30 cm diameter cylindrical foam glass aggregate samples compacted into sacks with adjusted relative humidity (50% or 95%) or submersion into water under laboratory conditions. Five compaction states were tested: uncompacted samples, 10%, 20%, 30%, and 40% compaction. The compaction of the samples was set by measuring the mass of the samples and the volume inside the sacks or formworks used for containing the compacted samples for the measurements. Since we knew the density of the compacted foam glass aggregates from previous tests, we filled and compacted the samples for the thermal conductivity test until reaching a similar state.
We inserted the needle probe into the foam glass aggregate samples after a precise bore with a 100 mm depth and a 4 mm diameter aperture for the needle was made. We had to weigh the samples in submerged conditions to avoid swimming up, see Figure 6a. An Almemo 2890-9 device (Ahlborn GmbH, Holzkirchen, Germany) was used to measure the samples’ temperature and relative humidity during the conditioning and throughout the measurement to ensure that the relative humidity conditions were constant during the whole process. A heating temperature difference of 10 K was applied during the experiments, resulting in an average temperature of the foam glass aggregate samples of 20 ± 1 °C during the measurement of 30 ± 1 °C. We chose the suitable sensor according to preliminary measurements on each sample and then measured the thermal conductivity ten times. Therefore, we performed 150 measurements on the samples altogether using the TLS method.
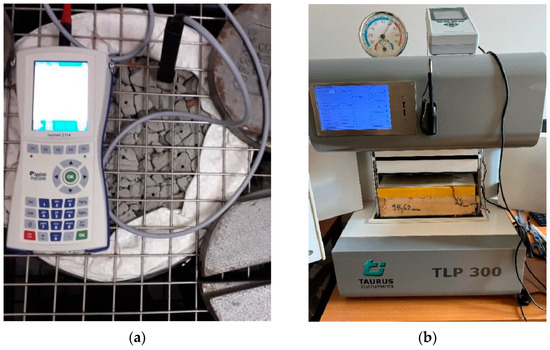
Figure 6.
Thermal conductivity measurement of foam glass aggregates: (a) TLS method, (b) GHP method.
To calculate a temperature conversion coefficient later, we had to measure the thermal conductivity of the samples at different temperature states, respectively. We chose the guarded hot plate (GHP) method for this purpose, where we can control the mean temperature of the tested samples. GHP is a steady-state measurement method that can determine a material’s thermal conductivity by using the electrical power output of a hot plate with one-directional heat conduction. The sample was heated from one side by an electrically heated plate (upper side) and cooled from the other side (lower side). The surface temperature of the sample under the heated plate was measured. The relationship used to obtain the thermal conductivity in accordance with EN 12664:2001 [55] is the following:
where —average power supplied to the metering section of the heating plate (W), —thickness of the specimen (m), —the measured area of the sample (2.5 × 10⁻³ m2), —surface temperature of the sample at the heated side (°C), and —surface temperature of the sample at the cooled side (°C). The surface temperatures were measured using five thermocouples on each side within the measured area.
A calibrated Taurus TLP 300 DTX GHP device (Taurus Instruments GmbH, Weimar, Germany) was used to measure the thermal conductivity of the foam glass aggregate samples at 10 ± 1 °C, which means that the heated plate was set to 15 °C. The cooled plate was set to 5 °C, which resulted in a 10 K temperature difference during the measurement. The measurement accuracy for the thermal conductivity measured by the device is ±2%, and the measurement repeatability is ±1%. The tests were conducted on approximately 10 cm high and 30 cm diameter rectangular foam glass aggregate samples compacted into waterproofed and sealed wooden formworks with 50% or 95% relative humidity, see Figure 6b. A 5 mm thick EPDM membrane was used on the internal side of the formworks to waterproof them to avoid moisture transfer through the formworks during the measurements and ensure that the relative humidity conditions did not change during the thermal conductivity measurements. An Almemo 2890-9 device (Ahlborn GmbH, Holzkirchen, Germany) was also used during these measurements to observe the samples’ temperature and relative humidity. Three measurements were carried out on each sample using the GHP device on samples with five different compaction states: uncompacted samples, 10%, 20%, 30%, and 40% compaction. Therefore, we performed 30 measurements altogether. The compaction ratios were set according to the known densities of the compacted materials from the previous measurements. Fewer measurements were performed in the case of the GHP method since the device has better accuracy than TLS, and the measuring time was around 6–8 h using the GHP method and approximately 30 min for the TLS method for each measurement.
2.2.3. Thermal Resistivity and the Conversion Coefficient
To calculate the thermal resistance of a compacted foam glass aggregate thermal insulation layer according to ISO 6946:2017 [56], we need to know the design thermal conductivity of the layer, which depends on the built-in state. Temperature, moisture content (which depends on relative humidity) and age are mentioned in the ISO 10456:2007 standard [57]. There are temperature conversion factors for cellular glass available in the cited standard; however, these values are valid for the foam glass material or panels having a thermal conductivity between 0.035 W/m·K and 0.055 W/m·K at 100–150 kg/m3 density and not for the compacted aggregate bulks. Therefore, to calculate the thermal resistance of the compacted foam glass aggregate layer, we need to develop a conversion coefficient that can convert the laboratory-measured thermal conductivity values into built-in states. We based our conversion coefficient on the calculation methodology of ISO 10456:2007 [57] but simplified the conversion into a single temperature conversion factor, which depends on the compaction and relative humidity of the foam glass aggregate. The equation is the following:
where —laboratory measured thermal conductivity of the foam glass aggregate material, —design thermal conductivity of a built-in material, —temperature conversion coefficient, —design temperature, and —mean temperature of the samples during laboratory measurements. We used the following equation to obtain the temperature conversion coefficient derived from the measurements we performed:
where —measured thermal conductivity using the TLS method, —measured thermal conductivity using the GHP method, —mean sample temperature using the TLS method, and —mean sample temperature using the TLS method. Since the TLS method sample temperature was around 30 °C and the GHP method was around 10 °C, we can obtain the compaction (uncompacted, 10%, 20%, 30%, and 40%) and relative humidity (50% and 95%)-dependent temperature conversion coefficients to calculate the design thermal conductivity. Between the boundaries of the conversion coefficients, we advise using linear interpolation to obtain intermediate values for approximation.
Knowing the design thermal conductivity for the foam glass aggregates, we can use the following simple equation based on ISO 6946:2017 [56] to determine the thermal resistivity of foam glass aggregate layers at different temperatures, humidity percentages and for various compaction ratios:
where —thermal resistivity of a built-in layer (m2·K/W), and —compacted thickness of a built-in layer. It is important to use the compacted thickness instead of the nominal since when foam glass aggregates are compacted, their thickness significantly decreases compared to the nominal loose state.
3. Results and Discussion
3.1. Effect of Compaction on Bulk Density of Foam Glass Aggregate
Foam glass aggregate has a wide range of particle size distribution ranging between 10 mm and 60 mm, which may impact the bulk density of the material. Therefore, measuring the effect of compaction on the material bulk density at both dry and submerged conditions is considered an essential engineering issue. More compaction energy has been applied to the same foam glass aggregate to achieve a higher compaction ratio. By elevating the compaction ratio to 40%, the dry bulk density of the material was increased by about 40%, as seen in Figure 7.
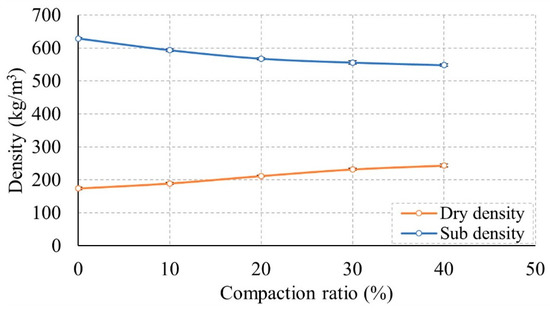
Figure 7.
Effect of compaction ratio on foam glass aggregate’s dry and submerged density.
Increasing bulk density was related to the effect of compaction on the rearrangement of the particles due to particle breakage, which led to higher bulk density. The particle size distribution of compacted foam glass aggregates shows that smaller particle contents increased with higher compaction ratios [12]. The increase in fine content in traditional aggregate is related to abrasion and attrition processes, which reduce the aggregate’s angularity and increase bulk density [58,59]. According to the basic compaction principles, standard effort compaction method by ASTM D698-12 [49] and modified effort compaction method by ASTM D1557-12 [60], applying a higher amount of compaction energy on the same material led to an increase in the bulk density. In some regard, Swan et al. [61] conducted impact compaction tests on the material depending on ASTM D1557-12 [60] method C using two types of compaction effort: 1200 kNm/m3 and 2700 kNm/m3. Their result showed that the bulk density of foam glass aggregate increased by about 2.4 to 2.7 times more than the initial material’s bulk density under the impact of elevated compaction energy.
In the case of the submerged condition, the density of foam glass aggregate decreased by about 8% after elevating the compaction ratio of the sample to 20%. The main reason behind this behaviour of foam glass aggregate may be related to the density of the material compared to the water density. As the density of foam glass material is lower than that of water, increasing the compaction ratio led to a lower submerged bulk density due to occupying a larger amount of the total volume by solid particles. The results and error bars are presented in Figure 7, but the latter is barely visible due to the slight deviation. Therefore, the mean values and deviations are listed in Table 1. The minimum and maximum deviation values for dry and submerged conditions ranged from around 2.25 kg/m3 to 5.35 kg/m3.

Table 1.
Mean density and standard deviation of the examined FGA at different compaction ratios.
3.2. Effect of Compaction on Compressional Behaviour of Foam Glass Aggregates
To show the effect of static loads at different compaction ratios, Figure 8 has been made. The value of each point of the figure has been obtained depending on the mean value of five trials applied on foam glass aggregates at the same compaction ratio. As can be seen from the figure, increasing the compaction ratio led to a decrease in the vertical strain of the material. This was probably because of extra compaction ratios on particle connection conditions in which bigger connected areas were obtained at higher compaction ratios. As a result, the overall well-connected particles made a stiffer system that can resist external loads with lower vertical strain values. Moreover, correlation trend lines were plotted to establish connections between the vertical strain values obtained from the same compressional loads but different compaction ratios. The figure illustrates that these correlation trend lines consistently fell within the error bar, particularly when the compaction ratios reached 30%. The minimum and maximum error values range between 0.06% and 0.862% for the compressional tests conducted on the examined foam glass aggregates under various compaction ratios and compressional loads. As shown in Figure 8, the deviation also increased at low compaction ratios (10%, and 20%) by increasing compressional loads. By increasing the compaction ratios to 30% and 40%, this phenomenon disappeared, emphasising the significant impact of compressional loads on particle stability at low compaction ratios. Furthermore, this observation highlights the reliability of the power-connection correlation under the given conditions. It indicates the stability of the material, particularly at higher compaction ratios of 30% and 40%, across all examined vertical strains.
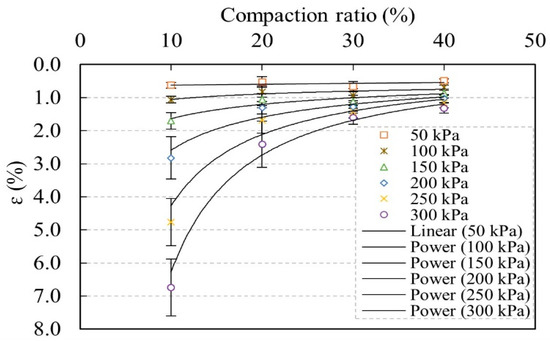
Figure 8.
Effect of static compression loads at different compaction ratios.
When comparing the results of other researchers, such as Swan et al. [61], with the present study’s findings, a significant difference in the vertical strain values was observed, particularly at a compaction ratio of 40%. The present study determined the total vertical strain values for compaction ratios of 10%, 20%, 30%, and 40% under a vertical stress of 300 kPa as 7.46%, 2.41%, 1.61%, and 1.32%, respectively. In contrast, Swan et al. [61] reported a final vertical strain value of approximately 19% under the same stress level. This disparity can be attributed to the compaction method employed in the study by Swan et al. [61], which involved applying a high amount of compaction energy according to the modified compaction method specified in the ASTM D1557-12 [60] standard. This excessive compaction energy resulted in severe damage to the particle size distribution, particularly in cases where a significant amount of fine materials was present, leading to substantial vertical strains and discrepancies in the vertical strain values under long-term loading conditions. Based on these findings, using traditional standard compaction methods for sample preparation in laboratory tests is not recommended.
From the stress–strain curves of the static compressional test conducted on five to eight samples of FGA, the compressional modulus (Eoed) values have been calculated. The mean values and standard deviation of the Eoed under varying compaction ratios and static compressional loads ranging from 50 kPa to 300 kPa with 50 kPa intervals are presented in Table 2. The maximum oedometric modulus was achieved for 10% and 20% compaction ratios under compressional loads of 150 kPa and 200 kPa, respectively. However, for 30% and 40% compaction ratios, the oedometric modulus continued to increase under all tested compressional loads. These findings indicate that the material at lower compaction ratios (10% and 20%) became progressively softer with higher compressional loads. Conversely, the consistently elevated oedometric modulus values suggest that the material exhibited stiffness and stability similar to conventional soils like sandy soil. This implies that the material could be considered for geotechnical applications under similar loading conditions by providing valuable insights for geotechnical engineers in selecting a suitable compressional modulus for specific projects or applications.
Table 2.
Calculated values of Eoed (MPa) for all loading steps and compaction ratios.
As shown in Table 2, the oedometric modulus of the examined foam glass aggregate at 10% compaction and under the impact of 50 kPa was about 7.5 MPa. It raised to 23 MPa when compacted by 40% under the impact of 300 kPa. In this regard, the present study results are in harmony with Steurer’s study [62]. He conducted a comprehensive study involving large-scale and oedometric laboratory compression tests to investigate the load-deformation behaviour of foam glass aggregates. According to his finding, by raising the compaction ratio from 10% to 25%, the stiffness modulus also increased.
Additionally, Steurer [62] also observed a higher stiffness modulus from the long-term confined compression test ranging from 30 MPa to 43 MPa under the same compressional stress impact compared to the present study ranging from 100 kPa to 300 kPa. According to the authors’ perspective, the higher compressional modulus observed in the mentioned study can be attributed to the foam glass aggregate grains’ greater compressive strength, measured at 2100 kPa. In our case, the compressional strength was approximately 1200 kPa.
3.3. Thermal Conductivity of FGA Using the TLS Method
The thermal conductivity has been measured for foam glass aggregate samples prepared with four different compaction ratios and obtained at three different moisture conditions (50%, 95%, and fully submerged) using the transient line source method. Figure 9 shows the effect of compaction ratios and relative humidity on foam glass aggregate’s thermal conductivity. The figure revealed that the thermal conductivity values at 50% and 95% relative humidity were proportionally increased by increasing compaction ratios, with a linear relationship and an R2 value of 0.99. The substantial proportional correlation value indicates that the compaction ratio significantly affects the heat transfer mechanism of this material, and it should be considered when foam glass aggregate is used as a huge mass in geotechnical applications. The proportional increase in the thermal conductivity parallel with elevated compaction ratio values may relate to the change in the amount of void ratios occupied by air under the impact of the elevated compaction ratio. Due to the particle sizes of foam glass aggregate, which range between 10 mm and 60 mm, the material has many voids, especially at low compaction ratios. By elevating the amount of compaction ratio, the interlocking of foam glass aggregate partials increased under impact compaction blows, which decreased the voids available between foam glass aggregate particles. The decrease in the void ratio means an increase in the solid ratio occupied by foam glass aggregate particles which allows for the elevation of the thermal conductivity of the whole system due to the higher conductivity of the solid part compared to air. Semenov et al. [38] reported similar findings and observed an increased thermal conductivity coefficient with increasing compaction ratios from 10% to 20%. This increase was attributed to the enhanced convective heat transfer component, specifically the air movement within the expanding intergranular space.
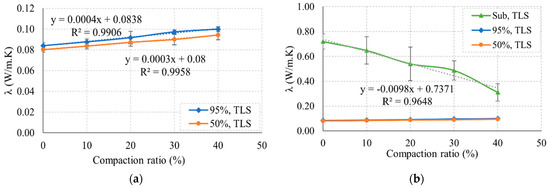
Figure 9.
Thermal conductivity at different compaction ratios and relative humidities with boundary limits: (a) 50% and 95% relative humidity, (b) 50%, 95%, and submerged condition.
Furthermore, as shown in Figure 9 and Table 3, the measured thermal conductivity was about 0.080 W/m K at a 10% compaction ratio, and it raised to 0.094 W/m·K after achieving a 40% compaction ratio when the relative humidity was 50%. By elevating the relative humidity of foam glass aggregate to 95%, the thermal conductivity increased from 0.0840 W/m K at 10% compaction to 0.099 W/m·K at 40% compaction. Similar observations were achieved by Ochs and Müller-Steinhagen [47] when they measured the thermal conductivity of foam glass granules at different moisture contents. Increasing the amount of relative humidity leads to higher moisture content, which increases the material’s thermal conductivity. In a related study, Ioana et al. [45] observed a linear increase in the thermal conductivity of dry samples ranging from approximately 0.08 W/m·K to 0.095 W/m·K as the moisture content increased. Furthermore, under actual site conditions, the calculated thermal conductivity values for foam glass aggregate available under the boundary area of the ground slabs, with moisture contents of approximately 2% by volume, were around 0.1 W/m·K. In contrast, the thermal conductivity in the middle area of the slabs, with a moisture content of approximately 6%, was about 0.12 W/m·K. By submerging the samples of foam glass aggregate inside water for about 24 h, a noticeable increase in the thermal conductivity value of the material was observed. For the 10% compaction ratio, the submerged thermal conductivity of foam glass aggregate was about 0.72 W/m·K. It decreased to 0.31 W/m·K at 40% compaction, showing a disproportional linear correlation between thermal conductivity and compaction ratio with an R2 value of 0.96. The disproportional relationship behaviour of submerged samples shows the compaction ratio’s positive impact on decreasing the material’s thermal conductivity. The void ratios decreased by increasing the compaction ratio, leading to less water content. As a result, the thermal conductivity of the matrix was controlled by foam glass aggregate particles with a lower thermal conductivity than water. Therefore, the thermal conductivity of the matrix decreased and showed disproportional relationships with an elevated compaction ratio. In a similar context, Chindaprasirt et al. [39] observed higher thermal conductivity values of 0.17 W/m·K for the wet samples submerged underwater for 28 days. In comparison, for the dry samples and those with approximately 2% moisture content, the thermal conductivity was around 0.1 W/m·K.
Table 3.
Effect of compaction ratio on thermal conductivity of foam glass aggregates.
The results also show that the change in the material’s thermal conductivity at submerged conditions was about 30.7%, while the results for 50% and 95% relative humidity were about 15% and 14.56%, respectively, after compacting the material by 40%. As can be seen from the changes in different environmental conditions, the decrease in the material’s thermal conductivity was much higher than the increased percent obtained from elevating the humidity for the same range of elevated compaction ratio. This result emphasises the significant positive impact of elevating compaction ratios of foam glass aggregates if used as thermal insulation materials in geotechnical applications. Also, the significant impact of the submerged condition on the rising thermal conductivity of the whole matrix means that great care should be considered when using the material which may be subjected to the same environmental condition at the actual building construction site.
Like other laboratory experiments to see the deviation in the measured values, many trials have been performed on foam glass aggregate samples at the same environmental and compaction ratio to measure the material’s thermal conductivity. We performed ten trials for the same compaction ratio and different samples of foam glass aggregate using a needle probe put into different positions in the samples. Figure 9 also shows the standard deviation of all measured thermal conductivity values besides the mean values. According to the measurements of both 50% and 95% relative humidity, the upper and lower limits of thermal conductivity values were located within 5% deviations, which is considered an acceptable range. In contrast, the standard deviation for fully submerged samples’ measurements reached about 20%. The availability of a higher deviation between the upper and lower limit values with the mean measured thermal conductivity values of submerged conditions may be related to the effect of water on the device’s efficiency measurement process. During making the aperture for measuring the material’s thermal conductivity, although a special drilling tool was used, the probability of obtaining a wider diameter than the needle probe diameter was still non-zero due to the material property, which contains a high amount of inter-closed pores. Furthermore, water availability inside the aperture during submerged conditions increased the relative distance between the surface of the needle probe and the solid particle of each trial. Therefore, the probability of obtaining the best contact between the solid material and the needle probe surface during the whole distance of the needle probe differed in each measurement trial, leading to a broader deviation in measured values.
3.4. Thermal Conductivity of FGA Using the GHP Method
Since the measured thermal conductivities using TLS were measured at a 30 °C mean sample temperature due to the method, we set the GHP apparatus to measure at 10 °C mean sample temperature to compare the temperature effects on FGA. According to the results, the decreasing temperature led to lower thermal conductivity values. Figure 10 shows a linear increasing trend line in the thermal conductivity values at both tested relative humidities (50% and 95%), parallel with the elevated compaction ratios (0%, 10%, 20%, 30%, and 40%) and while comparing the two temperatures. As appearing in both 50% and 95% RH, the general trend of increase in thermal conductivity of foam glass was linear. Similarly, observations were seen by Janetti et al. [31] from the relationship between thermal conductivity and temperature rising of the examined foam glass material. They found that the thermal conductivity exhibited a linear correlation with increasing temperatures within the range of 10 °C to 30 °C. This observation aligns with the fundamental theory of heat transfer. Furthermore, Janetti et al. [31] observed consistently increasing trends in thermal conductivity across all the measured samples in their study.
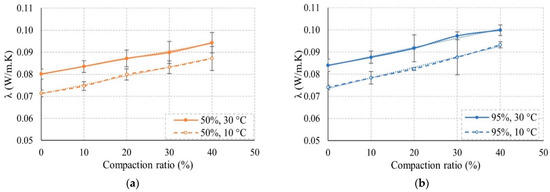
Figure 10.
Thermal conductivity of foam glass aggregate using different measurement methods at various humidity conditions: (a) 50% humidity content at 10 °C (GHP method) and 30 °C (TLS method), (b) 95% humidity content at 10 °C (GHP method) and 30 °C (TLS method).
Table 4 has been made to present the exact measured values at each compaction ratio and for different relative humidity percentages.
Table 4.
Thermal conductivity of foam glass aggregates using different measurement techniques.
It is visible that the difference between 10 °C and 30 °C thermal conductivity values is between 9.12% and 12.27% in the case of 50% relative humidity and 7.11% and 13.51% in the case of 95% relative humidity. We can observe the decreasing trend in the difference comparing the 95% RH values in the case of increasing compaction ratio. This trend can be explained similarly to the decreasing thermal conductivity of submerged FGA because the voids are decreasing with the elevated compaction, and less moist air could fit into the pores and between the aggregates of the compacted material. This effect is not visible clearly on the 50% RH conditioned samples, and the difference is decreased until 20% compaction, then increased at 30% and 40%.
3.5. Thermal Resistance of Compacted FGA Layers
The thermal resistance of foam glass aggregates at different compaction ratios and for various relative humidities are presented in Figure 11 based on the results of the TLS method measurements. The foam glass aggregate layer’s initial thickness (in the uncompressed condition) was 30 cm. The figure illustrated that the layers’ thermal resistance (R) is decreased by increasing the compaction ratios at 50% and 95% humidity. In the case of only soil humidity present, we can observe a substantial decrease in the thermal resistance of the compacted FGA layer since the compaction also reduced its thickness. The designing engineers need to calculate the compressed thickness and thermal conductivity of the FGA layer in the case of thermal and energy performance calculations because there could be up to a 30% difference in the R value of the FGA layer.
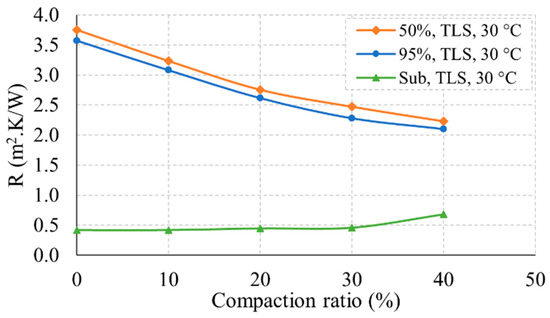
Figure 11.
The thermal resistance of foam glass aggregate at different compaction ratios and relative humidity using the TLS method.
In the submerged condition, the R values remained almost constant when the compaction ratio was located between 0% and 30%. This phenomenon is observable because despite losing thickness with the compaction, the thermal conductivity of the FGA is also decreasing. After that, the R value is slightly increased by increasing the compaction ratio to 40%, which indicates the importance of compacting the material to more than 30% to have a higher R value in case of water presence, making the material a more efficient thermal insulator.
We also compared the thermal resistance of the material at 10 °C and 30 °C at different relative humidities, see Figure 12. It is visible from the figure that there is a significant difference between the R value of compacted FGA layers and lower compaction ratios result in greater differences regarding the temperature change which can be up to 15% in the case of a humid built-in environment. It is also observable that the thermal insulation capability of the compacted foam glass aggregates is better if the mean temperature of the layer is lower. Therefore, applications of FGA are recommended in low-temperature environments.
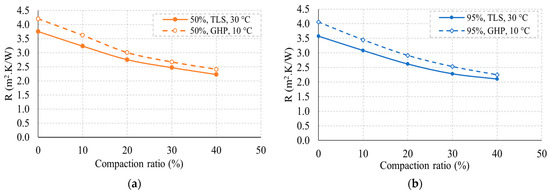
Figure 12.
The thermal resistance of a foam glass aggregate layer at various compaction ratios, temperatures and relative humidity: (a) 50% relative humidity, (b) 95% relative humidity.
3.6. Conversion Coefficient
Conversion coefficients are calculated using the presented methodology to provide the possibility of FGA’s thermal conductivity temperature conversion for different compaction ratios and relative humidities. The conversion coefficients are shown in Table 5.
Table 5.
Temperature conversion coefficient (ft) to convert λ values at different humidity conditions (50% and 95%).
Comparing the conversion coefficient to the ISO 10456:2007 [57] temperature conversion coefficient of cellular glass panels ranges between 0.0043 and 0.0027 in the case of thermal conductivity between 0.035 W/m·K and 0.055 W/m·K, respectively; hence, we can conclude that the foam glass aggregate’s conversion coefficient according to our study is in a similar range. Compaction decreases the temperature conversion coefficient, and we can see a slight difference between the 50% RH values and 95% RH values.
4. Conclusions
Our primary motivation was to show the thermal insulation and mechanical performance of FGA and gain a deeper understanding of how built-in factors impact the thermal performance of FGA, which can also have significant implications for applications in thermal insulation and related fields.
Therefore, in this study, the thermal properties of foam glass aggregates (FGA) were examined considering various factors, including humidity conditions, submergence, temperatures, and compaction ratios, to fill the gap in the scientific literature and reveal the thermal insulation applicability of FGA in different building construction applications as a thermal insulation layer. Our experimental results provide data for proper calculation with FGA as thermal insulation material in various built-in states.
We found that under dry conditions, the density of FGA exhibited a consistent and linear rise as the compaction ratios increased. This can be attributed to the increased occupation of space by solid content and the reduction of available void ratios between particles. However, increasing compaction ratios resulted in a decline in the submergence density of FGA under submergence conditions. This can be attributed to the significant difference in density ratios between water and FGA, which had a pronounced impact.
The vertical strain of FGA exhibited a decrease as the compaction ratios increased. The correlation coefficient values varied depending on the magnitude of the applied compressional loads and compaction ratios. Specifically, a stronger correlation between compaction ratios and vertical strain values was observed with higher compressional loads. Additionally, a higher compaction ratio resulted in a more favourable linear mean behaviour of the material when subjected to compressional loads.
By performing a comprehensive series of experiments on examined FGA samples, the material’s compressional modulus (Eoed) under varying compaction ratios and static compressional loads ranging from 50 kPa to 300 kPa with 50 kPa intervals has been calculated. The obtained result will be very valuable for designers in case of using the same material in civil and geotechnical applications.
The findings revealed a remarkable pattern in the thermal performance of FGA: as the compaction ratios of foam glass aggregates increased from 0% to 40%, there was a linear rise in thermal conductivity (λ) at both humidity levels of 50% and 95%. This can be attributed to the decrease in void volume available between FGA particles resulting from higher compaction ratios. However, when the foam glass aggregates were submerged, an even more intriguing trend emerged. Despite the same compaction ratios, the material’s thermal conductivity experienced a substantial decrease, following a steeper linear trajectory.
Both measurement techniques (TLS and GHP) exhibited a consistent and almost identical linear slope pattern in terms of thermal conductivity trend at 50% and 95% humidities, indicating good agreement. However, the thermal conductivity (λ) values obtained through the TLS method were higher due to the higher sample mean temperature at 30 °C than those obtained through the GHP method with a 10 °C sample mean temperature. This difference, therefore, can be attributed to the different sample mean temperatures.
The thermal resistance (R) of an FGA layer exhibited a linear decrease as the compaction ratios increased at 50% and 95% relative humidity levels. However, when the FGA samples were submerged, their thermal resistance values remained stable until a compaction ratio of 30%. However, upon further increasing the compaction ratio to 40%, a slight increase in the R value of the material was observed. The thermal resistance of a compacted FGA layer exhibited a nearly linear decrease with increasing compaction ratios at both 50% and 95% humidity levels. In the case of submerged FGA, the resistivity values remained stable until a compaction ratio of 30%. However, upon increasing the compaction ratio to 40%, there was a slight increase in the resistivity value of the material.
The results also revealed that thermal conductivity values obtained by both TLS and GHP methods had linear correlations with elevated compaction ratios with slightly higher standard deviation values using the TLS method. Furthermore, the temperature conversion coefficient (ft) values depending on the compaction and relative humidity of the FGA were calculated to convert the λ values to different temperatures than measured.
Author Contributions
Conceptualisation, B.N. and J.S.; methodology, W.S.M., B.N. and J.S.; investigation, W.S.M. and B.N.; data curation, W.S.M., B.N. and J.S.; writing—original draft preparation, W.S.M. and B.N.; writing—review and editing, B.N. and J.S.; visualisation, W.S.M.; supervision, B.N. and J.S. All authors have read and agreed to the published version of the manuscript.
Funding
This research was funded by the National Research, Development and Innovation Fund grant number TKP2021.
Institutional Review Board Statement
Not applicable.
Informed Consent Statement
Not applicable.
Data Availability Statement
Not applicable.
Acknowledgments
The research reported in this paper is part of project no. BME-NVA-02, implemented with the support provided by the Ministry of Innovation and Technology of Hungary from the National Research, Development and Innovation Fund, financed under the TKP2021 funding scheme. The authors sincerely thank Dániel Csanády, for his help during this research.
Conflicts of Interest
The authors declare no conflict of interest.
References
- Limbachiya, M.; Meddah, M.S.; Fotiadou, S. Performance of Granulated Foam Glass Concrete. Constr. Build. Mater. 2012, 28, 759–768. [Google Scholar] [CrossRef]
- Latest Glass Packaging Recycling Rate Steady at 76%. Available online: https://feve.org/glass_recycling_stats_2018/ (accessed on 18 June 2023).
- Sarkisov, P.D. Directed Crystallization of Glass—Basis for Obtaining Multifunctional Glass Ceramic Materials; RKhTU im. D. I. Mendeleeva: Moscow, Russia, 1997. (In Russian) [Google Scholar]
- Mallum, I.; Abdul, A.R.; Lim, N.H.A.S.; Omolayo, N. Sustainable Utilization of Waste Glass in Concrete: A Review. Silicon 2022, 14, 3199–3214. [Google Scholar] [CrossRef]
- Ghafari, N.; Segui, P.; Bilodeau, J.P.; Côté, J.; Doré, G. Assessment of Mechanical and Thermal Properties of Foam Glass Aggregates for Use in Pavements. In Proceedings of the Transportation Association of Canada and ITS Canada 2019 Joint Conference and Exhibition, Halifax, NS, Canada, 22–25 September 2019; pp. 1–18. [Google Scholar]
- Sasmal, N.; Garai, M.; Karmakar, B. Preparation and Characterization of Novel Foamed Porous Glass-Ceramics. Mater. Charact. 2015, 103, 90–100. [Google Scholar] [CrossRef]
- Vancea, C.; Lazău, I. Glass Foam from Window Panes and Bottle Glass Wastes. Cent. Eur. J. Chem. 2014, 12, 804–811. [Google Scholar] [CrossRef]
- Rawlings, R.D.; Wu, J.P.; Boccaccini, A.R. Glass-Ceramics: Their Production from Wastes-A Review. J. Mater. Sci. 2006, 41, 733–761. [Google Scholar] [CrossRef]
- Kurtulus, C.; Kurtulus, R.; Kavas, T. Foam Glass Derived from Ferrochrome Slag and Waste Container Glass: Synthesis and Extensive Characterisations. Ceram. Int. 2021, 47, 24997–25008. [Google Scholar] [CrossRef]
- Scheffler, M.; Colombo, P. Cellular Ceramics: Structure, Manufacturing, Properties and Applications; Wiley-VCH Verlag GmbH Co. KgaA: Weinheim, Germany, 2005; p. 669. [Google Scholar]
- Wattanasiriwech, D.; Nontachit, S.; Manomaivibool, P.; Wattanasiriwech, S. Foam Glass from Municipal Waste as a Lightweight Aggregate for Cement Mortar. In IOP Conference Series: Earth and Environmental Science; IOP Publishing: Bristol, UK, 2019; Volume 351. [Google Scholar] [CrossRef]
- Mustafa, W.S.; Nagy, B.; Szendefy, J. Impact of Compaction Ratio, Loading Period and Environmental Condition on Compressional Behavior of Foam Glass Aggregate. Constr. Build. Mater. 2022, 343, 128111. [Google Scholar] [CrossRef]
- Cosmulescu, F.; Paunescu, L.; Dragoescu, M.F.; Axinte, S.M. Comparative Analysis of the Foam Glass Gravel Types Experimentally Produced By Microwave Irradiation. J. Eng. Stud. Res. 2020, 26, 58–68. [Google Scholar] [CrossRef]
- Cimavilla-Román, P.; Villafañe-Calvo, J.; López-Gil, A.; König, J.; Rodríguez-Perez, M.Á. Modelling of the Mechanisms of Heat Transfer in Recycled Glass Foams. Constr. Build. Mater. 2021, 274, 122000. [Google Scholar] [CrossRef]
- Hurley, J. A UK Market Survey for Foam Glass; The Waste and Resources Action Programme: Branbury, UK, 2003; p. 114. [Google Scholar]
- Midha, S.; Kim, T.B.; Van Den Bergh, W.; Lee, P.D.; Jones, J.R.; Mitchell, C.A. Preconditioned 70S30C Bioactive Glass Foams Promote Osteogenesis in Vivo. Acta Biomater. 2013, 9, 9169–9182. [Google Scholar] [CrossRef]
- Sainz Fernández, C.; Gutiérrez Villanueva, J.L.; Quindós Poncela, L.S.; Fuente Merino, I. Radon Diffusion Coefficient in FOAMGLAS ® Cellular Glass Thermal Insulation; University of Cantabria—LaRUC: Santander, Spain, 2016; p. 18. [Google Scholar]
- Welter, T.; Müller, R.; Deubener, J.; Marzok, U.; Reinsch, S. Hydrogen Permeation Through Glass. Front. Mater. 2020, 6, 342. [Google Scholar] [CrossRef]
- Méar, F.; Yot, P.; Cambon, M.; Ribes, M. The Characterisation of Waste Cathode-Ray Tube Glass. Waste Manag. 2006, 26, 1468–1476. [Google Scholar] [CrossRef] [PubMed]
- Bernardo, E.; Albertini, F. Glass Foams from Dismantled Cathode Ray Tubes. Ceram. Int. 2006, 32, 603–608. [Google Scholar] [CrossRef]
- Petersen, R.R.; König, J.; Yue, Y. The Mechanism of Foaming and Thermal Conductivity of Glasses Foamed with MnO2. J. Non. Cryst. Solids 2015, 425, 74–82. [Google Scholar] [CrossRef]
- König, J.; Nemanič, V.; Žumer, M.; Petersen, R.R.; Østergaard, M.B.; Yue, Y.; Suvorov, D. Evaluation of the Contributions to the Effective Thermal Conductivity of an Open-Porous-Type Foamed Glass. Constr. Build. Mater. 2019, 214, 337–343. [Google Scholar] [CrossRef]
- König, J.; Lopez-Gil, A.; Cimavilla-Roman, P.; Rodriguez-Perez, M.A.; Petersen, R.R.; Østergaard, M.B.; Iversen, N.; Yue, Y.; Spreitzer, M. Synthesis and Properties of Open- and Closed-Porous Foamed Glass with a Low Density. Constr. Build. Mater. 2020, 247, 118574. [Google Scholar] [CrossRef]
- Mucsi, G.; Csőke, B.; Kertész, M.; Hoffmann, L. Physical Characteristics and Technology of Glass Foam from Waste Cathode Ray Tube Glass. J. Mater. 2013, 2013, 696428. [Google Scholar] [CrossRef]
- Chindaprasirt, P.; Lao-un, J.; Zaetang, Y.; Wongkvanklom, A.; Phoo-ngernkham, T.; Wongsa, A.; Sata, V. Thermal Insulating and Fire Resistance Performances of Geopolymer Mortar Containing Auto Glass Waste as Fine Aggregate. J. Build. Eng. 2022, 60, 105178. [Google Scholar] [CrossRef]
- Østergaard, M.B.; Cai, B.; Petersen, R.R.; König, J.; Lee, P.D.; Yue, Y. Impact of Pore Structure on the Thermal Conductivity of Glass Foams. Mater. Lett. 2019, 250, 72–74. [Google Scholar] [CrossRef]
- Østergaard, M.B.; Petersen, R.R.; König, J.; Bockowski, M.; Yue, Y. Impact of Gas Composition on Thermal Conductivity of Glass Foams Prepared via High-Pressure Sintering. J. Non-Cryst. Solids X 2019, 1, 100014. [Google Scholar] [CrossRef]
- Øiseth, E.; Aabøe, R.; Hoff, I. Field Test Comparing Frost Insulation Materials in Road Construction. In Proceedings of the 13th International Conference on Cold Regions, Orono, ME, USA, 23–26 July 2006. [Google Scholar]
- Zhai, C.; Zhang, J.; Zhong, Y.; Tao, X.; Wang, M.; Zhu, Y.; Yeo, J. Producing Light, Strong Foam Glass under a Low Sintering Temperature with Insights from Molecular Simulations. J. Non. Cryst. Solids 2022, 582, 121447. [Google Scholar] [CrossRef]
- Zhai, C.; Yu, Y.; Zhu, Y.; Zhang, J.; Zhong, Y.; Yeo, J.; Wang, M. The Impact of Foaming Effect on the Physical and Mechanical Properties of Foam Glasses with Molecular-Level Insights. Molecules 2022, 27, 876. [Google Scholar] [CrossRef]
- Bianchi Janetti, M.; Plaz, T.; Ochs, F.; Klesnil, O.; Feist, W. Thermal Conductivity of Foam Glass Gravels: A Comparison between Experimental Data and Numerical Results. Energy Procedia 2015, 78, 3258–3263. [Google Scholar] [CrossRef]
- Păunescu, L.; Drăgoescu, M.F.; Axinte, S.M. High mechanical strength porous material used as a foam glass gravel experimentally manufactured from glass waste by an unconventional technique. Constructii 2020, 21, 54–62. [Google Scholar]
- Ochs, F. Modelling Large-Scale Thermal Energy Stores; University of Stuttgart: Stuttgart, Germany, 2009. [Google Scholar]
- Scarinci, G.; Brusatin, G.; Bernardo, E. Glass Foams. In Cellular Ceramics: Structure, Manufacturing, Properties and Applications; Wiley-VCH Verlag GmbH Co. KgaA: Weinheim, Germany, 2005; pp. 158–176. [Google Scholar]
- Dragoescu, M.F.; Sourcing, D.; Paunescu, L.; Sourcing, D.; Axinte, S.M.; Fiti, A.; Bucharest, C.A. Foam Glass with Low Apparent Density and Thermal Conductivity Produced by Microwave Heating. Eur. J. Eng. Technol. 2018, 6, 1–9. [Google Scholar]
- Perera, S.T.A.M.; Zhu, J.; Saberian, M.; Liu, M.; Cameron, D.; Maqsood, T.; Li, J. Application of Glass in Subsurface Pavement Layers: A Comprehensive Review. Sustainability 2021, 13, 11825. [Google Scholar] [CrossRef]
- Ižvolt, L.; Dobeš, P.; Holešová, M.; Navikas, D. Assesment of the Possibility of Foam Glass Application in the Sub-Ballast Layers. J. Civ. Eng. Manag. 2023, 29, 253–267. [Google Scholar] [CrossRef]
- Semenov, V.; Bessonov, I.; Zhukov, A.; Mednikova, E.; Govryakov, I. Thermal Insulation Systems for Road Bases with Foam Glass Gravel. Mag. Civ. Eng. 2022, 110, 11003. [Google Scholar] [CrossRef]
- Zegowitz, A. Cellular Glass Aggregate Serving as Thermal Insulation and a Drainage Layer. In Proceedings of the International Conference on Thermal Performance of the Exterior Envelopes of Whole Buildings XI, Clearwater, FL, USA, 5–9 December 2010. [Google Scholar]
- Ochs, F.; Heidemann, W.; Müller-Steinhagen, H. Effective Thermal Conductivity of Moistened Insulation Materials as a Function of Temperature. Int. J. Heat Mass Transf. 2008, 51, 539–552. [Google Scholar] [CrossRef]
- Rieksts, K.; Loranger, B.; Hoff, I.; Scibilia, E. In Situ Thermal Performance of Lightweight Aggregates Expanded Clay and Foam Glass in Road Structures. In Proceedings of the 18th International Conference on Cold Regions Engineering and 8th Canadian Permafrost Conference, Reston, VA, USA, 18–22 August 2019; pp. 440–446. [Google Scholar] [CrossRef]
- Bradette, M.; Segui, P.; Doré, G.; Côte, J. Foam Glass Aggregates: Thermal Properties According to Aggregate’s General Characteristics. In Proceedings of the 18th International Conference on Cold Regions Engineering and 8th Canadian Permafrost Conference, Reston, VA, USA, 18–22 August 2019; pp. 364–372. [Google Scholar] [CrossRef]
- Jasińska, I.; Dachowski, R.; Jaworska-Wędzińska, M. Thermal Conductivity of Sand-Lime Products Modified with Foam Glass Granulate. Materials 2021, 14, 5678. [Google Scholar] [CrossRef]
- da Silva Fernandes, F.A.; de Oliveira Costa, D.D.S.; Rossignolo, J.A. Influence of Sintering on Thermal, Mechanical and Technological Properties of Glass Foams Produced from Agro-Industrial Residues. Materials 2022, 15, 6669. [Google Scholar] [CrossRef]
- Ioana, A.; Paunescu, L.; Constantin, N.; Pollifroni, M.; Deonise, D.; Petcu, F.S. Glass Foam from Flat Glass Waste Produced by the Microwave Irradiation Technique. Micromachines 2022, 13, 550. [Google Scholar] [CrossRef] [PubMed]
- Emersleben, A.; Meyer, M. Sustainable Pavement Construction by the Use of Recycled Glass. Int. J. Geotech. Eng. 2014, 8, 436–440. [Google Scholar] [CrossRef]
- Ochs, F.; Müller-Steinhagen, H. Temperature and Moisture Dependence of the Thermal Conductivity of Insulation Materials; NATO Advanced Study Institute on Thermal Energy Storage for Sustainable Energy Consumption (TESSEC): Izmir, Turkey, 2005; pp. 1–5. [Google Scholar]
- Glass Powder Production. Energocell Company. Debrecen, Hungary. 2023. Available online: https://www.energocell.hu/en/glass-powder-production (accessed on 9 July 2023).
- ASTM D698-12(2021); Standard Test Methods for Laboratory Compaction Characteristics of Soil Using Standard Effort (12,400 ft-lbf/ft3 (600 kN-m/m3)). ASTM International: West Conshohocken, PA, USA, 2021.
- Rudtsch, S.; Buck, W. Thermal Properties. In Springer Handbook of Materials Measurement Methods; Springer Berlin: Heidelberg, Germany, 2006; pp. 399–429. [Google Scholar]
- Al-kroom, H.; Abdel-Gawwad, H.A.; Abd Elrahman, M.; Abdel-Aleem, S.; Saad Ahmed, M.; Salama, Y.F.; Qaysi, S.; Techman, M.; Seliem, M.K.; Youssf, O. Utilization of Foamed Glass as an Effective Adsorbent for Methylene Blue: Insights into Physicochemical Properties and Theoretical Treatment. Materials 2023, 16, 1412. [Google Scholar] [CrossRef] [PubMed]
- Abdel-Gawwad, H.A.; Mohammed, M.S.; Arif, M.A.; Shoukry, H. Reuse of Lead Glass Sludge in the Fabrication of Thermally Insulating Foamed Glass with Outstanding Properties and High Pb-Stabilization. Environ. Sci. Pollut. Res. 2022, 29, 47209–47224. [Google Scholar] [CrossRef] [PubMed]
- Galson, D.A.; Wilson, N.P.; Schärli, U.; Rybach, L. A Comparison of the Divided-Bar and QTM Methods of Measuring Thermal Conductivity. Geothermics 1987, 16, 215–226. [Google Scholar] [CrossRef]
- ASTM D5334-22; Standard Test Method for Determination of Thermal Conductivity of Soil and Soft Rock by Thermal Needle Probe Procedure. ASTM International: West Conshehoken, PA, USA, 2022.
- EN 12667:2001; Thermal Performance of Building Materials and Products. Determination of Thermal Resistance by Means of Guarded Hot Plate and Heat Flow Meter Methods. Thick Products of High and Medium Thermal Resistance. European Committee for Standardization: Brussels, Belgium, 2001.
- ISO 6946:2017; Building Components and Building Elements-Thermal Resistance and Thermal Transmittance. International Organization for Standardization: Geneva, Switzerland, 2017.
- ISO 10456:2007; Building Materials and Products—Hygrothermal Properties—Tabulated Design Values and Procedures for Determining Declared and Design Thermal Values. International Organization for Standardization: Geneva, Switzerland, 2007.
- Kumpel, C.J. Investigation of Compaction Characteristics of Subbase Material Using the Superpave Gyratory Compactor; Rowan University: Glassboro, NJ, USA, 2013. [Google Scholar]
- McGarvey, K.; Panko, M.; Hurt, C.; Mehta, Y.; Sukumaran, B. Use of the Superpave Gyratory Compactor as a Predictor of Field Performance of Unbound Material. In Proceedings of the FAA Worldwide Airport Technology Transfer Conference, Atlantic City, NJ, USA, 20–22 April 2010. [Google Scholar]
- ASTM D1557-12(2012); Standard Test Methods for Laboratory Compaction Characteristics of Soil Using Modified Effort (56,000 ft-lbf/ft3 (2700 kN-m/m3)). ASTM International: West Conshohocken, PA, USA, 2012.
- Swan, R.H.; Yeom, S.; Sjoblom, K.J.; Stark, T.D.; Filshill, A. Engineering Properties of Foamed Recycled Glass as a Lightweight Fill; American Society of Civil Engineers (ASCE): Reston, VA, USA, 2016; pp. 11–22. [Google Scholar]
- Steurer, A. Behavior of Foam Glass Aggregate under Static Loads. In Proceedings of the 22nd European Young Geotechnical Research, Gothenburg, Sweden, 26–29 August 2012; pp. 15–20. [Google Scholar]


Disclaimer/Publisher’s Note: The statements, opinions and data contained in all publications are solely those of the individual author(s) and contributor(s) and not of MDPI and/or the editor(s). MDPI and/or the editor(s) disclaim responsibility for any injury to people or property resulting from any ideas, methods, instructions or products referred to in the content. |
© 2023 by the authors. Licensee MDPI, Basel, Switzerland. This article is an open access article distributed under the terms and conditions of the Creative Commons Attribution (CC BY) license (https://creativecommons.org/licenses/by/4.0/).