Abstract
This paper presents a finite element analysis of the bi-directional orthogonal model, which incorporates individual crack strain separation and tracking. The objective of this research is to expand the current shear friction model to manage bi-directional cracking at any angle, allowing for a more universal model that can be applied to intricate structures and non-proportional loading cases. The proposed model was initially developed as a total strain-based model, with the assumption that crack strains are equivalent to total strains, but it was subsequently recalculated to improve accuracy by separating crack strains from total strains. Furthermore, a separate crack strain formulation was created to account for strains in the concrete’s uncracked portions and locked-in crack strains. The article then discusses the testing of various convergence methods and loading programs to achieve high convergence. Comparative analyses of the generalized shear friction model with other models for crack orientation, and loading cases similar to those of a reinforced concrete membrane, are also presented. The MATLAB program successfully applied the bi-directional cracking model for one finite element under a uniform cyclical strain state, using a secant stiffness formulation.
1. Introduction
The finite element analysis for reinforced concrete is primarily dependent on steel and concrete constitutive relationship development, out of which, cracked reinforced concrete behavior is accurately modeled. However, it is important to note that the task is not simple because the stress–strain relationship between the cracked concrete, reinforcing steel, as well as their interactions, are all non-linear. Issues may include reverse loading and unloading relationships for arbitrary loading, the tension stiffening effect within cracked concrete when modeling the reinforcement’s bond–slip behavior, as well as shear transfer using shear friction through a crack. These relationships have been studied, and it is important to choose accurate and robust modeling techniques for finite element analysis that are able to capture the desired behavior. Finite-element modeling ultimately aims to provide formulations that are stable, easily implemented, and computationally efficient, and results that are accurate and reasonable.
The analysis of finite element reinforced concrete membrane structures is faced with a number of issues that have not been fully developed. There are five types of shear stress–strain relationships commonly used in the finite-element analysis of reinforced concrete. The constant shear modulus method, also known as the shear retention factor (β), is inconsistent with all of the primary mechanical relationships. However, it is necessary for accurate shear models of cracked concrete, and therefore, it is used in many commercial finite-element programs [1]. Zhu et al. [2] proposed a smeared shear modulus that is a function of principal stresses and strains. The method assumes that principal stress and strain directions coincide, which simplifies the calculation. The model is computationally efficient, but it does not enforce the slip–separation relationship or recognize steel yielding. The Modified Compression-Field Theory (MCFT) is a shear stress model proposed by Vecchio et al. [3]. It uses a smeared secant shear modulus that is a function of principle stresses and strains. The model requires checking shear stress at crack locations, where shear stress is a function of crack width, aggregate interlock, and concrete strength. This is accurate when recognizing the locking of rough crack surfaces and the shear strength of cracked concrete. However, the MCFT does not allow shear slip or total shear stress along cracked surfaces, and it does not enforce the relationship between crack slip and crack separation. Vecchio et al. [4] proposed the Disturbed Stress Field Model (DSFM), which uses formulations to determine shear slip as a function of local shear stress, crack width, crack spacing, and cube strength. However, it does not enforce the fundamental relationship between crack slip and crack separation. This means that crack slip can occur without stressing the reinforcement, which negates the relationship between stress in the reinforcement and shear-friction. As a result, the amount of steel does not have a relationship between either strength or stiffness. Walraven [5] proposed a shear-friction theory for cracked reinforced concrete that is based on the locking of aggregate particles on a cracked surface. The theory takes crack width, slip, aggregate size, and geometry into account. The shear-friction force developed is related to the normal compressive force on the crack surface, and it is caused by tension in the reinforcement crossing the crack. However, the process providing sufficient behavior simulations under arbitrary loading conditions, like reverse-cyclical loading, are limited [6,7]. In addition, some essential material model sections do not capture cracked reinforced concrete behavior in an accurate manner [8]. The main issue is that most models are derived from experimental data fitting, rather than from basic physical principles. Mitchell et al. [9] have proposed an orthogonal shear friction model that uses a modified Newton–Raphson method (MNRM) formulation. There is an assumption that divergence is caused by total strains which are purely crack strains that are made within the model. This assumption disregards the fact that some of the strains might emanate from the concrete’s uncracked portions. The absence of slip shear stress in computing does not matter because the equation is thought to be the uncracked concrete equation τ12 = GγTotal. Slip limits cannot be accurately determined if they are calculated using total strains instead of crack strains. This can cause the model to become unstable and diverge. This shows that it is necessary to separate crack strains from total strains and then track them during the analysis process [10]. This paper proposes a new bi-directional shear friction model (BSFM) with crack strains that are separated. The paper then compares Vecchio models and the uniform shear modulus (βG) with BSFM using crack strain separation (CSS) model.
2. Research Significance
Two significant areas concern the bond–slip relationship between reinforcement and concrete for various types of loading, and an appropriate model for the shear strength and stiffness in cracked concrete. To robustly examine the convergence of the bi-directional cracked concrete model, this study focused on a new formulation for the bi-directional shear friction model using crack strain separation to improve the convergence of the bi-directional cracked reinforced concrete membrane.
3. Crack Opening Path Model
This is a model that is based on the slip–separation relationship and crack opening model which is a constitutive model that uses the affiliation between the crack friction coefficient, , and tension stress; it is typically used for crack separation and the crack surface. This coefficient differs from the traditional friction coefficient as its definition is relative to the crack opening path slope but not the crack surface. As a result, a regular friction coefficient is achieved rather than one which differs from the crack opening path slope. Dilatancy and friction effects are separated, thus making the friction coefficient nearly constant [11,12,13,14,15]. The friction coefficient definition leads to values that vary to a small extent in terms of slip. Furthermore, the definition enhances the computation of a friction coefficient for the two slip directions because it is difficult to push a block uphill in comparison with pushing it downhill. The friction coefficients, μdown and μup, are defined as crack opening path angle θ and distinct crack path friction coefficient μ′. Figure 1 shows the relationships of the coefficient of friction. μ′ = T/N and μ = V/P, where μ′ is the coefficient of friction relative to the surface of the hill and μ is the coefficient of friction corresponding to the applied forces, V and P. It is convenient to define the friction coefficient, μ, in terms of the friction coefficient relative to the crack opening path, μ′. Chorzepa et al. [14] provide the detailed crack formulation. Therefore, it is essential to define the key concepts of the crack strain separated model.
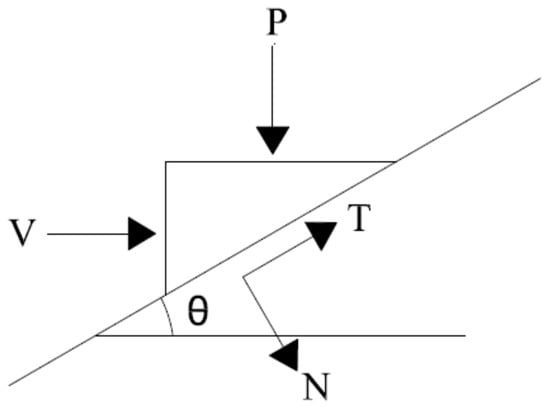
Figure 1.
Schematic of a block slipping “up the hill” at an inclination, θ.
4. Crack Strain Separated (CSS) Bi-Directional Shear Friction Model
The bilinear rectangular element is a key element of this model. It is a simple four-noded element with eight degrees of freedom, which allows it to translate horizontally and vertically. The boundary conditions, DOFs, and geometries of the model are all defined using this element [9]. The crack coordinate system remains as “1–2”, whereas the global coordinate system is in the “x–y” direction. The definitions of bi-directional cracking are similarly kept in such a way that the first crack can be formed out of the global coordinate system at angle θ. The direction of principal tension defines it. On the other hand, the second crack can be formed in a perpendicular direction to the first crack, thus making multiple crack coordinate systems unnecessary. The smearing of cracks and material properties occurs throughout the element. Crack strains are, however, considered to be unequal to the total number of strains, as only a single crack may be active at once. The model can now give an account of a locked-in crack slip. Integration of the linear crack opening path with the model is achieved with the aim of enforcing the slip–separation relationship. An effective strain may be defined as that which emerges from the crack opening path; it justifies the crack surface state. The enforcement of shearing stress limits crack surface slips. It also helps to define the crack’s shear stiffness because of friction.
MNRM enhanced the achievement of non-linear property convergence within the model [9]. There was pure shear loading from MNRM which was applicable to the vertical load. This was determined by applied displacements. A proportional load vector enforced pure shear loading, thus ensuring that a constant strain and stress state is maintained. More details on model definitions, like that of separated crack strain formulations, are presented in the following sections.
5. CSS Stress–Strain Formulations
The following formulations are aimed at defining stress–strain relationships, regarding crack strains, while maintaining the ability to formulate secant stiffness matrices based on the total number of strains analyzed. There is a similarity in terms of development between the total number of strains and a reasonable strain cracking simplification, which is considered when the slip is defined along the crack’s surface. The slip beside the crack was initially defined as the total shearing strain within the crack’s orientation, γ12. To separate the cracking shear strains, the total number of shear strains should be defined as follows:
where is the cracking shear strain and denotes the concrete shear strain with concrete shear modulus, (G). The crack’s locked-in slip can be justified by introducing the net shearing strain, γn. The calculation of the total shearing strain portion, which has not been previously locked in the crack, provides the net shearing strain, as illustrated in the following equation.
where γcrold is the previous converged value of the locked-in crack slip.
These definitions are only applicable to situations in which there is one crack direction. For the locked-in shear strain to be considered in two crack directions, it is important to consider the net shearing strain for two cracks (i.e., ), with the number representing the first or the second crack. As a result, the crack shear strain is allowed to be renewed for the active crack. Active crack would play a key role in defining the net shear strain, so that another crack shear strain can be obtained for the first crack. This implies that Equation (3) may define crack shear strain if either the first or the second crack is active. Individual crack strains, and the total number of strains, are currently separated from each other in the bi-directional shear friction model.
The effective strain concept is necessary for implementing the slip–separation relationship. In addition, effective strain is a very important element as it helps to define the crack surface state (i.e., compression or tension). The state of the crack enables the determination of shear friction behavior. However, there is a need to change effective strain formulas because the crack slip drives the crack opening path. It is important to note that effective strain must be incorporated into the crack shear strain and not the total shear strain. An effective strain is determined by subtracting the crack slip separation from the normal strain due to the crack, as shown in the following equation.
Normal concrete stress curves are defined using the effective strain. Positive effective strain values imply that the surface of the crack does not touch the crack. It ensures the existence of tension throughout the crack. On the other hand, negative effective strain values ensure the existence of compression throughout the surface of the crack. Normal concrete stress curves during periods of compression and tension should be equal as far as the bi-directional shear friction model is concerned. Equations should, however, be changed to incorporate include crack strain separation and the total number of strains. Equations (5) and (6), listed below, represent the normal concrete stress, which is formulated for crack one [14]. However, crack two equations may be obtained by replacing the equations of crack one with those of crack two for strain and stress notations.
(a) eε1 ≤ εcr (concrete cracking strain):
(b) eε1 > εcr:
5.1. Shearing Stress throughout the Crack during Periods of Compression and Tension
A bi-directional shear friction model was used to formulate shearing stress equations which separate the crack strains from the total number of strains. There are two main categories of shearing stresses: when the crack’s normal stress is compressive and when the crack’s normal stress is tense. The limits of shear friction, considered only when the crack is compressive, are also presented here. If the crack surface is determined to be tense, the shear stress is determined as follows, assuming that this is the shearing stress resisted by the dowel action of the reinforcement crossing the crack if either the first or the second crack is active in Equation (7).
There is some minimal stiffness when the cracks are not in contact with each other, and this may be thought of as a weak spring. The reformulation of normal stress equations when tension occurs throughout the crack can be achieved as shear stress has been defined. Equation (8) may be formulated in case of a positive shear strain, as follows:
For crack surfaces that are in contact with each other, when compression occurs throughout the crack, equations that have been presented in this section are used to determine the shear stress. The first and the second crack are represented by the following derivations, (γ12 < 0) and (γ12 > 0), for negative and positive shearing strains, respectively. There are three main cases that are usually considered, and whose derivations are presented in Table 1. The three cases are as follows: (a) the crack surface does not slip; (b) the crack surface slips downhill; and (c) the crack surface slips uphill. The non-slip equation is used to determine shear stress, τ12, in any shear strain, γ12. However, it is restricted by the highest (τa12) and lowest (τc12) shear stresses, as indicated by the following criteria:

Table 1.
Equations for Compression Across the Crack.
The upper and lower shear stress limits (τa and τc) denote the stress that is necessary for overcoming friction throughout the crack, thus initiating slip. The limits of shear stress for the two cracks help determine the crack that is active (τc1, τc2, τa1, and τa2). An active crack is usually the first crack to reach its limit as it is where the slip is first initiated, thus resulting in behavioral control.
5.2. Formulation of Secant Stiffness Matrix: Net Shearing Strain
The net shearing strain is the basis upon which normal and shear strains are formulated. This is achieved with the aim of separating crack strains from the total number of strains, thus enhancing the formulation of secant stiffness matrices which are divided into two major categories (i.e., crack one active and crack two active). E1 and E2 represent the concrete’s secant moduli when there are one and two crack directions. In addition, γn and the total shear strain, γ12, are pre-multiplied in the equations so that the stress equations can be written in terms of the aggregate strain.
5.2.1. Case One: Crack Direction 1 (Active)
After the formation of Crack 1, stiffness cases should be considered. For crack surfaces that are tense, the stress–strain relationship comprises a positive shearing strain and negative shearing strain, γ12, as illustrated in Table 2. However, the definition of a secant stiffness matrix is based on the various shear stress cases related to crack surfaces that are compressed. Normal stress and shearing stress equations can be presented in the matrix as well. Table 3 shows the cases for both the negative total shear strain (γ12 < 0) and positive total shear strain (γ12 > 0).
Table 2.
Secant Stiffness Matrices in Crack Direction 1 and 2 (Active) (the crack surface is tense).
Table 3.
Secant Stiffness Matrices in Crack Direction 1 (Active) (the crack surface is compressed).
5.2.2. Case Two: Crack Direction 2 (Active)
After the formulation of Crack 2, the following stiffness cases should be considered when Crack 2 is active. For the crack surface that is tense, the stress–strain relationship comprises a positive shearing strain and negative shearing strain, γ12, as illustrated in Table 2. However, the definition of the secant stiffness matrix is based on the various shear stress cases when the crack surface is compressed. Calculating the A, B, and C constants was achieved within the derivations of the cases of shear stress, as noted in the preceding section, as were the normal stress and shearing stress equations. Table 4 indicates the cases concerning both negative total shear strain (γ12 < 0) and positive total shear strain (γ12 > 0).
Table 4.
Secant Stiffness Matrices in Crack Direction 2 (Active) (the crack surface is compressed).
5.2.3. Active Crack Criteria
Only one established crack direction may be active at once, as previously stated. This makes it necessary to establish rational active crack criteria. The bi-directional shear friction model was newly formulated with the aim of separating crack strains from the total number of strains. However, there is a need to change some of the criteria that were previously established. The epsilon effective was used to determine whether the crack experienced compression or tension. The new effective strain formation, however, means that it is necessary to recognize the shear strain of the crack. It is hard to determine the shear strain of the crack until the right equation of the shear stress is determined. The newly established criteria for determining the crack state are as follows.
For tense crack surfaces, the following is used: . To provide a cracking shear stress solution, the following is used: The epsilon effective equation can be used in order to formulate the following equation.
The value obtained from Equation (9), shown above, is positive if the assumption that the conditions are tense is correct. However, if the assumption is incorrect, the value will be negative. In this case, the cracked surface is compressed. Once the value is determined, the active crack criterion is applied, as it is for the bi-directional shear friction model.
6. Results and Discussion
The bi-directional shear friction model’s CSS (Crack Strain Separated) formulation was used to analyze a single four-node component. The MATLAB Program was used to insert the Modified Newton–Raphson Method into the model’s CSS formulation [10]. Analysis was conducted using a single four-node rectangular component in the relative load vector. The concrete membrane’ measured 50.8 mm thick, 254 mm wide, and 254 mm tall with a shear retention factor, β′, of 0.05. Moreover, the compressive strength, f′c, of the concrete was approximately 41.4 MPa. The shear modulus, G, and elastic modulus, Ec, were 13.8 GPa and 27.6 GPa, respectively. The strength of the reinforcement yield was approximately 414 MPa, and the steel’s modulus elasticity, Es, was 206.8 GPa. Additionally, there was a horizontal and vertical reinforcement ratio of 2% and 0.5%, respectively. The concrete was pre-cracked, and the crack coordinates were placed at 45° away from the universal coordinate system. The friction coefficients, μdown, and μup, were 0.2 and 1.2, respectively, with a linear crack opening path inverse slope and a was set at 2.0. Additionally, the vertical load, v, was originally set at 8.9 kN.
The loading analysis effectively converged in a single direction and the solution diverged when unloading began. Figure 2, Figure 3 and Figure 4 indicate the CSS analysis results, with Figure 2 illustrating the total shear strain, γ12, and crack shear strain, γcr, versus the normal strain, ε1. This affiliation indicates a crack opening path and the relationship shows the crack opening path. For instance, when the normal strain is plotted again, the total shear strain exhibits two different slopes. Moreover, one slope was observed when the normal strain and crack shear strain (crack opening path) were plotted against each other, thus confirming that the crack opening path is enforced by crack shear strain. The concrete and crack shear strains that were plotted against the total shear strain are illustrated in Figure 3. At the start of the analysis, the state of the crack is in a “no slip” condition, and the crack shear strain remains zero as the concrete shear strain increases. Eventually, the crack surface begins to “slip up the hill” and the crack shear strain increases while the concrete shear strain moves toward zero. This enforces the idea that almost all strains in cracked concrete are crack strains.
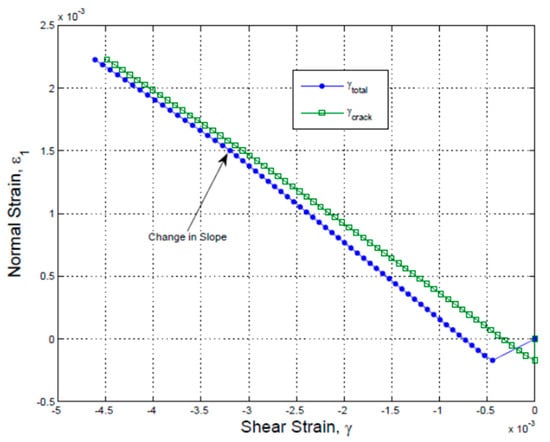
Figure 2.
Normal Strain vs. Crack Shear Strain and Total Shear Strain.
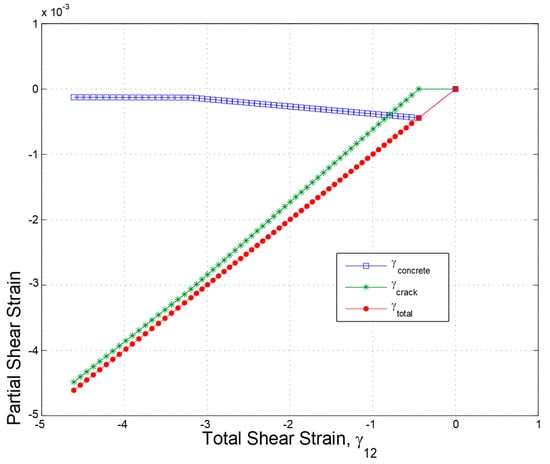
Figure 3.
Crack Shear Strain and Concrete Shear Strain vs. Total Shear Strain.
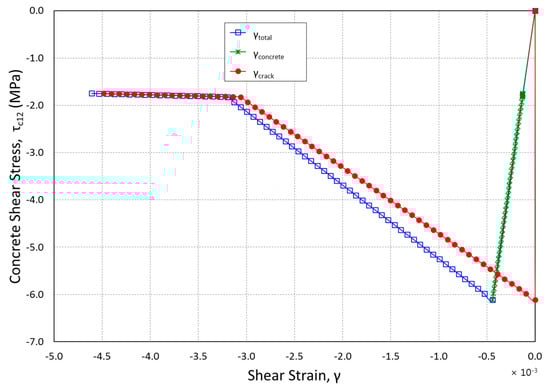
Figure 4.
Concrete Shear Stress vs. Total, Concrete, and Crack Shear Strains.
The concrete shear stress versus the concrete, crack, and total shear strains is illustrated in Figure 4. It is evident that the curve’s “no slip” portion (shear modulus, G) is only followed by concrete shear strains which reach the highest value at the onset of analysis, as shown in Figure 3. It then moves back to zero. According to the data presented in Figure 5, crack strains begin at point zero and they rise after the crack surface starts slipping. This is the point at which the shear strength starts becoming functional due to the shear friction that is created throughout the crack. Moreover, Figure 4 also shows that the additions of the concrete and crack shear strains are equal to the total number of shear strains, which verifies the relationship imposed by the CSS theory. Comparisons were made between the results obtained from the analysis of CSS and other models that are mostly used to model the stiffness of reduced shearing for cracked reinforced concrete, as shown in the following section.
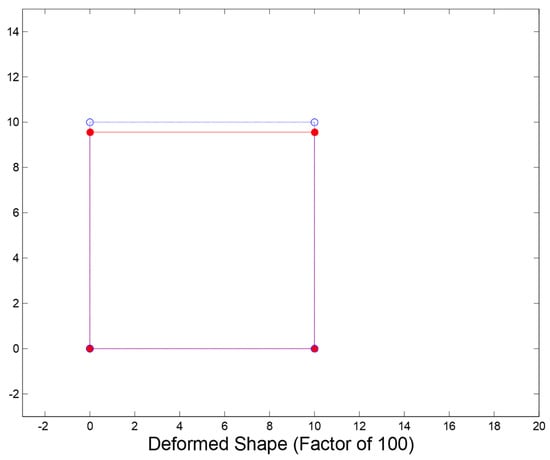
Figure 5.
Deformed Shape for zero prescribed displacement; CSS model (mm). The blue line represents the original, undeformed shape. The red line shows the deformed shape.
7. Comparison of MCFT and βG Models with CSS Results
The Crack Strain Separated analysis results were compared with the cracked reinforced concrete model results. It was found that the observed results were significantly different. MCFT (Modified Compression Field Theory), which was proposed by Vecchio [3], and basic βG models, were used in the comparison. The two modes have a similar tension stiffening curve and CSS analysis was used for the approximation of cracked concrete non-linear behavior. In addition, the models are secant stiffness formulations, including the Crack Strain Separated formulation. The reduced cracked concrete shear stiffness is handled using the basic βG model via the multiplication of the hear modulus, G, using a random factor, β, that is between 0 and 1. Vecchio’s [3] model changes the secant shear stiffness so that it becomes a secant stiffness value function for principal stress directions.
One component was subjected to analysis in a given group of loads under the control of a prescribed displacement, similarly to the crack strain separated analysis. The element was applied to an 80 kips constant vertical load and horizontal shear via the proportional load vector so as to make sure that the stress state is uniform. Reinforcement was applied to the global vertical and horizontal directions, with a vertical direction reinforcement ratio of 0.2%, and that of horizontal direction was 2%. Moreover, β in the βG model was set to 0.2. Poisson’s ratio was ignored for ease of implementation and interpretation of results. The stress strain and other material constant relationships were equal to the crack strain separation analysis. Initially, the model was analyzed with the prescribed DOF displacement set to zero. This occurred in order to initially determine the differences in behavior for a simple case. Figure 5, Figure 6 and Figure 7 show the deformed shape for the three models wherein zero prescribed displacement occurs. The open circles represent the position of the nodes that were not deformed, and the solid circles represent the deformed position of the nodes. The displacements are all given in inches and are multiplied by a factor of 100.
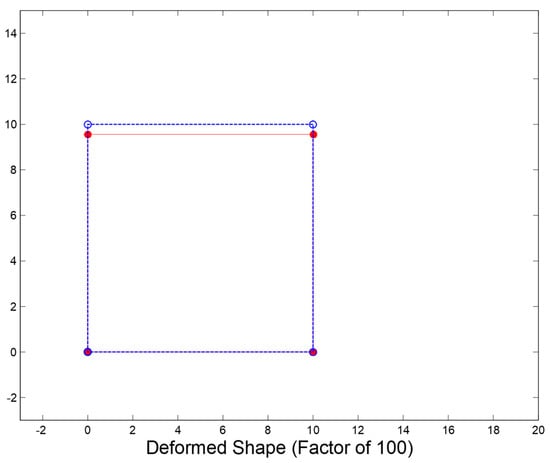
Figure 6.
Deformed Shape for zero prescribed displacement; Vecchio model (mm). The blue line represents the original, undeformed shape. The red line shows the deformed shape.
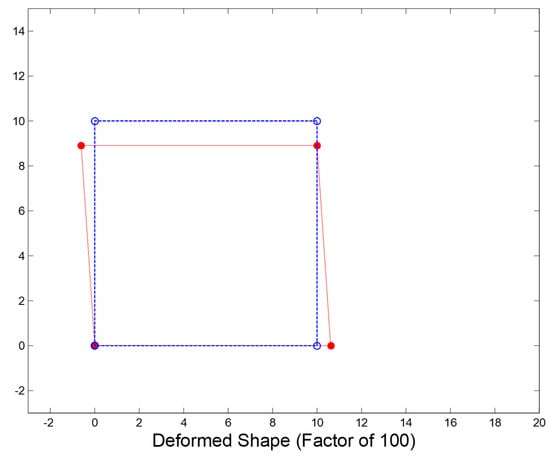
Figure 7.
Deformed Shape for zero prescribed displacement; βG model (mm). The blue line represents the original, undeformed shape. The red line shows the deformed shape.
Both the Vecchio and CSS models exhibit almost the same behavior, whereas the βG model’s results are very different. This is because of the effect of a false Poisson’s ratio which results from reduced shear stiffness. Researchers argue that elastic relationships between the elastic modulus, shear modulus, and Poisson’s ratio are violated by the reduced shear modulus. The rotation of the stiffness matrix to a global direction results in the production of a non-diagonal stiffness matrix even though Poisson’s ratio is ignored within the stiffness formulation of the crack orientation. If the elastic modulus, Poisson’s ratio, and shear modulus are elastically related, then rotating the diagonal stiffness matrix from the crack orientation to a global direction also produces a diagonal stiffness matrix. Therefore, the Vecchio and CSS models do not exhibit horizontal expansion. However, they exhibit vertical contraction which results from the compressive load. The state of the crack strain separated model is ‘no crack slip’. Therefore, the stiffness matrix within the crack orientation comprises the uncracked concrete’s full shear and elastic modulus. The Vecchio model is the same as the concrete’s elastic modulus when a specific loading state is not reduced; thus, the shear modulus can remain as the uncracked concrete’s true shear modulus. In addition, this is the reason why the Vecchio and CSS models’ results are almost identical with regard to the specific loading states.
A comparison was then made between the three models and the identical horizontal displacement sets. The element’s prescribed DOF in every model was increasingly displaced to approximately 1.524 mm. Figure 8, Figure 9, Figure 10, Figure 11, Figure 12 and Figure 13 present the three different models’ results with Figure 8 indicating the steel, concrete, and total shear stresses against the βG model’s total shear stress. The vertical load that was applied resulted in a large first step. One may realize that as the element is further displaced, the steel takes on more shear stress. Additionally, regarding displacement, the reduced shear modulus, βG, and slope is followed by the concrete. Furthermore, an increase in horizontal displacement results in the reduction of ‘slip’ or shear strain because the ratio of steel is higher in the horizontal direction compared with the vertical direction, as is evident by the deformed shape. The ultimate deformed shape had a prescribed displacement of 1.524 mm, and a value of 100, as shown in Figure 9.
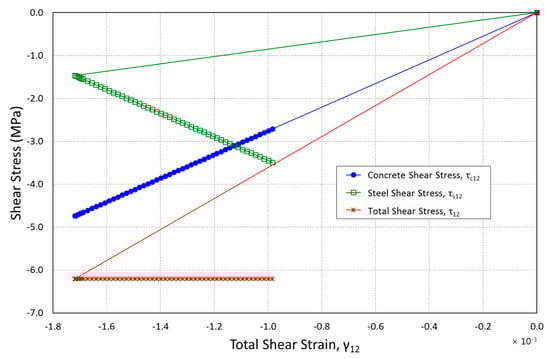
Figure 8.
Concrete, Steel, and Total Shear Stresses vs. Total Shear Strain; βG model.
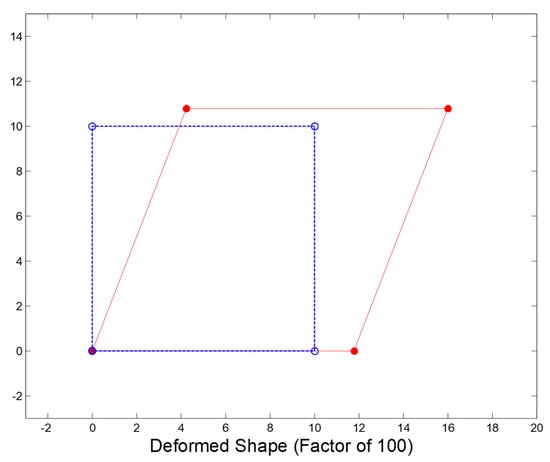
Figure 9.
Deformed Shape for a prescribed displacement of 1.524 (mm); βG model. The blue line represents the original, undeformed shape. The red line shows the deformed shape.
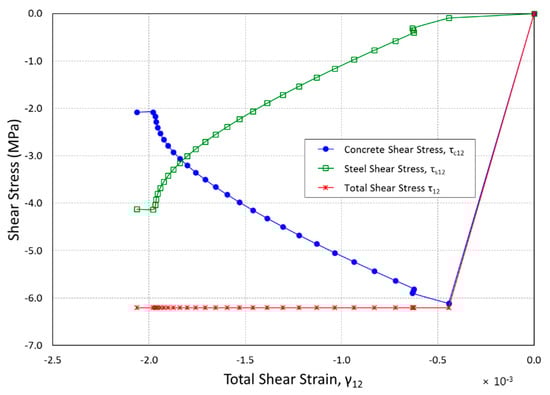
Figure 10.
Concrete, Steel, and Total Shear Stresses vs. Total Shear Strain; Vecchio model.
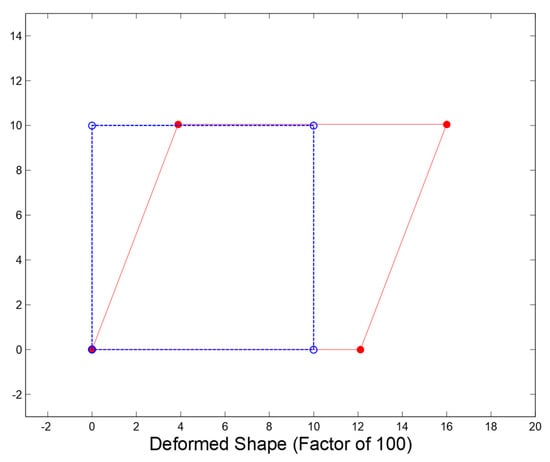
Figure 11.
Deformed Shape for a prescribed displacement of 1.524 (mm); Vecchio model. The blue line represents the original, undeformed shape. The red line shows the deformed shape.
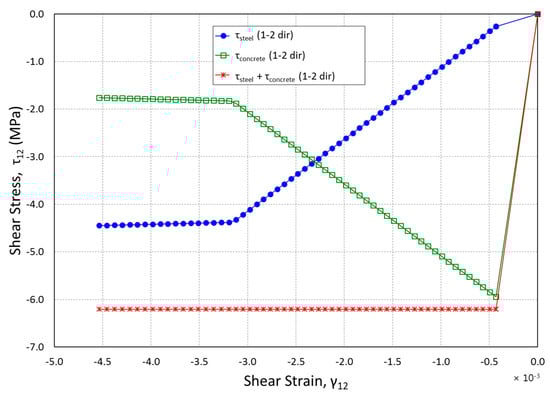
Figure 12.
Concrete, Steel, and Total Shear Stresses vs. Total Shear Strain; CSS model.
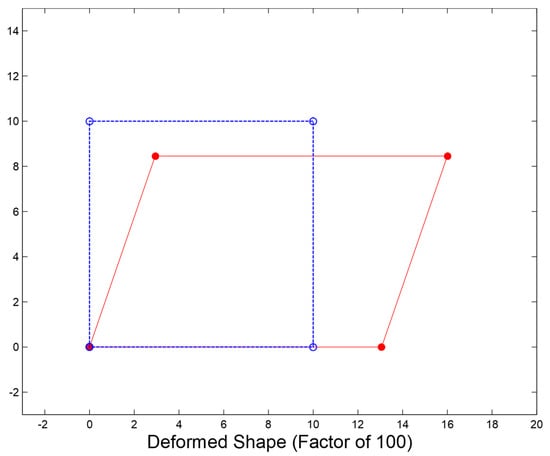
Figure 13.
Deformed Shape for a prescribed displacement of 1.524 (mm); CSS model. The blue line represents the original, undeformed shape. The red line shows the deformed shape.
Data obtained from the analysis of Vecchio is presented in Figure 10 and Figure 11, whereas the data obtained from the analysis of CSS is presented in Figure 12 and Figure 13. The comparison between Figure 10 and Figure 12 indicates some level of agreement between the shear stresses within the crack directions of the CSS and Vecchio models. Shear strains within the crack strain separated model are nearly two times that of the Vecchio model’s shear strains. Predicted displacements also differ, as is evident in the comparison between Figure 11 and Figure 13. Totally different results are generally produced by three different cracked reinforced concrete models. Figure 14 continues to present the differences between the three models, comparing every model’s prescribed displacement against the total shear stress, thus showing every model’s predicted shear stress versus the same displacements. The Vecchio and βG models evidently have the same maximum predicted shear stress whereas the crack strain separated shear stress is very low. It is also evident that steel yielded displacement varies depending on the model. This may be clearer when the curves’ slopes are smaller. The differences between the DOF’s vertical displacements varied greatly, even though the comparison of the prescribed DOF’s identical horizontal displacement results is shown in Figure 14. Comparing these results is critical in that the predicted design values differ significantly between fundamental load case models, like the one that may be seen by a shear wall. From the results, the establishment of a testing program that confirms the finite element models’ accuracy is necessary for the cracked reinforced concrete membranes that are frequently subjected to the loading pattern.
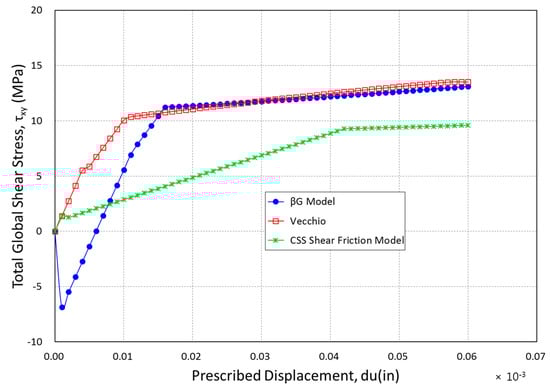
Figure 14.
Comparison of Global Shear Stress vs. Prescribed Displacement for βG; Vecchio and CSS models.
8. Conclusions
Models that use the CSS Model had the ability to capture some of reinforced concrete’s complex and unique behaviors. The models are unique in that they can help predict cracked reinforced concrete’s stiffness using rational physical behavior but not random constants. In addition, they can limit the shear strength as a reinforcing steel yielding function which is provided throughout the cracks based on recognized concrete behavior and ACI Building Code provisions [16]. The models are also capable of instigating the complex interaction between the reinforcing concrete and steel. This complex behavior is captured using a simple model.
- Formulation of CSS of the Bi-directional shear friction model had the ability to capture essential shear friction behaviors. Strains were successfully separated by the model because of the uncracked concrete and the cracks, thus resulting in increased accuracy in the overall model. The model can also handle various crack orientations.
- Comparing the CSS Model with other models such as the Modified Compression Field Model and basic βG models indicate that the level of inconsistency is very high. Predicted displacements and shear stresses varied greatly for the three models when compared. It was evident that every model showed varying interactions between the steel and the concrete because of the differences in the cracked concrete’s predicted stiffness.
- There are some elements that were examined using the three models. They were also subjected to horizontal shear and vertical compression. They had previously developed diagonal cracks. Reinforced concrete membrane loading can directly be applied to shear wall design and behavioral prediction.
Author Contributions
J.P.M. and Y.-J.K. conceived and formulated the equations and base model; J.P.M. and Y.-J.K. performed the base model with Matlab; J.P.M. and S.-U.C. analyzed the output data; J.P.M. and S.-U.C. contributed reagents/materials/analysis tools; J.P.M., S.-U.C., M.E.A. and Y.-J.K. wrote the paper. All authors have read and agreed to the published version of the manuscript.
Funding
This research was supported by Research Grant No. DGE-0538541 from the National Science Foundation.
Institutional Review Board Statement
Not applicable.
Informed Consent Statement
Not applicable.
Data Availability Statement
Data are contained within the article.
Acknowledgments
J.P.M. would like to thank the National Science Foundation for the GK-12. Fellowship that funded this research and provided invaluable experiences.
Conflicts of Interest
The authors declare no conflict of interest.
Abbreviations
| a | a parameter that defines the slope of the crack opening path |
| γtotal | the total shear strain |
| γ12 | the shear strain |
| γcr | the cracking shear strain |
| γc | the concrete shear strain |
| γcrold | the previous converged value of locked-in crack slip |
| γn | the net shearing strain |
| γn(1 or 2) | the net shearing strain in the first or second direction |
| γ12old | the previous converged value of shear strain |
| eε | the effective concrete crack strain |
| eε1 or 2 | the effective concrete crack strain in the first or second direction |
| ε1 or 2 | the concrete crack strain in the first or second direction |
| μup | the friction coefficient defined relative to the crack surface in the uphill direction |
| μdown | the friction coefficient defined relative to the crack surface in the downhill direction |
| σ1 | the concrete stress in the first direction |
| σ2 | the concrete stress in the second direction |
| τ12 | the shear stress |
| τa12 | the minimum shear stress |
| τb12 | the outside upper limit shear stress |
| τc12 | the maximum shear stress |
| fcr | the concrete crack stress |
| Ec | the modulus of elasticity of concrete |
| E1 or 2 | the secant modulus of concrete in the first or second direction |
| G | the concrete shear modulus |
| β′ | the dowel action shear retention factor |
| β | a random factor that is between 0 and 1 |
| V and P | the applied forces |
| T and N | the normal forces |
References
- So, M. Total-Strain Based Bond/Slip and Shear/Friction Membrane Model for Finite Element Analysis of Reinforced Concrete. Ph.D. Thesis, Washington University in St. Louis, St. Louis, MO, USA, 2008. [Google Scholar]
- Zhu, R.R.H.; Hsu, T.T.C.; Lee, J.Y. Rational Shear Modulus for Smeared-Crack Analysis for Reinforced Concrete. ACI Struct. J. 2001, 98, 443–450. [Google Scholar]
- Vecchio, F.J.; Collins, M.P. The Modified Compression-Field Theory for Reinforced Concrete Elements Subjected to Shear. ACI Struct. J. 1986, 83, 219–231. [Google Scholar]
- Vecchio, F.J. Reinforced Concrete Membrane Element Formulations. J. Struct. Eng. 1990, 116, 730–750. [Google Scholar] [CrossRef]
- Walraven, J.C. Rough Cracks Subjected to Earthquake Loading. J. Struct. Eng. 1994, 120, 1510–1524. [Google Scholar] [CrossRef]
- Palermo, D.; Vecchio, F.J. Simulation of Cyclically Loaded Concrete Structures Based on the Finite-Element Method. J. Struct. Eng. 2007, 133, 728–738. [Google Scholar] [CrossRef]
- Stevens, N.J.; Uzumeri, S.M.; Collins, M.P.; Will, G.T. Constitutive Model for Reinforced Concrete finite Element Analysis. ACI Struct. J. 1991, 88, 49–59. [Google Scholar]
- Pang, X.B.; Hsu, T.T.C. Behavior of Reinforced Concrete Membrane Elements in Shear. ACI Struct. J. 1995, 92, 665–677. [Google Scholar]
- Mitchell, P.J.; Cho, B.Y.; Kim, Y.J. Analytical Model of Two-Directional Cracking Shear-Friction Membrane for Finite Element Analysis of Reinforced Concrete. Materials 2021, 14, 1460. [Google Scholar] [CrossRef] [PubMed]
- Mitchell, P.J. Two-direction Cracking Shear-Friction Membrane Model for Finite Element Analysis of Reinforced concrete. Master’s Thesis, Washington University in St. Louis, St. Louis, MO, USA, 2010. [Google Scholar]
- Harmon, T.G.; Ramakrishnan, S.; Wang, E.H. Confined Concrete Subjected to Uniaxial Monotonic Loading. J. Eng. Mech. 1998, 124, 1303–1309. [Google Scholar] [CrossRef]
- Kim, Y.J.; You, B.; Sriraman, V.; Kotwal, A. Confined Concrete with Variable Crack Angle-Part I: Analytical Model. Mag. Concr. Res. 2014, 66, 1075–1083. [Google Scholar] [CrossRef]
- Kim, Y.J.; Sriraman, V.; Kotwal, A.; You, B. Confined Concrete with Variable Crack Angle-Part II: Shear Friction Model. Mag. Concr. Res. 2014, 66, 967–974. [Google Scholar] [CrossRef]
- Chorzepa, M.; Kim, Y.J.; Yun, G.J.; Harmon, G.T.; Dyke, S. Cyclic Shear-Friction Constitutive Model for Finite Element. ACI Struct. J. 2011, 108, 324–331. [Google Scholar]
- Mattock, A.H.; Hawkins, N.M. Shear Transfer in Reinforced Concrete−Recent Research. PCI J. 1972, 17, 55–75. [Google Scholar] [CrossRef]
- ACI 318-08; Building Code Requirements for Structural Concrete and Commentary. American Concrete Institute: Farmington Slopes, MI, USA, 2005.
Disclaimer/Publisher’s Note: The statements, opinions and data contained in all publications are solely those of the individual author(s) and contributor(s) and not of MDPI and/or the editor(s). MDPI and/or the editor(s) disclaim responsibility for any injury to people or property resulting from any ideas, methods, instructions or products referred to in the content. |
© 2023 by the authors. Licensee MDPI, Basel, Switzerland. This article is an open access article distributed under the terms and conditions of the Creative Commons Attribution (CC BY) license (https://creativecommons.org/licenses/by/4.0/).