Article

Train-Induced Vibration Prediction and Control of a Metro Depot and Over-Track Buildings

1
Key Laboratory of Urban Underground Engineering of Ministry of Education, Beijing Jiaotong University, Beijing 100044, China
2
School of Civil Engineering, Beijing Jiaotong University, Beijing 100044, China
3
National Engineering Research Center for Digital Construction and Evaluation Technology of Urban Rail Transit, China Railway Design Corporation, Tianjin 300308, China
*
Author to whom correspondence should be addressed.
Buildings 2023, 13(8), 1995; https://doi.org/10.3390/buildings13081995
Submission received: 29 May 2023 / Revised: 17 July 2023 / Accepted: 2 August 2023 / Published: 4 August 2023
(This article belongs to the Special Issue Acoustics and Noise Control in Buildings)

Abstract

:
To predict and control the train-induced vibration in depot buildings, a case study of the depot of Tianjin Metro, Line 5, was conducted. The platform of the depot has been constructed and is in use, and the construction of over-track buildings has not been completed. Firstly, an in situ measurement was performed to obtain the train loads and validate the numerical model. Secondly, a finite element model of the track–soil–depot structure was established. The train was simplified as a series of two spring-mass models and the train load was simulated using the measured rail acceleration. The calculated results were validated by the measurement data. To predict the vibration responses of the over-track building to be built, a sub-system of the over-track building was added to the numerical model. Finally, the vibration control effect of vibration isolation bearings was discussed. The results indicate that vibrations exceeded guideline limits without mitigation measures in some rooms of the over-track building. The dominant frequency of the building floors is 31.5 Hz. Vibration isolation bearings effectively mitigated the vibrations, and the IL reached approximately 7–15 dB at about 31.5 Hz.

1. Introduction

Recently, metro lines and their depots have gradually increased with the continuous development of urban rail transit. A metro depot is a place for vehicle operation management, parking, and maintenance, located in city suburbs and occupying a large area. As cities continue to grow rapidly, these depot areas have become integral parts of urban centers, presenting significant property development potential if the ground and area above the space can be fully utilized. The intensive development of urban space is an efficient use of land resources [1]. However, metro depots are characterized by complex track lines, turnouts, and track joints, which have drawn increasing attention to the issue of train-induced vibrations [2,3,4,5,6]. In the traditional ground vibration problem induced by underground metro trains, the soil layers play a crucial role in attenuating vibrations [7]. However, the vibration is directly transferred from the trackbed to the superstructures with higher vibration intensity and complex vibration spectra. The train-induced building vibrations and structural-borne noise can annoy the people who live or work in the over-track buildings [8]. Therefore, accurately predicting the vibration responses of superstructures and implementing effective vibration reduction measures are necessary to enhance the vibration comfort of these structures.
To learn the vibration characteristics of metro depots, many experimental studies have been performed recently. Zou et al. [9,10] conducted vibration measurements on over-track buildings in an operation depot and test line area, revealing amplified vibration responses within the natural frequency band of the structures. Cao et al. [11] conducted vibration measurements on an elevated mode depot and seven-story over-track residential buildings and investigated the effects of train speed and line location on vibration propagation. Liang et al. [12] performed a detailed on-site measurement to analyze the source and transmission characteristics of train-induced vibrations. Liao et al. [13] performed a field test of over-track buildings in China and used the exposure–response curve to analyze the impact of vibrations on occupants’ comfort. Recently, the measurement results were also employed to develop a data-driven cascaded state–space model, enabling the prediction of building vibrations in planned over-track buildings [14].
For to-be-built over-track buildings, the prediction is especially significant. Generally, the simplified impedance model and numerical method, e.g., finite element (FE) method [15], finite difference method [16], finite element–boundary element coupling method [17], and finite element–infinite element coupling method [18] have proven effective and appropriate for analyzing proposed buildings’ vibration problems. To improve calculation efficiency and gain a better understanding of vibration transmission characteristics, a simplified impedance-based model was established by Sanayei et al. [19,20], and was developed by Zou et al. [21,22]. Tao et al. [23] also proposed a method to predict vibration transmission from columns into girders and subsequently into floors. This model was also employed for predicting train-induced floor vibrations and structure-borne noise.
To mitigate the adverse effects of environmental vibration from rail transit, numerous studies have investigated vibration reduction measures in three aspects: vibration source [24,25], propagation path [26,27], and receiver [28,29]. However, these studies mainly focus on the traditional environmental vibration problems induced by underground metro trains in a tunnel. Regarding over-track buildings, Takei et al. [30] proposed a new building structural system adopting laminated rubber bearings that are softer in the vertical direction than general ones for the middle story of over-track buildings. Their research indicated that the train-induced vibration was reduced by using model experiments and numerical analysis. Zou et al. [31] confirmed the vibration isolation effect of the open trench, filled trench, and combined open and filled trench vibration isolation barriers on the over-track building on the test vehicle line by establishing a three-dimensional finite element model. Yang et al. [32] employed a base isolation measure that installed steel springs between the superstructure and the base, showing an effective reduction in excessive building vibrations. Zhou et al. [33,34] investigated the compression behavior and mechanical properties of thick rubber bearings used in over-track buildings.
This study focuses on a metro depot situated in Tianjin, China, whose platform has been built and is in use. According to the plan, a 12-story shear wall over-track building will be built. As the vibration induced by metro trains transmits directly through the structure to the building, without passing through the soil layer, the existing research results on the vibration impact of the adjacent buildings cannot be directly applied to this project. Therefore, it is necessary to analyze the vibration effect on the over-track building to ensure the indoor vibration meets the requirements of Chinese specifications. In addition, some vibration-reducing measures should be implemented if the vibration response exceeds the standard limits. In this paper, a field vibration measurement was performed at the depot to gather the vibration response characteristics of the depot. Then, a coupling model of track–soil–depot–building was established. The measured data were used to generate the train loads and verify the model, and detailed architectural parameters and physical properties were incorporated into the simulation of the building structure, which can accurately predict the vibration response. In addition, the vibration control effect of vibration isolation bearings was discussed. As the over-track structure in this study is relatively typical, the research results can be used in similar projects.

2. Vibration Measurement in Depot

2.1. Project Condition

The project is bounded by the top head platform, and the upper section of the platform is the over-track buildings area, as shown in Figure 1. The planned total land area is 1,330,000 m2 and will be constructed in phases. The primary construction covers an area of 240,000 m2, including the metro train maintenance depot, comprehensive maintenance depot, throat area, train entrance/exit section line, and accessory room, as shown in Figure 2. The primary implementation platform is on a total construction area of approximately 188,000 m2, including residential buildings covering around 120,000 m2. The second phase of implementation includes commercial buildings along the street, high-rise office buildings, hotels, apartments, and residential buildings covering the depot, car storage, bicycle storage, equipment rooms, warehouses, etc. To facilitate the development of the residential buildings on the top head platform, the operation depot will be divided into nine monoliths using deformation joints, allowing for the construction of 13 high-rise residential buildings with 12 or 18 floors.
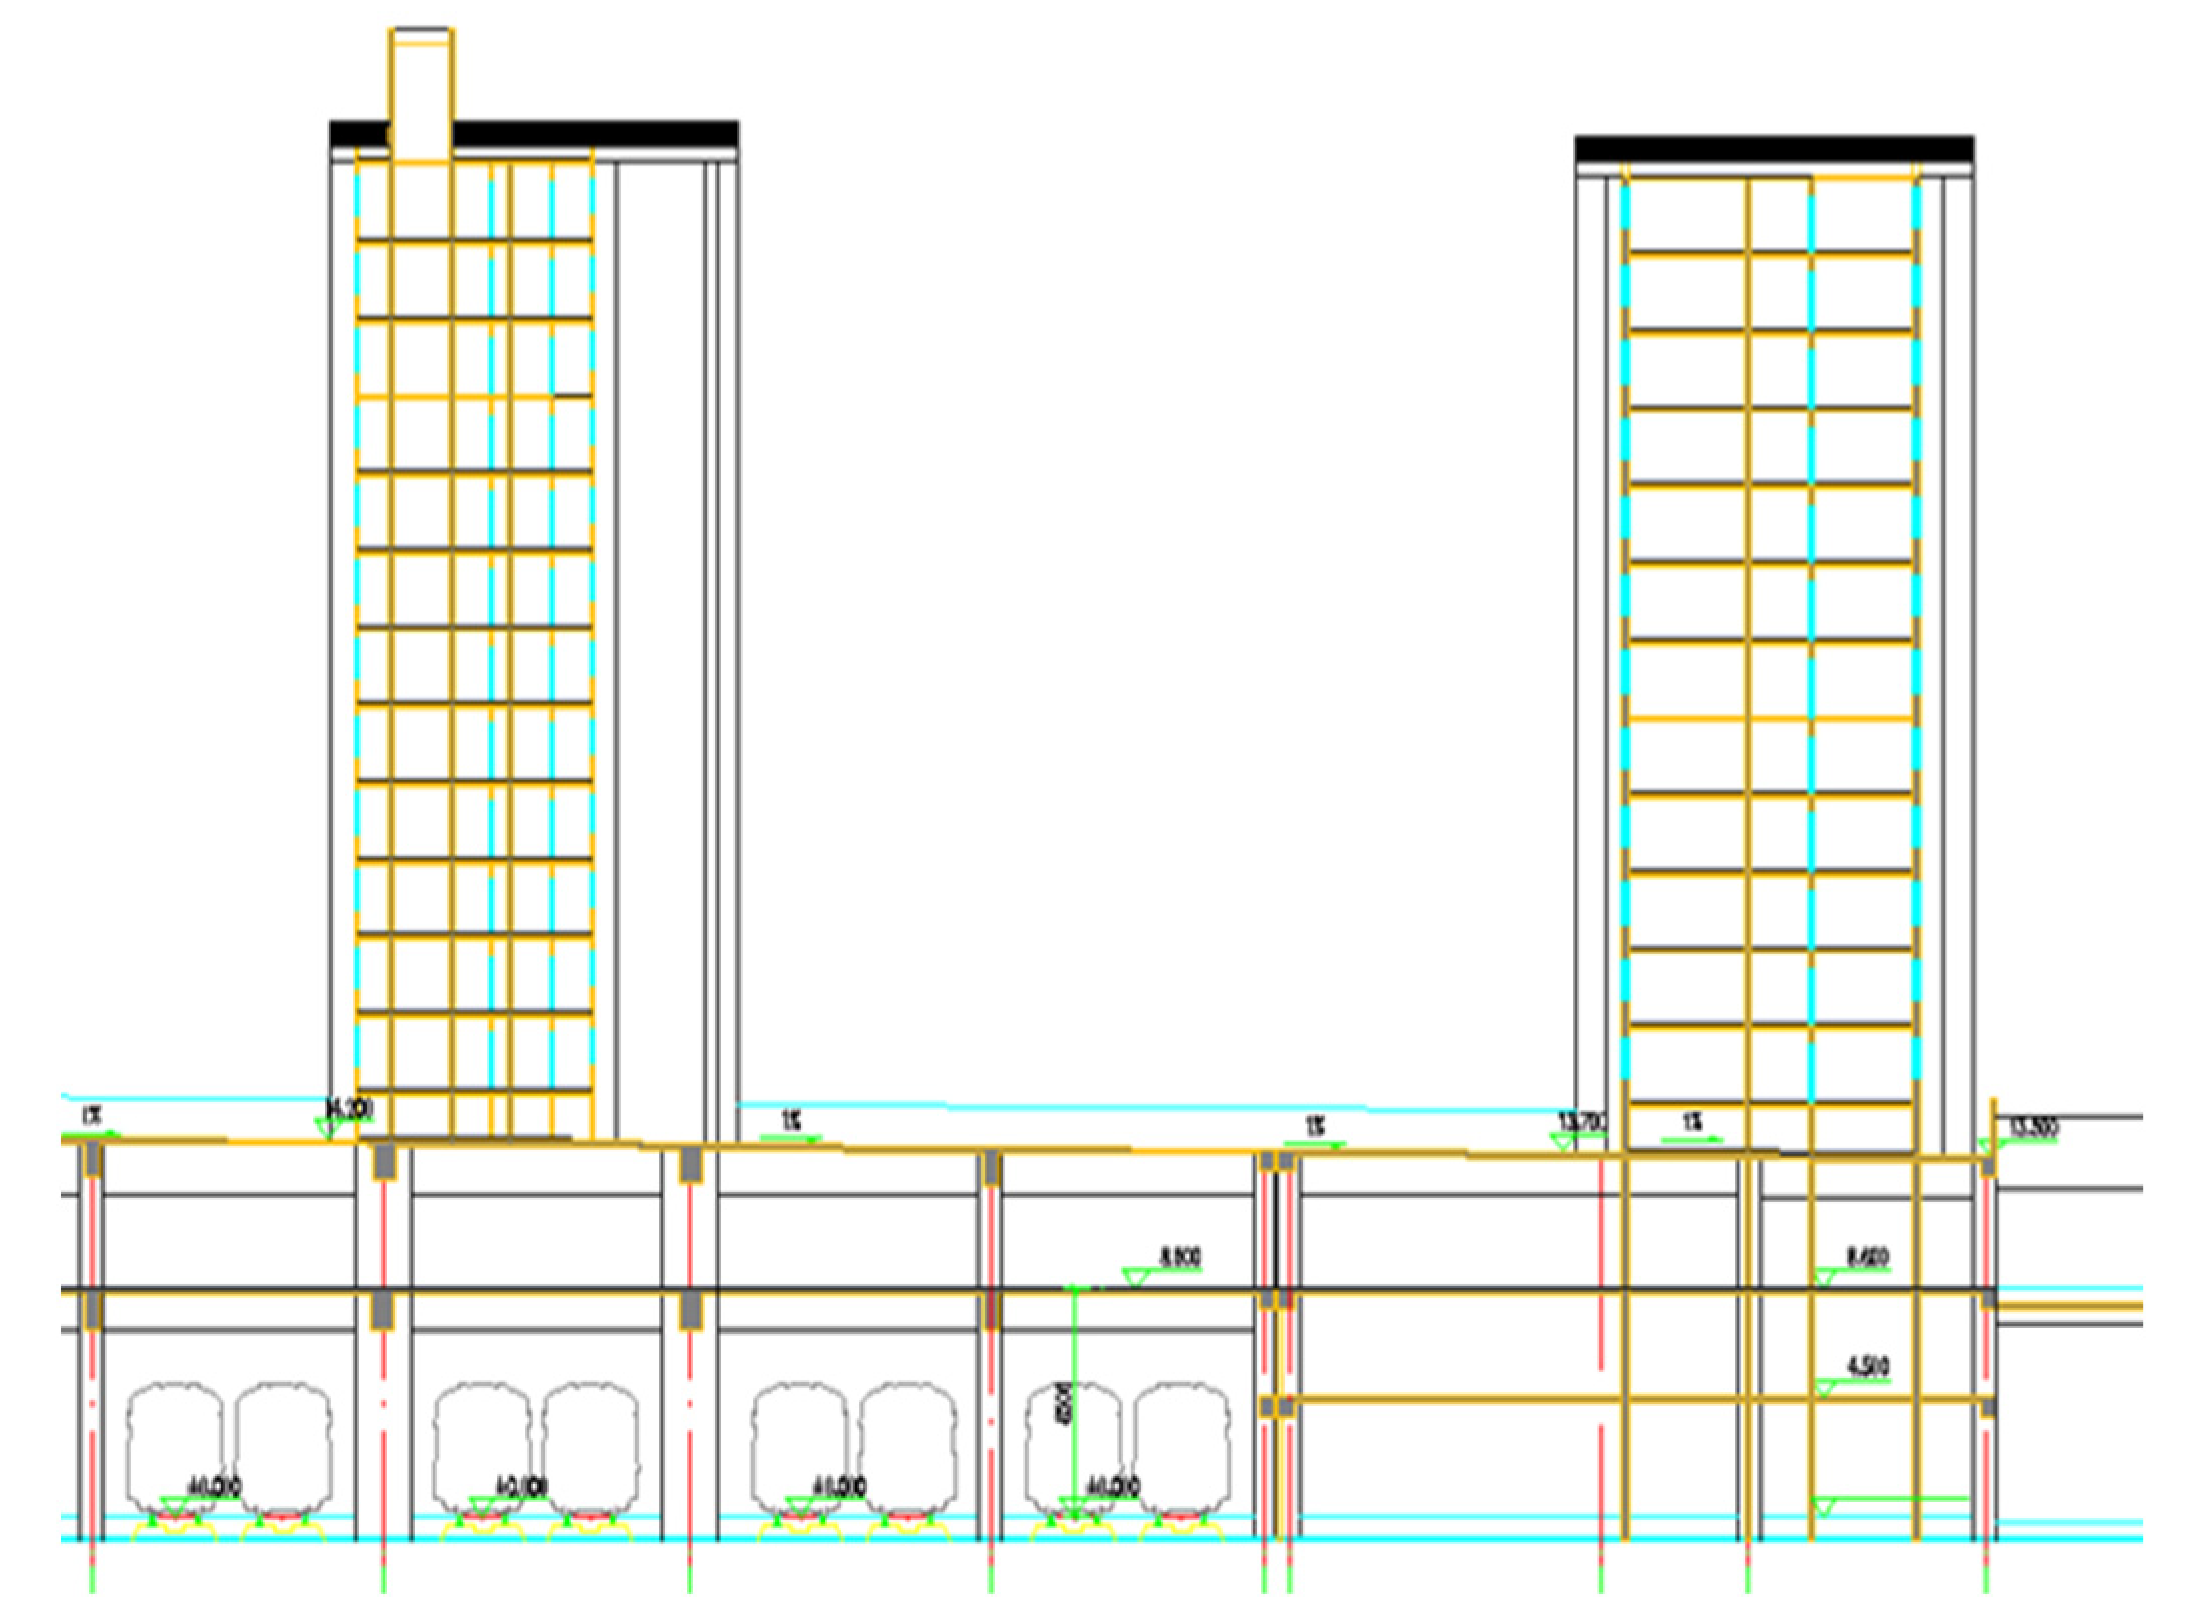
To analyze the vibration impact of the superstructure caused by trains in the depot before the building construction, a dynamic finite element (FE) model was established for a typical 12-story shear wall structure located on the top head platform. The section of the residential building is illustrated in Figure 3.

2.2. Measurement Point Arrangement

The vibration measurement was carried out on the operation depot and its top head platform. There were two main purposes of the measurement: obtaining train loads through measured acceleration on the rail, and validating the propagation law and verifying the numerical model through responses on the column and platform. Accordingly, the vibration sensors were arranged on the rail, the column of the operation depot, and the top head platform surface, as shown in Figure 4.
The INV306 (F) dynamic data acquisition analyzer and piezoelectric acceleration sensor types MN9824, MN9828, and 941B were adopted for the vibration measurements on the rail, column, and top head platform, respectively. An unattended intelligent collection system was employed, capable of automatically judging, collecting, and storing data according to predefined procedures.
The depot had CHN50 rails and type DTVI2 fasteners with the equivalent stiffness and damping of 7.8 × 10⁷ N/m and 5.51 × 10⁴ Ns/m, respectively. The operating trains were six Metro B-type vehicles with a total length of approximately 120 m. The train speed when entering and exiting the depot was relatively low, approximately 5 km/h. The measurement sampling frequency was 5120 Hz, and the measurement recorded the vertical acceleration of the rail during the passage of a single train, as well as the vertical and horizontal acceleration of the column and top head platform.

2.3. Measurement Result

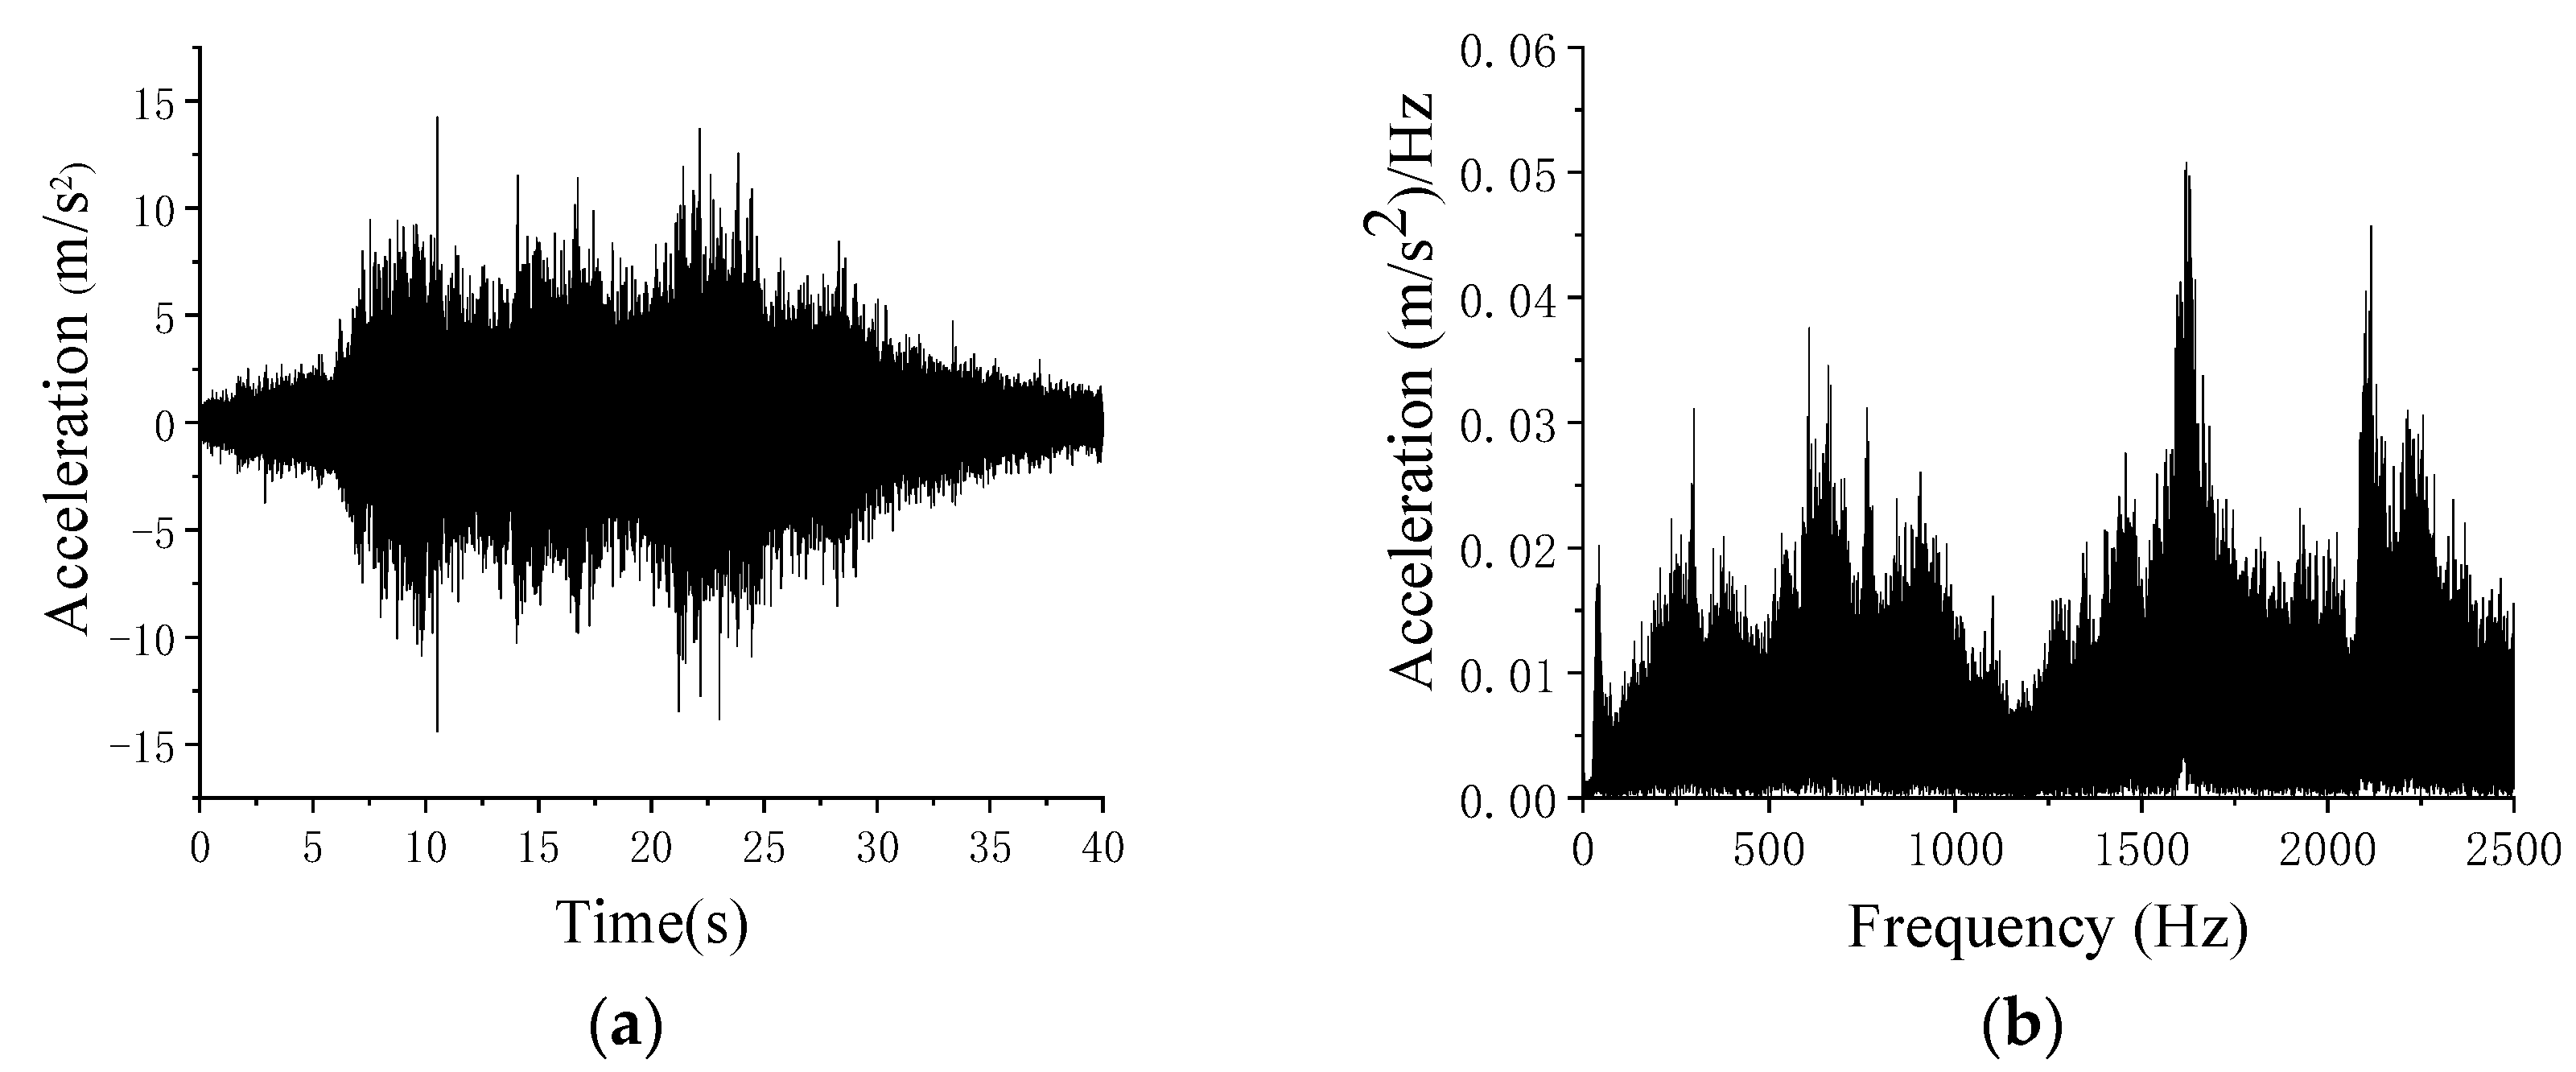
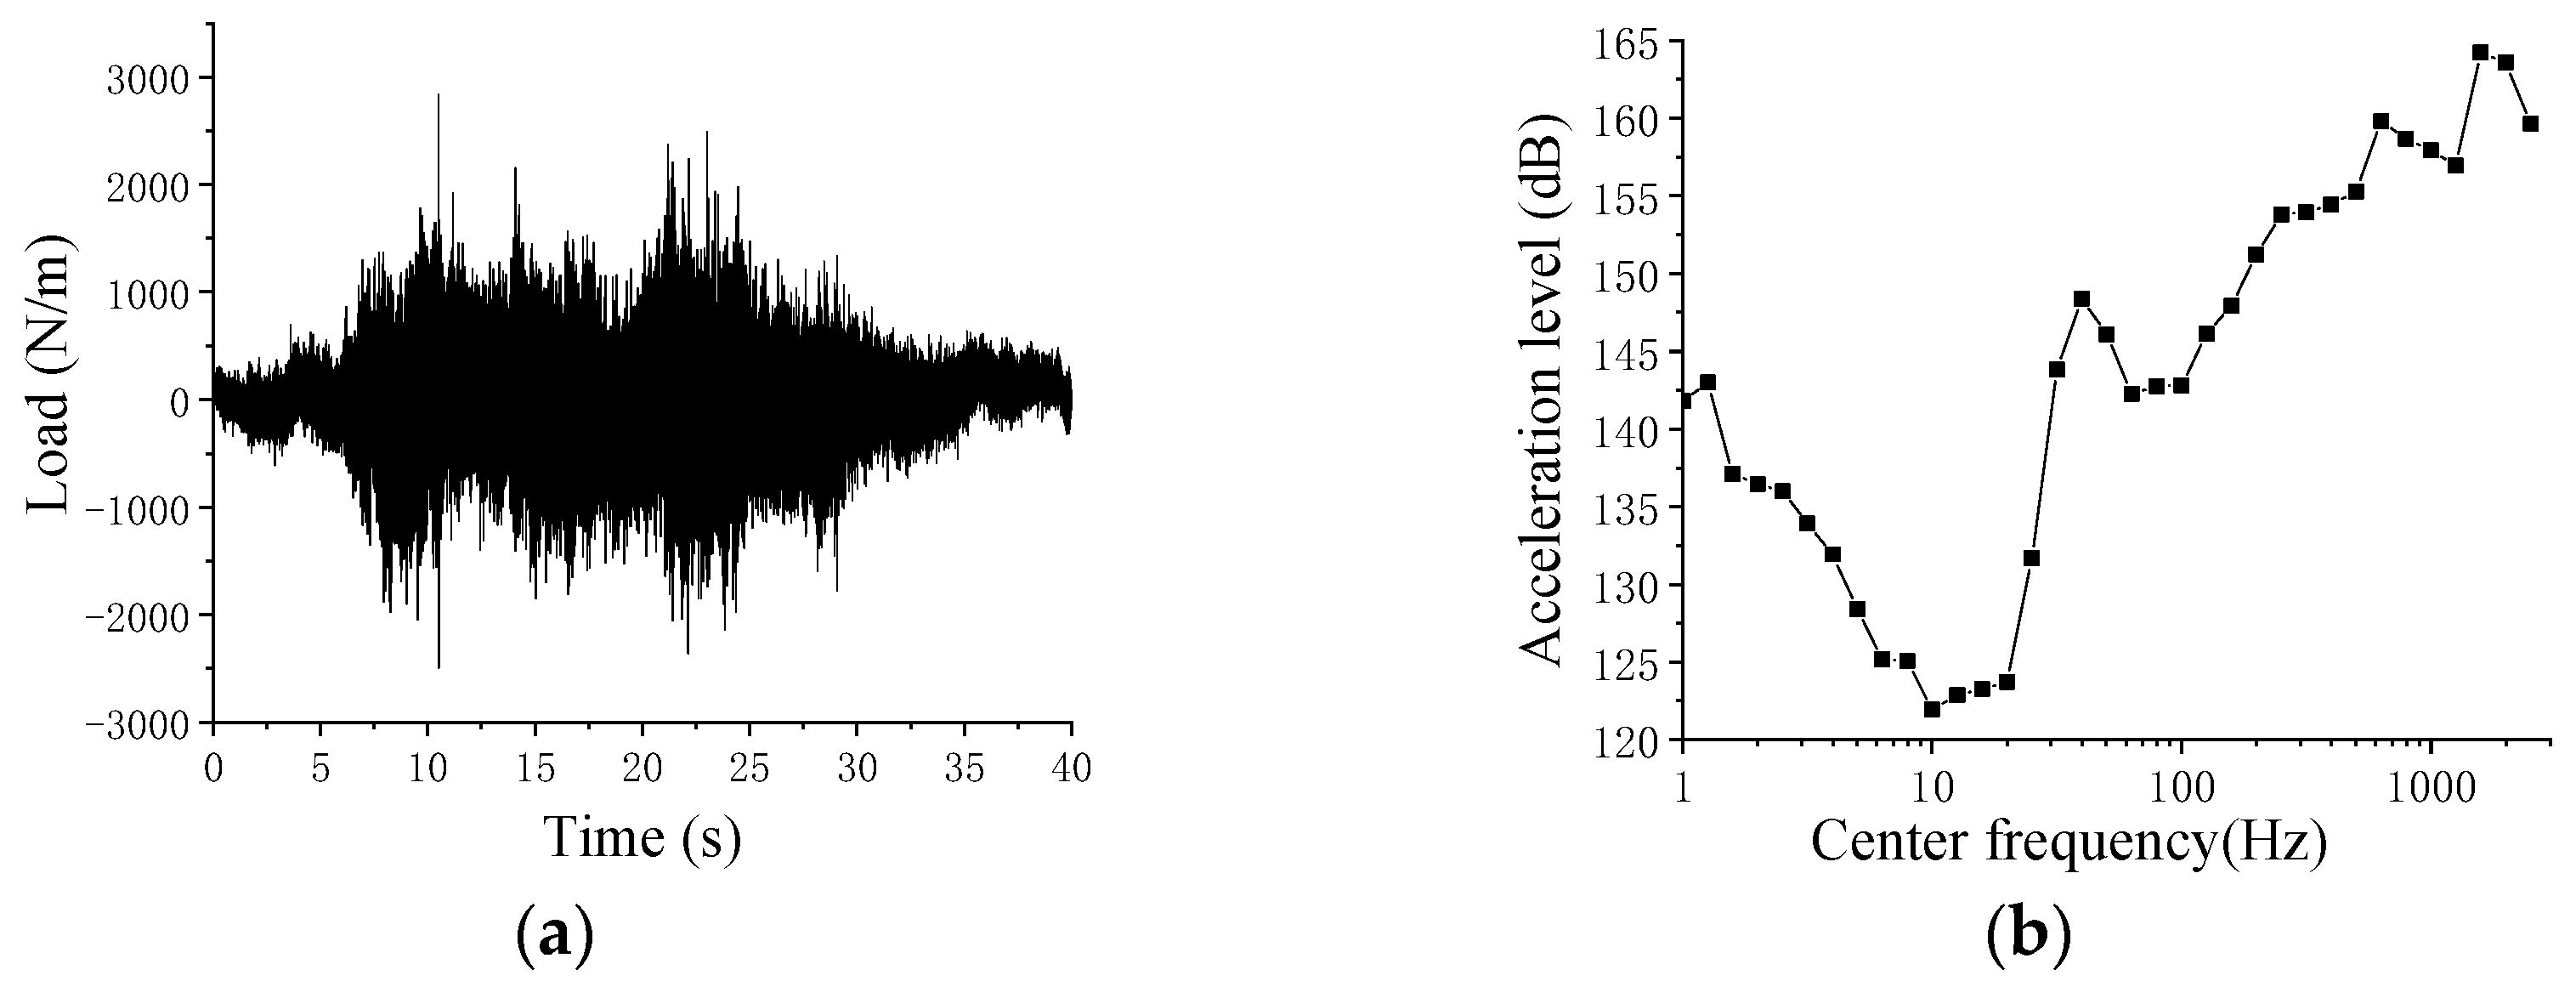
The acceleration time history and Fourier spectrum of vertical rail vibrations are shown in Figure 5. It can be observed that the peak value of the rail acceleration is around 15 m/s2. A series of peaks can be observed in the time histories, which are considered a result of the impact between the wheel and rail joints. The vertical acceleration vibration peak values on the rail repeat as the frequency increases, with the maximum value occurring at approximately 1600 Hz.
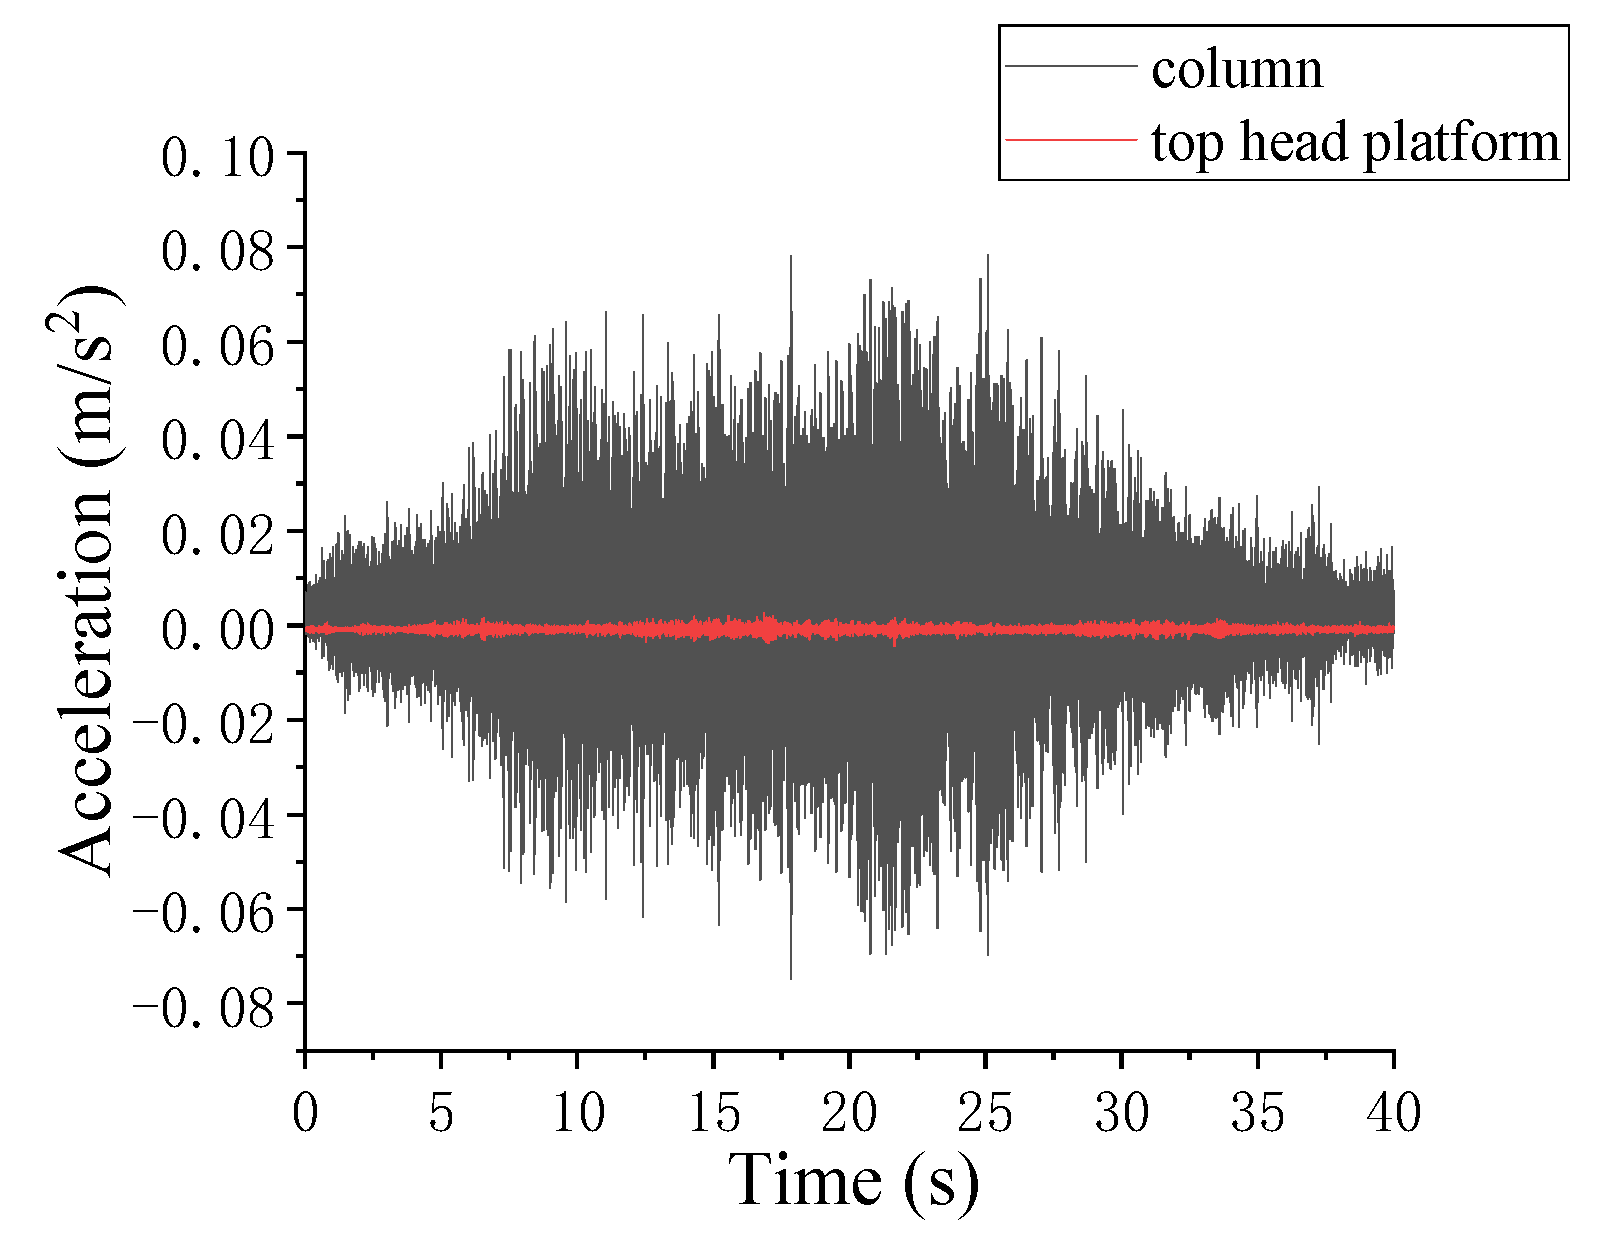
The acceleration time history of the vertical column and top head platform vibrations are shown in Figure 6, where the black and red lines represent the response of the column and the platform, respectively. It can be observed that the peak value of vibration acceleration in the column is significantly higher than that of the top head platform. Then, the peak values of vibration acceleration in the column and top head platform are noticeably lower than that on the rail. The vibration generated by the vibration source gradually weakens during the transmission process.
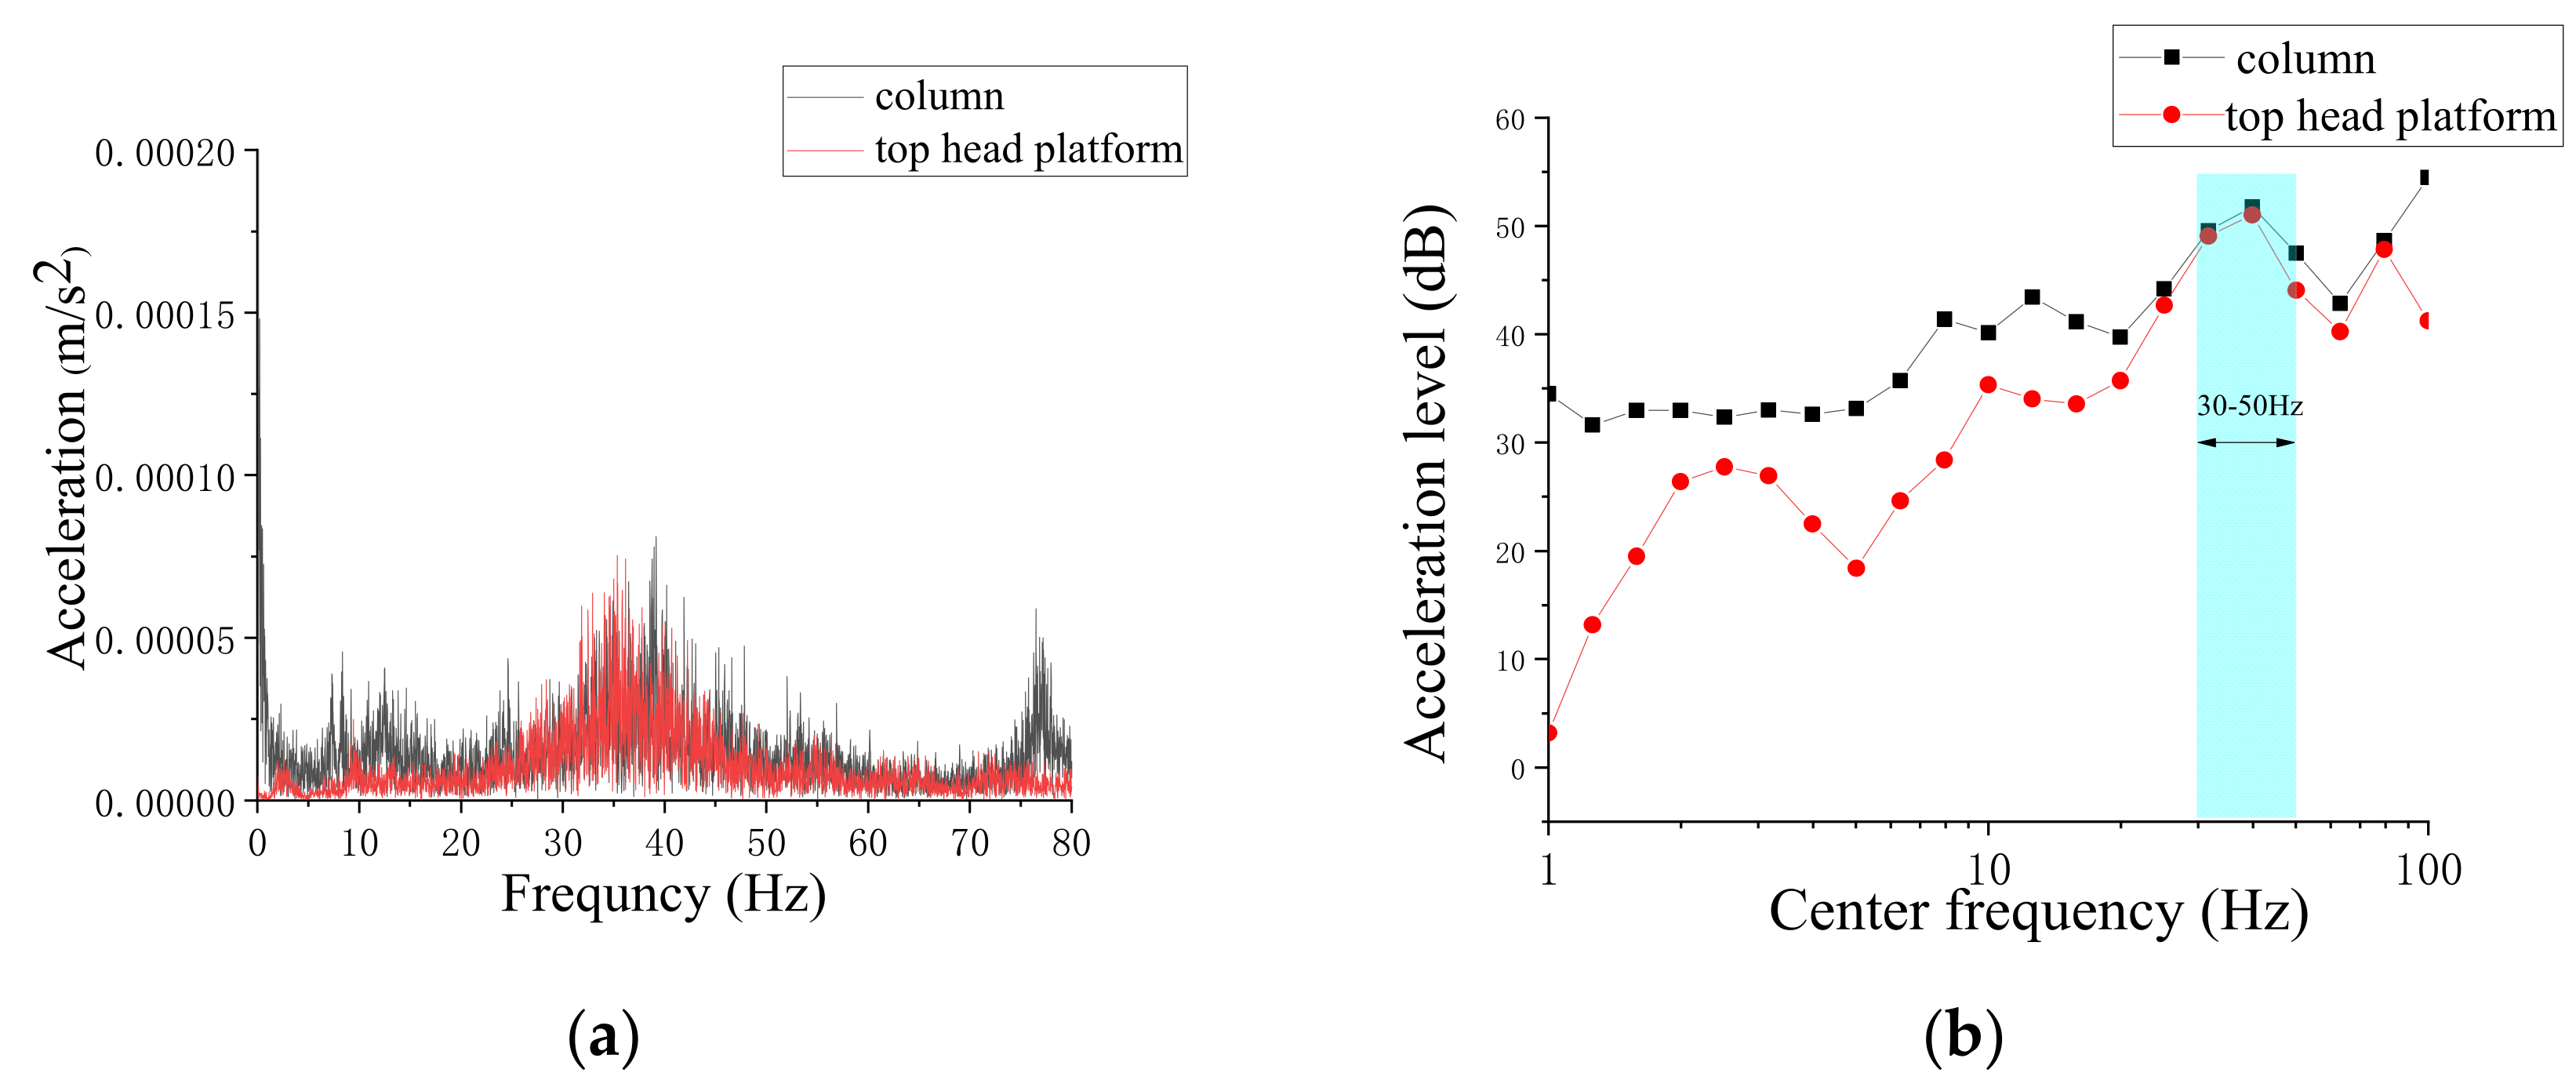
To deeply study the frequency content of the vibration caused by train operations in the depot and reveal the magnitude of components of vibration signals at different frequencies, the frequency spectrum and one-third octave spectrum analysis of measured time history data are presented, as shown in Figure 7. It can be observed that the vibration that propagated from the column to the top head platform at a significant frequency of between 30 and 50 Hz has the phenomenon of a main frequency shift from 35.35 Hz to 39.5 Hz, which is further validated by the one-third octave spectrum in Figure 7b.

3. Numerical Model

3.1. Track–Soil–Structure 3D FE Model

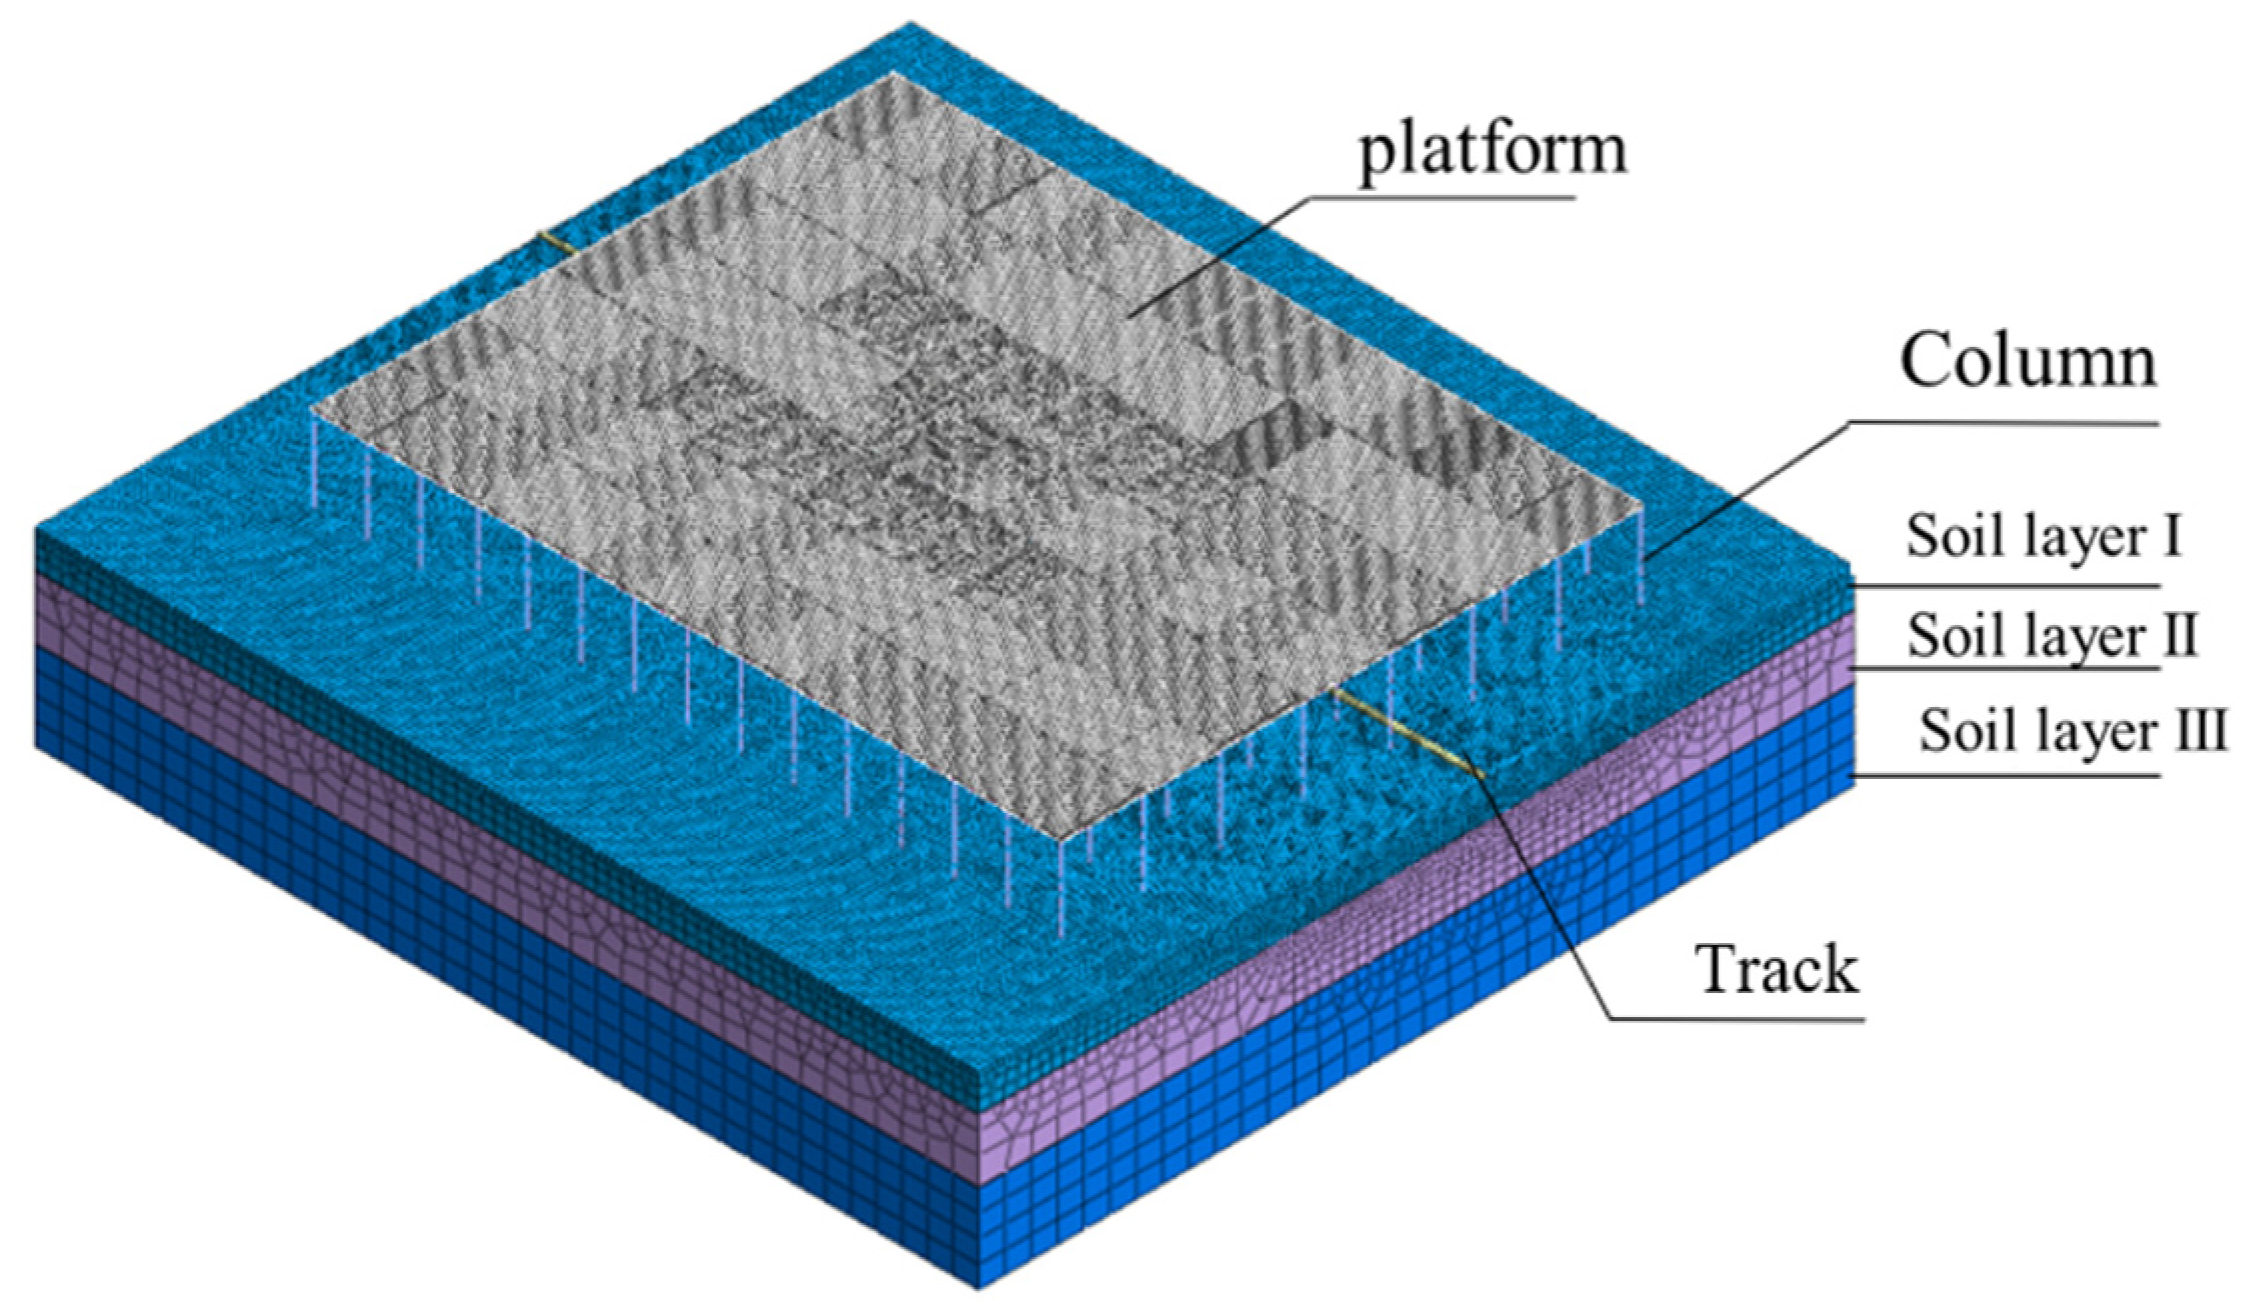
To predict the train-induced building vibrations, a track–soil–structure model was built for the operation depot structure and over-track building, as illustrated in Figure 8. In the model, the soil layers were modeled by the solid element. The platform, building floors, and walls were modeled by the plate elements, with a thickness of 200 mm. The platform of beams and columns was modeled by the beam elements; the cross-sectional size of the rectangular column was 100 mm × 100 mm, and the beam cross-section size was 1500 mm × 800 mm. The model size of the soil part was 150 m (length) × 140 m (width) × 30 m (depth). The main material parameters are listed in Table 1.
The Rayleigh damping assumption was employed:
[ C ] = α [ M ] + β [ K ]
where the damping matrix [C] was a linear superposition of the mass matrix [M] and the stiffness matrix [K] with the coefficients α and β. The two coefficients can be only defined by the damping ratio of soils and the analysis frequencies.
To avoid the influence of fluctuating reflections at the boundaries of the finite element (FE) model, an artificial viscoelastic absorption boundary was applied.
The building room plan is shown in Figure 9, with 12 floors and 13 rooms per floor, numbered a~m.

3.2. Dynamic Train Load

3.2.1. Simulated Acceleration on the Rail

The measured rail vibrations can be divided into a series of different frequency harmonics and written as a Fourier series:
x ( t ) = n = 0 A n cos n ω t + B n sin n ω t
where
A n = 2 T 0 T x ( t ) cos n ω t d t ( n = 0 , 1 , 2 , , N 1 )
B n = 2 T 0 T x ( t ) sin   n ω t   d t ( n = 0 , 1 , 2 , , N 1 )
where T is the record time and N is the number of sampling points. Therefore, the equation for the simulated vibration acceleration on the rail can be obtained using discrete sampling and Fourier transformation:
x ( t ) = n = 0 N 2 1 A n cos n ω t + B n sin n ω t
Figure 10 compares the measured and calculated time histories of rail vertical vibration accelerations in the operation depot, where the train speed is approximately 5 km/h and the sampling frequency is 5120 Hz. It can be observed that the time histories matched well.

3.2.2. Simplified Model of Metro Trains

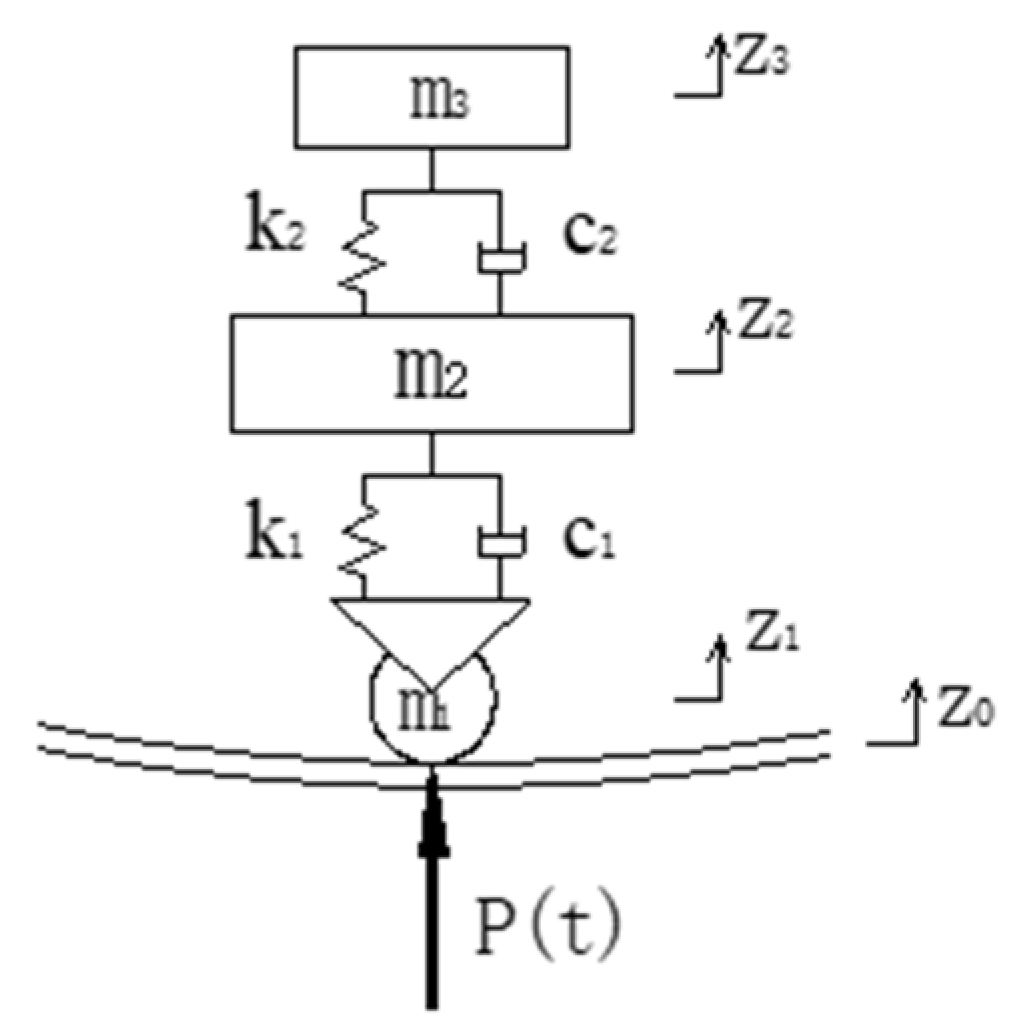
Since vertical vibration is the primary contributor to environmental vibration, the metro train was simplified as a series of two spring-mass models evenly distributed along the rail. One of the simplified models is shown in Figure 11. As the gravity center of the carriage is usually symmetrical in longitudinal and lateral directions, a quarter bogie was considered to calculate the train load on a one-sided rail. Table 2 lists the parameters of metro trains operating on the metro depot of Tianjin Metro, Line 5.

3.2.3. Simulated Train Load

The vertical kinematic equilibrium differential equation of the carriage can be established according to the coordinates in Figure 11.
m 3 z ¨ 3 + c 2 z ˙ 3 z ˙ 2 + k 2 z 3 z 2 = 0 m 2 z ¨ 2 + c 1 z ˙ 2 z ˙ 1 + k 1 z 2 z 1 k 2 z 3 z 2 c 2 z ˙ 3 z ˙ 2 = 0
where m1, m2, and m3 represent the masses of the wheels, bogie, and vehicle body, respectively; z0, z1, z2, and z3 denote the absolute displacements of the steel rail, wheels, bogie, and vehicle body, respectively; k1 and k2 represent the primary and secondary suspension stiffness, respectively; c1 and c2 represent the primary and secondary suspension damping, respectively.
Ignoring the wheel–rail bounce while the train is operating, the vertical vibration accelerations at the wheel and the rail are equal. The wheel–rail interaction force can be obtained accordingly.
P ( t ) = ( m 1 + m 2 + m 3 ) g + m 1 z ¨ 1 + m 2 z ¨ 2 + m 3 z ¨ 3 = ( m 1 + m 2 + m 3 ) g + [ m 1 m 2 m 3 ] ( { 1 1 1 } z ¨ 0 + [ 1 0 0 1 1 0 1 1 1 ] [ ξ ¨ 1 ξ ¨ 2 ξ ¨ 3 } )
where ξ1 = z1z0 = 0, ξ2 = z2z1, ξ3 = z3z2
The uniformly distributed train load can be expressed as:
F ( t ) = K n M P ( t ) / L
where K is the correction factor, n is the number of bogies per carriage, M is the total number of carriages, and L is the train length. For the metro trains operating in the Tianjin depot, n = 2, M = 6, and L = 117.12 m (19.52 m × 6). The simulated train load can be obtained using the simulated rail acceleration (see Figure 10b), as shown in Figure 12.

3.3. Model Validation

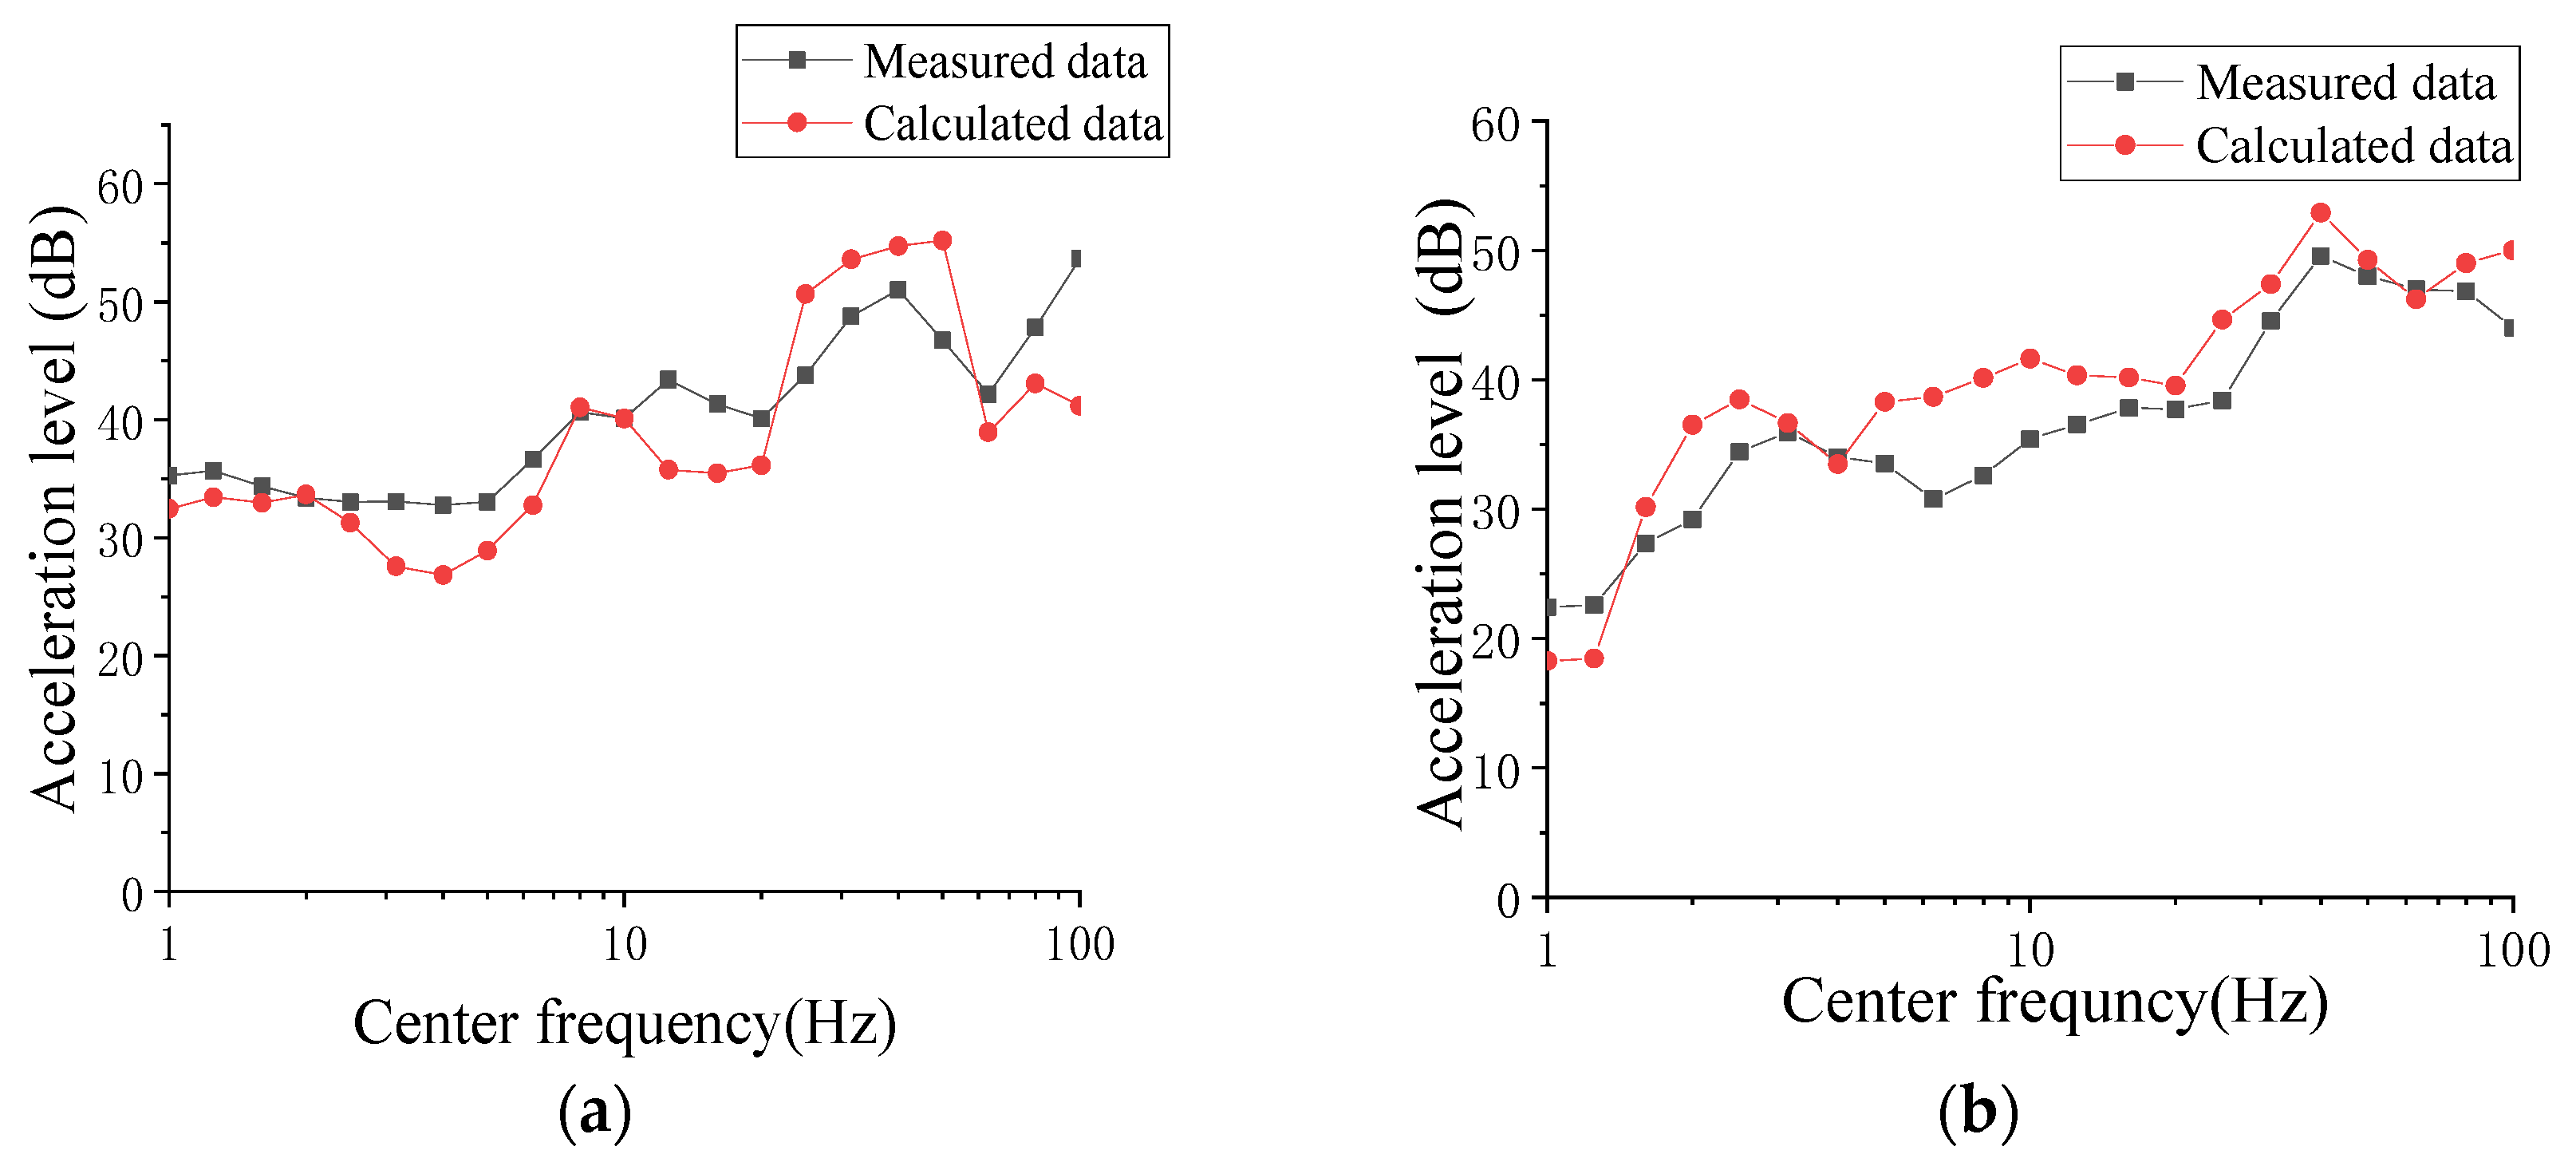
To validate the numerical model, a field measurement was performed at the depot. Since the over-track building had not been built, the measurement points were arranged on the column and top head platform, as described in Section 2. The over-track building sub-system was also excluded from the numerical model (Figure 13). The measured and calculated responses on the column and top head platform were compared in the one-third octave frequency domains, as illustrated in Figure 14. It can be observed that the model calculation results match the trend of the measured response, and the reliability of the model was acceptable.

3.4. Prediction Result of Building Vibrations

Based on the validated numerical model, the floor vibration responses of the to-be-built over-track building were calculated. The floor vibration responses were evaluated by two standards, JGJ/T170-2009 [36] and GB/T50355-2018 [37]. According to the standard Building Vibration and Secondary Radiation Noise Limit Caused by Urban Rail Transit and Its Measurement Method Standard (JGJ/T170-2009), the index of the vertical maximum vibration level VLmax in one-third octave bands was defined as follows:
V L max = max f i [ V L z , w f i ]
where maxfi represents the maximum value of the weighted vibration acceleration level in all one-third octave central frequencies fi, and VLz,w (fi) is the frequency-weighed vertical acceleration level.
The guideline-limited values of VLmax are listed in Table 3.
According to the Standard for Limits and Measurement Methods of Vibration in the Room of Residential Building (GB/T50355-2018), another index of the vertical maximum Z-vibration level (VLz,max) was also employed, defined as follows:
V L z , max = max t [ V L z t ]
where maxt represents the maximum value of the VLz(t) during the whole train pass-by time t, and VLz(t) is the vertical acceleration level, expressed as
V L z ( t ) = 20 log 10 a w , τ t a 0
where a0 = 10−6 m/s2 is the reference acceleration, and  a w , τ ( t )  is the running r.m.s. (root mean square) weighted acceleration, expressed as
a w , τ ( t ) = [ 1 τ t τ t a w 2 ( ξ ) d ξ ] 1 2
where  a w ξ  is the frequency-weighed instantaneous vibration acceleration at time ξ, τ is the integration time of measurement, and t is the instantaneous time.
The guideline-limited value of VLz,max is listed in Table 4.
The vertical weighted acceleration level VLz,w (fi) in the a–m rooms, as a function of central frequency in the one-third octave band, is illustrated in Figure 15. It can be observed that only the rooms h, j, and m of some floors exceeded the JGJ/T170-2009 standard limit value. The dominant floor vibrations induced by trains are between 30 and 50 Hz. They decrease first and then increase with the increase in frequency below 10 Hz, while the opposite trend is observed above 10 Hz; the center frequency corresponding to VLz(t) decreases with the increase in floors, and VLz(t) decreases first and then increases with the increase in floors. The prediction results are similar to the measurements and theoretical prediction in an over-track building reported by Zou et al. [21,22].
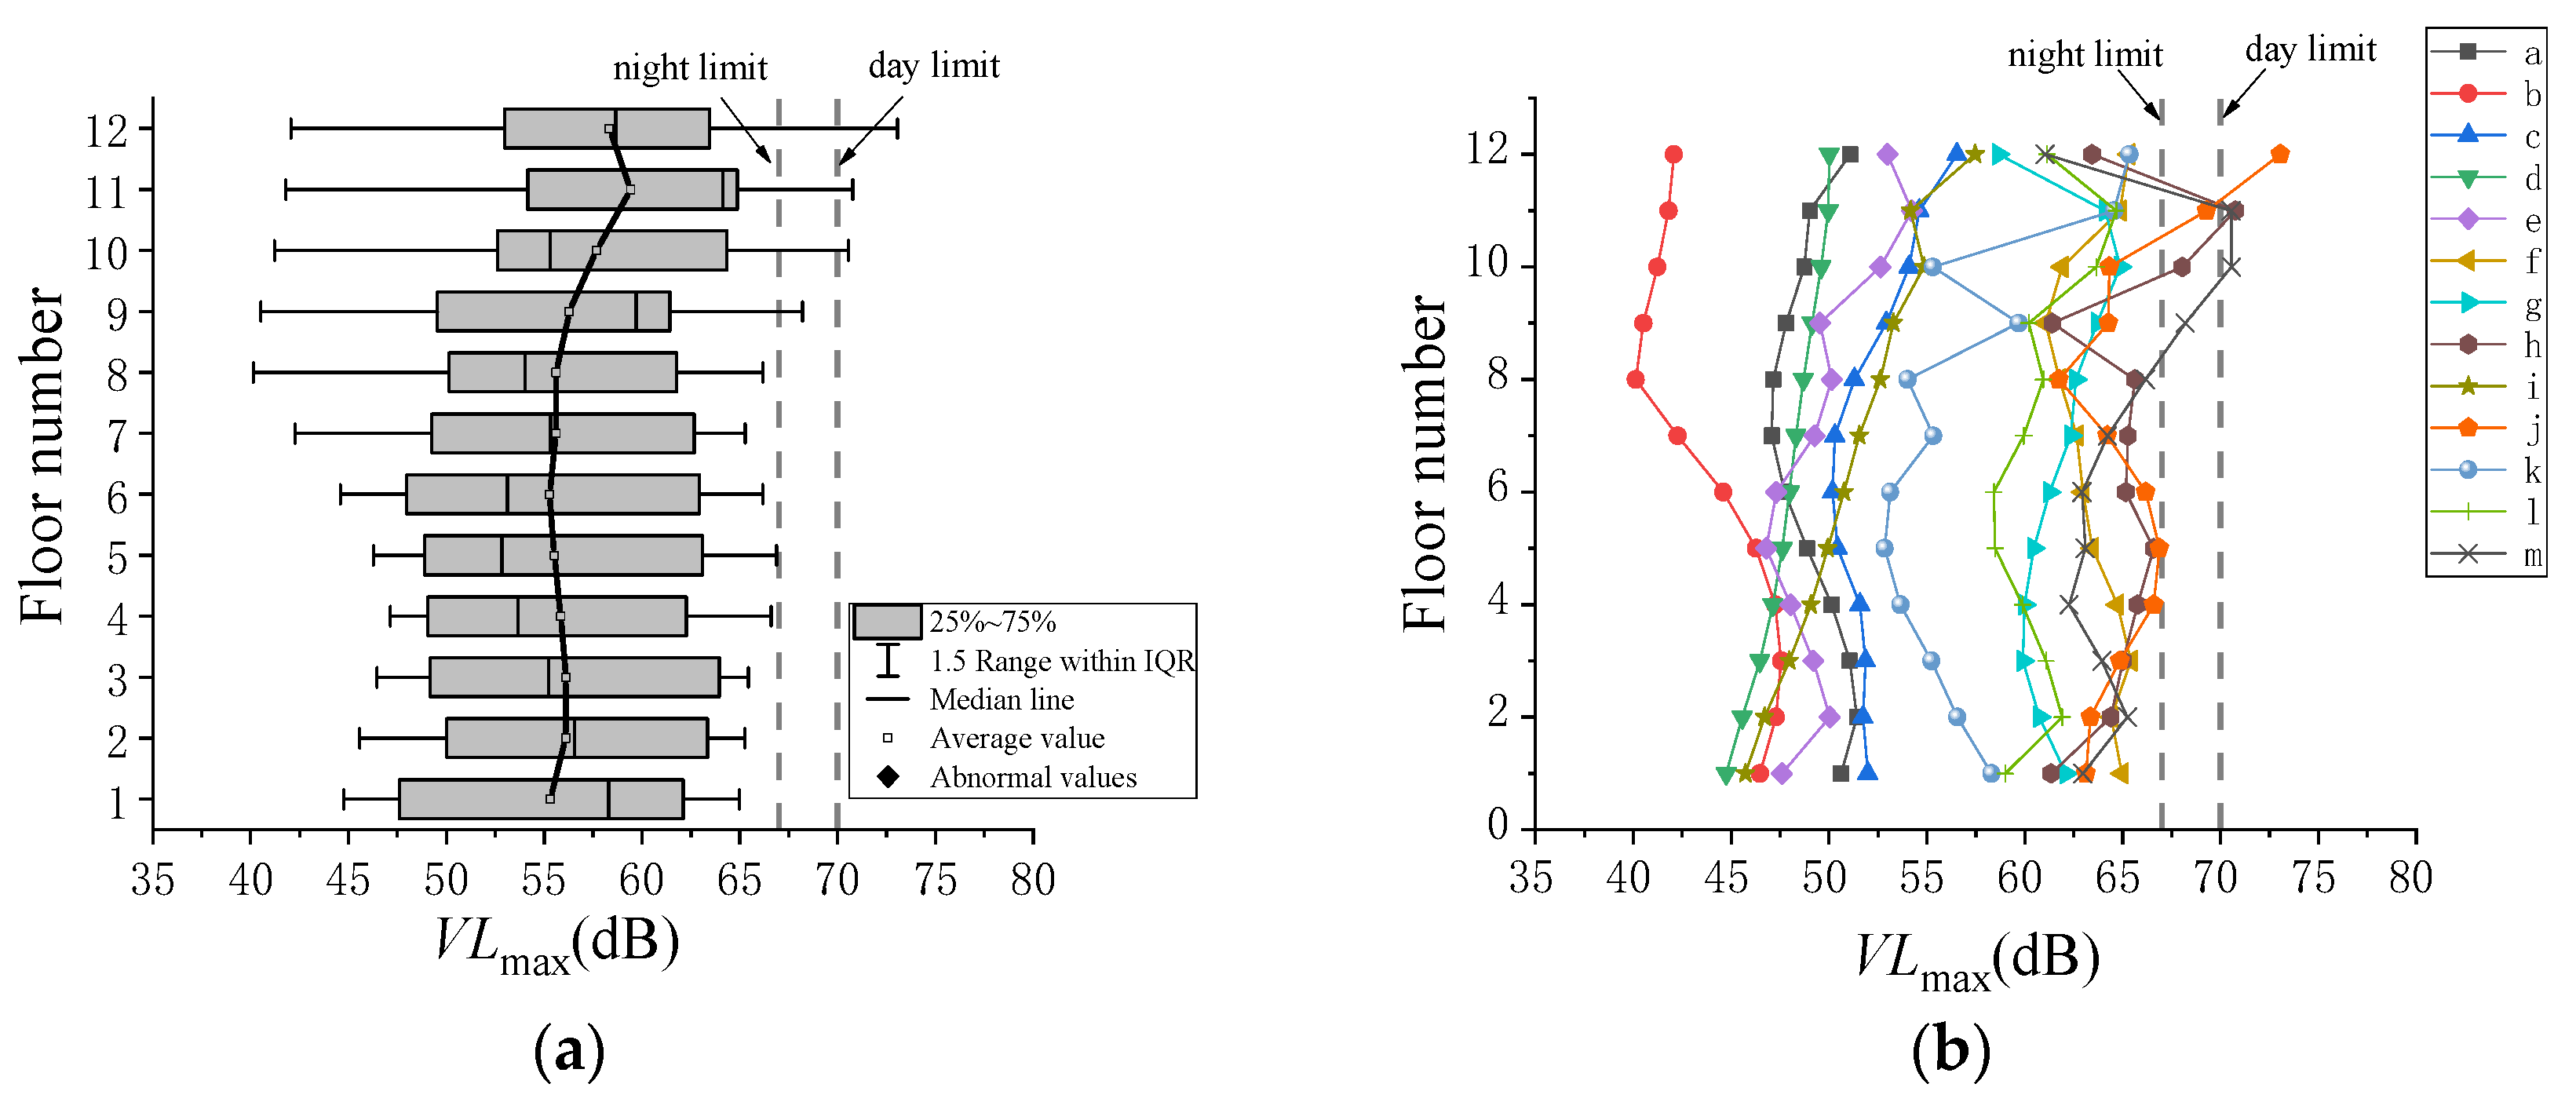
The VLmax varying with floor number is illustrated in Figure 16. It can be observed that the train-induced maximum building vibration is distributed on the first floor and top floor. The overall average value is below the JGJ/T170-2009 standard limit for residential, commercial, and mixed-use building areas. However, the maximum value of VLmax appears at the top of room j, which is approximately 73 dB and exceeds the JGJ/T170-2009 standard limits (67 dB during the day and 70 dB at night). Rooms h and m also exceed the guideline limit value. In the simplified wall–floor model prediction results by Auersch et al. [4], it was also found that the vibration of the top floor slab can reach its maximum value. This is mainly because some of the vibration energy will gradually diffuse along the floor from the intersection between the column and the floor. Due to the lack of vertical load-bearing structures above the top floor to absorb energy, energy will be transferred to the floor.
The VLz,max varying with floor number is illustrated in Figure 17. It can be observed that the VLz,max variation with floor is greatly influenced by the household type. The values of VLz,max in some rooms increase with the floor number, while the trends differ in some other rooms. However, the average value of VLz,max, as shown in the box diagram, indicates that the overall trend of the building is to decrease first and then increase. The maximum value of VLz,max occurs at the top of room j, which is approximately 74 dB and exceeds the GB50355-2018 standard day and night limit value for the primary bedroom. Rooms h, m, and f also exceed the standard limit value. However, the maximum value of VLz,max in room f is approximately 70.3 dB, exceeding the GB50355-2018 standard day limit by 0.3 dB.

4. Vibration Control Measures

The calculation results indicate that the floor vibrations in some rooms exceed the guideline value in relative standards, especially in rooms h, j, and m. Therefore, it is necessary to take measures to control the vibration and ensure vibration comfort. In this section, the reduction vibration measure of isolation rubber bearings was taken into account.
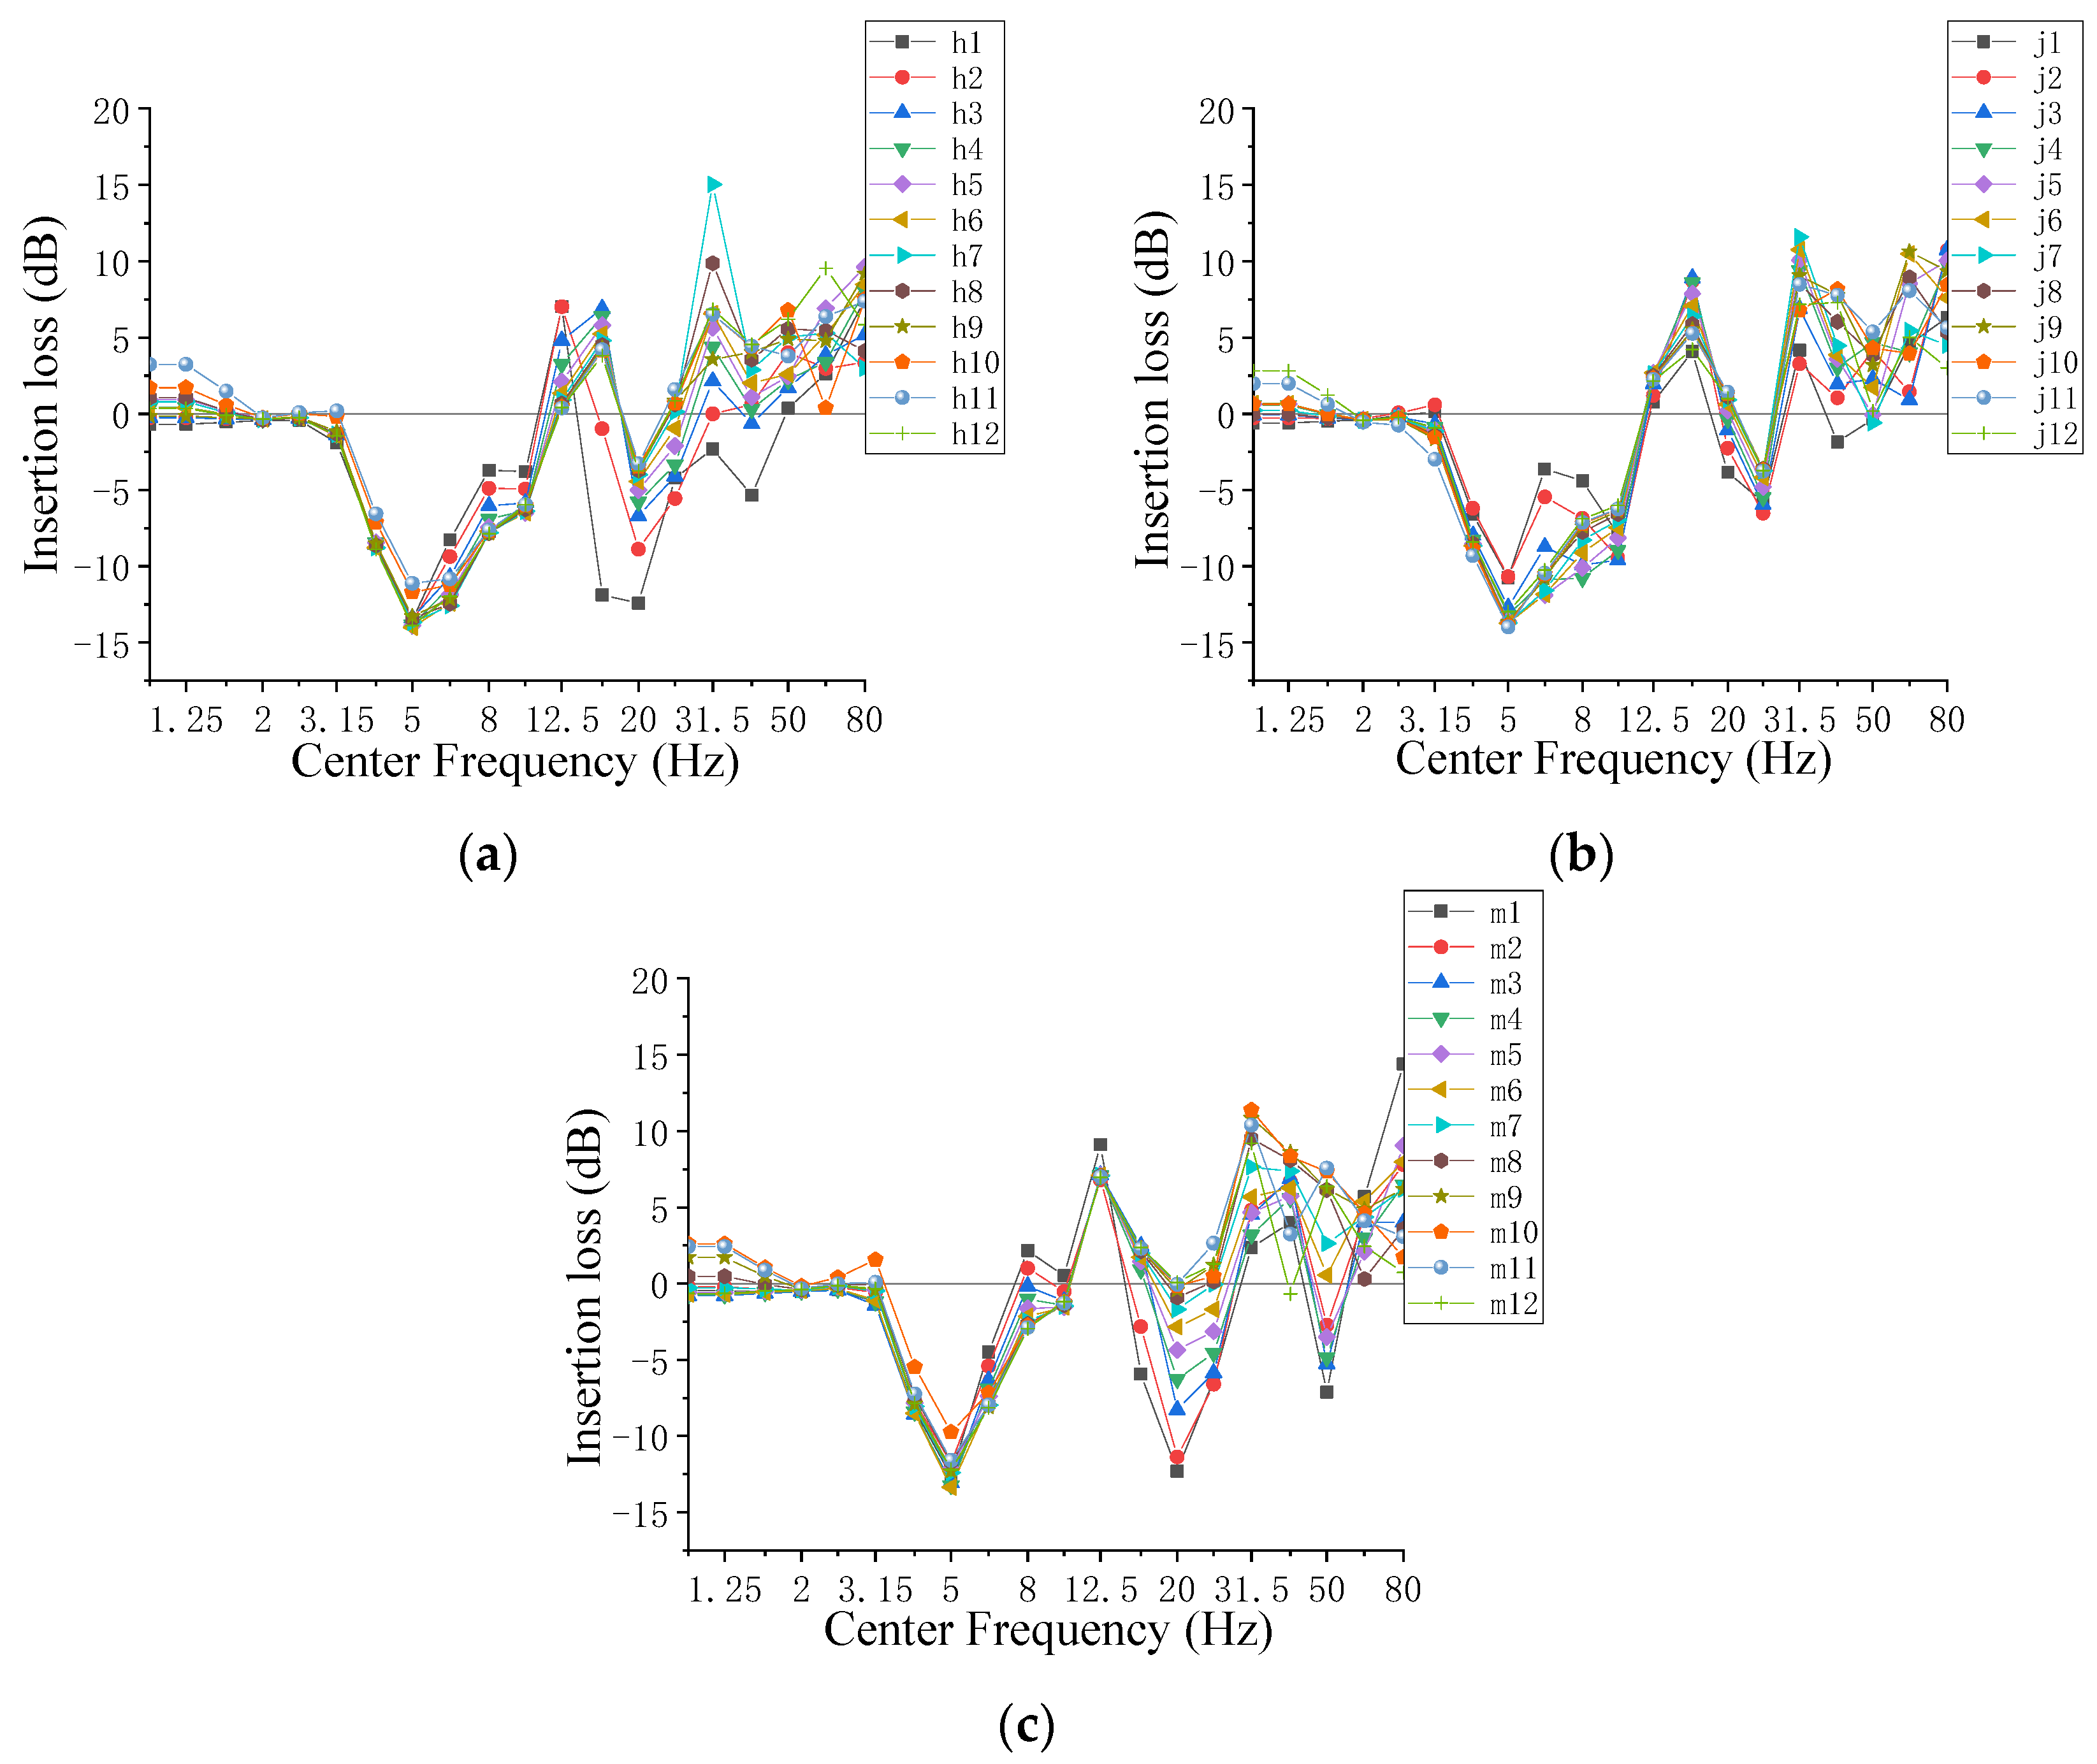
The indices VLmax, VLz,max, and insertion loss (IL) are used to evaluate the vibration reduction and isolation effect of the two types of measures. The IL was defined as
I L ( f i ) = V L w / o ( f i ) V L w ( f i )
where VLw/o and VLw are acceleration levels of the building floors without and with vibration mitigation measures, respectively; fi is the i-th center frequency; if IL > 0, it means that the vibration mitigation measures are effective.
The rubber bearing offers several advantages, including simple production, convenient transportation and installation, wide applicability, and ease of replacement [38]. Research indicates that the thick meat-type rubber bearing with lower vertical stiffness performs better in vibration isolation [33,39]. Therefore, the thick meat-type rubber bearing was selected to study the vibration isolation effect on the over-track building.
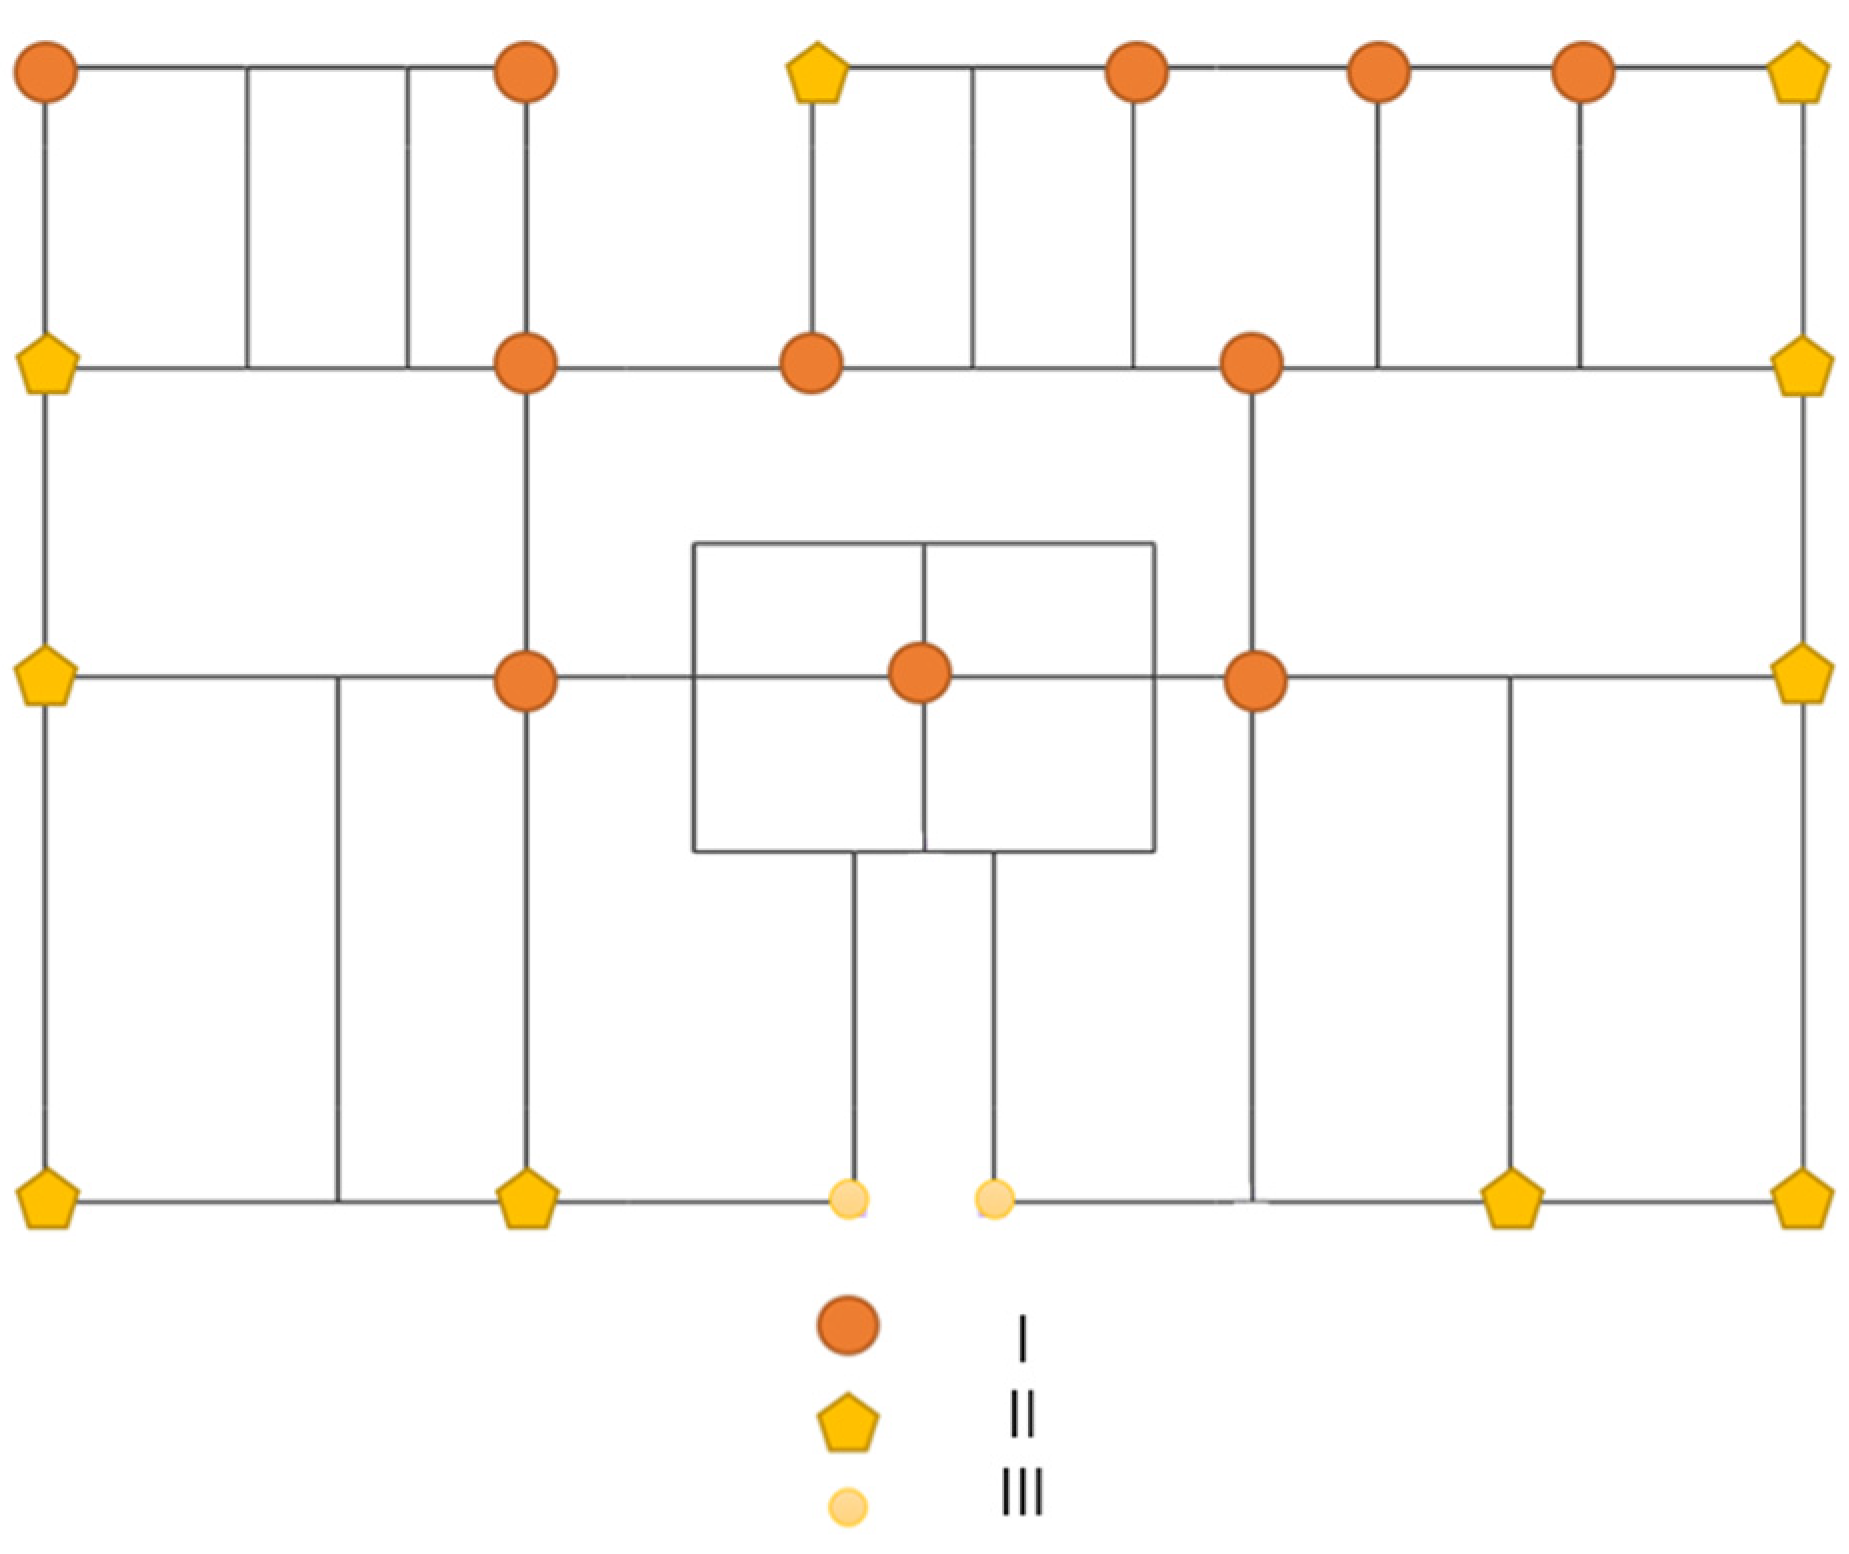
According to the project situation, the 22 vertical rubber bearings of three types are arranged on the building’s first floor of the numerical model in Section 3 to calculate the building’s vibration isolation response. The results are compared with the reference condition without isolation measurement. The vibration isolation scheme is determined by matching the axial force at the bottom of the wall with the bearings’ long-term load. The specific layout of the vibration isolation bearing is shown in Figure 18. The designed bearing parameters are listed in Table 5.
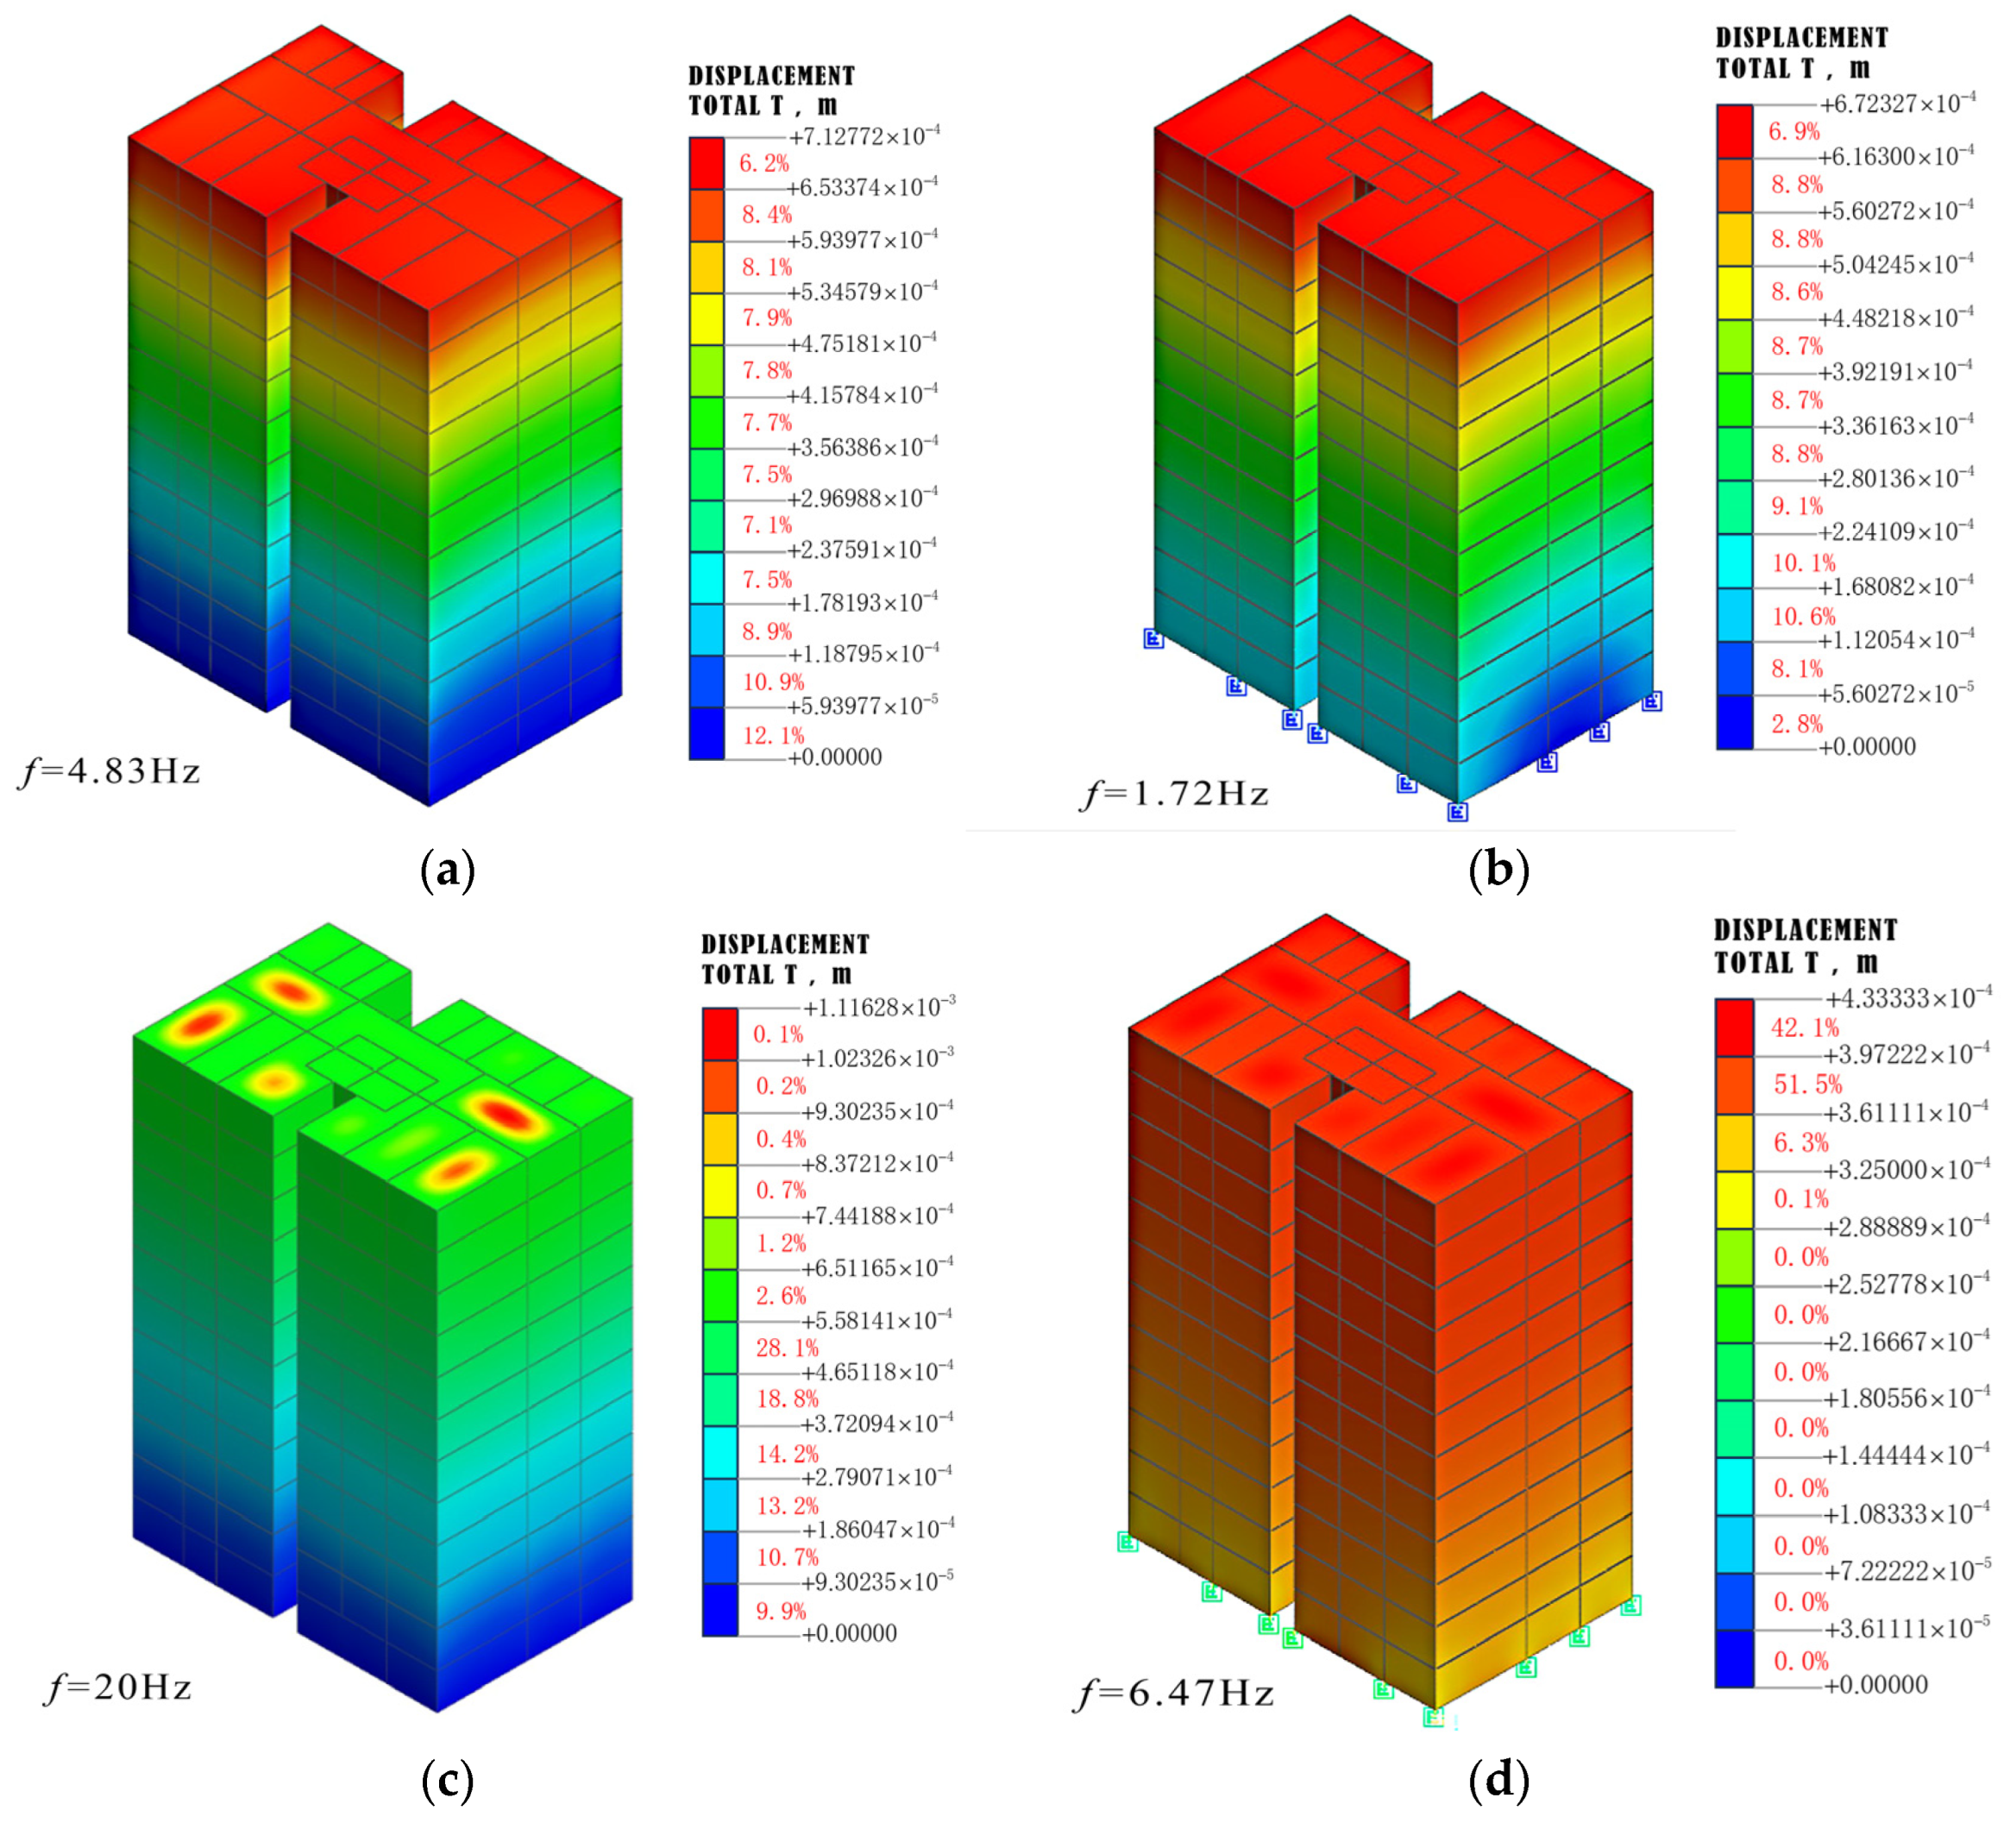
Figure 19 compares the first overall mode, vertical first mode, and floor first mode between the original and isolation models. Table 6 lists the modal comparison results. It can be observed that there is no obvious difference in the first overall mode when the vibration isolation bearings are employed. The 22 rubber vibration isolation bearings changed the vertical frequency of the overall structure, resulting in enhanced overall structural vertical vibration, with the building primarily exhibiting overall vibration. Because the vibration isolation bearings’ vertical stiffness is smaller than the over-track structure, the first vertical frequency decreases significantly. Therefore, the rubber vibration isolation bearing effectively extends the period of the structure and reduces the transmission of vertical vibrations to the over-track building. For vertical excitation, the room floor vibration response increases as the floor number increases without vibration isolation measures. However, the vertical excitation makes the room floor vibration response first decrease and then increase after adopting isolation measures.
The structural acceleration vibration isolation rate can be expressed as follows:
R d = a s a g = 1 + 2 ζ ϖ 1 ϖ 1 ϖ 1 ϖ 2 2 + 2 ζ ϖ 1 ϖ 2
where as is the acceleration of the vibration isolation structure, ag is the acceleration of the metro input structure, ξ is the damping ratio, and  ϖ 1 ϖ  is the ratio of the structure’s forced vibration frequency to natural frequency.
Because the metro-train-induced dominant frequency bands are between 30 and 70 Hz, and the vertical natural vibration frequency of the vibration isolation structure is 6.47 Hz, the ratio of  ϖ 1 ϖ  is between 4.64 and 10.82, which can achieve a vertical vibration isolation effect.
The vibration isolation bearings can not only extend the period of the superstructure, but also make its natural vibration frequency far away from the dominant frequencies of train-induced vibrations, improving the structure vibration isolation rate.
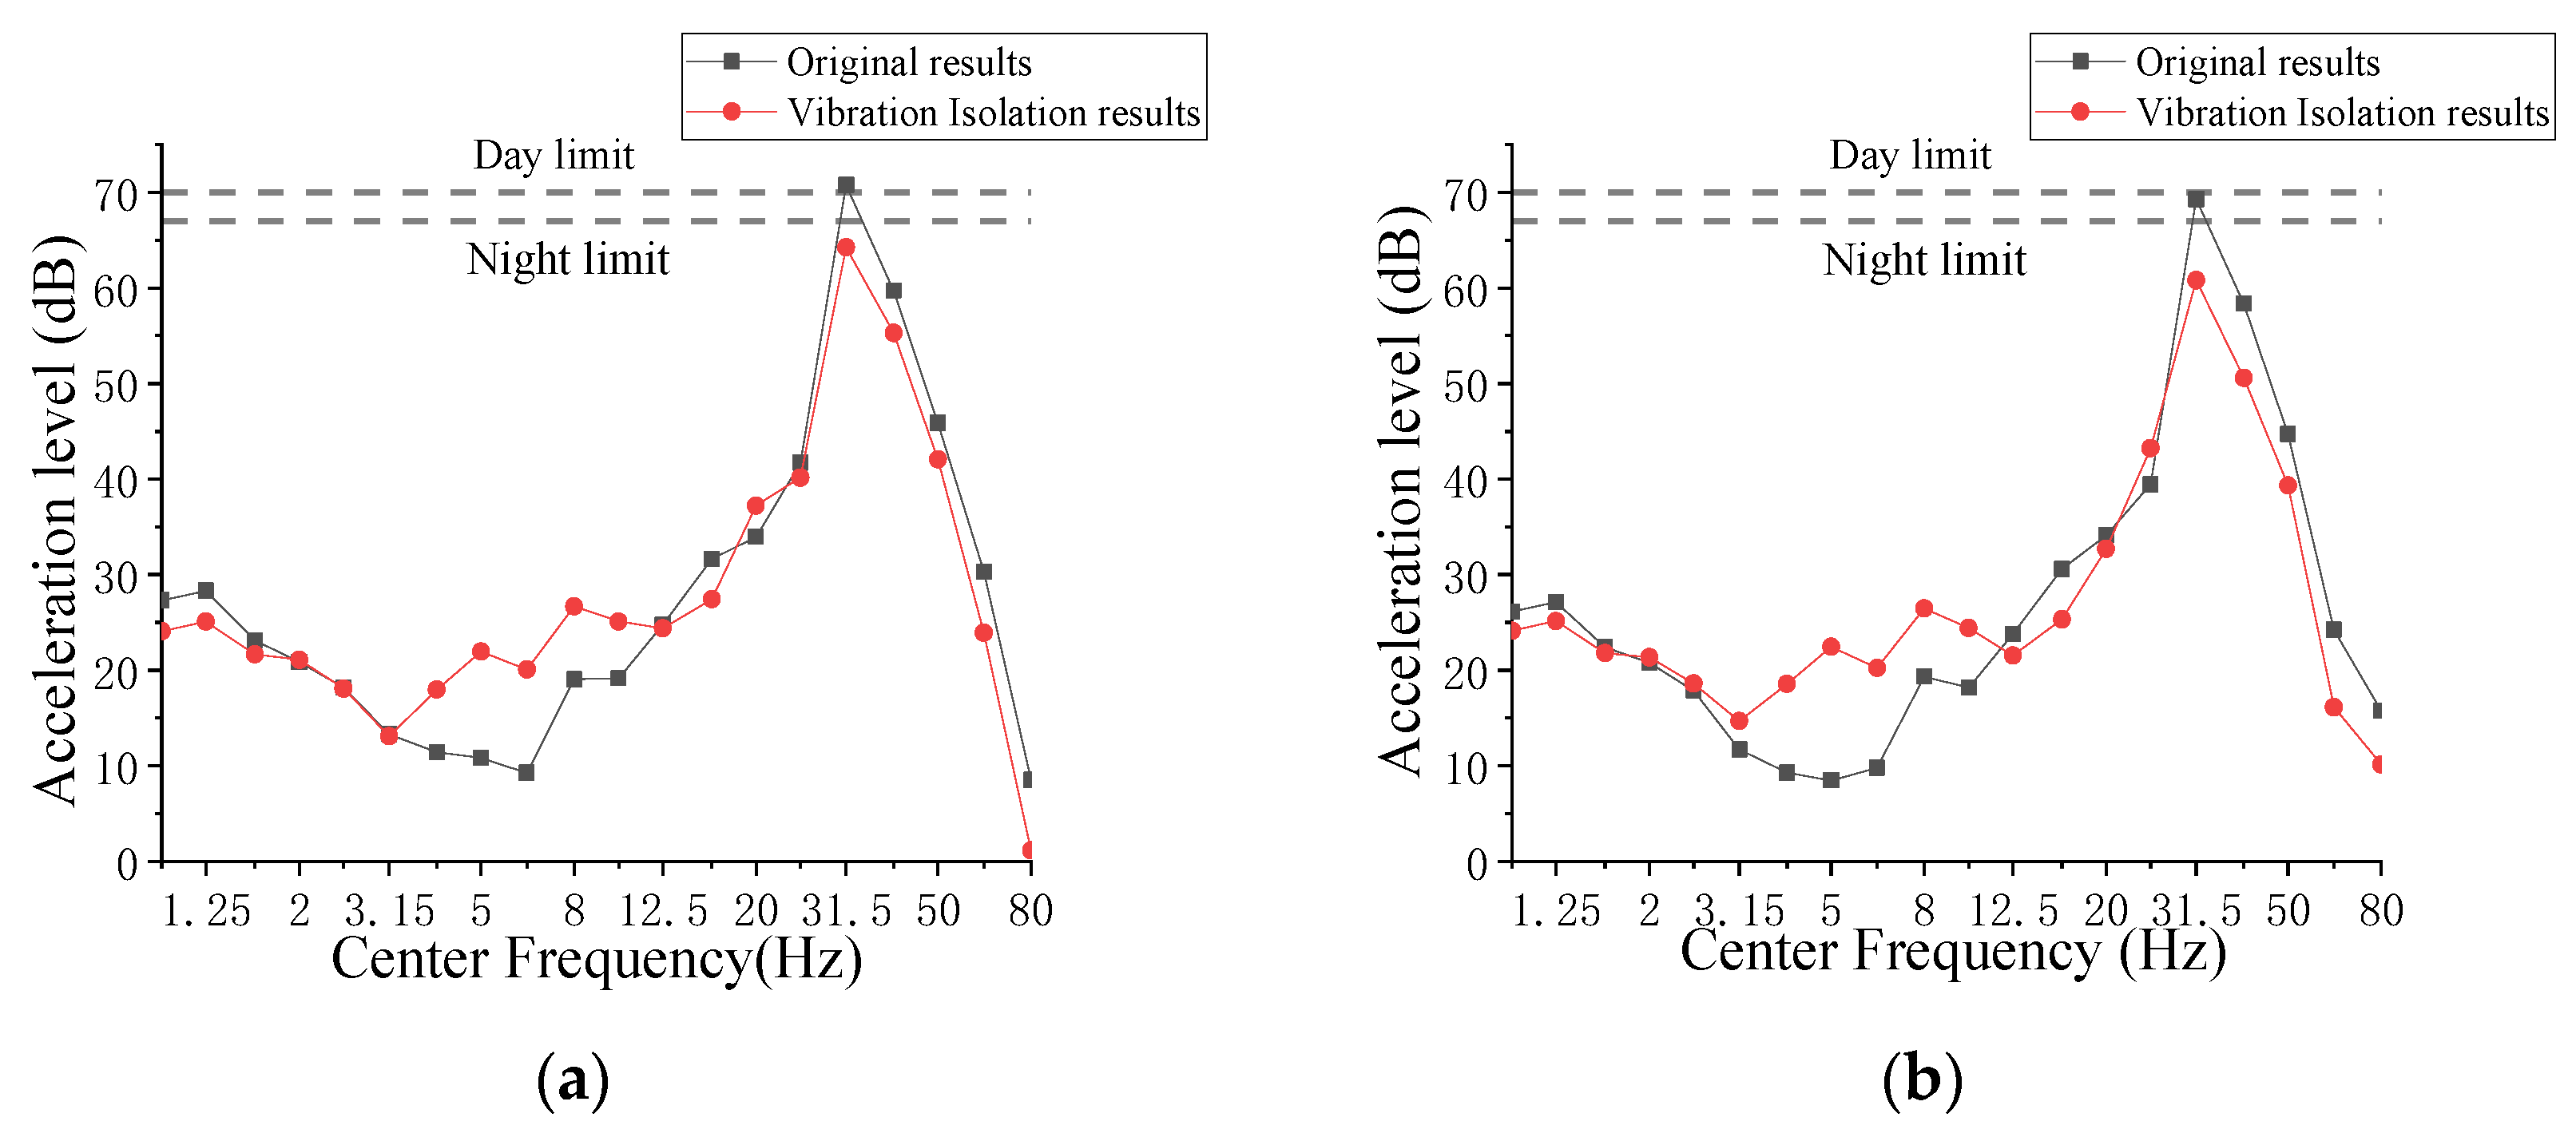
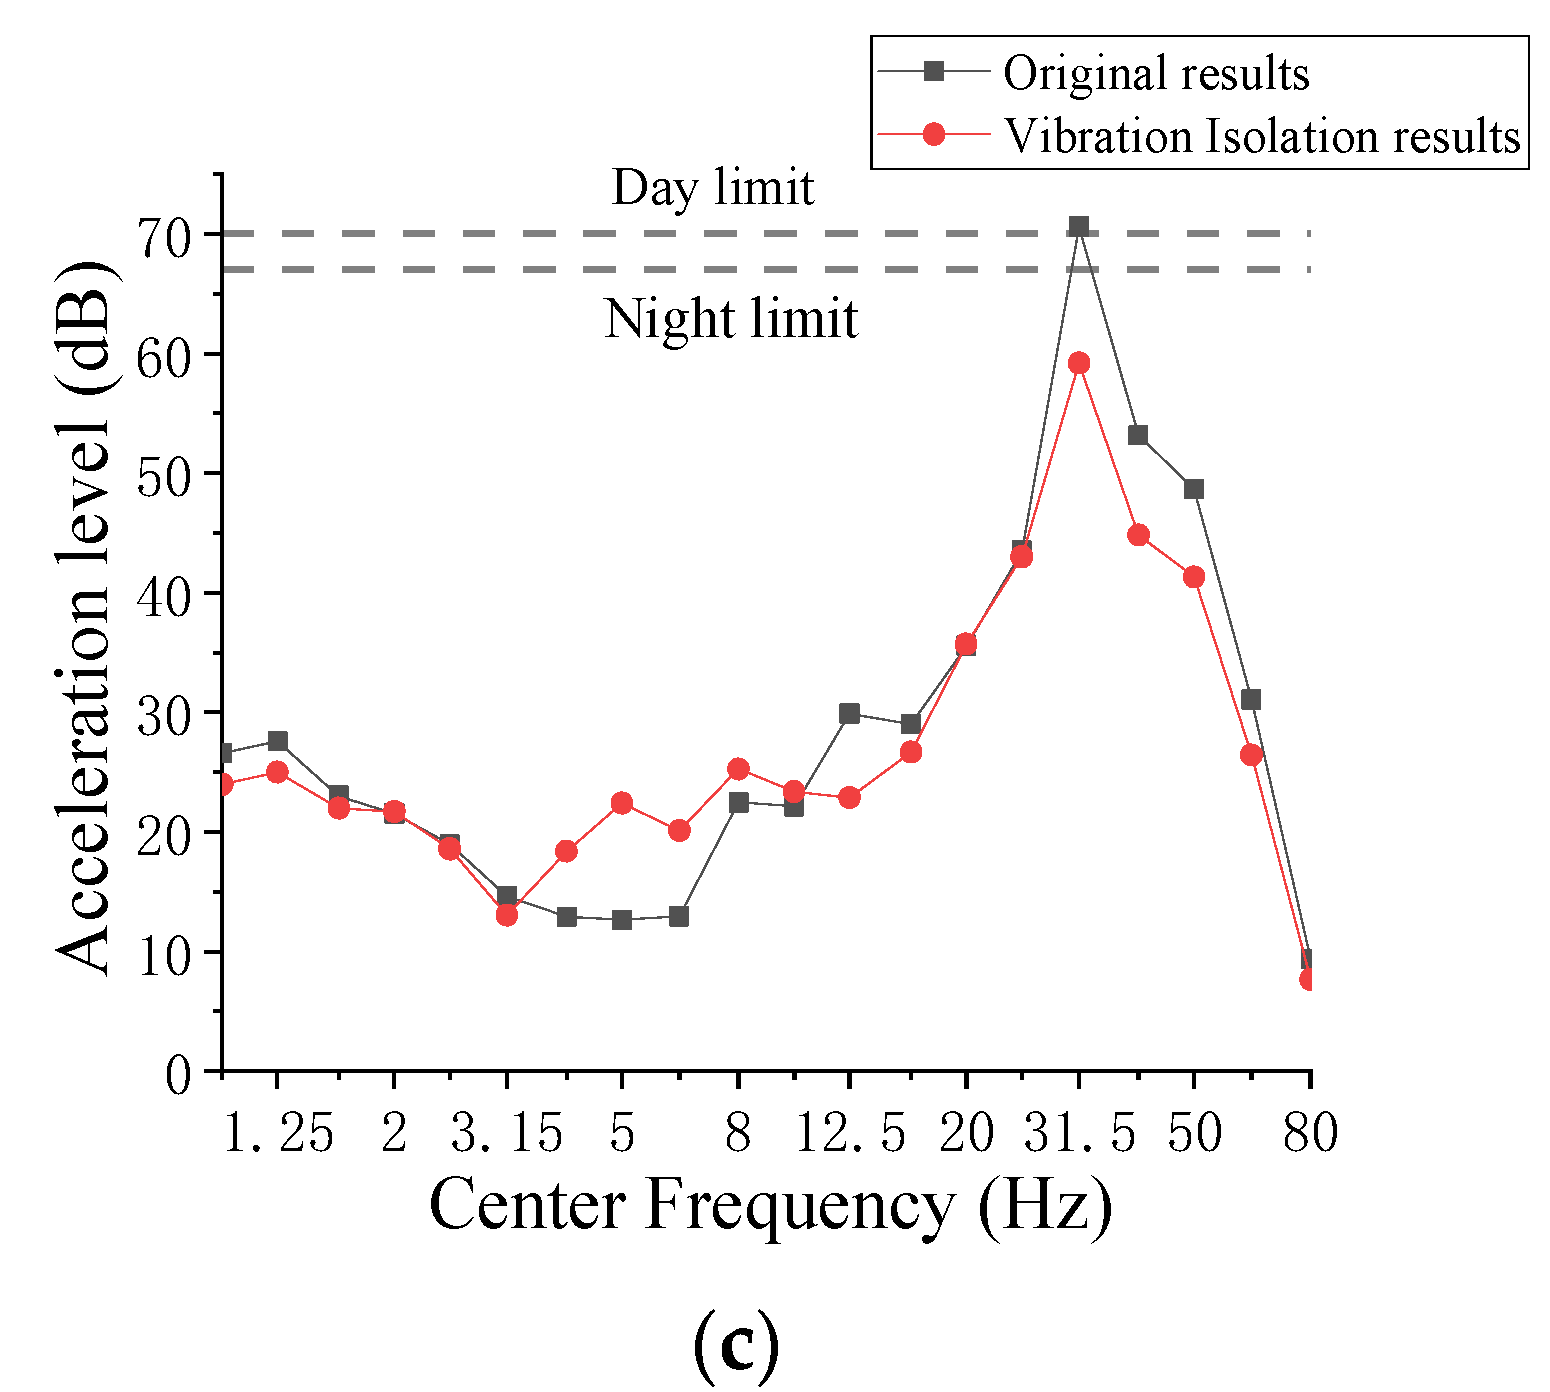
The vibration level without and with the isolation bearings in rooms h, j, and m of a typical story are shown in Figure 20. It can be observed that the vibration isolation of structure vibration level occurs with a significant vibration reduction effect in the frequency band above 30 Hz, which is approximately 5–15 dB. The peak value of the building floor vibration also appears in the 30–50 Hz range, so the vibration isolation bearings can effectively reduce the floor’s maximum vibration level and improve comfort. In the low frequency of 4–10 Hz, the vibration amplification phenomenon commonly occurs in vibration isolation structures on building floors. This is due to the rubber vibration isolation bearings reducing the vertical natural frequency of the over-track building compared to the building without vibration isolation; the vibration amplification phenomenon occurs earlier at lower frequencies.
The IL without and with vibration isolation bearings in rooms h, j, and m are shown in Figure 21. Generally, positive IL values are observed above 30 Hz, with an observed IL range of approximately 7–15 dB at the dominant frequency of 31.5 Hz. However, IL values between 4 and 8 Hz are negative.
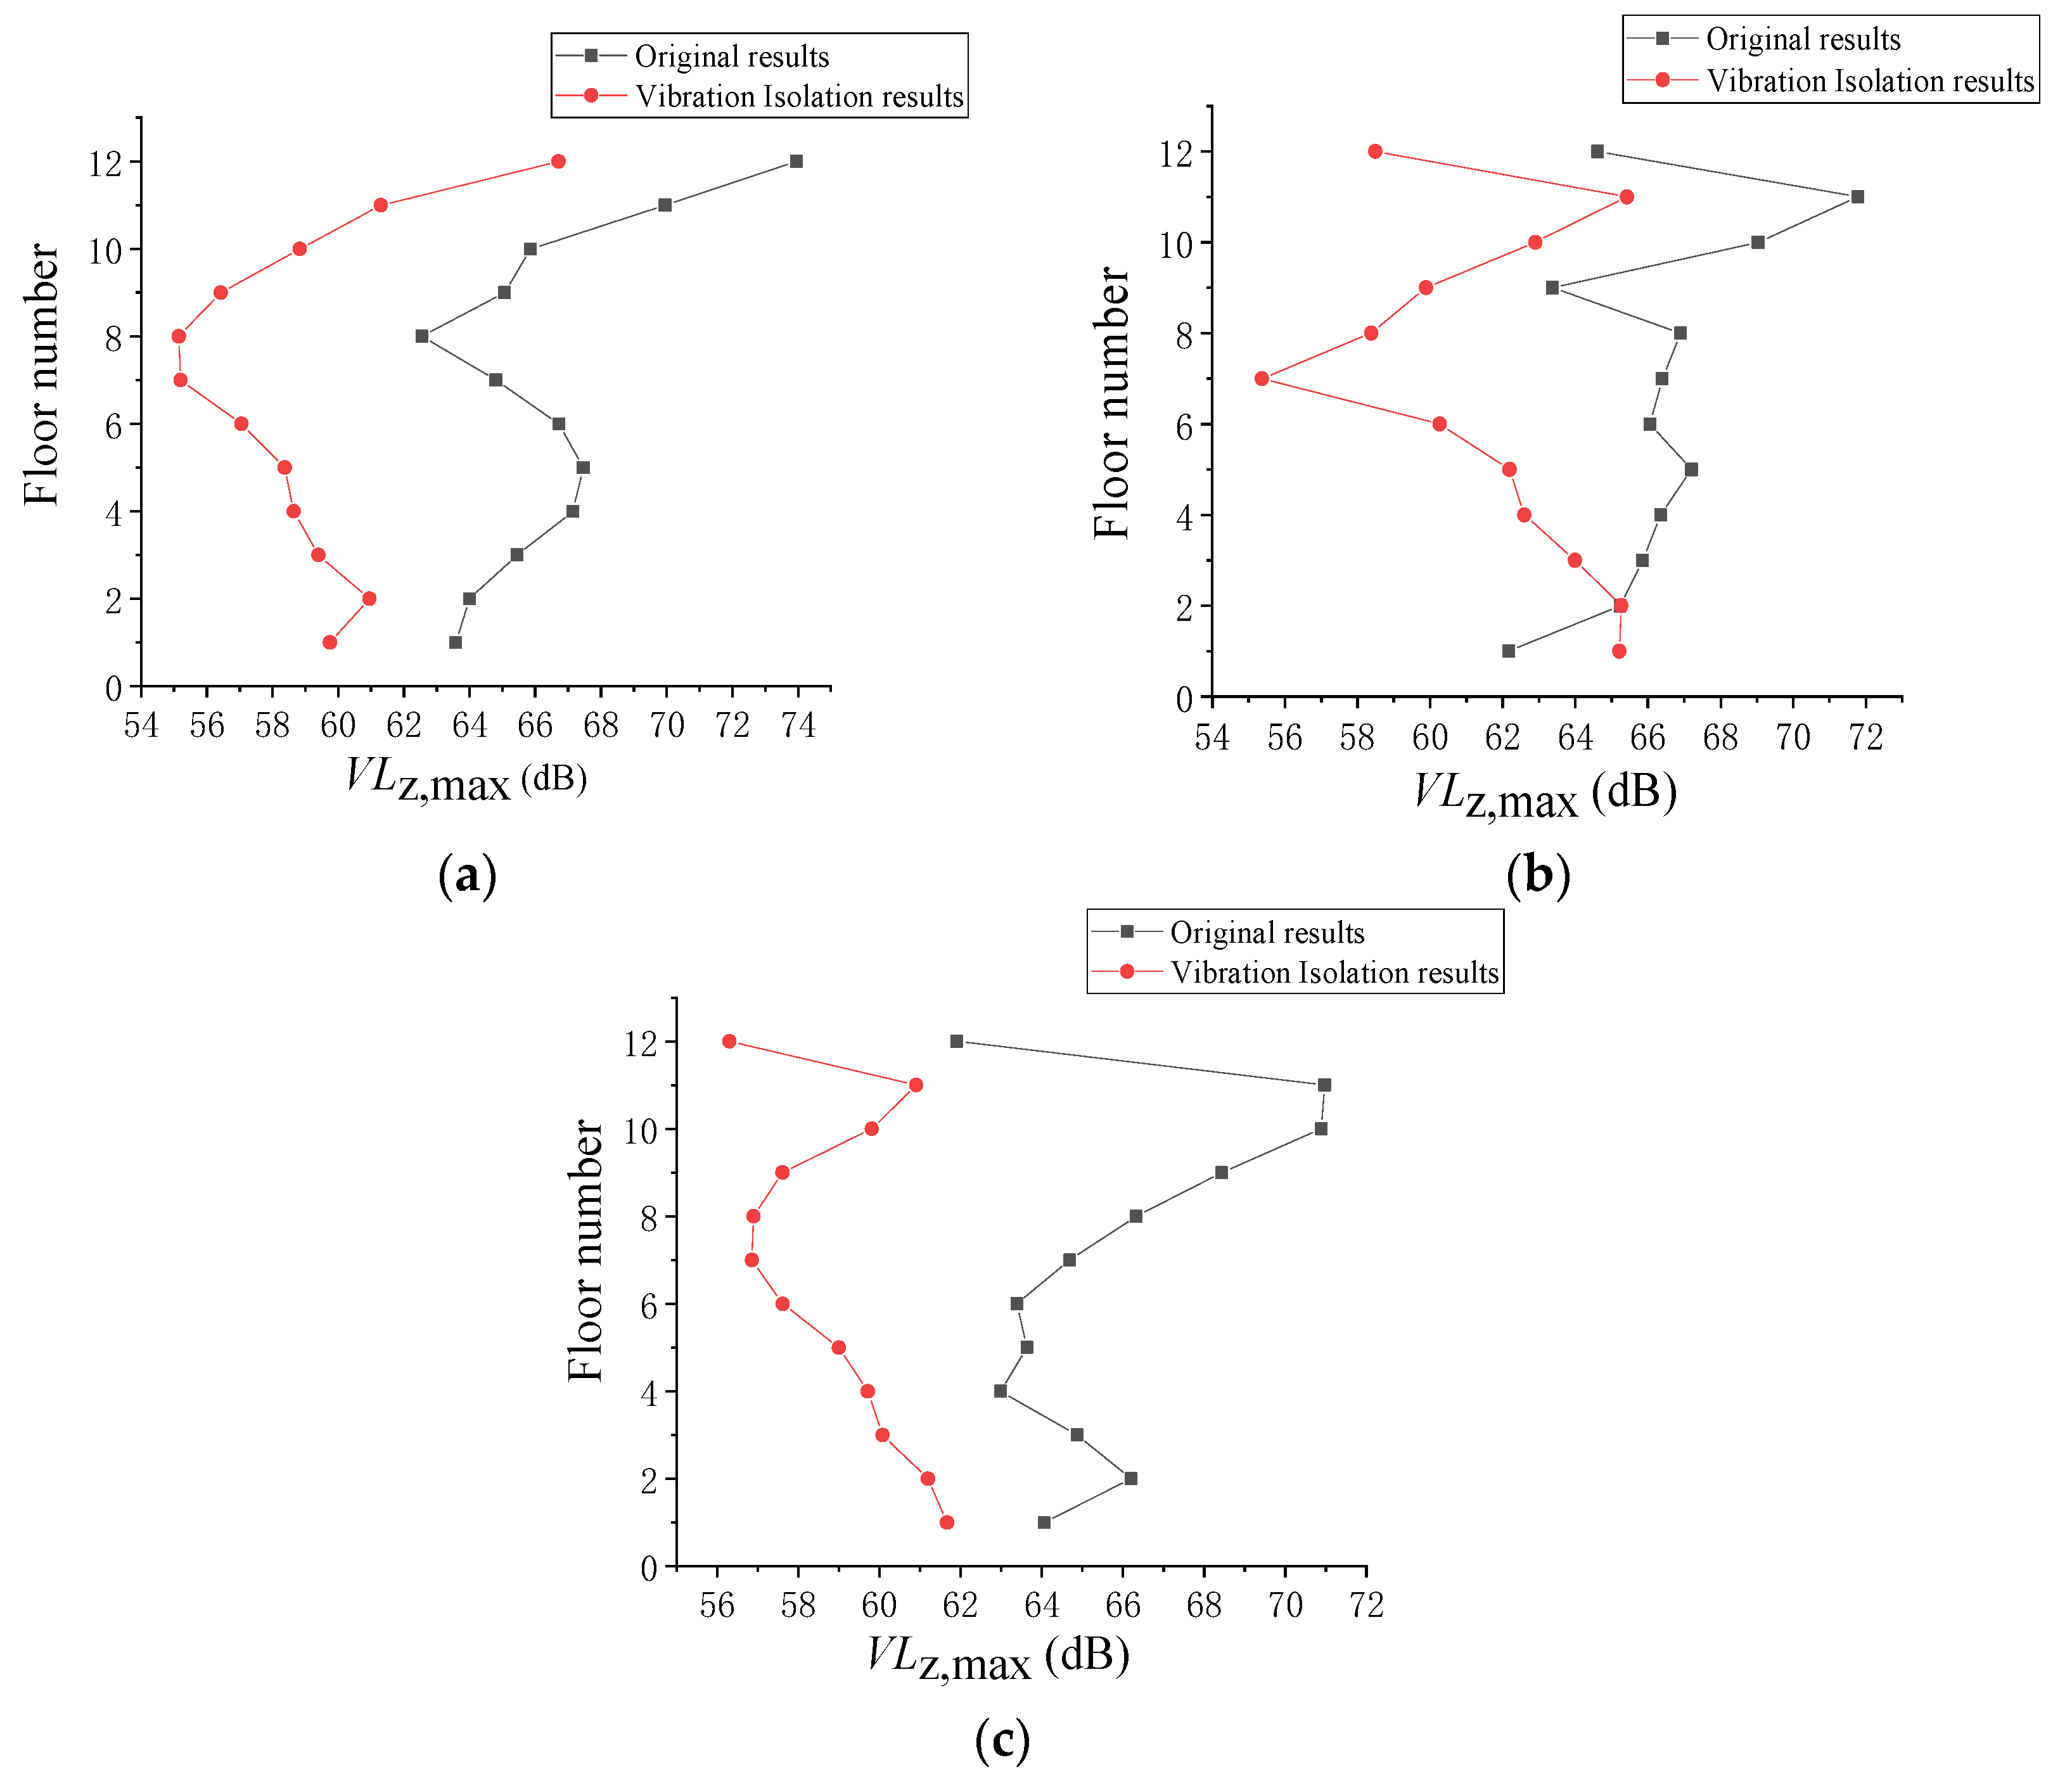
The VLz,max in rooms h, j, and m without and with vibration isolation bearings are shown in Figure 22. After adopting vibration isolation bearings, the values of VLz,max decrease by 3–12 dB. The reduction effect is more pronounced on floors 7–12 compared to floors 1–6.
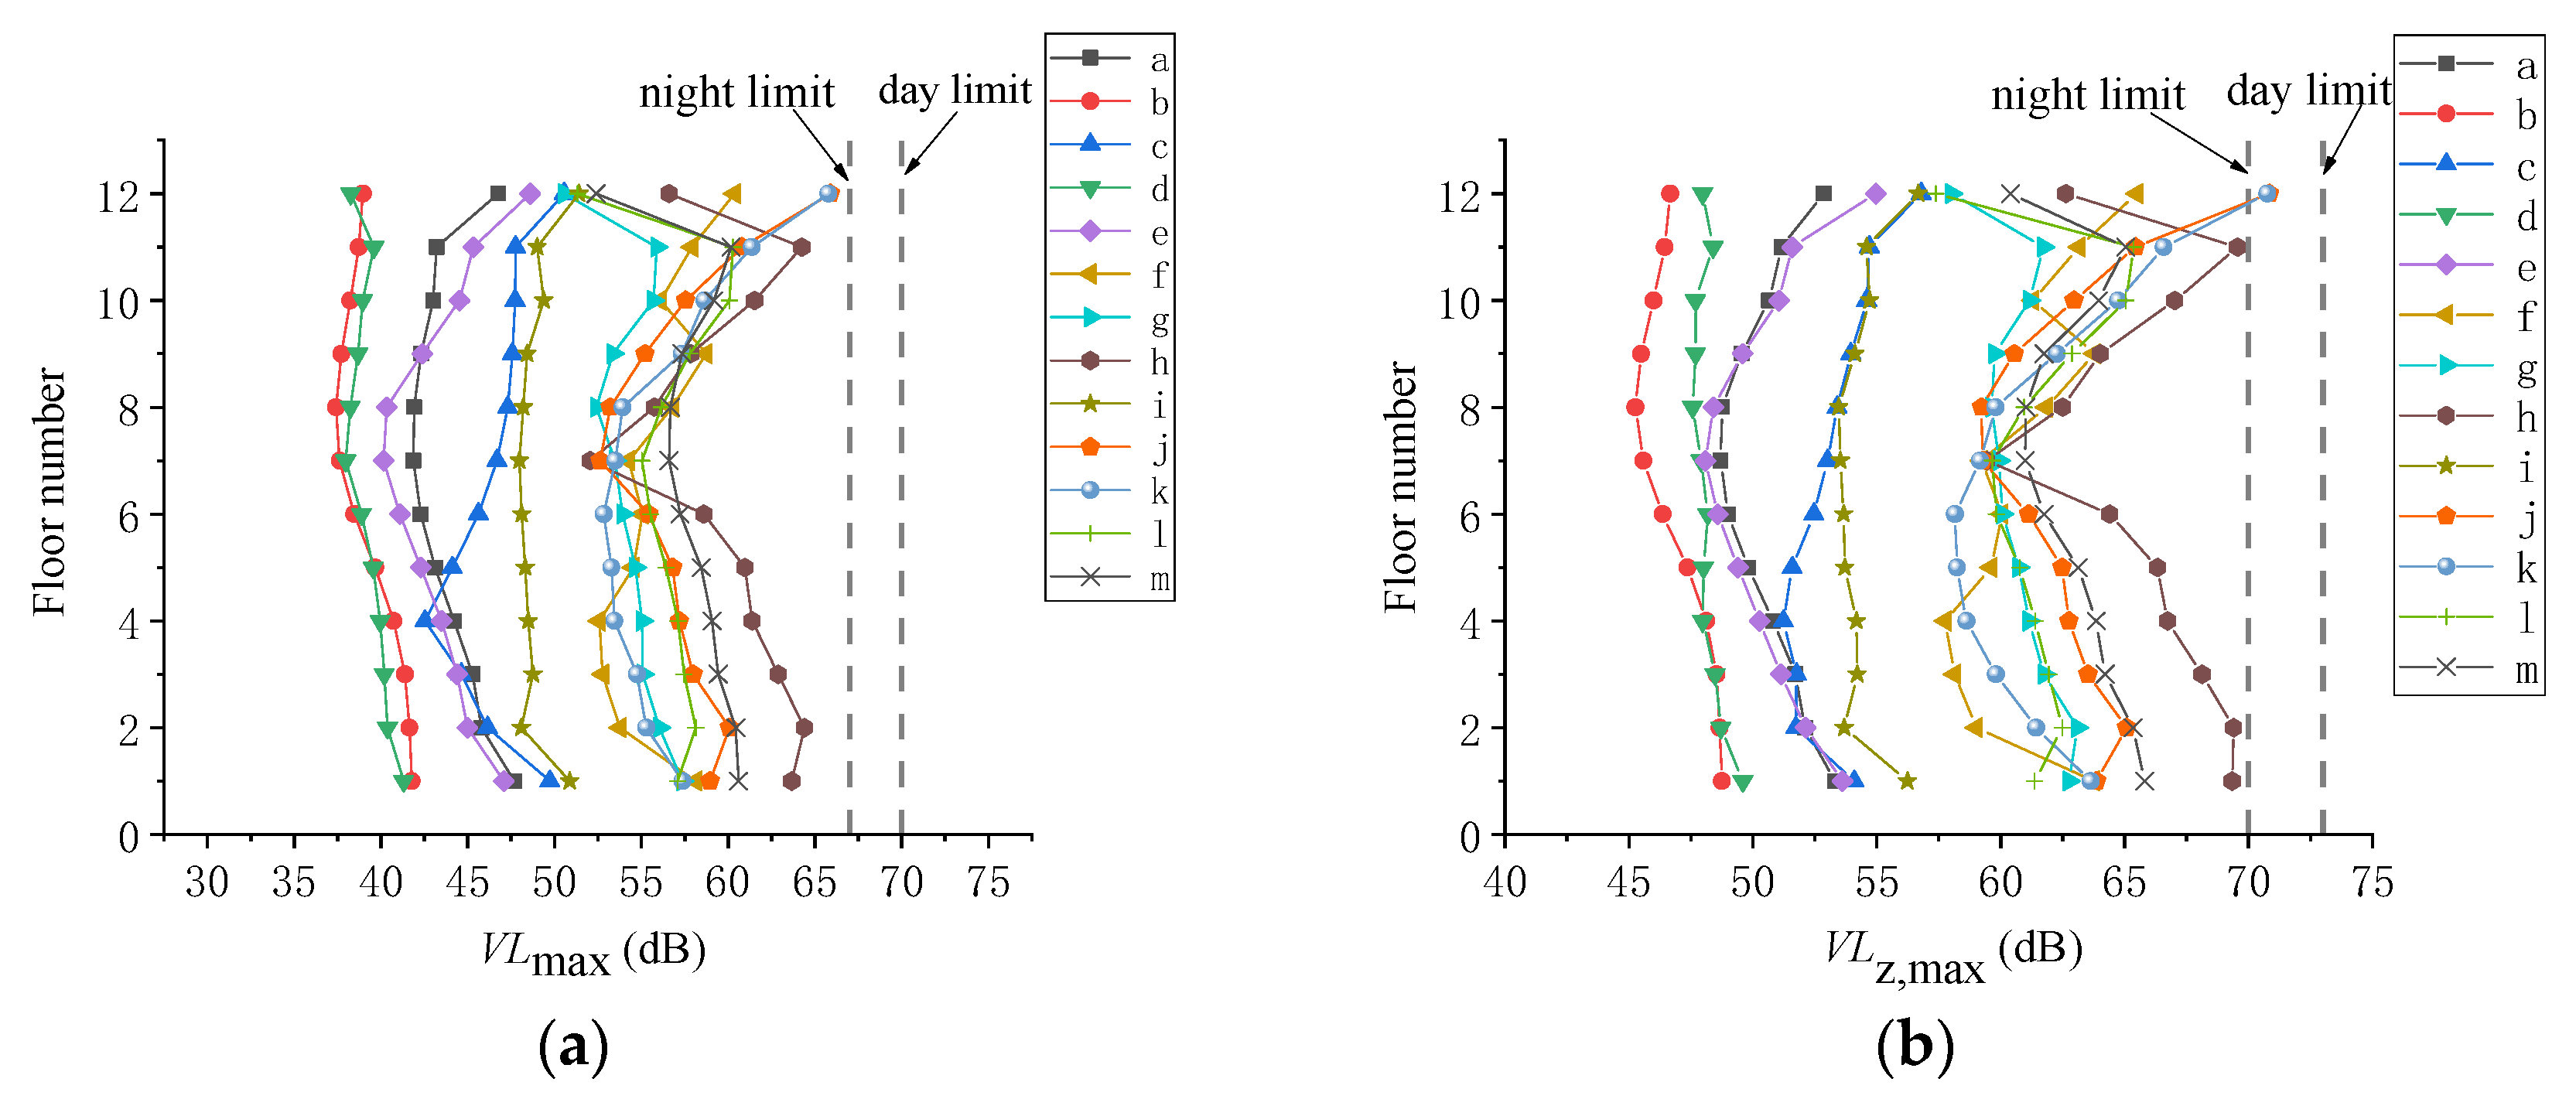
The vibration responses vary with floor number, as shown in Figure 23. When isolation vibration bearings are employed, the values of VLmax and VLz,max decrease first and then increase with the floor number. The building floor VLmax overall is below the JGJ/T 170-2009 standard limit for residential, commercial, and mixed-use building areas. The value of VLz,max in rooms k and j on the 12th floor is approximately 70.75 dB, which exceeds the GB/T 50355-2018 standard’s recommended night limit for bedrooms, but the difference is only 0.75 dB, which basically meets the guideline requirements.

5. Conclusions

To predict and control the train-induced vibration in over-track buildings, an in situ vibration measurement was conducted on the operation depot and its top head platform and a three-dimensional FE model of the track–soil–structure system was established. Then, the vibration control effect of vibration isolation bearings was discussed. The following conclusions can be drawn:
  • The peak acceleration measured on the rail was approximately 15 m/s2, which was significantly higher than the measurements taken on the column and top head platform, with vibration gradually weakening during transmission.
  • According to the numerical analysis, without vibration isolation bearings, the overall vibration response of the over-track building decreased and then increased with the increase in the floor number. Rooms h, j, and m significantly exceeded the standard limits. The maximum values of VLmax and VLz,max both appeared in room j on the top floor. The dominant frequency of the building floors was about 31.5 Hz, having a small decrease with the increase in the floor number.
  • After adopting vibration isolation bearings, the vertical natural vibration frequency of the superstructure was reduced, resulting in a low frequency of 4–10 Hz; the vibration amplification phenomenon commonly occurred in vibration isolation structures on the building floors.
  • Vibration isolation bearings had a significant reduction effect above 30 Hz, with the IL achieving a reduction of 7–15 dB, and the VLz,max values were reduced by 3–12 dB; the reduction effect was more pronounced on floors 7–12 compared to floors 1–6. The vibration response of the building floors has been reduced to meet the standard requirements.

Author Contributions

Methodology, X.S. and B.J.; Software and validation, T.W.; Formal analysis, T.W. and B.J.; Investigation, B.J.; Writing—original draft, T.W.; Writing—review and editing, X.S.; Supervision, X.S.; Funding acquisition, B.J. All authors have read and agreed to the published version of the manuscript.

Funding

This research was funded by the Tianjin Science and Technology Plan Project (22JCQNJC01710).

Data Availability Statement

Data derived from the current study can be provided to readers upon request.

Conflicts of Interest

The authors declare no conflict of interest.

References

  1. Handy, S. Smart Growth and the Transportation-Land Use Connection: What Does the Research Tell Us? Int. Reg. Sci. Rev. 2005, 28, 146–167. [Google Scholar] [CrossRef]
  2. Liu, W.; Li, C.; Ma, L.; Du, L. A frequency-domain formulation for predicting ground-borne vibration induced by underground train on curved track. J. Sound Vib. 2023, 549, 117578. [Google Scholar] [CrossRef]
  3. Hussein, M.; Hunt, H.; Kuo, K.; Costa, P.A.; Barbosa, J. The use of sub-modelling technique to calculate vibration in buildings from underground railways. Proc. Inst. Mech. Eng. Part F J. Rail Rapid Transit 2015, 229, 303–314. [Google Scholar] [CrossRef]
  4. Auersch, L. Building response due to ground vibration—Simple prediction model based on experience with detailed models and measurements. Int. J. Acoust. Vib. 2010, 15, 101. [Google Scholar] [CrossRef]
  5. Lopes, P.; Ruiz, J.F.; Costa, P.A.; Rodríguez, L.M.; Cardoso, A.S. Vibrations inside buildings due to subway railway traffic. Experimental validation of a comprehensive prediction model. Sci. Total Environ. 2016, 568, 1333–1343. [Google Scholar] [CrossRef] [PubMed]
  6. Cao, R.; Ma, M.; Sun, X.; Chen, J. Transmission characteristics of train-induced vibration in buildings based on wave propagation analysis. Constr. Build. Mater. 2023, 378, 13115. [Google Scholar] [CrossRef]
  7. Xu, L.; Ma, M. Analytical solution of ground-borne vibration due to spatially periodic harmonic moving load on a tunnel embedded in layered soil. J. Zhejiang Univ.-Sci. A 2023, 24, 637–652. [Google Scholar] [CrossRef]
  8. Connolly, D.P.; Marecki, G.P.; Kouroussis, G.; Thalassinakis, L.; Woodward, P.T. The growth of railway ground vibration problems—A review. Sci. Total Environ. 2016, 568, 1276–1282. [Google Scholar] [CrossRef]
  9. Zou, C.; Wang, Y.; Wang, P.; Gou, J. Measurement of ground and nearby building vibration and noise induced by trains in a metro depot. Sci. Total Environ. 2015, 536, 761–773. [Google Scholar] [CrossRef]
  10. Zou, C.; Wang, Y.; Moore, J.A.; Sanayei, M. Train-induced field vibration measurements of ground and over-track buildings. Sci. Total Environ. 2017, 575, 1339–1351. [Google Scholar] [CrossRef]
  11. Cao, Z.; Guo, T.; Zhang, Z.; Li, A. Measurement and analysis of vibrations in a residential building constructed on an elevated metro depot. Measurement 2018, 125, 394–405. [Google Scholar] [CrossRef]
  12. Liang, R.; Ding, D.; Liu, W.; Sun, F.; Cheng, Y. Experimental study of the source and transmission characteristics of train-induced vibration in the over-track building in a metro depot. J. Vib. Control 2022, 29, 107754632110701. [Google Scholar] [CrossRef]
  13. Liao, Y.; Zhang, P.; Wu, Q.; Zhang, H. A Case Study on Structural Serviceability Subjected to Railway-Induced Vibrations at TOD Developed Metro Depot. Buildings 2022, 12, 1070. [Google Scholar] [CrossRef]
  14. Tao, Z.; Hu, Z.; Wu, G.; Huang, C.; Zou, C.; Ying, Z. Train-Induced Vibration Predictions Based on Data-Driven Cascaded State-Space Model. Buildings 2022, 12, 114. [Google Scholar] [CrossRef]
  15. Clot, A.; Arcos, R.; Romeu, J. Efficient Three-Dimensional Building-Soil Model for the Prediction of Ground-Borne Vibrations in Buildings. J. Struct. Eng. 2017, 143, 04017098. [Google Scholar] [CrossRef]
  16. Wolf, S. Potential low frequency ground vibration (<6.3 Hz) impacts from underground LRT operations. J. Sound Vib. 2003, 267, 651–661. [Google Scholar]
  17. Jin, Q.; Thompson, D.J.; Lurcock, D.E.J.; Toward, M.G.R. A 2.5D finite element and boundary element model for the ground vibration from trains in tunnels and validation using measurement data. J. Sound Vib. 2018, 422, 373–389. [Google Scholar] [CrossRef] [Green Version]
  18. Hung, H.H.; Chen, G.H.; Yang, Y.B. Effect of railway roughness on soil vibrations due to moving trains by 2.5D finite/infinite element approach. Eng. Struct. 2013, 57, 254–266. [Google Scholar] [CrossRef]
  19. Sanayei, M.; Maurya, P.; Zhao, N.; Moore, J.A. Impedance modeling: An efficient modeling method for prediction of building floor vibrations. Struct. Congr. 2012, 2012, 886–897. [Google Scholar]
  20. Sanayei, M.; Moore, J.A.; Brett, C.R. Measurement and prediction of train-induced vibrations in a full-scale building. Eng. Struct. 2014, 77, 119–128. [Google Scholar] [CrossRef]
  21. Zou, C.; Moore, J.A.; Sanayei, M.; Wang, Y. Impedance model for estimating train-induced building vibrations. Eng. Struct. 2018, 172, 739–750. [Google Scholar] [CrossRef]
  22. Zou, C.; Moore, J.A.; Sanayei, M.; Tao, Z. Efficient impedance model for the estimation of train-induced vibrations in over-track buildings. J. Vib Control 2021, 27, 924–942. [Google Scholar] [CrossRef]
  23. Tao, Z.; Moore, J.A.; Sanayei, M.; Wang, Y.; Zou, C. Train-induced floor vibration and structure-borne noise predictions in a low-rise over-track building. J. Eng. Struct. 2022, 255, 113914. [Google Scholar] [CrossRef]
  24. Vogiatzis, K.E.; Kouroussis, G. Prediction and efficient control of vibration mitigation using floating slabs: Practical application at Athens metro lines 2 and 3. Int. J. Rail Transp. 2015, 3, 215–232. [Google Scholar] [CrossRef]
  25. Ma, M.; Liu, W.; Li, Y.; Liu, W. An experimental study of vibration reduction of a ballasted ladder track. J. Proc. Inst. Mech. Eng. Part F J. Rail Rapid Transit 2017, 231, 0954409716642488. [Google Scholar] [CrossRef]
  26. Sun, X.; Ma, M.; Jiang, B.; Cao, R. Ground vibration from freight railway: Environmental impact and potential mitigation measure at propagation path. Environ. Sci. Pollut. Res. 2022, 29, 44364–44377. [Google Scholar] [CrossRef]
  27. Li, Z.; Ma, M.; Liu, K.; Jiang, B. Performance of rubber-concrete composite periodic barriers applied in attenuating ground vibrations induced by metro trains. Eng. Struct. 2023, 285, 116027. [Google Scholar] [CrossRef]
  28. Fiala, P.; Degrande, G.; Augusztinovicz, F. Numerical modelling of ground-borne noise and vibration in buildings due to surface rail traffic. J. Sound Vib. 2007, 301, 718–738. [Google Scholar] [CrossRef]
  29. Ulgen, D.; Ertugrul, O.L.; Ozkan, M.Y. Measurement of ground borne vibrations for foundation design and vibration isolation of a high-precision instrument. Measurement 2016, 93, 385–396. [Google Scholar] [CrossRef]
  30. Takei, Y.; Yamada, S.; Izumi, Y.; Fujii, K. Application of seismic and vibration isolation structure system to design of over-track buildings. Q. Rep. RTRI 2007, 48, 50–57. [Google Scholar] [CrossRef] [Green Version]
  31. Zou, C.; Wang, Y.; Zhang, X.; Tao, Z. Vibration isolation of over-track buildings in a metro depot by using trackside wave barriers. J. Build. Eng. 2020, 30, 101270. [Google Scholar] [CrossRef]
  32. Yang, J.; Zhu, S.; Zhai, W.; Kouroussis, G.; Wang, Y. Prediction and mitigation of train-induced vibrations of large-scale building constructed on subway tunnel. Sci. Total Environ. 2019, 668, 485–499. [Google Scholar] [PubMed]
  33. Zhou, Y.; Zhang, Z. Experimental and analytical investigations on compressive behavior of thick rubber bearings for mitigating subway-induced vibration. Eng. Struct. 2022, 270, 114879. [Google Scholar]
  34. Zhou, Y.; Zhang, Z.; Vassiliou, M.F. Mechanical Properties of Thick Rubber Bearings Used in Over-Track Buildings. In Proceedings of the 17th World Conference on Seismic Isolation (17WCSI), Torino, Italy, 11–15 September 2022; Springer: Cham, Switzerland; pp. 179–189. [Google Scholar]
  35. Sun, X.J. Prediction of Environment Vibrations Induced by Metro Trains and Mitigation Measures Analysis. Ph.D. Thesis, Beijing Jiaotong University, Beijing, China, 2008. [Google Scholar]
  36. JGJ/T 170-2009; Standard for Limit and Measuring Method of Building Vibration and Secondary Noise Caused by Urban Rail Transit. Ministry of Housing and Urban-Rural Development of the People’s Republic of China: Beijing, China, 2009.
  37. GB/T50355-2018; Standard for Limits and Measurement Methods of Vibration in the Room of Residential Building. Ministry of Housing and Urban-Rural Development of the People’s Republic of China: Beijing, China, 2018.
  38. Muhr, A.H. A comparison of rubber and metal springs for vibration isolation. Plast. Rubber Compos. Process. Appl. 1992, 18, 3–7. [Google Scholar]
  39. Chen, H.W.; Pan, P.; Liu, J.C.; Sakurai, Y.; Nakamura, M.; Murota, N. Test of thick rubber bearings on its compressive properties. Adv. Mater. 2014, 919, 348–354. [Google Scholar] [CrossRef]
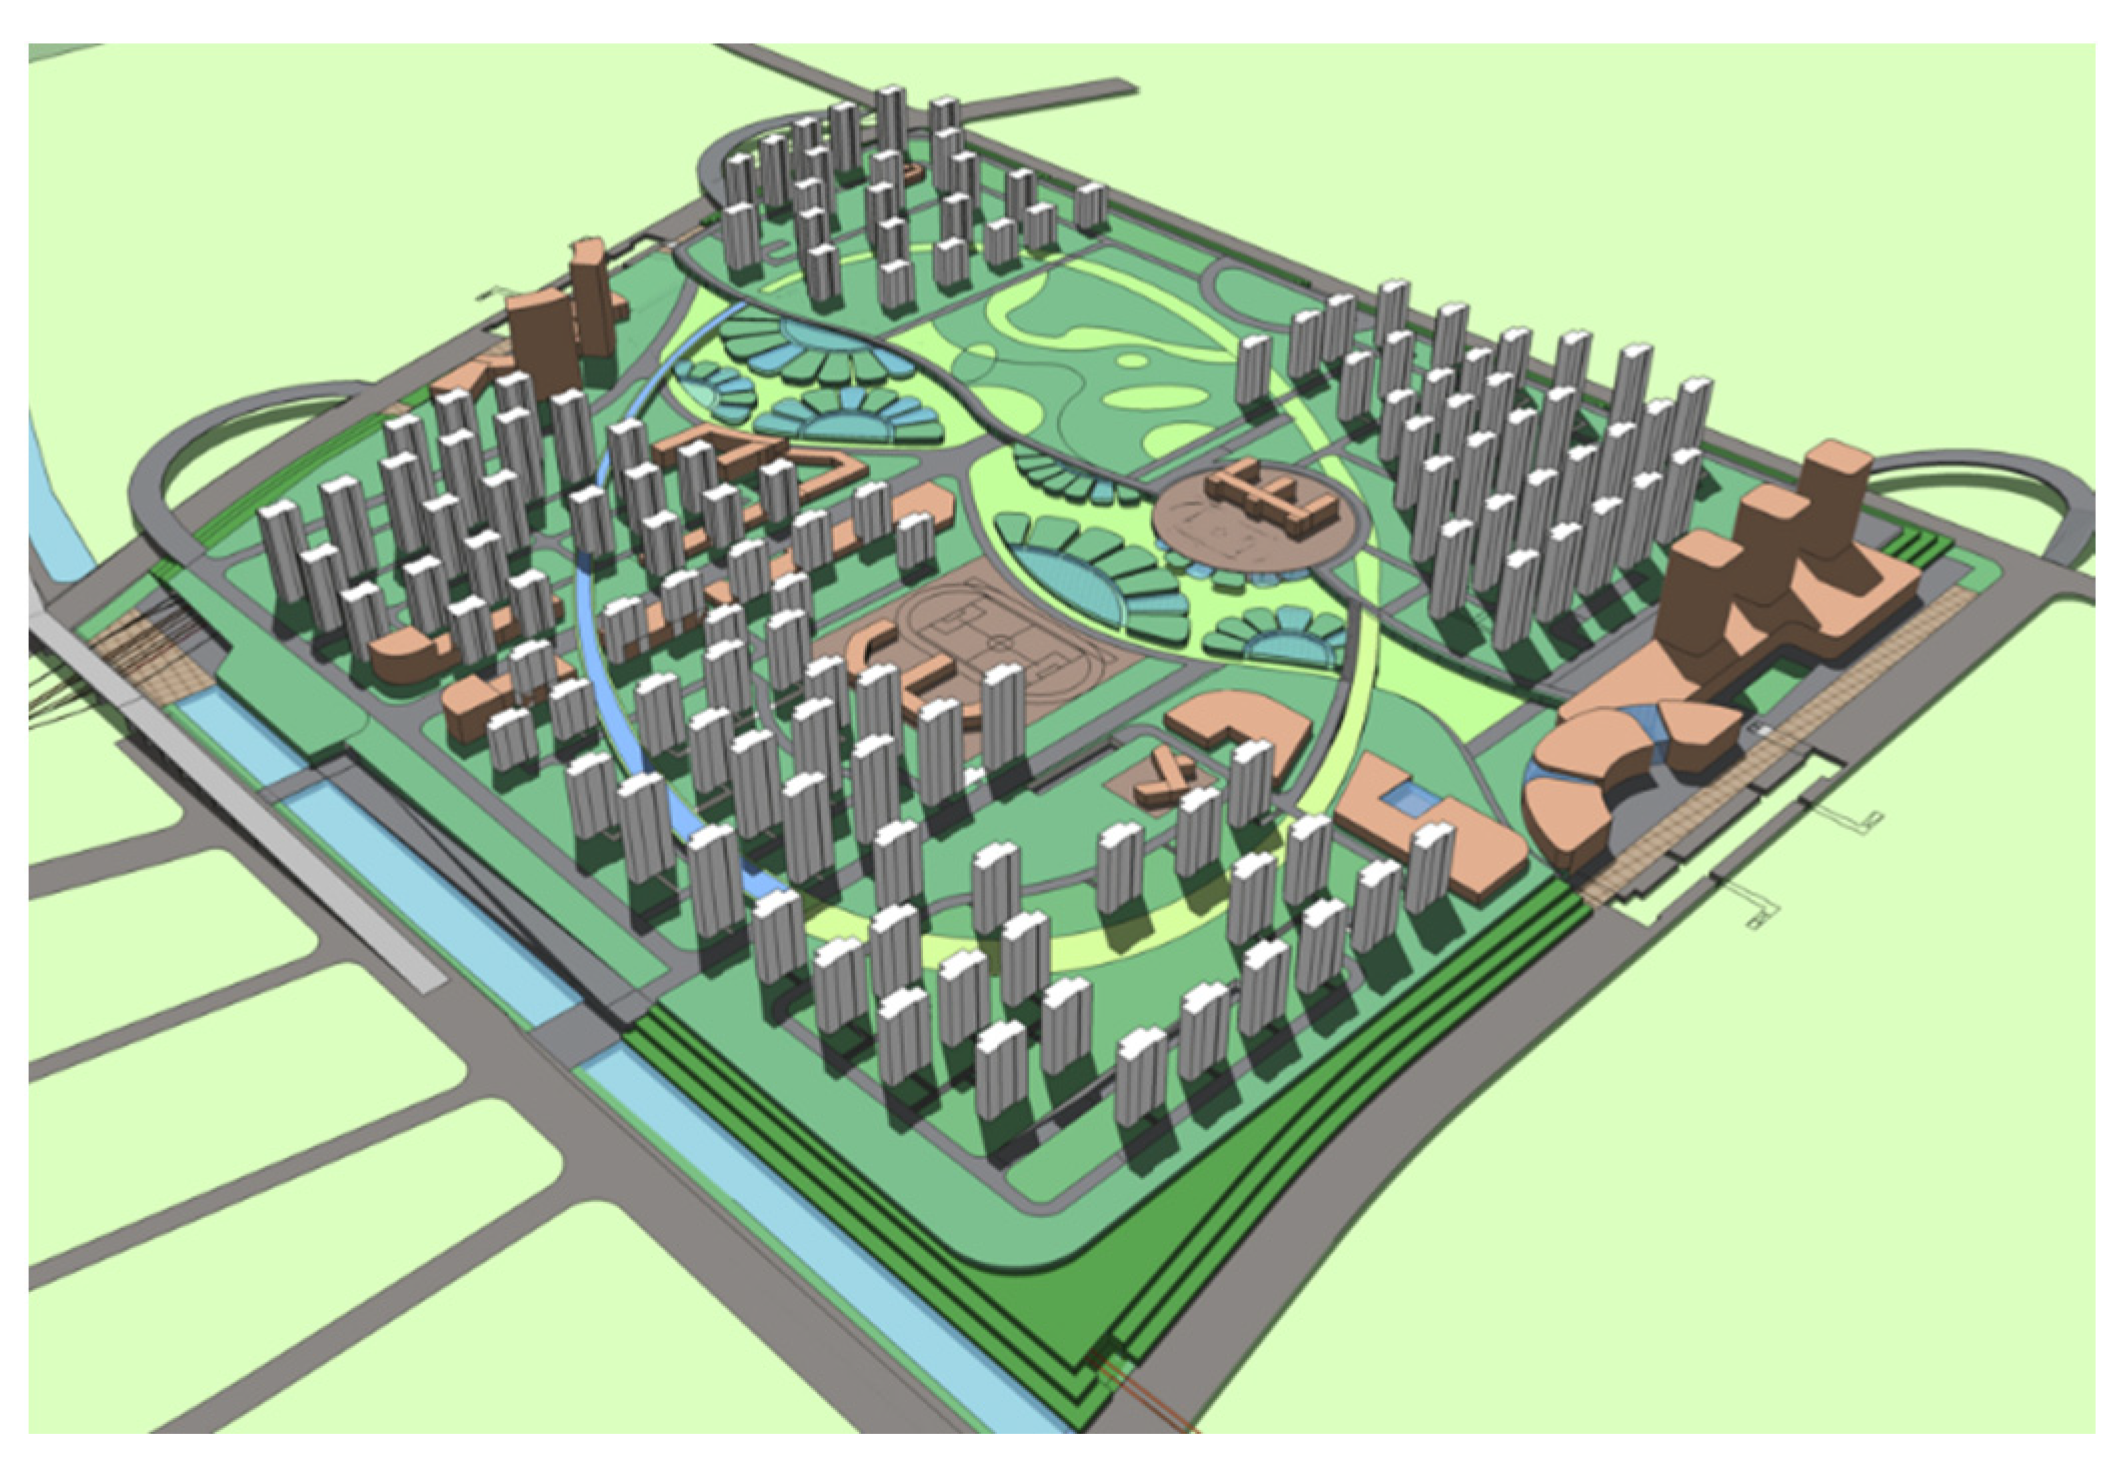
Figure 1. Layout of the metro depot.
Buildings 13 01995 g001
Figure 2. Layout of the primary construction.
Buildings 13 01995 g002
Figure 3. Section of residential building.
Buildings 13 01995 g003
Figure 4. Layout of field measurement points: (a) operation depot rail measurement points; (b) operation depot column measurement points; (c) top head platform measurement points.
Buildings 13 01995 g004
Figure 5. Vibration of the rail: (a) acceleration time history; (b) acceleration frequency spectra.
Buildings 13 01995 g005
Figure 6. Acceleration time–history of the operation depot column and top head platform.
Buildings 13 01995 g006
Figure 7. Vibration responses of the operation depot column and top head platform: (a) frequency spectrum; (b) one-third octave spectrum.
Buildings 13 01995 g007
Figure 8. Finite element model.
Buildings 13 01995 g008
Figure 9. Room number definition of the over-track building.
Buildings 13 01995 g009
Figure 10. Measured and calculated time history of rail vertical acceleration: (a) rail measured data; (b) rail calculated data.
Buildings 13 01995 g010
Figure 11. Simplified model of metro trains [35].
Buildings 13 01995 g011
Figure 12. Vibration response of train load (V = 5 km/h): (a) time history of train load; (b) one-third octave spectrum of train load.
Buildings 13 01995 g012
Figure 13. Depot foundation and superstructure platform model.
Buildings 13 01995 g013
Figure 14. Vibration response of column and top head platform: (a) one-third octave spectrum of column; (b) one-third octave spectrum of top head platform.
Buildings 13 01995 g014
Figure 15. Floor vibration responses in one-third octave bands of (am) rooms.
Buildings 13 01995 g015aBuildings 13 01995 g015b
Figure 16. VLmax varying with floor number: (a) box diagram; (b) point and line diagram.
Buildings 13 01995 g016
Figure 17. VLz,max varying with floor number: (a) box diagram; (b) point and line diagram.
Buildings 13 01995 g017
Figure 18. Layout of rubber vibration isolation bearings.
Buildings 13 01995 g018
Figure 19. Comparison of model modal results: (a) 1st overall mode original model; (b) 1st overall mode vibration isolation model; (c) vertical 1st mode original model; (d) vertical 1st mode vibration isolation model; (e) floor 1st mode original model; (f) floor 1st mode vibration isolation model.
Buildings 13 01995 g019aBuildings 13 01995 g019b
Figure 20. Vibration levels of three rooms: (a) room h, 11th story; (b) room j, 11th story; (c) room m, 11th story.
Buildings 13 01995 g020aBuildings 13 01995 g020b
Figure 21. Insertion loss of three rooms: (a) room h; (b) room j; (c) room m.
Buildings 13 01995 g021
Figure 22. VLz,max of three rooms: (a) room h; (b) room j; (c) room m.
Buildings 13 01995 g022
Figure 23. (a) VLmax and (b) VLz,max varying with floor number after adopting vibration isolation bearings.
Buildings 13 01995 g023
Table 1. Finite element model material dynamic parameters.
TitleDepth
(m)
Dynamic Elastic Modulus (MPa)Mass
Density
(kg/m3)
Poisson’s
Ratio
Damping Ratio
Soil layer I615019200.40.05
Soil layer II1020020300.30.04
Soil layer III1460019700.30.03
Trackbed//42,00020000.30.02
Beam/Column/Plate/32,50025000.350.02
Table 2. Parameters of metro trains at Tianjin Metro [35].
ParameterValueParameterValue
Carriage mass with full passenger capacity m3 (t)43.0Spring factor of bogie
kT (kN/m)
2080
Carriage mass moment of inertia J (tm2)1700Damping factor of bogie CT (kN·S/m)240
Bogie mass m2 (t)3.60Spring factor of bogie of wheels (kN/m)2450
Bogie mass moment of inertia J (tm2)9.62Damping factor of bogie of wheels (kN·s/m)240
Train length L (m)19.52Train space L (m)12.66
Axle base a (m)2.30Mass of every two wheels m1 (t)1.70
Table 3. Guideline-limited values suggested by JGJ/T170-2009 (dB) [36].
AreaDayNight
Special buildings6562
Residential and educational buildings6562
Residential, commercial, and mixed-use buildings7067
Industrial buildings7572
Table 4. Guideline-limited value of VLz,max inside residential buildings suggested by GB50355-2018 (dB) [37].
Room TypeLimit Value LevelTime PeriodLimit Value
BedroomRecommendedDay73
Night70
mandatoryDay78
Night75
Living roomRecommendedDay and night73
mandatoryDay and night78
Table 5. Parameters of rubber vibration isolation bearings.
ModelBearing Diameter (mm)Bearing Height
(mm)
Long Term Load
(kN)
Vertical Stiffness (kN/mm)Natural Frequency (Hz)
I80040045387506.47
II70038533275506.47
III50032019363206.46
Table 6. Comparison of model modal results.
Model1st Mode Overall Frequency (Hz)Vertical 1st Mode (Hz)Floor 1st Mode
(Hz)
Original model4.832020
Vibration isolation model1.726.4722.99
Disclaimer/Publisher’s Note: The statements, opinions and data contained in all publications are solely those of the individual author(s) and contributor(s) and not of MDPI and/or the editor(s). MDPI and/or the editor(s) disclaim responsibility for any injury to people or property resulting from any ideas, methods, instructions or products referred to in the content.