Article

Numerical Analysis and Experimental Investigation of High Cycle Fatigue Behavior in Additively Manufactured Ti–6Al–4V Alloy

1
CRITT Mécanique & Composites, University of Toulouse III—Paul Sabatier, 31400 Toulouse, France
2
OPT’ALM Company, Lieu-Dit Saint Caprais, 31330 Grenade, France
3
Department of Advanced Science and Technology, Toyota Technological Institute, Nagoya 468-8511, Japan
*
Authors to whom correspondence should be addressed.
Buildings 2023, 13(8), 2011; https://doi.org/10.3390/buildings13082011
Submission received: 23 June 2023 / Revised: 23 July 2023 / Accepted: 3 August 2023 / Published: 7 August 2023

Abstract

:
Additive Manufacturing (AM) of the Ti–6Al–4V alloy has gained significant importance across various industries, including biomedical, aerospace, cellular, and land vehicle applications, due to its numerous benefits. The certification of performance and reliability of AM materials, particularly for critical applications, heavily relies on evaluating fatigue strength. In this study, a numerical analysis based on the finite element method is presented to predict the High Cycle Fatigue (HCF) behavior of AM Ti–6Al–4V alloy. The investigation focuses on exploring the sensitivity of material fatigue life to surface roughness and Ultimate Tensile Strength (UTS). Uniaxial tensile and High Cycle Fatigue (HCF) tests were conducted on Ti–6Al–4V alloy samples extracted from rectangular walls manufactured using the Laser Metal Deposition (LMD) process. The walls were surface machined prior to sample extraction. Porosity and surface roughness measurements were performed on the samples. Numerical simulations of the HCF tests were carried out, considering various surface roughness ranges and UTS values. The numerical results were then compared to experimental data. The findings consistently demonstrated that higher surface roughness led to a shorter fatigue life, while higher UTS values resulted in a longer fatigue life. The numerical solutions aligned with the experimental results, indicating the efficacy of the finite element method in predicting the fatigue behavior of AM Ti–6Al–4V alloy. These insights contribute to a better understanding of the relationship between surface roughness, UTS, and fatigue life of Ti–6Al–4V alloys manufactured by AM.

1. Introduction

The Ti–6Al–4V alloy is highly regarded in various industries, including aerospace, marine, automobile, energy, chemical, and biomedical, owing to its exceptional corrosion resistance, low density, high strength, and biocompatibility [1,2,3,4,5]. Metal additive manufacturing processes have emerged as attractive methods for producing components using Ti–6Al–4V [3,4,6,7]. These techniques involve layer-by-layer deposition, melting, and solidification of powder or wire materials [3,7,8]. The advantages of these technologies lie in their ability to manufacture parts with complex geometries, introduce new functionalities, and significantly reduce material waste, manufacturing time, and labor costs compared to traditional manufacturing methods [3,4,5,7,9,10]. However, to fully harness the potential benefits of these technologies, it is crucial to ensure that the performance of additively manufactured components is comparable to their counterparts produced using traditional methods, particularly in terms of their mechanical properties. Currently, the characterization of these mechanical properties remains challenging, as there is no established robust correlation between processing parameters, microstructure, and mechanical properties of additively manufactured components. This knowledge gap hampers the widespread application of these technologies, particularly in critical fields [4,5,11,12,13,14].
Fatigue strength plays a crucial role in certifying the performance and reliability of materials [1,7,15,16]. The existing literature on additively manufactured Ti–6Al–4V materials indicates a significant dispersion of fatigue strength values, primarily due to structural defects such as porosity, lack of fusion, surface roughness, and residual stresses [3,5,14,17,18,19,20,21]. Surface roughness has been identified as a significant factor contributing to the reduced fatigue life of additively manufactured Ti–6Al–4V materials [4,21,22,23,24]. To mitigate or eliminate these structural defects, post-processing techniques such as surface machining and Heat and/or Hot Isostatic Pressing (HIP) treatments are employed [3,4,5,15,25,26,27,28]. However, due to the variability in build defects, uncertainty often arises regarding the fatigue behavior of these materials [12,14]. Therefore, a comprehensive understanding of the correlation between structural defects and the fatigue life of additively manufactured materials is crucial [12,14]. Several ongoing studies based on fracture mechanics or probabilistic approaches aim to incorporate one or more of these structural defects into fatigue models to accurately predict the fatigue life of additively manufactured parts [1,12,14,16,29,30]. Nevertheless, a globally accepted and efficient fatigue model is yet to be established [12,14].
Finite element analysis is widely considered the most suitable approach for solving complex mechanical problems. Advanced fatigue analysis technologies, such as fe-safe® software 2019, have been developed based on modern fatigue theories to analyze finite element models. These technologies allow for the consideration of various factors influencing fatigue strength, including surface finishes and material parameters, in fatigue analysis.
In this study, uniaxial High Cycle Fatigue (HCF) tests were conducted on Ti–6Al–4V samples manufactured using the Laser Metal Deposition (LMD) process. The porosity and surface roughness of the samples were measured, and a fatigue analysis utilizing the finite element method and the robust fatigue analysis capabilities of fe-safe software was developed. The sensitivity of the additively manufactured samples to two parameters, surface roughness and Ultimate Tensile Strength (UTS), was analyzed. Finally, the numerical solutions were compared to the experimental data to validate the analysis.

2. Materials and Methods

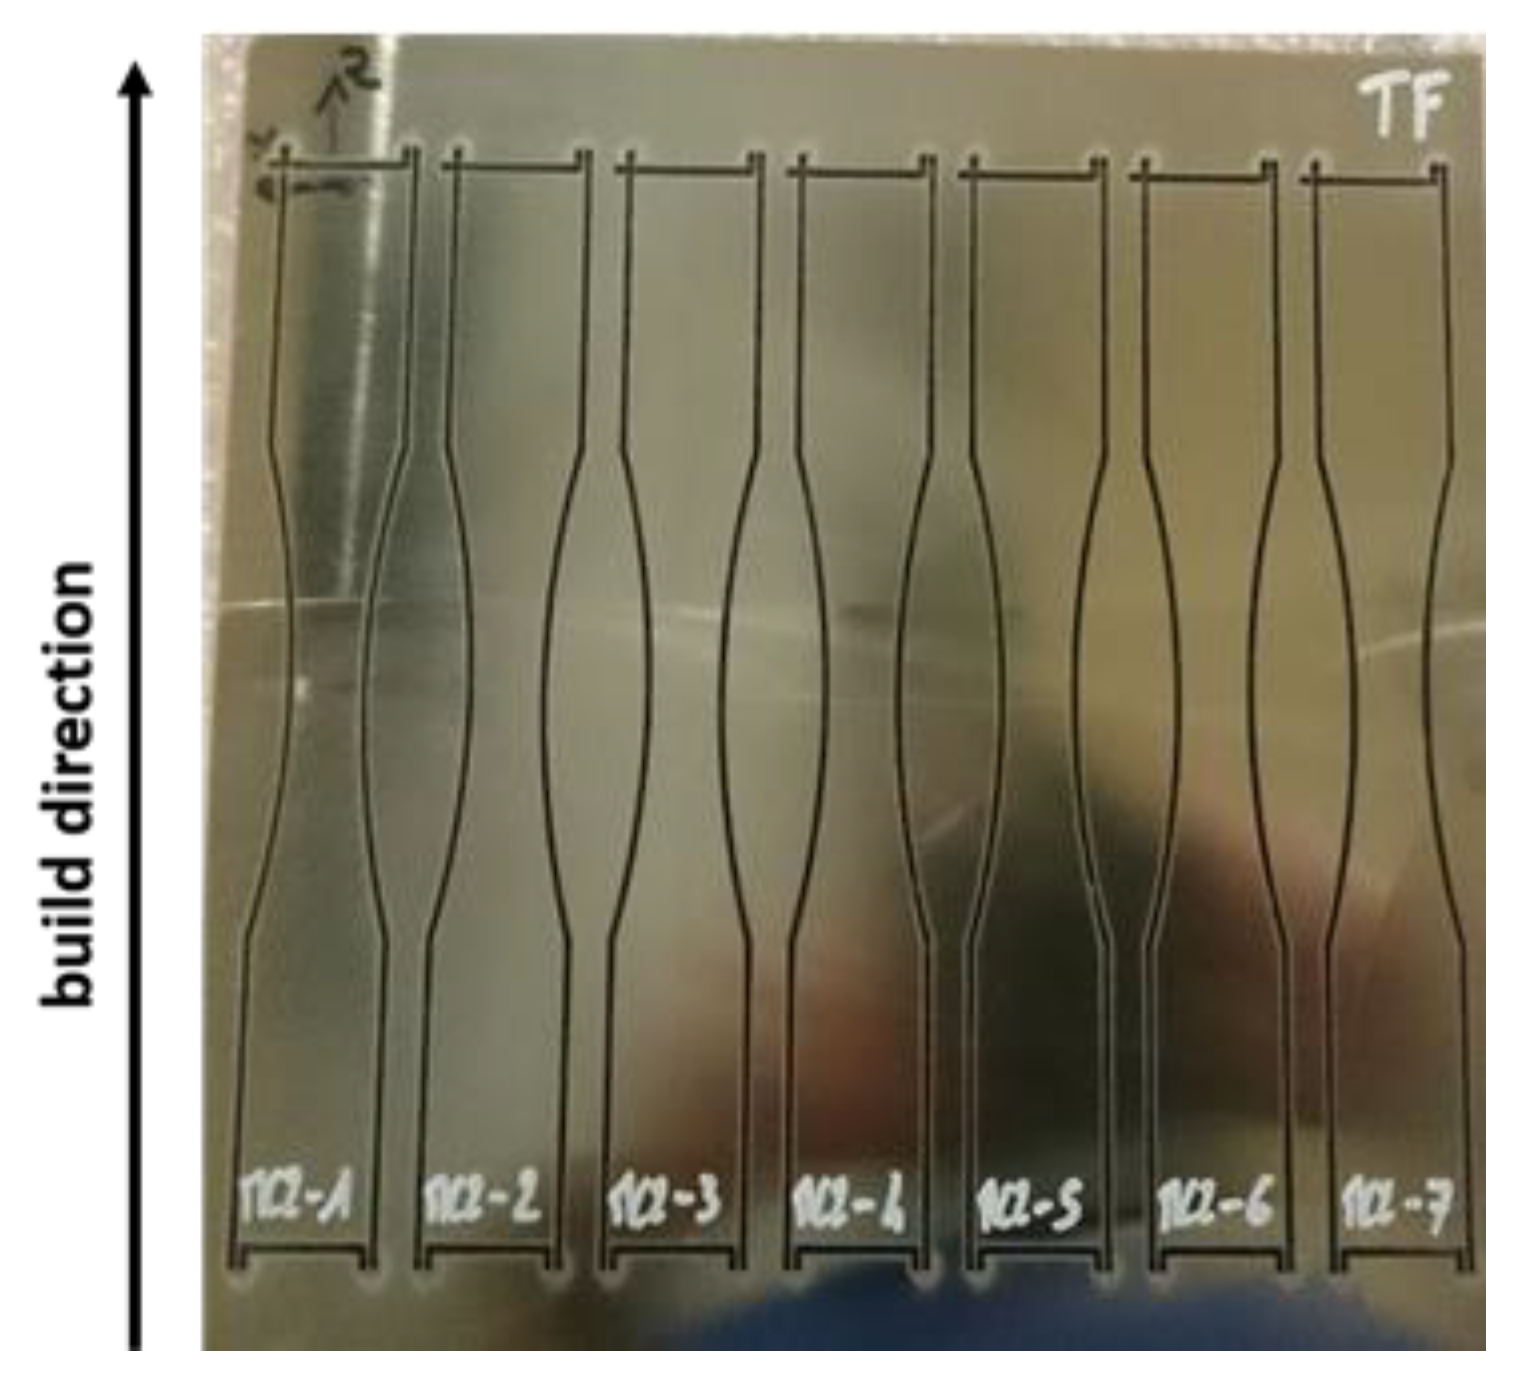
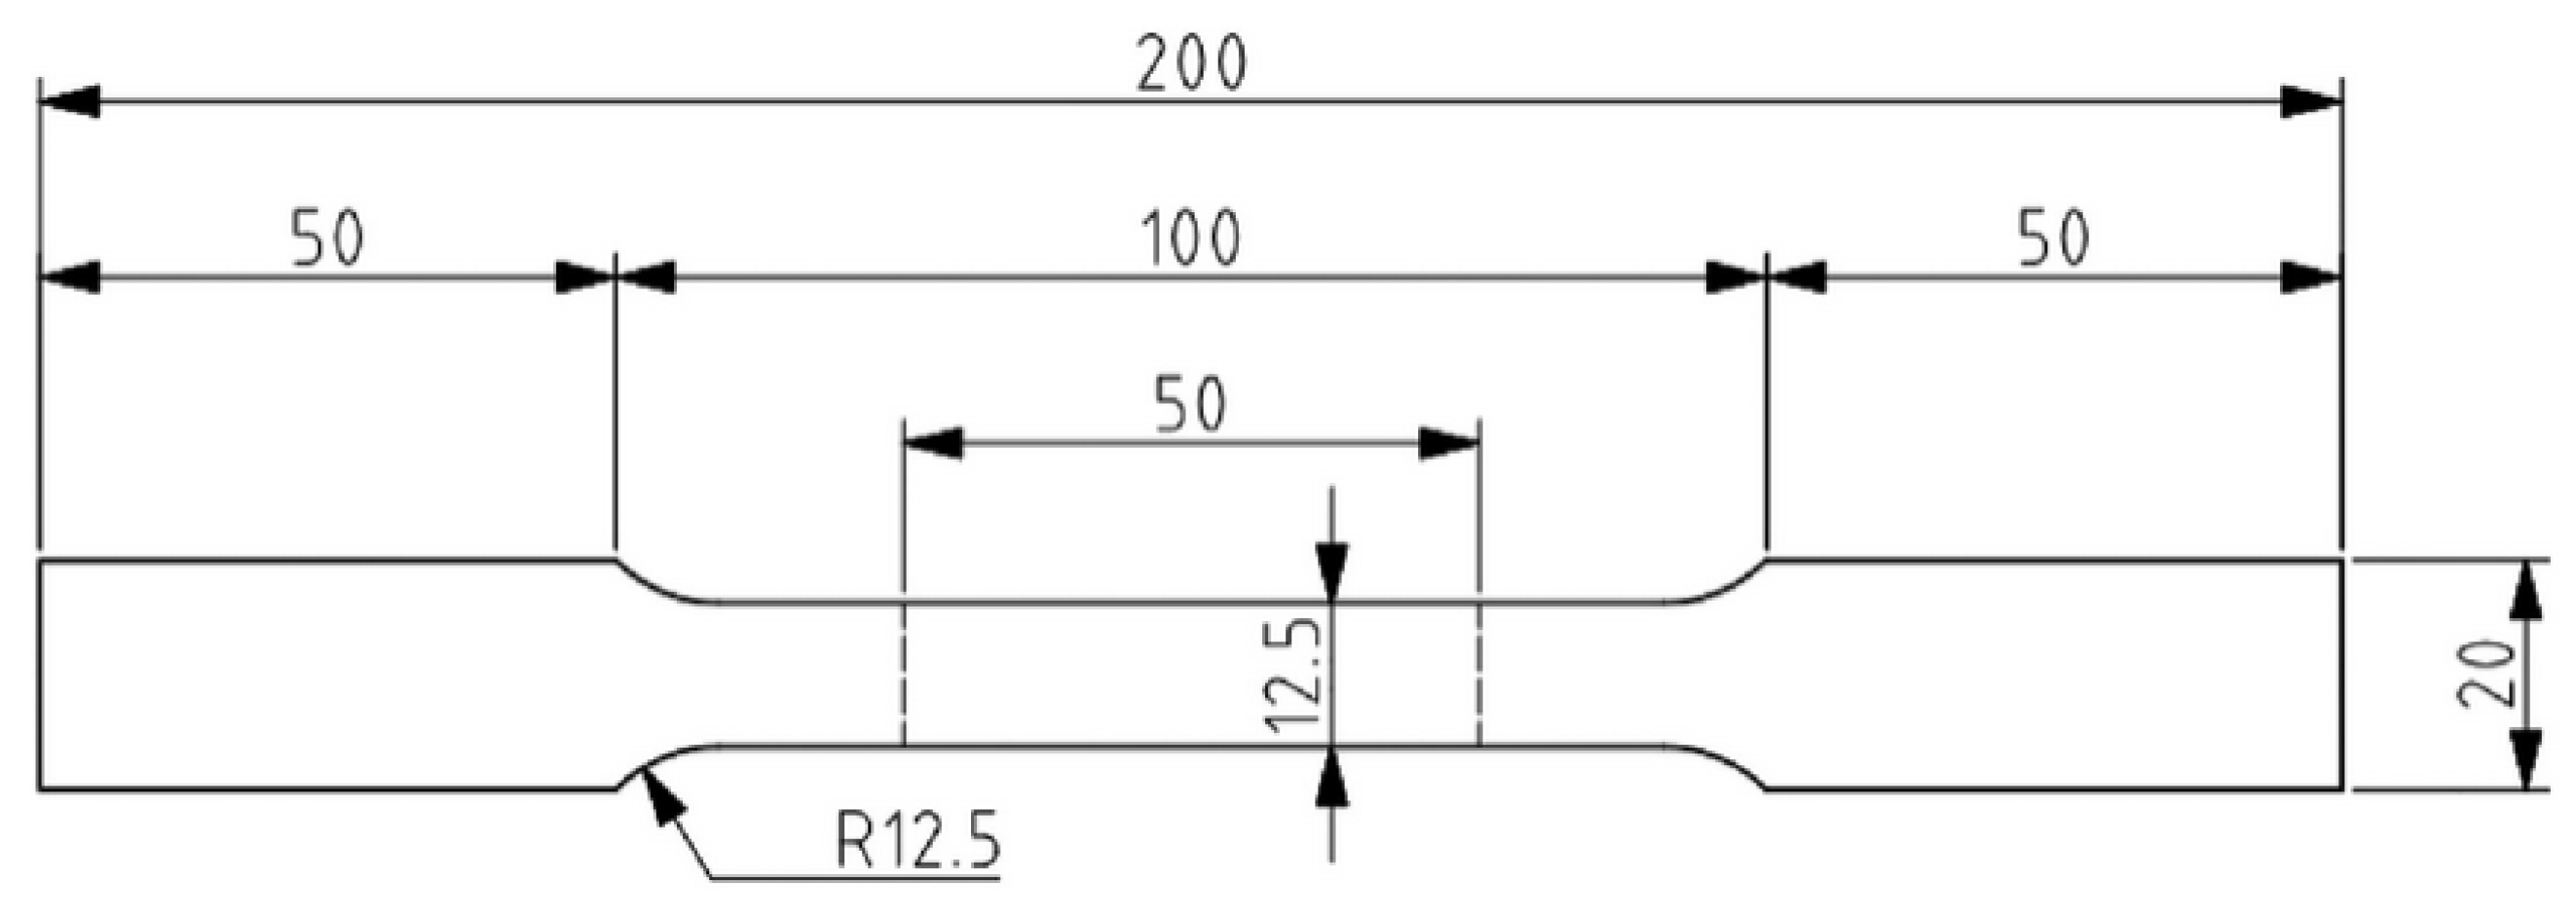
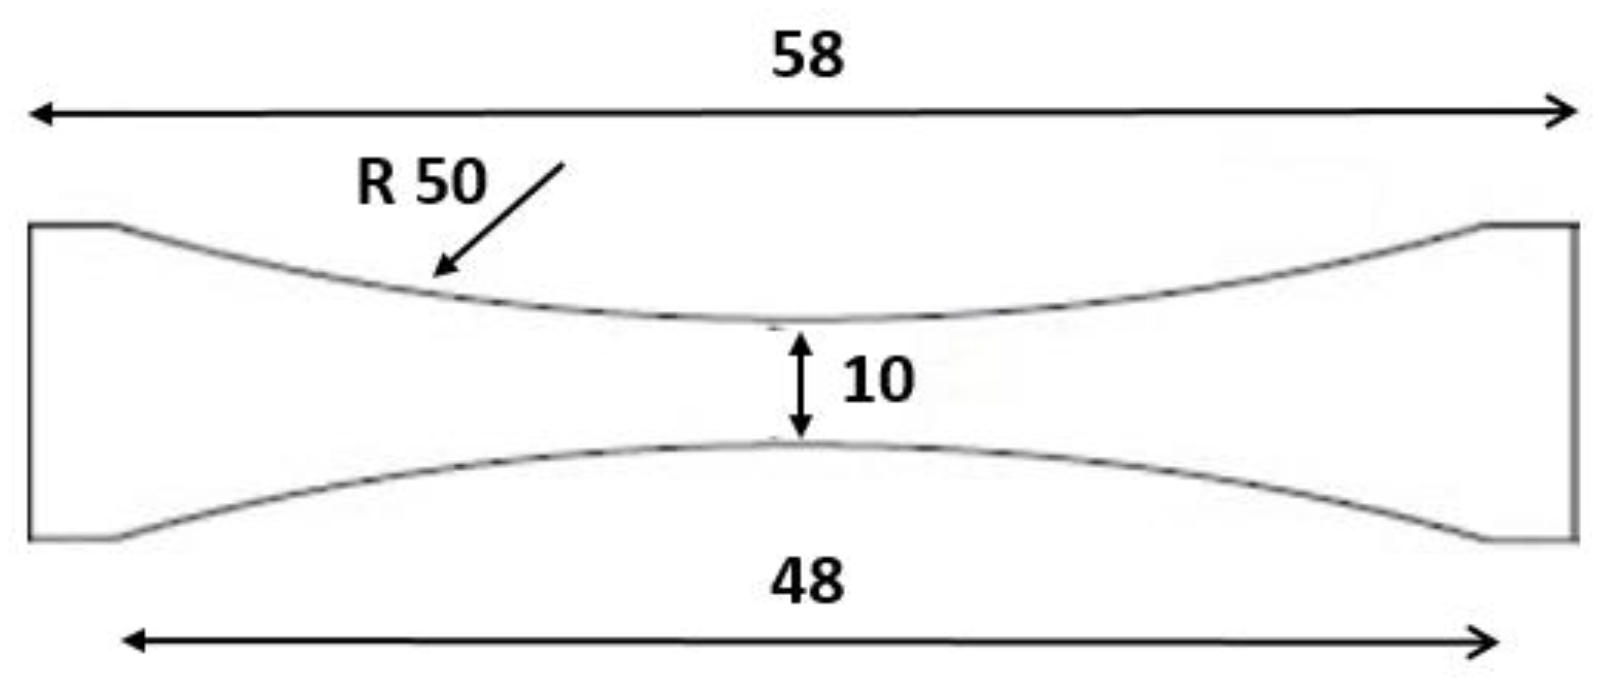
2.1. Samples and Experimental Tests

The powder-based Laser Metal Deposition (LMD) process was utilized to construct four rectangular walls, measuring 240 × 205 × 5.2 mm. These walls were subsequently surface machined on both sides to achieve a thickness of 4 mm. Twenty-one samples were extracted from three of the walls to conduct fatigue tests, while four samples were extracted from the fourth wall for tensile tests. All samples were extracted in the build direction, which is perpendicular to the substrate. The manufacturing of the walls was performed using a BeAM Modulo 400 machine, which comprises a continuous five-axis system. This system drives a laser deposition head with a spot size ranging from 0.8 to 1.2 mm (with a precision of 0.1 mm) and a 2 kW laser fiber source. The powder feed nozzle generates a track of solidified material with each pass. To minimize the porosity of the additively manufactured material, tracks with a thickness of 0.8 mm were deposited with a 40% overlap. The tracks of adjacent fused material form the layers of the material. Figure 1 illustrates an example of fatigue samples before being fully detached from the built walls. The samples were cut using abrasive water. The surface roughness of all the samples was measured using the AL-ICONA profilometer (in accordance with ISO 4287 [31]). The measurements were conducted at the center of the samples.
The tensile samples were designed following ISO 6892-1 [32], method A (Figure 2). Tensile testing was conducted at room temperature using a 3R testing machine (SYNTECH 150) with a maximum load capacity of 150 kN. A dynamic extensometer gauge, Catalog 2620-601, was utilized for direct static measurement of deformation. The extensometer features a 12.5 mm gauge length with a travel range of ±5 mm, allowing for ±40% strain. Tensile tests were performed at a strain rate of 0.025% per second.
The fatigue samples were designed in accordance with the NF-EN 6072 [33] standard (method Kt = 1, 0) (Figure 3). High Cycle Fatigue (HCF) tests were conducted using a SCHENCK Hydropuls PS3007B machine with a load capacity of 100 kN. Stress-controlled HCF tests were performed at room temperature, with a load ratio of R = 0.1 and a sinusoidal cycle frequency of 10 Hz. Twenty-one tests were carried out at six stress levels, each corresponding to a percentage of the material’s proportional limit as determined from the tensile tests. The selected percentages were 95, 90, 85, 80, 70, 60%. This resulted in stress levels for HCF testing ranging approximately between 480 and 760 MPa. For each stress level, at least three samples were tested, except for the 60% level where only two samples were tested. The number of cycles until sample failure was directly displayed on the console of the testing machine.

2.2. X-ray Computed Tomography (CT)

EasyTom 130 Micro CT scanners were utilized to conduct X-ray tomography on the AM samples, employing a non-destructive technique based on high-resolution digital radioscopy. This technique allowed for capturing the internal and external geometry of complex parts, as well as identifying possible defects, with a measurement accuracy of 10 µm. The purpose of the X-ray tomography was to analyze the porosity and estimate its surface fraction in the AM samples. A volume of approximately 5 × 5 × 5 mm3, centered on the axis of symmetry of the sample and located 20 mm from the upper surface, was selected for the CT scan. Each sample was incrementally rotated, resulting in a total of 962 2D X-ray images recorded in each direction (x, y, and z) during the CT scan. The X-ray CT data were analyzed using ImageJ software 2020, with a pixel length unit of 5 µm chosen for the analysis.

2.3. Numerical Fatigue Analysis

The numerical fatigue analysis was conducted using Abaqus/FEA coupled with fe-safe, a powerful fatigue analysis software from SIMULIA for finite element models. A two-dimensional model in Abaqus/Standard 2019 finite element code was used to simulate the uniaxial fatigue test. The dimensions of the experimental samples (Figure 3) were incorporated into the finite element model. Linear quadrilateral elements of type CPE4R were employed to mesh the model geometry, resulting in a total of 7800 elements. The central region of the model was assigned finer elements. One boundary of the model was fixed, while a load was applied to the opposite boundary. The material properties assumed in the analysis were isotropic elasticity with a Young’s modulus of 113 GPa, a Poisson’s ratio of 0.3, and a yield strength of 800 MPa. A load of 24 kN was applied to the model. The material parameters were determined from monotonic tensile tests. Once the Finite Element Analysis (FEA) solutions were obtained, the output file (*.odb) from Abaqus was imported into fe-safe software for fatigue analysis. The fe-safe elastic block method was selected for this analysis. The uniaxial stress–life algorithm was used to calculate the S–N curve, defined by the Basquin relationship [34]:
σ a = σ m a x σ m i n 2 = σ f ( 2 N f ) b
where σa is the stress amplitude; σ m a x and σ m i n are the maximum and the minimum stress, respectively; 2Nf is the number of reversals (half-cycles) to failure; the fatigue strength coefficient, σf, represents the intercept at 2Nf = 1 reversal; and b is the fatigue strength exponent (Basquin’s exponent).
For this algorithm, elastic Finite Element Analysis (FEA) stresses are needed. These stresses are then converted to elastic–plastic stress–strain using a multiaxial cyclic plasticity correction. The Goodman mean stress correction method was chosen for endurance prediction. The Goodman mean stress correction can be expressed as follows:
σ a σ a 0 + σ m U T S = 1
where σ m = σ m a x + σ m i n 2 is the mean stress; σ a is the equivalent stress amplitude at zero mean stress; and UTS is the material ultimate tensile strength. σ a and σ m are used to calculate σ a 0 . The UTS is required for normal stress analyses using Goodman mean stress correction. For this analysis, a value of 1044 MPa was selected for the UTS. The experimental stress amplitudes (Section 2.1) were applied to the model.
As stated above, the surface finish of AM materials is an important factor influencing fatigue strength. The fatigue strength analysis can consider surface roughness by utilizing surface finish corrections incorporated in the fe-safe software code. Different surface finish corrections can be specified based on the average roughness parameter, Ra. In this study, three predefined Ra ranges were selected: Ra < 0.25 µm, 0.6 < Ra < 1.6 µm, and 1.6 < Ra < 4 µm. The first range represents a mirror-polished surface finish. Each Ra range corresponds to a default curve of a surface finish factor, Kt, as a function of UTS. For a given UTS value, Kt is obtained from the corresponding curve. For a mirror-polished surface, Kt is equal to 1 regardless of the UTS value. The surface finish factors are employed in Neuber’s rule, which converts the elastic FEA stresses into elastic–plastic stress/strain. To estimate fatigue damage, fe-safe applies Miners’ rule, expressed as follows:
n N = 1
where n is the number of applied cycles and N is the number of cycles to failure obtained from the endurance curve. Failure will occur when n = N.
Details on the Neuber’s rule and Neuber’s rule are provided in the Fatigue Theory Reference Manual of fe-safe 2019.

3. Results and Discussion

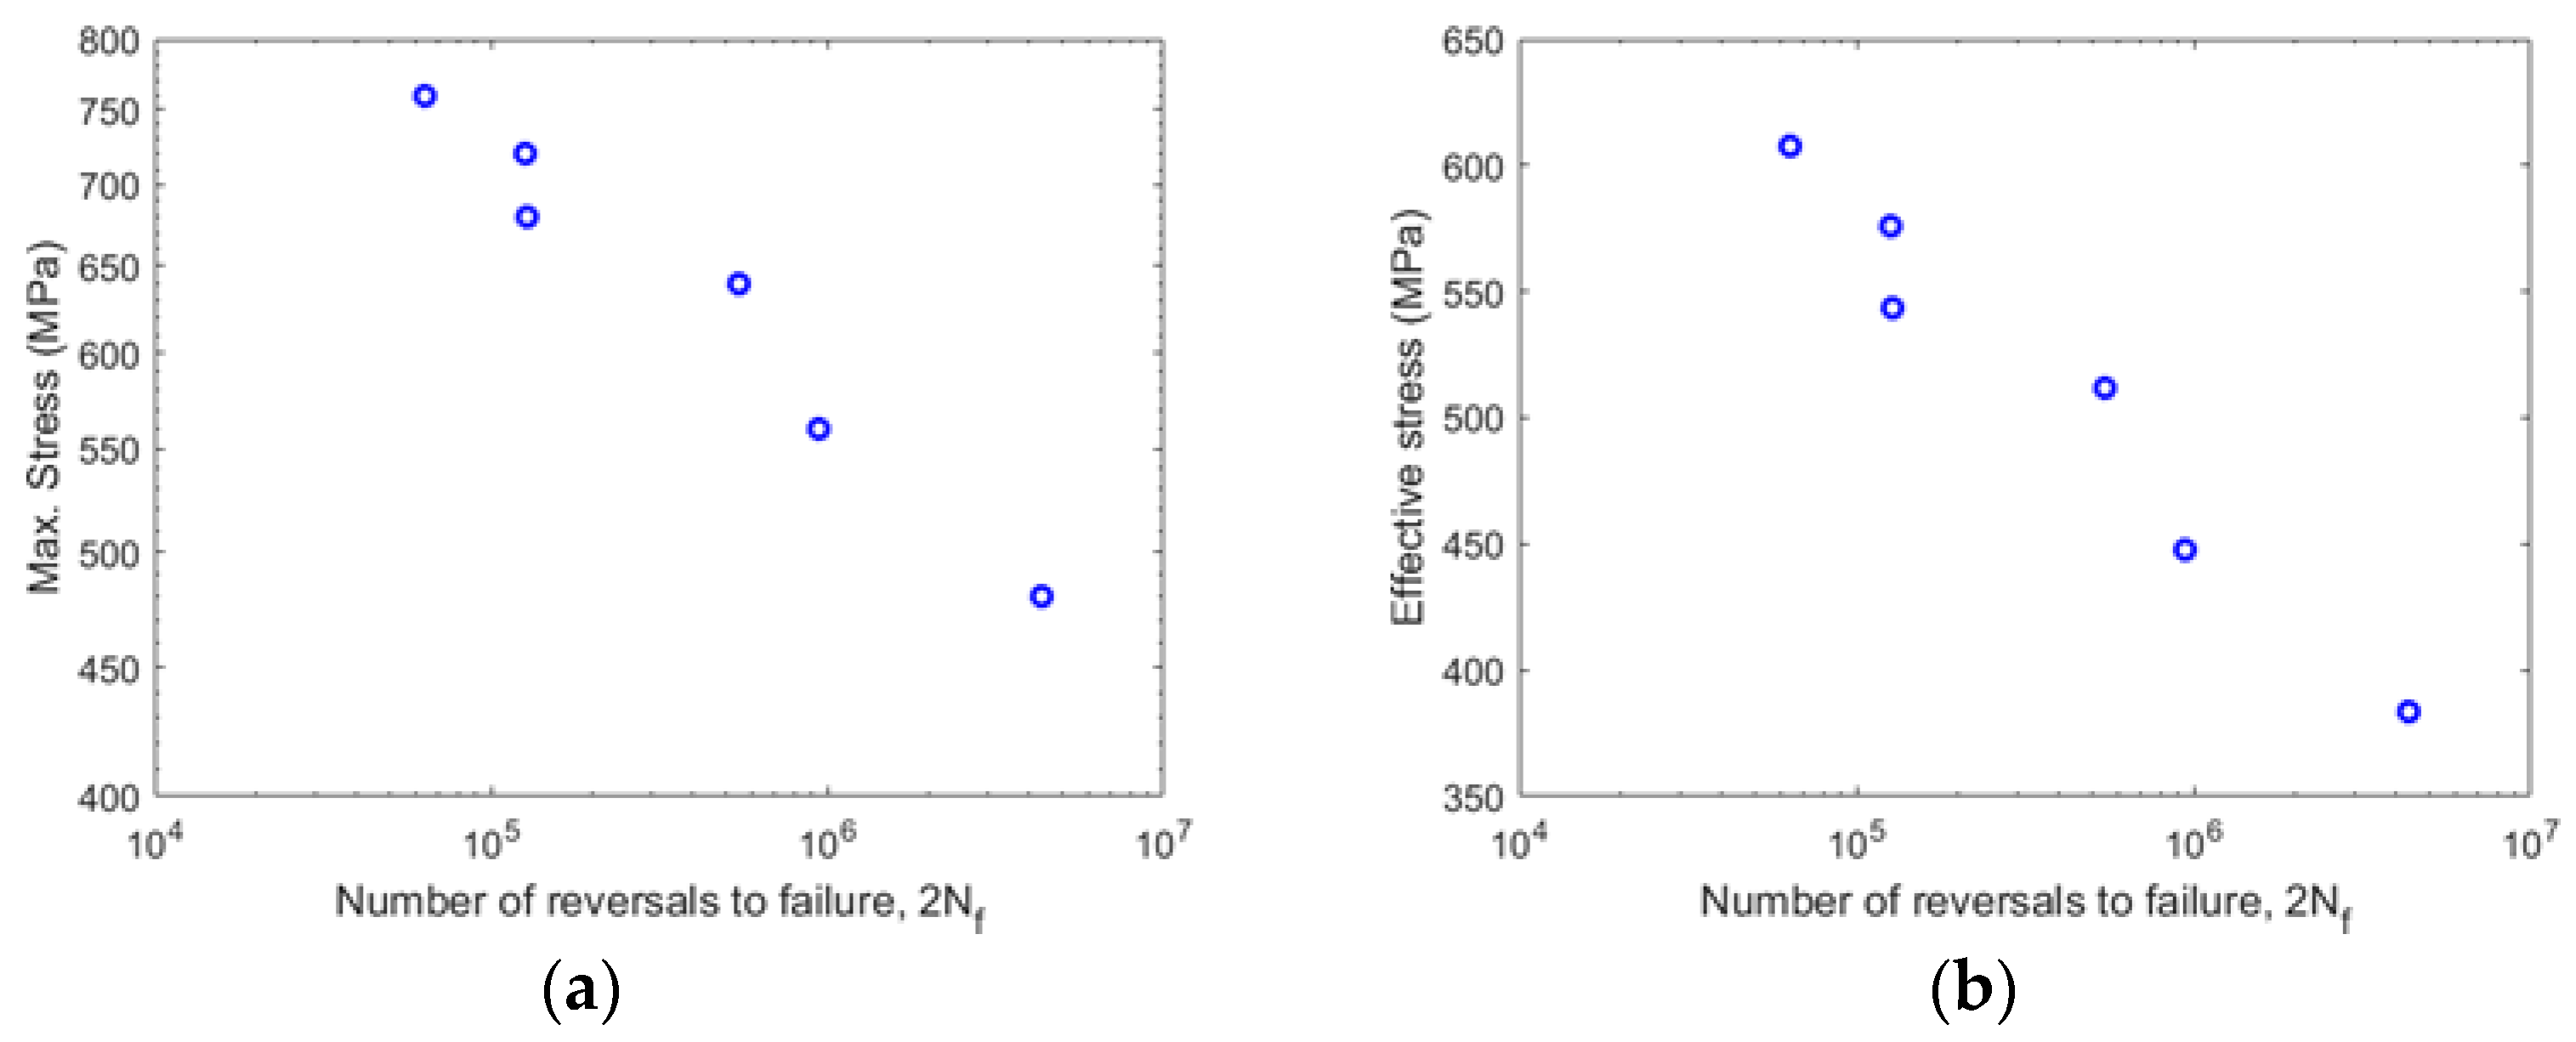
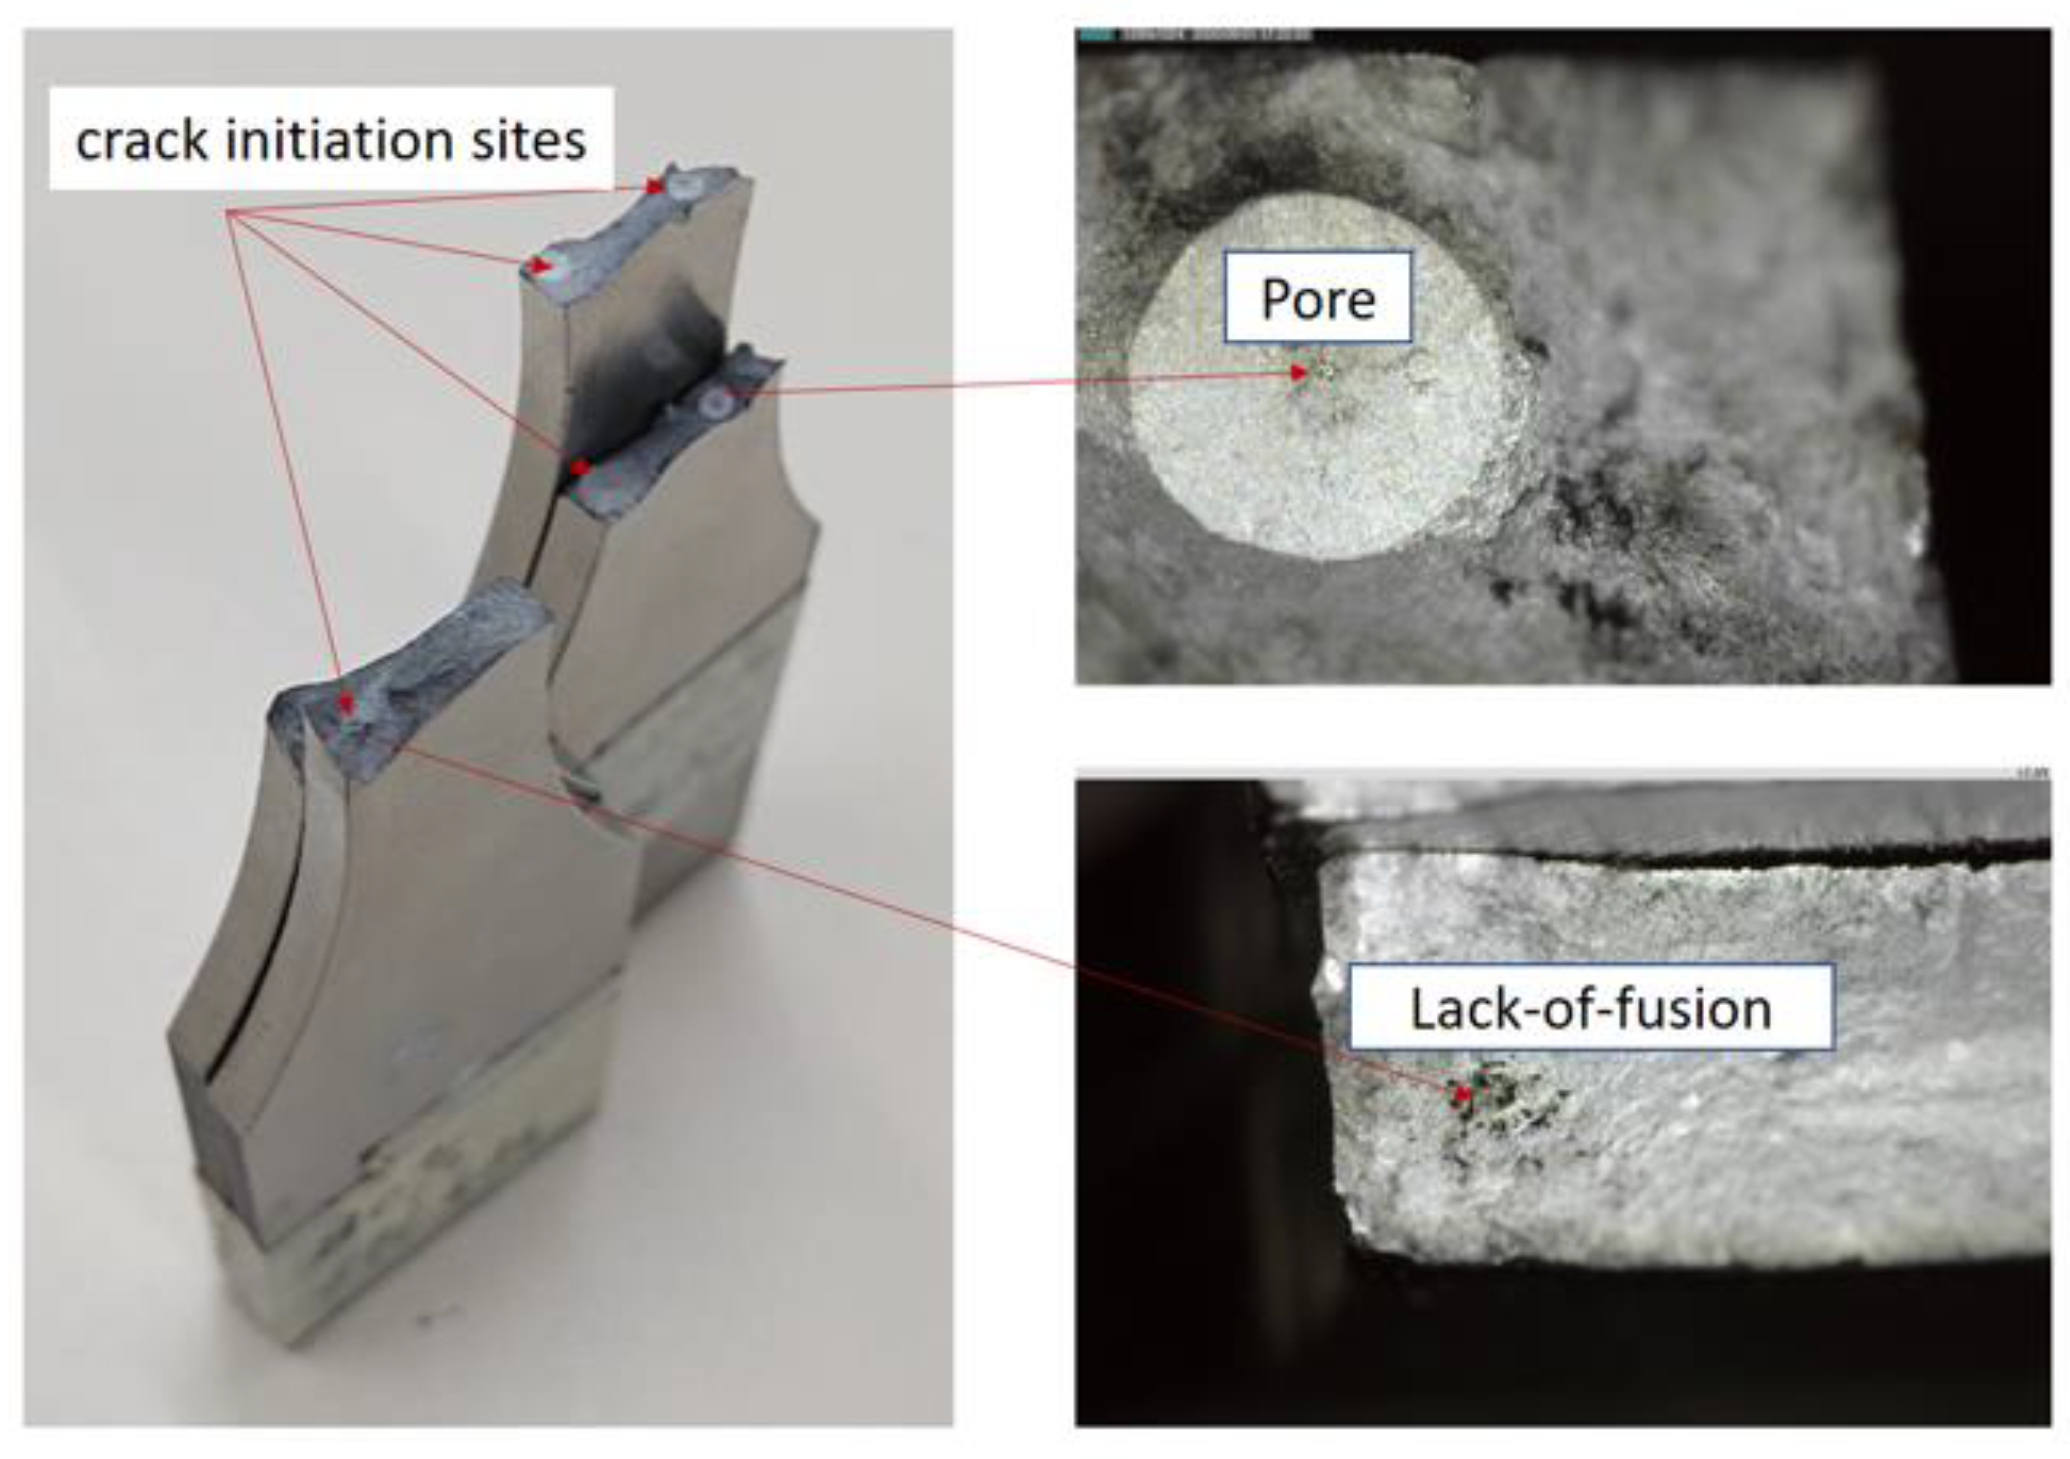
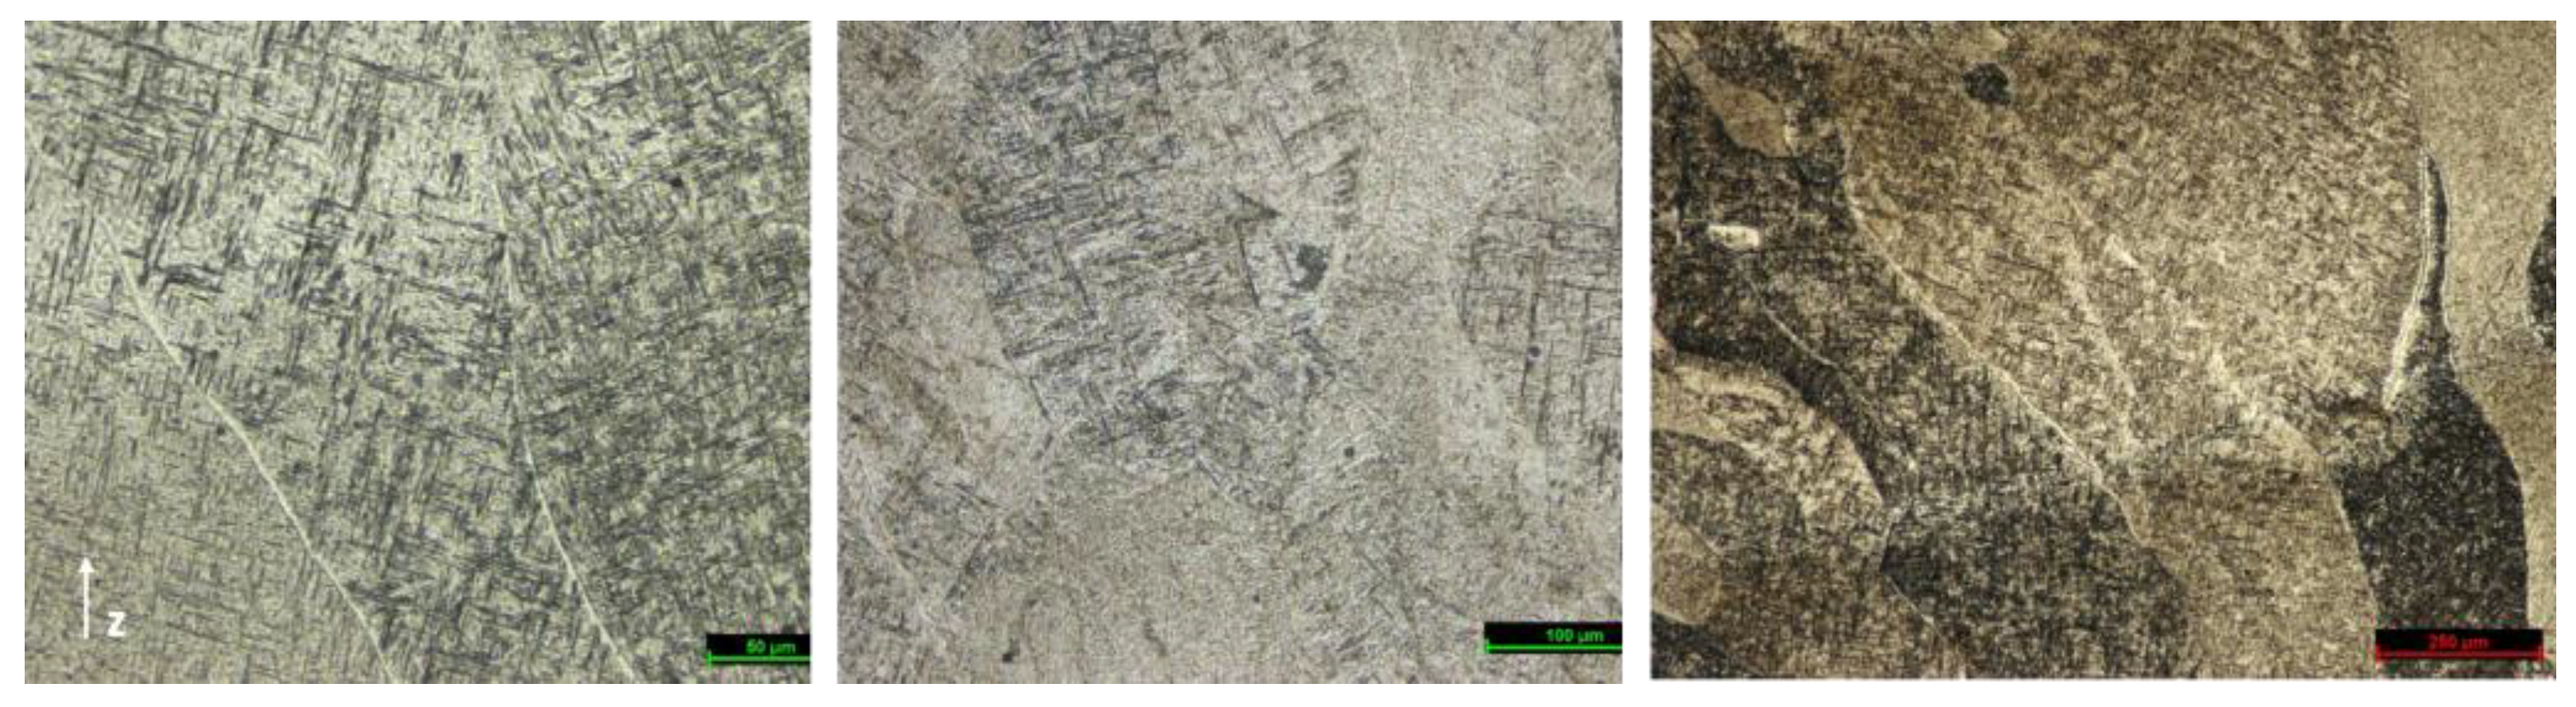
3.1. Experimental Results

The tensile tests were carried out to measure the yield strength of the material, which is used to calculate the stress levels applied in the HCF tests. The average values and mean deviations of the measured yield and ultimate strength for the tensile tested samples are 935 ± 7 MPa and 1044 ± 6 MPa, respectively (Table 1). These values are comparable to those of traditionally manufactured Ti–6Al–4V alloys [2,3,4,5,6,27,35,36]. The yield strength was measured using the 0.2% offset method. Hence, the stress levels applied in the HCF tests were calculated based on the proportional limit of the material (800 MPa), which is the stress above which plastic deformation occurs. Figure 4a illustrates a log10–log10 plot of the maximum stress versus the number of reversals to failure, 2Nf, for the stress-controlled fatigue tests (R = 0.1) conducted on the 21 tested samples. The data points represent the mean values measured for 2Nf (Table 2). Some dispersion in the data points was observed, likely due to variations in defect rates, such as pores or lack of fusion, among the samples. All tested samples exhibited a High Cycle Fatigue (HCF) lifetime greater than 104 cycles. The fatigue endurance limit was not directly measured due to the limited number of samples; however, we estimate its value to be greater than 400 MPa. This estimation is based on the fact that at a stress level of 480 MPa, while one specimen failed, no failure was observed in a second specimen for up to 5.14 × 10⁶ cycles, and the test was subsequently stopped. For comparison to available AM Ti–6Al–4V data, the fatigue life data were analyzed with respect to effective stress normalized for different R values, following the relationship described in [4,5,37]:
σ e f f = σ m a x 1 R 2 0.28
where σ e f f is the effective maximum value of the applied stress during a fatigue load cycle at stress ratio R = −1 and σ m a x is the actual maximum value of the applied stress during a fatigue load cycle at a specific R value (in this study, R = 0.1).
As depicted in Figure 4b, the fatigue properties of the tested samples are comparable to those of traditionally manufactured Ti–6Al–4V alloys and even some of the highest-performance AM Ti–6Al–4V alloys [3,4,25,26,38]. The fatigue parameters of the tested samples were determined by fitting the experimental data to Basquin’s equation (Figure 5). The identified values are 1088 MPa for the fatigue strength coefficient, σf, and −0.1046 for the fatigue strength exponent, b, with an R-squared value of 96%. While σf depends on the material’s Ultimate Tensile Strength (UTS) and true fracture strength, the value of b has been standardized for all materials using the universal slope method proposed by Manson [39] and later the modified universal slope method proposed by Muralidharan and Manson [40]. According to these two methods, the value of b falls within the range of −0.12 to 0.09. Additionally, a recent study [30] has demonstrated that both fatigue parameters are influenced by the Yield Strength (YS), with an improvement in YS leading to increased HCF life. The measured YS values are higher than those of standard Ti–6Al–4V, which likely contributes to the high fatigue performance of the tested samples. This improved performance can be attributed to the surface machining performed on the samples, which removes surface defects and their associated stress concentration effects [5,10,20,21,24,25,41,42,43]. Previous studies have reported a significant increase of about 50–60% in fatigue strength after surface machining [5,18,21,25]. The surface roughness parameter, Ra, measured for all fatigue samples falls within the range of 0.27 < Ra < 2 µm. These values are close to those typically associated with a mirror-polished surface finish (Ra < 0.25 µm).
The high fatigue performance of the tested samples can also be attributed to the low internal porosity rate present in the samples [6,10,16,18,20,21,22,26,42,44,45,46,47,48,49]. Analysis of the X-ray CT scans measuring the porosity revealed a low porosity in the samples, with pore sizes ranging from 12 to 66 µm and having a mean size of 23.6 µm. The average area fraction of porosity was approximately 0.003%, indicating a high density of the samples. This high density is achieved through the deposition method used, which involves overlapping up to 40% of the deposited layer tracks. However, it is important to note that the samples cannot be considered completely free of pores, as some porosity and lack of fusion were observed at the fracture surfaces. Figure 6 illustrates a typical example of crack initiation sites observed on the post-mortem samples, with internal porosity being the predominant defect leading to crack initiation in most samples.
The microstructure of the tested samples was analyzed, as shown in Figure 7. The micrographs revealed a typical morphology of the Additive Manufacturing Directed Energy Deposition (AM DED) process [5,47]. The microstructure consisted of a two-phase lamellar structure composed of colonies of α-strips with different orientations (white) separated by the β-phase (black). Primary β grains formed long columns, and α and α’ needle phases were observed within the β grains. The microstructure appeared relatively homogeneous throughout the entire construction, although the size of the lamellae varied depending on the specific area (bottom or top) of the sample.
During mechanical stress, the presence of grains and phase boundaries impedes the localization of plastic slip, thereby enhancing the fatigue performance of the samples [4,5,47]. Previous studies have demonstrated that the fatigue strength is influenced by the size of the α phase, where a decrease in α phase size correlates with an increase in fatigue strength [4,5]. The presence of α martensite also contributes to improved fatigue strength due to its high density of dislocations, which hinders the localization of plastic slip. However, it can reduce material ductility [27,28,36,50]. Furthermore, conducting post-heat treatment to induce the decomposition of α martensite into an ultrafine (200–300 nm) lamellar (α + β) microstructure has been shown to yield improved fatigue performance [50,51,52].

3.2. Numerical Fatigue Results

Fatigue simulations were conducted using the fe-safe elastic block method, with variations in surface roughness, to predict the life and initiation of damage in the tested samples. Figure 8a illustrates the fatigue life contours of the model for a surface roughness range of 0.6 < Ra < 1.6 µm and a stress amplitude of 306 MPa. The displayed values, shown in a logarithmic scale, indicate the variation in fatigue life within the model. The elements with the shortest life, representing the worst-case scenario for the entire model, are highlighted in red. Figure 8b shows contour plots of the damage distribution, with elements in red representing critical locations where fatigue failure is likely to occur.
Figure 9 compares the numerical S–N curves for different surface finishes with the experimental S–N curve. It is important to note that the experimental values represent sample failure, while the numerical values predict failure initiation. The results clearly demonstrate the impact of surface roughness on failure initiation. Higher surface roughness leads to shorter fatigue life. For a given stress level, the failure initiation occurs at higher values of 2Nf for mirror-polished surfaces (Ra < 0.25 µm) compared to the experimental values. Conversely, lower values of 2Nf are predicted for surface roughness in the range of 1.6 < Ra < 4 µm, especially at higher loads. The numerical S–N curve with a surface roughness of 0.6 < Ra < 1.6 µm closely matches the experimental curve, considering the measured surface roughness of 0.27 < Ra < 2 µm. However, while no failure was predicted in all numerical simulations at a stress amplitude of 216 MPa, one of the tested samples failed. Additionally, Figure 9 reveals that at a stress amplitude of 252 MPa, the samples failed before the predicted failure initiation. This suggests that factors other than surface roughness may contribute to fatigue deficiency under low amplitude stresses. Internal porosity and lack of fusion were observed on the fracture surfaces of the tested samples. To examine the effect of material UTS on fatigue life under different stress amplitudes, simulations were performed with varying UTS values. Figure 10 demonstrates that fatigue life is influenced by the UTS value, with higher UTS values corresponding to longer fatigue life. The numerical S–N curve that closely matches the experimental curve has the same UTS value and a similar surface roughness range. It is important to note that the developed model does not consider material porosity, which is a limitation. Incorporating porosity in the model would improve the accuracy of numerical simulations in predicting fatigue behavior.

4. Conclusions

In this study, the High Cycle Fatigue (HCF) properties of Ti–6Al–4V alloy additively manufactured using the Laser Metal Deposition (LMD) process were thoroughly investigated. The material’s mechanical properties were determined through a series of uniaxial tensile and HCF tests performed on the additively manufactured Ti–6Al–4V samples. Notably, the identified properties of the AM samples exhibited a comparable performance to traditionally manufactured Ti–6Al–4V alloys. This achievement can be attributed to the meticulous surface machining, which resulted in a low surface roughness (Ra < 2 µm) for the samples, and the deposition method used, which involved overlapping up to 40% of the deposited layer tracks. However, despite the deposition technique’s proven effectiveness in reducing porosity, we observed the presence of some internal pores and lack of fusion, which were responsible for crack initiation.
To gain further insights, numerical analysis utilizing the finite element method was employed to simulate the HCF tests. The numerical simulations took into account the surface roughness of the samples, and they effectively predicted the initiation of fatigue failure in the tested samples.
The sensitivity of material fatigue life to surface roughness and Ultimate Tensile Strength (UTS) was thoroughly examined in the numerical analysis. The results indicated that fatigue life was influenced by both the surface roughness and the UTS of the material. Specifically, higher surface roughness was associated with shorter fatigue life, while higher UTS resulted in longer fatigue life.
Ultimately, the fatigue analysis conducted through numerical simulations demonstrated its capability to accurately predict the fatigue behavior of the tested samples. This comprehensive study provides valuable insights into the HCF properties of additively manufactured Ti–6Al–4V alloy, enhancing our understanding and enabling further advancements in this field.

Author Contributions

Validation, S.L. and A.T.; Writing—original draft, D.R., F.D. and D.F.; Writing—review & editing, M.A.A. and G.C. All authors have read and agreed to the published version of the manuscript.

Funding

This study is partially funded by Occitanie Region READYNOV 2017 “CRO2” Project.

Data Availability Statement

Not applicable.

Conflicts of Interest

The authors declare no conflict of interest.

References

  1. Carrion, P.E.; Shamsaei, N.; Daniewicz, S.R.; Moser, R.D. Fatigue behavior of t Ti-6Al-4V ELI including mean stress effects. Int. J. Fatigue 2017, 99, 87–100. [Google Scholar] [CrossRef] [Green Version]
  2. Kutz, M. Mechanical Engineers’ Handbook, Volume 1: Materials and Engineering Mechanics; John Wiley & Sons: Hoboken, NJ, USA, 2015. [Google Scholar]
  3. Lewandowski, J.J.; Seifi, M. Metal additive manufacturing: A review of mechanical proper- ties. Annu. Rev. Mater. Res. 2016, 46, 151–186. [Google Scholar] [CrossRef] [Green Version]
  4. Li, P.; Warner, D.; Fatemi, A.; Phan, N. Critical assessment of the fatigue performance of additively manufactured Ti-6Al-4V and perspective for future research. Int. J. Fatigue 2016, 85, 130–143. [Google Scholar] [CrossRef]
  5. Liu, S.; Shin, Y.C. Additive manufacturing of ti6al4v alloy: A review. Mater. Des. 2019, 164, 107552. [Google Scholar] [CrossRef]
  6. Brandl, E.; Baufeld, B.; Leyens, C.; Gault, R. Additive manufactured Ti-6Al-4V using welding wire: Comparison of laser and arc beam deposition and evaluation with respect to aerospace material specifications. Phys. Procedia 2010, 5, 595–606. [Google Scholar] [CrossRef] [Green Version]
  7. Harun, W.; Manam, N.; Kamariah, M.; Sharif, S.; Zulkifly, A.; Ahmad, I.; Miura, H. A review of powdered additive manufacturing techniques for Ti-6Al-4V biomedical applications. Powder Technol. 2018, 331, 74–97. [Google Scholar] [CrossRef]
  8. Gibson, I.; Rosen, D.W.; Stucker, B.; Khorasani, M.; Rosen, D.; Stucker, B.; Khorasani, M. Additive Manufacturing Technologies; Springer: Cham, Switzerland, 2014; Volume 17. [Google Scholar]
  9. Dinda, G.; Song, L.; Mazumder, J. Fabrication of Ti-6Al-4V scaffolds by direct metal deposition. Metall. Mater. Trans. A 2008, 39, 2914–2922. [Google Scholar] [CrossRef] [Green Version]
  10. Edwards, P.; Ramulu, M. Fatigue performance evaluation of selective laser melted Ti-6Al-4V. Mater. Sci. Eng. A 2014, 598, 327–337. [Google Scholar] [CrossRef]
  11. Guessasma, S.; Zhang, W.; Zhu, J.; Belhabib, S.; Nouri, H. Challenges of additive manufacturing technologies from an optimisation perspective. Int. J. Simul. Multidiscip. Des. Optim. 2015, 6, A9. [Google Scholar] [CrossRef] [Green Version]
  12. Li, P.; Warner, D.; Phan, N. Predicting the fatigue performance of an additively manufactured Ti-6Al-4V component from witness coupon behavior. Addit. Manuf. 2020, 35, 101230. [Google Scholar] [CrossRef]
  13. Lu, J.; Chang, L.; Wang, J.; Sang, L.; Wu, S.; Zhang, Y. In-situ investigation of the anisotropic mechanical properties of laser direct metal deposition ti6al4v alloy. Mater. Sci. Eng. A 2018, 712, 199–205. [Google Scholar] [CrossRef]
  14. Torries, B.; Imandoust, A.; Beretta, S.; Shao, S.; Shamsaei, N. Overview on microstructure- and defect-sensitive fatigue modeling of additively manufactured materials. Jom 2018, 70, 1853–1862. [Google Scholar] [CrossRef]
  15. Benedetti, M.; Fontanari, V.; Bandini, M.; Zanini, F.; Carmignato, S. Low- and high-cycle fatigue resistance of Ti-6Al-4V eli additively manufactured via selective laser melting: Mean stress and defect sensitivity. Int. J. Fatigue 2018, 107, 96–109. [Google Scholar] [CrossRef]
  16. Wolff, S.; Lee, T.; Faierson, E.; Ehmann, K.; Cao, J. Anisotropic properties of directed energy deposition (DED-processed Ti-6Al-4V. J. Manuf. Process. 2016, 24, 397–405. [Google Scholar] [CrossRef] [Green Version]
  17. Akerfeldt, P.; Antti, M.-L.; Pederson, R. Influence of microstructure on mechanical properties of laser metal wire-deposited Ti-6Al-4V. Mater. Sci. Eng. A 2016, 674, 428–437. [Google Scholar] [CrossRef]
  18. Galarraga, H.; Lados, D.A.; Dehoff, R.R.; Kirka, M.M.; Nandwana, P. Effects of the microstructure and porosity on properties of Ti-6Al-4V eli alloy fabricated by electron beam melting (ebm). Addit. Manuf. 2016, 10, 47–57. [Google Scholar] [CrossRef] [Green Version]
  19. Kobryn, P.; Moore, E.; Semiatin, S. The effect of laser power and traverse speed on microstructure, porosity, and build height in laser-deposited Ti-6Al-4V. Scr. Mater. 2000, 43, 299–305. [Google Scholar] [CrossRef]
  20. Tammas-Williams, S.; Withers, P.; Todd, I.; Prangnell, P. The influence of porosity on fatigue crack initiation in additively manufactured titanium components. Sci. Rep. 2017, 7, 7308. [Google Scholar] [CrossRef] [PubMed]
  21. Wycisk, E.; Solbach, A.; Siddique, S.; Herzog, D.; Walther, F.; Emmelmann, C. Effects of defects in laser additive manufactured Ti-6Al-4V on fatigue properties. Phys. Procedia 2014, 56, 371–378. [Google Scholar] [CrossRef] [Green Version]
  22. Chastand, V.; Quaegebeur, P.; Maia, W.; Charkaluk, E. Comparative study of fatigue properties of Ti-6Al-4V specimens built by electron beam melting (EBM) and selective laser melting (SLM). Mater. Charact. 2018, 143, 76–81. [Google Scholar] [CrossRef]
  23. Kahlin, M.; Ansell, H.; Moverare, J. Fatigue behaviour of additive manufactured ti6al4v, with as-built surfaces, exposed to variable amplitude loading. Int. J. Fatigue 2017, 103, 353–362. [Google Scholar] [CrossRef] [Green Version]
  24. Molaei, R.; Fatemi, A.; Sanaei, N.; Pegues, J.; Shamsaei, N.; Shao, S.; Li, P.; Warner, D.; Phan, N. Fatigue of additive manufactured Ti-6Al-4V, part ii: The relationship between microstruc- ture, material cyclic properties, and component performance. Int. J. Fatigue 2020, 132, 105363. [Google Scholar] [CrossRef]
  25. Chastand, V.; Tezenas, A.; Cadoret, Y.; Quaegebeur, P.; Maia, W.; Charkaluk, E. Fatigue characterization of titanium Ti-6Al-4V samples produced by additive manufacturing. Procedia Struc.-Tural Integr. 2016, 2, 3168–3176. [Google Scholar] [CrossRef] [Green Version]
  26. Hrabe, N.; Gnäupel-Herold, T.; Quinn, T. Fatigue properties of a titanium alloy (Ti-6Al-4V) fabricated via electron beam melting (ebm): Effects of internal defects and residual stress. Int. J. Fatigue 2017, 94, 202–210. [Google Scholar] [CrossRef] [Green Version]
  27. Yu, J.; Rombouts, M.; Maes, G.; Motmans, F. Material properties of Ti-6Al-4V parts produced by laser metal deposition. Phys. Procedia 2012, 39, 416–424. [Google Scholar] [CrossRef] [Green Version]
  28. Zhai, Y.; Galarraga, H.; Lados, D.A. Microstructure evolution, tensile properties, and fatigue damage mechanisms in Ti-6Al-4V alloys fabricated by two additive manufacturing techniques. Procedia Eng. 2015, 114, 658–666. [Google Scholar] [CrossRef] [Green Version]
  29. Hayes, B.J.; Martin, B.W.; Welk, B.; Kuhr, S.J.; Ales, T.K.; Brice, D.A.; Ghamarian, I.; Baker, A.H.; Haden, C.V.; Harlow, D.G.; et al. Predicting tensile properties of Ti-6Al-4V produced via directed energy deposition. Acta Mater. 2017, 133, 120–133. [Google Scholar] [CrossRef]
  30. Ren, Y.; Lin, X.; Guo, P.; Yang, H.; Tan, H.; Chen, J.; Li, J.; Zhang, Y.; Huang, W. Low cycle fatigue properties of Ti-6Al-4V alloy fabricated by high-power laser directed energy deposition: Experimental and prediction. Int. J. Fatigue 2019, 127, 58–73. [Google Scholar] [CrossRef]
  31. ISO 4287:1997; Geometrical Product Specifications (GPS)-Surface Texture: Profile Method-Terms, Definitions and Surface Texture Parameters (JIS B 0601: 2013). ISO: Geneva, Switzerland, 1997.
  32. ISO 6892-1:2019; Metallic Materials—Tensile testing—Part 1: Method of Test at Room Temperature. ISO: Geneva, Switzerland, 2019.
  33. NF EN 6072; Série aérospatiale-Matériaux Métalliques-Méthodes D’essai-Essai de Fatigue à Amplitude Constante. British Standards Institution (BSI): London, UK, 2010.
  34. Basquin, O. The exponential law of endurance tests. Proc. Am. Soc. Test. Mater. 1910, 10, 625–630. [Google Scholar]
  35. Coffin, L.F., Jr. A Study of the Effects of Cyclic Thermal Stresses on a Ductile Metal; Transactions of the American Society of Mechanical Engineers: New York, NY, USA, 1954; Volume 76, pp. 931–950. [Google Scholar]
  36. Rafi, H.K.; Starr, T.L.; Stucker, B.E. A comparison of the tensile, fatigue, and frac- ture behavior of Ti–6al–4v and 15-5 ph stainless steel parts made by selective laser melting. Int. J. Adv. Manuf. Technol. 2013, 69, 1299–1309. [Google Scholar] [CrossRef]
  37. Walker, K. The effect of stress ratio during crack propagation and fatigue for 2024-t3 and 7075-t6 aluminum. In Effects of Environment and Complex Load History on Fatigue Life; ASTM International: West Conshohocken, PA, USA, 1970. [Google Scholar]
  38. Günther, J.; Krewerth, D.; Lippmann, T.; Leuders, S.; Tröster, T.; Weidner, A.; Biermann, H.; Niendorf, T. Fatigue life of additively manufactured Ti-6Al-4V in the very high cycle fatigue regime. Int. J. Fatigue 2017, 94, 236–245. [Google Scholar] [CrossRef]
  39. Manson, S. Fatigue: A complex subject-some simple approximations. Exp. Mech. 1965, 5, 193–226. [Google Scholar] [CrossRef] [Green Version]
  40. Muralidharan, U.; Manson, S. A modified universal slopes equation for estimation of fatigue characteristics of metals. J. Eng. Mater. Technol. 1988, 110, 55–58. [Google Scholar] [CrossRef]
  41. Greitemeier, D.; Palm, F.; Syassen, F.; Melz, T. Fatigue performance of additive manufac- tured tial6v4 using electron and laser beam melting. Int. J. Fatigue 2017, 94, 211–217. [Google Scholar] [CrossRef]
  42. Sterling, A.J.; Torries, B.; Shamsaei, N.; Thompson, S.M.; Seely, D.W. Fatigue behavior and failure mechanisms of direct laser deposited Ti-6Al-4V. Mater. Sci. Eng. A 2016, 655, 100–112. [Google Scholar] [CrossRef]
  43. Vilaro, T.; Colin, C.; Bartout, J.-D. As-fabricated and heat-treated microstructures of the Ti-6AL-4V alloy processed by selective laser melting. Metall. Mater. Trans. A 2011, 42, 3190–3199. [Google Scholar] [CrossRef]
  44. Alcisto, J.; Enriquez, A.; Garcia, H.; Hinkson, S.; Steelman, T.; Silverman, E.; Valdovino, P.; Gigerenzer, H.; Foyos, J.; Ogren, J.; et al. Tensile properties and microstructures of laser-formed Ti-6Al-4V. J. Mater. Eng. Perform. 2011, 20, 203–212. [Google Scholar] [CrossRef]
  45. Amsterdam, E.; Kool, G.A. High cycle fatigue of laser beam deposited Ti-6Al-4V and inconel 718. In Bridging the Gap between Theory and Operational Practice; Bos, M.J., Ed.; ICAF 2009; Springer: Dordrecht, The Netherlands, 2009; pp. 1261–1274. [Google Scholar]
  46. Bian, L.; Thompson, S.M.; Shamsaei, N. Mechanical properties and microstructural features of direct laser-deposited Ti-6Al-4V. Jom 2015, 67, 629–638. [Google Scholar] [CrossRef]
  47. Carroll, B.E.; Palmer, T.A.; Beese, A.M. Anisotropic tensile behavior of Ti-6Al-4V components fabricated with directed energy deposition additive manufacturing. Acta Mater. 2015, 87, 309–320. [Google Scholar] [CrossRef]
  48. Kumar, P.; Ramamurty, U. High cycle fatigue in selective laser melted Ti-6Al-4V. Acta Mater. 2020, 194, 305–320. [Google Scholar] [CrossRef]
  49. Zhang, P.; He, A.N.; Liu, F.; Zhang, K.; Jiang, J.; Zhang, D.Z. Evaluation of low cycle fatigue performance of selective laser melted titanium alloy Ai-6Al-4V. Metals 2019, 9, 1041. [Google Scholar] [CrossRef] [Green Version]
  50. Zhai, Y.; Galarraga, H.; Lados, D.A. Microstructure, static properties, and fatigue crack growth mechanisms in Ti-6Al-4V fabricated by additive manufacturing: Lens and ebm. Eng. Fail. Anal. 2016, 69, 3–14. [Google Scholar] [CrossRef]
  51. Xu, W.; Brandt, M.; Sun, S.; Elambasseril, J.; Liu, Q.; Latham, K.; Xia, K.; Qian, M. Additive manufacturing of strong and ductile Ti-6Al-4V by selective laser melting via in situ martensite decomposition. Acta Mater. 2015, 85, 74–84. [Google Scholar] [CrossRef]
  52. Xu, W.; Sun, S.; Elambasseril, J.; Liu, Q.; Brandt, M.; Qian, M. Ti-6Al-4V additively manufactured by selective laser melting with superior mechanical properties. Jom 2015, 67, 668–673. [Google Scholar] [CrossRef]
Figure 1. An example of samples before being completely detached from the built walls 4 mm thick. The build direction is perpendicular to the substrate.
Buildings 13 02011 g001
Figure 2. Specimen’s geometry in mm for tensile tests.
Buildings 13 02011 g002
Figure 3. Specimen’s geometry in mm for stress fatigue tests.
Buildings 13 02011 g003
Figure 4. Uniaxial HCF performance of DED Ti–6Al–4V samples under stress-controlled conditions with a stress ratio (R) of 0.1. (a) σ m a x versus 2Nf. (b) σ e f f versus 2Nf.
Buildings 13 02011 g004
Figure 5. Experimental fatigue data fitted according to Basquin’s equation.
Buildings 13 02011 g005
Figure 6. A typical example illustrating the locations where cracks initiated. The images were captured using an optical microscope at a magnification of ×100. The images on the right provide a closer view of two specific crack initiation sites.
Buildings 13 02011 g006
Figure 7. Microscopic observations at various magnifications, ×50, ×100, and ×1250, from left to right. The build direction (z) is indicated.
Buildings 13 02011 g007
Figure 8. The results of the numerical simulations. In (a), the logarithm of fatigue lives of the model is displayed for a stress amplitude of 306 MPa. The color-coded values represent the variation in fatigue life throughout the model, with elements corresponding to the worst-case life shown in red. (b) presents the contour plots of damage distributions, indicating the critical locations where fatigue failure is likely to occur, shown in red.
Buildings 13 02011 g008
Figure 9. Comparative analysis of numerical and experimental S–N curves for different surface roughnesses in DED Ti–6Al–4V alloy at a UTS value of 1044 MPa. The surface roughness of the experimental samples ranged from 0.27 to 2 μm in terms of the average roughness, Ra.
Buildings 13 02011 g009
Figure 10. Numerical S–N curves for various values of UTS in comparison with the experimental S–N curve. The numerical simulations were conducted with a surface roughness range of 0.6 < Ra < 1.6 µm.
Buildings 13 02011 g010
Table 1. Mechanical tensile properties.
SampleYoung’s Modulus (GPa)UTS (MPa)Yield Strength (MPa)
Sample 11131034924
Sample 21141049942
Sample 31131047939
Sample 41111044935
Table 2. Number of reversals to failure, 2Nf. The displayed values of 2Nf are the average values corresponding to the different applied stress levels.
Stress Level (MPa)760720680640560480
Number of samples343332 *
2Nf6.00 × 1041.27 × 1051.28 × 1055.45 × 1059.44 × 1054.00 × 106
Average deviation2.00 × 1046.00 × 1046.00 × 1045.00 × 105 3.00 × 10⁵-
* only one of the two samples failed.
Disclaimer/Publisher’s Note: The statements, opinions and data contained in all publications are solely those of the individual author(s) and contributor(s) and not of MDPI and/or the editor(s). MDPI and/or the editor(s) disclaim responsibility for any injury to people or property resulting from any ideas, methods, instructions or products referred to in the content.

