Article

An Integrated Model for Multi-Mode Resource-Constrained Multi-Project Scheduling Problems Considering Supply Management with Sustainable Approach in the Construction Industry under Uncertainty Using Evidence Theory and Optimization Algorithms

1
School of Civil Engineering, Iran University of Science and Technology, Tehran 16846-13114, Iran
2
School of Industrial Engineering, Iran University of Science and Technology, Tehran 16846-13114, Iran
3
College of Built Environment, Faculty of Computing, Engineering and the Built Environment, Birmingham City University, Birmingham B4 7XG, UK
*
Author to whom correspondence should be addressed.
Buildings 2023, 13(8), 2023; https://doi.org/10.3390/buildings13082023
Submission received: 2 July 2023 / Revised: 28 July 2023 / Accepted: 3 August 2023 / Published: 8 August 2023
(This article belongs to the Special Issue The Current Status and Future Prospects of Automation in Construction)

Abstract

:
In this study, the multi-mode resource-constrained multi-project scheduling problems (MMRCMPSPs) considering supply management and sustainable approach in the construction industry under uncertain conditions have been investigated using evidence theory to mathematical modeling and solving by multi-objective optimization algorithms. In this regard, a multi-objective mathematical model has been proposed, in which the first objective function aims to maximize a weighted selection of projects based on economic, environmental, technical, social, organizational, and competitive factors; the second objective function is focused on maximizing profit, and the third objective function is aimed at minimizing the risk of supply management. Moreover, various components, such as interest rates, carbon penalties, and other implementation limitations and additional constraints, have also been considered in the modeling and mathematical relationships to improve the model’s performance and make it more relevant to real-world conditions and related issues, leading to better practical applications. In the mathematical modeling adopted, the processing time of project activities has been considered uncertain, and the evidence theory has been utilized. This method can provide a flexible and rational approach based on evidence and knowledge in the face of uncertainty. In addition, to solve the proposed multi-objective mathematical model, metaheuristic optimization algorithms, such as the differential evolution (DE) algorithm based on the Pareto archive, have been used, and for evaluating the results, the non-dominated sorting genetic algorithm II (NSGA-II) has also been employed. Furthermore, the results have been compared based on multi-objective evaluation criteria, such as quality metric (QM), spacing metric (SM), and diversity metric (DM). It is worth noting that to investigate the performance and application of the proposed model, multiple evaluations have been conducted on sample problems with different dimensions, as well as a case study on residential apartment construction projects by a contracting company. In this respect, the answers obtained from solving the model using the multi-objective DE algorithm were better and superior to the NSGA-II algorithm and had a more favorable performance. Generally, the results indicate that using the integrated multi-objective mathematical model in the present research for managing and scheduling multi-mode resource-constrained multi-project problems, especially in the construction industry, can lead to an optimal state consistent with the desired objectives and can significantly improve the progress and completion of projects.

1. Introduction

Proper management and planning in resource-constrained project scheduling problems (RCPSPs) is one of the most current and complex issues in the field of project management, which aims to minimize the duration of the project. In recent years, considerable effort has been devoted by researchers to this area. It is worth mentioning that attention to the RCPSP concept is essential and used in various industry domains, such as the construction industry [1].
One of the special cases in this field is multi-mode resource-constrained project scheduling problems (MMRCPSPs), which can be extended to a multi-project with significant application and importance for real-world implementation issues. Scheduling of various projects and the division of various resources can be performed with two approaches: single-project and multi-project. In the single-project approach, projects are artificially integrated through virtual start and end activities and become a single project. It should be noted that both approaches can produce different schedules with the same priority rules [2]. Given that the multi-project situation is often more common in practice, it probably provides a better opportunity for further progress. In large and modern companies and organizations, multi-project scheduling is a crucial issue. Many projects are set up and implemented in these organizations, requiring simultaneous scheduling [1]. The multi-project scheduling problem was first studied by Pritsker et al. [3], who presented a practical model for multi-project scheduling and formulated the model as an example. However, no solution method for multi-project scheduling problems has been presented in their research.
Over time, the multi-project scheduling problem has attracted more researchers’ attention, and various methods and procedures have been presented to solve it. Also, the integration of project scheduling and material ordering in the last three decades has been given more attention to ensure the project’s profitability. The essential concern about ordering materials in the timing of various projects is to choose the right projects and suppliers so that the completion costs are minimized and, ultimately, the profitability of the projects is maximized [4]. In recent years, in addition to increasing profits, paying attention to sustainable development, sustainability dimensions, and adopting sustainability in the construction industry is felt as a necessity. Sustainability is a multifaceted concept that refers to economic, social, and environmental values and is a challenge in properly managing construction industry projects [5,6]. The integration of new issues in project scheduling and various sustainability aspects is currently for managers’ attention. In fact, the desire to develop and use new management methods for project scheduling and management has increased, and the foundations of sustainability have become dominant in various fields of fundamental management in organizations and businesses [6].
Based on the mentioned points, in this article, an integrated time–cost optimization model is presented for multi-project scheduling and resource ordering in construction industry projects with a sustainable approach under uncertain conditions. In this respect, a multi-objective mathematical model has been proposed for the investigated problem, and then metaheuristic algorithms have been used to solve the model. The problem of the current research includes multi-projects, and multi-mode implementation has been considered for the activities of each project, and each activity will be completed in only one mode. Also, the types of project resources are renewable and non-renewable.
It is worth mentioning that some previous studies have dealt with the multi-project scheduling problem with a simple and discrete approach, and a number of them have also considered various items often separately, such as material ordering, supplier selection, or sustainability aspects [7,8]. However, most of these studies have not paid adequate attention to an integrated approach in the field of multi-project scheduling and consideration of resource constraints, uncertainty, suppliers, sustainability, and other complementary aspects, such as interest rate, discount factors, risk criteria, organizational criteria, and competitive criteria. Considering that the mentioned cases significantly affect the optimal scheduling of construction projects, their consideration and inclusion in multi-project modeling in the construction industry can lead to the appropriate and more favorable implementation of the projects.
In this regard, the proposed model in this research has been designed and developed according to the shortcomings of previous research models for multi-mode resource-constrained multi-project scheduling problems (MMRCMPSPs). It has been tried that the presented model has an integrated and complementary method along with the scheduling of project activities simultaneously with the approach of sustainable development in the construction industry, influential and various issues such as the optimal use of renewable and non-renewable resources and sustainability aspects are also addressed. As mentioned earlier, in the problem being investigated, uncertainty has also been taken into account, where the parameter of the processing time of activities is non-deterministic. It is worth noting that although many methods, such as probability theory, fuzzy, entropy, and evidence theory, have been proposed to deal with uncertainty, evidence theory has the advantage of dealing with uncertainty flexibly and logically based on evidence and knowledge and has wider applications in measuring uncertainty in decisions [9]. Therefore, regarding this matter, evidence theory has been used in the current research to face the uncertainty of the time of activities, and a new functional investigation has been carried out.
Actually, in this research, a novel multi-objective mathematical model and relations with a new integration methodology for multi-mode resource-constrained multi-project scheduling have been presented by considering many different cases, such as costs, times, risks, profits, sustainability, uncertainty, suppliers, carbon penalties, interest rates, environmental, technical, social, organizational, and competitive factors. Indeed, this integration and optimization between various items, also stated in the different parts of the research, is the distinguishing feature of this work from other studies in this field and one of the contributions. Furthermore, solving and investigating the proposed model using metaheuristic optimization algorithms and uncertainty theories, such as evidence theory, is one of the strengths of this research. Also, the performance of the proposed model and method has been evaluated for various problems. That has been described in detail in related parts of the current article.
It is noted that this article is organized into six sections. Section 1, as an introduction, presents the importance of the subject and an introduction to the problem under investigation. In Section 2, as a literature review division, relevant previous research is reviewed to explain the research gap. Section 3 defines the problem and describes the mathematical modeling. Section 4 explains the structure of metaheuristic solving algorithms, such as the multi-objective differential evolution (DE) algorithm based on the Pareto archive and the non-dominated sorting genetic algorithm II (NSGA-II). Finally, in Section 5, the results of the model and evaluations are reviewed and presented, and in Section 6 and the last section of the article, the summary and conclusion of the research are provided.

2. Literature Review

The problems of project scheduling have attracted the attention of many researchers in the past years, and many studies have been conducted in this field and in different situations, some of which have been briefly reviewed and explained in the following section. In this regard, Le [10] studied resource-constrained multi-project scheduling problems (RCMPSPs) by considering the moving time of renewable resources (labor, machinery, and equipment) in Vietnam’s construction projects. This research examined several projects in different places and at large distances from each other. In the presented model of this research, allocating a resource from one project to another was considered very expensive and time-consuming. Also, an algorithm based on priority rules was presented to solve this problem and minimize project implementation time. Tseng [11] also presented two heuristic algorithms to solve the multi-project scheduling problem with resource-constrained in multi-mode. The first algorithm is a parallel scheduling algorithm, which is a combination of priority rules for activities and modes, and the second algorithm is based on the genetic algorithm (GA). Browning and Yassine [12] studied the static RCMPSP with two objectives for minimizing project delays and portfolio lateness and presented a mathematical model for the investigated problem. Zhang and Sun [13] also investigated the multi-project scheduling problem with limited resources and solved this problem using priority rules based on heuristics methods.
Liu and Chen [14] studied the multi-project scheduling problem in the construction industry, assuming the allocation of different resources. They discussed the resource allocation mechanism for multi-project scheduling problems and then presented an optimization-based model to solve resource allocation problems. This research designed a scheduling model with constraints and different optimization objectives, including minimizing total costs and project duration, according to each activity’s combination of resource allocation. Singh [15] investigated the multi-project scheduling problem by considering resource constraints using rule-based priority and analytic hierarchy process (AHP) methods. Suresh et al. [16] also studied the multi-project scheduling problem with limited resources and the assumption of transfer times of resources between activities. Their study presents a new approach based on the genetic algorithm to solve the multi-project scheduling problem with resource transfer times, where the net present value (NPV) of all projects is maximized concerning renewable resource constraints. El-Abbasy et al. [17] studied multi-objective optimization for multi-project scheduling in the construction industry using the elitist non-dominated sorting genetic algorithm. They presented the development of an automated system that optimizes the scheduling of several construction projects according to different objectives, considering financial aspects and required resources under the operating system. Pinha et al. [18] have also addressed the multi-project scheduling problem with limited resources in their research. In this study, they presented mathematical modeling for multi-project scheduling with multiple resource constraints in ship repair.
Joo and Chua [19] have addressed the MMRCMPSP assuming splitting of ad hoc activities in civil engineering companies. They presented a mathematical model for this problem and used a simulated annealing (SA) algorithm to solve it. Rostami et al. [20] have also investigated multi-project scheduling problems by assuming resource pool locations for periodic services. They considered the transfer of resources between projects and presented a mathematical model to minimize the completion time. Further, they used the artificial bee colony algorithm to solve the model. Li and Xu [21] studied the multi-project scheduling problem with resource constraints using a multi-agent system and a two-stage decomposition method. Nabipoor Afruzi et al. [1] also presented a robust optimization mathematical model for the multi-project scheduling problem with limited resources under conditions of uncertainty in the time of activities. Shafahi and Haghani [22] addressed the problem of project scheduling and selection of projects with phase interdependence between phases. They presented a mixed integer programming (MIP) mathematical model that maximizes the NPV and future investments under time limitations on budgets and reinvestment strategies. Birjandi and Mousavi [23] presented fuzzy mixed integer nonlinear programming (MINLP) in a mathematical model for the RCPSP in fuzzy conditions with multiple routes. To solve the model, they used a hybrid metaheuristic approach based on particle swarm optimization (PSO) and genetic algorithms to minimize project completion costs. Additionally, Garcia-Nieves et al. [24] proposed a multi-objective linear-programming optimization model for scheduling repetitive activities in construction projects. Their research presented a guide and computational testing of a new mathematical model that can optimize construction schedules according to the most given conditions in terms of time and location.
Zou and Zhang [25] presented a constraint programming approach with atypical activities for scheduling repetitive projects by soft logic. They have developed a flexible, iterative scheduling model by integrating soft logic into the time-cost trade-off. This model allows similar activities in different units to be performed in parallel (run simultaneously), sequentially (one after the other), or partially parallel and partially sequentially. Also, Rahman et al. [26] addressed the problem of a construction project scheduling with resource-constrained using a memetic algorithm. Zhang and Cui [27] investigated the problems of project scheduling and ordering materials considering the storage space limitation. They presented a two-objective mathematical model for minimizing the construction project’s time and related costs, including material inventory costs, ordering costs, and indirect costs. The proposed model is NP-HARD, and the NSGA-II algorithm has been used to solve it.
Also, in recent years, many studies have been performed on project scheduling problems, considering the aspects of sustainability. El-Alfy [28] investigated the design of sustainable constructions according to value engineering principles. Also, Hwang et al. [29] have addressed the management of green and sustainable construction projects to improve project scheduling performance. Ali et al. [30] also reviewed and studied the project management and sustainability literature. They examined previous research on the impacts of sustainability aspects in different phases of project management. Their investigations showed that the components of sustainability significantly affect all stages of project management, and their consideration leads to improvements in the project management process. Mahmoudi et al. [31] investigated the problem of sustainable project scheduling in construction and presented a mathematical model. The purpose of the mathematical model proposed by them is based on the aspects of sustainability. It includes minimizing the costs of pollutants and job injuries, for which they used the SA algorithm for optimization. Their study considers the project network dynamically, and the model’s parameters are also probabilistic.
Wang et al. [32] studied the issue of green project planning concerning sustainable development. For this problem, they presented a two-objective mathematical model with the goals of minimizing the project cost and maximizing the reduction of pollutant gas emissions. They used the NSGA-II to solve the model. Several construction projects are considered in the investigated problem, and the presented mathematical model deals with the scheduling of project activities in the planning period with sustainability goals. Habibi et al. [7] have also investigated the problem of scheduling project activities and ordering materials, taking into account sustainability considerations for construction projects. In a research article, Mahmoudi et al. [33] evaluated, selected, and scheduled urban road construction projects (URCP) considering sustainability. In their article, the network for a data envelopment analysis (DEA) model is first built. Then, considering the elements of sustainability, combining data coverage analysis, game theory, and the selection and scheduling of sustainable URCP, a two-level model for the selection and scheduling of URCP is presented. Finally, an algorithm is proposed to solve the model.
Khayamim et al. [34] presented a sustainable approach for selecting and scheduling urban transportation infrastructure projects in large networks. In their research, a new procedure has been presented to accomplish the selection and scheduling of urban transportation projects simultaneously. They also presented a mathematical programming model, and according to the relevant model, a two-phase hybrid solution method was developed. Askarifard et al. [35] have also provided a robust multi-objective optimization model for project scheduling by considering risk and sustainable development criteria. They presented a model with the objectives of minimizing cost, risk, and socio-environmental impacts to reduce project delays. RezaHoseini et al. [8] have also presented a bi-objective model for green construction supply chains under conditions of uncertainty, in which supplier integration and multi-project scheduling are considered. This study evaluates the construction supply chain using a bi-objective linear mathematical model in which the actual environmental impacts of vehicles in terms of distance, pollution status, and road slope are considered. Also, the synergy between supplier selection and project timing in the proposed green supply chain is considered in this research.
It is worth mentioning that apart from the cited cases, various and numerous other studies have been carried out in civil engineering fields, using new methods and computer algorithms to overcome different technical issues [36,37,38], which, for the coherence and brevity of contents in this section, only these items are noted, and the review of the most relevant previous research is limited to them in this part of the article. Now, regarding the mentioned cases, in the following and in the form of Table 1, to better comprehend and identify the previous studies and research gaps, a comparison and overview of some significant studies and articles in this field have been made with the current research.
As shown in Table 1, various researchers have investigated the problems of multi-project scheduling and sustainability considerations. However, this research takes a more integrated and comprehensive approach by considering other important factors, such as interest rates, discount factors, risk criteria, organizational criteria, and competitive criteria, in addition to sustainability issues. Project selection, material ordering, and supplier selection are also included in the scheduling and modeling process. Furthermore, this research incorporates uncertainty conditions based on evidence theory, which has not been previously performed in an integrated and combined manner in this field. Another notable aspect of this research is the inclusion of carbon penalties for suppliers who exceed the allowed pollution limit. It is worth mentioning that previous research in the field of multi-project scheduling in the construction industry has not given adequate attention to the carbon penalty. Finally, this research employs a multi-objective mathematical modeling approach and uses metaheuristic algorithms such as the DE and NSGA-II to solve the problem. Considering all the mentioned cases and conditions, this integrated approach can lead to a practical and optimal solution to make appropriate executive decisions.

3. Mathematical Modeling

As mentioned in the previous sections, this research aims to present an integrated multi-objective mathematical model for multi-mode resource-constrained multi-project scheduling in the construction industry with a sustainable development approach under uncertain conditions. In this respect, the current research problem includes several projects that require renewable and non-renewable resources to complete activities. The required resources for each project are predetermined, and renewable resources include machinery, equipment, and human resources, while non-renewable resources include materials and supplies that must be purchased from suppliers with limited capacity.
Figure 1 presents the current study’s conceptual model of relations between supplier conditions, project activities, and the scheduling process. This formation shows that the required resources are obtained from different suppliers to complete project activities. Finally, project activities are finished using the acquired resources according to the corresponding schedule. Suppliers have limited capacity to provide resources for project activities, and the transportation time of resources from suppliers to projects is determined and varies. In order to maintain the resources, costs associated with maintenance and operation must be paid. In this respect, the time value of money (TVM) is also considered based on the interest rate in each period. In addition, various factors, such as liquidity risk of the supplier, natural disaster risk for the supplier, defective or low-quality materials and equipment from the supplier, and late delivery risk of resources by the supplier are considered in the model for selecting the supplier and ordering materials from them, according to expert opinions. Projects also have priority, which is determined by the project’s score based on economic, environmental, technical, social, organizational, and competitive factors.

3.1. Assumptions of Modeling

In the current research problem, the modeling assumptions are as follows:
  • The research issue is a multi-project problem mainly focused on construction projects.
  • Each project has its own activities, and projects do not share activities.
  • Among the available projects, one or more projects can be selected.
  • The beneficiaries of this issue are the employer, contractor, and suppliers.
  • From the employer’s point of view, the projects have priority, which is determined in the form of project points according to economic, environmental, social, technical, organizational, and competitive factors and announced to the contractor.
  • According to the experts’ opinions, there is a possibility of some risks occurring, such as the risk of financial and liquidity for suppliers, the risk of natural disasters for the supplier, the risk of defective and low-quality materials and equipment provided by the supplier, and the risk of delayed delivery of resources by the supplier.
  • The processing time of activities is uncertain, and evidence theory is used to consider this uncertainty and related conditions.
  • Renewable resources (such as labor and machinery) or non-renewable resources (such as construction materials, such as cement, plaster, steel rebar, brick, and tile) are required to complete project activities.
  • Non-renewable resources are purchased from multiple suppliers, and each supplier can only deliver one type of non-renewable resource. For example, cement can be purchased from one supplier, and steel rebar can be bought from another.
  • The mathematical model of the current research is multi-objective and aims to maximize the weight of selected projects based on the implementation priorities of the employer, which include economic, environmental, social, technical, organizational, and competitive factors; furthermore, it has the intention of maximizing the profits and minimizing the risks in projects.

3.2. Components and Descriptions in the Mathematical Model

In the following in this section, the mathematical model’s relevant indices, parameters, and variables are presented and described in Table 2, Table 3 and Table 4, respectively.

3.3. Relations of Objective Functions and Constraints in the Mathematical Model

According to the descriptions of indices, parameters, and variables, the main structure of the mathematical model and the objective functions and constraints are presented in the following.
M a x   Z 1 = j J ( E M j + L D j + L M j + L n v j + o r g j + c o m j )   z p j
The mathematical Relation (1) expresses the first objective function of the model to maximize the weight of a project selection according to environmental, economic, social, technical, organizational, and competitive factors.
M a x   Z 2 = a i j A t = E S i j L S i j m = 1 M C F i j m + U i j m X i j t P / F , I r % , t a i j A t = E S i j L S i j m = 1 M C F i j m U i j m X i j t P / F , I r % , t a i j A t = E S i j L S i j m = 1 M C o s t i j m U i j m X i j t ( P / F , I r % , t ) k K j = 1 J i = 1 n j t = 1 max L S i j + P i j m 1 H k I k t P / F , I r % , t j J ω j   T D j
The mathematical Relation (2) is the model’s second objective function, which aims to maximize profits.
Min Z 3 = j s x s j ( v a r d s j + v a r q s j ) + s ( v a r n d s + v a r c f s ) j x s j + s ρ ( j E N V s j P M A X )
The mathematical Relation (3) is the third objective function of the model in order to minimize pollution and supply risks.
j = 1 J q s j C s ,                                                                   s S
The constraint Relation (4) states that the sum of the demand of all the projects in the portfolio from a supplier should not exceed the capacity of that supplier.
s S ( k ) q s j Q j k ,                                                         j J ,   k K ( j )
Relation (5) indicates that the amount of demand for each project in the portfolio from each supplier should not be less than the quantity required by the project from that source.
q s j M x s j                                                                           ,   s S ( k ) , k K ( j ) , j J
Relation (6) states that if the supplier s serves project j, then the amount of demand for that project from the supplier can exist.
s S ( k ) x s j = 1                                                               , j J ,   k K ( j )
The mathematical Relation (7) shows that each supplier provides only one resource.
j = 1 J s S c s j q s j B                                                 ,   s S ( k ) , k K ( j ) , j J
Relation (8) states that the total procurement cost for non-renewable resources in the project portfolio should be under the budget.
S T i j ( r s + τ s j ) × x s j                                 ,   s S ( k ) ,   k K ( a i j ) ,   a i j A ( j ) ,   j J
Relation (9) indicates that the activity can start after the required non-renewable resources are available. In fact, the activity starts when the resources are available at the same time.
( S T i j + P i j m ) × u i j m S T i j               , ( a i j , a i j ) E ( j ) ,   j J ,   m M
Relation (10) indicates the prerequisite relationships of the activities in the selected projects.
( S T i j + P i j m ) × u i j m M ( 1 y i i j ) S T i j         ,     i , i A L ( l ) , i i , l L ( j ) ,   i , i k ( a i j ) , k K ( a i j ) , j J
( S T i j + P i j m ) × u i j m M y i i j S T i j                           ,     i , i A L ( l ) , i i , l L ( j ) , i , i k ( a i j ) , k K ( a i j ) , j J
Relations (11) and (12) show that activities in the selected project that share a renewable resource cannot start simultaneously. Also, each project has its own separate resources.
m = 1 M u i j m = 1                                                                         , a i j A ( j ) ,   j J
Relation (13) guarantees that each activity is implemented in only one mode.
C T j ( S T i j + P i j m ) × u i j m                     , a i j A ( j ) ,   j J ,   m M
Relation (14) states that the project is finished after completing all its activities.
D T j C T j + R j                                                             , j J
Relation (15) calculates the time to complete the review of each project.
D T j D T j M ( 1 z j j ) + R j                       ,   j { 0 } J ,   j J ,   j j
Relation (16) ensures that the review sequence of the projects in the portfolio is respected based on the completion time.
j { 0 } J ,   j j z j j = 1                                             ,   j J
Relation (17) guarantees that the check of projects is performed once.
j J z 0 j = 1
Relation (18) guarantees that only one project can be checked immediately after the dummy project 0.
j J ,   j j z j j 1                                                             ,   j , j J
Relation (19) ensures that immediately after a project, such as j, at most, one project can be checked.
T D j D T j + D D j                                                     ,   j J
Relation (20) states the delay of each project.
t = E S i j L S i j X i j t = 1                                                                 ,   a i j A
Relation (21) shows that the activity can be performed only between the earliest and the latest start time.
S = 1 S k = 1 K i = 1 n j t = 1 max ( L S i j + P i j m 1 ) Y i j k s m t = 1                       ,   a i j A , m M ,   j J
Relation (22) states that one purchase is required for each type of resource in the activity.
I k , 0 = I k ,   max ( L S i j + P i j m ) = 0                                                                   ,   k K ,   a i j A
Relation (23) states that the level of resources at the beginning of the first period and the end of the final period is zero.
I k t = I k t 1 + a i j A s S m = 1 M b i m k j × Y i j k s m t τ s j a i j A m = 1 M t = max t P i j m + 1 , E S i j min t , L S i j u i j m b i m k j P i j m X i j t           ,     j J ,   k k a i j ,   t = 1,2 , , max ( L S i j )
Relation (24) shows the limitation of resource inventory level in time periods.
S = 1 S k = 1 K t = 1 max ( L S i j + P i j m 1 ) ( t + τ s j ) × Y i j k s m t t = E S i j L S i j t × X i j t     ,   a i j A ,   m M
Relation (25) shows that any activity can start only after providing the requested resource.
z j j M × z p j × z p j                                                   , j , j J
Relation (26) states that the projects are examined if they are selected in the project portfolio.
x s j M × z p j                                                                             ,   s S ( k ) , k K ( j ) , j J
Relation (27) shows that the supplier provides services to the projects selected in the portfolio.
t X i j t M × z p j                                                             ,   a i j A ( j ) ,   j J
Relation (28) shows that the project’s activities start if the project is selected in the portfolio.
m = 1 M u i j m M × z p j                                                           , a i j A ( j ) ,   j J
Relation (29) states that activity can be implemented in a mode if the project is selected in the portfolio.
As mentioned, in the current research model, it is assumed that the processing time of the activities is non-deterministic, and the limitations related to the processing time are chance constraints. If the processing time is considered a possibility and if 1 − βi is assumed to be the lowest probability of the i constraint, the limitations, including the processing time of the activities, are rewritten as follows:
p [ ( S T i j + P i j m ) × u i j m S T i j ] 1 β 1                                             ,     ( a i j , a i j ) E ( j ) ,   j J ,   m M
p [ ( S T i j + P i j m ) × u i j m M ( 1 y i i j ) S T i j ] 1 β 2           ,     i , i A L ( l ) , i i , l L ( j ) , k K ( a i j ) , j J
p [ ( S T i j + P i j m ) × u i j m M y i i j S T i j ] 1 β 3                             ,     i , i A L ( l ) , i i , l L ( j ) , k K ( a i j ) , j J
p [ C T j ( S T i j + P i j m ) × u i j m ] 1 β 4                                         ,   a i j A ( j ) ,   j J ,   m M
p [ I k , 0 = I k , max ( L S i j + P i j m ) = 0 ] 1 β 5                                     ,   k K ,   a i j A
p I k t = I k t 1 + a i j A s S m = 1 M b i m k j × Y i j k s m t τ s j a i j A m = 1 M t = max t P i j m + 1 , E S i j min t , L S i j u i j m b i m k j P i j m X i j t 1 β 6         ,     j J ,   k k a i j ,   t = 1,2 , , max ( L S i j )

3.4. Uncertainty and Evidence Theory

In recent decades, various mathematical theories have been devised and studied to use in conditions of uncertainty and certainty. Some of these theories include the classical theory of sets and entropies [39], the theory of fuzzy sets and systems [40,41], the probability theory [39], the possibility theory [42], the Dempster–Shafer evidence theory [43], the random sets theory [44], fuzzy measure theory [45], and fuzzy event probability theory [41]. Often, some theories possess only one specific type of uncertainty, while more general theories (such as Dempster–Shafer evidence theory) include more than one type of uncertainty, meaning that they consider different aspects of data breach related to a problem. In the evidence theory, the Dempster combination rule effectively integrates evidence from different information sources [46].
The evidence theory and related principles were first presented by Arthur P. Dempster with the approach of upper and lower probabilities in the context of statistical inference. Dempster modeled a type of uncertainty when describing the probabilities of events. Later, Shafer formulated this theory to represent incomplete information and reasoning under uncertainty, calling it the evidence theory, and developed it further. For this reason, the theory was also named the Dempster–Shafer or D–S theory. Conceptually, this theory is similar to Bayesian theory and, in its developed form, can deal with incomplete data, except that it uses knowledge-dependent uncertainty, which is the advantage of evidence theory, including flexibility and ease of implementation [47,48].
However, some researchers notice the difference between Bayesian statistical modeling and Dempster–Shafer theory as different concepts. In their opinion, the Bayesian model actually presents a Boolean type of phenomenon in which the phenomenon either exists or does not exist [48]. Although Bayesian rules have a classical concept in the field of probability, the Dempster–Shafer rule is used for other variable system scenarios, such as the equal behavior of a set of variables with a non-zero crossing. In the Bayesian theory, the weights are probabilities, while in the Dempster–Shafer theory, they are sometimes referred to as masses and are intuitively discernment as probabilities. Although the Dempster–Shafer theory does not require prior probability information for its function, it does require an initial allocation of mass that reflects our initial knowledge of the system. In addition, the Dempster–Shafer theory has the advantage of being more explicit for the states of doubt in individual knowledge. Also, the evidence theory allows considering of more concepts, such as belief (Bel) and plausibility (Pl), while the Bayesian approach is limited only to the classical concepts of probabilities [43,49].
The Dempster–Shafer theory uses a set of numbers in the range of [0, 1] to represent a belief in given hypotheses based on some evidence. These numbers indicate the degree of support for the hypotheses provided by the evidence. Unlike the other models, the Shafer model does not use negative numbers; thus, it can be considered an extension of Bayesian and combination functions. In this theory, the power of giving over evidence depends on the data sources, which are usually people, organizations, and information providers for the desired scenario. Objectively, the observers and sources of data are located outside the system, and subjectively, they can be operators or experts. From an objective point of view, the correct hypothesis is completely recognizable, but from a subjective point of view, matching the hypothesis with reality is inconclusive and probable [50].
Based on the mentioned points, in this research and in order to investigate uncertainty, evidence theory has been used, which starts with the definition of the frame of discernment. In this respect, suppose that θ is a finite nonzero set of N unique elements. Then 2θ shows the set of all its subsets, which includes all the examined propositions.
θ = { H 1 , H 2 , , H N }
On the other hand, 2θ includes the null set and θ itself, which null represents a statement that we know is false. Also, θ corresponds to a statement that we know to be true. Considering the idea of a discernment frame, it is possible to give a mathematical form to this intuitive idea in which a part of the belief can be assigned to a proposition without necessarily assigning it to this proposition or its opposite. The part of the belief assigned to a statement, in the form of a discernment frame, means that a part of the belief that belongs to a subset also belongs to all the subsets that include it.
It should be possible to distribute all of a person’s beliefs among subsets of θ in such a way that each subset, such as A, is given a part of the belief that is only specific to A and does not belong to any of the subsets of A. Based on this, Shafer describes that if θ is a frame of discernment, the function as m(x):2θ → [0, 1] is a basic probability assignment if the following three relations hold.
m ( φ ) = 0  
A 2 θ m ( A ) = 1
0 m ( A ) 1
The m(A) is called the basic probability number, representing the belief that exactly is assigned to A. Relation (37) shows that no belief should be assigned to the null subset (φ). In this regard, Relation (38) indicates that the total size of a person’s belief is equal to 1, so the quantity m(A), according to the interval of Relation (39), represents the belief that exactly belongs to A. In order to measure the total belief assigned to A, all quantities m(B) where B is a subset of A and is also called the focal element of m should be considered.
B e l ( A ) = B A m ( B )
If θ is a discernment frame, the function as Bel:2θ → [0, 1] is a belief function if it satisfies the conditions of the following Relations (41) and (42).
B e l ( φ ) = 0  
B e l ( θ ) = 1
Also, for every positive integer number such as n and every set of A1, A2, …, An subsets of θ, the following Relation (43) holds.
B e l ( A 1 A 2 A n   ) i B e l ( A i ) i > j B e l ( A i A j ) + + ( 1 ) n B e l ( A 1 A 2 A n   )
It is worth noting that the basic probability assignment that produces a belief function is unique and can be evaluated from the belief function. Regarding doubts and upper limits of probability, it should be noted that a person’s belief in proposition A is not fully described by the degree of belief as Bel(A), and it does not indicate the degree of doubt regarding A or the degree of belief in the negation of A. In this respect, a more accurate description can be considered according to the following relations, including the degrees of belief and doubt.
D o u ( A ) = B e l ( A ¯ )
Actually, the degree of doubt is not as useful as the quantities of the following relation:
P l ( A ) = 1 D o u ( A )  
This quantity represents the extent to which a person does not doubt A, that is, the extent to which a person considers A to be possible. In fact, Pl(A) is the upper limit of the probability of A.
If Bel is a belief function defined on the frame θ, the function as Pl:2θ → [0, 1] is the plausibility function and is defined as follows:
P l ( A ) = 1 B e l ( A ¯ )    
According to the above relation, this function is the upper probability for Bel. In evidence-based reasoning, each evidence or observer creates an evidentiary or intuitive distance. In this respect, the lower limit (Bel) is called belief, and the upper limit (Pl) is called plausibility.
Considering that Pl(A) is the upper limit of the probability function for Bel, it can be written as:
B e l ( A ) P l ( A )
On the other hand, if m is a Bayesian function and then:
B e l ( A ) = P l ( A )
In fact, this function is a measure of probability evaluation. Concerning the mentioned points, in this research, the evidence theory is also used to model the uncertainty of the processing time of the activities, which is a positive real number; we will face the definition of the mass function in the set of R+ numbers. The mechanisms of the belief function theory, which were introduced earlier, remain in the same state if the number of focal sets is unknown [51]. It is worth noting that the focal sets of the mass function, which are also considered in this research, will be in the intervals of positive numbers. In addition to the mentioned cases, the issue of adding evidential variables used in the following sections has been defined and presented according to previous research in this field [52].
Considering that [ w ] = [ w _ , w ¯ ] , this means that w _ w w ¯ ; in this regard, we assume that σ and τ are two evidential variables of intervals in R+ space and have a limited number of focal sets. The sum of these two variables means that σ + τ, with the following mass function, is an evidential variable.
m ( σ + τ [ u ] ) = [ s ] + [ t ] = [ u ] m ( σ [ s ] ) . m ( τ [ t ] )
[ s ] + [ t ] = [ s _ + t _ , s ¯ + t ¯ ]
For σ and τ (evidential variables in the above definition), suppose σ ¯ and τ ¯ are two independent random variables with the associated probability mass functions p σ ¯ and p τ ¯ for focal sets [ s _ , s ¯ ] and [ t _ , t ¯ ] , which are, respectively, defined as follows:
p σ ¯ ( s ¯ ) = m ( σ [ s _ , s ¯ ] )
p τ ¯   ( t ¯ ) = m ( τ [ t _ , t ¯ ] )
In the previous relations, σ ¯ and τ ¯ are the upper limits of the probabilities of σ and τ, which can be shown:
B e l ( σ + τ Q ) = p ( σ ¯ + τ ¯ Q )                                   , Q R +

3.5. Project Scheduling Model Based on the Evidence

In this section, the description and explanation of cases where the uncertainty of the processing time of the activities in the project scheduling problem, which are represented by the belief functions, are performed. Suppose that processing time is evidential rather than just deterministic or probabilistic. In this regard, according to the fundamental studies that have been carried out in this field [53], the constraints, including the time of activities in the project scheduling model based on the evidence and beliefs, have been explained. As mentioned earlier, in the present research model, it is assumed that the processing time of the activities is uncertain, and the constraints related to the processing time are chance constraints. In this respect, if 1 − βi is assumed to be the lowest probability of establishing i constraint, the limitations, including the processing time of the project activities, can be rewritten as follows:
B e l [ ( S T i j + P i j m ) × u i j m S T i j ] 1 β 1 _             ,   ( a i j , a i j ) E ( j ) ,   j J ,   m M
P l [ ( S T i j + P i j m ) × u i j m S T i j ] 1 β 1 ¯                 ,   ( a i j , a i j ) E ( j ) ,   j J ,   m M
B e l [ ( S T i j + P i j m ) × u i j m M ( 1 y i i j ) S T i j ] 1 β 2 _           ,     i , i A L ( l ) , i i , l L ( j ) , k K ( a i j ) , j J
P l [ ( S T i j + P i j m ) × u i j m M ( 1 y i i j ) S T i j ] 1 β 2 ¯               ,     i , i A L ( l ) , i i , l L ( j ) , k K ( a i j ) ,   j J
B e l [ ( S T i j + P i j m ) × u i j m M y i i j S T i j ] 1 β 3 _                           ,     i , i A L ( l ) , i i , l L ( j ) , k K ( a i j ) , j J
P l [ ( S T i j + P i j m ) × u i j m M y i i j S T i j ] 1 β 3 ¯                                 ,     i , i A L ( l ) , i i , l L ( j ) , k K ( a i j ) , j J
B e l [ C T j ( S T i j + P i j m ) × u i j m ] 1 β 4 _                     ,   a i j A ( j ) ,   j J ,   m M
P l [ C T j ( S T i j + P i j m ) × u i j m ] 1 β 4 ¯                         ,   a i j A ( j ) ,   j J ,   m M
B e l [ I k , 0 = I k , max ( L S i j + P i j m ) = 0 ] 1 β 5 _                 ,   k K ,   a i j A
P l [ I k , 0 = I k , max ( L S i j + P i j m ) = 0 ] 1 β 5 ¯                     , k K ,   a i j A
B e l I k t = I k t 1 + a i j A s S m = 1 M b i m k j × Y i j k s m t τ s j a i j A m = 1 M t = max t P i j m + 1 , E S i j min t , L S i j u i j m b i m k j P i j m X i j t 1 β 6 _         ,     j J ,   k k a i j ,   t = 1,2 , , max ( L S i j )
P l I k t = I k t 1 + a i j A s S m = 1 M b i m k j × Y i j k s m t τ s j a i j A m = 1 M t = max t P i j m + 1 , E S i j min t , L S i j u i j m b i m k j P i j m X i j t 1 β 6 ¯         ,     j J ,   k k a i j ,   t = 1,2 , , max ( L S i j )
It is worth noting that if the sum of the processing times is considered in some constraints, it is performed according to the Relations (49) and (50) and the relevant explanations mentioned. Also, depending on the values chosen for β i ¯ and β i _ and the nature of the evidential processing times P i j m , the modeling may turn into a simpler optimization. For example, if β i _ = β i ¯ , it is of special importance. In this case, the constraints, including Pl in all limitations, can be removed; that is, only the constraints of Bel need to be evaluated. Actually, if the constraints of Bel are satisfied, the constraints of Pl are necessarily satisfied due to the relationship between the belief and plausibility functions. In this respect, the approach based on the belief is one of this type, and no limitation based on Pl is considered [53].
In addition, according to the Relations (51)–(53) and related explanations, the modeling of the mentioned problem can be modified into an equivalent optimization problem, in which the random processing time of the activities is defined as the upper limit of its probability that means P ¯ i j m . In particular, since evidential processing is classified, we face the problem that the processing time of each activity belongs to only one interval [ P _ i j m , P ¯ i j m ] ; therefore, in this regard, the belief constraints and relations are represented as follows:
( S T i j + P ¯ i j m ) × u i j m S T i j                           ,   ( a i j , a i j ) E ( j ) ,   j J ,   m M
( S T i j + P ¯ i j m ) × u i j m M ( 1 y i i j ) S T i j               ,     i , i A L ( l ) , i i , l L ( j ) , k K ( a i j ) , j J
( S T i j + P ¯ i j m ) × u i j m M y i i j S T i j                                 ,     i , i A L ( l ) , i i , l L ( j ) , k K ( a i j ) , j J
C T j ( S T i j + P ¯ i j m ) × u i j m                                 ,   a i j A ( j ) ,   j J ,   m M
I k , 0 = I k , max ( L S i j + P ¯ i j m ) = 0                           ,   k K ,   a i j A ( j ) ,   j J  
I k t = I k t 1 + a i j A s S m = 1 M b i m k j × Y i j k s m t τ s j a i j A m = 1 M t = max t P ¯ i j m + 1 , E S i j min t , L S i j u i j m b i m k j P ¯ i j m X i j t     ,     j J ,   k k a i j ,   t = 1,2 , , max ( L S i j )
In the case of processing times and β i _ = β i ¯ , the project scheduling optimization model under consideration means searching in the feasible area of the problem to optimize the objective functions assuming the maximum amount of processing time (worst case), which is in accordance with min-max optimization methods regarded in robust optimization [54].
It is reminded that the case of β i _ = 1 > β i ¯ , is the inverse of the case of β i _ = β i ¯ . Also, the constraints related to the Bel can be dropped because they are necessarily satisfied and only evaluate the constraints related to the Pl. In addition, in the case of β i _ = 1 > β i ¯ as in the case of β i _ = β i ¯ , the modeling problem can be changed into an equivalent optimization problem due to the existence of a counterpart according to Relations (51)–(53) and the mentioned explanations for the plausibility function, which depends on the lower endpoints of the focal sets.

4. Solution Methods and Algorithms

In this research, for solving the multi-objective mathematical model, metaheuristic optimization algorithms, such as the differential evolution (DE) algorithm based on the Pareto archive have been employed, and for evaluating the results, the non-dominated sorting genetic algorithm II (NSGA-II) has also been used. The DE algorithm is a powerful algorithm for solving nonlinear and multi-objective optimization problems, which was designed by Storn and Price [55]. This method combines simple mathematical operators with crossover, mutation, and selection operators. The basic idea of this algorithm is to generate practical parameter vectors for optimization. The mutation and crossover operators produce new vectors, and the selection operator converts these vectors into possible solutions for the next generation of the algorithm.
The DE algorithm works with a set of optimization parameters represented by D-dimensional parameter vectors called members. This algorithm is population-based, and each generation or iteration of the algorithm includes a population of these vectors (NP answers). Accordingly, the main process and the general structure of the DE algorithm are presented as Algorithm 1, and relevant explanations in the following.
Algorithm 1. The main process and the general structure of the DE algorithm.
{
G = 0
Create a random initial population C i g i ,   i = 1 , , NP
Evaluate f ( C i g ) i ,   i = 1 , , NP
 For G = 1 to MAX GEN Do
  For i = 1 to NP Do
   Select randomly r1 ≠ r2 ≠ r3:
   jrand = randint(1,D)
    For j = 1 to D Do
     If (randj [0, 1) < cr or j = jrand) Then
       M i , j G + 1 = C r 3 , j G + f ( C r 1 , j G C r 2 , j G )
     Else
       C i , j G + 1 = C i , j G
     End If
    End For
   If ( f ( M i G + 1 ) f ( C i G ) ) Then
     C i G + 1 = M i G + 1
   Else
     C i G + 1 = C i G
   End If
  End For
  G = G + 1
 End For
}
As mentioned earlier, this algorithm is based on the population, and each iteration of the algorithm includes a population of answers. In the basic DE algorithm, the initial population of the algorithm is randomly generated. Each answer in the population is represented by C i g , in which i indicates the number of the answer in the population, and g represents the number of the generation of the algorithm. In this respect, it is assumed that the population size in each generation is equal to NP, in which case i is a number in the interval [1..NP]. The population in iteration g is represented by Pc, and P c , i g represents the answer number i in iteration g, which is C i g where i = 1, 2, …, NP. Actually, in each solution, C i g is a D-dimensional vector whose j element or dimension is represented by C i , j g where j = 1, 2, …, D–1.

4.1. Representation and Structure of the Answers

In this research and the related modeling, the matrix structure has been used to represent the answers. In order to display the variables z p j , C T j , D T j , and T D j , a one-dimensional matrix is used, and the number of elements in these matrices is equal to the number of projects. For the variable z p j , the matrix element’s value is either 0 or 1, indicating whether a project is selected or not. The values of the elements in C T j , D T j , and T D j represent the project completion time, the due time for examination of the project, and the project delay, respectively. A two-dimensional matrix is also used to show the variables z j j , x s j , S T i j , c i j , q s j , and I k t . The U i j m variable is also represented by a three-dimensional matrix. It should be noted that the matrix dimensions related to the mentioned variables are based on the variable indices and their element values according to the definitions made in the mathematical modeling section. Also, the values of X i j t , y i i j , and Y i j k s m t variables are determined based on the following matrices and mentioned points.

4.1.1. Matrix of the First Type

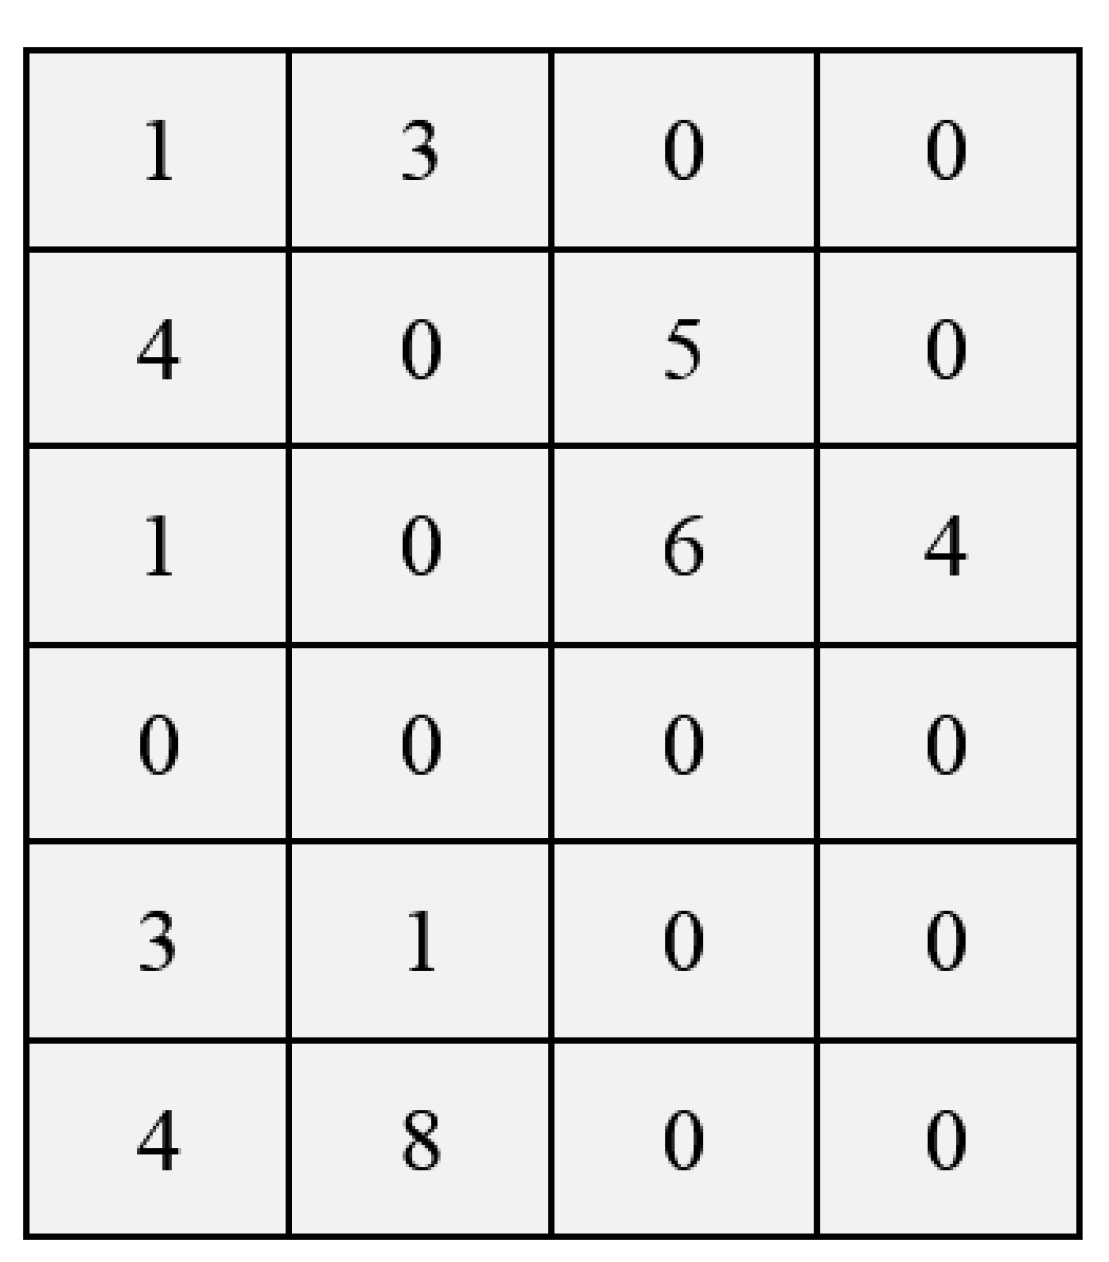
The structure of the first matrix is a two-dimensional matrix whose number of rows is twice the number of selected projects. The information on each project is displayed in two lines, the first line includes the schedule of the relevant project activities, and the second line shows the implementation mode of each project activity. The structure of the first type matrix is presented in the following example.
Concerning the mentioned cases, for example, it is assumed that the investigated problem has two projects selected from all the projects, which include six and eight activities, respectively, and three implementation modes are possible for all the projects’ activities.
Figure 2 indicates that the first two lines of the above matrix are related to the first project, whose activities are scheduled as follows:
1 2 4 3 5 6
According to the presented matrix, these activities of the first project are considered for implementation in modes 1, 3, 3, 3, 3, and 3, respectively. In the same way, lines 3 and 4 are related to the second project, with eight activities considered for implementation according to the announced modes.
It is worth mentioning that according to the explained cases, based on the first type matrix, the values of X i j t and y i i j variables can be determined because this type of matrix contains information about the scheduled sequence of project activities in the time period from the start to the end of the project.

4.1.2. Matrix of the Second Type

The second matrix’s structure is a three-dimensional matrix determining which suppliers are allocated for each project source. This matrix’s number of rows equals the total number of resources needed for projects. The second dimension, or columns, represents the number of suppliers assigned to each resource. The third dimension, or height, also shows the activity number. Concerning the mentioned cases, for example, it is assumed that two projects and three resources are required for supply. In this respect, the allocation of suppliers to the resources required for the activity of the projects is in the form of a matrix, as follows.
As can be seen in Figure 3, the number of rows of the matrix is equal to 6. The first three rows are related to the resources of the first project, and the next three rows are related to the resources of the second project. In this regard, the first resource of the first project in the activity is provided by supplier number 1 at time 3, the second resource by suppliers 4 and 5 at time 0, and the third resource by supplier number 1 at time 0, and supplier number 6 at time 4. According to Figure 3 and the fourth row of the matrix, the activity of the second project does not require the first resource. The second resource of the activity of the second project is provided by supplier number 3 at time 1, and the third resource is provided by supplier number 4 at time 8.
It is worth mentioning that the information related to the implementation mode can be calculated from the variable U i j m and the information related to the period t from the sequence of projects’ activities in the previous structure and other related variables. In the current research, in order to produce a feasible solution, the matrix related to the selection of projects was randomly generated first. Then the series–parallel approach was used to schedule the activities of projects, according to previous research [56]. After determining the sequencing of the activities using the mentioned method, their implementation modes were randomly assigned and evaluated. Also, the variables related to the start time and completion time were calculated based on the sequences, and the allocation of suppliers to order materials was performed randomly while respecting the suppliers’ capacity. It should be noted that, to produce the initial answer set, as many non-repetitive feasible answers as the population size were generated.

4.2. Mutation Operator

The DE algorithm includes the mutation operator, which works, such as the genetic algorithm, with two parents. In the DE algorithm, the mutation operator is applied to two parents C i g and ( C J g C K g ) and the child or mutation vector M i g is produced. In this respect, Relation (72) shows how the mutation operator produces a child from two parents in this algorithm.
M i , j g = C i , j g + A × r a n d i , j g × ( C J , j g C K , j g )
In the relation mentioned above, factor A is a positive number greater than or equal to 1 that controls the rate or speed of population evolution. Also, the rand is a random number in the range (0, 1).

4.3. Crossover Operator

As mentioned in the previous section, a mutation vector named M i g is generated for the vector of the solution C i g . After generating the mutation vector, this vector is crossed with the current solution or C i g and a new vector named T i g is produced. In this regard, the Relation (73) indicates how the crossover operator works in this algorithm.
T i , j g = { M i , j g         i f   ( r i , j g c r   o r   j = j r ) C i , j g             i f                       o t h e r w i s e              
The cr is the crossover factor that the operator uses to determine the elements of the T i g vector. Also, the value of the cr factor is in the range (0, 1), and by comparing this factor with the random value, the elements of the new vector are determined. It is worth noting that the value of r i , j g is in the interval (0, 1).

4.4. Selection Operator

In this part of the algorithm, the vector T i g is compared with the solution vector C i g based on the value of the objective function or the fitness function, and the elements of an answerable vector are selected from the elements of the crossover vector ( T i g ) and the solution ( C i g ). The fitness function defined in each work is based on the limitations and assumptions of the same work, and it entirely depends on the problem under investigation. In this respect, Relation (74) shows how the selection operator works.
C i g + 1 = { T i g           i f   ( f i t n e s s ( T i g ) f i t n e s s ( C i g ) ) C i g             i f     ( f i t n e s s ( C i g ) < f i t n e s s ( T i g ) )
As noted in the previous sections, an answer in the current population is first affected by the mutation operator, then by the crossover operator, and finally, by the selection operator where a new solution is produced for the next generation. All the answers for the next generation will be updated similarly. It is worth mentioning that the selection operator designed in this research works based on the prerequisite and post-requirement relationships of the activities and according to the network of projects. Also, the numbers in the vector resulting from the crossover are used for each project as priorities. In this way, at each stage, the activities that can be scheduled according to the project network are selected as candidates, and among them, an activity is selected whose corresponding number is smaller, or in other words, has a higher priority. This work continues until all activities are scheduled.
Regarding the selection of the implementation mode for each activity, the corresponding number is rounded. If the resulting number is between 1 and m, it is considered as the implementation mode without any change. If the resulting number is smaller than 1, the implementation mode of the activity is considered 1. If the resulting number is greater than m, the implementation mode is considered equal to m. It is necessary to remember that m is actually the number of implementation modes of the projects.

4.5. Updating the Pareto Archive and Selecting the Next-Generation Answers

Considering that in solving multi-objective problems, due to the possibility of conflict between objectives, there is no single solution in which all objectives are optimal, in the end, a set of dominant solutions will be presented as optimal (near-optimal) solutions. In this research, a method based on the Pareto archive has been used to solve it; also, the quality of the answers in the archive is very important. Therefore, this archive will be updated for each algorithm iteration in the current research. In order to update the Pareto archive, all the answers in the archive and the newly generated answers are put in an answer pool and leveled. Then all the answers for the first level are selected for the new Pareto archive. It is worth mentioning that in each step of the DE optimization algorithm, among the previous and new solutions, N solutions (population size) will be selected as the best solutions according to the fitness level according to Relation (75). The selection method calculates the value of cs for all these answers. Then the answers are sorted according to the ascending order of the value of cs, and finally, the first N solutions will be selected [57].
c s = r a n k c r o w d i n g   d i s t a n c e
In the above relation, the rank of the level and number of the examined answers are determined after sorting the solutions. Then the crowding distance describes the average distance component corresponding to the crowding of the other answers.

5. Results and Discussion

In order to solve the presented model, the DE optimization algorithm is used, and for assessing the performance, the results obtained from this algorithm are compared with the results of the NSGA-II algorithm based on the evaluating criteria, such as quality, spacing, and diversity metrics according to the descriptions of previous studies [57,58]. It is worth mentioning that the proposed algorithms have been implemented in MATLAB software 2015. Also, in order to solve the presented model by the algorithms, several different sample problems have been designed and examined, and after setting and adjusting the parameters of the model and algorithms, these problems have been solved by the proposed algorithms.

5.1. Setting of Parameters

For implementing the solution algorithms, the required parameters were set and adjusted as follows:
  • In the DE optimization algorithm, the cr value is set equal to 0.2.
  • A rate of 0.8 for crossover and 0.1 for mutation is considered in the NSGA-II algorithm.
  • For running the algorithms, the number of algorithm repetitions and the population size are set to 300 and 200, respectively.
Also, the other related items and parameters are considered as follows:
  • The maximum number of implementation modes is considered equal to three, and the number of resources required to complete the activities of each project and in each implementation mode is considered in a uniform interval [2..4].
  • The completion time of each project is considered in the uniform interval [m1..m2], where m2 is equal to 1.5 times, and m1 is 1.2 times the total processing time of all projects.
  • The cost of purchasing resources in a uniform interval [10..20] and the cost of performing activities in a uniform interval [5..15] are included.
  • The rate related to the value of money is considered equal to 0.18.
  • Transportation time in the uniform interval [1..5], supplier preparation time in the uniform interval [1..3], the capacity of suppliers in the uniform interval [150..300], and resource maintenance cost in the uniform interval [20..30] are considered.
  • The total budget has been calculated based on the cost of providing resources, the cost of performing activities, and other related costs of the projects.
  • The processing time of each project’s activities and implementation mode is considered in the uniform interval [10..40].
As mentioned earlier in the previous sections, in this research, non-deterministic processing time has been considered, and evidence theory has been used to model uncertainty. In this regard, first, the amount of processing time for each activity in each mode and each project has been considered in the interval [10..40]. Then, the amount of evidential (non-deterministic) processing time is calculated according to the following relations.
m ( p i j m e v = p i j m d e t ) = α
m ( p i j m e v [ p i j m d e t γ . p i j m d e t ,   p i j m d e t + γ . p i j m d e t ] ) = 1 α
It is worth mentioning that in Relations (76) and (77), p i j m e v is the evidential processing time and p i j m d e t is the deterministic processing time, which are considered in the uniform interval [10..40]. The α and γ are in the range (0, 1), which are set to 0.8 and 0.1, respectively, in the present study. Also, the value of β is considered equal to 0.1 for the uncertainty of the evidence theory.

5.2. Evaluating the Results of Solving the Model by Algorithms

In the current section, regarding the previously mentioned items, the performance, and results of solving the model by the algorithms in various problems, such as the construction of residential projects by the studied contracting company and various sample problems with small and large sizes, have been examined and discussed. In this respect, the results of solving the multi-project problem of building residential units in the studied company using the proposed model and algorithms are examined and presented. Then, the results of solving random sample problems in different scales by the presented model and algorithms are investigated and described. Also, the performance of the algorithms is compared and examined based on the values of the objective functions and evaluation metrics.

5.2.1. Solving the Problem of Multi-Project Construction

As mentioned earlier, in this research, a multi-objective mathematical model has been presented for the purpose of multi-project scheduling, taking into account various issues, such as sustainability aspects and the supply of resources from different suppliers under conditions of uncertainty. In fact, the main goal of this model is to optimize both the cost and time of projects by taking into account the other considerations explained and the relevant priorities. It should be noted that after the design and presentation of the model, in order to check its performance and practical benefits in the real world, an evaluation as a case study has also been performed. In this regard, four residential apartment construction projects in Iran, which have been implemented simultaneously by a contractor company, have been selected, and the model has been solved by algorithms based on the data of this multi-project problem.
It is worth mentioning that the required data for the model parameters and variables for this issue have been collected and analyzed using the document mining technique from the company’s database and existing organizational documents. The residential apartment construction projects by the studied company have had 80, 92, 86, and 83 main activities, respectively. In order to progress and complete them, all kinds of resources and consumable materials have been used. Also, this company has purchased the required resources from four main suppliers in the relevant construction fields. Considering the mentioned cases, the problem was solved by DE and NSGA-II algorithms, and the time and cost results obtained from solving the model of this research were compared with the corresponding values obtained from the implementation schedule of the projects in the studied contracting company. The relevant values based on the objective functions of the model are briefly presented in Table 5, and the solution algorithms’ improvement rate and practical performance have also been evaluated.
As can be seen in Table 5, using the mathematical model proposed in this research to implement the construction activities of residential projects has made appropriate improvements in the objective functions, which finally leads to optimal implementation timing and better selection of projects with higher priority and lower risk. Also, the results indicate that using the schedule obtained from solving the model by the DE algorithm provides more improvements than the NSGA-II algorithm in the present multi-project problem. The improvement rates in the DE algorithm’s results compared to the company’s results were 27.8%, 15.3%, and 13.3%, respectively, in the first, second, and third objective functions. Meanwhile, the improvement results by the NSGA-II algorithm were 9.0%, 9.7%, and 4.8% in the first, second, and third objective functions. Concerning the mentioned points and evaluating the obtained results, using the mathematical model proposed in the current study to schedule the multi-project problems of residential construction projects regarding the aspects of sustainability and material supply management is considered useful and effective. It causes a significant improvement in the success and progress of projects from the perspective of the objective functions of the presented research model.

5.2.2. Solving Random Sample Problems

In order to evaluate the performance of the model and algorithms, several sample problems have been randomly created in different scales. These problems have been solved by DE and NSGA-II algorithms, and the results have been compared and examined. In line with the mentioned cases, the generalities of the sample problems are summarized in Table 6 in the J/I/S/L/K format, where J, I, S, L, and K represent the projects, activities, suppliers, renewable resources, and non-renewable resources.
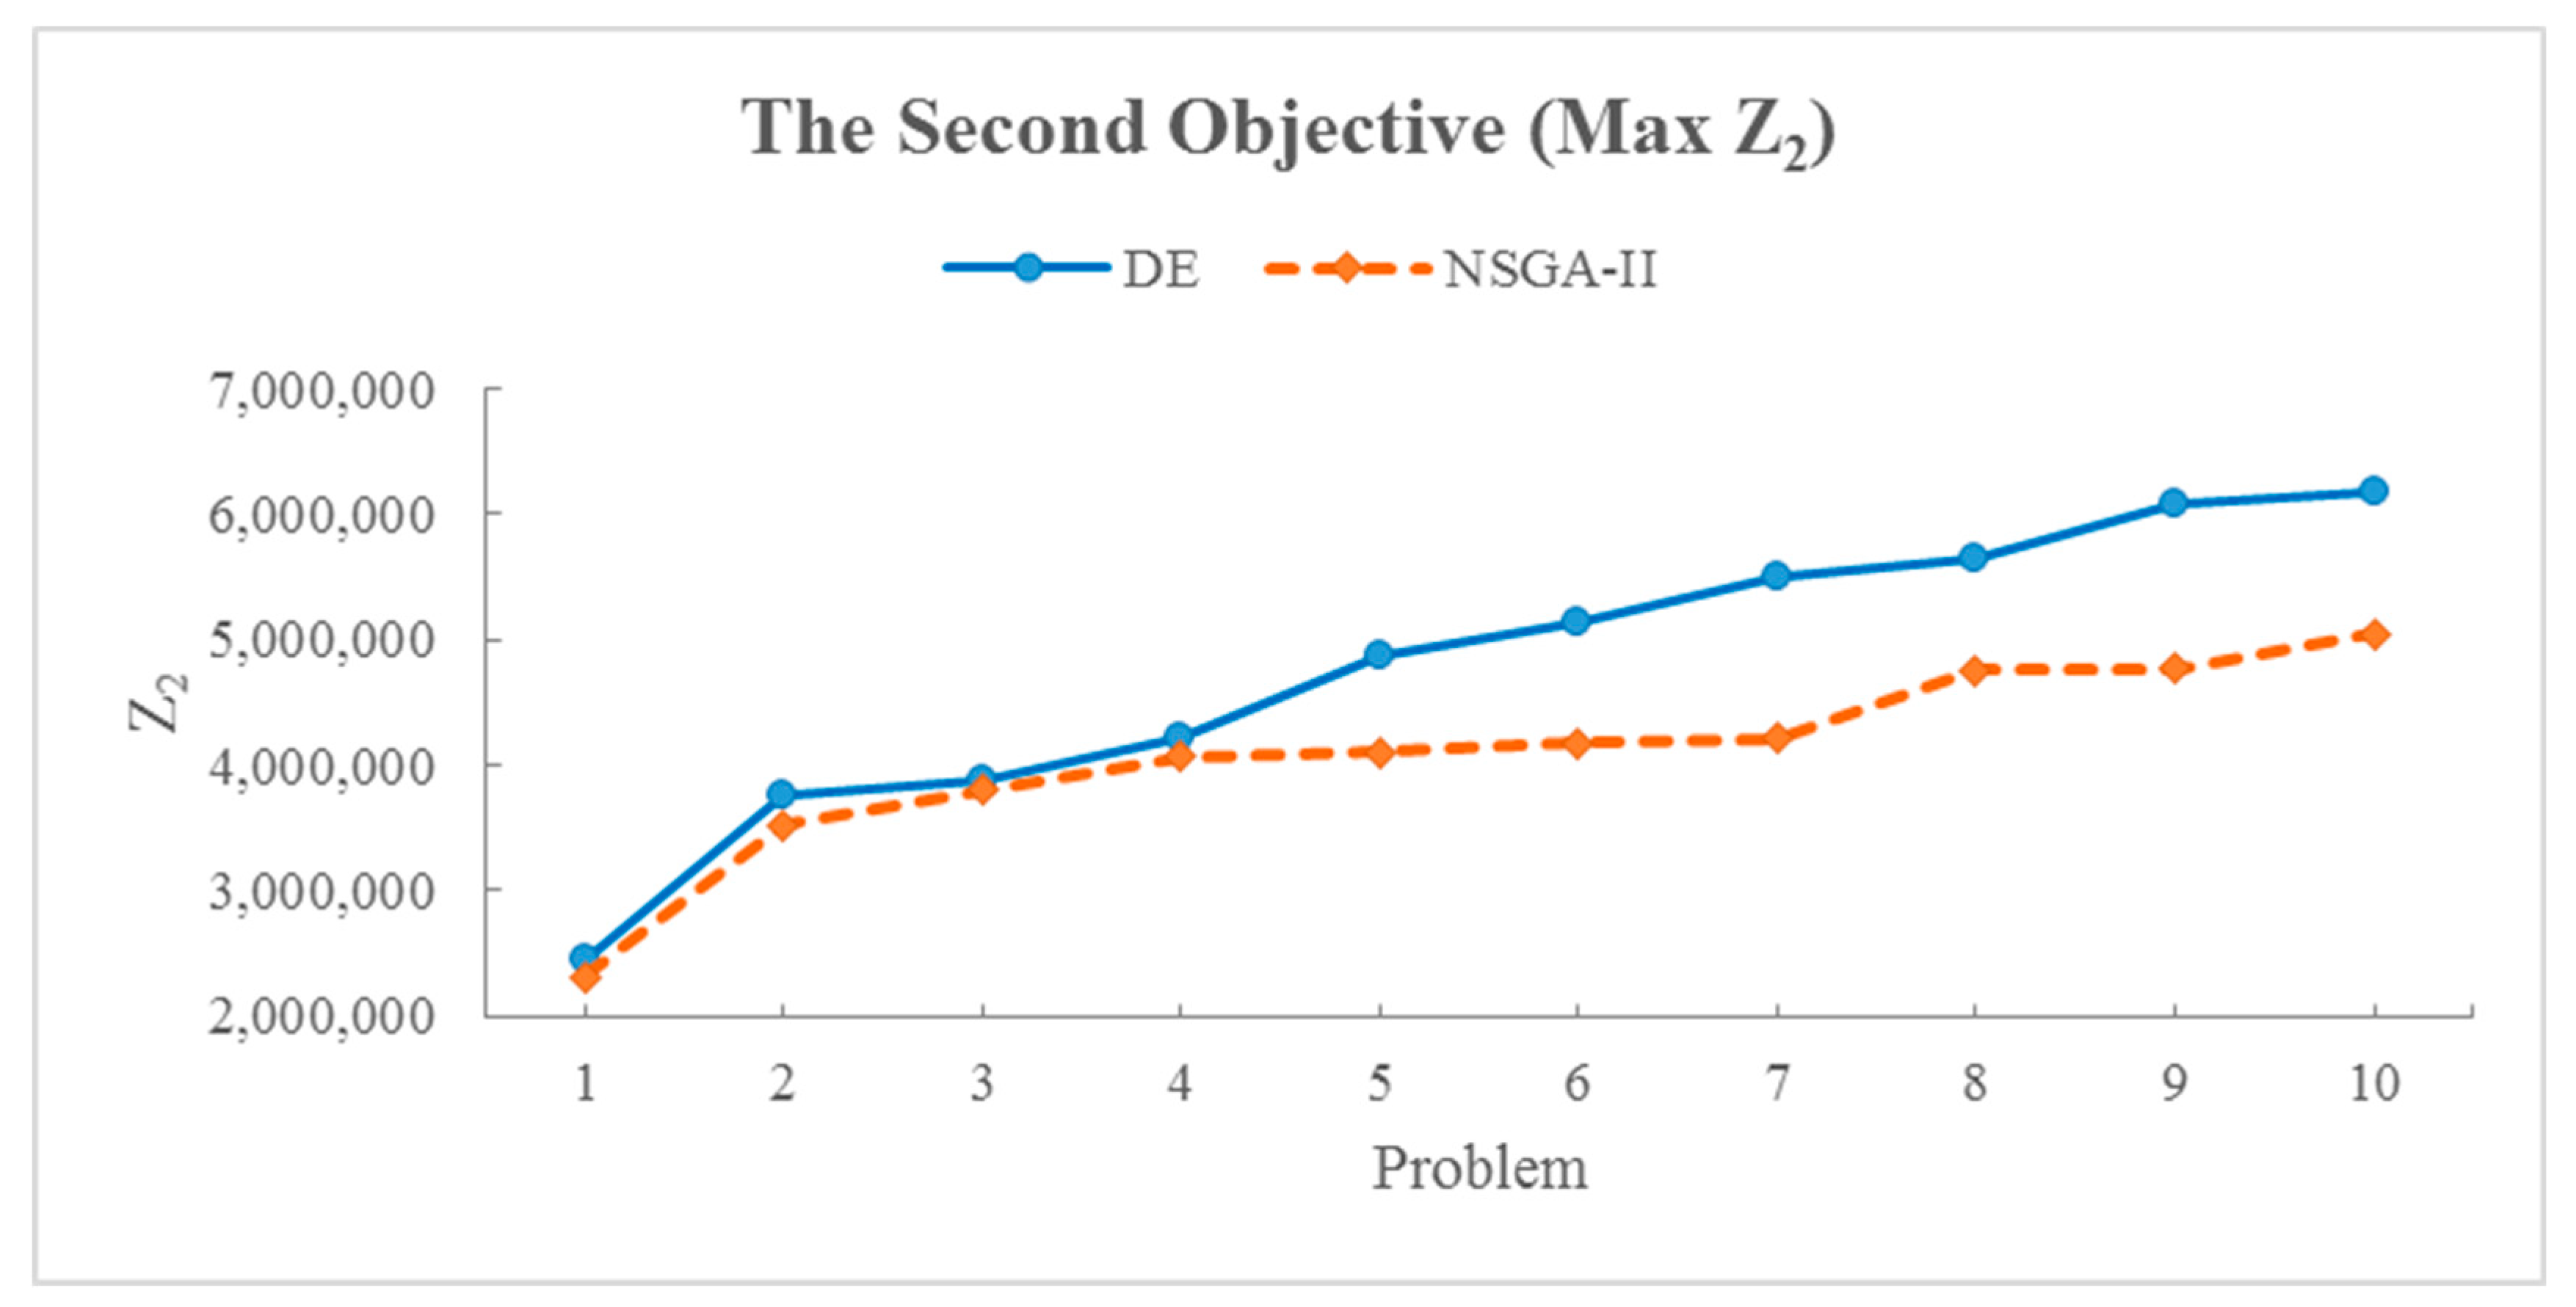
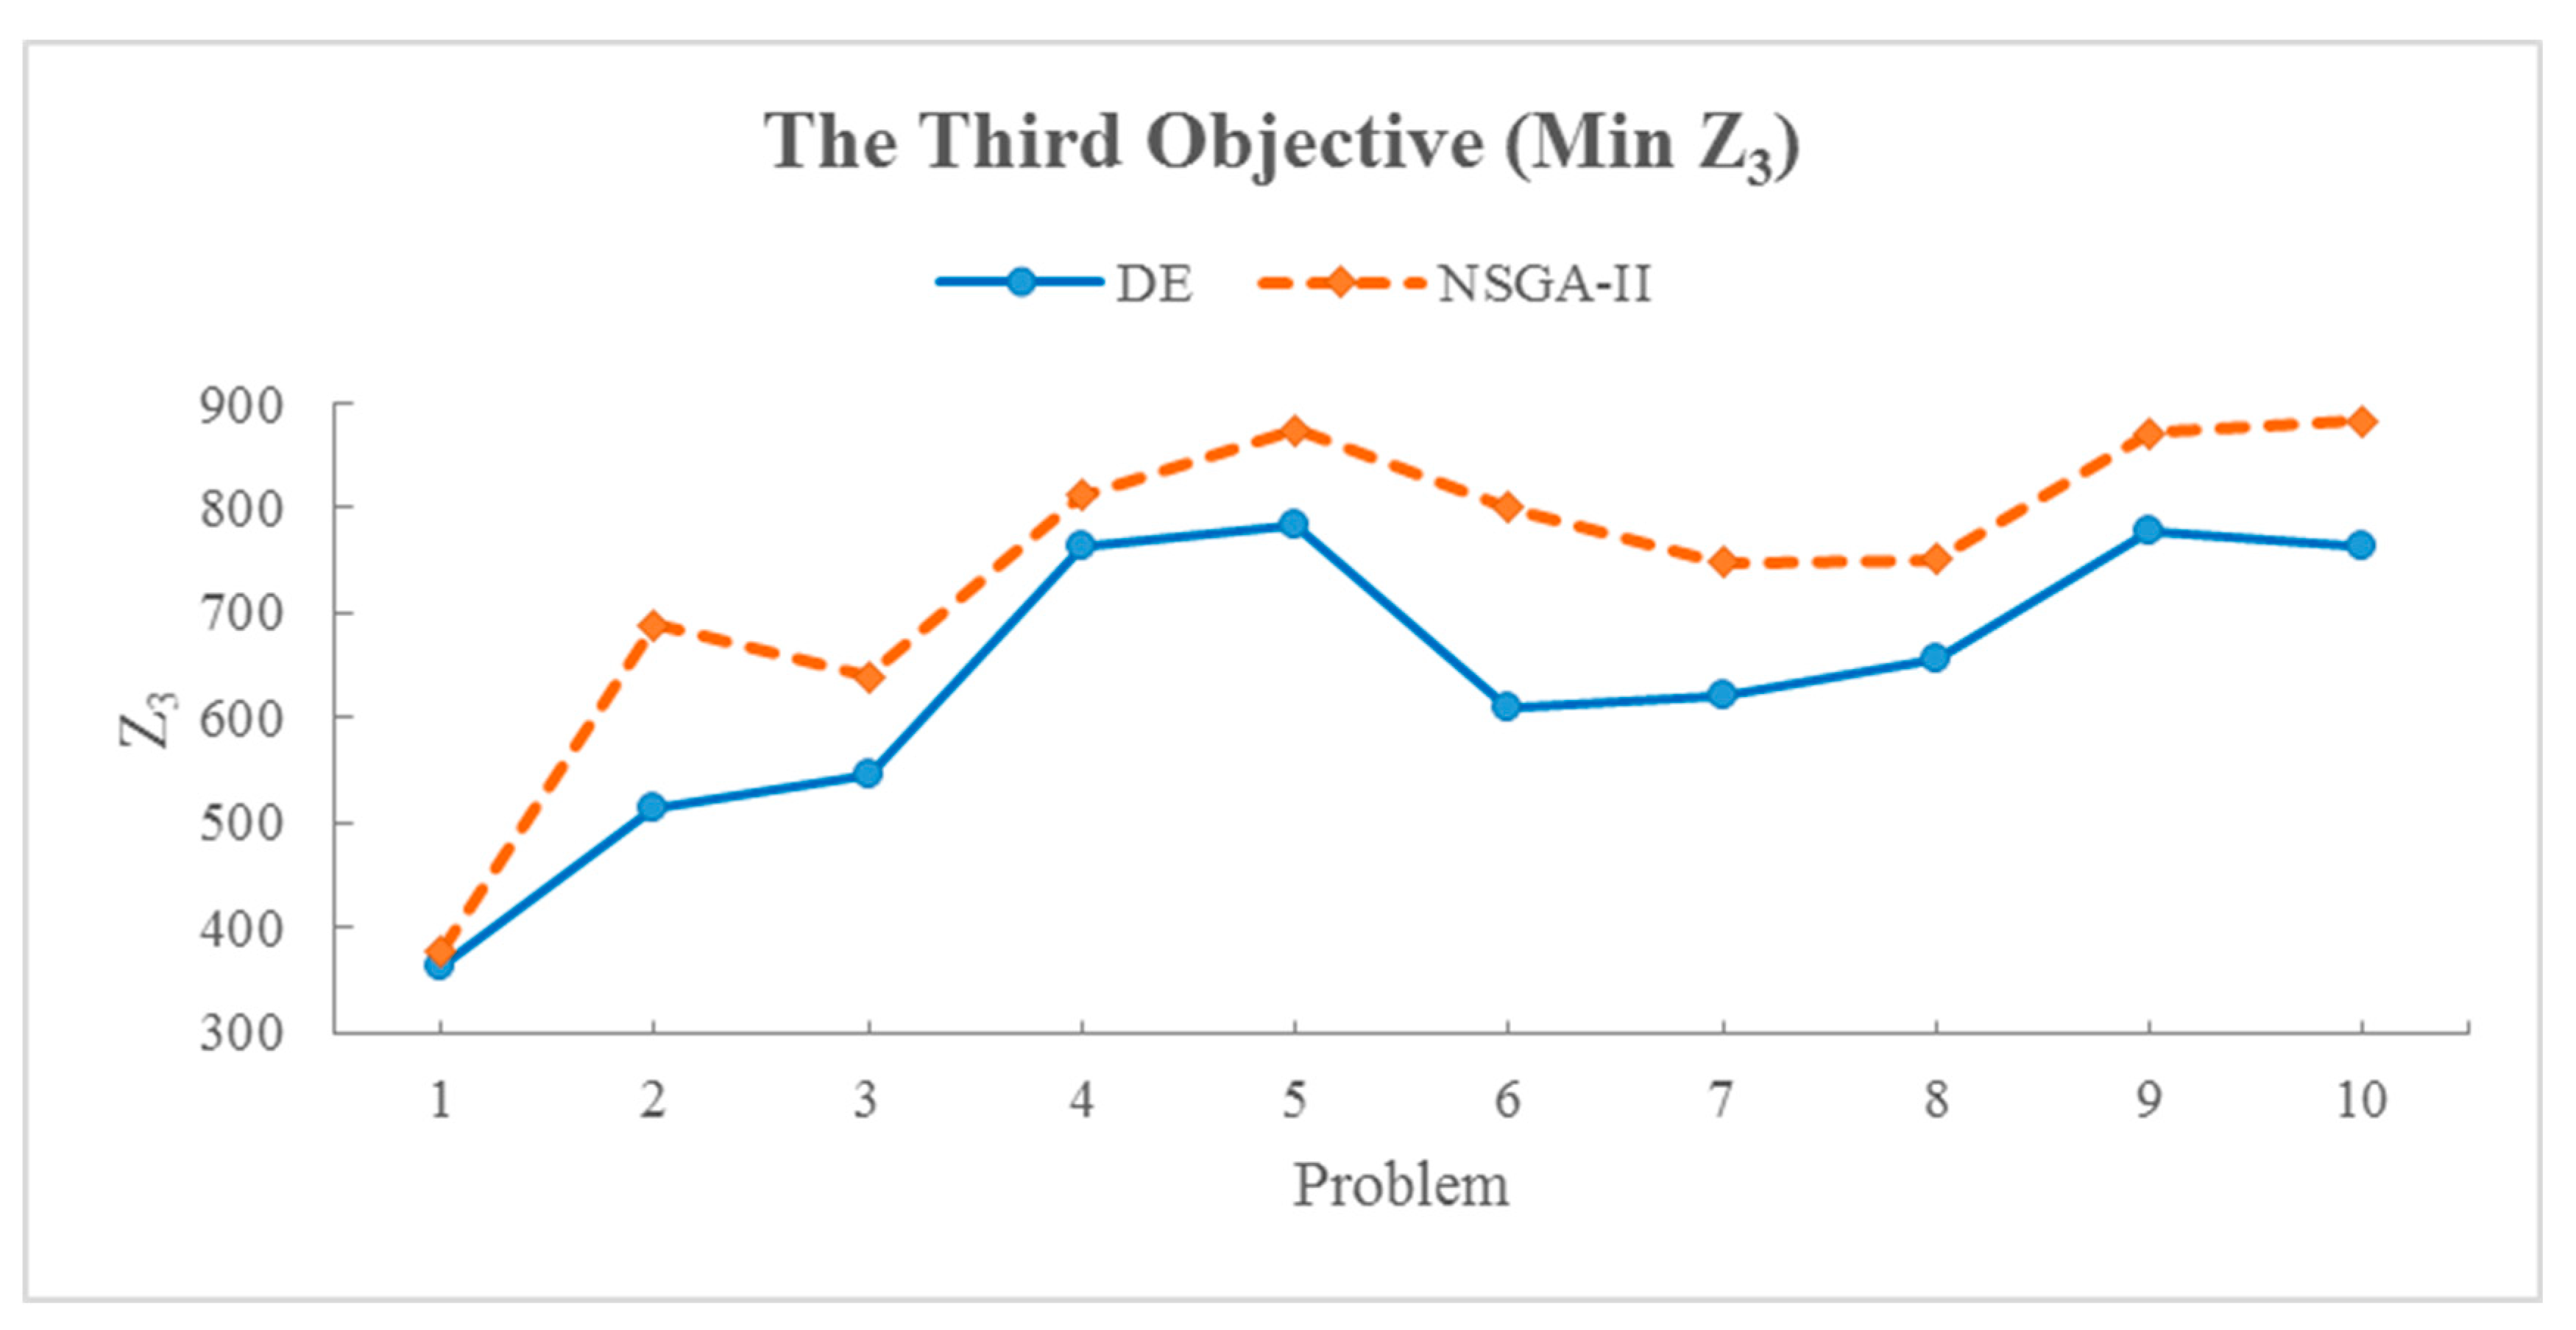
The results of solving the model by algorithms in random sample problems, according to Table 6, show the values of the objective functions of the best solution. As seen in all the cases, the solutions obtained from the multi-objective DE algorithm were better than the solutions obtained from the NSGA-II, which can lead to the desired objective function values. Regarding the mentioned cases and the obtained answers, in the following and Figure 4, Figure 5 and Figure 6, the results have been presented and evaluated in the form of diagrams to obtain an easier discernment of the performance of the solution algorithms and the difference in the current results. It is worth mentioning that according to the explanations of the relations and modeling, the first objective function (Z1) and the second objective function (Z2) were optimal as maximized, and the third objective function (Z3) was optimal as minimized. In this regard, Figure 4, Figure 5 and Figure 6 also indicate the DE algorithm’s more satisfactory performance in the sample problems and the optimal answers obtained from solving the mathematical model of the current research.
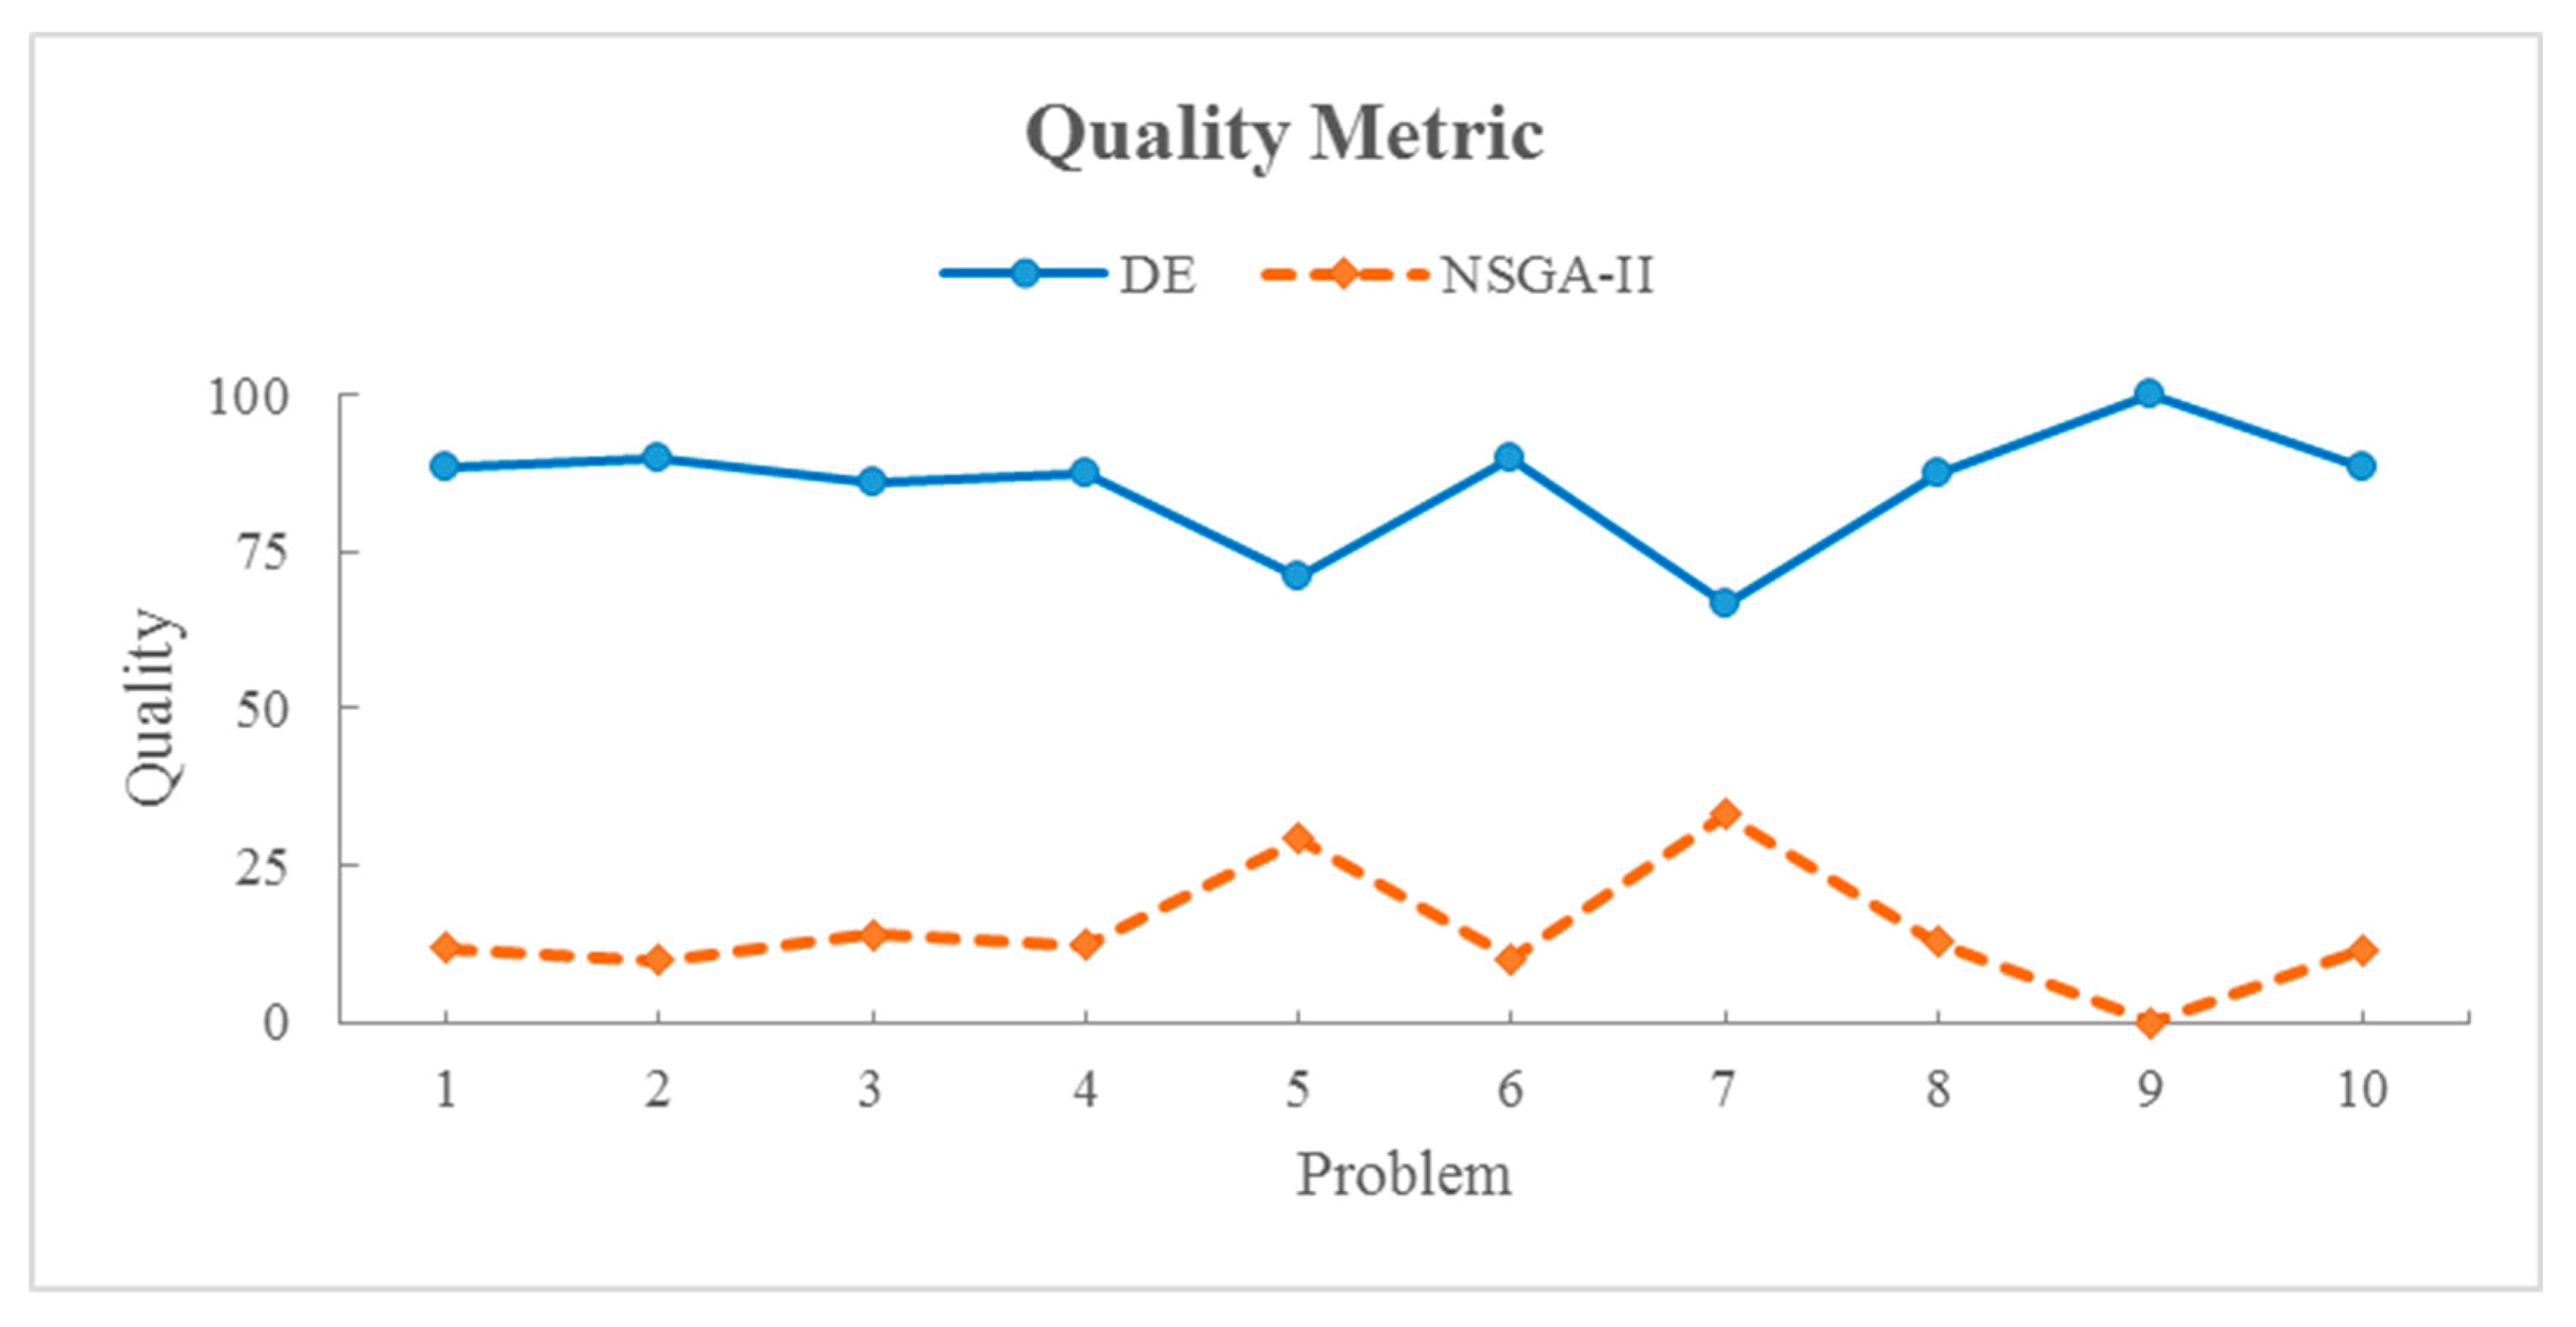
In order to investigate the performance of the algorithms and the results based on the evaluation criteria of the multi-objective problems such as quality, spacing, and diversity metrics, the comparison and evaluation have been made according to Table 7 and the corresponding Figure 7, Figure 8 and Figure 9 for better reviewing the performance of the solution algorithms.
According to Table 7, the investigation results indicate that in all sample problems, the quality and spacing metrics values obtained from the multi-objective DE algorithm were greater and superior to those calculated for the NSGA-II. These results demonstrate the high capability and power of the multi-objective DE algorithm compared to the NSGA-II in reaching an optimal answer, as well as a higher ability to explore and exploit the feasible area of the solution. It is worth noting that the duration of processing and running of the DE algorithm was somewhat longer than the NSGA-II, but there was no significant difference. Also, the obtained values in the field of diversity metric show that the NSGA-II searches the solution area more uniformly than the DE algorithm, and the obtained answers are more uniform. Regarding the mentioned cases, in the following and according to Figure 7, Figure 8 and Figure 9, the relevant graphs are also presented for the purpose of easier examination and a better understanding of the performance of the solution algorithms in the current research based on the evaluation metrics of the multi-objective problems.
As can be seen in Figure 7, Figure 8 and Figure 9, the DE algorithm was superior to the NSGA-II in all metrics of quality, spacing, and diversity, and considering the obtained results, it has a more satisfactory ability to achieve optimal answers in solving the present research model.

6. Conclusions

As explained in the previous sections, in this research, the multi-mode resource-constrained multi-project scheduling problems were addressed, taking into account supply management and a sustainable approach in the construction industry under conditions of uncertainty, using evidence theory for mathematical modeling and solving by multi-objective optimization algorithms. In this respect, a multi-objective mathematical model has been presented, in which the first objective function aims to maximize a weighted selection of projects based on economic, environmental, technical, social, organizational, and competitive factors; the second objective function is focused on maximizing profit, and the third objective function is aimed towards minimizing the risk of supply management. Furthermore, various items such as interest rates, carbon penalties, and other implementation limitations and additional constraints have also been considered in the modeling and mathematical relationships to improve the model’s performance and make it more relevant to real-world conditions and related issues, leading to better practical applications. It should be noted that the processing time of project activities has been considered uncertain in the mathematical modeling, and the evidence theory has been utilized. This method can provide a flexible and rational approach based on evidence and knowledge in the face of uncertainty. This problem was modeled using a belief function based on the chance-constrained programming approach for stochastic mathematical models. In addition, for solving the proposed multi-objective mathematical model, metaheuristic optimization algorithms such as the DE algorithm based on the Pareto archive have been used, and for evaluating the results, the NSGA-II algorithm has also been employed. Moreover, the results have been compared based on multi-objective evaluation criteria, such as quality, spacing, and diversity metrics.
It is worth mentioning that for investigating the performance and application of the proposed model, multiple evaluations have been conducted on sample problems with different dimensions, as well as a case study on residential apartment construction projects by a contracting company. In this regard, the construction projects of residential apartments implemented simultaneously by a contractor company were selected, and the presented model was solved by algorithms based on the information from the multi-project problems. The outcomes indicated that the improvement rates in the DE algorithm’s results compared to the company’s data were 27.8%, 15.3%, and 13.3%, respectively, in the model’s first, second, and third objective functions. Also, the improvement results by the NSGA-II algorithm were 9.0%, 9.7%, and 4.8% in the model’s first, second, and third objective functions. Concerning the mentioned points and evaluating the obtained results, using the mathematical model presented in the current study to schedule the multi-project problems of residential construction projects regarding the aspects of sustainability and supply management is considered beneficial and practical. In addition, several sample problems have been randomly created in different scales to evaluate the performance of the model and algorithms. The DE and NSGA-II algorithms have solved these problems, and the results have been compared and examined with each other and also based on the evaluation metrics of multi-objective problems such as quality, spacing, and diversity metrics. The results demonstrated that the solutions obtained from the multi-objective DE algorithm were better and superior to the NSGA-II algorithm in all cases. There has been this superiority in terms of the quality and spacing metrics values, which has led to more favorable objective function values. Also, the NSGA-II algorithm searches the solution area with more uniformity than the DE algorithm, and the ability of the multi-objective DE algorithm is greater than the NSGA-II algorithm to explore and exploit the feasible solution area to achieve optimal answers and suitable implementation solutions.
Finally, regarding the explanations and the evaluations, it can be generally considered helpful and effective to use the integrated multi-objective mathematical model proposed in the current research in order to manage and schedule multi-mode resource-constrained multi-project problems. Furthermore, in future research in this field, the proposed model and related method can be employed along with using artificial intelligence and other optimization algorithms suitable for implementation problems. Also, considering other items and objectives appropriate for the performance projects can help improve and develop this. The utilization of this model in the construction industry can lead to significant improvements in project management with a sustainable approach, considering various influential and diverse factors, such as economic, environmental, social, technical, organizational, and competitive factors, along with suitable choices based on implementation priorities and evidence, particularly in uncertain conditions; this ultimately achieves the highest profit with the least cost and risk, especially in the management and supply of the project needs, and the progress and completion of projects with the optimal state implemented successfully.

Author Contributions

Conceptualization, M.G., P.G., A.M., A.A.S.J. and S.T.; Methodology, M.G., P.G., A.M., A.A.S.J. and S.T.; Software, M.G. and A.M.; Investigation, M.G. and A.A.S.J.; Resources, M.G., P.G. and S.T.; Writing—original draft, M.G., P.G. and A.M.; Writing—review & editing, M.G., P.G., A.M., A.A.S.J. and S.T.; Supervision, P.G. and A.M.; Project administration, M.G., P.G. and A.M. All authors have read and agreed to the published version of the manuscript.

Funding

This research received no external funding.

Data Availability Statement

The required data and descriptions are provided in the article.

Conflicts of Interest

The authors declare no conflict of interest.

References

  1. Afruzi, E.N.; Aghaie, A.; Najafi, A.A. Robust Optimization for the Resource Constrained Multi-Project Scheduling Problem with Uncertain Activity Durations. Sci. Iran. 2020, 27, 361–376. [Google Scholar] [CrossRef]
  2. Lova, A.; Tormos, P. Analysis of Scheduling Schemes and Heuristic Rules Performance in Resource-Constrained Multiproject Scheduling. Ann. Oper. Res. 2001, 102, 263–286. [Google Scholar] [CrossRef]
  3. Pritsker, A.A.B.; Waiters, L.J.; Wolfe, P.M. Multiproject scheduling with limited resources: A zero-one programming approach. Manag. Sci. 1969, 16, 93–108. [Google Scholar] [CrossRef] [Green Version]
  4. Asadujjaman; Rahman, H.F.; Chakrabortty, R.K.; Ryan, M.J. Resource constrained project scheduling and material ordering problem with discounted cash flows. Comput. Ind. Eng. 2021, 158, 107427. [Google Scholar] [CrossRef]
  5. Qazi, A.; Shamayleh, A.; El-Sayegh, S.; Formaneck, S. Prioritizing risks in sustainable construction projects using a risk matrix-based Monte Carlo Simulation approach. Sustain. Cities Soc. 2020, 65, 102576. [Google Scholar] [CrossRef]
  6. Armenia, S.; Dangelico, R.M.; Nonino, F.; Pompei, A. Sustainable project management: A conceptualization-oriented review and a framework proposal for future studies. Sustainability 2019, 11, 2664. [Google Scholar] [CrossRef] [Green Version]
  7. Habibi, F.; Barzinpour, F.; Sadjadi, S.J. A mathematical model for project scheduling and material ordering problem with sustainability considerations: A case study in Iran. Comput. Ind. Eng. 2019, 128, 690–710. [Google Scholar] [CrossRef]
  8. RezaHoseini, A.; Noori, S.; Ghannadpour, S.F. Integrated scheduling of suppliers and multi-project activities for green construction supply chains under uncertainty. Autom. Constr. 2021, 122, 103485. [Google Scholar] [CrossRef]
  9. Fan, W.; Xiao, F. A New Conflict Management in Evidence Theory Based on DEMATEL Method. J. Sens. 2019, 2019, 7145373. [Google Scholar] [CrossRef] [Green Version]
  10. Le, H.Q. Resource-Constrained Multi-Project Scheduling with Resource Moving Time for Construction Projects in Vietnam. In Proceedings of the First International Conference on Construction in Developing Countries (ICCIDC–I), Karachi, Pakistan, 4–5 August 2008. [Google Scholar]
  11. Tseng, C.C. Two heuristic algorithms for a multi-mode resource-constrained multi-project scheduling problem. J. Sci. Eng. Technol. 2008, 4, 63–74. [Google Scholar]
  12. Browning, T.R.; Yassine, A.A. Resource-constrained multi-project scheduling: Priority rule performance revisited. Int. J. Prod. Econ. 2010, 126, 212–228. [Google Scholar] [CrossRef]
  13. Zhang, L.; Sun, R. An improvement of resource-constrained multi-project scheduling model based on priority-rule based heuristics. In Proceedings of the ICSSSM11, Tianjin, China, 25–27 June 2011; IEEE: Piscataway, NJ, USA, 2011; pp. 1–5. [Google Scholar]
  14. Liu, S.S.; Chen, W.T. Construction multi-project scheduling model considering different resource allocation behavior. In Applied Mechanics and Materials; Trans Tech Publications Ltd.: Bäch, Switzerland, 2012; Volume 174, pp. 2815–2819. [Google Scholar]
  15. Singh, A. Resource Constrained Multi-project Scheduling with Priority Rules & Analytic Hierarchy Process. Procedia Eng. 2014, 69, 725–734. [Google Scholar] [CrossRef]
  16. Suresh, M.; Dutta, P.; Jain, K. Resource constrained multi-project scheduling problem with resource transfer times. Asia-Pac. J. Oper. Res. 2015, 32, 1550048. [Google Scholar] [CrossRef]
  17. El-Abbasy, M.S.; Elazouni, A.; Zayed, T. MOSCOPEA: Multi-objective construction scheduling optimization using elitist non-dominated sorting genetic algorithm. Autom. Constr. 2016, 71, 153–170. [Google Scholar] [CrossRef]
  18. Pinha, D.; Ahluwalia, R.; Senna, P. The Combinatorial Multi-Mode Resource Constrained Multi-Project Scheduling Problem. Int. J. Supply Oper. Manag. 2016, 3, 1391–1412. [Google Scholar] [CrossRef]
  19. Joo, B.J.; Chua, P.C. Multimode resource-constrained multi-project scheduling with ad hoc activity splitting. In Proceedings of the 2017 IEEE International Conference on Industrial Engineering and Engineering Management (IEEM), Singapore, 10–13 December 2017; IEEE: Piscataway, NJ, USA, 2017; pp. 2261–2265. [Google Scholar]
  20. Rostami, M.; Bagherpour, M.; Mazdeh, M.M.; Makui, A. Resource pool location for periodic services in decentralized multi-project scheduling problems. J. Comput. Civ. Eng. 2017, 31, 04017022. [Google Scholar] [CrossRef]
  21. Li, F.; Xu, Z. A multi-agent system for distributed multi-project scheduling with two-stage decomposition. PLoS ONE 2018, 13, e0205445. [Google Scholar] [CrossRef]
  22. Shafahi, A.; Haghani, A. Project selection and scheduling for phase-able projects with interdependencies among phases. Autom. Constr. 2018, 93, 47–62. [Google Scholar] [CrossRef]
  23. Birjandi, A.; Mousavi, S.M. Fuzzy resource-constrained project scheduling with multiple routes: A heuristic solution. Autom. Constr. 2019, 100, 84–102. [Google Scholar] [CrossRef]
  24. García-Nieves, J.D.; Ponz-Tienda, J.L.; Ospina-Alvarado, A.; Bonilla-Palacios, M. Multipurpose linear programming optimization model for repetitive activities scheduling in construction projects. Autom. Constr. 2019, 105, 102799. [Google Scholar] [CrossRef]
  25. Zou, X.; Zhang, L. A constraint programming approach for scheduling repetitive projects with atypical activities considering soft logic. Autom. Constr. 2020, 109, 102990. [Google Scholar] [CrossRef]
  26. Rahman, H.F.; Chakrabortty, R.K.; Ryan, M.J. Memetic algorithm for solving resource constrained project scheduling problems. Autom. Constr. 2019, 111, 103052. [Google Scholar] [CrossRef]
  27. Zhang, Y.; Cui, N. Project scheduling and material ordering problem with storage space constraints. Autom. Constr. 2021, 129, 103796. [Google Scholar] [CrossRef]
  28. El-Alfy, A.E.D. Design of sustainable buildings through Value Engineering. J. Build. Apprais. 2010, 6, 69–79. [Google Scholar] [CrossRef] [Green Version]
  29. Hwang, B.-G.; Leong, L.P.; Huh, Y.-K. Sustainable green construction management: Schedule performance and improvement. Technol. Econ. Dev. Econ. 2014, 19, S43–S57. [Google Scholar] [CrossRef] [Green Version]
  30. Ali, F.; Boks, C.; Bey, N. Design for Sustainability and Project Management Literature—A Review. Procedia CIRP 2016, 48, 28–33. [Google Scholar] [CrossRef] [Green Version]
  31. Mahmoudi, R.; Alinaghian, M.; Mogouie, H. A mathematical model for sustainable probabilistic network design problem with construction scheduling considering social and environmental issues. J. Ind. Syst. Eng. 2017, 10, 17–37. [Google Scholar]
  32. Wang, W.; Chen, J.; Liu, Q.; Guo, Z. Green Project Planning with Realistic Multi-Objective Consideration in Developing Sustainable Port. Sustainability 2018, 10, 2385. [Google Scholar] [CrossRef] [Green Version]
  33. Mahmoudi, R.; Shetab-Boushehri, S.N.; Hejazi, S.R.; Emrouznejad, A.; Rajabi, P. A hybrid egalitarian bar-gaining game-DEA and sustainable network design approach for evaluating, selecting and scheduling urban road construction projects. Transp. Res. Part E: Logist. Transp. Rev. 2019, 130, 161–183. [Google Scholar] [CrossRef]
  34. Khayamim, R.; Shetab-Boushehrib, S.N.; Hosseininasab, S.M.; Karimi, H. A sustainable approach for selecting and timing the urban transportation infrastructure projects in large-scale networks: A case study of Isfahan, Iran. Sustain. Cities Soc. 2020, 53, 101981. [Google Scholar] [CrossRef]
  35. Askarifard, M.; Abbasianjahromi, H.; Sepehri, M.; Zeighami, E. A robust multi-objective optimization model for project scheduling considering risk and sustainable development criteria. Environ. Dev. Sustain. 2021, 23, 11494–11524. [Google Scholar] [CrossRef]
  36. Khandelwal, M.; Marto, A.; Fatemi, S.A.; Ghoroqi, M.; Armaghani, D.J.; Singh, T.N.; Tabrizi, O. Implementing an ANN model optimized by genetic algorithm for estimating cohesion of limestone samples. Eng. Comput. 2018, 34, 307–317. [Google Scholar] [CrossRef]
  37. Shahnazar, A.; Rad, H.N.; Hasanipanah, M.; Tahir, M.M.; Armaghani, D.J.; Ghoroqi, M. A new developed approach for the prediction of ground vibration using a hybrid PSO-optimized ANFIS-based model. Environ. Earth Sci. 2017, 76, 527. [Google Scholar] [CrossRef]
  38. Mojtahedi, S.F.F.; Tabatabaee, S.; Ghoroqi, M.; Soltani Tehrani, M.; Gordan, B.; Ghoroqi, M. A novel probabilistic simulation approach for forecasting the safety factor of slopes: A case study. Eng. Comput. 2019, 35, 637–646. [Google Scholar] [CrossRef]
  39. Aczél, J.; Forte, B.; Ng, C.T. Why the Shannon and Hartley entropies are ‘natural’. Adv. Appl. Probab. 1974, 6, 131–146. [Google Scholar] [CrossRef]
  40. Dubois, D.J. Fuzzy Sets and Systems: Theory and Applications; Academic Press: Cambridge, MA, USA, 1980; Volume 144. [Google Scholar]
  41. Zadeh, L.A. Probability measures of fuzzy events. J. Math. Anal. Appl. 1968, 23, 421–427. [Google Scholar] [CrossRef] [Green Version]
  42. Dubois, D.; Prade, H. Properties of measures of information in evidence and possibility theories. Fuzzy Sets Syst. 1987, 24, 161–182. [Google Scholar] [CrossRef]
  43. Shafer, G. A Mathematical Theory of Evidence; Princeton University Press: Princeton, NJ, USA, 1976; Volume 42. [Google Scholar]
  44. Nguyen, H.T. On entropy of random sets and possibility distributions. Anal. Fuzzy Inf. 1987, 1, 145–156. [Google Scholar]
  45. Klement, E.P. Fuzzy σ-algebras and fuzzy measurable functions. Fuzzy Sets Syst. 1980, 4, 83–93. [Google Scholar] [CrossRef]
  46. Huynh, V.N. Discounting and Combination Scheme in Evidence Theory for Dealing with Conflict in Information Fusion. In Proceedings of the MDAI, Perpignan, Japan, 30 November–2 December 2009; pp. 217–230. [Google Scholar]
  47. Choi, H.; Katake, A.; Choi, S.; Kang, Y.; Choe, Y. Probabilistic combination of multiple evidence. In Proceedings of the Neural Information Processing: 16th International Conference, ICONIP 2009, Bangkok, Thailand, 1–5 December 2009; Proceedings, Part I 16. Springer: Berlin/Heidelberg, Germany, 2009; pp. 302–311. [Google Scholar]
  48. Kay, R.U. Fundamentals of the Dempster-Shafer theory and its applications to system safety and reliability modelling. Reliab. Theory Appl. 2007, 2, 173–185. [Google Scholar]
  49. Challa, S.; Koks, D. Bayesian and Dempster-Shafer fusion. Sadhana 2004, 29, 145–174. [Google Scholar] [CrossRef]
  50. Zhang, D.; Guo, M.; Zhou, J.; Kang, D.; Cao, J. Context reasoning using extended evidence theory in pervasive computing environments. Future Gener. Comput. Syst. 2010, 26, 207–216. [Google Scholar] [CrossRef]
  51. Nassreddine, G.; Abdallah, F.; Denoux, T. State estimation using interval analysis and belief-function theory: Application to dynamic vehicle localization. IEEE Trans. Syst. Man Cybern. Part B (Cybern.) 2009, 40, 1205–1218. [Google Scholar] [CrossRef] [PubMed] [Green Version]
  52. Yager, R.R. Arithmetic and other operations on Dempster-Shafer structures. Int. J. Man-Mach. Stud. 1986, 25, 357–366. [Google Scholar] [CrossRef]
  53. Masri, H.; Abdelaziz, F.B. Belief linear programming. Int. J. Approx. Reason. 2010, 51, 973–983. [Google Scholar] [CrossRef] [Green Version]
  54. Sungur, I.; Ordóñez, F.; Dessouky, M. A robust optimization approach for the capacitated vehicle routing problem with demand uncertainty. IIE Trans. 2008, 40, 509–523. [Google Scholar] [CrossRef]
  55. Storn, R.; Price, K. Differential evolution–A simple and efficient heuristic for global optimization over continuous spaces. J. Glob. Optim. 1997, 11, 341. [Google Scholar] [CrossRef]
  56. Möhring, R.H.; Schäffter, M.W. Scheduling series-parallel orders subject to 0/1-communication delays. Parallel Comput. 1999, 25, 23–40. [Google Scholar] [CrossRef]
  57. Deb, K.; Pratap, A.; Agarwal, S.; Meyarivan, T. A fast and elitist multiobjective genetic algorithm: NSGA-II. IEEE Trans. Evol. Comput. 2002, 6, 182–197. [Google Scholar] [CrossRef] [Green Version]
  58. Tavakkoli-Moghaddam, R.; Azarkish, M.; Sadeghnejad-Barkousaraie, A. A new hybrid multi-objective Pareto archive PSO algorithm for a bi-objective job shop scheduling problem. Expert Syst. Appl. 2011, 38, 10812–10821. [Google Scholar] [CrossRef]
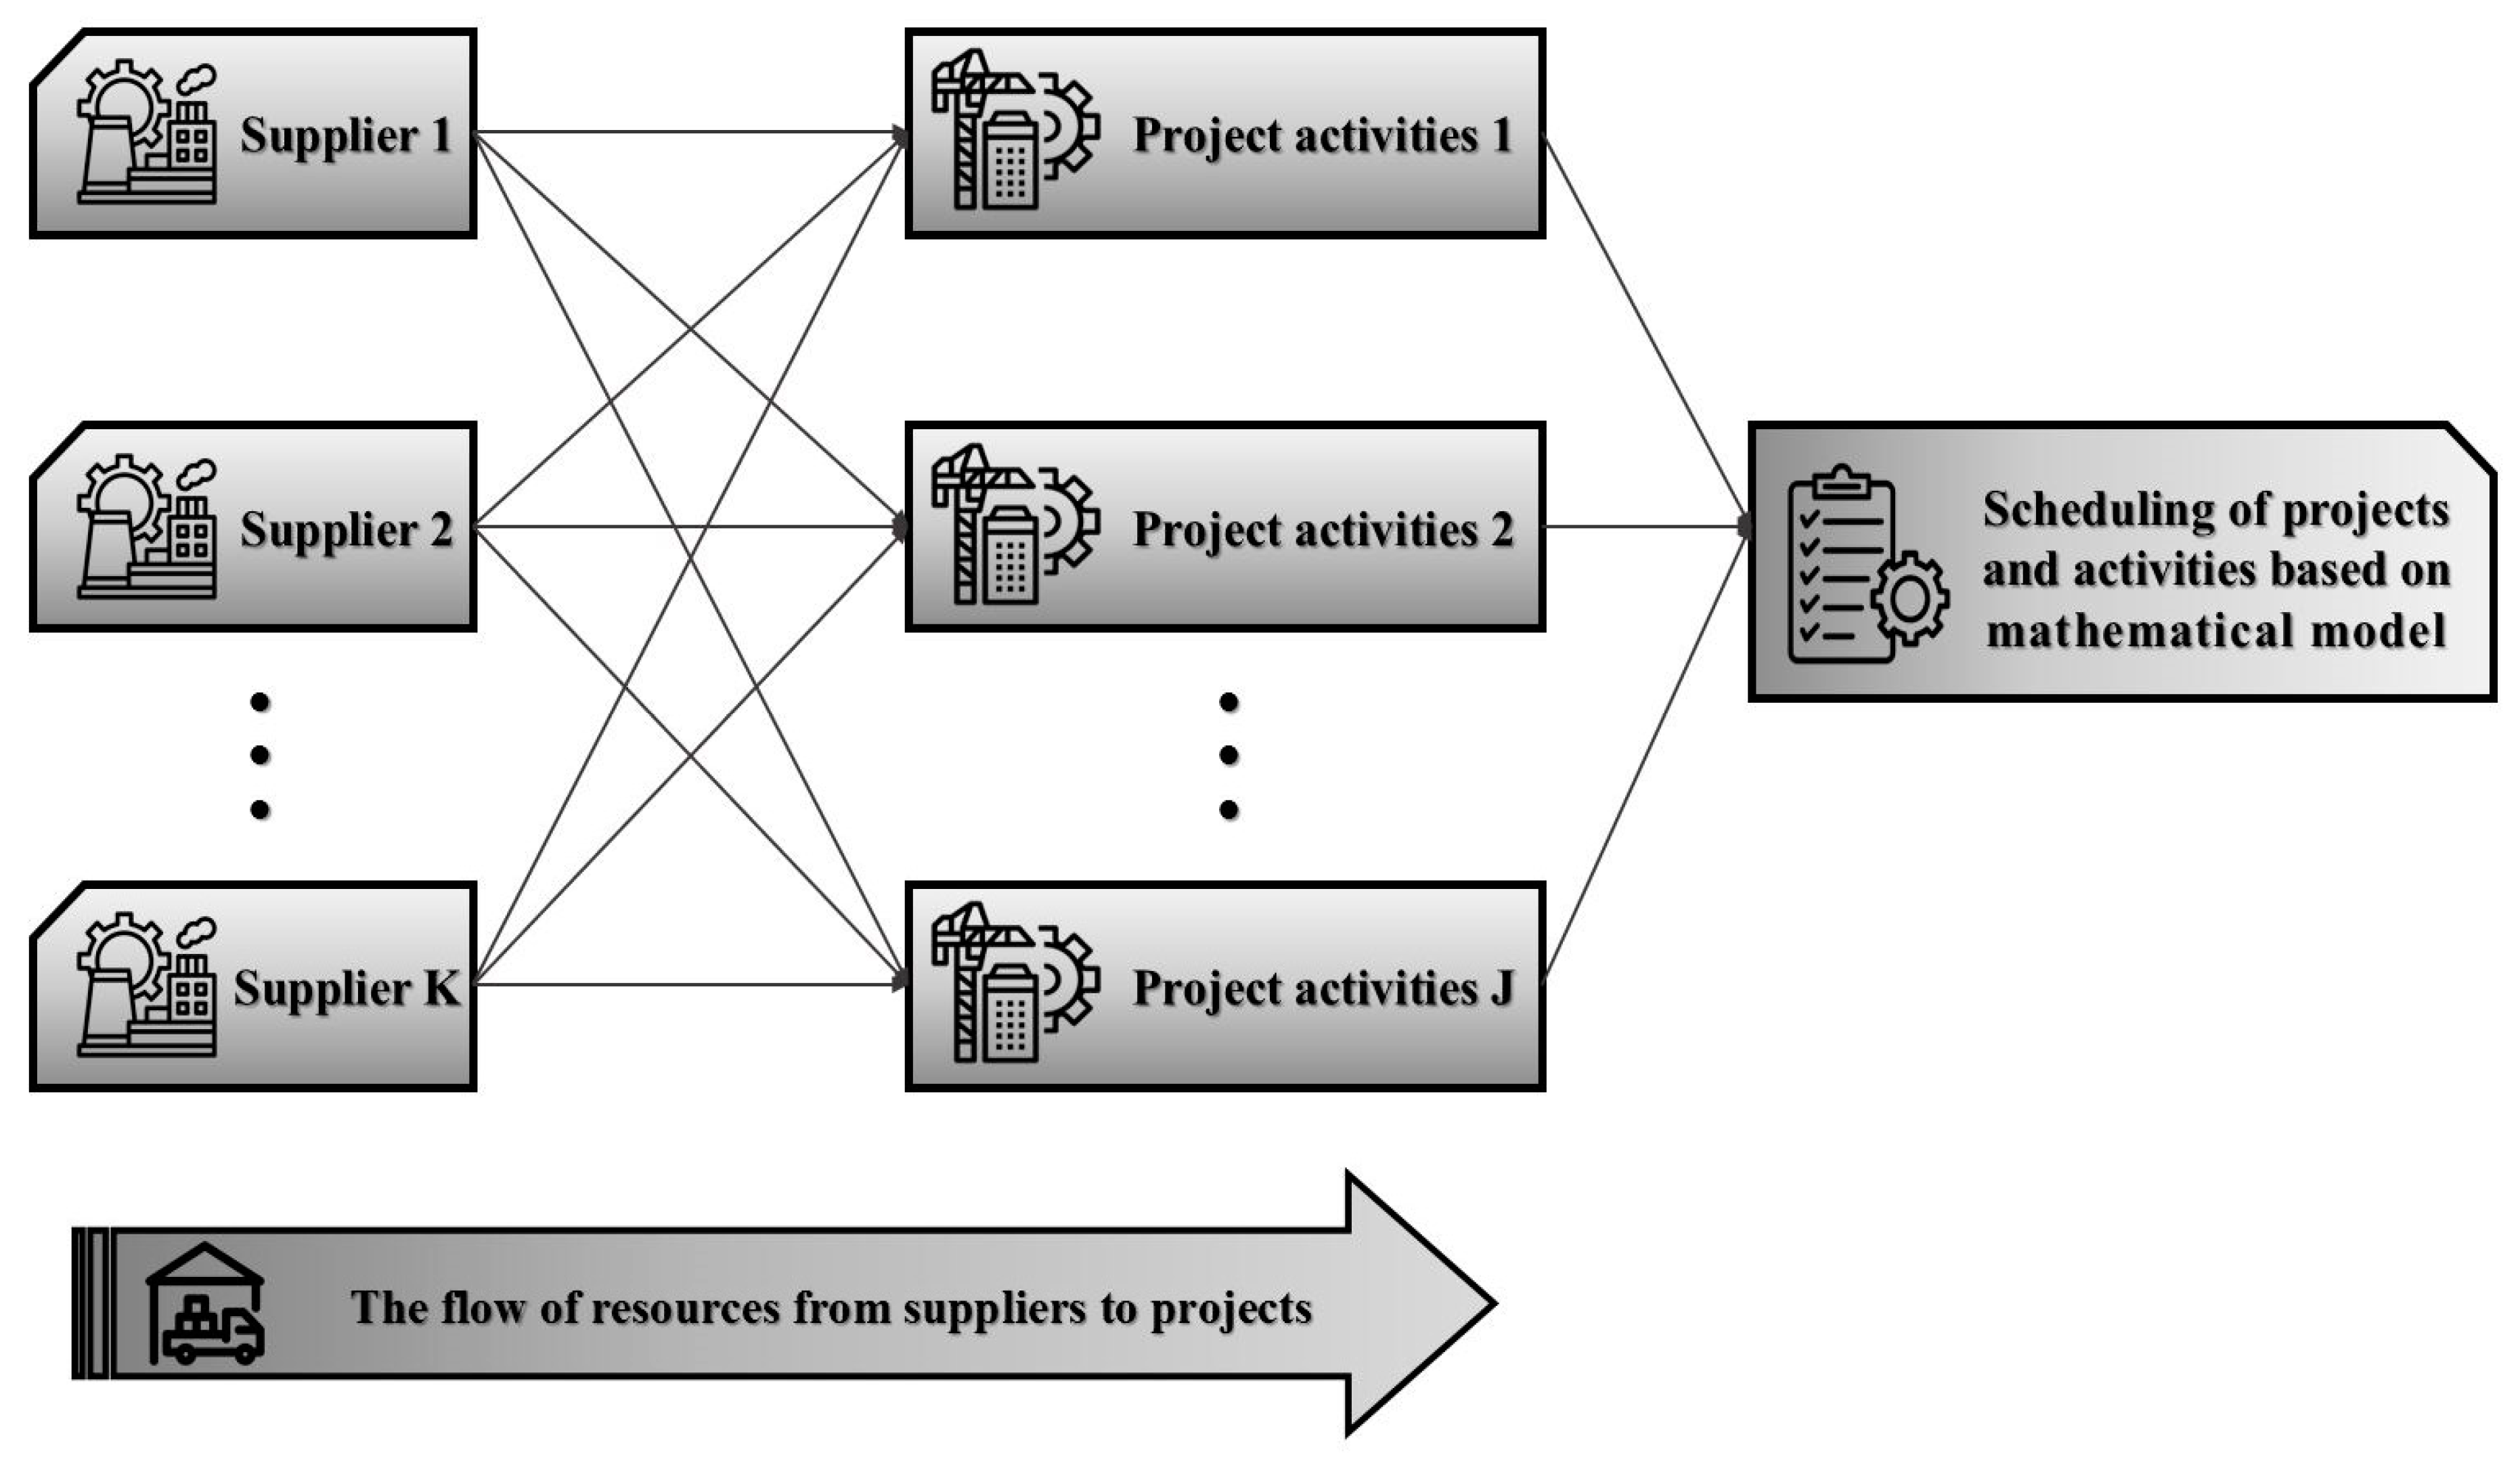
Figure 1. The conceptual model of relations and conditions for suppliers and projects activities in the present research.
Buildings 13 02023 g001
Figure 2. The matrix of the first type for solution structure.
Buildings 13 02023 g002
Figure 3. The matrix of the second type for solution structure.
Buildings 13 02023 g003
Figure 4. The evaluation of the solution algorithms based on the model’s first objective function.
Buildings 13 02023 g004
Figure 5. The evaluation of the solution algorithms based on the model’s second objective function.
Buildings 13 02023 g005
Figure 6. The evaluation of the solution algorithms based on the model’s third objective function.
Buildings 13 02023 g006
Figure 7. The comparison of the solution algorithms based on the quality metric.
Buildings 13 02023 g007
Figure 8. The comparison of the solution algorithms based on the spacing metric.
Buildings 13 02023 g008
Figure 9. The comparison of the solution algorithms based on the diversity metric.
Buildings 13 02023 g009
Table 1. An overview of some previous related studies with the current research.
Works and ReferencesSingle ProjectMulti-ProjectSingle ObjectiveMulti-ObjectiveSupplier and OrderingProject SelectionTransportation TimeRisk FactorCompetition FactorOrganization FactorSustainabilityInterest RateDiscount FactorCarbon PenaltyEvidence Theory
Nabipoor Afruzi et al. [1]
Habibi et al. [7]
RezaHoseini et al. [8]
Le [10]
Tseng [11]
Browning and Yassine [12]
Zhang and Sun [13]
Liu and Chen [14]
Singh [15]
Suresh et al. [16]
El-Abbasy et al. [17]
Pinha et al. [18]
Joo and Chua [19]
Rostami et al. [20]
Li and Xu [21]
Shafahi and Haghani [22]
Birjandi and Mousavi [23]
Garcia-Nieves et al. [24]
Zou and Zhang [25]
Rahman et al. [26]
Zhang and Cui [27]
El-Alfy [28]
Hwang et al. [29]
Ali et al. [30]
Mahmoudi et al. [31]
Wang et al. [32]
Mahmoudi et al. [33]
Khayamim et al. [34]
Askarifard et al. [35]
Current Research
Table 2. Indices of the mathematical model.
SymbolDescription
j Projects
i Project activities
n j Number of activities for the project j
s Suppliers
k Non-renewable resource
l Renewable resource
M Number of available implementation modes (m)
t Time ( t = { 1 , 2 , , T } )
Table 3. Parameters of the mathematical model.
SymbolDescription
A ( j ) = { a 1 j , a 2 j , , a n j j } ,   j J Set of activities for the project j
A = j J A ( j ) Set of all the activities
K ( a i j ) ,   a i j A Set of non-renewable resources required by activity i of the project j
K ( j ) = a i j A K ( a i j ) ,   j J ,   i I Set of non-renewable resources required by the project j
K = a i j A K ( a i j ) Set of all the non-renewable resources
S ( k ) ,   k K Set of suppliers for the non-renewable resource k
S = k K S ( k ) Set of all suppliers for the non-renewable resources
L ( j ) ,   j J Set of renewable resources for the project j
A L ( l ) A ( j ) , l L ( j ) Set of activities in project j that require a renewable resource l
E ( j ) , j J
a i j , a i j A ( j ) ( a i j , a i j ) E ( j )
Set of prerequisite constraints for activities in the project j
(The activity a i j must be completed before the activity a i j .)
b i m k j The required number of the resource k to complete activity i of project j in the implementation mode m
P i j m The processing time of activity i of project j in the implementation mode m
D D j ,   j J The delivery date of project j to complete all activities and examinations
τ s j ,   s S ,   j J The time of transportation from supplier s to project j(In the units of time, such as days)
r s ,   s S The time of release supplier s
Q j k ,   j J ,   k K ( a i j ) ,   a i j A The amount requested from the non-renewable resource k to complete all activities in the project j
C s ,   s S The capacity of the supplier s
R j ,   j J The review duration of the project j
B The total budget for the purchase of non-renewable resources
ω j ,   j J The weight and relative importance of the project j to reach its due date
E S i j   , a i j A The earliest start time of activity i of the project j
L S i j   , a i j A The latest start time of activity i of the project j
E F i j   , a i j A The earliest finish time of activity i of the project j
L F i j   , a i j A The latest finish time of activity i of the project j
C F i j m +   , a i j A ( j ) , m M The incomes dependent on activity i of the project j in mode m
C F i j m   , a i j A ( j ) , m M The expenses dependent on activity i of the project j in mode m
I r The interest rate
( P / F , I r % , t ) The future value of money under discount factor based on interest rate in each period of times
C o s t i j m   ,   a i j A The cost of implementation for activity i of the project j in mode m
H k The cost of holding and maintaining the resource k in the day
E M j The employment score of the project j
L D j The local development score of the project j
L M j The score of complying with the safety principles of the project j
L n v j The score of complying with the environmental preservation of the project j
o r g j The organization score of the project j
c o m j The competitive score of the project j
E N V s j The amount of emission of polluting gases resulting from the production and transportation of materials by supplier s for the project j
PMAX Maximum permissible pollution for suppliers(The government and rules determine it.)
ρ The amount of tax discount (ρ ≤ 0, which means if the required conditions be as j E N V s j P M A X , a tax discount will be received amount of ρ ( j E N V s j P M A X ) monetary units.)
v a r d s j The amount of risk of delay in the delivery of materials by the supplier s for the project j
v a r q s j The amount of risk of defective, low quality, and non-green materials and equipment by the supplier s for the project j
v a r n d s The amount of risk caused by natural disasters for the supplier s
v a r c f s The amount of liquidity and financial risk for the supplier s
Table 4. Variables of the mathematical model.
Symbol and Description
z p j       1                                                                                                                                                                                                 If   project   j   is   selected . 0                                                                                                                                                                                                                                                 Otherwise     ,   j J
z j j       1                                                                           If   project   j   is   examined   immediately   before   project   j .   ( Project   0   is   a   dummy   project . ) 0                                                                                                                                                                                                                                                     Otherwise     , j 0 J ,   j J , j j
x s j         1                                                                                                                                                             If   supplier   s   serves   to   project   j .   0                                                                                                                                                                                                                                                   Otherwise     , s S k ,   k K j , j J
X i j t     1                                                                                                                                   If   activity   i   of   project   j   starts   at   time   t . 0                                                                                                                                                                                                                                                     Otherwise ,   a i j A L l ,   l L j , j J
U i j m 1                                                                                                                     If   activity   i   of   project   j   is   performed   in   mode   m . 0                                                                                                                                                                                                                                                                       Otherwise       ,   a i j A L l ,   l L j , j J
Y i j k s m t 1                           If   resource   k   is   ordered   from   supplier   s   for   activity   i   of   project   j   in   mode   m   for   period   t . 0                                                                                                                                                                                                                                                                                                                                         Otherwise  
y i i j       1                                 If   the   activity   a i j   is   scheduled   before   the   activity   a i j .   0                                                                                                                                                                                                   Otherwise     , a i j , a i j A L l , a i j a i j ,   l L j , j J
S T i j ,         a i j A : The start time of activity i of the project j
c i j : The completion time of activity i of the project j
C T j : The completion time of the project j
q s j ,   s S ,   j J : The amount of transportation from supplier s to project j
D T j   ,   j 0 : The due time for examination of project j (DT0 indicates the earliest examination start time)
T D j   ,   j J : The delay of project j
I k t : The inventory level of resource k in the period t
a i j A t = E S i j L S i j m = 1 M C F i j m + U i j m X i j t P / F , I r % , t : The time value of income from the implementation of the activity
a i j A t = E S i j L S i j m = 1 M C F i j m U i j m X i j t P / F , I r % , t : The time value of cost from the implementation of the activity
a i j A t = E S i j L S i j m = 1 M C o s t i j m U i j m X i j t ( P / F , I r % , t ) : The time value for the implementation of activity in mode m
k K j = 1 J i = 1 n j t = 1 max L S i j + P i j m 1 H k I k t P / F , I r % , t : The time value of cost for maintenance of resources
j J ω j   T D j : The penalty for delay in projects
Table 5. Analyzing the results of solving the problem of residential construction projects.
ObjectivesCompanyDENSGA-IIImprovement by
DE
Improvement by NSGA-II
The first objective function2.873.673.1327.8%9.0%
The second objective function461,507532,191506,48915.3%9.7%
The third objective function409.5354.8389.713.3%4.8%
Table 6. The results of solving the model by algorithms in random sample problems.
No.Problem
J/I/S/L/K
Multi-Objective Optimization Algorithms
DENSGA-II
Z1Z2Z3Z1Z2Z3
110/10/3/3/36.62,461,507.1361.85.02,311,212.9378.2
210/10/5/3/36.73,751,235.1515.15.63,526,973.8687.9
315/10/3/3/38.13,866,516.7547.17.53,796,087.3638.5
415/10/5/3/39.74,210,047.2763.48.94,059,576.1811.6
520/10/5/3/316.94,865,074.1782.215.34,107,462.6874.3
620/10/10/3/315.25,135,227.1610.414.64,179,287.8800.3
725/10/5/3/315.45,500,734.3622.313.54,216,197.8748.2
825/10/10/3/316.85,642,828.7654.714.94,757,346.1751.3
930/10/5/3/317.76,082,742.3777.516.24,764,090.6870.7
1030/10/10/3/316.96,175,004.6762.715.15,038,724.2882.3
Table 7. The investigation of the solution algorithms’ performance based on the multi-objective evaluation criteria.
No.Problem
J/I/S/L/K
Multi-Objective Optimization Algorithms
DENSGA-II
Quality
Metric
Spacing
Metric
Diversity MetricQuality
Metric
Spacing
Metric
Diversity Metric
110/10/3/3/388.11.011930.211.90.791218.4
210/10/5/3/390.00.752871.610.00.631901.6
315/10/3/3/385.91.022685.314.10.811954.2
415/10/5/3/387.61.103063.512.40.852112.5
520/10/5/3/370.90.932636.329.10.771901.9
620/10/10/3/389.90.892816.510.10.612265.1
725/10/5/3/366.81.213486.333.20.842793.6
825/10/10/3/387.21.024121.912.80.803278.6
930/10/5/3/31001.114565.900.793397.7
1030/10/10/3/388.41.205054.111.60.864758.7
Disclaimer/Publisher’s Note: The statements, opinions and data contained in all publications are solely those of the individual author(s) and contributor(s) and not of MDPI and/or the editor(s). MDPI and/or the editor(s) disclaim responsibility for any injury to people or property resulting from any ideas, methods, instructions or products referred to in the content.