Article

An Experimental Approach to Assess the Sensitivity of a Smart Concrete

Laboratoire Matériaux et Durabilité des Constructions (LMDC), Université de Toulouse, INSA, UPS Génie Civil, 135 Avenue de Rangueil, 31077 Toulouse, CEDEX 04, France
*
Author to whom correspondence should be addressed.
Buildings 2023, 13(8), 2034; https://doi.org/10.3390/buildings13082034
Submission received: 26 July 2023 / Revised: 6 August 2023 / Accepted: 8 August 2023 / Published: 9 August 2023
(This article belongs to the Section Building Materials, and Repair & Renovation)

Abstract

:
Structural health monitoring of concrete infrastructure is a critical concern for timely repair and maintenance. This study provides an innovative approach utilizing smart concrete integrated with multi-walled carbon nanotubes (MWCNTs) to enhance electrical conductivity. The smart concrete’s self-sensing capability is assessed through fractional change in electrical resistance (FCR) measured using a four-probe technique. Four-point bending and compressive tests explore the material’s response to cyclic and monotonic loads. Additionally, the impact of saturation levels on self-sensing sensitivity is investigated through compressive tests on varying saturation degrees. Remarkably, a substantial correlation between crack mouth opening displacement (CMOD) and FCR is observed during cyclic bending tests, where FCR increases significantly (from 0.019% to 154%) as CMOD rises from 0.004 mm to 0.55 mm. Digital image correlation (DIC) further validates CMOD measurements and their correlation with FCR. Moreover, this study reveals that amplitude of loading and degree of saturation have a significant effect on the self-sensing of the smart concrete. In saturated conditions, the self-sensing response of the material is insensitive to the mechanical strain, while with reduction in the saturation degree, a quasi-linear response is observed. To assess the sensitivity of the smart concrete, stress and strain sensitivities were evaluated, revealing a noteworthy enhancement of approximately 33% and 50% in stress and strain sensitivity, respectively, as saturation levels decreased. The self-sensing response of the material is very sensitive to the mechanical strain during monotonic loading and damage. These findings indicate the potential of smart concrete as a promising tool for comprehensive, real-time structural health monitoring for infrastructure during its entire life.

1. Introduction

Concrete is a mix of heterogeneous materials ranging from microns (cementitious materials) to millimeters (sand and gravel). Generally, sand and gravel are inert materials held together by the binder. However, the inherent heterogeneity of concrete raises concerns about its long-term structural performance. Different types of loading, such as thermal pressures, earthquakes [1], fire [2], or applied charges to the structures [3], can cause concrete damage [4]. Moreover, damage can also be due to the alkali–silica reaction (ASR), corrosion, calcium leaching, and physical and chemical damage such as carbonation, sulphate, and chloride attack [5]. Therefore, monitoring and assessment of the damage in concrete structures is one of the most prominent emerging research areas today, and is referred to as structural health monitoring (SHM). This provides a system of detection and diagnosis of damage for aerospace, civil, and mechanical infrastructure. The quality assessment of civil infrastructure can be carried out using destructive (DT) and non-destructive (NDT) techniques. The assessment through DT can be carried out through laboratory investigation of the integral part of the structure, for which the extraction and preparation of the specimens is required for lab test. These techniques are time consuming, costly, and provide analysis on the damage after laboratory investigation. However, NDT evaluations such as acoustic emission techniques (AET), ultrasonic inspections, modal analysis, finite element methods, and rebound hammer tests are faster, reliable, and economical approaches to assess the damage even without extracting the sample for investigation. However, neither the DT nor NDT mentioned above provide the time scale monitoring of the structure to analyze the damage.
Over the past few decades, non-destructive techniques (NDT) have been frequently used to monitor the various properties of concrete structure through indirect assessment. NDT methods for evaluation of the concrete structures have been classified by various researchers, such as the acoustic emission technique (AET) for the assessment of cracking and characterization of concrete [6], and optical fiber (OF) for strain/stress measurement and crack detection, as well as the curing process [7,8,9]. In recent years, concrete degradation has also been tracked by measuring the change in concrete’s electrical resistance in response to applied loads [10,11,12,13,14].
Plain concrete exhibits substantial electrical resistance due to poor conductivity [11,15]. The pore water and permeability of concrete have a significant impact on the ionic conduction, which is noticeable in plain concrete. Therefore, the degree of saturation is crucial because as the saturation decreases, the concrete’s electrical resistance increases. According to Sun et al. [16], the variation in electrical resistivity of concrete is mainly due to the movement of ions by the pore water available. Hence, use of plain concrete to monitor damage using a self-sensing response by measuring the variation in the electrical resistivity under the application of mechanical loading is limited.
While developing smart concrete, conductive components like carbon fibers, steel fibers, carbon nanotubes, slag, or carbon black must be employed. The resistivity of the concrete is significantly reduced and has less reliance on the saturation level with the addition of any of the conductive materials mentioned above. Since the discovery of CNTs by Iijima in 1995 [17], they have been used in various composites due to their exceptional properties, such as high electrical conductivity, strength, high young’s modulus, and low density [18,19,20,21,22,23]. Due to the properties mentioned above, CNTs have been successfully used in the recent past to prepare smart concrete.
Ferdinasyah et al. [24] studied the damage to plain concrete under three-point bending cyclic loading by measuring the variation in its electrical properties using a Wheatstone bridge circuit. They found that damage to the plain concrete can be monitored based on electrical measurement. However, the location of the electrode is an important issue in order to achieve better sensitivity to the damage, as by changing the location of electrode, variation in the sensing signal is also observed. This might be due to the formation of a current path or variation in the electrical resistivity of the plain concrete. For each tested specimen, having different degree of saturation ultimately affects the electrical resistance of the material.
Self-sensing cementitious composites integrating mono carbon nanofibers (CNF) and hybrid CNF/carbon fibers (CF) were designed by Wang et al. [25] The piezoresistive response of self-sensing cementitious composites was observed by applying cyclic compressive stress within the elastic limits. They found that cementitious composites without the addition of conductive materials show the self-sensing response under compressive stress because of the ionic conduction within the control mix. However, the sensitivity of control mix is very low due to the high resistivity of the material. A higher concentration of mono CNFs increases the sensitivity of the response (50% of FCR). However, the use of hybrid CNF/CF not only improves the sensitivity of the self-sensing cementitious composites with the maximum FCR value of around 80%, but it also improves the repeatability and linearity of the piezoresistive response.
Bu et al. [26] analyzed the crack propagation in concrete beams using a DIC method. They conducted fracture experiments on the pre-cracked/notched concrete beam at various loading rates, and crack opening displacement (COD) and fracture process zone (FPZ) were observed through field displacement obtained by the DIC method. They found the DIC method relevant in the damage assessment and deformation measurement of concrete material by comparing the results obtained with traditional clip-on extensometer.
Additionally, various researchers are working to develop smart approaches for the assessment of damage in concrete structures. Li et al. [27] studied the performance of smart concrete to assess the damage in the beam elements. They found that smart concrete should be applied in the tension zone to economize the material as the damage initiates from the bottom of the beam. Furthermore, the dynamic behavior of structural beams prepared with innovative smart concrete material was studied by Birgin et al. [28] They studied the impact of smart concrete under dynamic loading by preparing the concrete beams in bulk form and embedding the smart concrete sensor in ordinary concrete beams. A promising result for monitoring the health of the structure under dynamic loading was observed during this study.
In this context, this study presents a novel approach to damage characterization in concrete based on FCR measurements. The method offers an alternative, cost-effective means of evaluating damage, complementing existing tools such as AET and optical fibers. The comprehensive investigation focuses on smart concrete subjected to cyclic four-point bending tests, utilizing NDT techniques like DIC and self-sensing response measurements. Additionally, the impact of moisture variation on the self-sensing response in the studied smart concrete was explored.

2. Materials and Methods

2.1. Materials and Mix Design

Concrete specimens were prepared using the mix proportions as shown in Table 1. Ordinary Portland cement (CEM I 52.5R) conforming to EN 197-1:2011 [29], natural sand (0–4 mm), and coarse aggregate (4–10 mm) were used with a water to cement (w/c) ratio of 0.45. Master Glenium 27, a modified polycarboxylic ether polymer-based superplasticizer was also used to control the workability of the fresh concrete. Multi-walled carbon nanotubes (MWCNTs), which were provided by Nanocyl Sambreville, Belgium, were used as a conductive material to create the smart concrete at a rate of 0.75 percent (relative to the mass of cement). The previous article [23] provides information on the characteristics of MWCNTs.

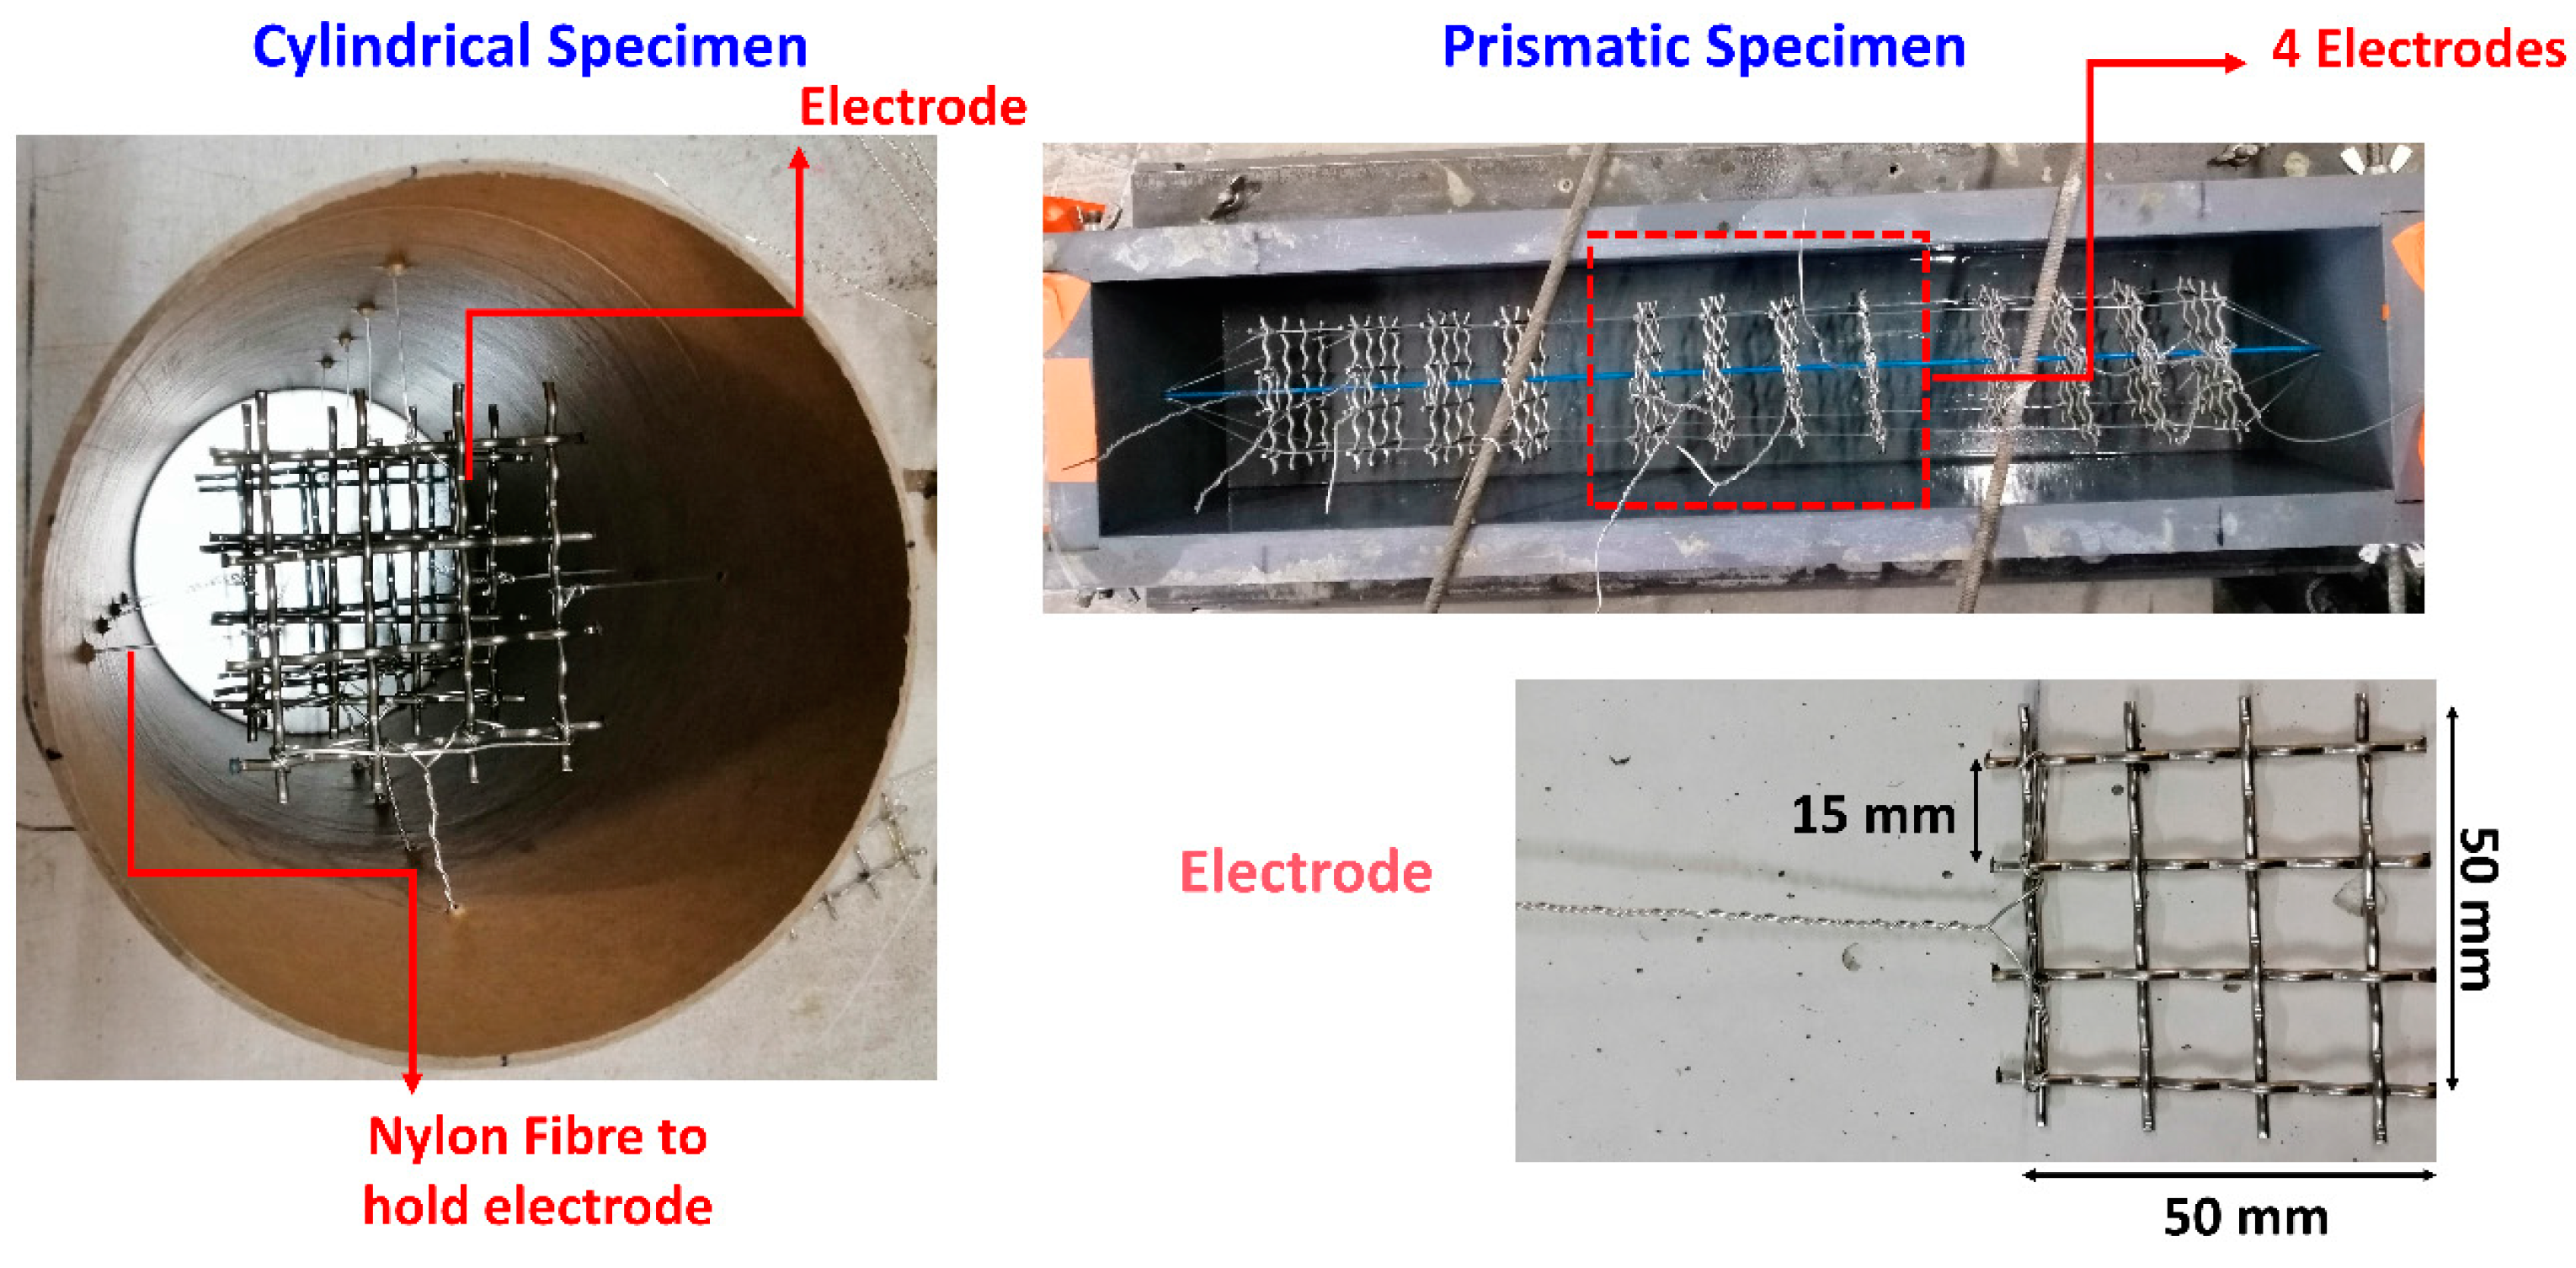
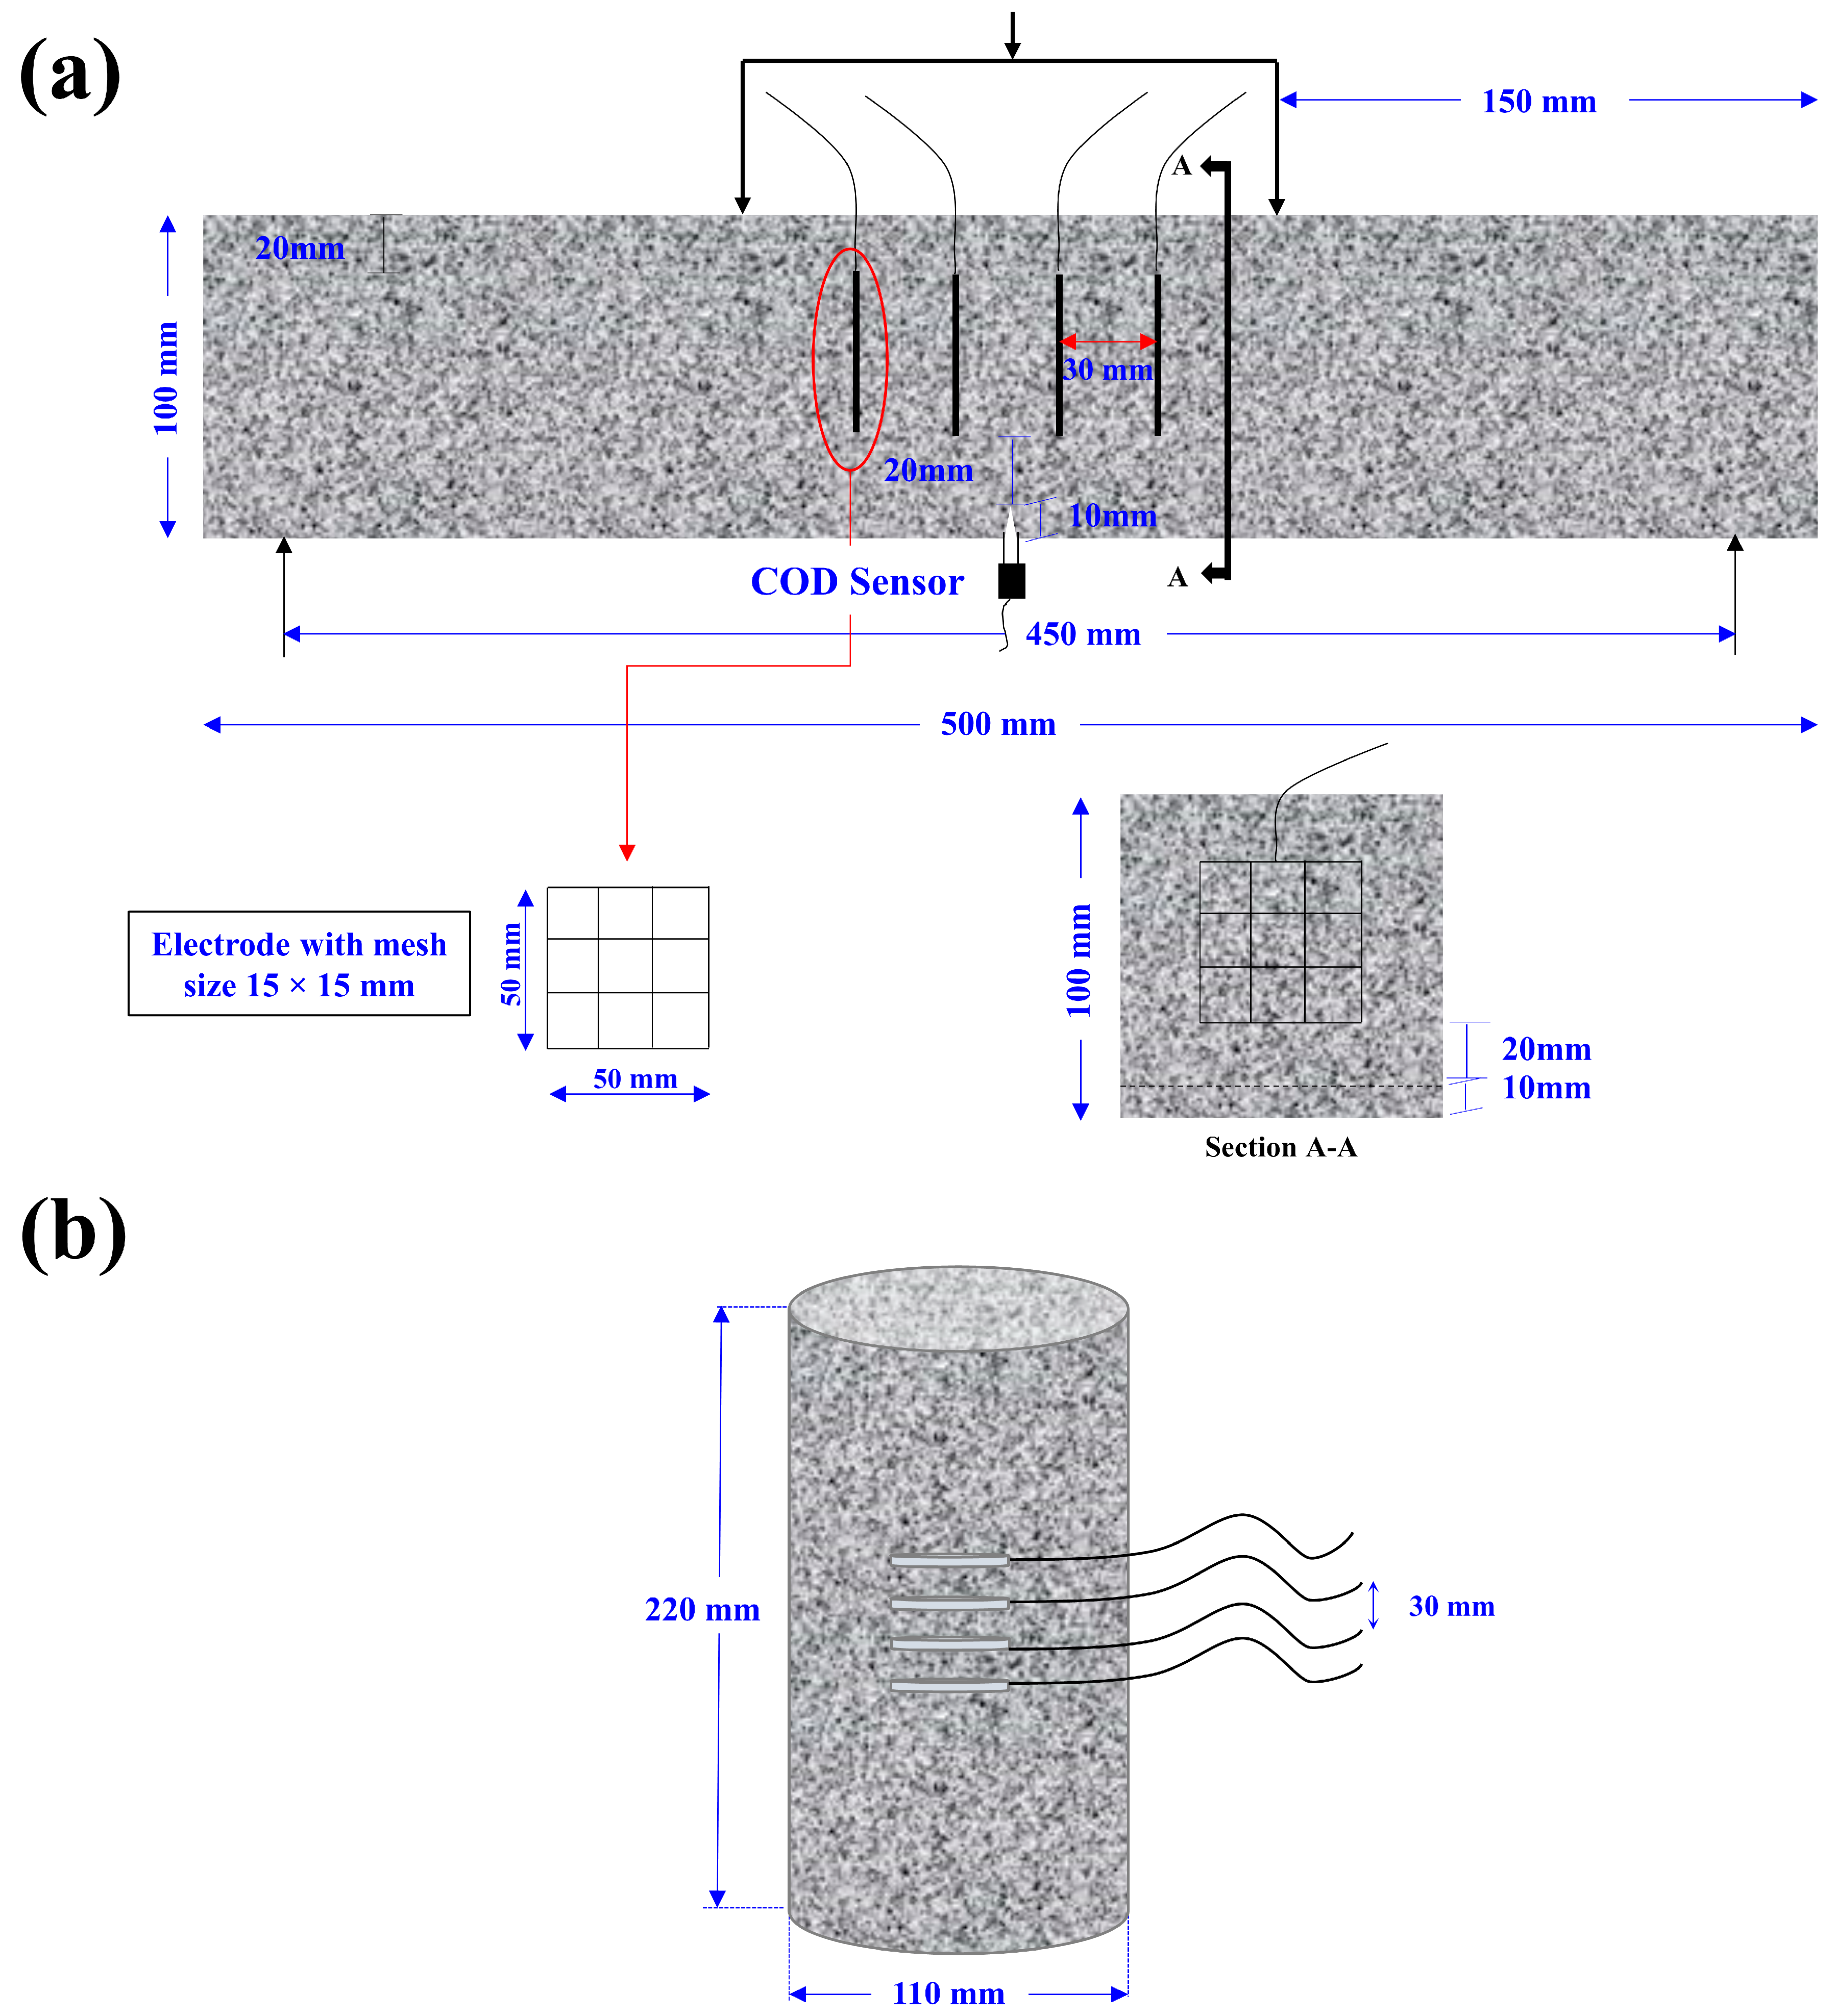
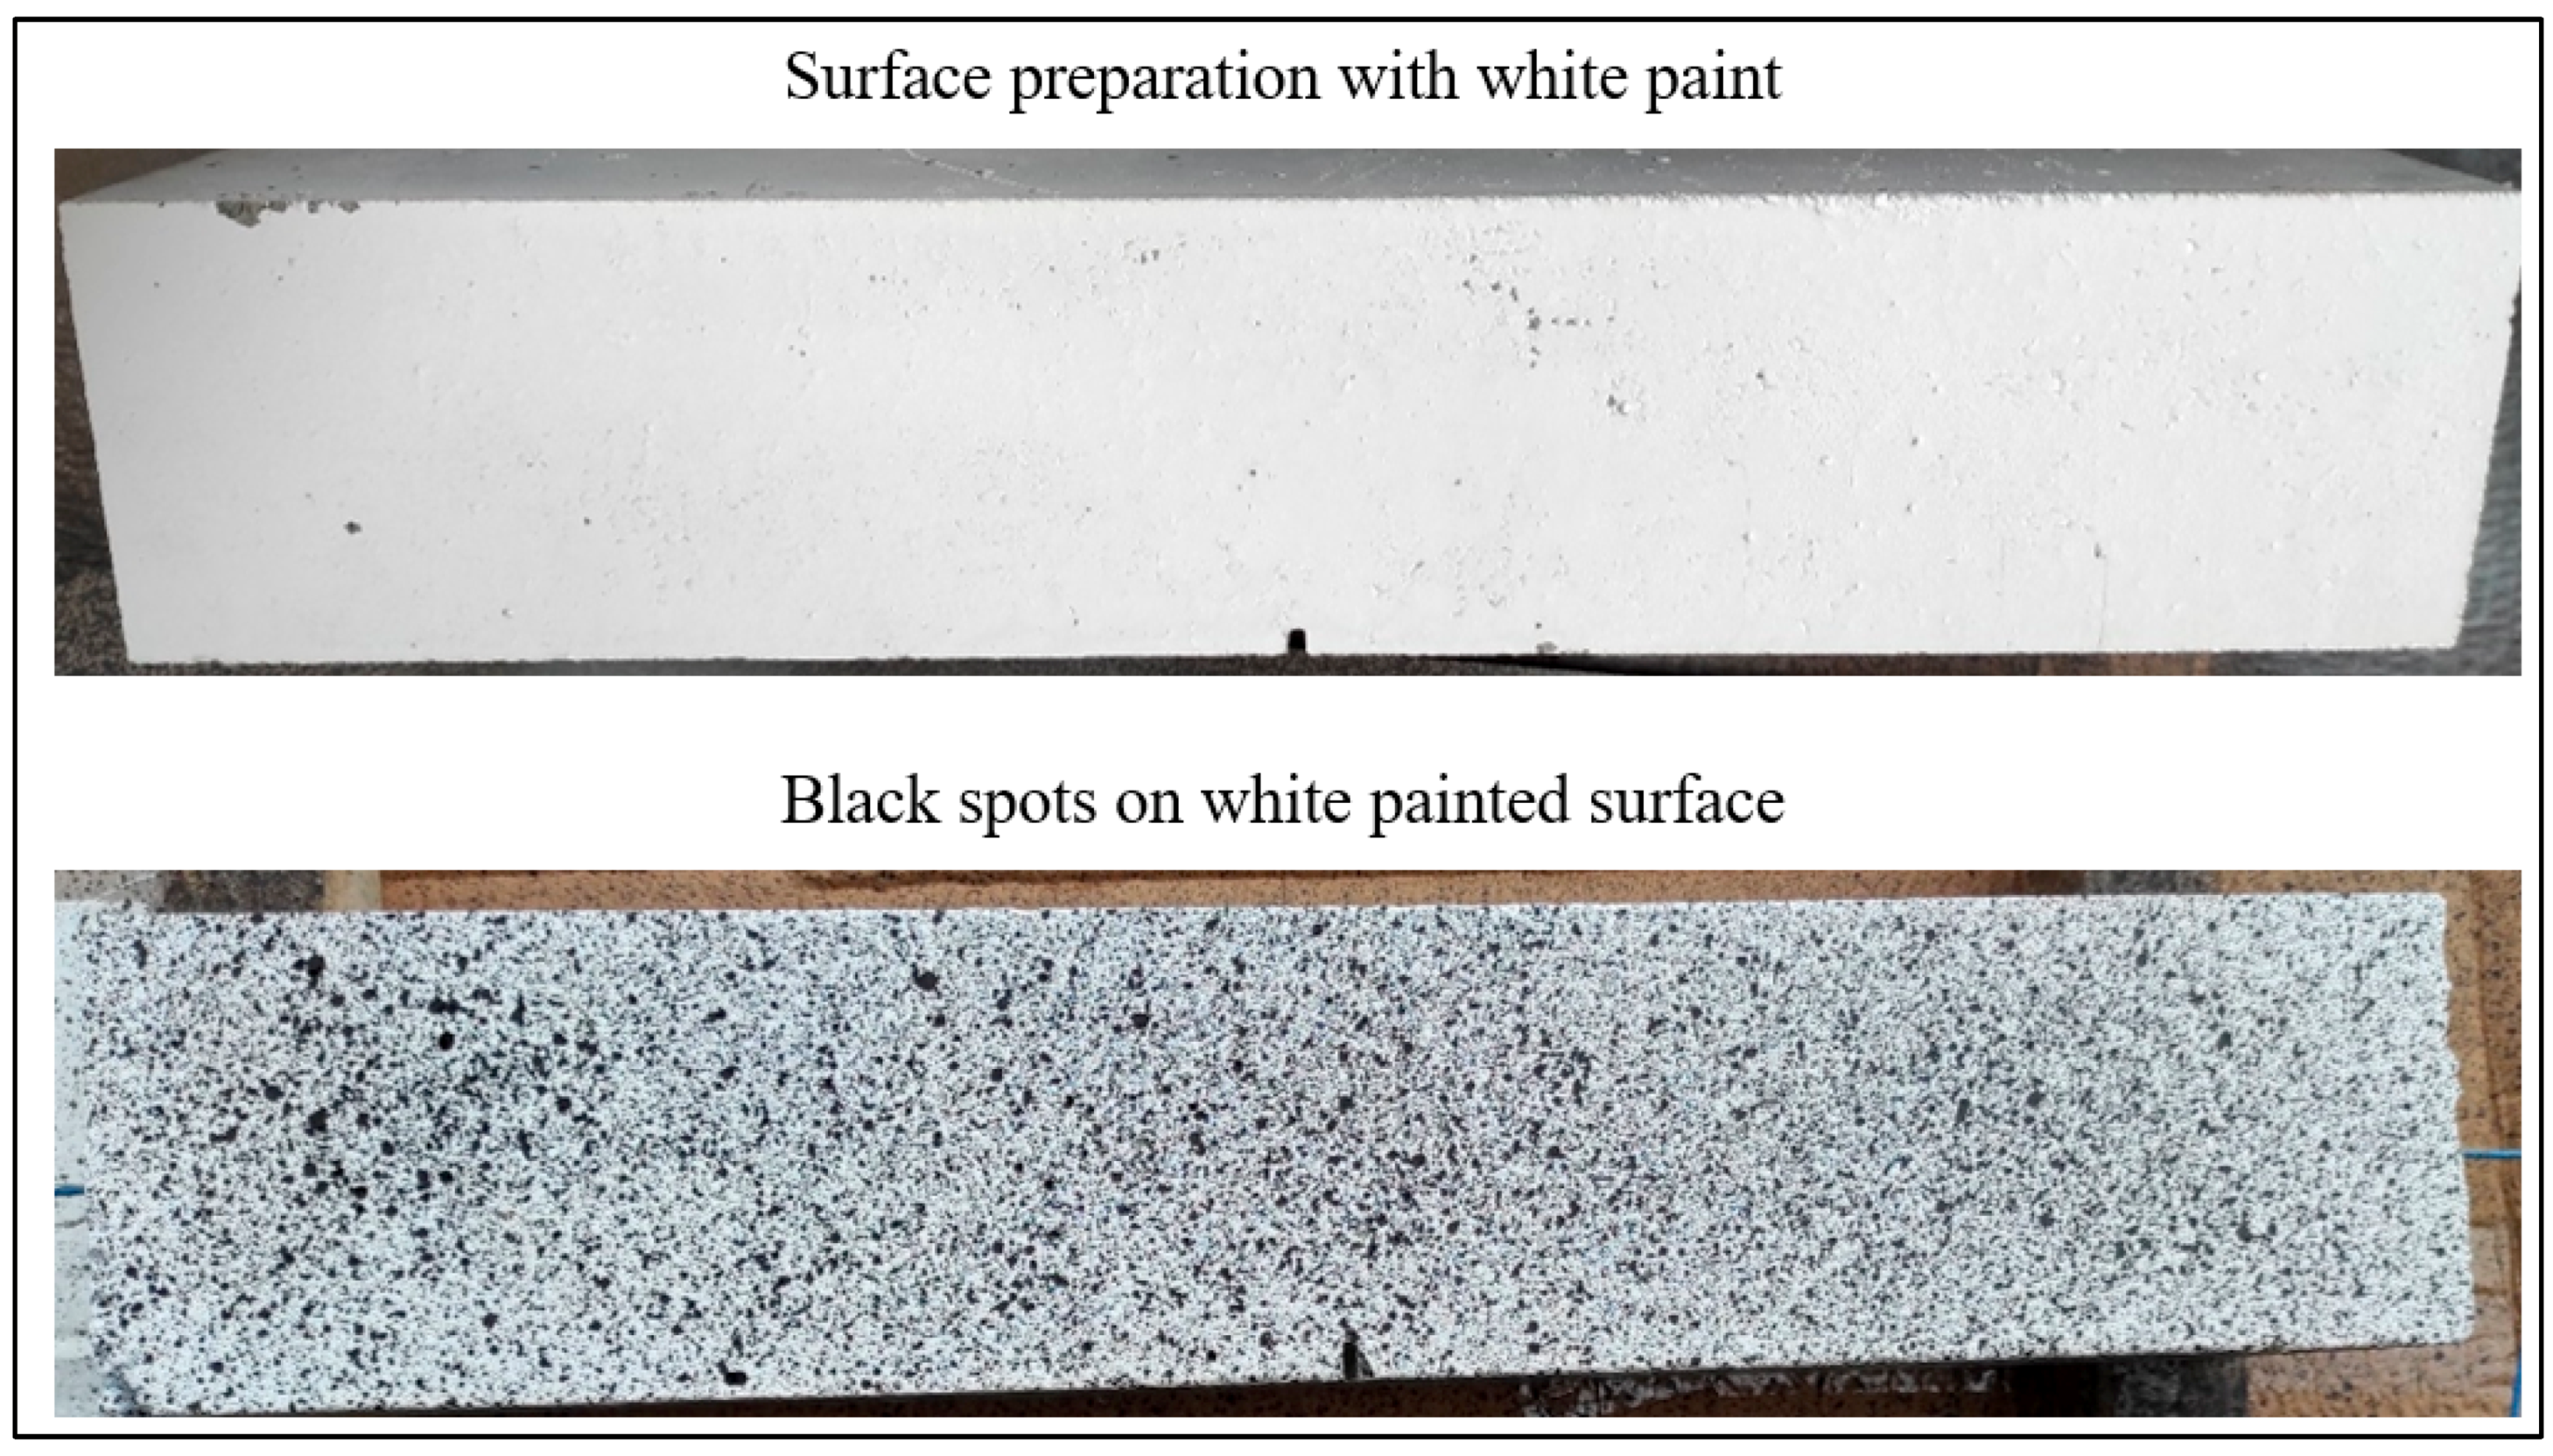
2.2. Preparation of Specimens

Concrete cylinders of 110 mm in diameter and 220 mm in height and prismatic specimens of 100 mm × 100 mm × 500 mm were prepared. Before preparing the fresh concrete, molds were prepared as shown in Figure 1. Gauze type electrodes made with high conductive and corrosion resistive material (stainless steel) were used as shown in Figure 1. To assess electrical resistance using the four-probe method, four electrodes were placed in the center of cylindrical and prismatic specimens at 30 mm from one another.
A UP400St powerful ultrasonicator (400 W, 24 kHz) provided by Hielscher ultrasound technology, Teltow, Germany was used for the sonication of the solution, prepared by mixing the water with MWCNTs. The required quantities of MWCNTs and water were weighted and mixed, and then the solution was mechanically stirred. After mechanical stirring, the solution was sonicated using the ultrasonicator at a rate of 1 min/liter to get a uniform black suspension [30]. Cement, sand, and aggregates were weighted and mixed in the mixer. After dry mixing of the materials, a dispersed solution of MWCNTs was gradually added to the dry mix during the mixing. During the mixing of the constituents of the concrete, superplasticizer was also added to improve the workability of the concrete. The fresh concrete was then cast into the molds by applying compaction using a vibrating table. The concrete specimens were removed from the molds after 24 h of casting and were placed in a curing room for 28 days at 20 °C and relative humidity (RH) of 100%. The steps for the preparation of specimens are shown in Figure 2.
The schematic diagram of the prepared specimens is shown in Figure 3. Before testing of the prismatic specimen, a notch of 10 mm was also made in the middle for initiation of a crack at the predefined location. They were tested under compression and four-point bending.

2.3. Testing Procedures

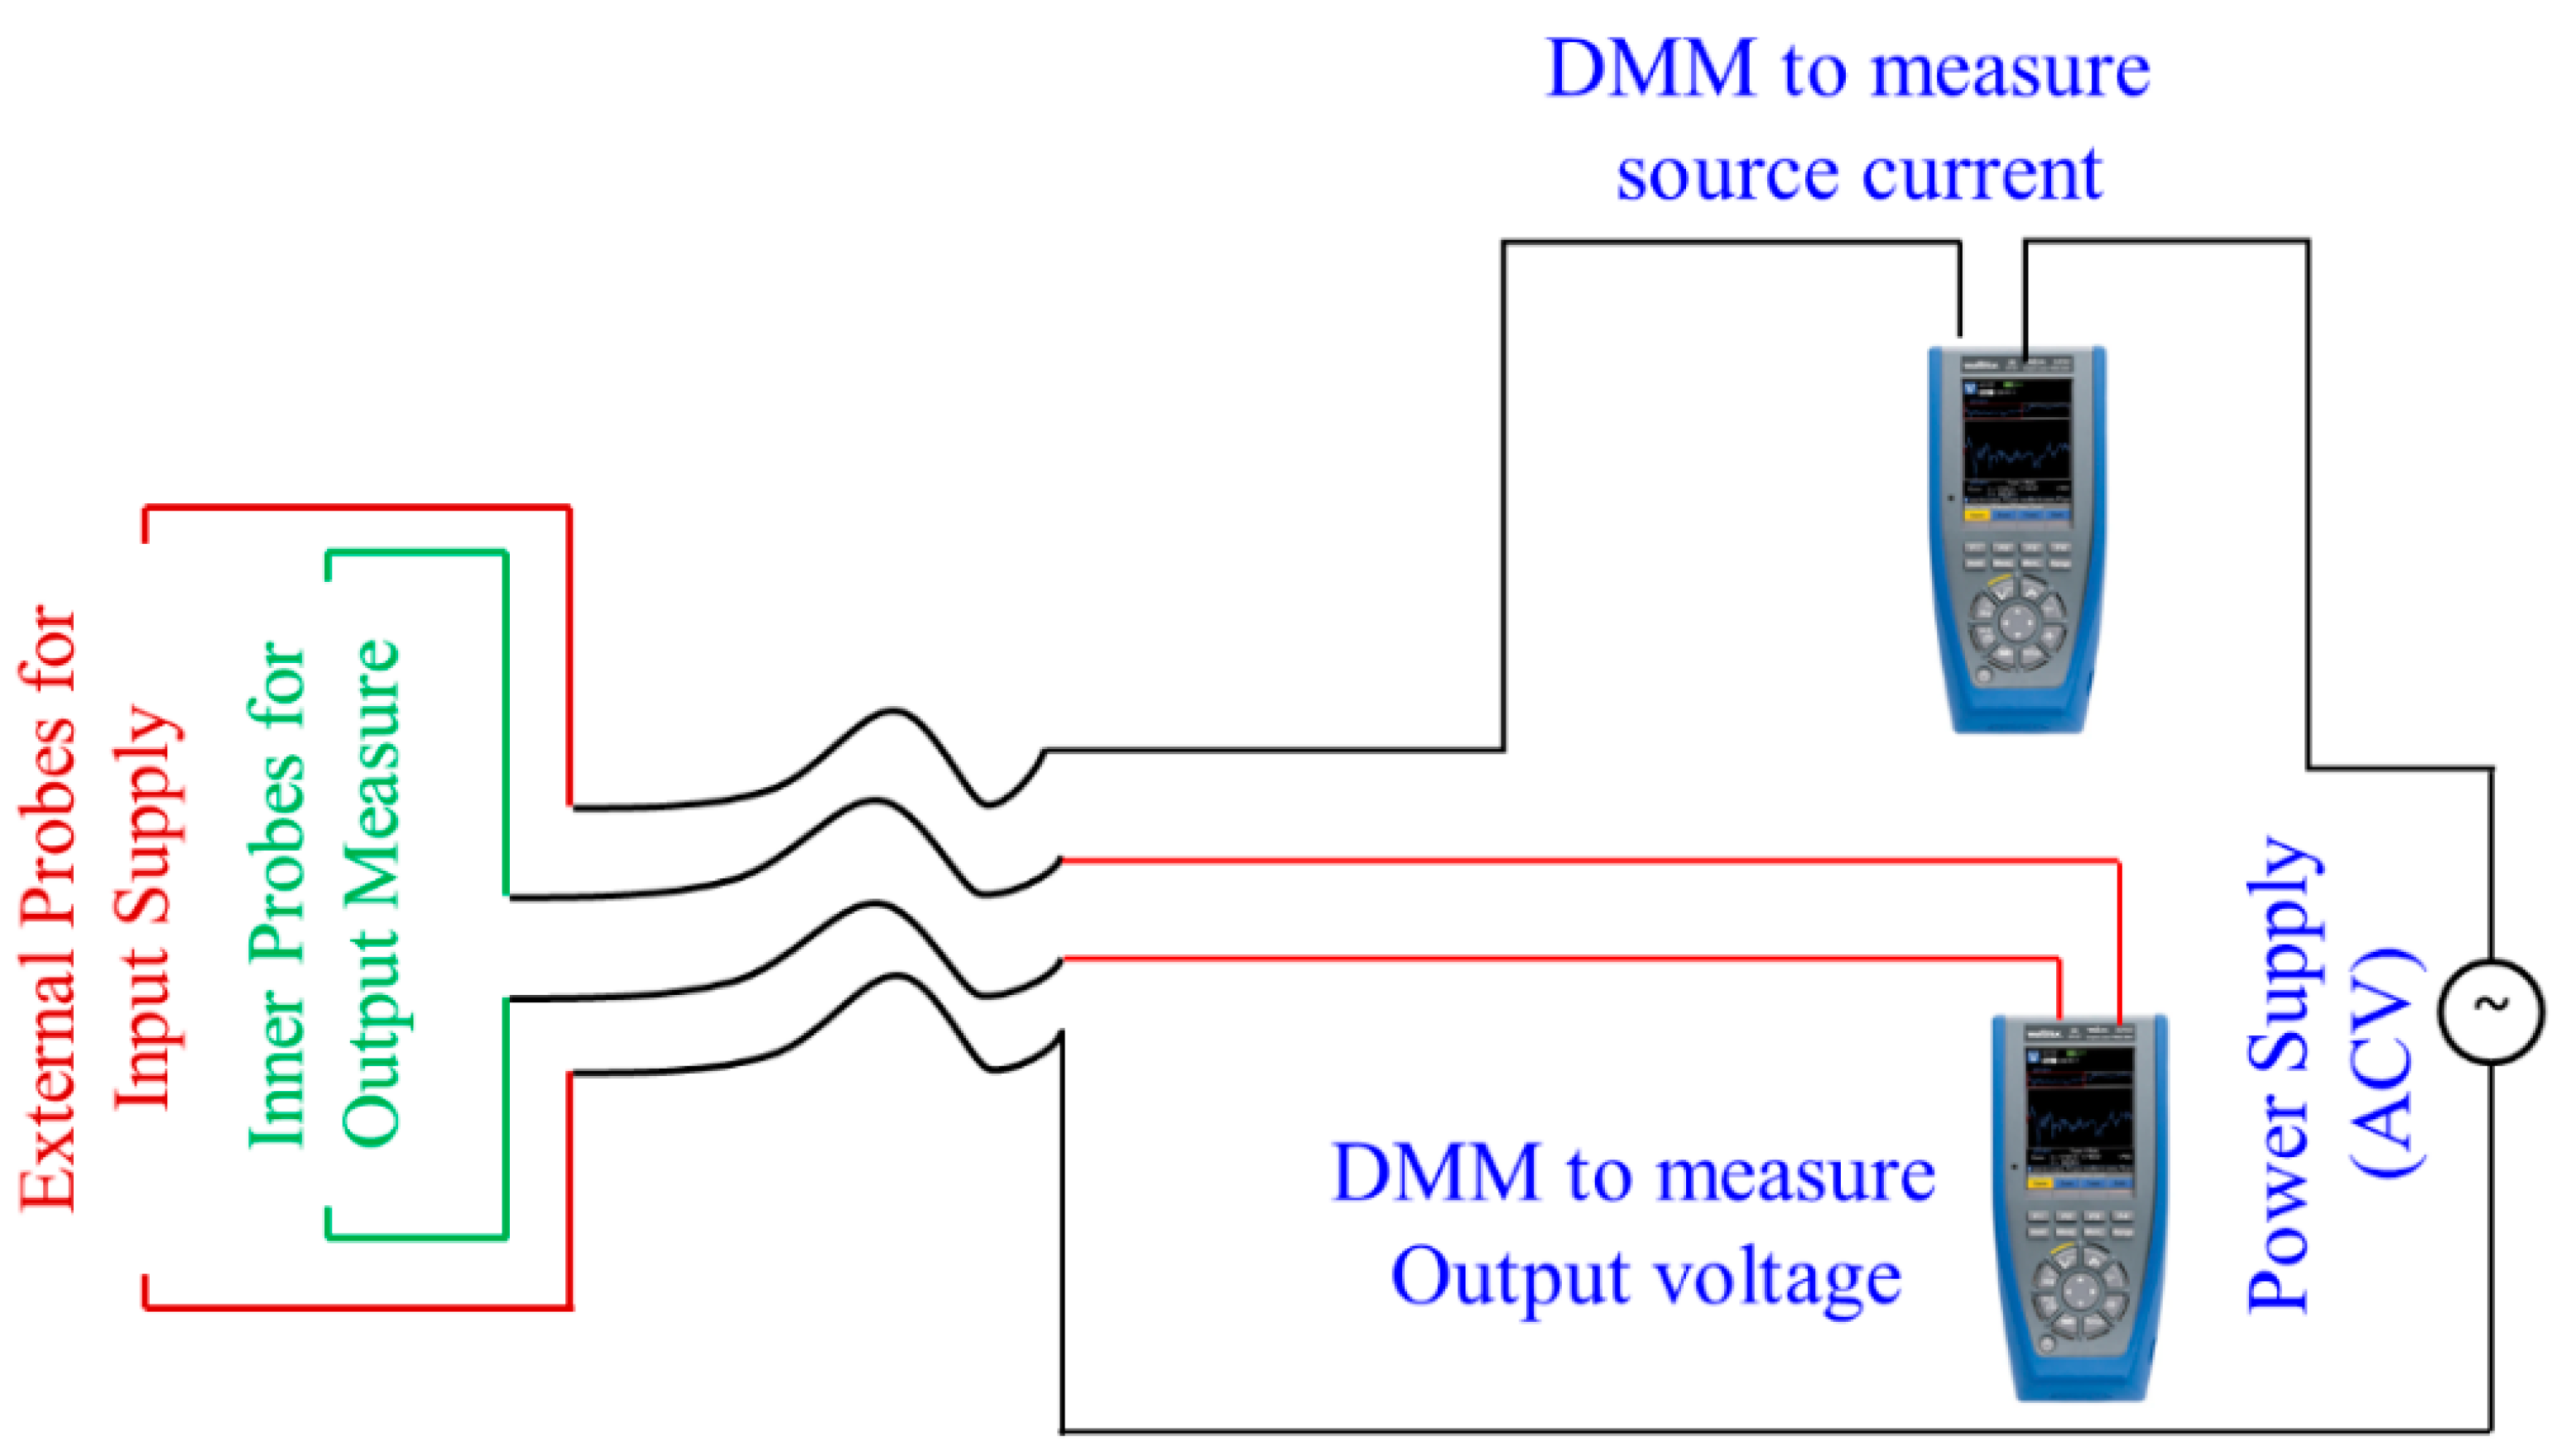
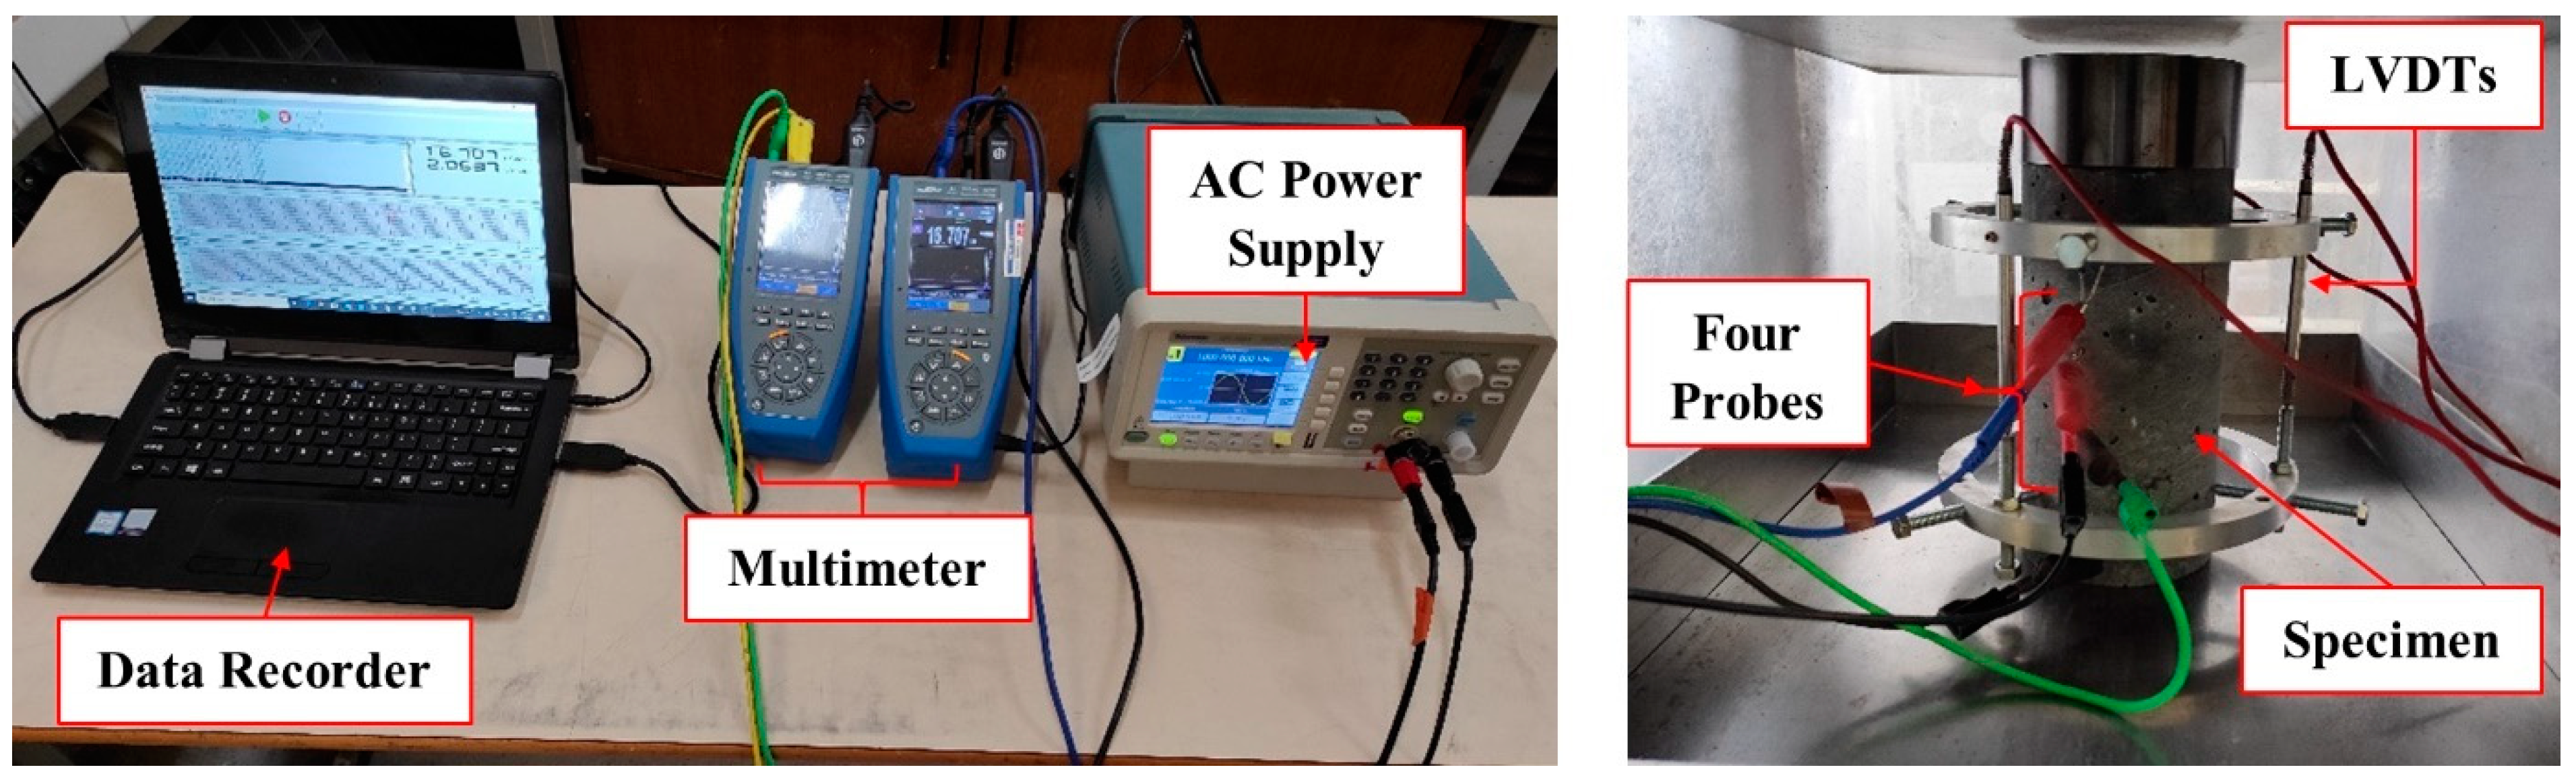
2.3.1. Four-Probe Method

During the experiment, the electrical resistance fluctuation of the testing specimens was measured using the four-probe method. The alternating current (AC) from the outside probes was applied and the output was detected in the form of AC voltage from the inner probes, which is a highly popular and effective approach used to measure the electrical resistance of the material. Due to less contact and spreading resistance, this method of measuring electrical resistance is more effective than two probes [31]. The input voltage from the AC source was administered by applying a 20 V peak-to-peak voltage at a frequency of 1 kHz. These parameters were chosen in accordance with the previous study conducted by Ferdiansyah et al. [24] They found that the input voltage of 20 V with 1 kHz of frequency provides a high sensitivity to the measuring system. The schematic presentation of the four-probe method is shown in Figure 4.
By measuring the current and voltage by a four-probe method, electrical resistance is calculated by Ohm’s law as described in Equation (1). By calculating the electrical resistance from Equation (1), fractional change in electrical resistance (FCR) is calculated using Equation (2).
R = V I
F C R = ( R R i ) R i × 100
where, R is the electrical resistance measured during the test and Ri is the electrical resistance before the specimen loading.

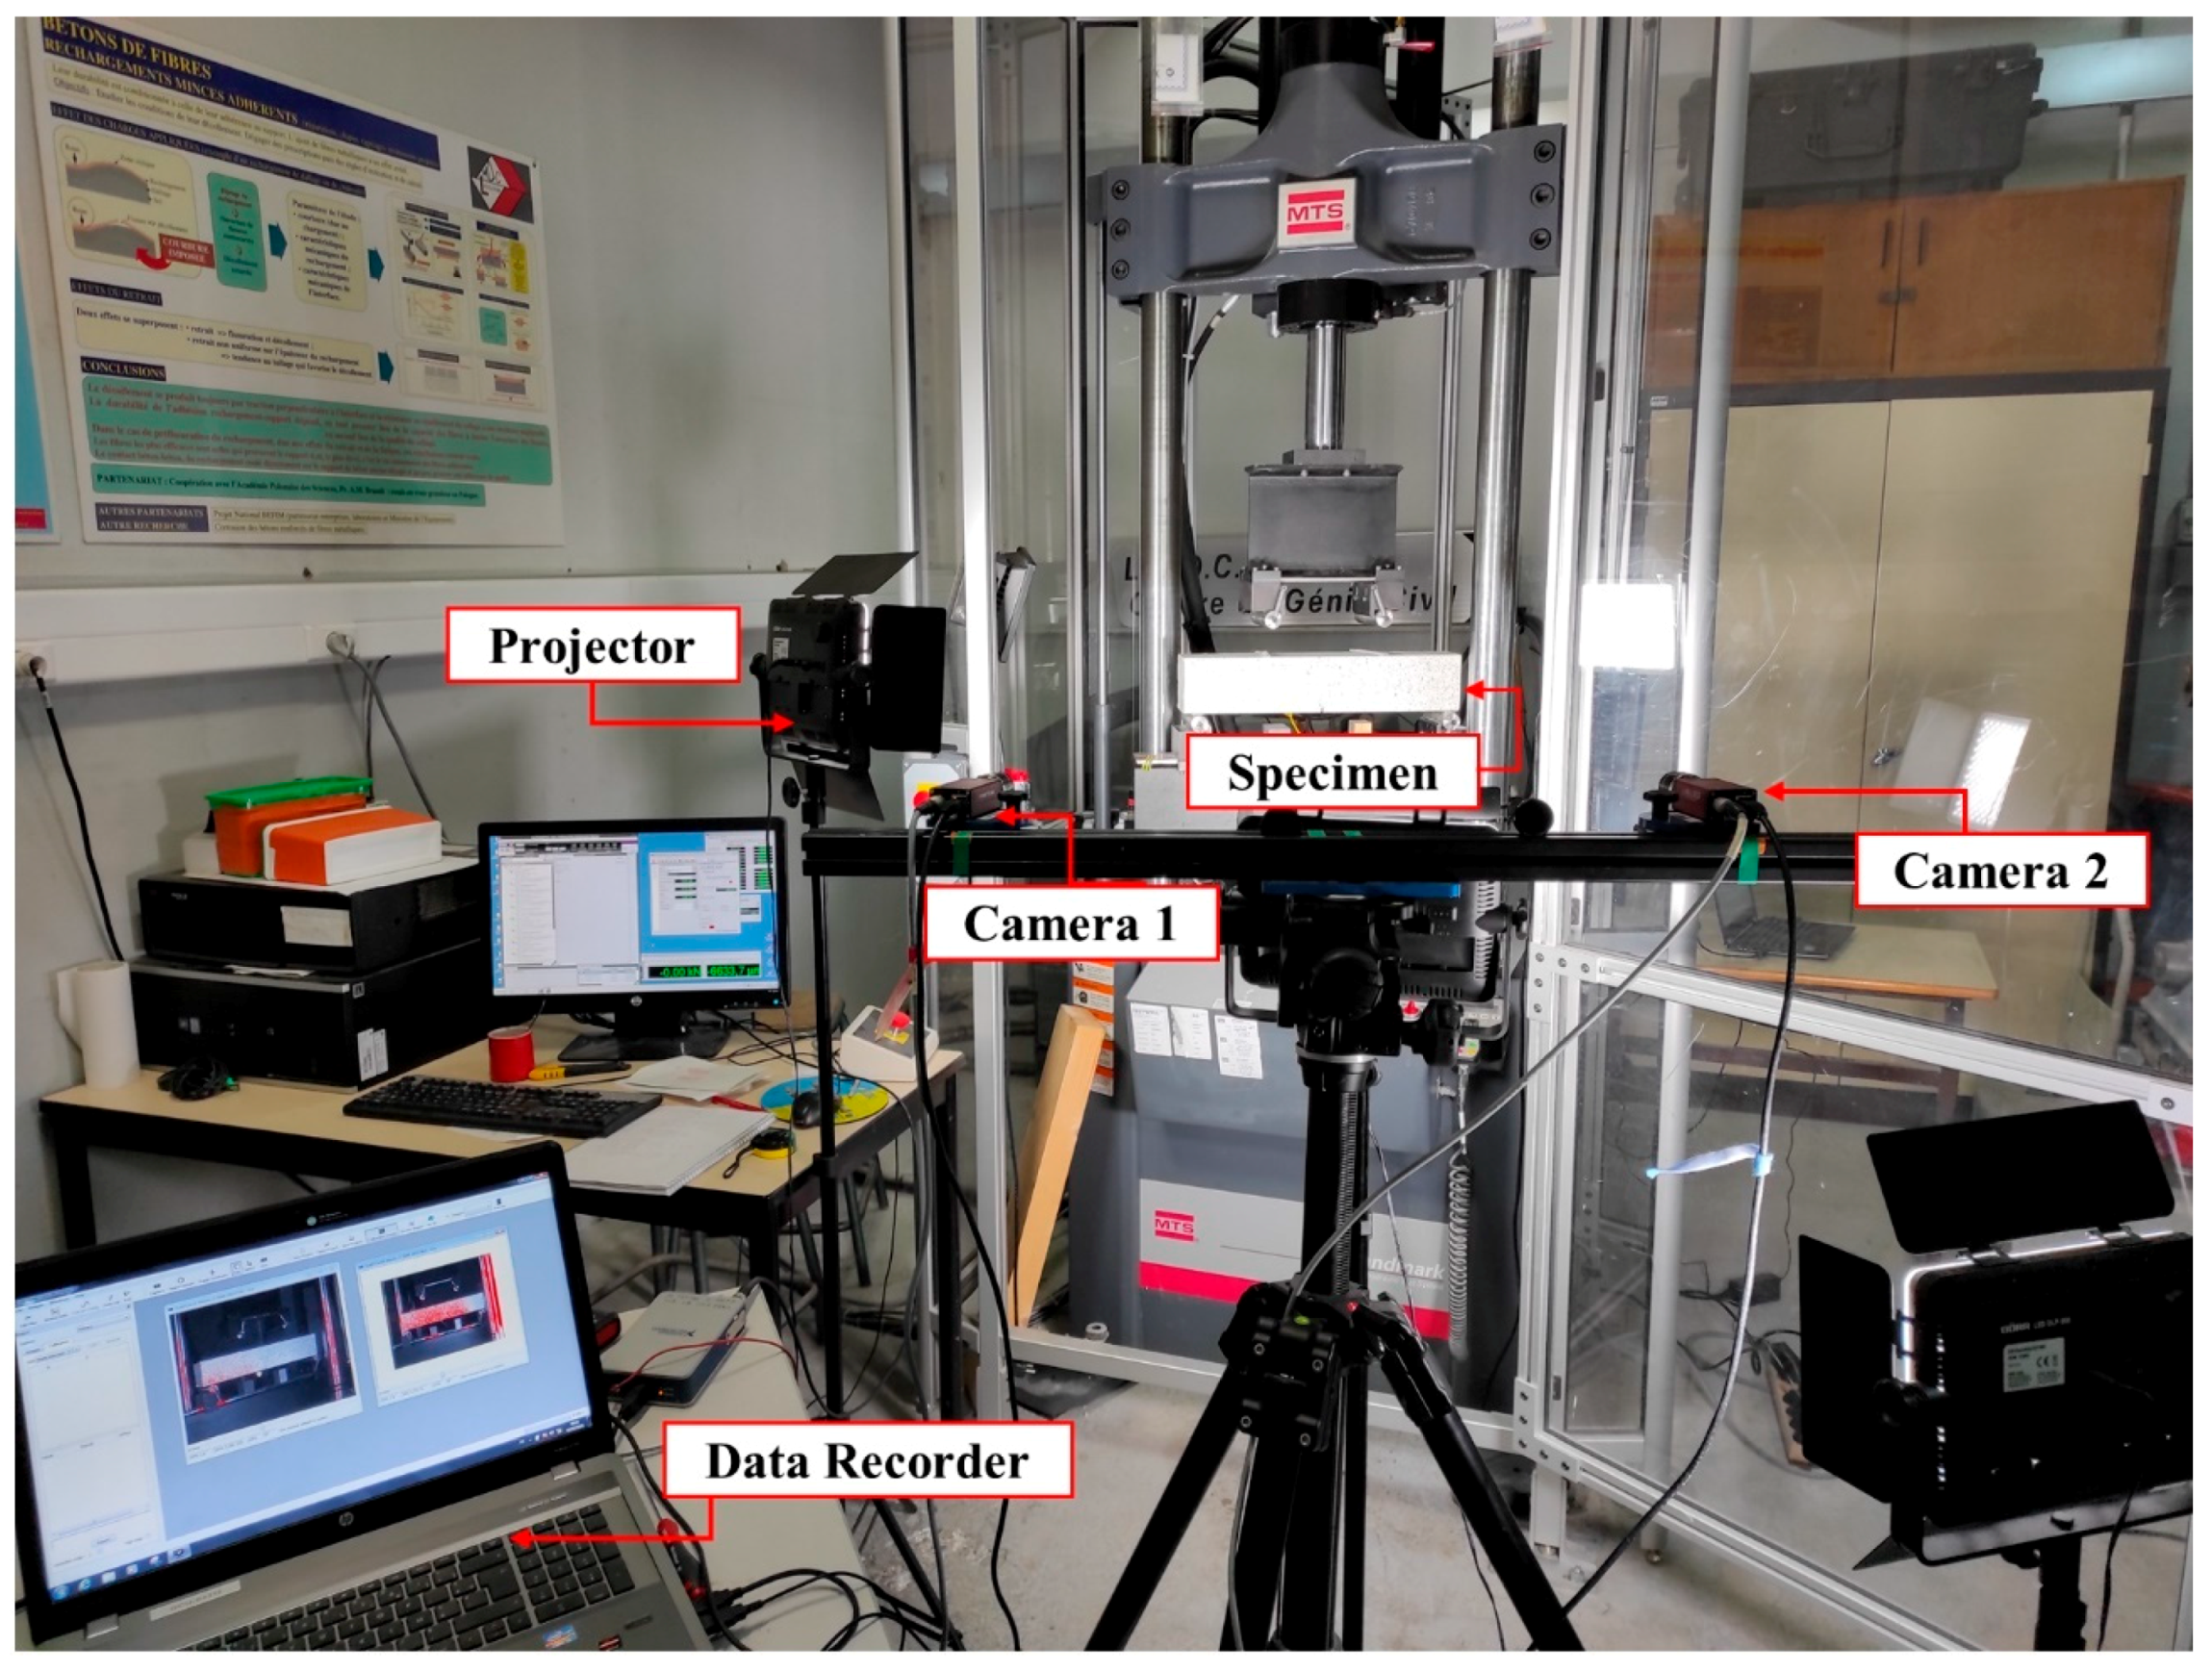
2.3.2. Four-Point Bending Test

A hydraulic testing machine with a maximum capacity of 100 kN was used to conduct the four-point bending test on the prepared specimens. A clip-gauge sensor was used to measure the crack mouth opening displacement (CMOD) at the predefined location (notch) of the prismatic specimen. The experiment was controlled by the CMOD at a rate of 50 µm/min. Two monitoring systems were installed to assess the damage in the specimens, including an electrical resistance measuring system (for internal damage) and digital image correlation (DIC) techniques (for the assessment of damage from the surface of the specimen).
The layout of the four-point bending test is shown in Figure 5. For the cyclic bending test, 5 loading-unloading cycles were carried out. The initial cycle of loading was applied by adopting a load of 50% to the maximum capacity of the specimen before peak load was reached. The rest of the four cycles were performed after peak. For the first cycle in the post-peak, the sequence of the cycle was started at 80% of the peak load and unloading continued till 1 kN was reached. From 1 kN, loading was started again to reach 80% of the peak to complete the cycle of loading. A similar sequence was adopted for the next cycles of loading; 60%, 40%, and 20% in post-peak zones. Figure 6 shows the loading sequence adopted for these tests.

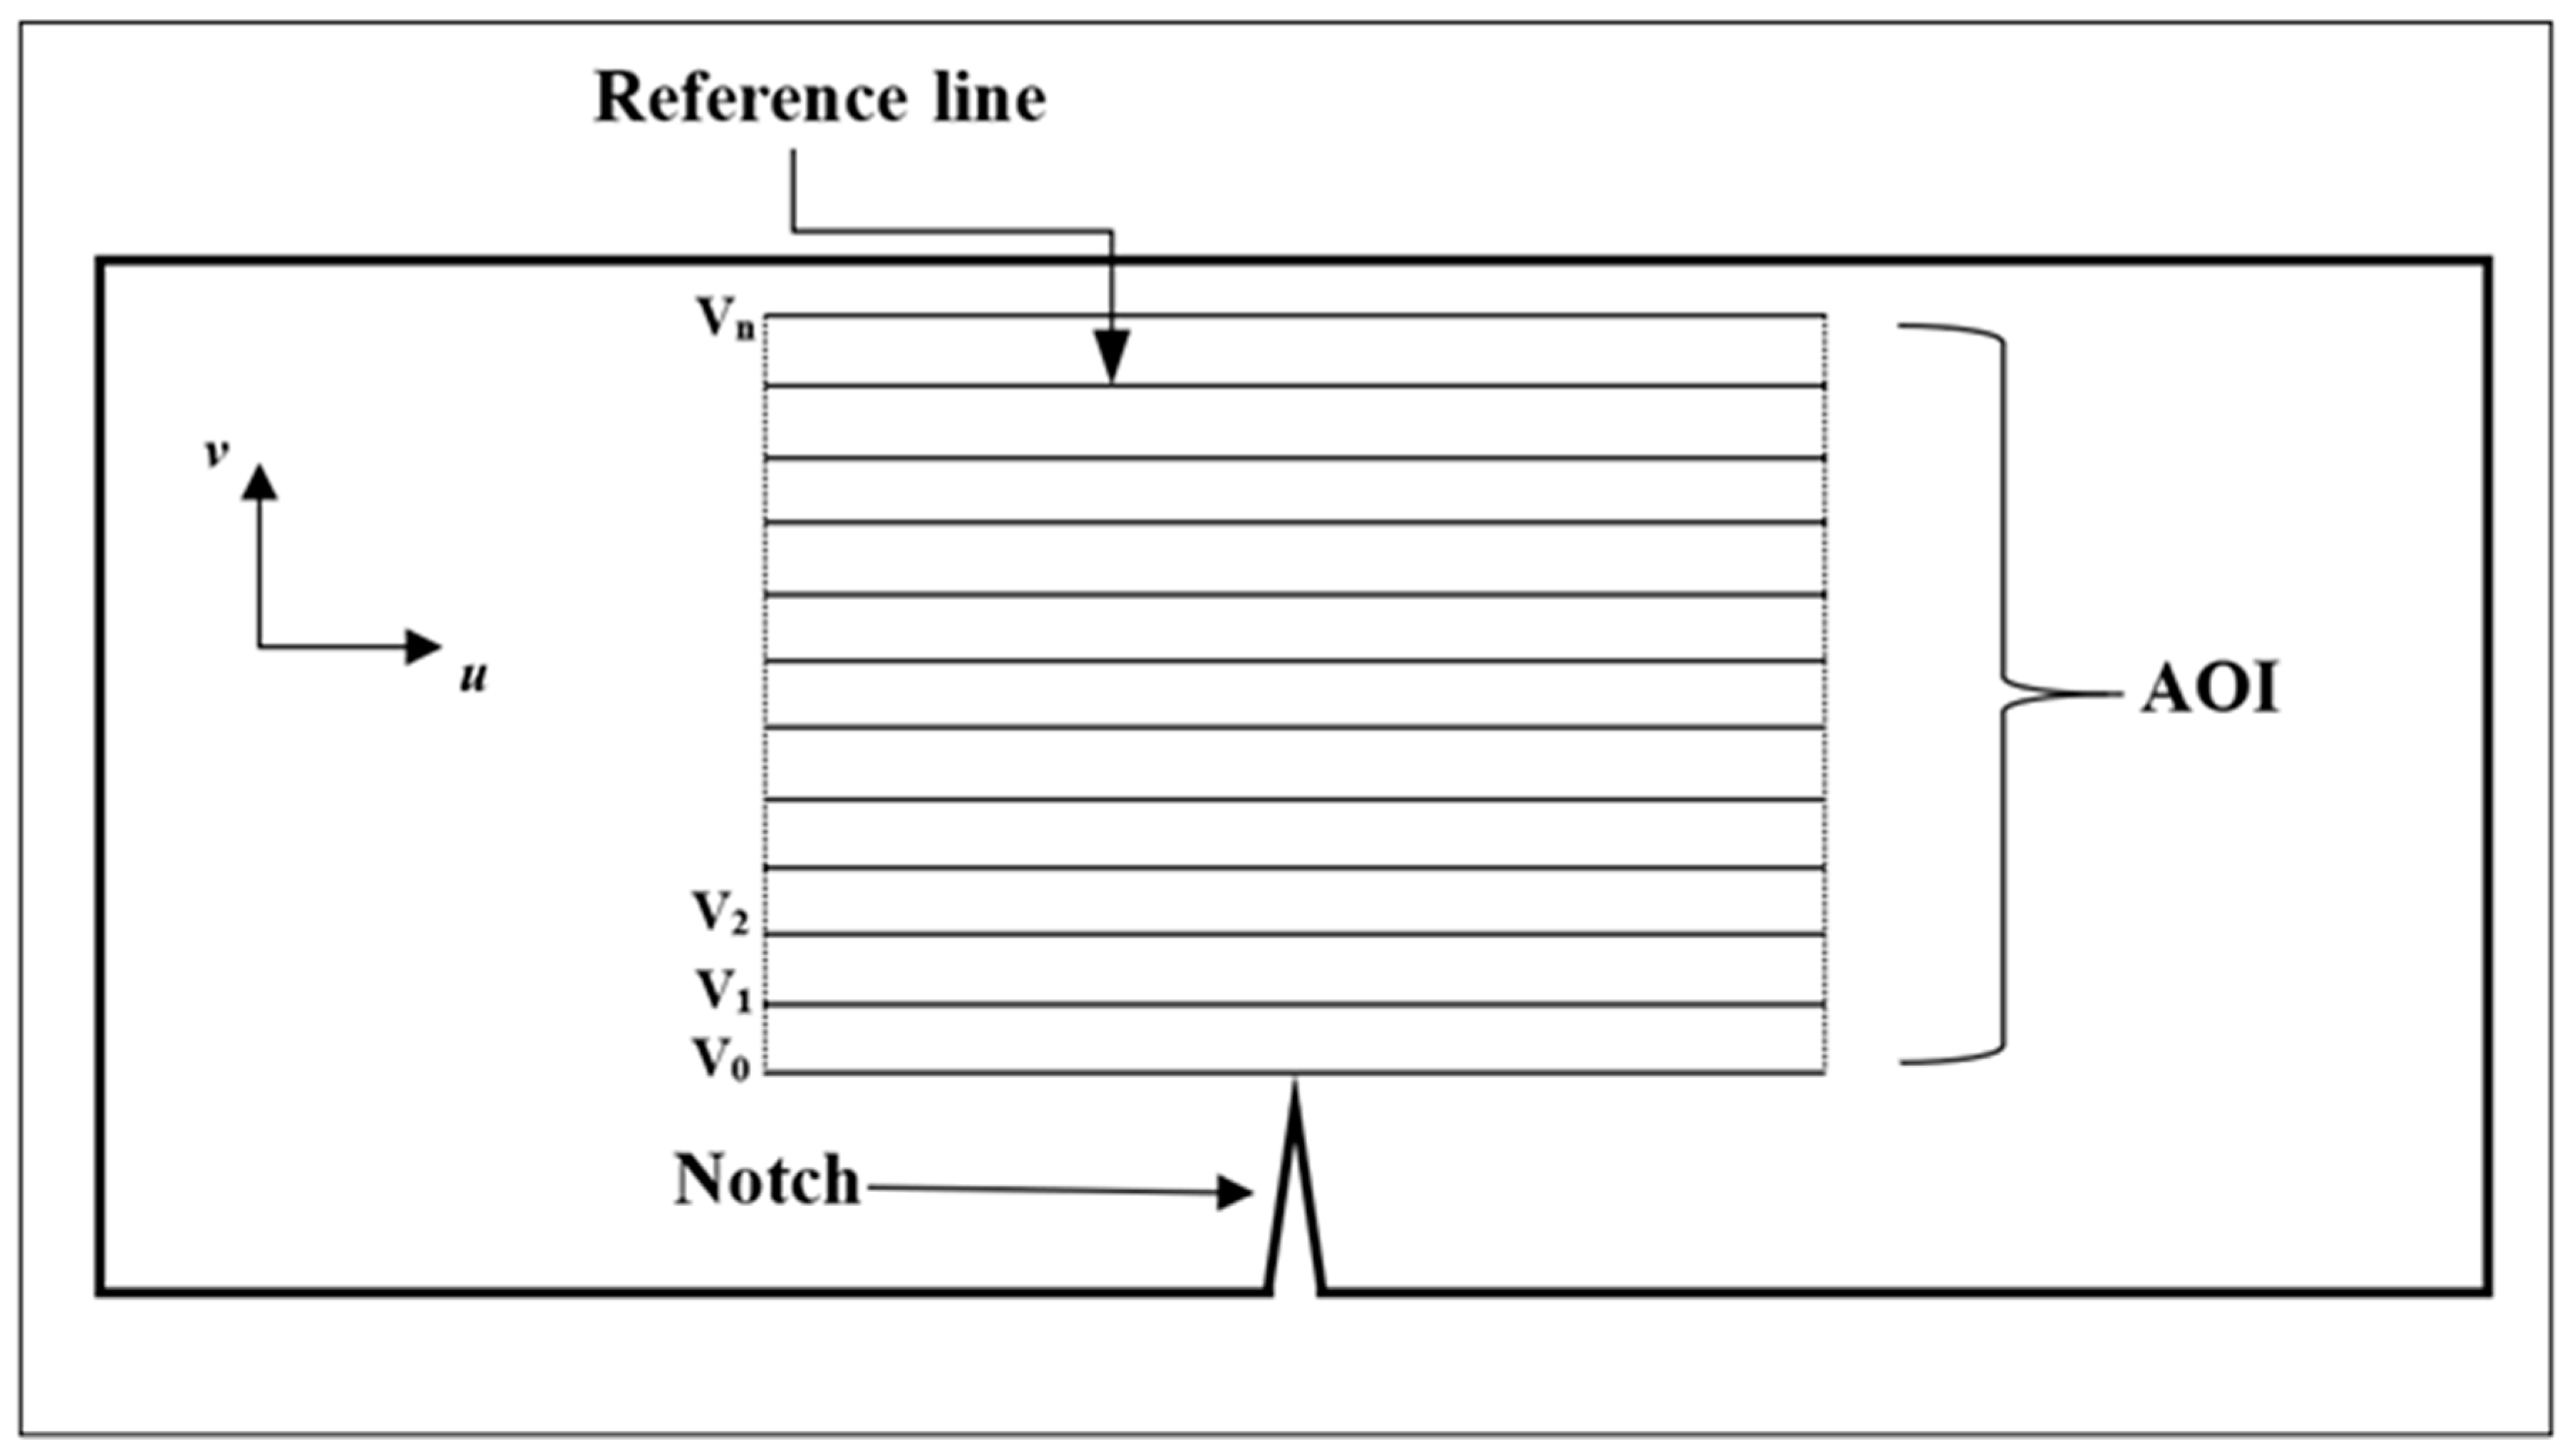
2.3.3. Digital Image Correlation (DIC)

An optical, non-contact measurement method called digital image correlation (DIC) is used to quantify surface displacements on an object of interest. The strain field at the object’s surface is then calculated using displacement. The area of interest (AOI) needs to be painted with a random speckle pattern before the process begins to provide the most accurate analysis [32]. For the 3D image correlation technique, two sets of images must be simultaneously collected from two different cameras. To establish the 3D system in which the event or process being analyzed will take place, the system must be calibrated. The pictures from the two cameras are then correlated using the calibration data to establish the displacement and strain of the material under investigation [33]. The sample was painted white and then black spots were added to this white painted surface as seen in Figure 7 in order to perform 3D image correlation. The entire experimental testing setup (lights, cameras, etc.) required to perform digital image correlation is shown in Figure 8. To track the crack onset and propagation, a four-point bending test was performed in conjunction with this DIC approach. During the experiment, two 50-W LED cameras with an 8 mm focal length were utilized to examine the study area, as depicted in Figure 8. During the test, the images were taken every 1 s. The VIC 3D v.9.4 software was used for the post-processing of the images taken.

2.3.4. Compressive Test

Self-sensing is the responsive behavior of smart concrete under the change in its own condition, such as stress, strain, or damage [34]. These characteristics are determined by measuring the material’s piezoresistivity. Electrical measurements return to their beginning stage under unloading conditions because applied stresses remain within the material’s elastic limit as conductive materials begin to move toward one another under uniaxial compression loading. Self-sensing assessment of smart concrete was carried out under a uni-axial loading cycle, and it is assessed in terms of variation in electrical resistance as measured using the four-probe method as shown in Figure 9. Three cycles of loading/unloading were monitored with a four-probe method at stress levels of 20, 35, and 50% of the compressive strength. Three linear variable differential transducer (LVDT) sensors were connected at 120° from each other to measure the strain during the experiment. Moreover, in order to analyze the degree of saturation effect on the self-sensing response of the concrete, samples were placed under three distinct saturation conditions as shown in Table 2.

3. Results & Discussions

3.1. Four-Point Bending Test

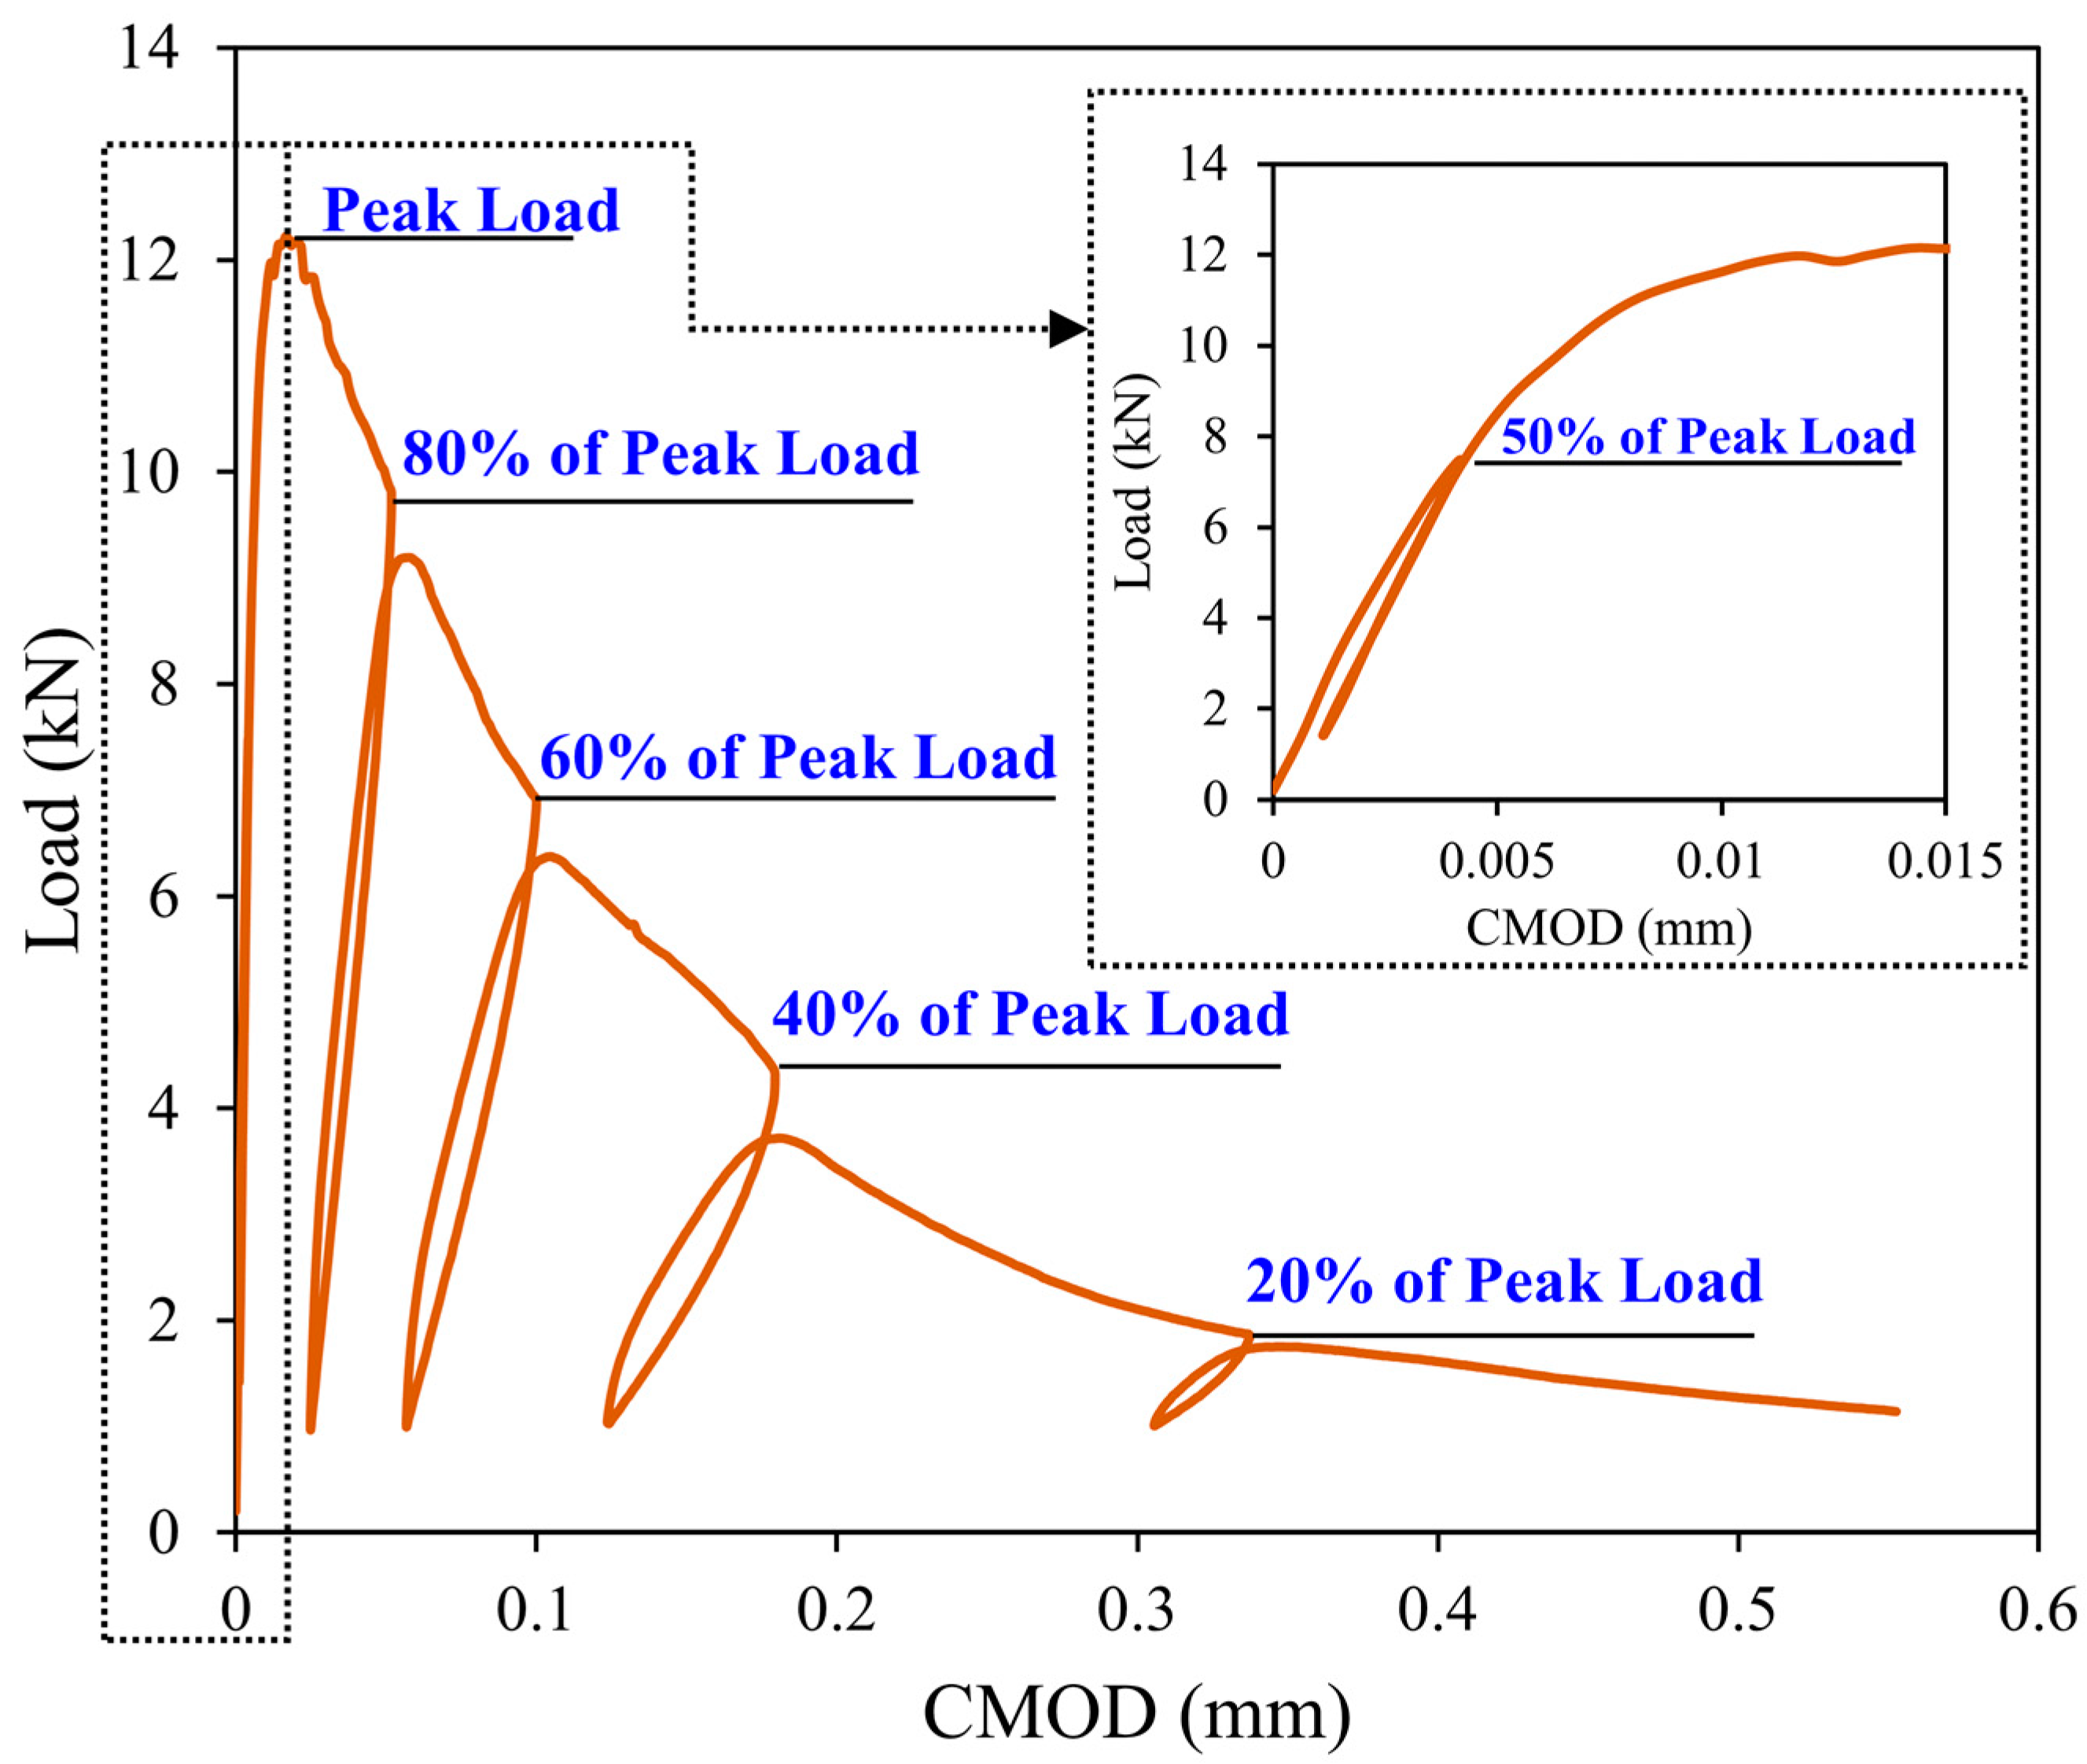
3.1.1. Load versus CMOD

The relation between the CMOD and load for the prismatic specimen can be seen from Figure 10. Linear increase in the load was observed up to 50% of the peak and then continues non-linearly beyond this, due to the initiation of the micro-cracks in the material. There is rapid growth of the micro-cracks and then a softening behavior of the material, through which load starts to decrease with the increase in the CMOD.

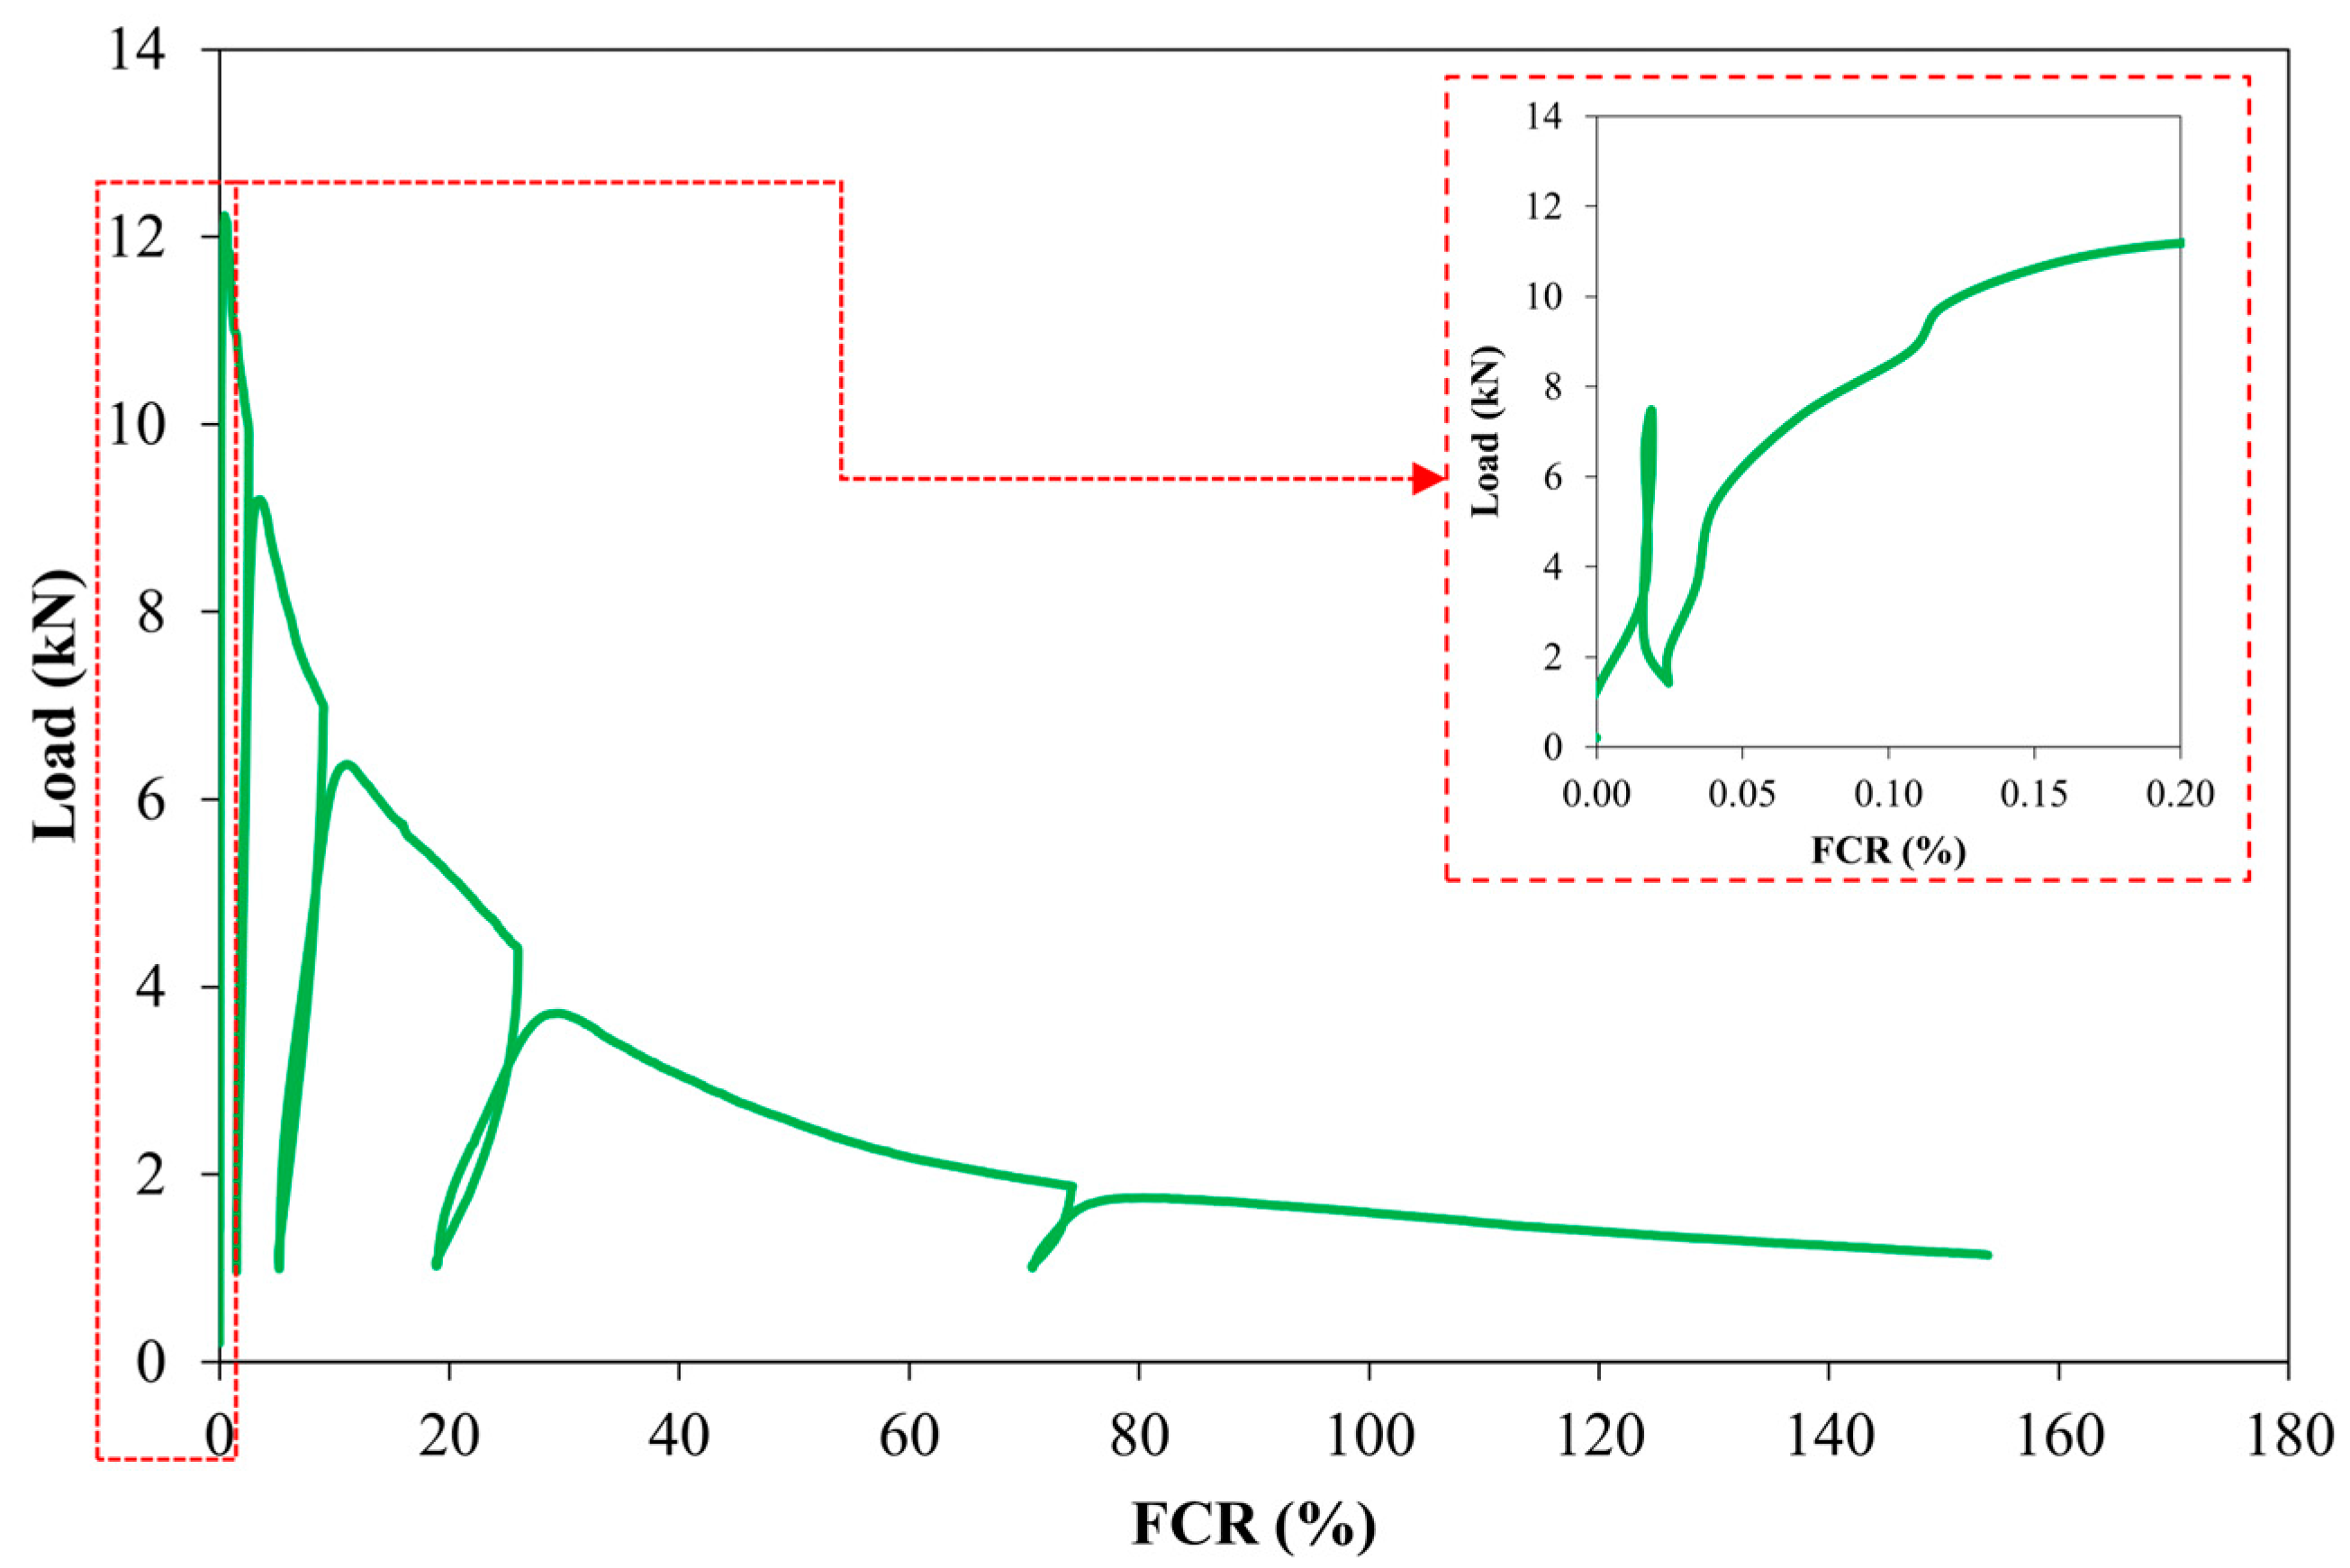
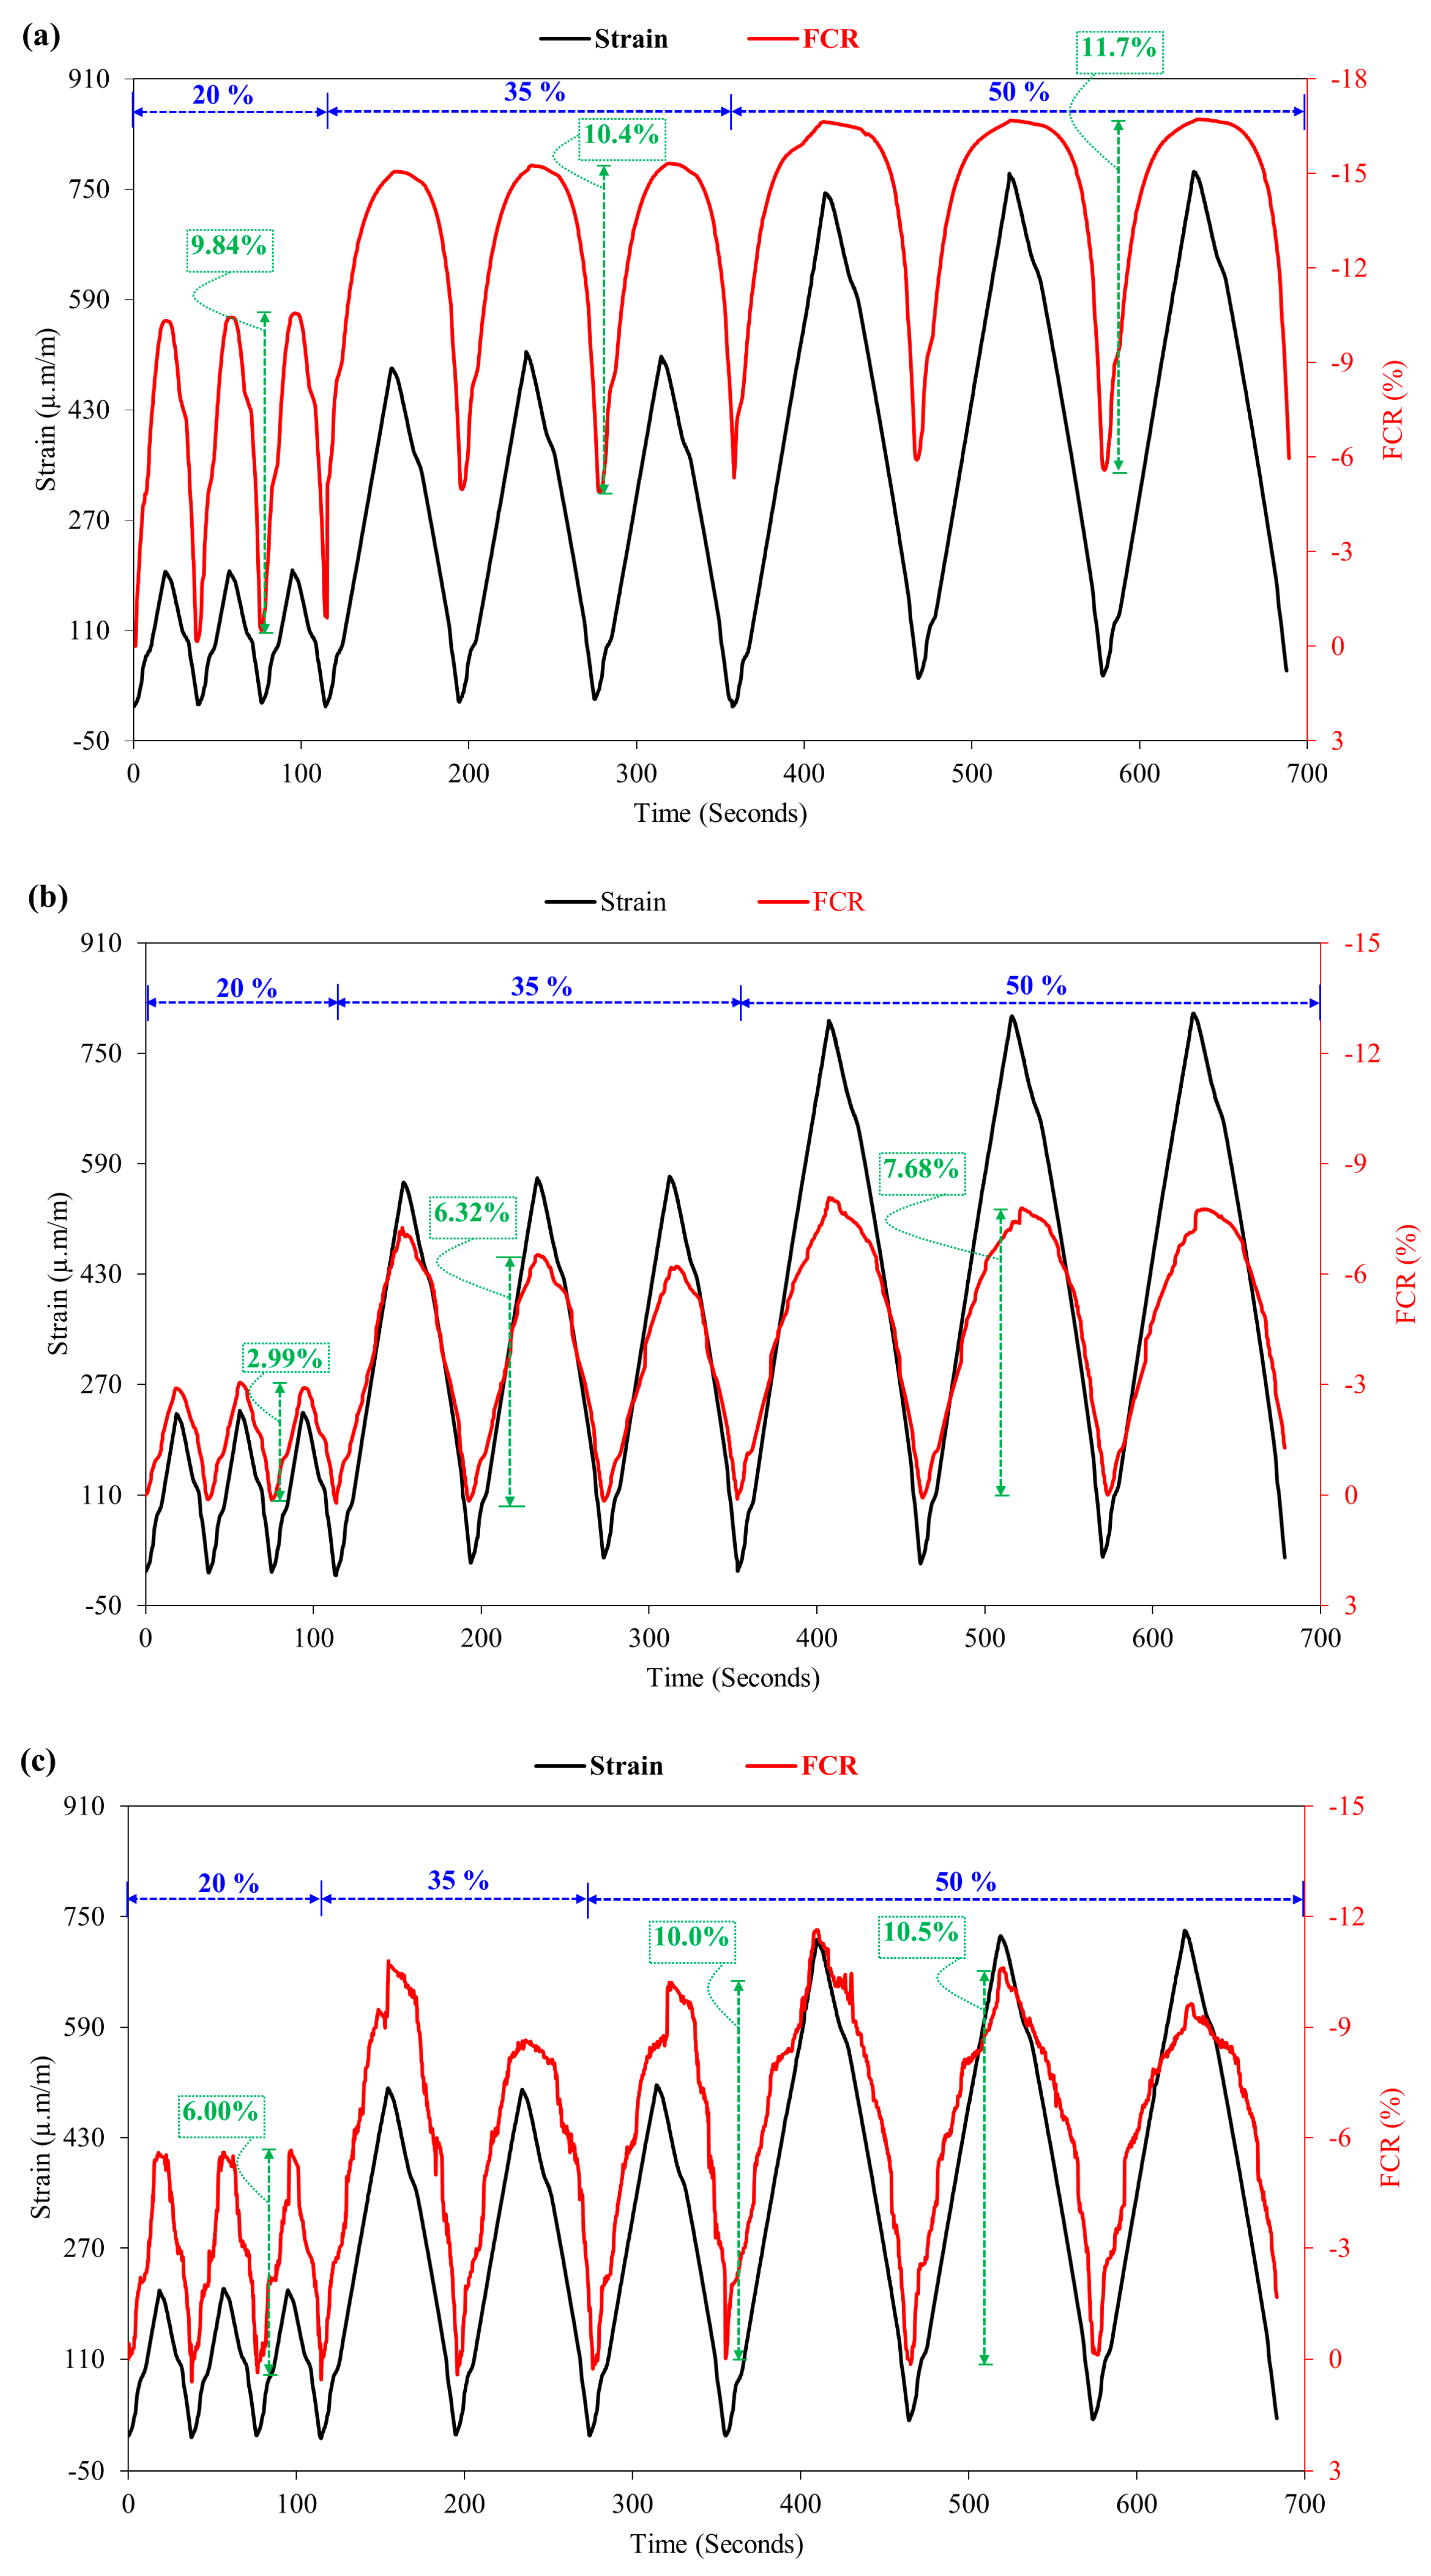
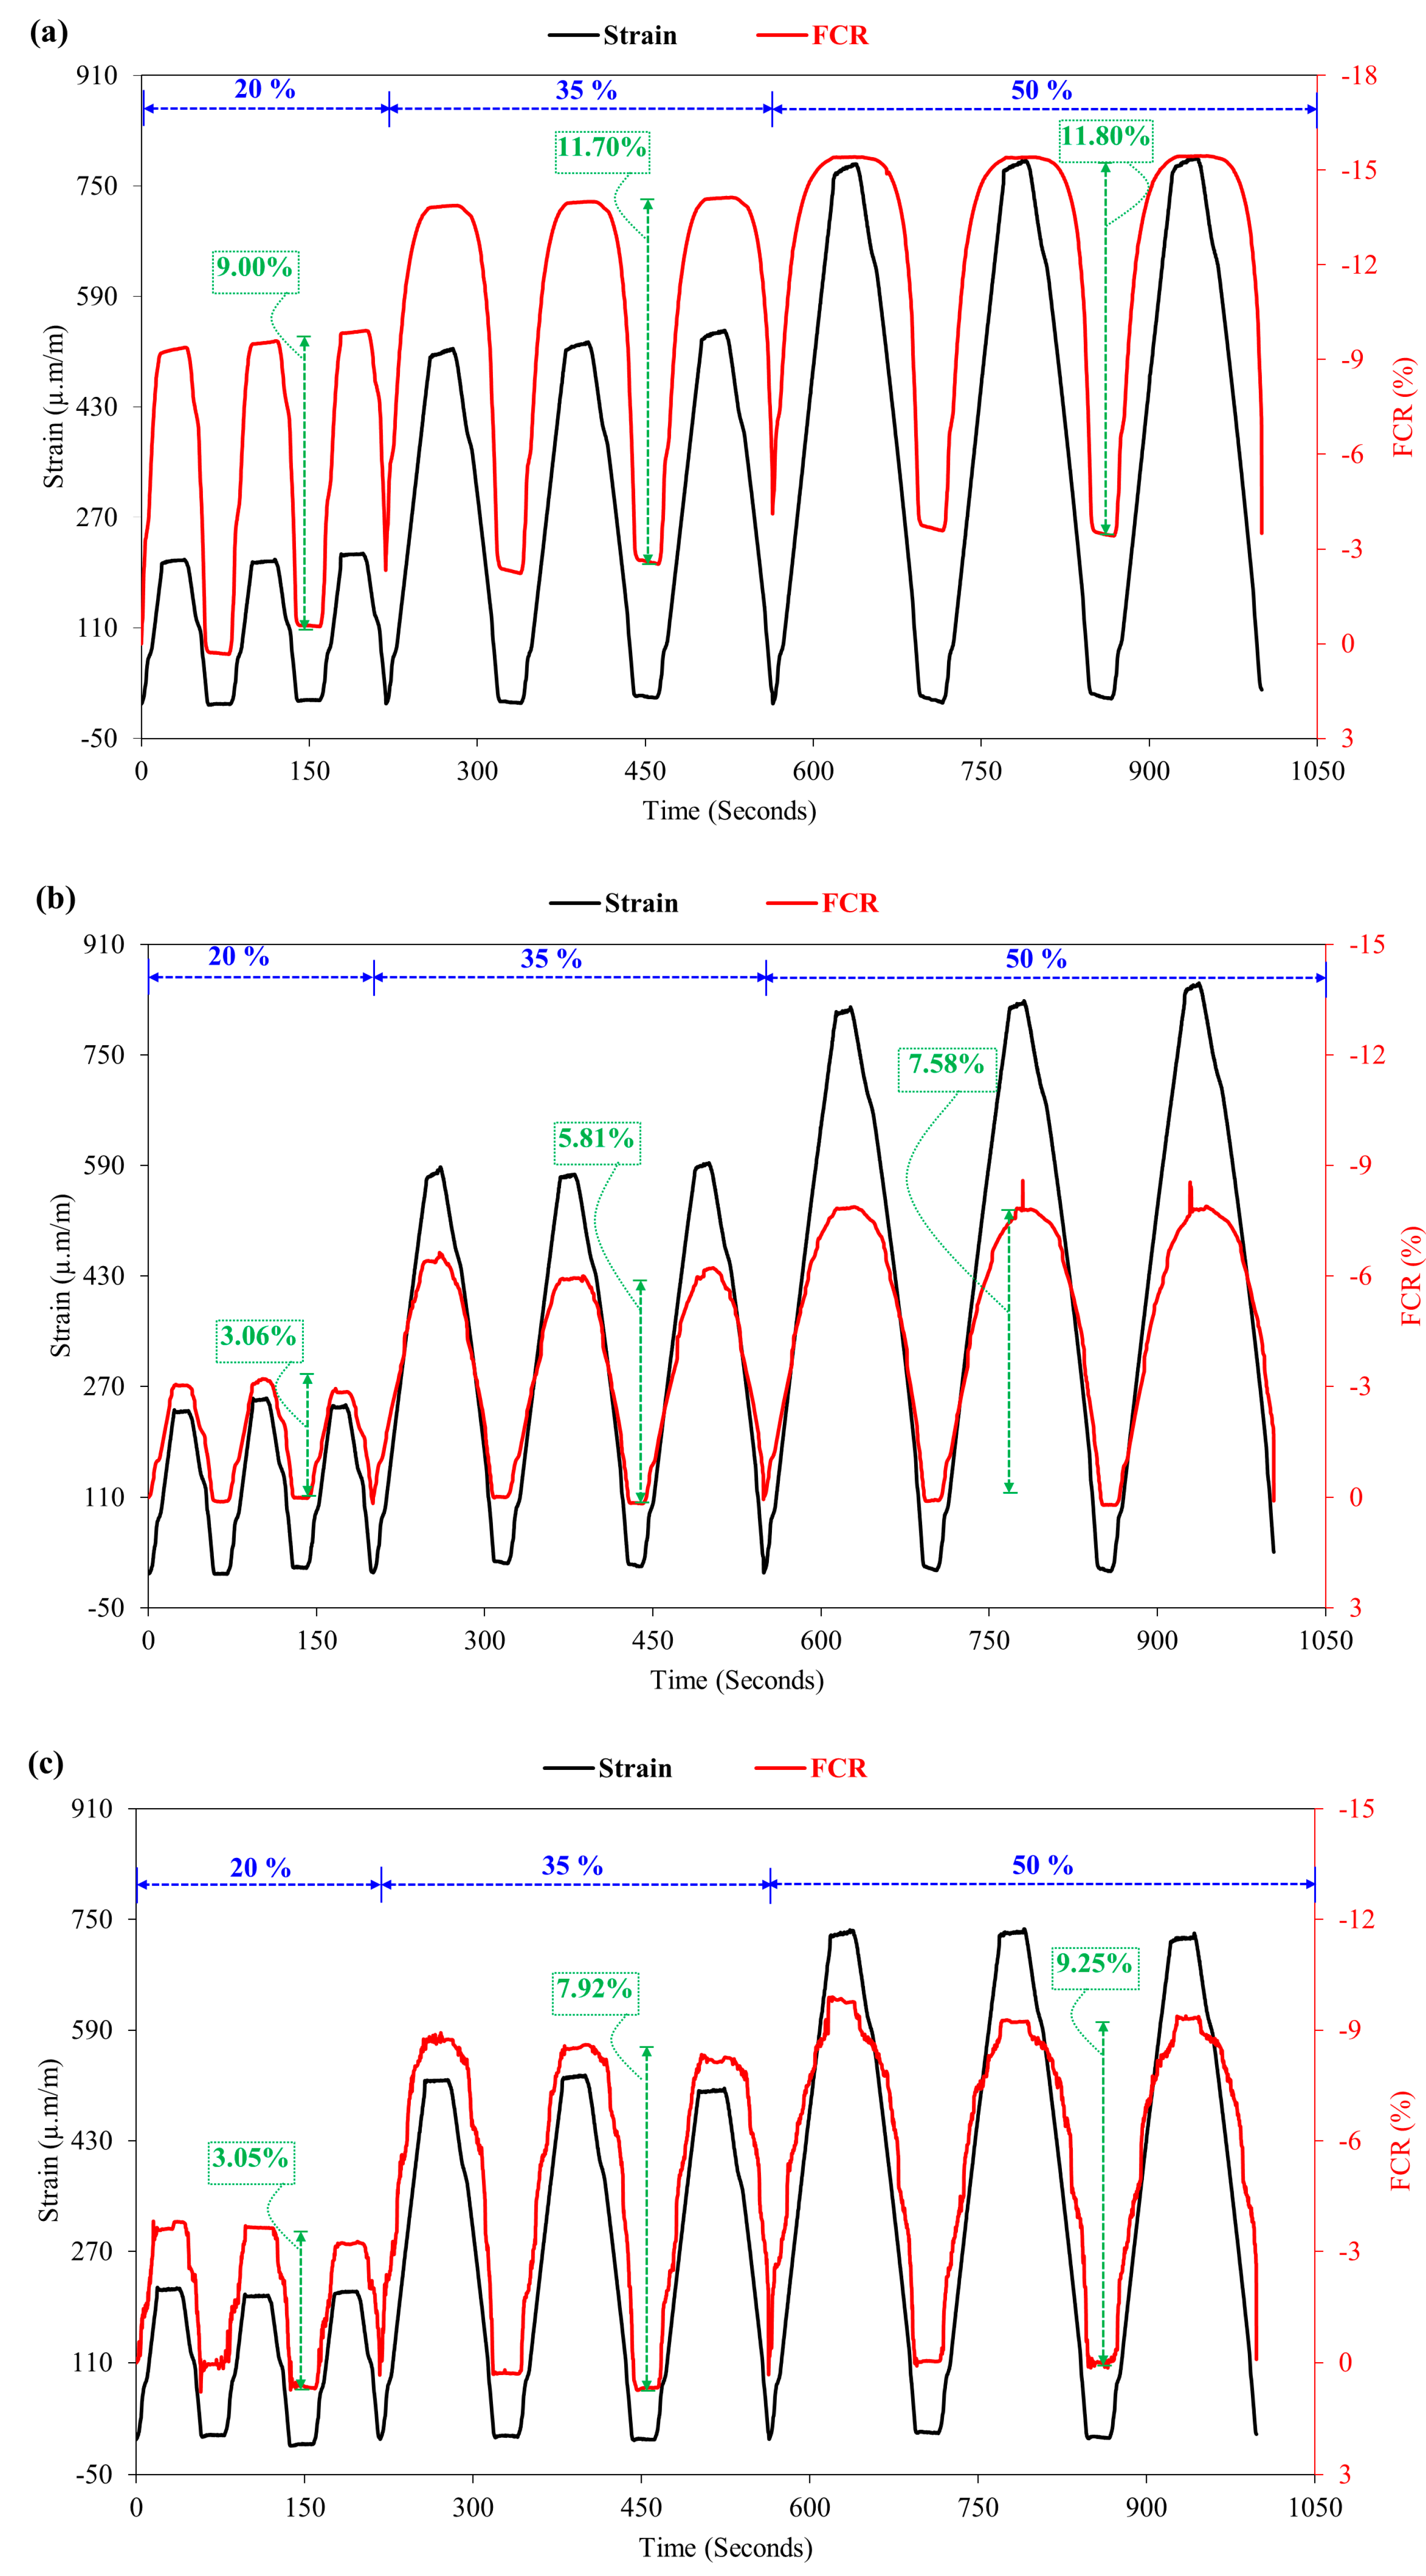
3.1.2. Load versus FCR
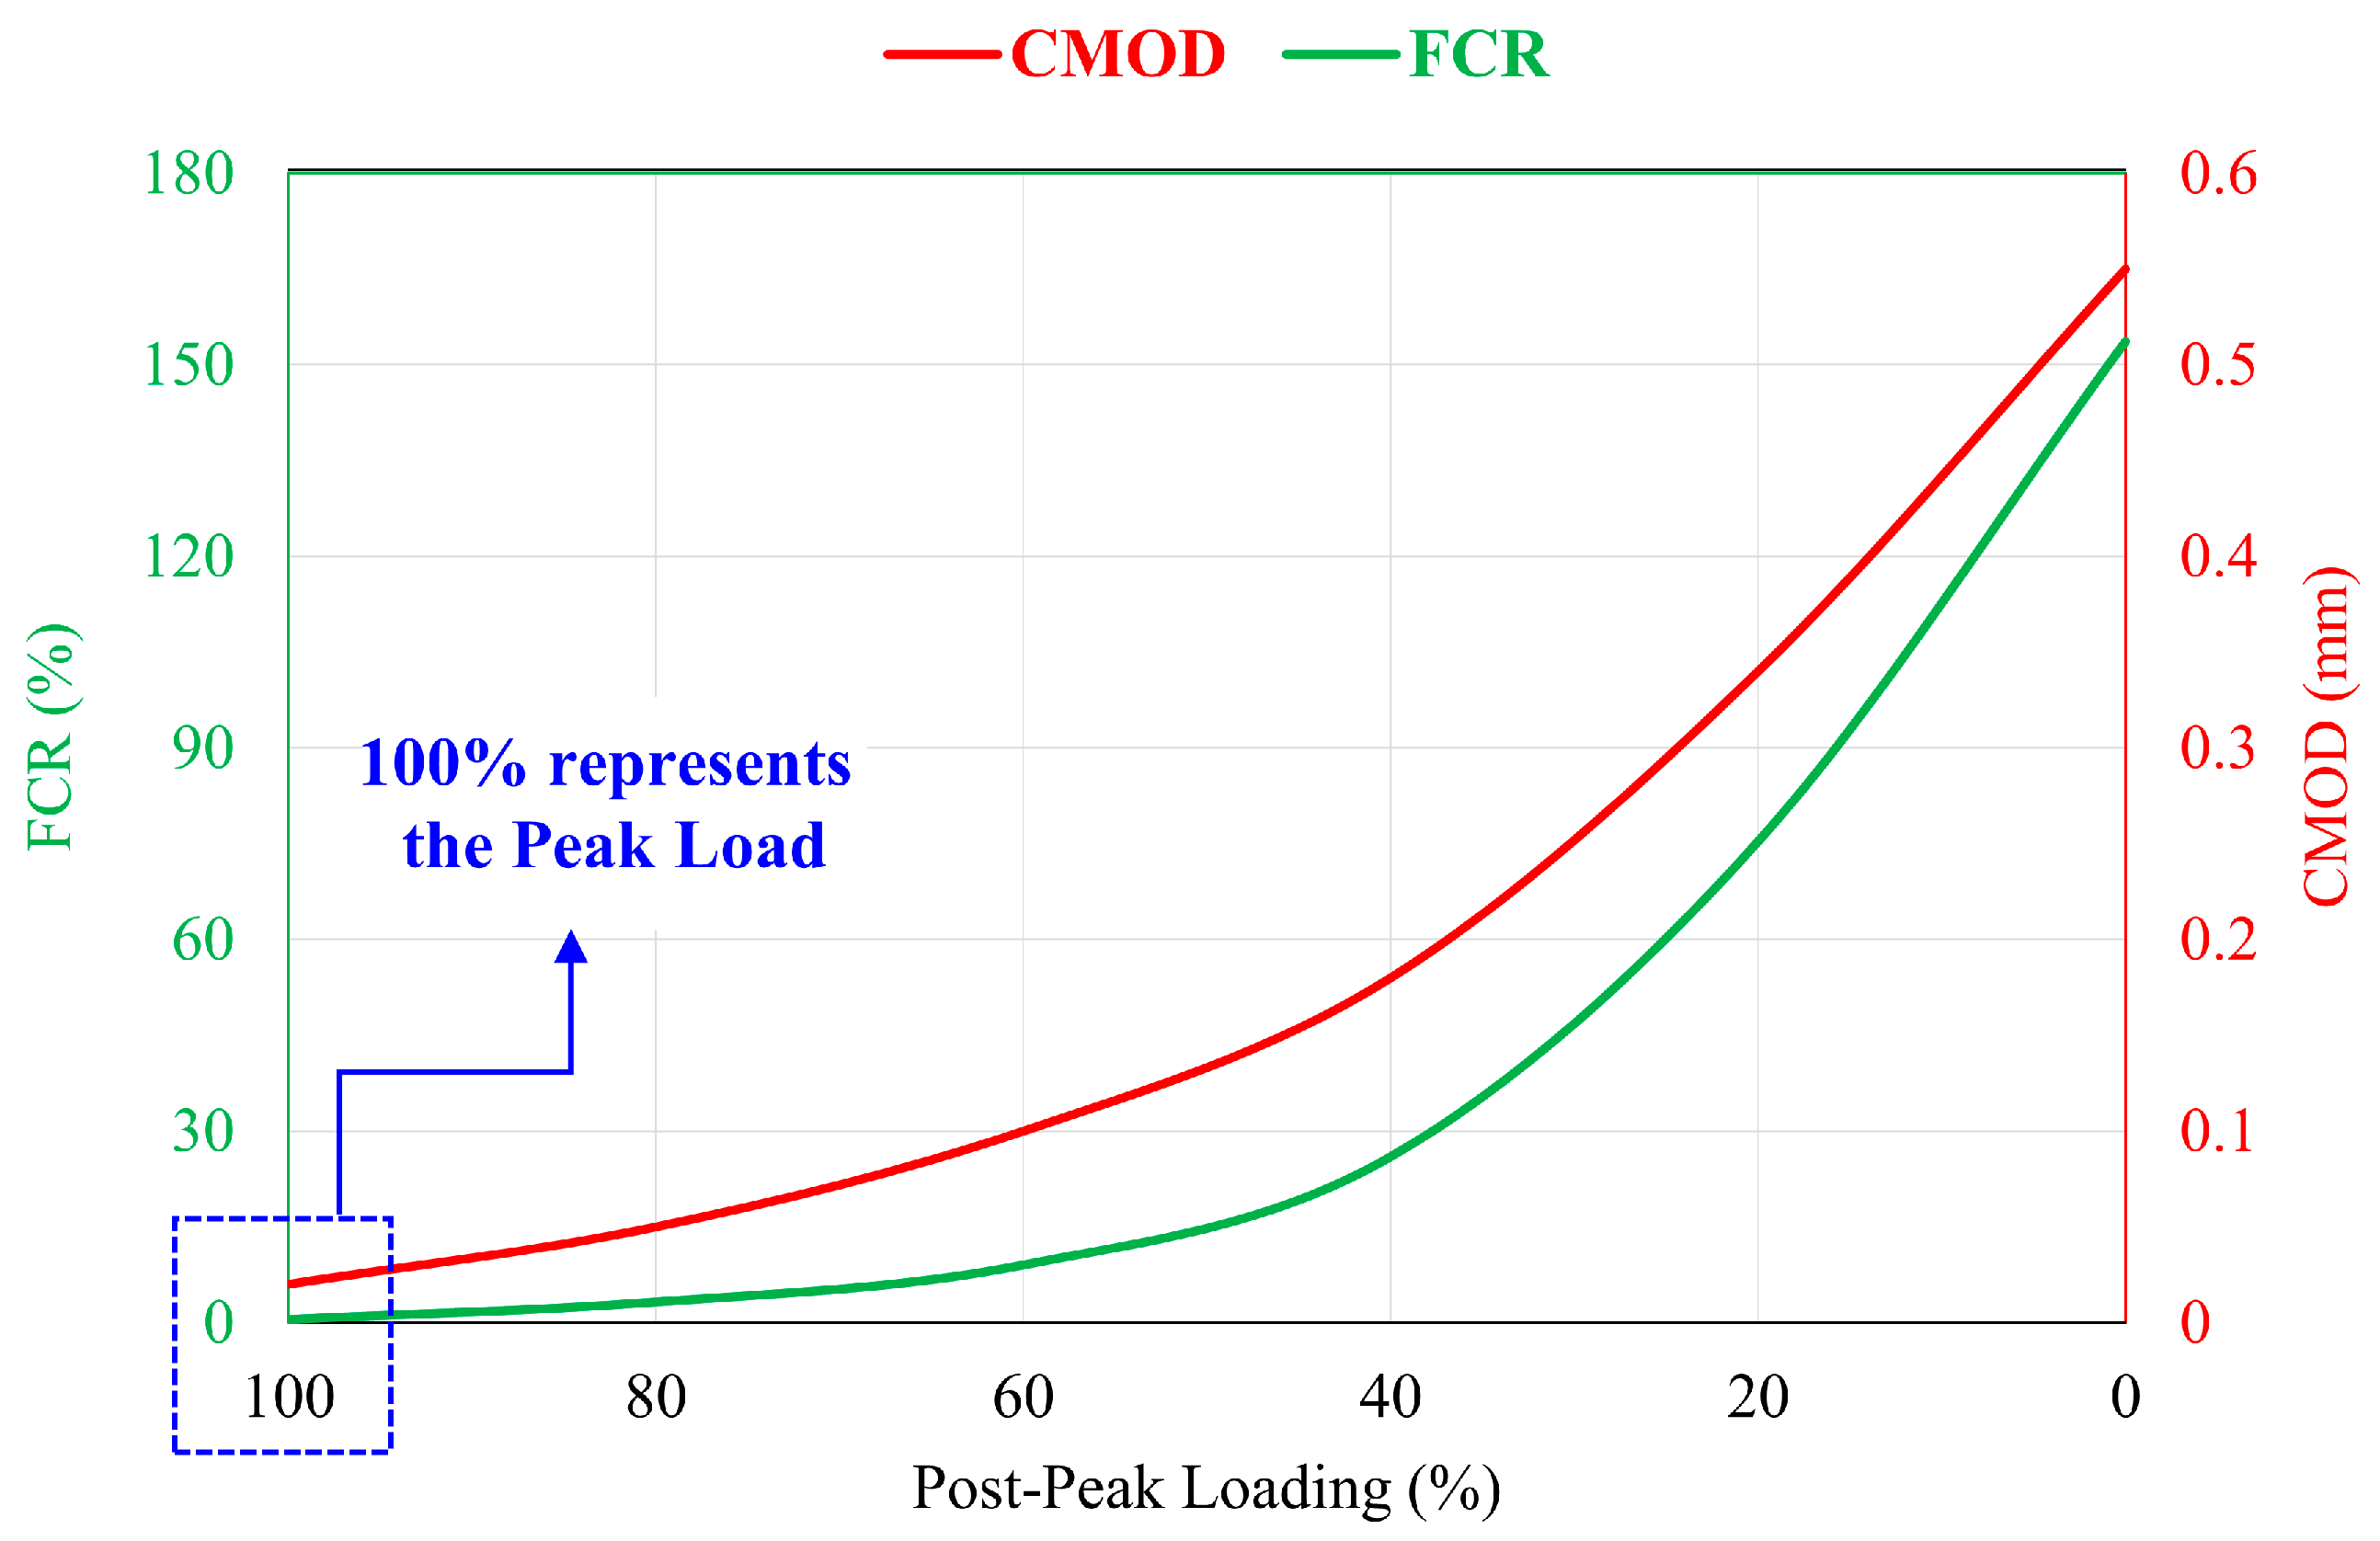
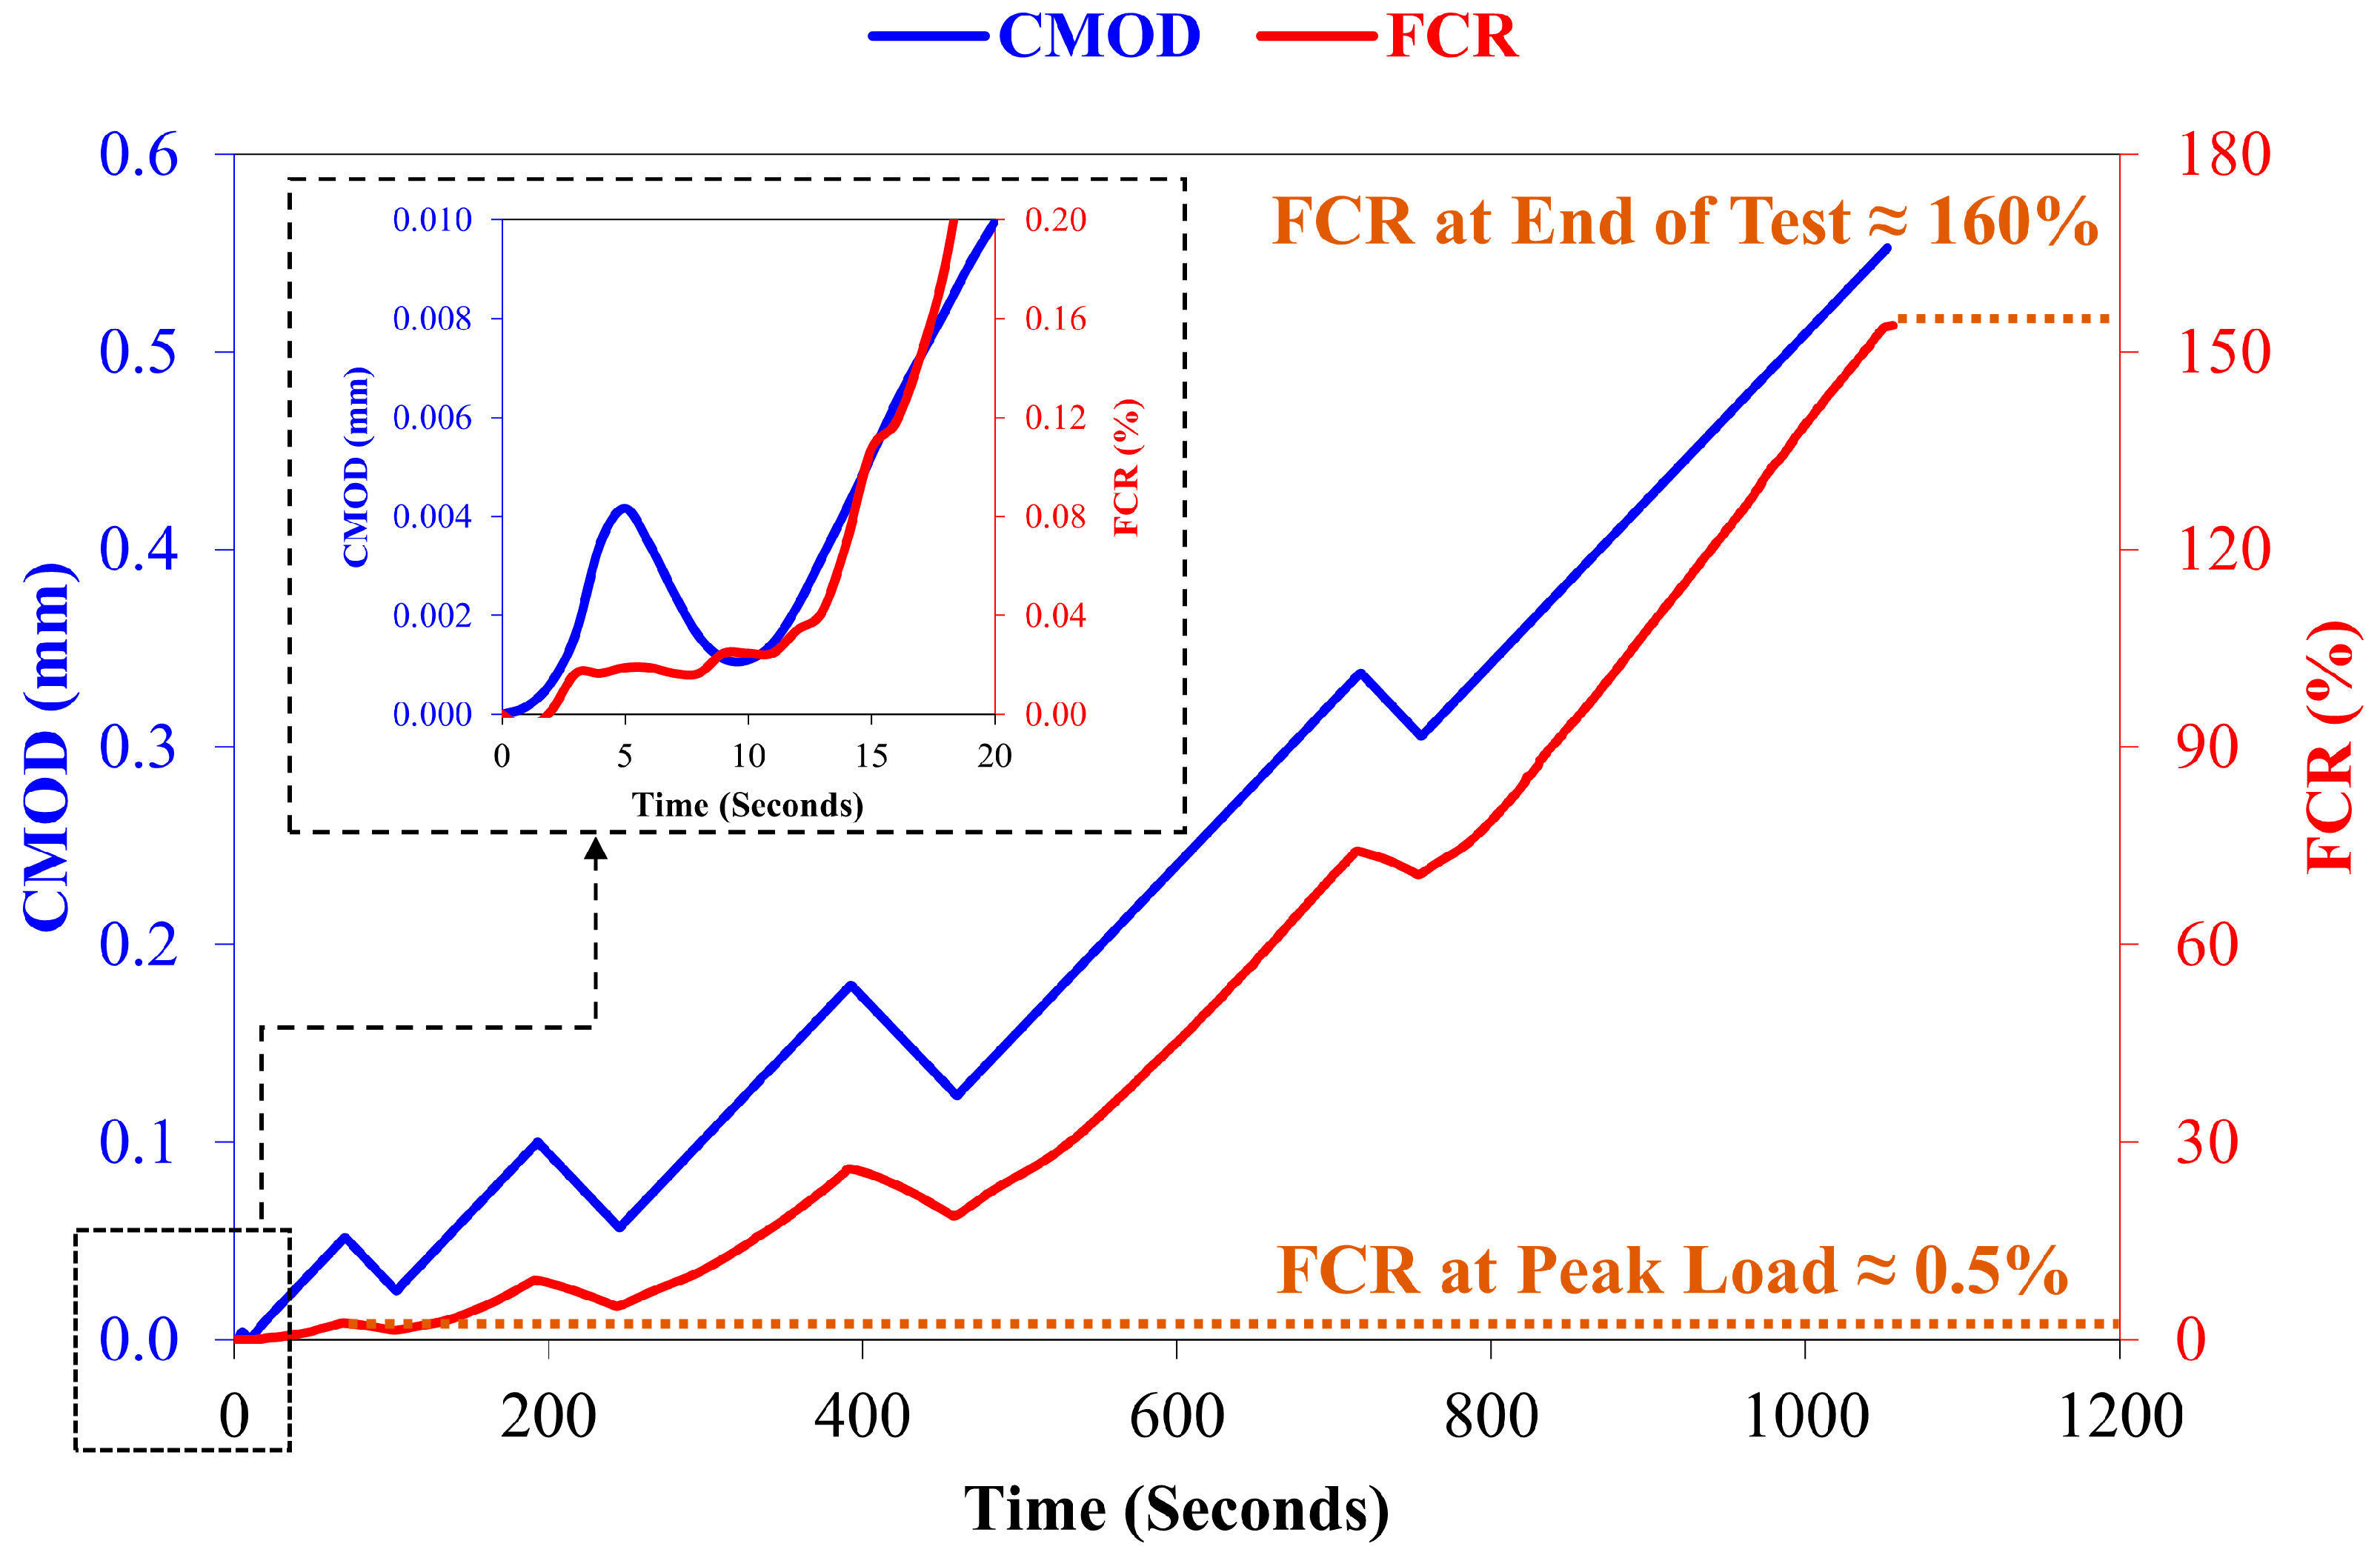
The relationship between the fractional change in electrical resistance (FCR) and the applied load exhibited a similar pattern to the observations seen in the case of the crack mouth opening displacement (CMOD), as visually depicted in Figure 10. With further analysis of the results, Figure 11 illustrates a clear correlation: as the CMOD measurements increased, so did the corresponding FCR values. Conversely, a decrease in CMOD was accompanied by a reduction in FCR.
This interesting relation between FCR and CMOD suggests a correlation between the two factors. Given that the four-point bending cycle test is fundamentally influenced by the CMOD, it follows that the FCR serves as an effective quantitative measure of CMOD variations. The dynamic relationship between these variables implies that changes in CMOD during the testing process are reliably correlated by corresponding to the FCR values, further emphasizing the FCR measurement as an indicator of CMOD fluctuations. This finding demonstrates the potential utility of FCR as a valuable alternative for assessing damage in concrete.
Figure 12 shows the variation of FCR and CMOD at peak load and various loading stages in the post-peak zone. It can be seen that up to the 40% of the post-peak load value, the damage assessed through the clip-gauge sensor is higher when compared to one observed through smart concrete. This can be attributed to the fact that the smart concrete provides an assessment of internal damage, while the clip-gauge sensor provides a damage assessment from a specific external point. These observations provide a convincing overall internal damage assessment of the material using FCR measurements.

3.1.3. CMOD and FCR

Figure 13 shows the damage assessed by a mechanical clip-gauge sensor in terms of CMOD and through the developed smart concrete as represented by FCR. Smart concrete responds to the opening and closing of the crack during loading/unloading cycles by showing the variation in the FCR. The response of the smart concrete (FCR value of <0.04%) at 50% of the flexure strength of the specimen shows that the damage is not initiated in the materials [35]. As the loading proceeds after peak, a softening behavior begins in the material, resulting in the opening of the crack at a greater rate. The same damage has been observed through the FCR. By the end of the test, the FCR had increased from 0.5% at peak load to roughly 160% as shown in Figure 13.

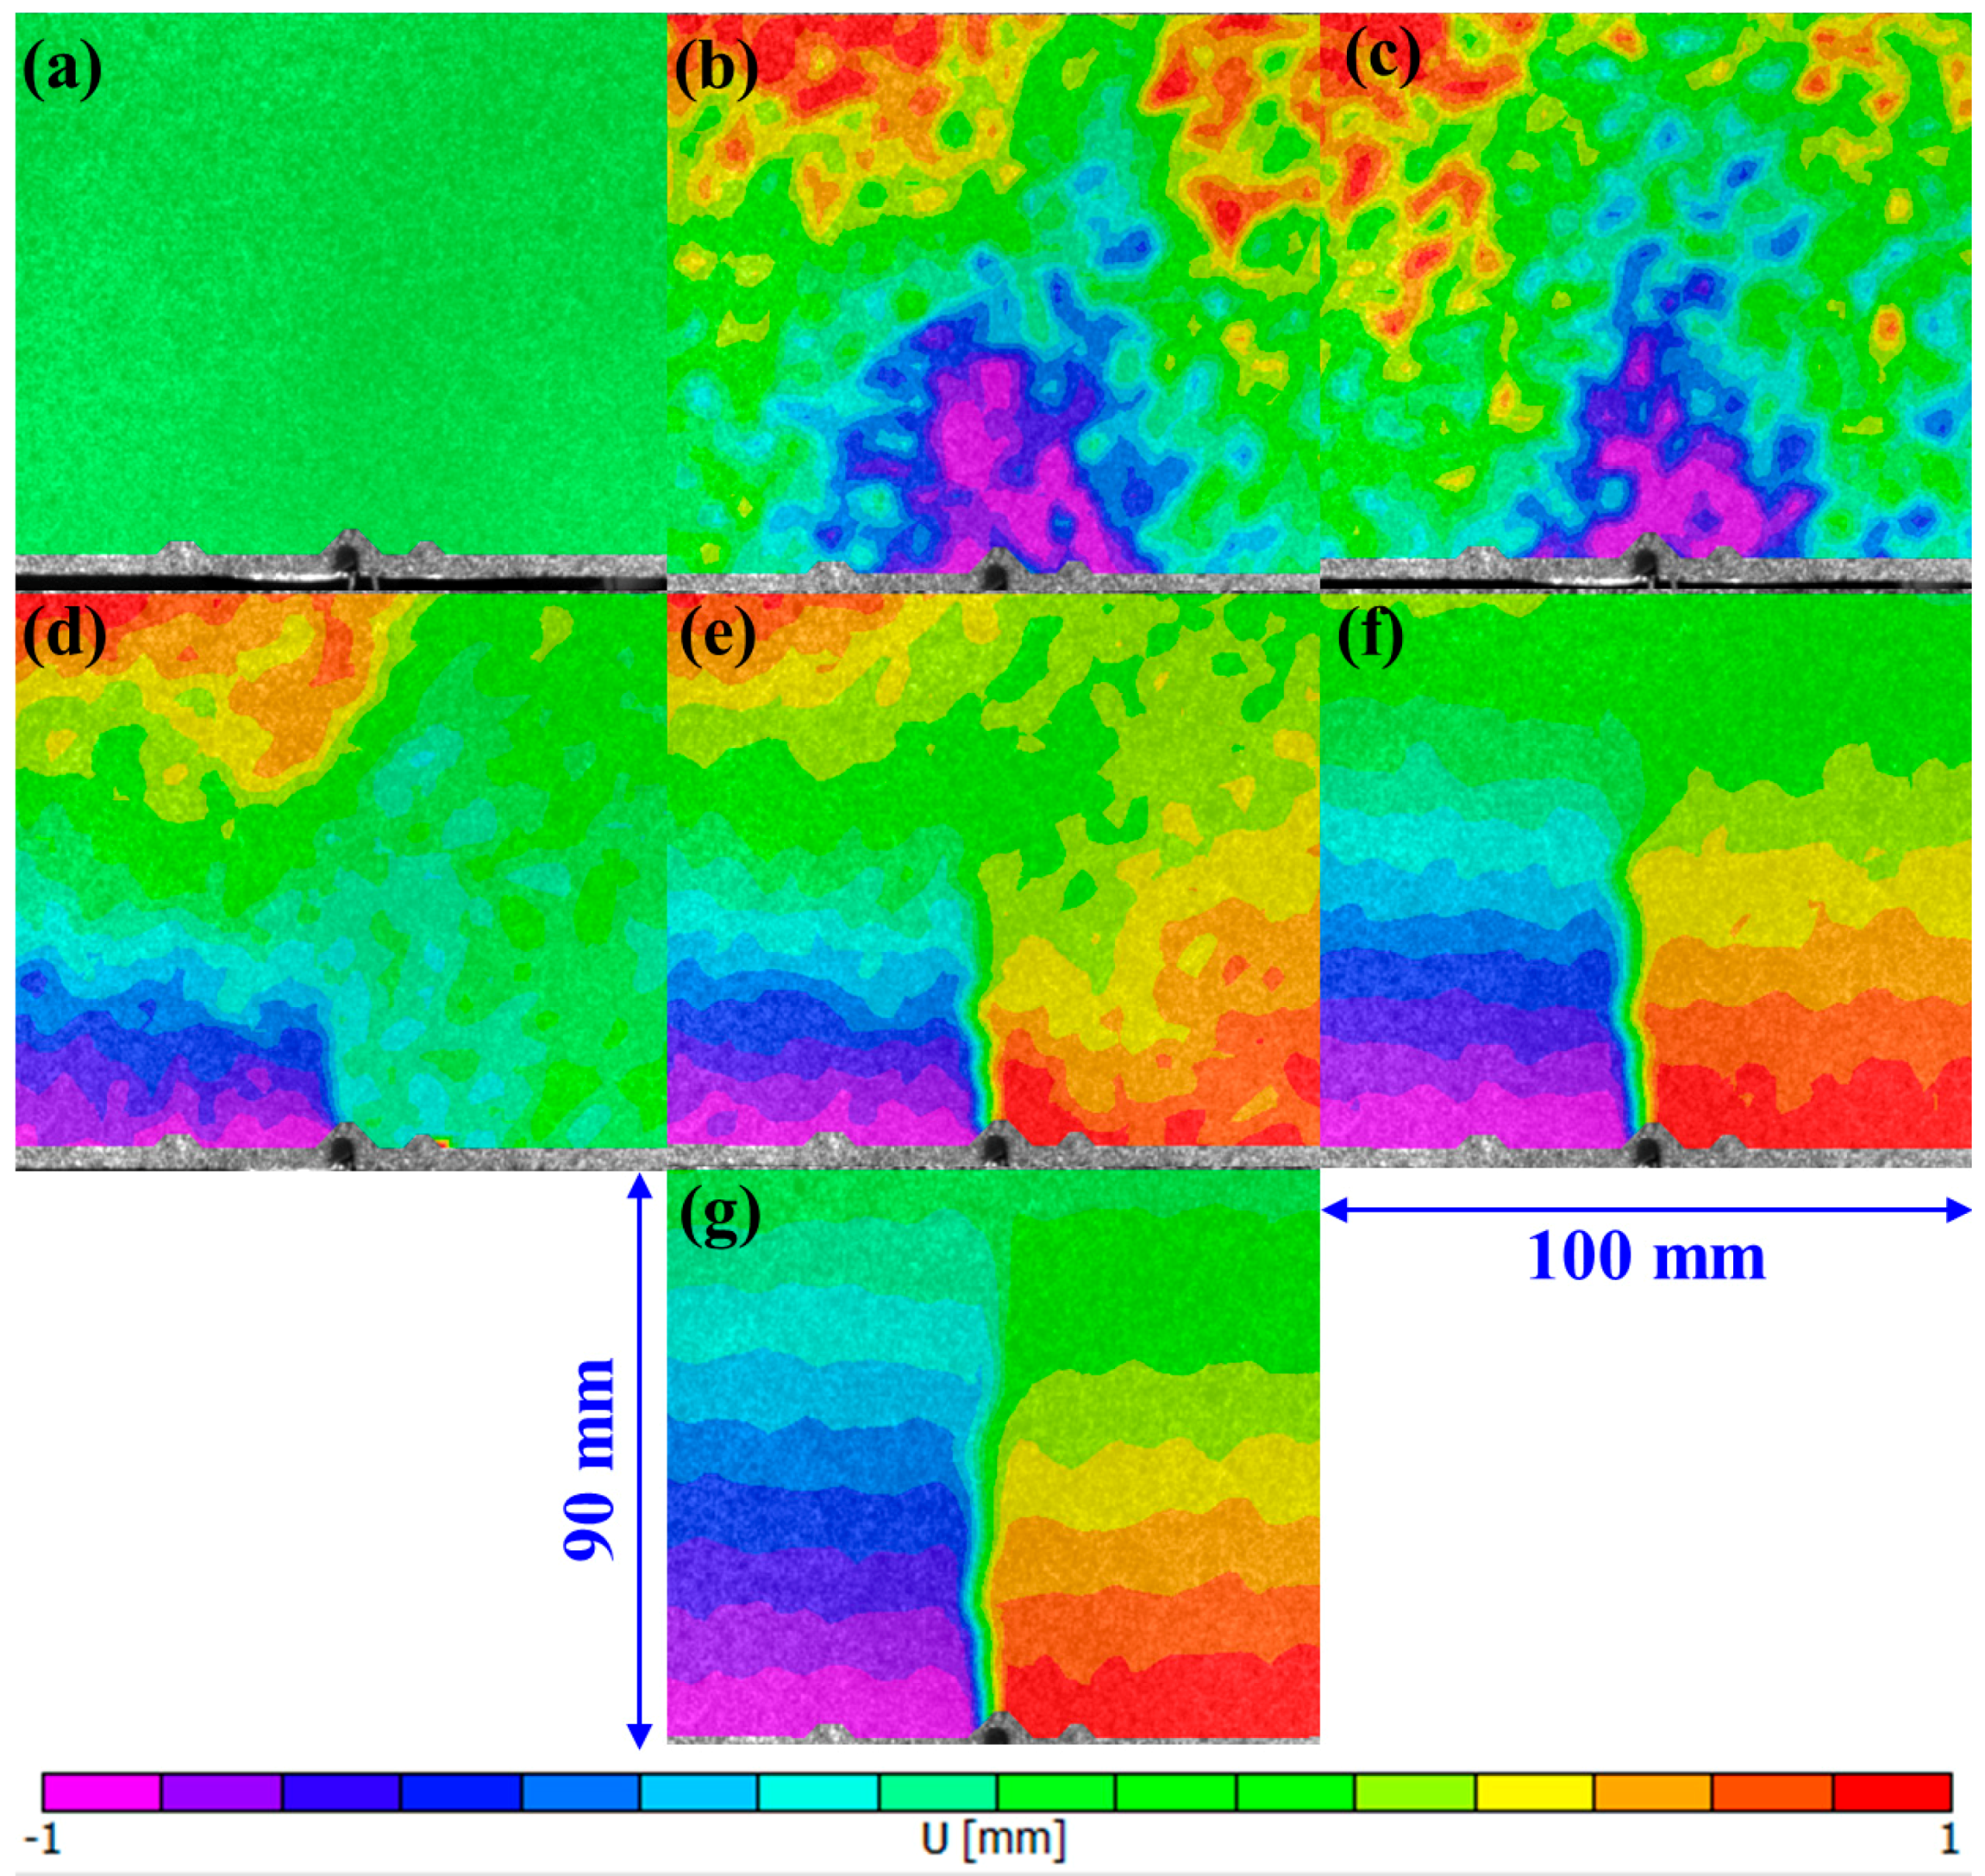
3.1.4. Crack Propagation by DIC

The crack propagation at different loading levels as determined by the DIC method is shown in Figure 14. According to the horizontal axis (U), displacement fields depict the crack’s evolution. The uniform displacement field in Figure 14a indicates that the loading has not yet begun. However, with the start of the test, displacement of each point with respect to the previous conditions starts to change gradually. Figure 14b,c shows the fluctuation in the displacement field to some extent, indicating the minor crack being developed in the beam as the loading progresses. However, as illustrated in Figure 14d–g, the macro-crack propagation can be seen from the displacement fields at 80% of post-peak and beyond.
Horizontal (u-direction) and vertical displacement (v-direction) can be obtained from DIC analysis. However, horizontal displacements are used for the crack propagation and crack length calculations. The crack length can be calculated by defining reference lines along the vertical axis (v-axis) on the digital image under observation [36] as shown in Figure 15. The first reference line (v0) is defined at the tip of the notch and all other reference lines (v1, v2, v3, …, vn) are defined parallel to the horizontal axis. The displacement of the points across the face of crack along the reference line across the crack propagation is calculated and length of the crack is evaluated. Displacement of the reference line shows continuity along the horizontal axis as long as the crack does not cross it. As soon as the crack crosses the reference line, discontinuity in the displacement across the faces of crack is observed, indicating the propagation of the crack from the reference line under investigation. The accuracy of the crack propagation depends on the density of the reference lines. In this study, reference lines are defined at a 5 mm distance from each other.
Figure 16 shows the crack length obtained by DIC analysis of digital images. For comparison, FCR and load are also plotted on the same graph. DIC analysis shows the development of minor cracks when the load reaches 50% of the flexure strength of the materials. A similar indication of damage was observed through the self-sensing response of the smart concrete (smaller value of FCR). A significant increase in the damage was observed after the peak in the softening zone of the material, as indicated through DIC analysis and FCR measurements. However, the increase in the FCR is sharp, beyond 40% of the post-peak. This could be due to the incomplete opening of the crack internally, due to which the current is flowing because of the presence of the conductive materials. However, this is at the face of beam even though the crack is developed and detected by DIC. Therefore, one can say that the monitoring method based on the FCR measurements provides an indication of the internal damage as compared to the surface damages obtained through other techniques such as DIC or strain gauges.

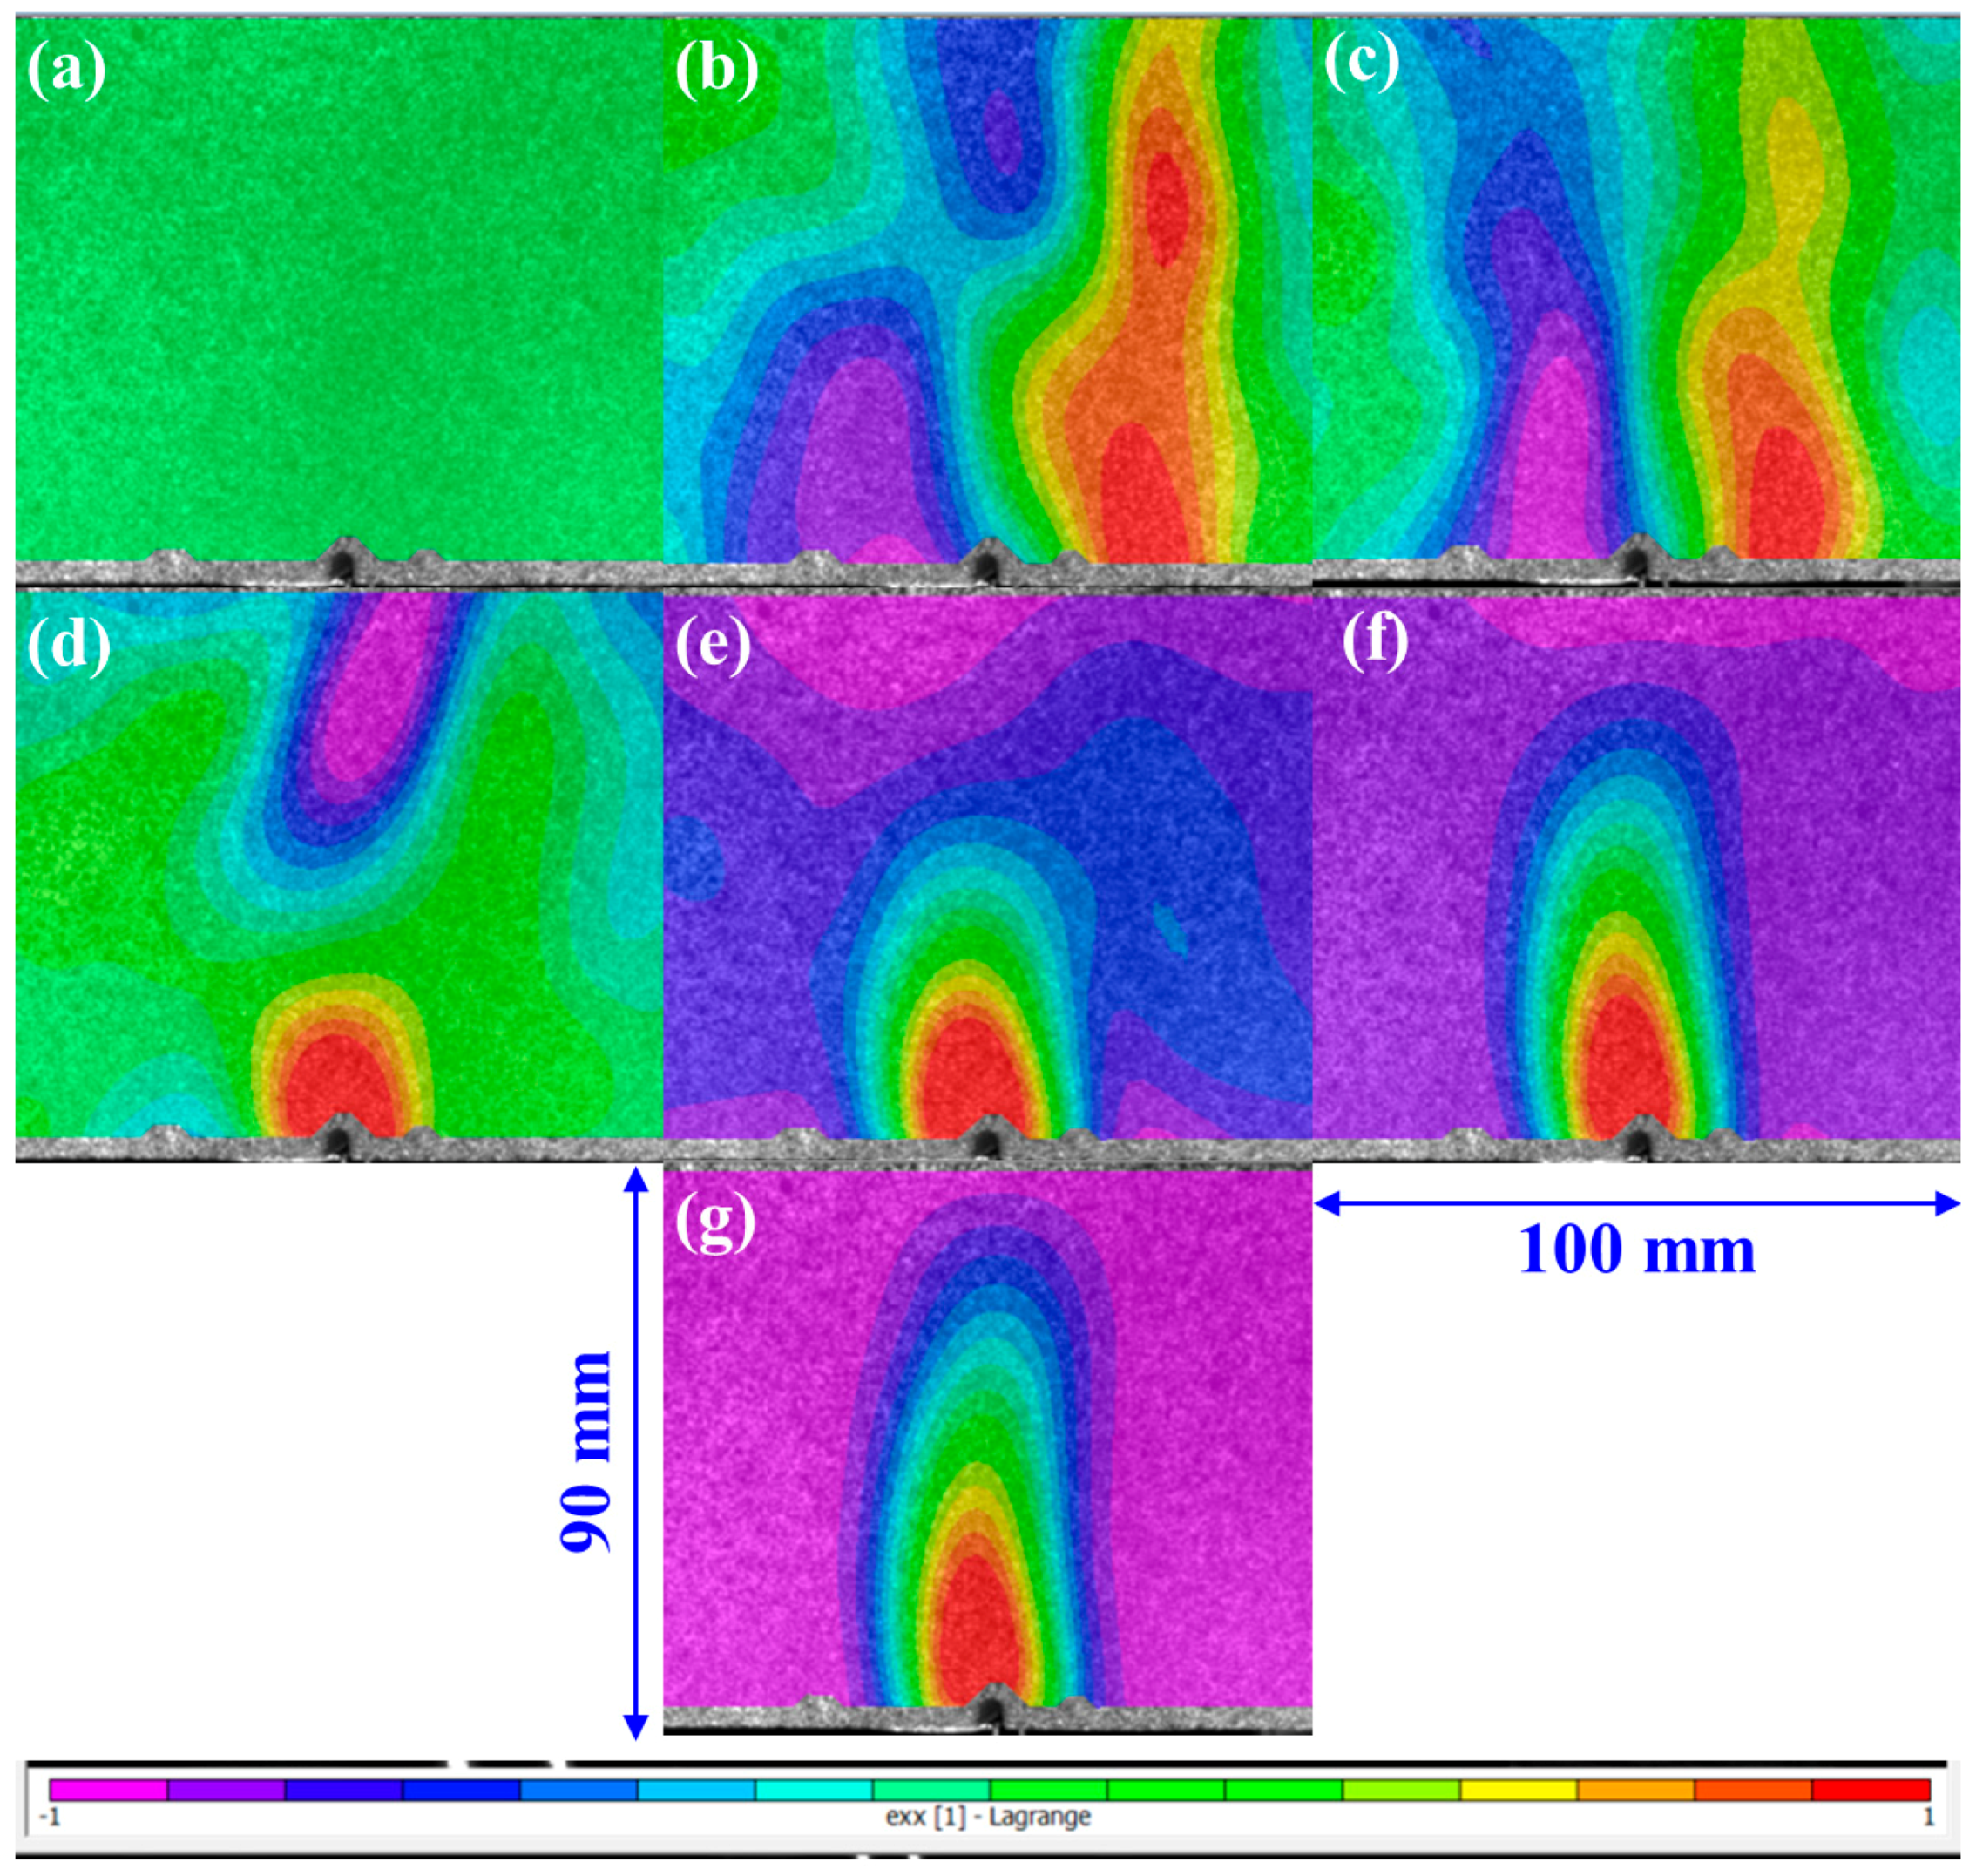
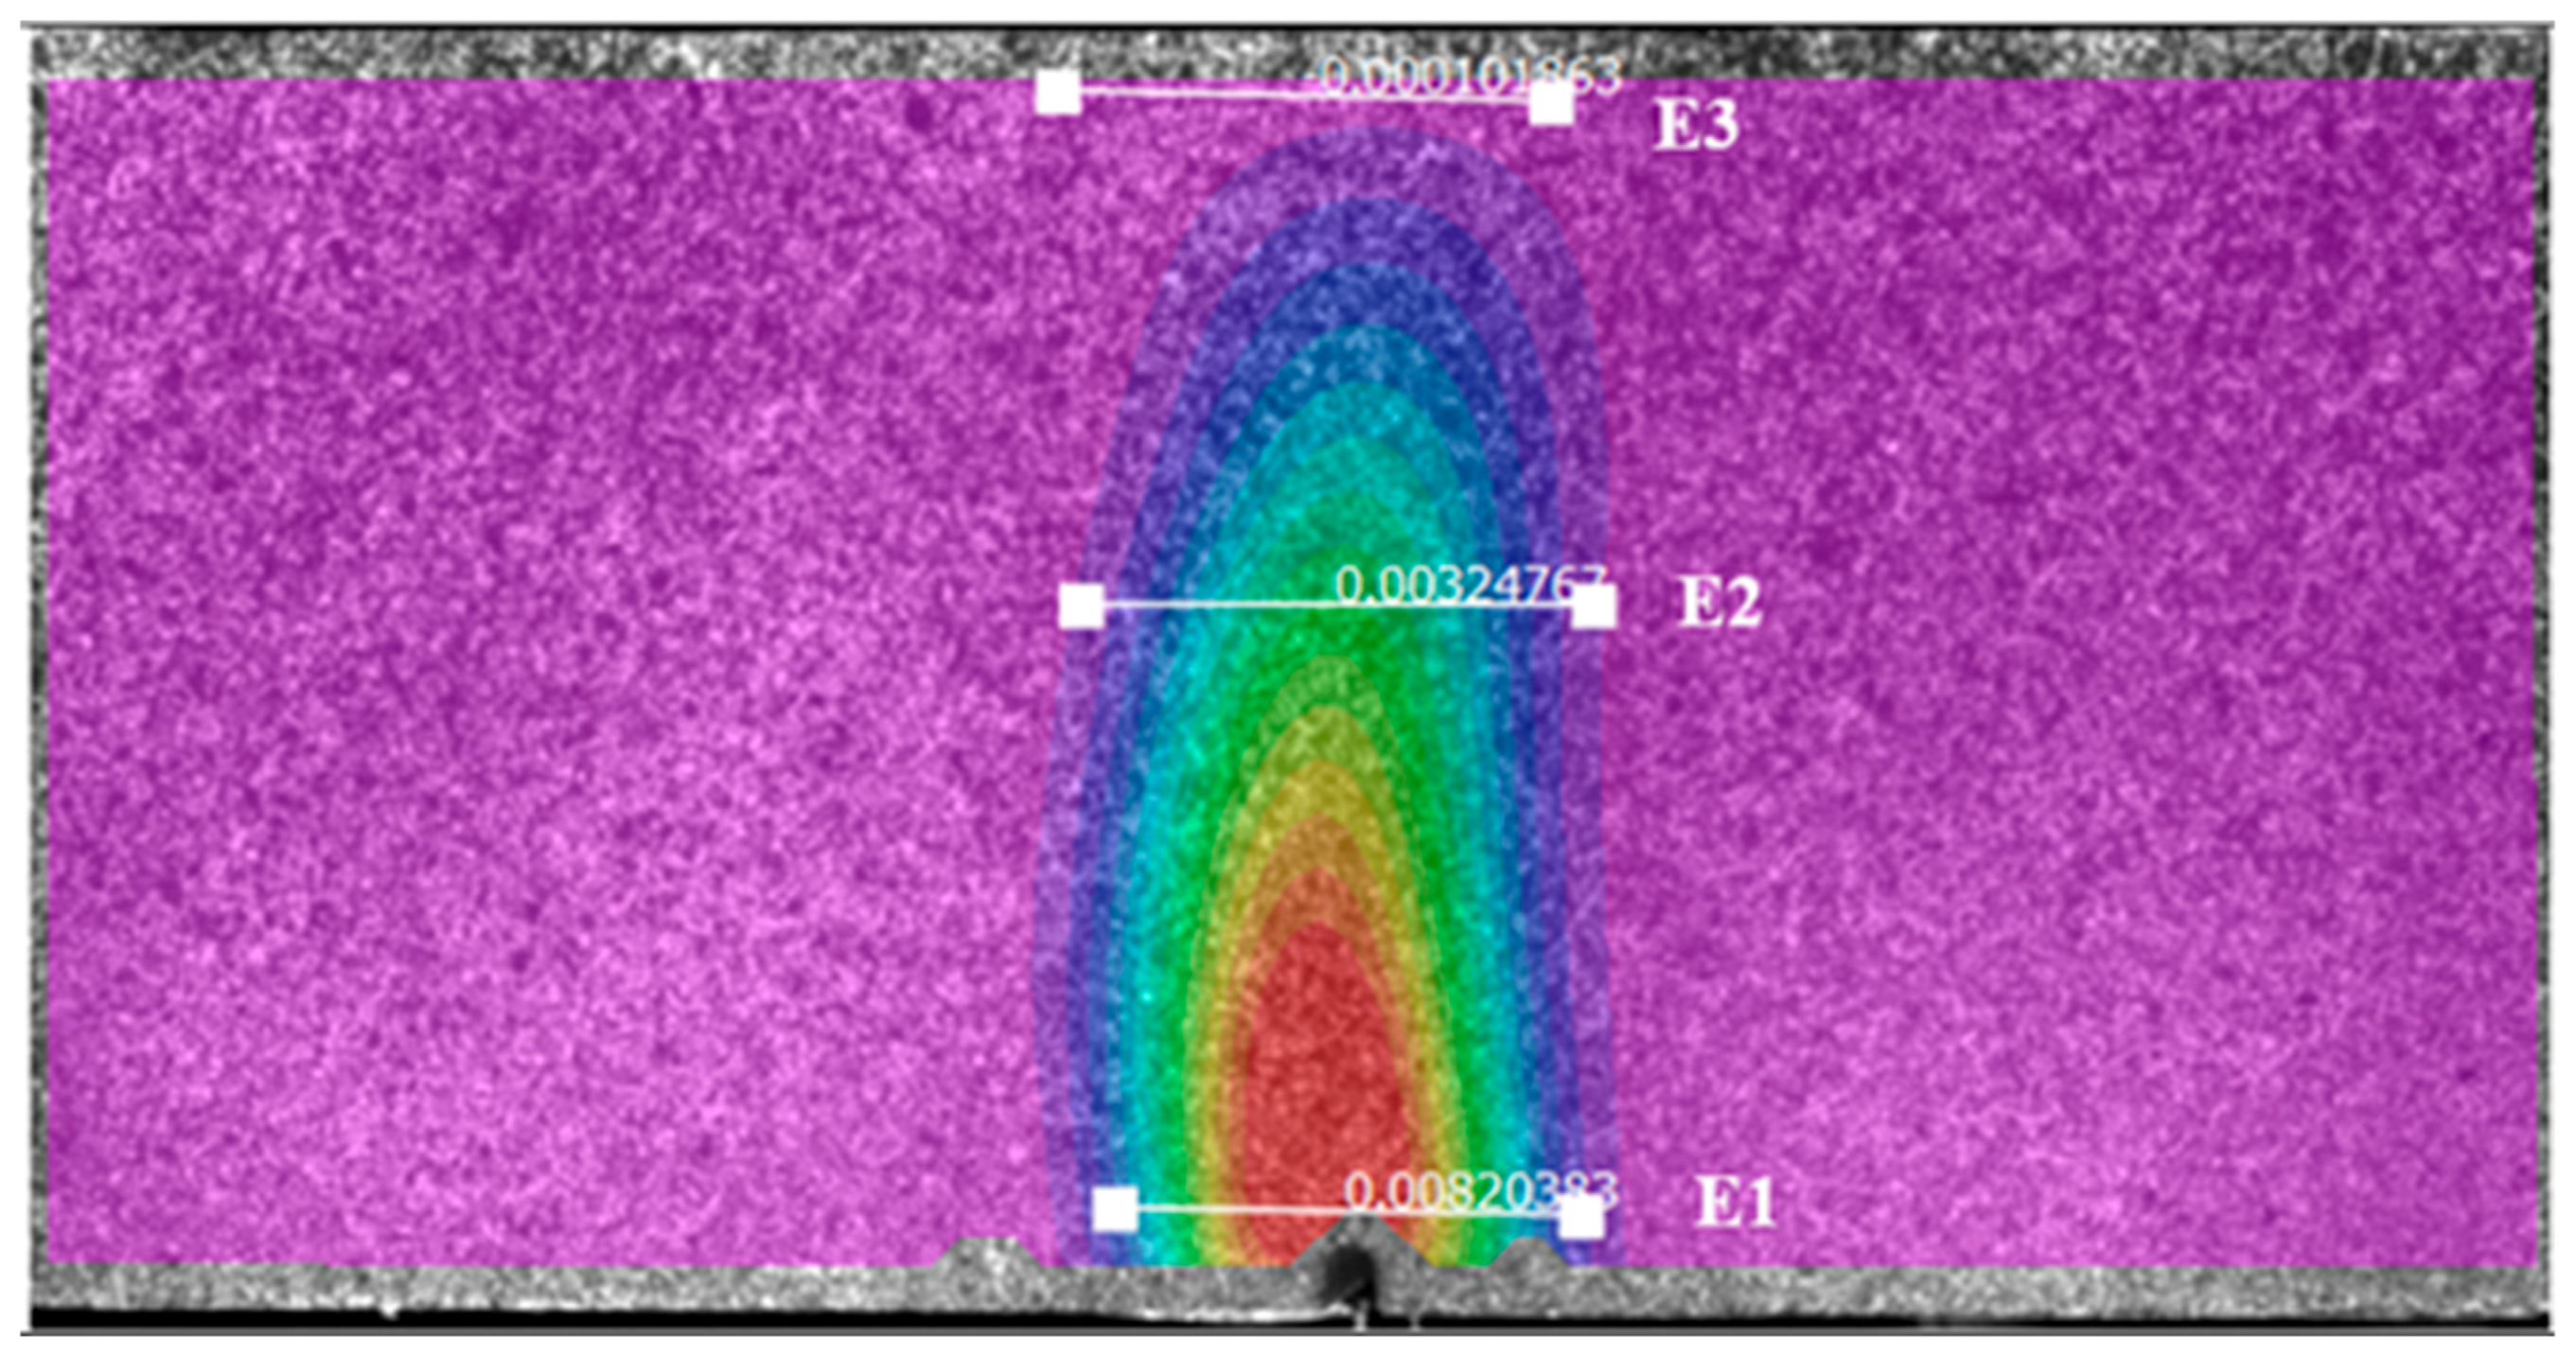
3.1.5. Evolution of Strain by DIC

Figure 17 shows the strain fields of concrete specimens by DIC analysis at different loading cycles as shown in Figure 6. Figure 17a shows that the uniform strain field distribution corresponds to the state of pre-loading. Figure 17b shows the strain field distribution in the AOI when the load reaches 50% of the peak in the pre-peak zone. Similar fields of distribution can be observed when the load reaches the maximum capacity of the beam, as shown in Figure 17c. A random distribution of strain fields on the surface under investigation as well as near the tip of crack can be observed until the peak of the load is reached. A random distribution of the strain field shows that concrete is an heterogenous material, including various flaws like pores and micro-cracks during the aging of concrete specimens. With the further increase in the load beyond peak, random distributed strain fields start to decrease gradually and move towards the crack tip where stress intensity is high, as shown in Figure 17d–g. The fracture process zone (FPZ) is also observed, indicated by a positive value of strain field across the crack propagation while the remaining area of AOI shows a negative strain field.
Artificial extensometers were defined at the bottom, middle, and top of the beam, perpendicular to the direction of crack propagation to monitor the opening of the crack as shown in Figure 18. Elongation (D1) in each extensometer was measured by the post-treatment processing of the images.
Figure 19 shows the variation in D1 with time for each extensometer as well as FCR with time. It can be seen that maximum elongation is observed at the tip of the notch, indicating the maximum opening at this location. With the propagation of the crack, the crack width starts to reduce towards the top of the beam, where the width of the crack is negligible as indicated by the D1 in the extensometer (E3). However, it can also be stated that DIC results are in line with FCR. Therefore, the response of smart concrete in terms of FCR against the loading can be used to analyze the damage, opening of the crack, and propagation of the crack.

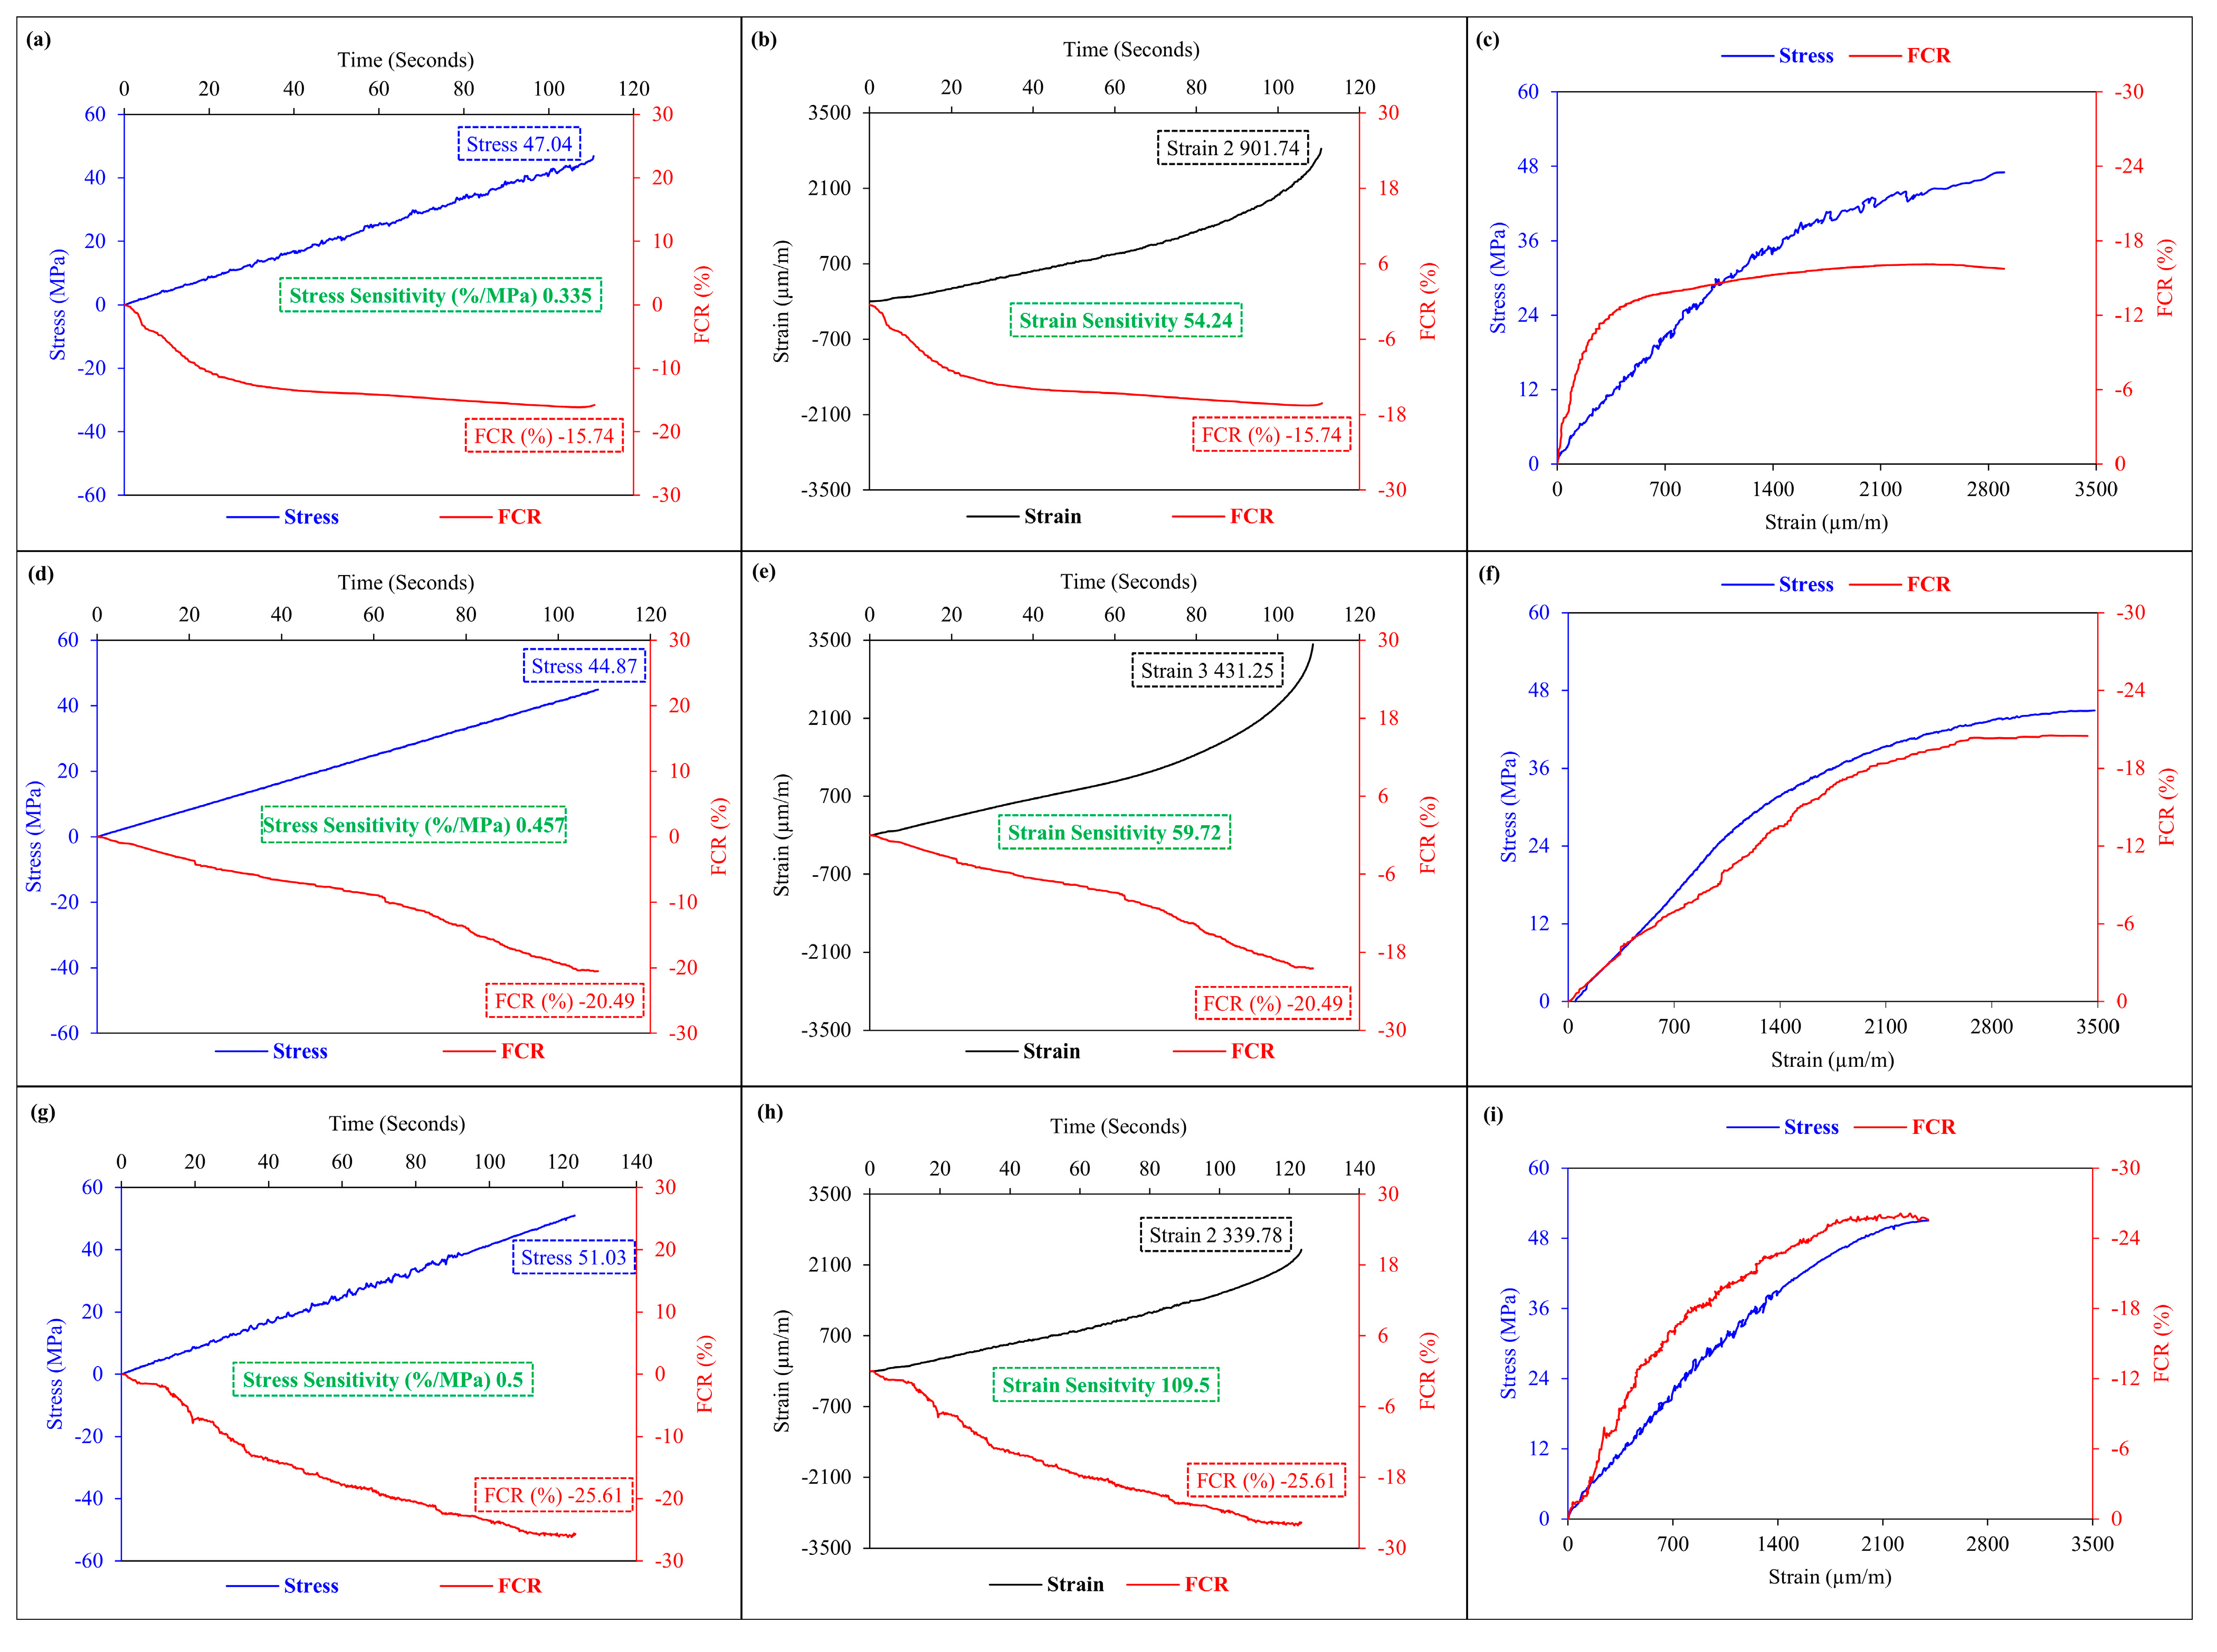
3.2. Compressive Test

The investigation explores the relation between compressive strain and the fractional change in electrical resistance (FCR) by applying cyclic compressive stresses, specifically targeting stress levels at 20%, 35%, and 50% of the compressive strength. These experiments enclosed different specimens, denoted as C1, C2, and C3, characterized by varying degrees of saturation. The comprehensive results visualized in Figure 20 provide the relationship between FCR and compressive strain across these different stress levels.
Figure 21 shows the results obtained through the application of sustained loading, each lasting 20 s, at the peak of every cycle. From Figure 20a, it is depicted that the variation in FCR is same around 9–11%, with a minor difference irrespective of stress level for the saturated specimen (C1). This shows that at the stress level of 20%, the conductive path for the conduction becomes saturated and beyond the 20% of the stress level, the FCR trend becomes non-linear indicating no further variation in FCR as explained by Wang et al. [37] Moreover, with the increase in stress beyond 20%, there is a permanent increase in the FCR at pre-load stage indicating the disturbance of the conductive path [37].
The distinctive characteristics of the C1 specimen, attributed to its higher moisture content, contribute to this behavior. At the 20% stress level, the presence of abundant moisture effectively fills the gaps between moisture content or carbon nanotubes (CNT), resulting in the attainment of maximum conduction capacity. Subsequent increments in stress levels do not improve conduction further. However, as moisture content decreases in the C2 and C3 conditions, the voids between moisture content and CNT expand due to moisture loss, yielding a linear FCR trend closely aligned with compressive strain. Remarkably, when subjected to higher stress levels, inconsistencies observed in FCR responses during each loading cycle signify sustained damage affecting the conductive paths.
As moisture content decreases, the sensitivity of the FCR response is also reduced, underscoring the influence of moisture content on the sensitivity of smart concrete. Nonetheless, this decreasing sensitivity aligns linearly with strain variation, as depicted in Figure 22f,i. In essence, this detailed analysis demonstrates the relation between FCR, compressive strain, and moisture content. The experimental evidence highlights the critical role of moisture content in influencing conductive behavior, while stress-induced disruptions further underline the correlation between these factors.
The sensitivity of the concrete can be determined using force sensitivity, stress sensitivity, or strain sensitivity. In order to perform quantitative analysis of the sensitivity of the smart concrete, stress and strain sensitivity parameters were calculated according to the previous research [38,39,40,41,42] at various degrees of saturation in a monotonic compression test. Stress sensitivity is defined as the fractional change in the electrical resistance per unit of the applied compressive stress. Strain sensitivity is defined as the fractional change in the electrical resistance per unit of the strain. The following are the relations which have been used for the calculations of stress and strain sensitivity.
S t r e s s s e n s i t i v i t y = F C R C o m p r e s s i v e s t r e n g t h
S t r a i n s e n s i t i v i t y = F C R C o m p r e s s i v e s t r a i n
where FCR is the fractional change in electrical resistance at the failure of the material, compressive stress is the failure stress or compressive strength of the material, and compressive strain is the strain at the failure of the specimen. Stress sensitivity is measured in%/MPa, while strain sensitivity has no unit.
Figure 22 shows the stress and strain sensitivity with respect to FCR under monotonic loading to failure for various degrees of saturation. From Figure 22, it can be seen that with the decrease in moisture content FCR is increased, and an improvement in the stress and strain sensitivities was observed, as can be observed from Table 3. Linearity of the FCR is directly linked with the degree of saturation of the specimen as can be seen in Figure 22c,f,i.

4. Conclusions

This study conducted a detailed and comprehensive experimental investigation to evaluate the damage and piezoresistive characteristics of smart concrete, which was enhanced with the incorporation of conductive MWCNTs. Analysis of the results yielded the following conclusions.
The results obtained from concrete beam specimens demonstrated that the FCR measurements proficiently tracked crack propagation. A strong correlation was established between the mechanically assessed CMOD and FCR at distinct loading phases. The viability of FCR to assess damage in smart concrete under various loading conditions was evident. In addition to FCR and CMOD, the digital image correlation (DIC) technique was employed to analyze crack development during different loading cycles. However, disparities were noted between crack length calculations derived from DIC data and the material’s FCR response. This inconsistency was attributed to variances between surface-based crack measurements using DIC and the internal damage evaluation facilitated by FCR. It can be elaborated on by the fact that the material was not damaged enough internally, due to which electrical conduction is high, as indicated by lower value of FCR. Subsequently, as cracks extended further, an increase in FCR variation was observed, an indication of the widening discontinuities among conductive pathways, thereby reflecting increased internal material damage.
In the context of cyclic compressive testing, a substantial influence of the degree of saturation on piezoresistive behavior was established. The saturated conditions led to a non-linear correlation between FCR and mechanical strain, stabilizing beyond a stress threshold of 20 to 50%. Conversely, specimens exhibiting less than 100% saturation displayed a linear FCR response to mechanical strain. Notably, the specimens subjected to “C3” saturation conditions exhibited higher sensitivity in terms of stress and strain responses, highlighting superior sensing capabilities during cyclic and monotonic loading until failure.

Author Contributions

Conceptualization, S.S. and A.T. (Ahmed Toumi); methodology, A.T. (Anaclet Turatsinze); software, S.S.; validation, J.-P.B., A.T. (Ahmed Toumi) and A.T. (Anaclet Turatsinze); formal analysis, S.S.; investigation, A.T. (Anaclet Turatsinze); resources, J.-P.B.; data curation, A.T. (Anclet Turatsinze); writing—original draft preparation, S.S.; writing—review and editing, A.T. (Ahmed Toumi); visualization, J.-P.B.; supervision, J.-P.B.; project administration, A.T. (Anaclet Turatsinze); funding acquisition, S.S. All authors have read and agreed to the published version of the manuscript.

Funding

This research received no external funding.

Data Availability Statement

All the relevant data are contained within the article.

Conflicts of Interest

The authors declare no conflict of interest.

References

  1. Preciado, A.; Peña, F.; Fonseca, F.C.; Silva, C. Damage description and schematic crack propagation in Colonial Churches and old masonry buildings by the 2017 Puebla-Morelos earthquakes (Mw = 8.2 and 7.1). Eng. Fail. Anal. 2022, 141, 106706. [Google Scholar] [CrossRef]
  2. Qin, D.; Gao, P.; Aslam, F.; Sufian, M.; Abdul-Jabbar, H. A comprehensive review on fire damage assessment of reinforced concrete structures. Case Stud. Constr. Mater. 2022, 16, e00843. [Google Scholar] [CrossRef]
  3. Golewski, G.L. The Phenomenon of Cracking in Cement Concretes and Reinforced Concrete Structures: The Mechanism of Cracks Formation, Causes of Their Initiation, Types and Places of Occurrence, and Methods of Detection—A Review. Buildings 2023, 13, 765. [Google Scholar] [CrossRef]
  4. Kovler, K.; Chernov, V. Types of damage in concrete structures. In Failure, Distress and Repair of Concrete Structures; Woodhead Publishing: Sawston, UK, 2009; pp. 32–56. [Google Scholar]
  5. Portland Cement Association. Types, Causes of Concrete Deterioration; IS536 Portland Cement Association: Skokie, IL, USA, 2002. [Google Scholar]
  6. Nguyen-Tat, T.; Ranaivomanana, N.; Balayssac, J.P. Characterization of damage in concrete beams under bending with Acoustic Emission Technique (AET). Constr. Build. Mater. 2018, 187, 487–500. [Google Scholar] [CrossRef]
  7. Zhao, J.; Bao, T.; Chen, R. Crack monitoring capability of plastic optical fibers for concrete structures. Opt. Fiber Technol. 2015, 24, 70–76. [Google Scholar] [CrossRef]
  8. Howiacki, T.; Sieńko, R.; Bednarski, Ł.; Zuziak, K. Structural monitoring of concrete, steel, and composite bridges in Poland with distributed fibre optic sensors. Struct. Infrastruct. Eng. 2023, 2023, 2230558. [Google Scholar] [CrossRef]
  9. André, P.S.; Varum, H.; Antunes, P.; Ferreira, L.; Sousa, M.G. Monitoring of the concrete curing process using plastic optical fibers. Measurement 2012, 45, 556–560. [Google Scholar] [CrossRef]
  10. Wen, S.; Chung, D.D. Damage monitoring of cement paste by electrical resistance measurement. Cem. Concr. Res. 2000, 30, 1979–1982. [Google Scholar] [CrossRef]
  11. Chung, D.D. Damage in cement-based materials, studied by electrical resistance measurement. Mater. Sci. Eng. R Rep. 2003, 42, 1–40. [Google Scholar] [CrossRef]
  12. Cholker, A.K.; Tantray, M.A. Electrical resistance-based health monitoring of structural smart concrete. Mater. Today Proc. 2021, 43, 3774–3779. [Google Scholar] [CrossRef]
  13. Chen, B.; Liu, J. Damage in carbon fiber-reinforced concrete, monitored by both electrical resistance measurement and acoustic emission analysis. Constr. Build. Mater. 2008, 22, 2196–2201. [Google Scholar] [CrossRef]
  14. Bontea, D.M.; Chung, D.D.; Lee, G.C. Damage in carbon fiber-reinforced concrete, monitored by electrical resistance measurement. Cem. Concr. Res. 2000, 30, 651–659. [Google Scholar] [CrossRef]
  15. Chen, P.W.; Chung, D.D. Concrete as a new strain/stress sensor. Compos. Part B Eng. 1996, 27, 11–23. [Google Scholar] [CrossRef]
  16. Sun, M.; Li, Z.; Song, X. Piezoelectric effect of hardened cement paste. Cem. Concr. Compos. 2004, 26, 717–720. [Google Scholar] [CrossRef]
  17. Iijima, S. Helical microtubules of graphitic carbon. Nature 1991, 354, 56–58. [Google Scholar] [CrossRef]
  18. Lu, J.P. Elastic properties of carbon nanotubes and nanoropes. Phys. Rev. Lett. 1997, 79, 1297. [Google Scholar] [CrossRef] [Green Version]
  19. Dresselhaus, M.S.; Dresselhaus, G.; Charlier, J.C.; Hernandez, E. Electronic, thermal and mechanical properties of carbon nanotubes. Philosophical Transactions of the Royal Society of London. Ser. A Math. Phys. Eng. Sci. 2004, 362, 2065–2098. [Google Scholar] [CrossRef]
  20. Salvetat, J.P.; Bonard, J.M.; Thomson, N.H.; Kulik, A.J.; Forro, L.; Benoit, W.; Zuppiroli, L. Mechanical properties of carbon nanotubes. Appl. Phys. A 1999, 69, 255–260. [Google Scholar] [CrossRef]
  21. Yakobson, B.I.; Avouris, P. Mechanical properties of carbon nanotubes. In Carbon Nanotubes: Synthesis, Structure, Properties, and Applications; Springer: Berlin/Heidelberg, Germany, 2001. [Google Scholar]
  22. Dresselhaus, G.; Dresselhaus, M.S.; Saito, R. Physical Properties of Carbon Nanotubes; World Scientific: Singapore, 1998. [Google Scholar]
  23. Shahzad, S.; Toumi, A.; Balayssac, J.P.; Turatsinze, A.; Mazars, V. Cementitious composites incorporating Multi-Walled Carbon Nanotubes (MWCNTs): Effects of annealing and other dispersion methods on the electrical and mechanical properties. Matériaux Tech. 2022, 110, 104. [Google Scholar] [CrossRef]
  24. Ferdiansyah, T.; Balayssac, J.P.; Turatsinze, A. An experimental approach for characterisation of concrete damage using the wheatstone bridge circuit. Int. J. Civ. Eng. 2022, 20, 75–89. [Google Scholar] [CrossRef]
  25. Wang, L.; Aslani, F. Development of self-sensing cementitious composites incorporating CNF and hybrid CNF/CF. Constr. Build. Mater. 2021, 273, 121659. [Google Scholar] [CrossRef]
  26. Bu, J.; Chen, X.; Hu, L.; Yang, H.; Liu, S. Experimental study on crack propagation of concrete under various loading rates with digital image correlation method. Int. J. Concr. Struct. Mater. 2020, 14, 25. [Google Scholar] [CrossRef]
  27. Li, J.; Chen, L.; Hu, G.; Guo, J.; Wang, Z.; Lu, W.; Luo, J.; Fan, X.; Zhu, Y.; Wang, X.; et al. Research on performance of smart concrete materials and self-monitoring of cracks in beam members. Mater. Today Commun. 2023, 35, 105775. [Google Scholar] [CrossRef]
  28. Birgin, H.B.; D’Alessandro, A.; Ubertini, F. Dynamic behavior of structural beams made of innovative smart concrete. Procedia Struct. Integr. 2023, 44, 1624–1631. [Google Scholar] [CrossRef]
  29. BS EN 197-1:2011; Cement. Composition, Specifications and Conformity Criteria for Common Cements. British Standards Institution: London, UK, 2011.
  30. Shahzad, S.; Toumi, A.; Balayssac, J.P.; Turatsinze, A. Design of smart cementitious composites based on multi-walled carbon nanotubes (MWCNTs) using probe ultrasonicator for dispersion. In Proceedings of the 6th International Conference on Concrete Repair, Rehabilitation and Retrofitting (ICCRRR 2022), Cape Town, South Africa, 3 October 2022; Volume 364. No. 05012. [Google Scholar]
  31. Singh, Y. Electrical resistivity measurements: A review. In International Journal of Modern Physics: Conference Series 2013; World Scientific Publishing Company: Singapore, 2013; Volume 22, pp. 745–756. [Google Scholar]
  32. Gencturk, B.; Hossain, K.; Kapadia, A.; Labib, E.; Mo, Y.L. Use of digital image correlation technique in full-scale testing of prestressed concrete structures. Measurement 2014, 47, 505–515. [Google Scholar] [CrossRef]
  33. Pickerd, V. Optimisation and Validation of the ARAMIS Digital Image Correlation System for Use in Large-Scale High-Strain-Rate Events; Defense Science and Technology Organization Victoria: Maritime, Australia, 2013. [Google Scholar]
  34. Dong, W.; Li, W.; Tao, Z.; Wang, K. Piezoresistive properties of cement-based sensors: Review and perspective. Constr. Build. Mater. 2019, 203, 146–163. [Google Scholar] [CrossRef]
  35. Ho, A.C.; Turatsinze, A.; Hameed, R.; Vu, D.C. Effects of rubber aggregates from grinded used tyres on the concrete resistance to cracking. J. Clean. Prod. 2012, 23, 209–215. [Google Scholar] [CrossRef]
  36. Bhowmik, S.; Ray, S. An experimental approach for characterization of fracture process zone in concrete. Eng. Fract. Mech. 2019, 211, 401–419. [Google Scholar] [CrossRef]
  37. Wang, Y.; Zhao, X.; Zhao, Y. Piezoresistivity of cement matrix composites incorporating multiwalled carbon nanotubes due to moisture variation. Adv. Civ. Eng. 2020, 2020, 1. [Google Scholar] [CrossRef] [Green Version]
  38. Le, H.V.; Kim, M.K.; Kim, S.U.; Chung, S.Y.; Kim, D.J. Enhancing self-stress sensing ability of smart ultra-high performance concretes under compression by using nano functional fillers. J. Build. Eng. 2021, 44, 102717. [Google Scholar] [CrossRef]
  39. Han, B.; Zhang, L.; Sun, S.; Yu, X.; Dong, X.; Wu, T.; Ou, J. Electrostatic self-assembled carbon nanotube/nano carbon black composite fillers reinforced cement-based materials with multifunctionality. Compos. Part A Appl. Sci. Manuf. 2015, 79, 103–115. [Google Scholar] [CrossRef]
  40. Han, B.; Ding, S.; Wang, J.; Ou, J.; Han, B.; Ding, S.; Wang, J.; Ou, J. Electrostatic Self-Assembled Carbon Nanotube/Nano-Carbon Black Fillers-Engineered Cementitious Composites. In Nano-Engineered Cementitious Composites: Principles and Practices; Springer: Singapore, 2019; pp. 665–707. [Google Scholar]
  41. Demircilioglu, E.; Teomete, E.; Ozbulut, O.E. Strain sensitivity of steel-fiber-reinforced industrial smart concrete. J. Intell. Mater. Syst. Struct. 2020, 31, 127–136. [Google Scholar] [CrossRef]
  42. Wang, L.; Aslani, F. Structural performance of reinforced concrete beams with 3D printed cement-based sensor embedded and self-sensing cementitious composites. Eng. Struct. 2023, 275, 115266. [Google Scholar] [CrossRef]
Figure 1. Preparation of molds with embedded electrodes before concrete pouring.
Buildings 13 02034 g001
Figure 2. Steps for the preparation of concrete specimens.
Buildings 13 02034 g002
Figure 3. Schematic diagram of the specimens: (a) beam for bending test and (b) cylinder for compression test.
Buildings 13 02034 g003
Figure 4. Layout of four-probe measuring technique.
Buildings 13 02034 g004
Figure 5. Four-point flexure testing arrangement with four-probe technique.
Buildings 13 02034 g005
Figure 6. Loading-unloading cycles for four-point bending test.
Buildings 13 02034 g006
Figure 7. Sample preparation for bending test along with 3D image correlation.
Buildings 13 02034 g007
Figure 8. Setup for digital image correlation (DIC).
Buildings 13 02034 g008
Figure 9. Compression test setup along with LVDTs and four-probe technique.
Buildings 13 02034 g009
Figure 10. Load versus CMOD under four-point bending cyclic loading.
Buildings 13 02034 g010
Figure 11. Load versus FCR under four-point bending cyclic loading.
Buildings 13 02034 g011
Figure 12. FCR and CMOD variation against loading.
Buildings 13 02034 g012
Figure 13. FCR and CMOD versus time for prismatic specimen under bending test.
Buildings 13 02034 g013
Figure 14. Propagation of crack at various loading sequences: (a) pre-load, (b) 50% pre-peak, (c) peak load, and loading cycles after peak (d) 80%, (e) 60%, (f) 40%, and (g) 20%.
Buildings 13 02034 g014
Figure 15. Reference lines on area of interest (AOI).
Buildings 13 02034 g015
Figure 16. Variation in FCR and crack length measured through DIC against loading.
Buildings 13 02034 g016
Figure 17. Strain fields of concrete specimens at various loading sequences: (a) pre-load, (b) 50% pre-peak, (c) peak load, and loading cycles after peak (d) 80%, (e) 60%, (f) 40%, and (g) 20%.
Buildings 13 02034 g017
Figure 18. Use of extensometer to detect the opening of crack along the beam face.
Buildings 13 02034 g018
Figure 19. Elongation in extensometer (D1) at various locations, and FCR versus time.
Buildings 13 02034 g019
Figure 20. Compressive strain and fractional change in electrical resistance (FCR) of smart concrete under cyclic compressive stress of 20, 35, and 50% with respect to the compressive strength of materials for: (a) C1 specimen, (b) C2 specimen, and (c) C3 specimen.
Buildings 13 02034 g020
Figure 21. Compressive strain and FCR of smart concrete under cyclic compressive stress of 20, 35, and 50% with respect to the compressive strength of materials with a plateau of 20 s: (a) C1 specimen, (b) C2 specimen, and (c) C3 specimen.
Buildings 13 02034 g021
Figure 22. Compressive stress/strain and FCR under monotonic loading under various degrees of saturation: for C1 specimen (ac), for C2 specimen (df), and for C3 specimens (gi).
Buildings 13 02034 g022
Table 1. Mix proportions for smart concrete (for 1 m3).
MaterialQuantity
OPC (CEM I 52.5R)350 kg
Fine Aggregates875 kg
Coarse Aggregates980 kg
Water175 kg
Superplasticizer 14%
MWCNTs 10.75%
1 The content is with respect to the mass of the cement.
Table 2. Designation of specimens based on degree of saturation.
DesignationC1C2C3
Condition20 °C
RH ≈ 100%
23 °C
50% < RH < 100%
40 °C
RH < 50%
Mass Loss (Water)
%
02.25.1
Table 3. Stress and strain sensitivities of smart concrete.
PropertiesCondition of Specimens
C1C2C3
FCR at Failure (%)15.7420.4925.61
Stress Sensitivity (%/MPa)0.3350.4570.5
Strain Sensitivity54.2459.72109.5
Disclaimer/Publisher’s Note: The statements, opinions and data contained in all publications are solely those of the individual author(s) and contributor(s) and not of MDPI and/or the editor(s). MDPI and/or the editor(s) disclaim responsibility for any injury to people or property resulting from any ideas, methods, instructions or products referred to in the content.

