Article

Risk Analysis in Implementing Building Energy Performance Projects: Hybrid DANP-VIKOR Model Analysis—A Case Study in Iran

by
Hossein Naderi
1,*,†,
Mohammad Hossein Heydari
1,† and
Majid Parchami Jalal
2,†
1
Myers-Lawson School of Construction, Virginia Tech, Blacksburg, VA 24061, USA
2
Department of Project Management and Construction, Faculty of Architecture, College of Fine Arts, University of Tehran, Tehran 1417935840, Iran
*
Author to whom correspondence should be addressed.
These authors contributed equally to this work.
Buildings 2023, 13(8), 2066; https://doi.org/10.3390/buildings13082066
Submission received: 11 July 2023 / Revised: 31 July 2023 / Accepted: 11 August 2023 / Published: 14 August 2023
(This article belongs to the Section Building Energy, Physics, Environment, and Systems)

Abstract

:
Building energy performance contracts have emerged as a highly effective strategy for reducing energy consumption in both developed and developing markets. These projects inherently involve risks, and a comprehensive risk analysis can greatly enhance their successful implementation, especially in emerging markets. This research aims to analyze risks associated with building energy performance projects, considering their interrelationships, prioritization, and the ranking of optimal project types based on the analyzed risks. Given its position as the largest electrical energy consumer in the Middle East and its status as an emerging market, Iran was selected as the case study for conducting the risk analysis. Thirteen risk factors were classified into four distinct risk groups, and their relationships and priority weights were determined using a hybrid DANP approach. Subsequently, the VIKOR method was employed to rank the most-advantageous project types based on their risk priorities. The findings of this research identified project lifecycle risks as the highest-priority risks, while external risks were determined to be the most-influential among all identified risks. Moreover, the implementation of packaged public projects was identified as the most-favorable alternative for promoting building energy performance projects in Iran and similar emerging markets. By providing a comprehensive understanding of risks, this study offers valuable insights that can aid emerging and developing markets in successfully implementing energy performance projects and improving overall energy efficiency.

1. Introduction

The building sector plays a significant role in global carbon dioxide emissions, accounting for approximately one-third of energy- and process-related emissions, both directly and indirectly [1]. High energy consumption is associated with a wide range of threats, including environmental impacts, among others. Energy performance projects have been introduced as one of the most-effective ways to reduce energy consumption and improve the overall energy efficiency of buildings [2]. In Energy Performance Contracting (EPC) projects, energy savings are the central means of earning income and covering project costs, enabling these projects to quickly establish themselves in energy-intensive markets [3,4,5]. EPC projects are not limited to developed countries, as a considerable number of developing countries have already embraced them as a primary strategy for reducing energy costs [6,7]. Nevertheless, despite the significant growth of these projects in both developed and developing countries, their market in many energy-intensive countries, such as Iran, is still in its early stages [8,9].
Despite the obvious advantages of EPC projects, they are typically subjected to risks [10], necessitating a combination of various factors to achieve success [11,12,13]. The inherent riskiness of these projects hampers their development in newly established and emerging markets, where risk analysis plays a crucial role in driving market growth [10]. Consequently, numerous research studies have been conducted on EPC risks in both developed and developing markets. Some studies have investigated the risks faced by Energy Service Companies (ESCOs), which are the main players in implementing EPC projects, at both the European level [14,15] and in specific countries such as Finland [16] and Sweden [17]. Moreover, significant research has been carried out on risk identification and analysis in emerging markets, including China’s EPC projects, contributing to the development of that market. For example, Da-li et al. [18] investigated different risks associated with the development of EPC markets in China and proposed various measures to mitigate them. Liu et al. [19] analyzed the threats and weaknesses for the development of China’s EPC projects using the Analytic Network Process (ANP)-Strengths, Weaknesses, Opportunities, and Threats (SWOT) method. Various methods have been employed to analyze risks in EPC projects. Lee et al. [20] utilized sensitivity analysis and Monte Carlo techniques to quantitatively simulate risk assessment. Other researchers have employed qualitative methods to analyze risks. Wang et al. [21] identified and prioritized the risks of EPC projects by comparing the best–worst method with other techniques to validate the proposed model. Another study [22] ranked identified risks using a new approach called Multi-Attributive Border Approximation area Comparison (MABAC) method, considering decision-makers’ bounded rationality and behavioral psychology. Additionally, Garbuzova-Schlifter et al. [23] applied the Analytic Hierarchy Process (AHP) method to rank EPC risks in Russia’s market.
Despite the application of various approaches by researchers to analyze risks in EPC projects, the interrelationship between risks is often overlooked, limiting the applicability of these studies and making risk management challenging, particularly in developing markets that face multiple risks. Moreover, the implementation of high-risk projects in new markets can result in early project failure, thereby diminishing the effectiveness of energy efficiency policies. To address these issues, this study aims to achieve several objectives. Firstly, it seeks to identify a comprehensive range of risks specific to EPC projects in emerging markets, with a particular focus on the case of Iran. Secondly, it aims to establish a network of relationships among these risks to deepen the understanding of risk management. Thirdly, the study aims to prioritize the identified risks to enhance the likelihood of identifying effective solutions. Lastly, it aims to rank three low-risk project types as alternatives during the initial stages of market development to increase the probability of success for EPC projects.
To address the aforementioned objectives, a hybrid Multi-Criteria Decision-Making (MCDM) technique that combines Decision-Making Trial and Evaluation Laboratory (DEMATEL), ANP, and VIekriterijumsko KOmpromisno Rangiranje (VIKOR) is employed. This proposed approach not only establishes a network of risks and their priorities, but also ranks the most-favorable alternatives. By offering a more-accurate depiction of the risks and their interrelationships, this method facilitates policymakers in making more-effective decisions. Similar approaches have been successfully utilized by researchers in various industries to tackle complex problems [24]. Some notable studies in this regard include the identification and ranking of risks in product lifecycle management by [25], the control of information security risks [26], and optimal vendor selection for recycled materials [27].
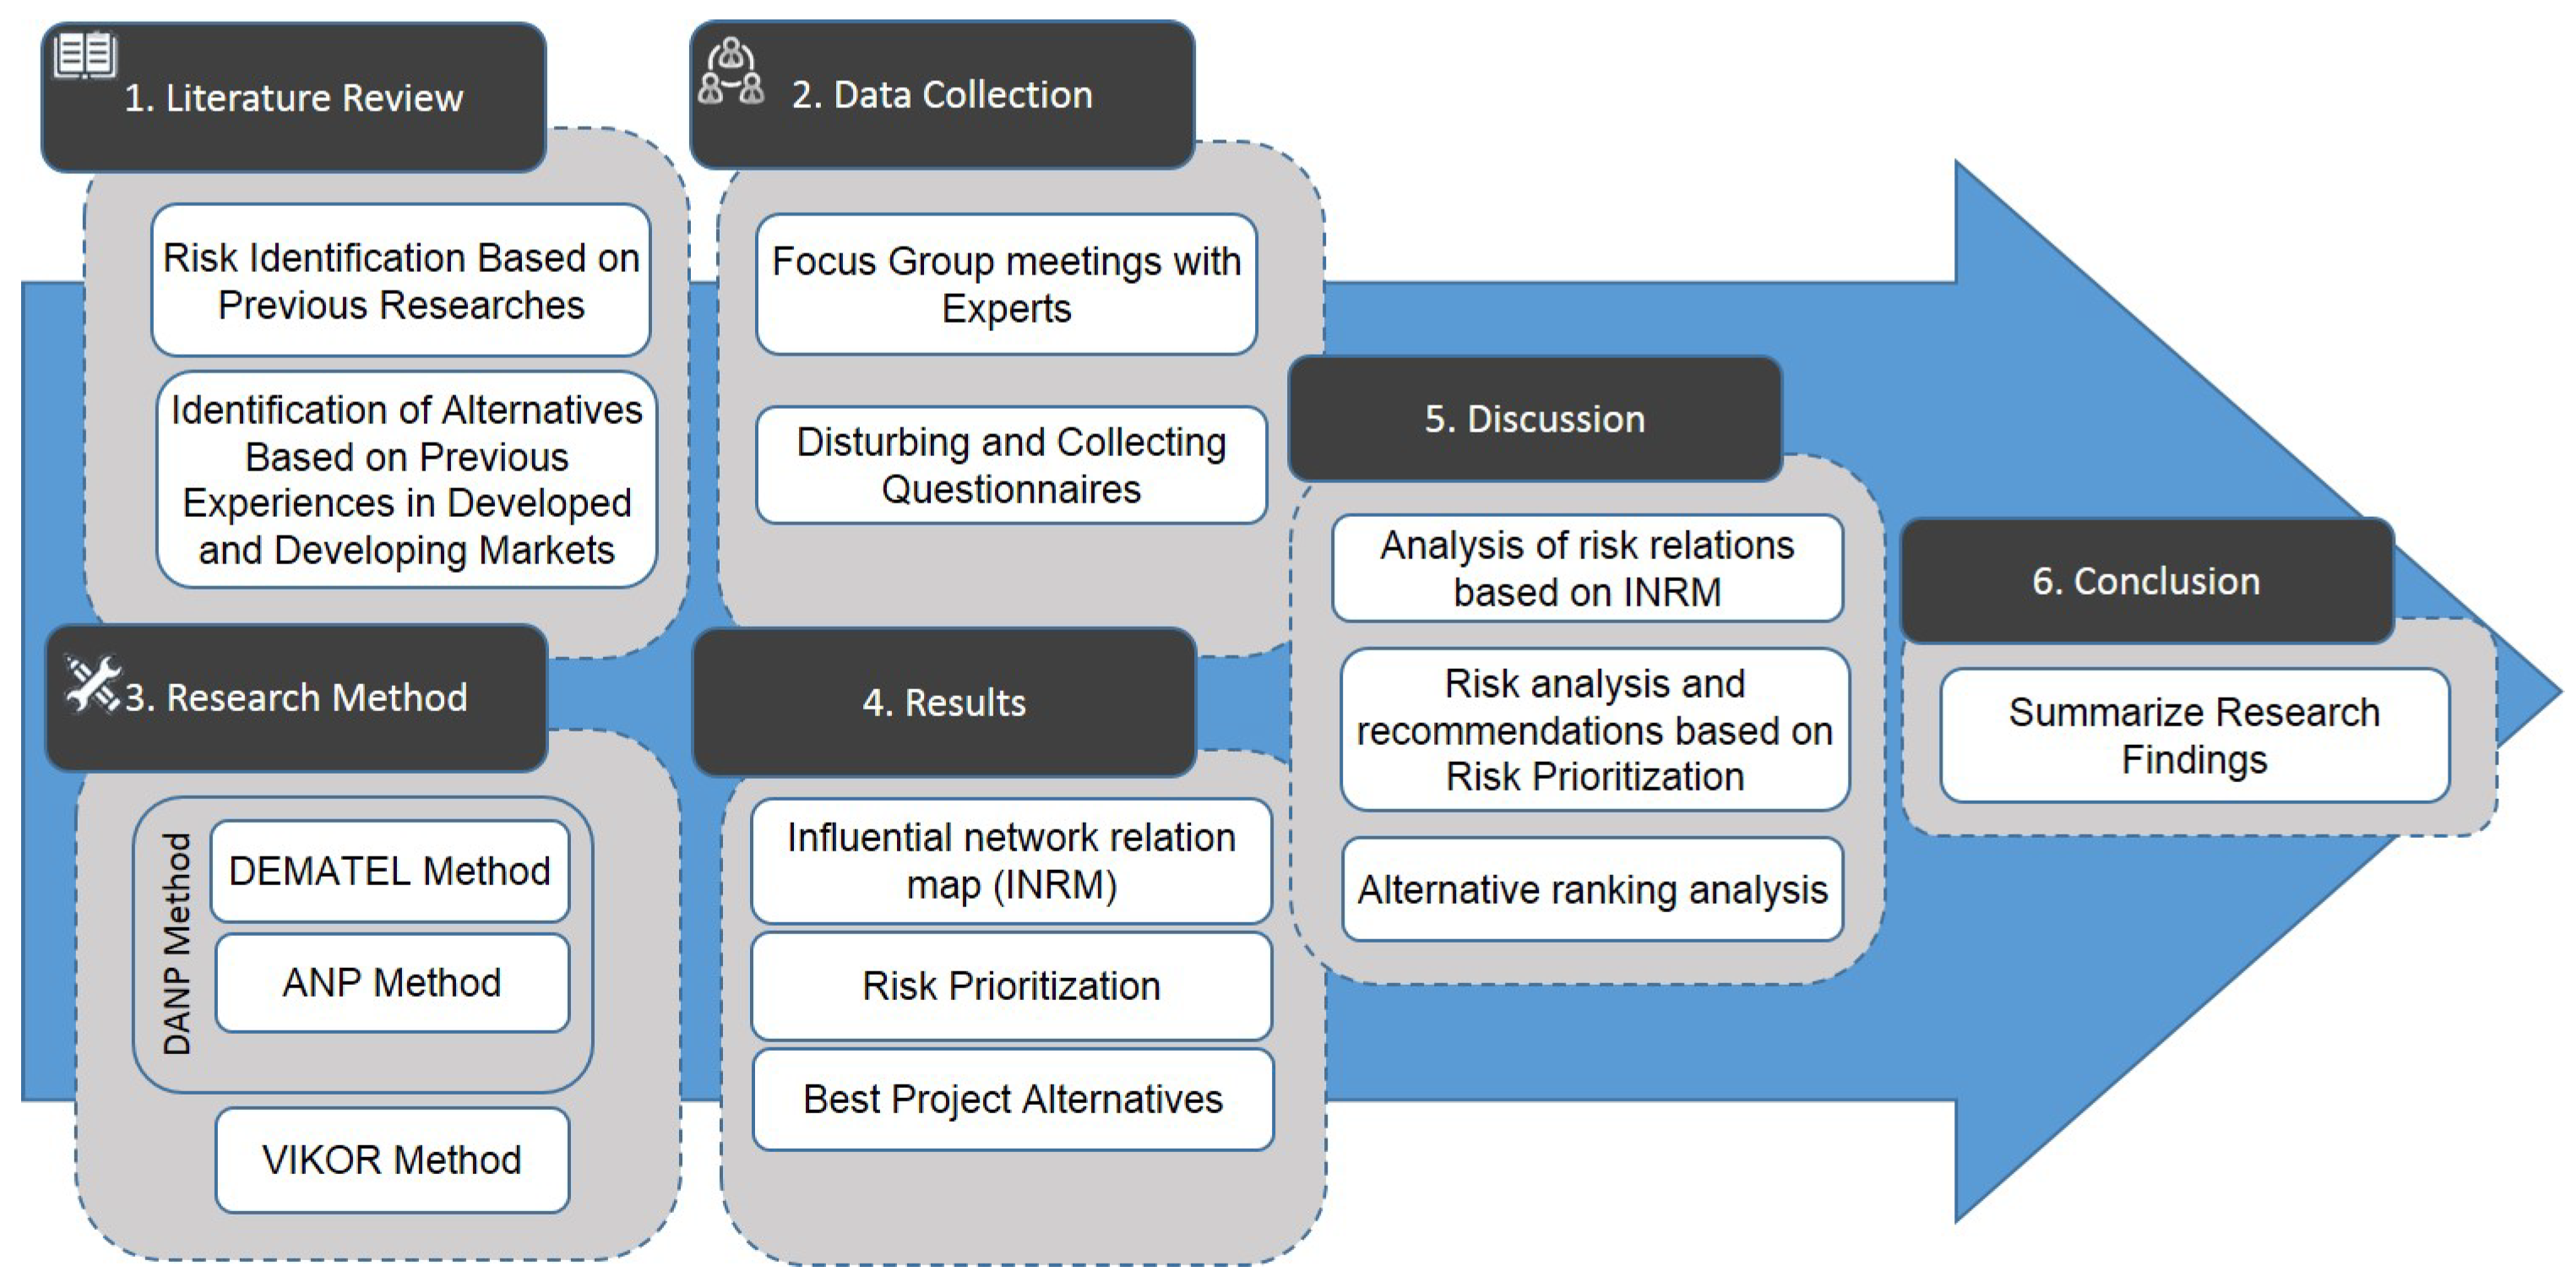
Figure 1 illustrates the six-stage research process undertaken in this study. In the initial stage (Section 2.2), a comprehensive set of risks in both developed and developing markets was identified. Subsequently, a selection of relevant projects was identified based on successful experiences in developed and developing markets (Section 2.3). The second stage involved the integration and categorization of the identified factors through focus group meetings, followed by the distribution of questionnaires (Section 3.1). In the third stage, the collected questionnaire data were utilized to compute the proposed research method (Section 3.2). The results are presented in Section 4 and analyzed in Section 5. Finally, a summary of the research findings and their implications is provided in Section 6.

2. Literature Review

2.1. Related Studies

Numerous studies have embraced the MCDM approaches to provide optimized solutions in various domains. One widely employed technique, the Epsilon-Based Measure (EBM), has been instrumental in evaluating the efficiency of systems in recent research endeavors [28,29]. Notably, the supply chain domain has witnessed significant improvements through the integration of MCDM approaches, as evident in the works of Kler et al. [30] and Alipour-vaezi [31]. Furthermore, MCDM techniques have found applications in diverse fields, extending their impact beyond traditional domains. For instance, in the context of post-disaster reconstruction, MCDM has proven invaluable for providing solutions that prioritize reconstruction approaches, as demonstrated by Mohammadnazari [32]. Moreover, the scope of MCDM implementation has expanded to encompass health and safety improvements, as explored in studies by Alipour-vaezi et al. [33] and Ballesteros [34]. Additionally, MCDM methods have been employed to evaluate organizational factors that enhance coordination in buildings. Notable research conducted by Ourang et al. [35], Rajabi [36], and Rajabi [37] has highlighted the significance of leveraging MCDM approaches to optimize coordination within organizational structures.

2.2. Identification of Risks Associated with the Implementation of Building Energy Performance Projects

In this section, we conduct a thorough identification of risks, integrating similar ones based on previous studies conducted in both developed and developing markets. This study addresses the comprehensive range of risks associated with the implementation of building energy performance projects. Specifically, it investigates both the risks that jeopardize the success of these projects and the potential negative effects on the environment that may arise from their implementation. Subsequently, all the identified risks are categorized and presented in Table A1 in Appendix A. The identified risks from previous studies were presented to several experts, who reached a consensus on the risk categorization, which includes risks in project lifecycle, market and technology risks, legal and contractual risks, and external risks. Additionally, the experts contributed by adding several risks to the ones identified from the literature (further details are provided in Section 3.1).

2.2.1. Risks in Project Lifecycle

During the project planning phase, inaccurate energy user data [23,38,39] can lead to lower accuracy of energy-saving simulations. Conversely, the inability of ESCOs to precisely measure data can result in complications [20,40]. The absence of standardized energy user systems and variations in energy consumption patterns among users have been identified as significant local risks [10]. Additionally, industry experts consider the lack of local consulting companies as a notable risk.
Moving on to the execution phase, the lack of experienced ESCOs and subcontractors can impede the success of projects [21,41]. Ensuring that the installation of equipment in the energy user system is scheduled at specific times is crucial to avoid disruption to energy user activities [10]. Poor cooperation and a negative working environment, in general, can have a detrimental effect on project performance [39,41]. Moreover, given the extended contract duration of these projects [42], the risk of inadequate operation and maintenance practices arises, potentially hindering project success [23,43]. These risks in the operation and maintenance phase include a lack of sufficient knowledge and experience in equipment usage and maintenance [23,41]. All these comprise the risks in the Project lifecycle (P).

2.2.2. Market and Technology Risks

The group of risks related to Market and technology (M) is further categorized into three factors: demand risk (M1), finance risk (M2), and technology risk (M3). In new markets, limited demand poses a significant risk for ESCOs, potentially decreasing their motivation to undertake projects [21,23]. Issues specific to markets like Iran can further threaten these projects.
Finance plays a crucial role in EPC projects, with its importance amplified in emerging markets where many small-scale ESCOs struggle to secure project financing [44,45]. Moreover, numerous banks are unfamiliar with EPC models and find it challenging to identify viable projects for financing [41,46]. Cumbersome rules in the public sector make the finance process intricate, discouraging many financial institutions from entering this area [19]. Fluctuations in interest rates [10] and a lack of government backing [40,47] have also been identified as risks in various EPC markets. Additionally, experts have highlighted the potential inability of internal investors to finance EPC projects as local risks.
With advancing technology and the introduction of more-sophisticated equipment to the market, the complexity of energy-saving equipment increases [38]. In emerging markets, up-to-date equipment is scarce and often comes at a significant cost [41]. Consequently, some small-sized companies resort to using inefficient technologies, thereby increasing project risks [19]. The complexity of user equipment [46] and dependence on imported equipment [47] are among the technological risks associated with EPC projects. Moreover, the procurement and transfer of appropriate technology to countries like Iran present additional challenges.

2.2.3. Legal and Contractual Risks

The group of risks associated with legal and Contractual (C) aspects can be further categorized into three factors: legal risks (C1), contractual risks (C2), and credit risks (C3). The success of many EPC projects relies on the presence of supportive laws [2,45]. The absence or frequent changes in these laws can significantly increase project risks [41]. In the public sector, projects often face challenges in obtaining the required permits due to complex rules and regulations [48].
The selection of an appropriate business model plays a fundamental role in the development of EPC projects [16,42,49]. In emerging markets like Iran, the localization of EPC business models is still lacking, and the lack of alignment with local laws can lead to project failure. The credibility of the parties involved in the projects forms the foundation for trust between them [49,50]. A lack of credibility can result in energy users or ESCOs failing to fulfill their responsibilities, ultimately leading to conflicts within projects [23,49].

2.2.4. External Risks

External (E) risks encompass a set of risks that are beyond the control of EPC experts, meaning that these risks are external to the expertise and influence of the professionals involved in the building energy performance projects. These risks are more closely associated with policy-makers, governmental decisions, or other external factors that may significantly impact the project’s success or outcomes. This group of risks can be further categorized into four factors: economic risks (E1), political risks (E2), social risks (E3), and climate risks (E4).
Economic risks typically involve fluctuations in prices, inflation, and the uncertainty of energy tariffs [41,46]. Moreover, low energy prices directly impact the profitability and productivity of ESCOs, thereby affecting the progress of projects [51,52]. Changes in governments and subsequent alterations in supportive policies, especially in emerging markets, can have a negative impact on EPC projects [44]. Additionally, diplomatic issues and international tensions, as observed in many countries including Iran, pose risks to project success.
In emerging markets, a lack of awareness among energy users regarding EPC projects [53] often leads to public opposition due to concerns about increased energy prices. Unfavorable weather conditions also contribute to external risks [10,21].

2.3. Identification of Alternatives

In this section, our objective is to identify the lowest-risk alternatives through a comprehensive review of experiences in both developed and developing markets. We presented the identified project types from developed and developing countries to experts in a focus groups. After multiple meetings and thorough discussions, the experts selected three alternatives (further details in Section 3.1). Table 1 displays the identified projects in developed and developing markets on the left, and on the right, it presents the outputs of the focus group with the three selected projects.

2.3.1. Developed Markets

To identify project characteristics that contribute to the success of developed markets, we can review EPC projects in countries such as the United States and Germany. The United States has a significant share of the global EPC market [60]. Public projects, including government buildings, universities, schools, treatment centers, and hospitals, are prominent in the United States [53]. EPC projects enable the public sector to comply with government regulations and update existing equipment and facilities [8]. Germany, as one of the most-developed European markets [60], can also provide insights into lower-risk projects. In the early stages of the German ESCO market, packaged projects were utilized in the public sector [54]. By dividing public buildings into numerous projects, the market reduced technology risks and project delays [61]. Additionally, the EPC market in Austria can serve as a practical choice, as its rapid development makes it a role model for emerging markets [56]. Municipal street lighting projects and energy efficiency improvements of old buildings were crucial factors that stimulated demand in this market [14].

2.3.2. Developing Markets

Developing markets share similarities with emerging markets and can provide valuable insights. The Korean market is a successful example in this regard. Although EPC projects in Korea were not a top priority for a long time [57], projects in the industrial sector significantly contributed to the market’s growth [8]. The selection of simple projects also helped mitigate risks and supported market expansion [57].
The EPC market in Turkey has shown significant growth in recent years [58,59]. Given Iran’s proximity and cultural similarities, projects in the Turkish market can help identify suitable alternatives. The support of universities for EPC projects and the implementation of projects in the residential and industrial sectors have been considered positive strategies in Turkey [58]. Furthermore, the growth of EPC projects in Bulgaria, after a period of stagnation due to low energy prices [8], can introduce feasible projects to the Iranian market, which also experiences low energy prices. Municipal lighting projects have played a vital role in the development of the EPC market in Bulgaria [8].

3. Materials and Methods

The AHP method [62] is often considered impractical for real-world problems due to a lack of interdependencies [63]. The ANP method [64] was proposed as a solution to address this limitation. However, the ANP method derives the weighted super-matrix by dividing each factor in each column by the number of clusters, resulting in each column having the same weight and not considering the influence of clusters on each other [27,65]. To overcome these challenges, this research utilizes the DANP technique, which combines the DEMATEL method with ANP [66,67].
In the DANP method, the interrelationships among the risks are measured using the DEMATEL method [68]. This approach generates an Influential Network Relation Map (INRM) that depicts the relationships among the risk factors. The risk weights are then determined using DANP. These risk weights are subsequently used in conjunction with the VIKOR method [69] to rank the alternatives. A schematic diagram illustrating the DANP with VIKOR method is shown in Figure 2. While the DANP with VIKOR method demonstrates notable advantages in addressing the limitations of traditional AHP and ANP approaches, it is essential to acknowledge a potential limitation in the DANP technique itself. The DANP method heavily relies on expert judgments to establish the influential network relation map, which may introduce subjectivity and bias into the decision-making process.

3.1. Data Collection

To ensure a robust and comprehensive data collection process, this study engaged in an extensive eight-month endeavor involving more than 20 focus group meetings. The focus group meetings were attended by a panel of experts with diverse backgrounds, as detailed in Table 2, all of whom possessed significant experience in Iran’s EPC market.
The data collection process began with the identification of 68 risk factors derived from existing research and the integration of six types of projects based on experienced markets, resulting in a total of 44 risk factors. Among these, 35 risks were sourced from the existing literature, while an additional 9 risks were contributed through expert opinions gathered during the focus group meetings (as described in Section 3.1). Subsequently, to gain deeper insights into the interrelationships among the identified risks, experts from the focus groups classified these risks based on their previous studies and personal opinions.
The classification process involved categorizing risks with similar roots or underlying causes into distinct risk groups. The rationale behind this classification was to understand how risks within the same category might be interconnected and how they collectively influence specific dimensions of the EPC market in Iran. Consequently, this categorization enabled the study to explore the interdependencies among the identified risks and shed light on the complex dynamics that shape the overall risk landscape in the context of EPC projects. As a result of this classification process, the 44 risk factors were further organized into 13 factors and four dimensions, as elaborated in Section 5.
Moreover, to ensure a representative sample, 140 verified questionnaires were distributed among Iranian ESCOs and building energy companies officially registered in the Ministry of Energy. The design of these questionnaires is presented in Appendix B. The selection of this target population was based on their expertise and direct involvement in the Iran EPC market. Out of the 140 questionnaires, 106 were successfully collected and used for subsequent calculations and analysis. While the focus group meetings and questionnaires were designed to yield robust insights, it is important to acknowledge potential limitations associated with data collection. The reliance on expert opinions and self-reporting through questionnaires might introduce subjectivity and response bias. Nevertheless, measures, such as the validation process by the focus group, were taken to mitigate such limitations and ensure the rigor of the data-collection process. The inputs and outputs of the focus group meetings are visually depicted in Figure 3, providing a clear overview of the data-gathering process.

3.2. The DEMATEL Process

3.2.1. Step 1: Construct the Direct Relationship Matrix (A)

After collecting the questionnaires and calculating the average scores, the direct relationship matrix A was constructed. In this matrix, a i j represents the influence of criterion i on criterion j.
A = a 11 a 1 j a 1 n a i 1 a i j a i n a n 1 a n j a n n

3.2.2. Step 2: Normalized Direct Relationship Matrix (X)

Matrix X = [ x i j ] m × n is obtained by normalizing the matrix A through the following equations. Based on Equation (3), the maximum amount for the total sum of values in each row and column is divided by the corresponding entries in the direct relationship matrix.
X = z × A
z = m i n 1 m a x 1 i < n j = 1 n a i j , 1 m a x 1 i < n i = 1 n a i j

3.2.3. Step 3: Compute the Total Relation Matrix ( T c )

Matrix X represents direct relationships between the entries, and X 2 denotes indirect (second-hand) relations, and so on. The total relationship matrix T is given as follows.
T = X + X 2 + + X h = lim h X + X 2 + + X h = X ( I + X + + X h 1 ) ( I X ) ( I X ) 1 = X ( I X h ) ( I X ) 1 T = X ( I X ) 1 , h
Now, the sums of the rows and columns were taken to obtain matrices R and S.
T = t i j , i , j = 1 , 2 , , n
R = r i n × 1 = j = 1 n t i j n × 1 , S = s j n × 1 = i = 1 n t i j 1 × n
Therefore, ( r i + s j ) represents the importance degree of each factor within the whole system and ( r i s j ) denotes the net influence given by or received by the factors in the system. If this value is positive, factor i is characterized as a cause, and whenever the value is negative, the factor is identified as an effect.

3.3. The DANP Process

3.3.1. Step 4: Formation of Unweighted Super-Matrix ( W c )

In this step, the total relationship matrix T C is used as the basis for calculations. The values of the entries in all columns are summed to normalize this matrix. As a result, the matrix T C = [ t i j ] n × n is obtained from the entries of matrix T, and matrix T D = [ t i j D ] m × m is derived from the clusters of matrix T.
T C = D 1 c 1 c 1 m 1 D j c j 1 c j m j D n c n 1 c n m n D 1 c 1 m 1 c 11 D i c i m i c i 1 D n c n m n c n 1 T c 11 T c 1 j T c 1 n T c i 1 T c i j T c i n T c n 1 T c n j T c n n
After the normalization of matrix T using the clusters, the new matrix T C α is given by the following formula.
T c α = D 1 c 1 c 1 m 1 D j c j 1 c j m j D n c n 1 c n m n D 1 c 1 m 1 c 11 D i c i m i c i 1 D n c n m n c n 1 T c α 11 T c α 1 j T c α 1 n T c α i 1 T c α i j T c α i n T c α n 1 T c α n j T c α n n
Furthermore, Equations (9) and (10) show the normalization process for matrix T C α 11 .
d 11 c i = j = 1 m 1 t c i j 11 , i = 1 , 2 , , m 1
T c α 11 = t c 11 11 / d c 1 11 t c 1 j 11 / d c 1 11 t c 1 m 1 11 / d c 1 11 t c i 1 11 / d c i 11 t c i j 11 / d c i 11 t c i m 1 11 / d c i 11 t c m 11 11 / d c m 1 11 t c m 1 j 11 / d c m 1 11 t c m 1 m 1 11 / d c m 1 11 = t c 11 α 11 t c 1 j α 11 t c 1 m 1 α 11 t c i 1 α 11 t c i j α 11 t c i m 1 α 11 t c m 11 α 11 t c m 1 j α 11 t c m 1 m 1 α 11
Then, the unweighted matrix W C is built as follows.
W = T c α = D 1 c 1 c 1 m 1 D j c j 1 c j m j D n c n 1 c n m n D 1 c 1 m 1 c 11 D i c i m i c i 1 D n c n m n c n 1 W 11 W i 1 W n 1 W 1 j W i j W n j W 1 n W i n W n n

3.3.2. Step 5: Building the Weighted Super-Matrix W α

Equations (7)–(11) are performed as the previous step for the total relationship matrix of clusters in order to build the unweighted super-matrix T D α as follows.
T D α = t D α 11 t D α i 1 t D α n 1 t D α 1 j t D α i j t D α n j t D α 1 n t D α i n t D α n n
Now, the unweighted super-matrix of clusters is multiplied by T C α to obtain the weighted super-matrix.
W α = T D α W = t D α 11 × W 11 t D α i 1 j × W i 1 t D α n 1 × W n 1 t D α i 1 × W 1 j t D α i j × W i j t D α n j × W n j t D α 1 n × W 1 n t D α i n × W i n t D α n n × W n n

3.3.3. Step 6: Building the Limit Super-Matrix

Limiting the weighted super-matrix by increasing the power k is continued until the amount of criteria weights remains unchanged. Therefore, the super-matrix is converged by lim k ( W α ) K in order to build the limit super-matrix. The super-matrix obtains the final weights used for providing a ranking [66].

3.4. The VIKOR Process

3.4.1. Step 7: Building the Normalized VIKOR Matrix

A decision matrix was built from the questionnaires collected. The entry a i j represents the influence of criteria i on alternative j. Then, the decision matrix is normalized using Equation (14).
r i j = a i j i = 1 m ( a i j ) 2

3.4.2. Step 8: Determining Positive and Negative Ideal Solutions

In this step, the positive and negative ideal solutions are calculated by Equations (15) and (16).
F * = f 1 * = m a x r i 1 , f 2 * = m a x r i 2 , , f n * = m a x r i n
F = f 1 = m i n r i 1 , f 2 = m i n r i 2 , , f n = m i n r i n

3.4.3. Step 9: Calculating the Utility Measure (S) and Regret Measure (Q) for Each Alternative

In this step, the utility measure (S) and regret measure (Q) for each alternative is obtained by Equations (17) and (18), respectively. The weights w i are those obtained by the DANP method.
S i = L i P = 1 = j = 1 n [ w j ( | f j * f i j | ) / ( | f j * f j | ) ]
Q i = L i P = = m a x w j ( | f j * f i j | ) / ( | f j * f j | ) , j = 1 , 2 , , n

3.4.4. Step 10: Calculating the VIKOR Index and Ranking of Alternatives

The VIKOR index should be measured first to choose and rank alternatives. The index is given as follows.
R k = v ( S k S * ) / ( S S * ) + ( 1 v ) ( Q k Q * ) / ( Q Q * )
where the value S = m a x i S i ,   S * = m i n i S i ,   Q * = m i n i Q i ,   Q = m a x i Q i is obtained. Then, the alternatives are ordered based on the values of Q, S, and R. Given the negative characteristic of risks, the best alternative is the one with a higher Q and S than the others, meaning that the associated alternative has a high distance from the ideal solution, and it is introduced as the desirable alternative.

4. Results

4.1. Building the Network of Risk Relations

In this section, the Influential Network Relation Map (INRM) is constructed to depict the relationships among the risks in EPC projects. The results are presented as follows.

4.1.1. Step 1: Establishing the Direct Relationship Matrix for Risk Factors

After collecting the questionnaires and eliminating imperfect ones, the direct relationship matrix is obtained based on the average scores provided by the respondents. The matrix is shown in Table 3.

4.1.2. Step 2: Building the Normalized Relationship Matrix

The normalized matrix is obtained through the utilization of Equations (2) and (3), as depicted in Table 4. Based on these equations, the maximum amount for the total sum of values in each row and column is divided by the corresponding entries in the direct relationship matrix. Consequently, the maximum summation, which is 28.375 in Column 3, serves as the divisor for all the entries in the matrix.

4.1.3. Step 3: Building the Total Relation Matrix and Network Relationship Map of Risks

In this step, we obtain the total relationship between the risks using Equations (4)–(6). The total relationship matrix ( T c ) demonstrates the direct and indirect influence of risk factors and dimensions on each other, as shown in Table 5. Additionally, Table 6 presents the importance degree of factors and dimensions, along with their causal or effect nature. In this table, the value of ( r i s j ) represents the cause or effect relationship between risks. Risks with positive values are classified as causative risks, while risks with negative values are classified as effect risks. However, it should be noted that this cause or effect relationship can be negligible in some risks when the value is near zero. For example, E4 or environmental risks exhibit both cause and effect features, but with more effect features, leading to a value close to zero for ( r i s j ) . Furthermore, the Influential Network Relation Map (INRM) for risk factors and dimensions is depicted in Figure 4a based on the obtained tables.

4.2. Determining the Weights and Ranking of Risks

4.2.1. Step 4: Calculating the Unweighted Matrix

According to Equations (7)–(11), the unweighted matrices for risk factors and dimensions are calculated as Table 7.

4.2.2. Step 5: Building the Weighted Super-Matrix

The weighted matrix for risk factors is derived using Equations (1) and (13), as seen in Table 8.

4.2.3. Step 6: Building the Limit Matrix and Ranking of the Risk Factors

In this step, the weighted super-matrix is converged using the corresponding equations in order to obtain the final weight for each risk factor. The weighted super-matrix is converged after taking the fourth power. Finally, Table 9 shows the final weights (priority) of risk factors and their ranking. These weights were used in the VIKOR calculations.

4.3. Ranking Alternatives

After collecting the questionnaires and removing imperfect ones, the VIKOR matrix was obtained to rank alternatives. The normalized matrix was calculated using Equations (1) and (14), and the indicators required to rank alternatives were derived using Equations (15)–(19). The weights of the risk factors obtained in the previous section were applied in Equations (17) and (18). Consequently, the distance between the risk factors and the ideal solution was measured. Table 10 represents the normalized matrix, positive and negative ideal solutions, and alternatives rankings.

5. Discussion

5.1. Influential Network Relation Map between Risks

Table 6 provides a characterization of the risks based on the values of ( r i + s j ) and ( r i s j ) . The value of ( r i + s j ) indicates the importance degree of each factor, while values of ( r i s j ) above the horizontal axis (positive) indicate the impact of the corresponding factor on other criteria (cause) and values below the horizontal axis (negative) imply that the factor is influenced by the others (effect).

5.1.1. Influential Relation of Risk Dimensions

According to Figure 4a and Table 6, the value of ( r i s j ) for External risk dimensions (E) is 0.25, which is the highest value among the other risk dimensions. This indicates that external risks have a significant influence on all other risk dimensions, particularly on the influenced risk dimensions P and M. As external risks are beyond the control of EPC experts, decision-makers can positively impact other risks by effectively managing and controlling these external risks. A similar pattern can be observed for Contractual risks (C) with a ( r i s j ) value of 0.19, indicating their significant influence on other criteria.
The value of ( r i + s j ) for Project lifecycle risks (P) and Market and technology risks (M) is 0.91 and 0.87, respectively, making them the most-influential dimensions among the risk dimensions. This suggests a strong relationship of these dimensions with other criteria. While EPC experts have limited control over Project lifecycle risks (P) and Market and technology risks (M), their ability to manage External risks (E) and Contractual risks (C) directly affects the other risks.
Overall, the discussion highlights that, although managers may have limited control over certain risk dimensions, such as Project lifecycle risks (P) and Market and technology risks (M), their ability to effectively manage External risks (E) and Contractual risks (C) can have a positive impact on other risks.

5.1.2. Influential Relation of External Risks

According to Figure 4e, political risks (E2) have a ( r i s j ) value of 0.29, indicating their causal nature in relation to other risks within this dimension. Although political risks are ranked third in terms of their importance degree ( r i + s j ) , they have the most-significant direct impact on other risks across the dimensions E, C, P, and M. This implies that addressing political risks and managing factors such as unstable regulations can increase the likelihood of success in the EPC market in Iran.
The high importance degree ( r i + s j ) of social risks (E3) with a value of 0.61 highlights the positive impact of promoting awareness by social decision-makers on project outcomes. By creating awareness and understanding of the benefits of EPC projects among the public, the adoption and implementation of such projects can be facilitated.
Regarding economic risks (E1), it is observed that they influence other risks and are influenced by political risks to a similar extent. An incremental increase in energy prices, as seen in markets such as Bulgaria [8], can enhance the profitability of EPC projects and promote awareness of the EPC concept. This, in turn, can lead to better financing opportunities for EPC projects. Overall, the discussion emphasizes the significance of addressing political risks, promoting social awareness, and considering economic factors such as energy prices to create a favorable environment for the development of the EPC market in Iran.

5.1.3. Influential Relation of Legal and Contractual Risks

Based on Figure 4d, the importance degree of Contractual risks (C2) is 0.44, which aligns with previous research indicating that the use of standardized contract models directly contributes to better project acceptance and execution procedures [15]. Developing contractual models tailored to the conditions of the Iranian market, through research and analysis, can significantly help in managing this risk.
The importance degree of legal risks (C1) and credit risks (C3) is approximately the same, with a value of 0.36. This emphasizes the importance of having stable legislation and addressing restrictive bureaucratic processes related to EPC projects. Additionally, it underscores the significance of trust and credibility between the parties involved in the contract.

5.1.4. Influential Relation of Market and Technological Risks

As shown in Figure 4c, the positive value of ( r i s j ) for demand risks (M1) indicates the influence of motivation factors on crucial risks related to finance (M2) and technology (M3). The presence of bidirectional arrows between finance risks (M2) and technology risks (M3) suggests a direct relationship between these two aspects. This implies that having control over finance risks contributes to the utilization of better equipment and the reduction of technology-related risks. Furthermore, mitigating technology risks enhances profitability and improves project finances.
With an importance degree of 0.61, both finance risks (M2) and technology risks (M3) are emphasized as crucial factors directly impacting the successful implementation of projects. This highlights the need for effective management of these risks to ensure project success.

5.1.5. Influential Relation of Project Lifecycle Risks

Figure 4b illustrates the high importance of all three factors within the project lifecycle dimension. Planning and design risks (P1) have an importance degree of 0.67, followed by execution risks (P2) with 0.70, and operation and maintenance risks (P3) with 0.71. This implies that EPC experts can increase the likelihood of project success by effectively managing these risks. The direct impact of planning and design risks (P1) on other risks suggests that, by mitigating risks within this factor, experts can better control other risks. Additionally, the mutual relationship between execution risks (P2) and operation and maintenance risks (P3) emphasizes the direct association between these two phases, further underscoring the importance of addressing these risks appropriately.

5.2. Risk Factors’ Priorities (Weights)

According to Table 9, operation and maintenance risks (P3) are ranked first, indicating their high priority among EPC projects. This highlights the significant importance of effectively managing these risks for the success of the project. The negative value of ( r i s j ) in Table 6 for this risk factor suggests its influenced nature, meaning that the occurrence of other risks has a negative impact on the operation and maintenance risks. This can lead to dissatisfaction among energy users and ultimately result in the failure of EPC projects. According to Table 11, the findings of this study underscore the significance of Operation and Maintenance (O&M) risks. Additionally, it is noteworthy to mention that the identified risks in other studies, namely financial risks and market risks, closely align with the most-influential risk identified in our study, which is the political risk. The results reveal that political risk has the greatest impact on other risk factors. Political stability and government policies directly influence the financial climate and market conditions for such projects. As a result, political risk emerges as a critical determinant that shapes the landscape for other risks in the EPC domain, making it a central focus of concern in both our study and other related research.
In terms of ranking, five risk factors are listed from first to fifth: P3, P2, M3, M2, and P1. Except for design and planning risks (P1), all other factors exhibit an influenced nature (effect). However, it should be noted that the role of design and planning risks (P1) is particularly important as they enable experts influence other risks by effectively controlling the planning and design stages.
In order to effectively manage project lifecycle risks (P) and market risks (M), managers and policymakers should focus on addressing other causal risks such as political risks (E2), economic risks (E1), legal risks (C1), and awareness risks (E2). These risks have a substantial negative value of ( r i s j ) in Table 6, indicating their causative nature and the potential to influence other risks. Managers have more control over these risks, making them important targets for risk mitigation.
Policy-makers are recommended to take actions to address these risks by establishing stable rules and regulations, increasing public awareness about EPC projects, and implementing measures to control inflation rates. Additionally, EPC experts should prioritize the management of highly causal risks such as design and planning risks (P1), execution risks (P2), and technology risks (M3) in order to effectively control operation and maintenance risks (P3) and finance risks (M2). Investing in human resources training and promoting awareness, in conjunction with managing other risks, can contribute to better control of execution risks.

5.3. Ranking of Alternatives

According to Table 10, the implementation of public packaged projects (A2) is ranked highest in terms of success probability and lowest in terms of risk probability, based on the calculated risk weights and the opinions of the respondents. This indicates that these projects have a higher likelihood of success and lower overall risk compared to the other alternatives considered. The success of public packaged projects can be attributed to several factors. Firstly, these projects, which involve public buildings, hospitals, schools, and universities, typically have a higher profit margin for Energy Service Companies (ESCOs) compared to small or medium-scale projects. This profitability factor plays a role in mitigating the overall risk associated with the projects.
Furthermore, the implementation of a considerable number of similar public projects helps with reducing execution risks (P2) and operation and maintenance risks (P3). This is because the experience gained from executing multiple projects of the same nature allows for better planning and execution, resulting in a more-efficient management of risks. Additionally, the successful implementation of these public projects contributes to raising awareness among the public about the concept of energy performance, which in turn helps with better controlling social risks (E3) and finance risks (M2). Once public projects have been successfully implemented and external risks and contractual risks have been effectively controlled, it becomes more feasible to undertake projects in the industrial sector or municipalities. These projects can leverage the experience gained from the successful execution of public projects and benefit from the improved risk management practices.
In conclusion, the ranking of alternatives suggests that starting with the implementation of public packaged projects can provide a solid foundation for EPC projects, given their higher success probability and lower risk probability. This can be followed by gradually expanding into other sectors and municipalities, utilizing the knowledge and risk mitigation strategies gained from previous projects.
While public packaged projects appear to be the most-favorable alternative, it is essential to consider potential challenges and limitations that may arise during their implementation, especially in emerging markets such as Iran. One of the primary challenges in executing public packaged projects could be the complex bureaucratic processes and regulatory requirements that often accompany public-sector initiatives. Overcoming administrative hurdles and ensuring streamlined approvals can be critical to expedite project execution and maintain the anticipated success probability. Additionally, although public projects may offer higher profit margins for Energy Service Companies (ESCOs), they may also entail longer payment cycles and potential cash flow challenges. Addressing financial risks and ensuring timely payments from public entities may require careful negotiation and contractual arrangements.
To address these challenges and ensure the successful implementation of public packaged projects and subsequent expansion, several strategies and recommendations can be considered. These include: (1) engaging in proactive collaboration with relevant government authorities to streamline administrative processes and secure necessary approvals efficiently; (2) developing robust and comprehensive contractual agreements that explicitly address financial risks and ensure payment certainty; (3) leveraging the experience gained from successful public projects to continuously refine risk management practices and enhance project execution efficiency.

6. Conclusions

In conclusion, this research has highlighted the significance of analyzing risks and their relationships in the successful implementation of Energy Performance Contracting (EPC) projects in developing countries with high energy consumption. By applying a hybrid MCDM method combining the DEMATEL, ANP, and VIKOR techniques, several important findings and recommendations have been obtained. Firstly, the influential network relation map provided insights into the interdependencies among different risk dimensions and factors. External risks, particularly political risks, were identified as having the greatest direct impact on other risks. On the other hand, project lifecycle risks had a significant cause or effect relationship with other risks. This highlights the need for effective risk management strategies, particularly in relation to external risks and project lifecycle risks. Secondly, the risk priorities (weights) were calculated using the DANP method. Operation and maintenance risks emerged as the highest-priority risk factor among the EPC projects. This emphasizes the importance of focusing on effective maintenance and operation practices to ensure project success. Lastly, the most-advantageous alternatives for implementing EPC projects were ranked based on risk priorities and feedback from respondents. Public packaged projects, such as public buildings, hospitals, schools, and universities, were identified as the most-practical and -promising alternative, with the highest success probability in the early stages of market development. These projects offer higher profitability for ESCOs and contribute to raising awareness about energy performance among the public.
To enhance the success of EPC projects in emerging markets facing political and legal challenges, decision-makers should prioritize the establishment of stable and supportive laws and regulations. This can help control political and legal contractual risks, along with other risks. Implementing public packaged projects can serve as a stepping stone to effectively manage risks related to operation and maintenance, execution, social factors, and finance. Furthermore, EPC experts should pay particular attention to controlling planning and design risks, as it enables them to influence and mitigate other risks.
Overall, the findings of this research provide valuable insights and recommendations for the risk management and implementation of EPC projects in developing countries. By considering the identified risks, their relationships, and the recommended strategies, decision-makers and stakeholders can enhance the success and sustainability of EPC projects, contributing to improved energy efficiency and reduced carbon emissions.

Author Contributions

Conceptualization, H.N.; methodology, H.N.; software, M.H.H.; validation, M.H.H. and M.P.J.; formal analysis, M.P.J.; investigation, M.H.H.; resources, M.P.J.; data curation, M.H.H.; writing—original draft preparation, H.N.; writing—review and editing, M.H.H.; visualization, M.H.H.; supervision, M.P.J.; project administration, H.N. All authors have read and agreed to the published version of the manuscript.

Funding

This research received no external funding.

Informed Consent Statement

Informed consent was obtained from all subjects involved in the study.

Data Availability Statement

Data and models that support the findings of the study are available from the corresponding author upon reasonable request.

Acknowledgments

The authors acknowledge VT’s OASF support for covering the fees for publishing this article.

Conflicts of Interest

The authors declare no conflict of interest.

Abbreviations

The following abbreviations are used in this manuscript:
EPCEnergy Performance Contracting
ESCOEnergy Service Company
MCDMMulti Criteria Decision Making
DEMATELDecision-Making Trial and Evaluation Laboratory
DANPDEMATEL Analytic Network Process
VIKORVIekriterijumsko KOmpromisno Rangiranje
INRMInfluential Network Relation Map

Appendix A

The identified risk factors and dimensions are classified as follows.
Table A1. Identification and classification of risks based on literature review and expert opinions.
Risks Dimensions and FactorsDescriptionReferences
Project Lifecycle Risks (P)
 Planning and Designing Risks (P1)Lack of accuracy in initial data (client)[23,38,39]
Quality of data measurement (ESCOs)[20,40]
Predictability of energy consumption pattern[10]
Lack of consulting ESCOsExpert opinion
 Execution Risks (P2)Lack of reliable subcontractors[21,41]
Project time management[20,21]
Quality of working atmosphere([39,41]
Changes in client’s requests[10]
 Operation and Maintenance Risks (P3)The lack of standards in O&M[23,43,44]
The lack of awareness of O&M[21,50]
Changing the client during O&MExpert opinion
Market and Technology Risks (M)
 Demand Risks (M1)Demand and competition issues[21,23]
Lack of motivation for investment[23]
Expert opinion
 Financial Risks (M2)Cumbersome process of financing[19]
Low repayment capacity of ESCOs[23,44]
Failure to find practical finance method[41,46]
Fluctuations in the interest rate[41,46]
Lack of government guarantees[40,46,47]
Inability of investors to fulfill financial obligationsExpert opinion
 Technology Risks (M3)The proper performance of installed equipment[19,38,48]
Complexity of energy user equipment[43,46]
Increased dependency on imports[47]
Costliness of imported technology[41]
Expert opinion
Legal and Contractual Risks (C)
 Legal Risks (C1)Unstable rules and regulations[41,45]
Lack of supportive policies[2,41,45]
Cumbersome local rulesExpert opinion
Delays in conceding required permits[48]
 Contractual Risks (C2)Lack of standard local contract models[21,49]
Lack of contracts according to M&V[21]
 Credit Risks (C3)Lack of trust among parties[49,50]
Possibility of non-fulfillment of obligations[23,49]
External Risks (E)
 Economic Risks (E1)Low energy prices[51,52]
Exchange rate fluctuations[40,46]
Uncertainty of energy tariffs[21,23]
Increasing inflation rate[41,46]
 Political Risks (E2)Change in governments’ supportive priorities[44]
Expert opinion
 Social Risks (E3)Lack of awareness and high expectation[38,53]
Public opposition to increased energy pricesExpert opinion
Project neighbors’ discontentExpert opinion
 Environmental Risks (E4)Unfavorable weather conditions[10,21]
Worsening environmental aspectsExpert opinion

Appendix B

The questionnaire tables were designed as follows.
Figure A1. DEMATEL and VIKOR questionnaires.
Buildings 13 02066 g0a1

References

  1. IEA. Building Energy. 2021. Available online: https://www.iea.org/energy-system/buildings (accessed on 10 July 2023).
  2. Yuan, X.; Ma, R.; Zuo, J.; Mu, R. Towards a sustainable society: The status and future of energy performance contracting in China. J. Clean. Prod. 2016, 112, 1608–1618. [Google Scholar] [CrossRef]
  3. Hopper, N.; Goldman, C.; McWilliams, J.; Birr, D. Public and Institutional Markets for ESCO Services: Comparing Programs, Practices and Prformance; Ernest Orlando Lawrence Berkeley National Laboratory, University of California Berkeley: Berkeley, CA, USA, 2005.
  4. Ürge-Vorsatz, D.; Köppel, S.; Liang, C.; Kiss, B.; Nair, G.G.; Celikyilmaz, G. WEC ADEME Project on Energy Efficiency Policies an Assessment of on Energy Service Companies (ESCOs) Worldwide. 2007. Available online: https://www.researchgate.net/publication/239602666_An_Assessment_of_on_Energy_Service_Companies_ESCOs_Worldwide (accessed on 10 July 2023).
  5. Boza-Kiss, B.; Bertoldi, P.; Economidou, M. Energy Service Companies in the EU; Technical Report; EU Publications: Luxembourg, 2017. [CrossRef]
  6. Qin, Q.; Liang, F.; Li, L.; Wei, Y.M. Selection of energy performance contracting business models: A behavioral decision-making approach. Renew. Sustain. Energy Rev. 2017, 72, 422–433. [Google Scholar] [CrossRef]
  7. Rosenow, J.; Cowart, R.; Thomas, S. Market-based instruments for energy efficiency: A global review. Energy Effic. 2018, 12, 1379–1398. [Google Scholar] [CrossRef]
  8. Hansen, S.J.; Langlois, P.W.; Bertoldi, P. ESCOs around the World: Lessons Learned in 49 Countries; CRC Press: Boca Raton, FL, USA, 2009; p. 377. [Google Scholar]
  9. Parchami Jalal, M.; Naderi, H. Investigation of ESCO developing markets and strategies to develop Energy Performance Contracts (EPC) Projects in iran. J. Renew. New Energy 2018, 5, 28–38. (In Persian) [Google Scholar]
  10. Lee, P.; Lam, P.T.; Lee, W.L. Risks in Energy Performance Contracting (EPC) projects. Energy Build. 2015, 92, 116–127. [Google Scholar] [CrossRef]
  11. Kostka, G.; Shin, K. Energy conservation through energy service companies: Empirical analysis from China. Energy Policy 2013, 52, 748–759. [Google Scholar] [CrossRef]
  12. Xu, P.; Chan, E.H.W.; Qian, Q.K. Success factors of energy performance contracting (EPC) for sustainable building energy efficiency retrofit (BEER) of hotel buildings in China. Energy Policy 2011, 39, 7389–7398. [Google Scholar] [CrossRef]
  13. Zhang, Y.; Han, Q.M.; Liu, C.B.; Sun, J.Y. Analysis for critical success factors of energy performance contracting (EPC) projects in China. In Proceedings of the 2008 IEEE International Conference on Industrial Engineering and Engineering Management, IEEM 2008, Singapore, 8–11 December 2008; pp. 675–679. [Google Scholar] [CrossRef]
  14. Bertoldi, P.; Boza-Kiss, B. Analysis of barriers and drivers for the development of the ESCO markets in Europe. Energy Policy 2017, 107, 345–355. [Google Scholar] [CrossRef]
  15. Vine, E. An international survey of the energy service company (ESCO) industry. Energy Policy 2005, 33, 691–704. [Google Scholar] [CrossRef]
  16. Pätäri, S.; Sinkkonen, K. Energy Service Companies and Energy Performance Contracting: Is there a need to renew the business model? Insights from a Delphi study. J. Clean. Prod. 2014, 66, 264–271. [Google Scholar] [CrossRef]
  17. Kindström, D.; Ottosson, M.; Thollander, P. Driving forces for and barriers to providing energy services—A study of local and regional energy companies in Sweden. Energy Effic. 2017, 10, 21–39. [Google Scholar] [CrossRef] [Green Version]
  18. Da-li, G. Energy service companies to improve energy efficiency in China: Barriers and removal measures. Procedia Earth Planet. Sci. 2009, 1, 1695–1704. [Google Scholar] [CrossRef] [Green Version]
  19. Liu, G.; Zheng, S.; Xu, P.; Zhuang, T. An ANP-SWOT approach for ESCOs industry strategies in Chinese building sectors. Renew. Sustain. Energy Rev. 2018, 93, 90–99. [Google Scholar] [CrossRef]
  20. Lee, P.; Lam, P.T.; Yik, F.W.; Chan, E.H. Probabilistic risk assessment of the energy saving shortfall in energy performance contracting projects—A case study. Energy Build. 2013, 66, 353–363. [Google Scholar] [CrossRef] [PubMed]
  21. Wang, Z.; Xu, G.; Lin, R.; Wang, H.; Ren, J. Energy performance contracting, risk factors, and policy implications: Identification and analysis of risks based on the best-worst network method. Energy 2019, 170, 1–13. [Google Scholar] [CrossRef]
  22. Wang, L.; Peng, J.J.; Wang, J.Q. A multi-criteria decision-making framework for risk ranking of energy performance contracting project under picture fuzzy environment. J. Clean. Prod. 2018, 191, 105–118. [Google Scholar] [CrossRef]
  23. Garbuzova-Schlifter, M.; Madlener, R. AHP-based risk analysis of energy performance contracting projects in Russia. Energy Policy 2016, 97, 559–581. [Google Scholar] [CrossRef]
  24. Gölcük, İ.; Baykasoğlu, A. An analysis of DEMATEL approaches for criteria interaction handling within ANP. Expert Syst. Appl. 2016, 46, 346–366. [Google Scholar] [CrossRef]
  25. Singh, S.; Chandra Misra, S.; Kumar, S. Identification and ranking of the risk factors involved in PLM implementation. Int. J. Prod. Econ. 2020, 222, 107496. [Google Scholar] [CrossRef]
  26. Ou Yang, Y.P.; Shieh, H.M.; Leu, J.D.; Tzeng, G.H. A vikor-based multiple criteria decision method for improving information security risk. Int. J. Inf. Technol. Decis. Mak. 2009, 8, 267–287. [Google Scholar] [CrossRef]
  27. Hsu, C.H.; Wang, F.K.; Tzeng, G.H. The best vendor selection for conducting the recycled material based on a hybrid MCDM model combining DANP with VIKOR. Resour. Conserv. Recycl. 2012, 66, 95–111. [Google Scholar] [CrossRef]
  28. Nguyen, V.T.T.; Wang, C.N.; Yang, F.C.; Vo, T.M.N. Efficiency Evaluation of Cyber Security Based on EBM-DEA Model. Eurasia Proc. Sci. Technol. Eng. Math. 2022, 17, 38–44. [Google Scholar] [CrossRef]
  29. Wang, C.N.; Yang, F.C.; Vo, N.T.M.; Thanh, V.; Nguyen, T. Enhancing Lithium-Ion Battery Manufacturing Efficiency: A Comparative Analysis Using DEA Malmquist and Epsilon-Based Measures. Batteries 2023, 9, 317. [Google Scholar] [CrossRef]
  30. Kler, R.; Gangurde, R.; Elmirzaev, S.; Hossain, M.S.; Vo, N.V.; Nguyen, T.V.; Kumar, P.N. Optimization of Meat and Poultry Farm Inventory Stock Using Data Analytics for Green Supply Chain Network. Discret. Dyn. Nat. Soc. 2022, 2022, 1–8. [Google Scholar] [CrossRef]
  31. Alipour-Vaezi, M.; Aghsami, A.; Rabbani, M. Introducing a novel revenue-sharing contract in media supply chain management using data mining and multi-criteria decision-making methods. Soft Comput. 2022, 26, 2883–2900. [Google Scholar] [CrossRef]
  32. Mohammadnazari, Z.; Mamoudan, M.M.; Alipour-Vaezi, M.; Aghsami, A.; Jolai, F.; Yazdani, M. Prioritizing Post-Disaster Reconstruction Projects Using an Integrated Multi-Criteria Decision-Making Approach: A Case Study. Buildings 2022, 12, 136. [Google Scholar] [CrossRef]
  33. Alipour-Vaezi, M.; Rezaie, K.; Tavakkoli-Moghaddam, R. Proposing a Novel Data-Driven Optimization Methodology to Calculate the Insurance Premium in the Iranian Health Insurance Industry. Emerg. Mark. Financ. Trade 2023, 59, 3362–3377. [Google Scholar] [CrossRef]
  34. Ballesteros, L.M.S.; Ourang, S.; Pazdon, J.; Kuffel, K. Increasing safety in residential construction through a simplified earthquake- and typhoon-resistant guidelines. J. Future Sustain. 2023, 3, 119–124. [Google Scholar] [CrossRef]
  35. Ourang, S. Evaluation of Inter-Organizational Coordination of Housing Services in Rural Alaska through Social Network Analysis. 2022. Available online: https://dr.lib.iastate.edu/entities/publication/ea904209-079d-44a7-9260-bbb2412cad5f (accessed on 10 July 2023).
  36. Rajabi, M.S.; Rezaeiashtiani, M.; Radzi, A.R.; Famili, A.; Rezaeiashtiani, A.; Rahman, R.A. Underlying Factors and Strategies for Organizational BIM Capabilities: The Case of Iran. Appl. Syst. Innov. 2022, 5, 109. [Google Scholar] [CrossRef]
  37. Rajabi, M.S.; Radzi, A.R.; Rezaeiashtiani, M.; Famili, A.; Rashidi, M.E.; Rahman, R.A. Key Assessment Criteria for Organizational BIM Capabilities: A Cross-Regional Study. Buildings 2022, 12, 1013. [Google Scholar] [CrossRef]
  38. Cook, D.; Bradford, J. Energy Saving Performance Contracts; Technical Report; Construction Financial Management Association: Princeton, NJ, USA, 2012; Available online: https://www.google.com/url?sa=t&rct=j&q=&esrc=s&source=web&cd=&ved=2ahUKEwj495KPwtiAAxUzQjABHWCkBYUQFnoECBEQAQ&url=https%3A%2F%2Fahclaw.com%2Fwp-content%2Fuploads%2F2012%2F11%2FArticle-CFMA-re-EPSCs.pdf&usg=AOvVaw3KusYZkhecntSRMLYfexPU&opi=89978449 (accessed on 10 July 2023).
  39. Heimonen, I.; Immonen, I.; Kauppinen, T.; Nyman, M.; Junnonen, J.M. Risk management for planning and use of building service systems—VTT’s Research Information Portal. In Proceedings of the 9th REHVA World Congress Clima 2007, WellBeing Indoors, Helsinki, Finland, 10–14 June 2007. [Google Scholar]
  40. Mills, E.; Kromer, S.; Weiss, G.; Mathew, P.A. From volatility to value: Analysing and managing financial and performance risk in energy savings projects. Energy Policy 2006, 34, 188–199. [Google Scholar] [CrossRef]
  41. Jinrong, H.; Enyi, Z. Engineering Risk Management Planning in Energy Performance Contracting in China. Syst. Eng. Procedia 2011, 1, 195–205. [Google Scholar] [CrossRef] [Green Version]
  42. Shang, T.; Zhang, K.; Liu, P.; Chen, Z. A review of energy performance contracting business models: Status and recommendation. Sustain. Cities Soc. 2017, 34, 203–210. [Google Scholar] [CrossRef]
  43. Hansen, S.J. Performance Contracting: Expanding Horizons; The Fairmont Press, Inc.: Lilburn, GA, USA, 2006; p. 343. [Google Scholar]
  44. Sarkar, A.; Singh, J. Financing energy efficiency in developing countries-lessons learned and remaining challenges. Energy Policy 2010, 38, 5560–5571. [Google Scholar] [CrossRef]
  45. Shahateet, M.I.; Khazali, M.; Albaali, G.; Sweis, N.; Saidi, A.G. Barriers to improving energy efficiency: Insights from energy services companies in jordan. Int. J. Energy Econ. Policy 2021, 11, 155–164. [Google Scholar] [CrossRef]
  46. Wang, J.; Chen, X. Estimation of the risks of energy performance contract projects based on the unascertained measure model. In Proceedings of the IEEE International Conference on Automation and Logistics, ICAL 2008, Qingdao, China, 1–3 September 2008; pp. 1043–1047. [Google Scholar] [CrossRef]
  47. Shang, T.C.; Zhang, L.R.; Liu, P.H.; Pan, Z.N. The risk of energy performance contracting project. In Proceedings of the 2008 International Conference on Wireless Communications, Networking and Mobile Computing, WiCOM 2008, Dalian, China, 12–17 October 2008. [Google Scholar] [CrossRef]
  48. Zhang, X.; Li, X.; Chen, S. Problem and Countermeasure of Energy Performance Contracting in China. Energy Procedia 2011, 5, 1377–1381. [Google Scholar] [CrossRef] [Green Version]
  49. Carbonara, N.; Pellegrino, R. Public-private partnerships for energy efficiency projects: A win-win model to choose the energy performance contracting structure. J. Clean. Prod. 2018, 170, 1064–1075. [Google Scholar] [CrossRef]
  50. Martinot, E. World bank energy projects in China: Influences on environmental protection. Energy Policy 2001, 29, 581–594. [Google Scholar] [CrossRef]
  51. Bertoldi, P.; Rezessy, S.; Vine, E. Energy service companies in European countries: Current status and a strategy to foster their development. Energy Policy 2006, 34, 1818–1832. [Google Scholar] [CrossRef]
  52. Lu, Z.; Shao, S. Impacts of government subsidies on pricing and performance level choice in Energy Performance Contracting: A two-step optimal decision model. Appl. Energy 2016, 184, 1176–1183. [Google Scholar] [CrossRef]
  53. Stuart, E.; Larsen, P.H.; Carvallo, J.; Goldman, C.A.; Gilligan, D. U.S. Energy Service Company (ESCO) Industry: Recent Market Trends; Lawrence Berkeley National Lab. (LBNL): Berkeley, CA, USA, 2016; p. 51.
  54. Seefeldt, F. Energy Performance Contracting—Success in Austria and Germany—Dead End for Europe? European Council for an Energy-Efficient Economy: Stockholm, Sweden, 2003. [Google Scholar]
  55. Wargert, D. Energy Contracting Models in Germany and Sweden. Master’s Thesis, Lund University, Lund, Sweden, 2011; p. 100. [Google Scholar]
  56. Geißler, M.; Waldmann, A.; Berliner Energieagentur GmbH. Market Development for Energy Services in the European Union. The Applicability of Energy Performance Contracting in the EU Member States under the Given Conditions of Public Procurement Laws and Budgetary Rules. 2006, pp. 88–99. Available online: https://www.google.com/url?sa=t&rct=j&q=&esrc=s&source=web&cd=&ved=2ahUKEwivuYPRwtiAAxVZSjABHSpvCK4QFnoECBEQAQ&url=https%3A%2F%2Fwww.aceee.org%2Ffiles%2Fproceedings%2F2006%2Fdata%2Fpapers%2FSS06_Panel8_Paper08.pdf&usg=AOvVaw07QdeJQbBevokgGMutY6Dx&opi=89978449 (accessed on 10 July 2023).
  57. Lee, M.K.; Park, H.; Noh, J.; Painuly, J.P. Promoting energy efficiency financing and ESCOs in developing countries: Experiences from Korean ESCO business. J. Clean. Prod. 2003, 11, 651–657. [Google Scholar] [CrossRef]
  58. Akman, U.; Okay, E.; Okay, N. Current snapshot of the Turkish ESCO market. Energy Policy 2013, 60, 106–115. [Google Scholar] [CrossRef]
  59. Okay, E.; Okay, N.; Konukman, A.E.Ş.; Akman, U. Views on Turkey’s impending ESCO market: Is it promising? Energy Policy 2008, 36, 1821–1825. [Google Scholar] [CrossRef]
  60. IEA. Energy Service Companies (ESCOs). 2018. Available online: https://www.iea.org/reports/energy-service-companies-escos-2 (accessed on 10 July 2023).
  61. Hofer, K.; Limaye, D.; Singh, J. Fostering the Development of ESCO Markets for Energy Efficiency. In Fostering the Development of ESCO Markets for Energy Efficiency; World Bank: Washington, DC, USA, 2016; pp. 1–8. [Google Scholar] [CrossRef]
  62. Saaty, T.L. What is the Analytic Hierarchy Process? In Mathematical Models for Decision Support; Springer: Berlin/Heidelberg, Germany, 1988; pp. 109–121. [Google Scholar] [CrossRef]
  63. Chen, S.H.; Lin, W.T. Analyzing determinants for promoting emerging technology through intermediaries by using a DANP-based MCDA framework. Technol. Forecast. Soc. Chang. 2018, 131, 94–110. [Google Scholar] [CrossRef]
  64. Saaty, T.L.; Vargas, L.G. The Analytic Network Process. Int. Ser. Oper. Res. Manag. Sci. 2013, 195, 1–40. [Google Scholar] [CrossRef]
  65. Chiu, W.Y.; Tzeng, G.H.; Li, H.L. A new hybrid MCDM model combining DANP with VIKOR to improve e-store business. Knowl.-Based Syst. 2013, 37, 48–61. [Google Scholar] [CrossRef]
  66. Tzeng, G.H.; Huang, J.J. Multiple Attribute Decision Making, Methods and Applications; CRC Press, Taylor & Francis Group: Boca Raton, FL, USA, 2012. [Google Scholar]
  67. Tzeng, G.H.; Chiang, C.H.; Li, C.W. Evaluating intertwined effects in e-learning programs: A novel hybrid MCDM model based on factor analysis and DEMATEL. Expert Syst. Appl. 2007, 32, 1028–1044. [Google Scholar] [CrossRef]
  68. Gabus, A.; Fontela, E. World Problems, An Invitation to Further Thought within the Framework of DEMATEL; Battelle Geneva Research Center: Geneva, Switzerland, 1972. [Google Scholar]
  69. Opricovic, S.; Tzeng, G.H. Extended VIKOR method in comparison with outranking methods. Eur. J. Oper. Res. 2007, 178, 514–529. [Google Scholar] [CrossRef]
Figure 1. An outline of the research process.
Buildings 13 02066 g001
Figure 2. Schematic diagram of DANP with VIKOR method.
Buildings 13 02066 g002
Figure 3. Focus group meetings inputs and outputs.
Buildings 13 02066 g003
Figure 4. Influential Network Relation Map (INRM) among dimension risks (a) and among risk factors of P (b), M (c), C (d), and E (e).
Buildings 13 02066 g004
Table 1. Identified alternatives for EPC projects (the left side is based on international experience, and the right side is according to expert opinions).
Market SituationIdentified AlternativesReferencesExpert Opinions
Developed Markets Municipal street lighting projects (A1)
USAPublic projects such as universities, schools, and hospitals[8,43,53]
GermanyPackaged projects in the public sector sector[15,54,55]
AustriaStreet lighting projects by municipalities[14,56]Public packaged projects (many public buildings as one project) (A2)
Developing Markets
South KoreaIndustrial projects supported by the government[8,57]
TurkeyPrivate residential and industrial projects with scientific support from universities[58,59]Private industrial with support of universities and government (A3)
BulgariaPublic sector projects by municipalities[8,14]
Table 2. Information of experts participating in the survey.
ExpertEducationYears of Experience
Academic Expert 1Ph.D. in Mechanical Engineering12 years
Academic Expert 2Ph.D. in Electrical Engineering8 years
Academic Expert 3Ph.D. in Civil Engineering10 years
Government Official 1B.Sc. in Mechanical Engineering12 years
Government Official 2M.Sc. in Public Policy7 years
Government Official 3B.Sc. in Political Science14 years
Government Official 4Ph.D. in Law18 years
ESCO Expert 1B.Sc. in Mechanical Engineering9 years
ESCO Expert 2B.Sc. in Electrical Engineering12 years
ESCO Expert 3M.Sc. in Energy Management6 years
ESCO Expert 4M.Sc. in Business Administration19 years
Table 3. Direct relationship matrix for risk factors.
P1P2P3M1M2M3C1C2C3E1E2E3E4
P10.0003.1103.1200.4101.7442.2440.4600.1300.2440.0900.1400.8402.680
P20.9100.0003.2900.9190.5811.9300.8600.7800.5810.1700.0901.8201.940
P30.7600.7900.0002.1901.5811.9300.9800.6300.5810.1200.1401.9600.330
M11.6632.4191.7560.0003.3371.9300.8370.8370.9070.1400.1401.1000.060
M22.3263.3702.2500.4190.0002.6630.3200.4190.8370.3100.1401.4300.110
M32.8603.0812.8300.9071.0810.0000.2300.3700.4190.1100.0901.1002.330
C11.2441.2440.8603.4192.7601.4190.0002.8600.4192.0810.1401.2440.140
C23.5813.4192.5122.8303.2301.0930.3600.0002.0810.4190.1401.0810.090
C31.5811.5122.2301.7561.2440.7561.2561.5930.0000.0000.0000.4190.000
E11.4883.2602.7563.6903.4302.6630.8370.4192.1740.0000.8372.5120.000
E20.1400.3371.0932.3373.1403.2442.6861.0930.9073.7560.0002.5100.000
E31.0931.2442.7602.8501.7561.0930.4190.8371.3300.9070.4190.0000.000
E42.4602.5932.9300.4191.2562.4190.8800.1400.1400.3600.1400.8370.000
Table 4. Normalized relationship matrix of risk factors.
P1P2P3M1M2M3C1C2C3E1E2E3E4
P10.0000.1100.1100.0140.0610.0790.0160.0050.0090.0030.0050.0300.094
P20.0320.0000.1160.0320.0200.0680.0300.0270.0200.0060.0030.0640.068
P30.0270.0280.0000.0770.0560.0680.0350.0220.0200.0040.0050.0690.012
M10.0590.0850.0620.0000.1180.0680.0290.0290.0320.0050.0050.0390.002
M20.0820.1190.0790.0150.0000.0940.0110.0150.0290.0110.0050.0500.004
M30.1010.1090.1000.0320.0380.0000.0080.0130.0150.0040.0030.0390.082
C10.0440.0440.0300.1200.0970.0500.0000.1010.0150.0730.0050.0440.005
C20.1260.1200.0880.1000.1140.0390.0130.0000.0730.0150.0050.0380.003
C30.0560.0530.0790.0620.0440.0270.0440.0560.0000.0000.0000.0150.000
E10.0520.1150.0970.1300.1210.0940.0290.0150.0770.0000.0290.0880.000
E20.0050.0120.0390.0820.1110.1140.0950.0390.0320.1320.0000.0880.000
E30.0390.0440.0970.1000.0620.0390.0150.0290.0470.0320.0150.0000.000
E40.0870.0910.1030.0150.0440.0850.0310.0050.0050.0130.0050.0290.000
Table 5. The total relationship matrix of risk factors and risk dimensions.
PP1P2P3MM1M2M3CC1C2C3EE1E2E3E4ri
P0.115 0.108 0.044 0.053 0.320
P1 0.0620.1810.195 0.0660.1160.146 0.0420.030.033 0.0170.0110.080.1280.438
P2 0.0890.0730.191 0.0860.080.127 0.0540.0520.046 0.020.0090.1070.0950.352
P3 0.0790.0950.073 0.120.1090.12 0.0540.0450.044 0.0170.010.1060.0370.247
M0.161 0.099 0.046 0.047 0.353
M1 0.1190.1640.151 0.0540.1730.135 0.0540.0560.059 0.0190.0110.0880.0390.362
M2 0.1350.1880.166 0.0670.0580.154 0.0360.040.054 0.0230.0110.0980.0450.279
M3 0.1550.1820.188 0.0820.0970.072 0.0350.0370.04 0.0170.0090.0880.1180.252
C0.159 0.144 0.065 0.046 0.414
C1 0.1260.1540.143 0.190.1850.136 0.0310.130.058 0.0890.0140.1070.0420.22
C2 0.2010.2250.208 0.1660.1940.133 0.0490.0360.108 0.0310.0130.1050.0520.193
C3 0.1060.1190.148 0.1080.10.083 0.0640.0790.025 0.0120.0050.0570.0280.168
E0.16 0.162 0.070 0.060 0.452
E1 0.1460.2350.233 0.2130.2190.199 0.0720.060.12 0.0240.0390.1650.0510.279
E2 0.1030.1410.17 0.1790.2170.214 0.130.0840.083 0.1570.0130.1650.0410.375
E3 0.0980.1220.178 0.1530.1280.107 0.0420.0570.076 0.0450.0210.0510.030.147
E4 0.140.1630.186 0.0670.1010.149 0.0550.030.03 0.0260.0110.0790.040.155
s i 0.5950.230.350.460.5130.20.330.360.2250.140.250.190.2060.250.080.460.16
Table 6. Cause–effect relationships between risks and dimensions.
PP1P2P3MM1M2M3CC1C2C3EE1E2E3E4
ri0.3200.4400.3500.2500.3500.3600.2800.2500.4100.2200.1900.1700.4500.2800.3700.1500.160
si0.5900.2300.3500.4600.5100.2000.3300.3600.2200.1400.2500.1900.2100.2500.0800.4600.160
ri+si0.9100.6700.7000.7100.8700.5700.6100.6100.6400.3600.4400.3600.6600.5300.4600.6100.320
ri-si−0.2700.2100.000−0.210−0.1600.160−0.050−0.1100.1900.080−0.050−0.0200.2500.0300.290−0.310−0.010
Natureeffectcausecauseeffecteffectcauseeffecteffectcausecauseeffecteffectcausecausecauseeffecteffect
Table 7. Unweighted matrix for risk factors and dimensions.
PP1P2P3MM1M2M3CC1C2C3EE1E2E3E4
P0.359 0.456 0.384 0.354
P1 0.1410.2520.319 0.2750.2770.295 0.2980.3170.284 0.2380.2490.2450.286
P2 0.4140.2060.385 0.3780.3840.347 0.3630.3550.32 0.3830.3420.3080.334
P3 0.4450.5420.296 0.3470.3390.358 0.3380.3280.396 0.3790.410.4470.38
M0.336 0.281 0.348 0.359
M1 0.2010.2930.345 0.1490.2410.326 0.3720.3360.371 0.3380.2940.3950.211
M2 0.3540.2740.312 0.4780.2060.386 0.3620.3940.343 0.3470.3550.3310.319
M3 0.4450.4340.343 0.3730.5530.287 0.2670.270.285 0.3150.3510.2740.47
C0.138 0.13 0.156 0.155
C1 0.4030.3560.374 0.3180.2780.314 0.1430.2520.383 0.2850.4390.2410.478
C2 0.2810.3430.316 0.3320.3040.332 0.5930.1890.47 0.2380.2820.3250.262
C3 0.3170.3020.309 0.3510.4180.354 0.2630.560.147 0.4770.2790.4340.26
E0.166 0.134 0.112 0.132
E1 0.070.0860.102 0.1220.1310.072 0.3530.1540.121 0.0870.4170.3060.166
E2 0.0460.040.06 0.070.0610.04 0.0570.0650.049 0.1390.0340.1420.07
E3 0.3410.4630.619 0.5630.5540.38 0.4240.5210.557 0.5920.4390.350.508
E4 0.5430.4120.219 0.2460.2540.508 0.1660.260.274 0.1820.1090.2010.256
Table 8. Total Weighted matrix.
P1P2P3M1M2M3C1C2C3E1E2E3E4
P10.0510.0910.1150.1250.1260.1340.1150.1220.1090.0840.0880.0870.101
P20.1490.0740.1380.1720.1750.1580.140.1360.1230.1350.1210.1090.118
P30.160.1950.1060.1580.1540.1630.130.1260.1520.1340.1450.1580.134
M10.0680.0980.1160.0420.0680.0920.1290.1170.1290.1210.1060.1420.076
M20.1190.0920.1050.1340.0580.1090.1260.1370.120.1250.1280.1190.115
M30.150.1460.1150.1050.1550.0810.0930.0940.0990.1130.1260.0990.169
C10.0560.0490.0520.0410.0360.0410.0220.0390.060.0440.0680.0370.074
C20.0390.0470.0440.0430.0390.0430.0930.0290.0730.0370.0440.050.041
C30.0440.0420.0430.0450.0540.0460.0410.0870.0230.0740.0430.0670.04
E10.0120.0140.0170.0160.0170.010.0390.0170.0140.0120.0550.0410.022
E20.0080.0070.010.0090.0080.0050.0060.0070.0050.0180.0040.0190.009
E30.0560.0770.1030.0750.0740.0510.0470.0580.0620.0780.0580.0460.067
E40.090.0680.0360.0330.0340.0680.0190.0290.0310.0240.0140.0270.034
Table 9. Ranking of risk factors.
P1P2P3M1M2M3C1C2C3E1E2E3E4
Risks Weights0.1060.1360.1510.0950.1080.1210.0460.0460.0480.0180.0090.0690.047
Ranking52164311108121379
Table 10. Alternative rankings.
Normalized Decision Matrix F * F Global WeightDistant to Ideals
A1A2A3A1A2A3
P10.3200.3000.3800.3800.3000.1100.0780.1060.000
P20.2800.3100.4100.4100.2800.1400.1360.0990.000
P30.3600.2800.3500.3600.2800.1500.0000.1510.018
M10.3800.2400.3900.3900.2400.0900.0060.0950.000
M20.4300.2100.3600.4300.2100.1100.0000.1080.032
M30.3200.3100.3800.3800.3100.1200.0970.1210.000
C10.2900.4000.3100.4000.2900.0500.0460.0000.039
C20.2800.4300.2900.4300.2800.0500.0460.0000.046
C30.3600.3000.3400.3600.3000.0500.0000.0480.011
E10.4000.2100.3800.4000.2100.0200.0000.0180.002
E20.3300.3600.3100.3600.3100.0100.0060.0000.009
E30.4400.2500.3100.4400.2500.0700.0000.0690.048
E40.3000.3300.3800.3800.3000.0500.0470.0280.000
S0.460.840.20
Q0.140.150.05
R0.631.000.00
Ranking213
Table 11. Comparison of current results with previous findings.
StudiesMarketRisk Analysis MethodMost-Important RiskSuggested Alternatives
Garbuzova-Schlifter et al. [23]RussiaAHPFinancial and regulatory risksNo
Wang et al. [21ChinaFuzzy MCDMMarket risksNo
This studyIranDANPO&M risksYes
Disclaimer/Publisher’s Note: The statements, opinions and data contained in all publications are solely those of the individual author(s) and contributor(s) and not of MDPI and/or the editor(s). MDPI and/or the editor(s) disclaim responsibility for any injury to people or property resulting from any ideas, methods, instructions or products referred to in the content.

