Abstract
The reliability of high-rise buildings’ rigid-pile composite foundations primarily relies on the load test results of single-pile composite foundations. Field load tests were conducted for a high-rise building in the loess area of China, the results conformed to the design requirements. Nevertheless, the buildings experienced significant settlement after construction, which was quite different from the test results. Investigating bearing disparities between the single-pile and group-pile composite foundations in high-rise structures was necessary. Firstly, conducting an indoor interface shear test to propose a pile–soil hyperbolic contact model and integrate it into the numerical model. Subsequently, a finite element model was employed that accounts for pile–soil interactions in order to analyze discrepancies in bearing. The results show that the settlement difference rises by 56.4% as the load escalates by 100 kPa from the initial level and increases by 28.9% as the load ascends by 100 kPa to the final level. The settlement difference changes with an increasing load in a hardened curve pattern. Furthermore, differences in pile bearing characteristics and pile–soil interaction were analyzed. Negative friction occurs within 1/4 of the pile length within group-pile composite foundations, while in single-pile composite foundations, the range contracts to 1/10.
1. Introduction
Rigid-pile composite foundation refers to the incorporation of stiff bonded material piles into the natural ground to form an artificial foundation, which aims to reduce settlement and increase bearing capacity [1]. Due to its significant social and economic benefits, it has become a commonly used method for ground improvement [2], widely applied in high-rise buildings [3] and complex construction projects [4]. In a rigid-pile composite foundation, the role of the cushion layer is to adjust the bearing capacity of the soil between the piles and improve the load-bearing state of the piles [5]. By reducing stress concentration between the piles and the soil, the bearing capacity and stability of the piles are improved, providing a more rational and effective utilization of the load-bearing capacity between the piles and the soil, ultimately enhancing the overall bearing performance of the foundation system.
In practical engineering, field load tests could be employed to assess the reliability of composite foundations [6,7]. However, there were differences in load-bearing characteristics between the load tests and the actual composite foundations [8]. In recent years, there have been several loess areas where high-rise buildings with rigid-pile composite foundations have passed the load tests according to design requirements but experienced significant settlement after construction. As a result, there are questions about the reliability of load tests for rigid-pile composite foundations in high-rise buildings.
The settlement of rigid-pile composite foundations caused by the load is an essential indicator for evaluating the effectiveness of foundation improvement [9]. In loess regions, it is common practice to conduct load tests on single-pile composite foundations to obtain load-settlement results and determine the bearing capacity using settlement control methods. Currently, high-rise buildings directly adopt settlement control standards formulated for multi-story buildings with lower building loads [10]. However, researchers have not yet studied whether these settlement control standards for multi-story buildings apply to high-rise buildings with larger structural loads.
Scholars have extensively researched rigid-pile composite foundations’ load-bearing and deformation mechanisms using experimental and numerical methods [11,12,13,14,15,16,17,18,19,20]. Based on these studies, several theories have been proposed to describe the load-deformation behavior of composite foundations. However, in practical engineering, conducting field load tests remains a common method for assessing the load-bearing capacity of composite foundations. These tests provide insights into the load response and foundation deformation under actual working conditions, helping to validate the accuracy of theoretical models and providing reliable information for engineering design.
The field load test of single-pile composite foundation is the predominant method in engineering due to its advantages in terms of time and cost [21]. Controlling settlement based on load tests determines the bearing capacity of composite foundations. Settlement control standards are based on building classification and soil properties, with the corresponding load representing the characteristic value of the bearing capacity [22,23].
There are significant differences in the load conditions between load tests on single-pile composite foundations for high-rise buildings and the stress conditions of pile groups in composite foundations. Therefore, it is necessary to explore the reliability of applying load tests on single-pile composite foundations in high-rise buildings.
This study focused on the issue of significant differential settlement between test results and actual settlement to investigate the applicability of single-pile composite foundation load experiments in high-rise structures. A field load test is performed on a single-pile composite foundation of a high-rise building, and the obtained results are subsequently compared with the actual settlement. Additionally, a numerical method is employed that involved establishing finite element models for both the single-pile composite foundation and the actual group-pile composite foundation. The interaction law between pile-soil friction in loess soil was proposed and incorporated into the numerical model of the composite foundation. Analyzing the differences in bearing performance adopts simulating the bearing characteristics of both the single-pile and the group-pile composite foundation under the same load. These research findings contribute to assessing the reliability and applicability of single-pile composite foundation load tests in high-rise buildings and provide a reference for engineering design.
2. Analysis of Single-Pile Composite Foundation Load Test Results
To elucidate the divergence in bearing characteristics between single-pile composite foundations and group-pile composite foundations. Field load tests and building settlement observations were conducted. The purpose was to expound upon the dissimilarity in load-bearing behavior between these two foundations by assessing their macroscopic settlement responses.
2.1. Project Overview
The background project is a high-rise building in Xi’an that adopts a plain concrete pile composite foundation. The building has 33 floors above ground and 2 floors underground, with a total floor area of approximately 45,000 square meters, classified as a Class A building. It is a shear wall structure with a raft foundation. The original soil consists of loess and ancient soil; the landform unit belongs to the loess plateau. Figure 1a shows field test site information. The composite foundation consists of plain concrete piles as reinforcement elements. An equilateral triangular pattern arranges the piles, with a pile spacing of 1300 mm and a row spacing of 1126 mm. The pile diameter is 400 mm, and the pile length is 22 m. The concrete strength of the piles is C35. Non-displacement pile technology is employed for construction. A cushion layer is placed on top of the pile with a thickness of 0.2 m, with the sixth layer of loess and ancient soil acting as the load-bearing layer at the pile end. The composite foundation’s design requirement is that the bearing capacity’s characteristic value should not be less than 700 kPa.
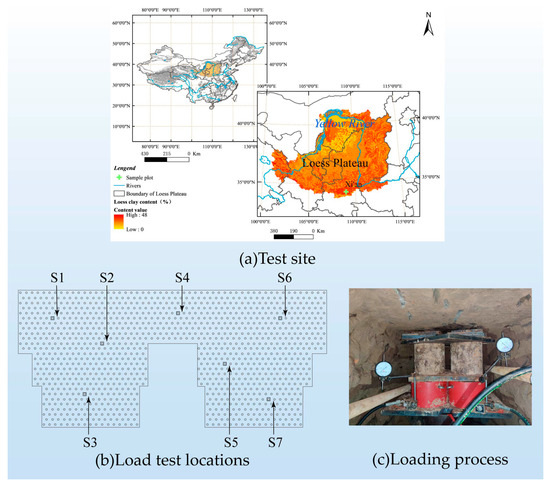
Figure 1.
Static loading test.
2.2. Analysis of Static Load Test
Seven sets of field tests were conducted on single-pile composite foundations, with consideration given to the arrangement characteristics of the superstructure and raft, through which the test point locations were determined. S1 through S7 were the test point numbers. With eight stages of loading, the slow, sustained load method was used to apply the load. The final load was set at 1400 kPa; each level increased by 175 kPa. Figure 1b shows the load test locations, and Figure 1c depicts the loading procedure during the on-site test.
Figure 2 depicts the load-settlement curves of the single-pile composite foundation. Upon examination, it was evident that all seven curves exhibited an asymptotic pattern, suggesting that the test did not reach its limit. As per the stipulation of not exceeding half of the maximum loading, the characteristic value of the bearing capacity is determined to be 700 kPa [24].
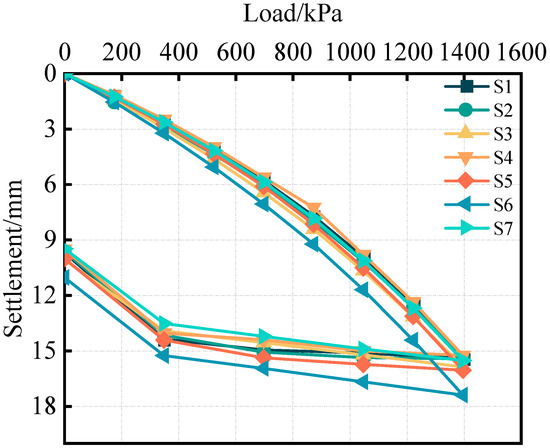
Figure 2.
Q-s curve of single-pile composite foundation.
After the culmination of the construction, observations were undertaken at intervals of 1 to 2 months over a span of 16 months. The building’s highest settlement at a certain point was 172.3 mm after the observation period, while the lowest settlement was 167.7 mm. Furthermore, the settlements exhibited instability, and the settlement joints between building units displayed noticeable misalignment. Strengthening the foundation is imperative for safety considerations, thereby resulting in a substantial increase in construction costs.
2.3. Discussion of Static Load Test
Based on the load test of the single-pile composite foundation, the characteristic value of the composite foundation’s bearing capacity was determined to be 700 kPa, with a settlement of approximately 7 mm. Nevertheless, the high-rise building exhibited a post-construction settlement of 160 mm within 16 months following its completion. Despite the load test results indicating that the composite foundation can withstand a load of 700 kPa, the actual structure’s load resulted in a significantly larger settlement than that observed in the static load test.
3. Interface Model between Pile and Soil
Adopting the finite element method to analyze the factors underlying the disparities in load-bearing characteristics and elucidating the applicability of static load tests in evaluating composite foundations. The interaction between the piles and surrounding soil within composite foundations is a pivotal component influencing the overall bearing capacity [25]. The indoor soil–structure interface contact experiments were performed to simulate pile–soil interactions with greater fidelity in numerical simulations. The aim was to establish an ontological understanding of the pile–soil contact relationship.
3.1. Interfacial Shear Test
The Shear Trac III apparatus simulated pile–soil contact behavior by conducting shear tests on the interface between concrete plates and loess soil [26]. This test aimed to replicate the actual pile–soil interaction in numerical simulations. Based on the test results, the relationship between shear strain and shear stress at the pile–soil interface was derived.
Experiments were conducted to examine the interaction between plain concrete slabs and loess. Soil samples were procured near the construction site. These samples exhibited a yellowish-brown coloration and featured substantial pores and wormholes. Remolded soil was prepared for testing to mitigate the influence of uneven void distribution on test outcomes. Adhering to the specifications enumerated in geotechnical tests, the soil was prepared to mirror site-specific conditions. With a moisture content of 21%, sealing it and leaving it for 24 h ensures even water distribution. As shown in Figure 3a, the concrete slab was loaded into the lower shear box while securing the upper shear box. The soil samples compacted in layers in the upper shear box, as shown in Figure 3b. Controlled compaction thickness achieved the desired dry density. Drilling at 60 mm intervals along the soil specimen’s central axis facilitated the precise introduction of white lime. This enabled the observation of internal deformation, as depicted in Figure 3d. Subsequently, shear tests were conducted at normal pressures of 50 kPa, 100 kPa, 200 kPa, and 300 kPa, employing a shear rate of 0.8 mm/min.
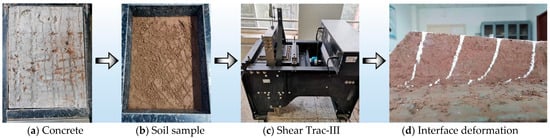
Figure 3.
Interfacial shear experiment.
Figure 4 depicts the graphical representation of the interface shear stress-displacement relationship. The correlation between shear displacement and shear stress at the interface between the structure and soil exhibits an initial upward trend followed by stabilization, resembling a hyperbolic curve. The hyperbolic Equation (1) is employed to fit the experimental data [27].
where τ is the shear stress, and γ is the shear displacement. Based on the τ − γ hyperbolic model, the shear modulus G can be deduced using the corresponding calculation formula.
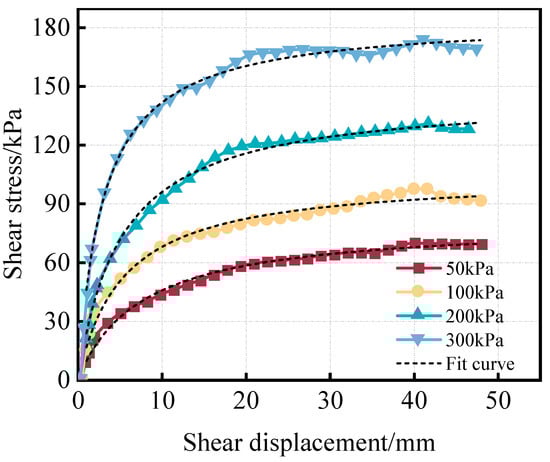
Figure 4.
Shear stress–strain curve.
Illustrated in Figure 4 are the fitting curves depicting shear displacement–shear stress correlations under normal loads of 50 kPa, 100 kPa, 200 kPa, and 300 kPa. The goodness of fit R2, approximately 0.98, closely aligns with the test curve. Consequently, this confirms the validity of employing the hyperbolic Equation (1) to elucidate the interrelationship between shear displacement and stress.
3.2. Interface Contact Model
Following the hyperbolic correlation between shear displacement and shear strain, the shear modulus G can be obtained as presented in Equation (2).
According to Equation (2), one can derive Equation (3).
In the state of zero shear stress, which corresponds to the initial contact between the pile and soil, the initial shear modulus can be assumed as G0. Equation (1) reveals that the reciprocal of the shear modulus G0 can be expressed in terms of the parameter “a”, specifically as a = 1/G0. Experimental findings demonstrate that the initial shear modulus G0 varies with the normal stress σn. By plotting the logarithmic curve of G0 and σn, as depicted in Figure 5, the relationship between lg(1/G0) and lg(σn) approximately follows a straight line passing through the origin with a slope of “k”.
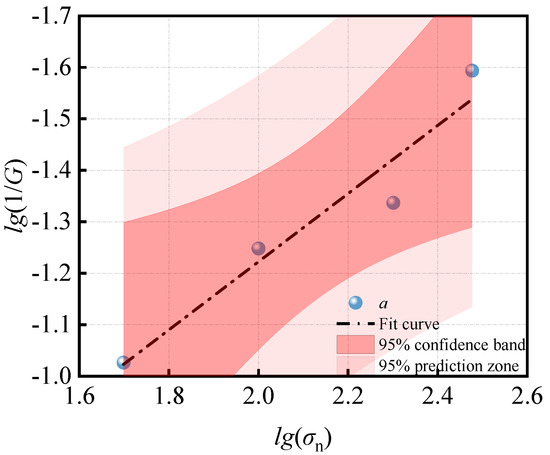
Figure 5.
lg (1/G) – lg (σn).
Hence, Equation (4) represents the association between the initial shear modulus 1/G0 and the normal stress σn.
Equation (1) shows that as the shear strain γ approaches infinity, the ultimate shear stress converges to the value of 1/b. Let τu denote the shear stress τ when the shear strain γ tends to infinity, representing the asymptotic shear stress value τ. However, in reality, the shear strain γ cannot reach infinity. As the shear displacement increases to a specific value, the shear stress τ will reach the maximum shear stress τu. Consequently, the relationship is established as b = 1/τu.
By substituting the parameters “a” and “b” into Equation (3), the expression in Equation (5) can be obtained.
According to the Mohr–Coulomb criterion, Equation (6) can determine the failure shear stress.
Substituting Equation (6) into Equation (5) accomplishes the calculation of the shear modulus at the pile–soil contact, leading to the derivation of Equation (7).
where c represents the cohesion of the pile–soil contact, φ denotes the friction angle of the contact surface, and k is a dimensionless coefficient.
The normal pressure σn = K0γh, where K0 is the coefficient of lateral pressure, γ is the effective strain, and h is the depth of stress.
Equation (7), for determining the shear modulus of the contact surface, exhibits a resemblance to Goodman’s tangential stiffness formula [28]. Incorporating the frictional shear properties between the pile and soil, as described in Equation (7), into the numerical calculation facilitates an accurate simulation of the contact behavior between piles and soil in composite foundations.
4. Numerical Simulation of Group-Pile Composite Foundation
A finite element model is established for composite foundations considering pile–soil contact action, setting the pile in surface-to-surface contact with the surrounding soil. In addition, the correlation mentioned above, between shear displacement and shear stress, integrates into the pile–soil interface contact simulation. Customizing subroutines within the finite element software facilitates this integration. Subsequently, the analysis delves into the intricate bearing attributes while considering the pivotal factor of pile–soil contact.
4.1. Finite Element Model
Based on the design parameters for the high-rise structure example in this paper, the construction of three-dimensional solid models for single-pile and group-pile composite foundations is accomplished using finite element software. Modeling half of the composite foundation due to its symmetric cross-section in order to enhance computational efficiency. The soil model measures 50 × 50 × 50 m and contains 584 simple concrete piles with a 0.2 m thick layer of gravel layering atop the piles. The pile spacing is 1.3 m, the pile diameter is 400 mm, and the pile length is 22 m. The model constrains the sides in the X and Y directions and the bottom surface in the X, Y, and Z directions, while leaving the upper surface unrestricted.
Figure 6 displays the model’s meshing, with 38,536 cells for the single-pile composite foundation and 494,026 cells for the half-group-pile composite foundation model. The analysis assumes elastic deformation of the ordinary concrete structures, while the soil and bedding materials adhere to the yield criterion of the Mohr–Coulomb elastoplastic model. The specific parameters for the computational model are extracted from the project’s geologic investigation report, as detailed in Table 1.
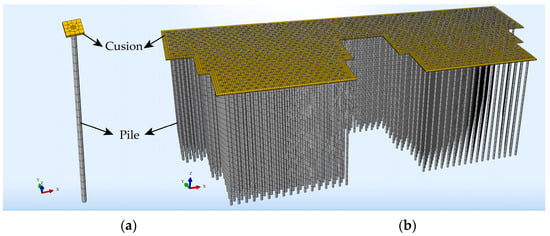
Figure 6.
Composite foundation numerical model. (a) Single-pile composite foundation, (b) Group-pile composite foundation.

Table 1.
Model parameters value.
4.2. Geostress Balance
Because the soil layer has been consolidated for a long time, the deformation has been stabilized. Therefore, the numerical simulation first carries out the ground stress equilibrium, simulating self-weight stress in the soil layer, which will not produce settlement due to self-weight [29]. After achieving ground stress equilibrium, the composite foundation generated a settlement at the order of 10−9 mm. The foundation under gravity did not experience significant settlement, indicating that the ground model aligns with reality. Subsequently, calculations for the finite element model of the composite foundation started.
4.3. Model Validation
To verify the precision of the finite element modeling approach and parameter choices, conducting a comparative analysis between the finite element analysis of the single-pile composite foundation and the load-settlement curves obtained from field tests. Figure 7 presents the load-settlement curves. The load-settlement curves obtained from the finite element analysis are in good agreement with the results of the field load tests, exhibiting a maximum deviation of no more than 5% between the two curves. It indicates that the research is trustworthy, utilizing the parameters and models indicated above.
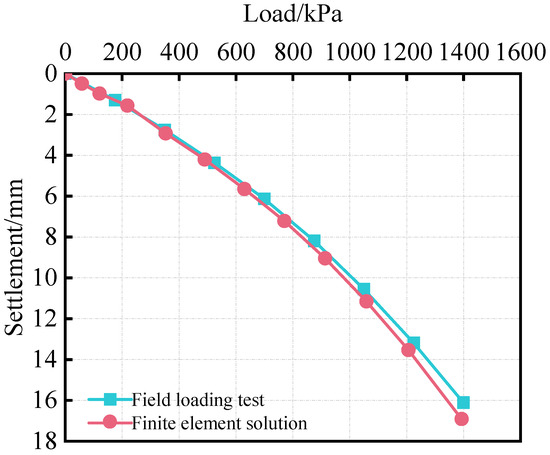
Figure 7.
Model validation.
4.4. Settlement Differences between Single-Pile and Group-Pile Composite Foundation
As shown in Figure 8, there is a significant difference between the load-settlement curves of single-pile composite foundations and group-pile composite foundations. According to the settlement difference curves, the settlement difference rises by 56.4% as the load escalates by 100 kPa from the initial level and increases by 28.9% as the load ascends by 100 kPa to the final level. The increase in the settlement difference decreases with the increase in load, which is shown as a hardening curve.
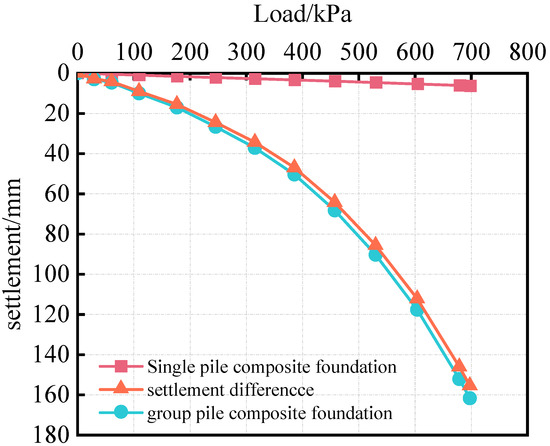
Figure 8.
Load-settlement curve.
Figure 9 illustrates the settlement contours of both the single-pile composite foundation and the group-pile composite foundation subjected to a load of 700 kPa. The settlement contours elucidate that single-pile composite foundations exhibit a comparatively smaller bearing area and a limited additional stress influence range, whereas group-pile composite foundations boast a larger bearing area and a more extensive range of additional stress influence. The settlement of a group-pile composite foundation under identical loads exhibits an amplified magnitude, attributed to the influence of the size effect.
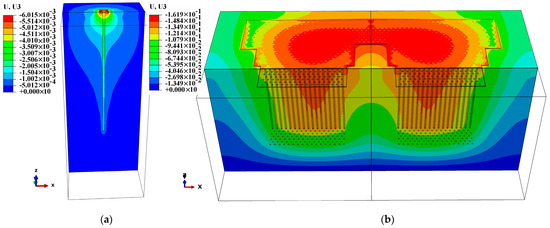
Figure 9.
Contours of composite foundation settlement. (a) Single-pile composite foundation, (b) Group-pile composite foundation.
The results of the field load test enable the determination of the characteristic value of the composite foundation. However, it is imperative to acknowledge that the settlement observed in the load test does not entirely reflect the settlement behavior of the group-pile composite foundation. For a comprehensive understanding of settlement characteristics, it is imperative to study the differences in bearing characteristics between single-pile and group-pile composite foundation.
4.5. Difference in Pile Axial Force
Figure 10 depicts the piles employed for data extraction. Figure 11 presents the axial force distribution of the single-pile composite foundation and the group-pile composite foundation. The top of pile loading in group-pile composite foundations exceeds that of a single-pile composite foundation. This occurrence is attributed to the influence of a stiff load-bearing plate, which adjusts the settlement to achieve uniformity while distributing the pressure from the center to the edges [30]. Consequently, the load becomes more concentrated on the soil at the periphery of the load-bearing plate in single-pile composite foundation. This phenomenon also elucidates the higher axial force observed in the side piles of the composite foundation compared to the inner piles. Therefore, minimizing the above effects during static load tests on such composite foundations is imperative to ensure the obtained results apply to group-pile design.
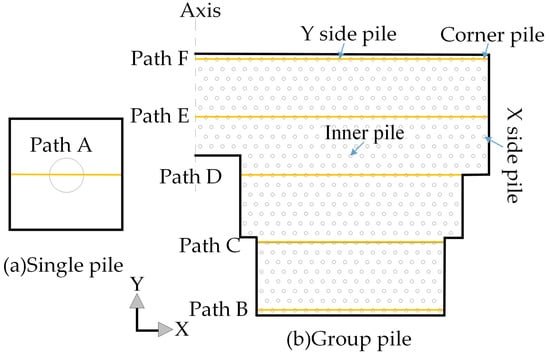
Figure 10.
Value path.
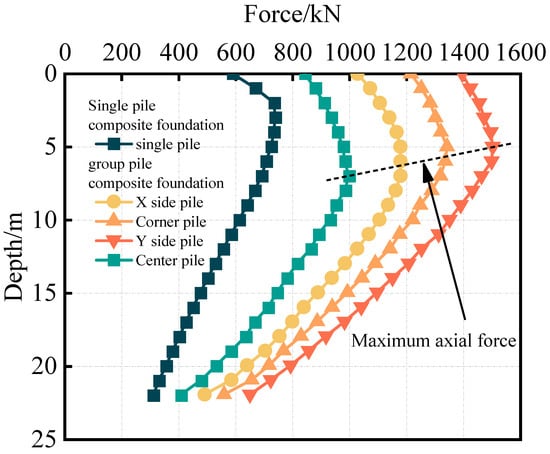
Figure 11.
Axial force distribution.
4.6. Difference in Pile-Side Skin Friction
Figure 12 illustrates the skin friction distribution curves for single-pile and group-pile composite foundations. The presence of a cushion induces an upward-penetrating deformation in the pile top, resulting in a significant negative friction zone along the pile shaft.
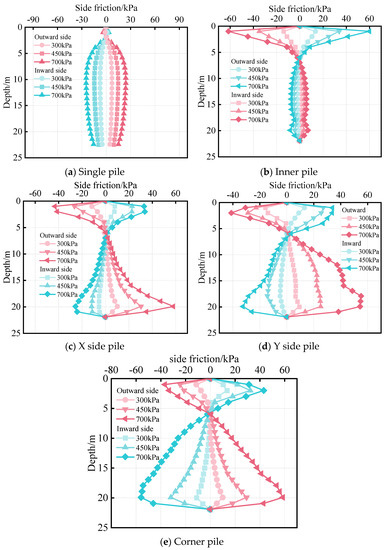
Figure 12.
Distribution of lateral pile friction.
Figure 12a indicates that the negative friction of the single-pile composite foundation emerges within 1/10 of the pile’s length. The positive friction pattern exhibits a spindle-shaped distribution, characterized by lower values at the upper and lower ends and higher values in the middle section. Positive friction on the pile side primarily acts on the middle and upper sections of the pile. As depicted in Figure 12b, the negative friction of the inner pile for the group piles distributes across the lower quarter of the pile’s length from the pile top. The positive friction takes on a shuttle-like distribution in the middle and lower portions of the pile, exhibiting a lesser value than the single-pile composite foundation.
Figure 12c–e show the skin friction distribution curves along the depth for the X side pile, Y side pile, and corner pile, respectively. The distribution of negative friction spans a quarter of the pile length from the top. Beyond the neutral point’s depth, the skin friction becomes operative, displaying a linear augmentation along the depth. In the case of group piles, the loads concentrate on the side and corner piles, resulting in a significant contribution of skin friction.
The growth of pile skin friction develops with relative movement between the pile and soil. To elucidate the rationale for the variation in friction distribution, we shall delve into the relative deformation between the pile and the soil.
4.7. Difference in Pile–Soil Vertical Deformation
Figure 13a presents the deformation profile of the pile–soil system along path A for a single-pile composite foundation. The soil surrounding the pile undergoes significant relative displacement in comparison to the pile top during the upward insertion of the pile into the cushion layer. The relative deformation between the soil and pile gradually attenuates with increasing depth and attains an equilibrium state at a depth of approximately 2 m. Below this depth, the pile experiences downward deformation relative to the surrounding soil. The relative deformation between the pile and soil initially increases and subsequently decreases with depth. The positive friction of the pile facilitates the transfer of load from the pile to the surrounding soil. As the depth increases, the pile stress diminishes, leading to a declining trend in the vertical deformation of the pile relative to the surrounding soil.
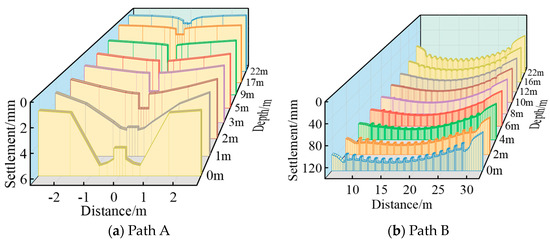
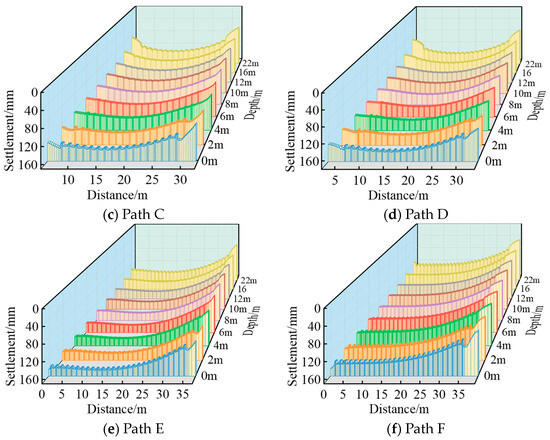
Figure 13.
Pile–soil deformation.
Figure 11f and Figure 13b display the pile–soil deformation curves for selected paths (Path B and Path F) at the periphery of the composite foundation. Figure 12d,e and Figure 13c exhibit the pile–soil deformation curves for selected paths (Path C, Path D, and Path E) within the interior of the composite foundation. The top of the pile and the surrounding soil exhibit considerable relative displacements and deformations. The relative deformation between the soil and pile approaches equilibrium when the depth of the soil surrounding the peripheral piles reaches 6 m.
Similarly, the relative deformation between the soil and pile reaches equilibrium when the depth of the soil surrounding the internal pile reaches 4 m. Beyond the equilibrium depth of pile–soil relative displacement, the pile experiences downward deformation relative to the surrounding soil, and the relative deformation amplifies with depth. The most significant relative deformation occurs at the pile end, where the end of the pile inserts into the underlying layer.
4.8. Mechanism of Pile–Soil Interaction
As shown in Figure 14, the impact of applied vertical loads on the piles and the surrounding soil between the single-pile and group-pile composite foundations.
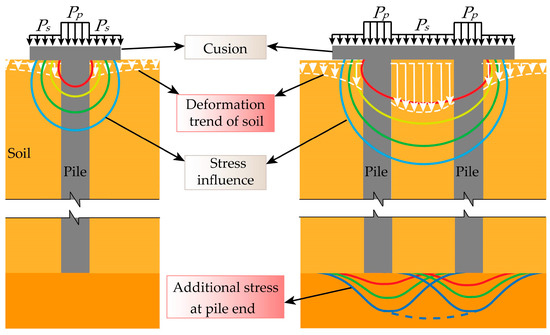
Figure 14.
Analysis of load-bearing difference mechanism.
When submitting the composite foundation to load, the cushion adjusts the load distribution, causing the pile carry the load “pp”, while the soil bears the load “ps” and spreads its impact to the surrounding soil [31]. Due to the extensive pressure bearing area of the high-rise building, the additional stresses propagate extensively within the foundation soil layer. In contrast, distributing stresses during testing into the deeper layers of the reinforced region is difficult for single-pile composite foundations due to the small size of the load-bearing slabs. The load test of the single-pile composite foundation solely assesses the bearing capacity of the pile–soil unit at a shallower depth, disregarding its bearing capacity in the deeper layers of the foundation. Consequently, the settlement of a single-pile composite foundation is significantly smaller than that of a group-pile composite foundation with a larger bearing area.
In contrast to the single-pile composite foundation, the group-pile composite foundation exhibits a broader distribution of additional stress within the soil due to its larger pressure area when subjected to loading. This results in more extensive downward deformation within the deeper layers of the soil. Meanwhile, it induces negative friction (referred to as the “weakening effect” [32]) on certain pile segments inside the piles. However, the “weakening effect” on the pile side near the pile end is not prominent due to the shallow depth of the soil’s additional stress influence. The upper load is transmitted through the pile body and released into the soil near the pile end, leading to the exertion of positive friction near the end of the pile [33]. Consequently, the pile body near the end tends to move downward relative to the soil body, resulting in the generation of a “strengthening effect” in the friction near the pile end. A simplified representation of this mechanism is illustrated in Figure 15.
Figure 15.
Pile–soil interaction. (a) Single-pile composite foundation, (b) Group-pile composite foundation.
5. Conclusions
The progression of rigid-pile composite foundations in the loess region, from low-rise to high-rise structures, relies primarily on the insights gained from load tests conducted on single-pile composite foundations. Class A buildings, surpassing 30 floors, increasingly adopt rigid-pile composite foundations. Nevertheless, in recent years, while the load tests on single-pile composite foundations for high-rise buildings in loess areas of China fulfill design specifications, some buildings experience considerable settlement in practice. To gain deep insight into the bearing properties of single-pile composite foundations and composite foundations using both piles and soil, as well as to analyze settlement, field tests and settlement observations are conducted on a high-rise structure in Xi’an. The analysis of previous tests and investigations deduces the following conclusions:
- (1)
- According to the interfacial shear test result, the connection between the pile–soil shear stress and shear displacement exhibits a hyperbolic pattern. An interaction model at the pile–soil interface based on the hyperbolic model is proposed.
- (2)
- Under the same loading conditions, the settlement between the single-pile composite foundation and the group-pile composite foundation exhibits a notable disparity. The settlement difference rises by 56.4% as the load escalates by 100 kPa from the initial level and increases by 28.9% as the load ascends by 100 kPa to the final level. The rate of settlement difference augmentation diminishes as the load intensifies, manifesting a characteristic hardening curve.
- (3)
- The negative friction of the single-pile composite foundation emerges within 1/10 of the pile’s length, and the skin friction works from top to bottom. The negative friction of the group piles distributes across the lower quarter of the pile’s length, and the skin friction works from the bottom to upper middle of pile. This phenomenon arises from the “weakening” effect at the pile top and the “enhancing” effect at the pile bottom of the pile–soil interaction on the additional stress for group-pile composite foundations.
- (4)
- Given the larger loads and pressure-bearing areas of newly constructed high-rise buildings, the settlement control standards formulated based on multi-story structures no longer apply to pile groups. Therefore, the settlement of the group-pile composite foundation in high-rise buildings is considerably greater than that of the single-pile composite foundation, as concluded above. Relying solely on the settlement control method determined by the load-settlement curve of the single-pile composite foundation may result in an overestimation of the bearing capacity and pose potential risks for the actual composite foundation. To ensure the reliability of utilizing the single-pile composite foundation load test in high-rise structures, it becomes necessary to allocate additional safety reserves for settlement control.
Author Contributions
Conceptualization, L.Z. and T.W.; methodology, L.Z.; software, L.Z. and Z.Z.; validation, L.Z. and T.W.; formal analysis, L.Z., T.W. and X.J.; resources, L.Z. and T.W.; data curation, L.Z., T.W. and X.J.; writing—original draft preparation, L.Z., T.W. and Z.Z.; writing—review and editing, L.Z., T.W., Z.Z. and X.J.; visualization, L.Z., T.W. and Z.Z.; supervision, L.Z.; project administration, L.Z.; funding acquisition, L.Z. and T.W. All authors have read and agreed to the published version of the manuscript.
Funding
This work was supported by the Shaanxi Provincial Natural Science Basic Research Key Project [grant number 2020ZJ-49]; Shaanxi Provincial Natural Science Basic Research Program Project [grant number 2021JQ-644]; and Shaanxi Provincial Department of Education Scientific Research Program Project [grant number 21JK0672].
Institutional Review Board Statement
Not applicable.
Informed Consent Statement
Not applicable.
Data Availability Statement
The data used to support the findings of this study are available from the authors upon request.
Conflicts of Interest
The authors declare that they have no conflict of interests to report regarding the present study.
References
- Bourgeois, E.; Buhan, P.D.; Hassen, G. Settlement Analysis of Piled-Raft Foundations by Means of a Multiphase Model Accounting for Soil-Pile Interactions. Comput. Geotech. 2012, 46, 26–38. [Google Scholar] [CrossRef]
- Yu, J.L.; Zhou, J.J.; Gong, X.N.; Xu, R.Q.; Li, J.Y.; Xu, S.D. Centrifuge Study on Behavior of Rigid Pile Composite Foundation Under Embankment in Soft Soil. Acta Geotech. 2020, 16, 1909–1921. [Google Scholar] [CrossRef]
- Tao, J.H.; Liang, S.T.; Fan, Y.W.; Zhang, Y.; Tao, M. Field Tests on High-Bearing Composite Foundation with Plain Concrete Piles. Chin. J. Geotech. Eng. 2012, 34, 693–700. [Google Scholar]
- Wang, Y.N.; Jiang, B.S.; Yu, J.; Gao, C.; Fang, D.Y. In-Situ Experiment on Composite Foundation of High Pressure Jet Grouting Piles of Hong Kong-Zhuhai-Macau Bridge. Chin. J. Rock Mech. Eng. 2017, 36, 1514–1521. [Google Scholar] [CrossRef]
- Gong, X.N. Generalized Composite Foundation Theory and Engineering Application. Chin. J. Geotech. Eng. 2007, 29, 1–13. [Google Scholar]
- Dai, G.; Gong, W.; Zhao, X.; Zhou, X. Static Testing of Pile-Base Post-Grouting Piles of the Suramadu Bridge. Geotech. Test. J. 2011, 34, 34–49. [Google Scholar] [CrossRef]
- Baker, C.N.; Azam, T.; Joseph, L.M. Settlement Analysis for the 450 M KLCC Towers. In Vertical and Horizontal Deformations of Foundations and Embankments; ASCE Special Technical Publications: Reston, VA, USA, 1994; pp. 1650–1671. [Google Scholar]
- Liu, P.; Yang, G.H.; Fan, Z.; Liu, H.K.; Zhang, Y.C. Experimental Study on Scale Effect of Rigid Pile Composite Foundation. Chin. J. Rock Mech. Eng. 2016, 35, 187–200. [Google Scholar] [CrossRef]
- Zheng, J.-J.; Liu, Y.; Pan, Y.-T.; Hu, J. Statistical Evaluation of the Load-Settlement Response of a Multicolumn Composite Foundation. Int. J. Geomech. 2018, 18, 04018015. [Google Scholar] [CrossRef]
- Zheng, G.; Yu, Z.F. Standardization of Bearing Test and the Determination of Bearing Capacity of Composite Foundation. J. Build. Struct. 2003, 24, 84–91. [Google Scholar] [CrossRef]
- Ashour, M.; Norris, G.M.; Elfass, S.; Al-Hamdan, A.Z. Mobilized Side and Tip Resistances of Piles in Clay. Comput. Geotech. 2010, 37, 858–866. [Google Scholar] [CrossRef]
- Clancy, P.; Randolph, M.F. An Approximate Analysis Procedure for Piled Raft Foundations. Int. J. Numer. Anal. Methods Geomech. 1993, 17, 849–869. [Google Scholar] [CrossRef]
- Liu, D.; Zheng, G.; Liu, J.; Li, J. Experimental Study on Comparison of Behavior between Rigid Pile Composite Foundation and Composite Pile Foundation. J. Build. Struct. 2006, 27, 121–128. [Google Scholar]
- Lv, Y.; Liu, H.; Ding, X.; Kong, G. Field Tests on Bearing Characteristics of X-Section Pile Composite Foundation. J. Perform. Constr. Facil. 2012, 26, 180–189. [Google Scholar] [CrossRef]
- Lang, R.; Ma, C.; Sun, L.; Lin, S.; Yan, S.; Huo, Z.; Yang, W. Three-Dimensional Modeling on Load-Transferring Mechanism of Rigid Pile–Net Composite Foundation. Int. J. Geomech. 2022, 22, 04022097. [Google Scholar] [CrossRef]
- Suleiman, M.T.; Ni, L.; Raich, A. Development of Pervious Concrete Pile Ground-Improvement Alternative and Behavior Under Vertical Loading. J. Geotech. Geoenvironmental. Eng. 2014, 140, 04014035. [Google Scholar] [CrossRef]
- Wang, Z.-F.; Cheng, W.-C.; Wang, Y.-Q.; Du, J.-Q. Simple Method to Predict Settlement of Composite Foundation under Embankment. Int. J. Geomech. 2018, 18, 04018158. [Google Scholar] [CrossRef]
- Li, Y.; Yao, L.; Chen, G.; Zhao, W.; Liu, X. Nonlinear Settlement Calculation of Composite Foundation Based on Tangent Modulus Method: Two Case Studies. Buildings 2023, 13, 892. [Google Scholar] [CrossRef]
- Yang, P.; Hu, H.-S.; Xu, J.-F. Settlement Characteristics of Pile Composite Foundation under Staged Loading. Procedia Environ. Sci. 2012, 12, 1055–1062. [Google Scholar] [CrossRef]
- Zhang, Y.; Chan, D.; Wang, Y. Consolidation of Composite Foundation Improved by Geosynthetic-Encased Stone Columns. Geotext. Geomembr. 2012, 32, 10–17. [Google Scholar] [CrossRef]
- Zheng, G.; Gu, X.L. Analysis of the Bearing Test of Rigid Pile Composite Foundation. J. Build. Struct. 2001, 22, 93–96. [Google Scholar] [CrossRef]
- Zheng, G.; Gong, X.N.; Xie, Y.L.; Li, G.X. State-of-the-Art Techniques for Ground Improvement in China. China Civ. Eng. J. 2012, 45, 127–146. [Google Scholar] [CrossRef]
- Liu, S.Y.; Zhou, J.; Zhang, D.W.; Ding, X.M.; Lei, H.Y. State of ohe Art of the Ground Improvement Technology in China. China Civ. Eng. J. 2020, 53, 93–110. [Google Scholar] [CrossRef]
- JGJ 79-2012; China Academy of Building Sciences. Technical Specification for Building Foundation Treatment. China Construction Industry Press: Beijing, China, 2012.
- Chow, Y.K. Analysis of Vertically Loaded Pile Groups. Int. J. Numer. Anal. Methods 1986, 10, 59–72. [Google Scholar] [CrossRef]
- Ilori, A.O.; Udoh, N.E.; Umenge, J.I. Determination of Soil Shear Properties on A Soil to Concrete Interface Using a Direct Shear Box Apparatus. Int. J. Geo-Eng. 2017, 8, 17. [Google Scholar] [CrossRef]
- Zhang, D.L. Establishment and Application of a Interface Model between Soil and Structure. Chin. J. Geotech. Eng. 1998, 20, 65–69. [Google Scholar]
- Goodman, R.E.; Taylor, R.L.; Brekke, T.L. A Model for the Mechanics of Jointed Rock. J. Soil Mech. Found. Div. 1968, 94, 637–659. [Google Scholar] [CrossRef]
- Tipsunavee, T.; Arangjelovski, G.; Jongpradist, P. Numerical Analysis on Effects of Soil Improvement on Pile Forces on Existing High-Rise Building. Buildings 2023, 13, 1523. [Google Scholar] [CrossRef]
- Chi, Y.J.; Song, E.X.; Chen, Z.Y. Analysis of Bearing Performance of Rigid Pile Composite Foundation under Vertical Loads. Eng. Mech. 2003, 20, 9–14. [Google Scholar] [CrossRef]
- Liang, F.Y.; Chen, L.Z.; Shi, X.G. Numerical Analysis of Composite Piled Raft with Cushion Subjected to Vertical Load. Comput. Geotech. 2003, 30, 443–453. [Google Scholar] [CrossRef]
- Dong, J.R. Enhanced and Weakened Effect of Skin Friction of Cast-In-Situ Piles. Chin. J. Geotech. Eng. 2009, 31, 658–662. [Google Scholar]
- Radhakrishnan, R.; Leung, C.F. Load Transfer Behavior of Rock-Socketed Piles. J Geotech Eng 1989, 115, 755–768. [Google Scholar] [CrossRef]
Disclaimer/Publisher’s Note: The statements, opinions and data contained in all publications are solely those of the individual author(s) and contributor(s) and not of MDPI and/or the editor(s). MDPI and/or the editor(s) disclaim responsibility for any injury to people or property resulting from any ideas, methods, instructions or products referred to in the content. |
© 2023 by the authors. Licensee MDPI, Basel, Switzerland. This article is an open access article distributed under the terms and conditions of the Creative Commons Attribution (CC BY) license (https://creativecommons.org/licenses/by/4.0/).