Article

Performance of FRP-Upgraded RC One-Way Ribbed Slabs with an Opening in Flexure Zone

Chair of Research and Studies in Strengthening and Rehabilitation of Structures, Department of Civil Engineering, King Saud University, Riyadh 11421, Saudi Arabia
*
Author to whom correspondence should be addressed.
Buildings 2023, 13(9), 2260; https://doi.org/10.3390/buildings13092260
Submission received: 11 July 2023 / Revised: 28 August 2023 / Accepted: 30 August 2023 / Published: 6 September 2023
(This article belongs to the Section Building Materials, and Repair & Renovation)

Abstract

:
Reinforced concrete (RC) one-way ribbed slabs serve as a prevalent flooring solution in the Middle East. In this region, the occurrence of openings within these slabs is frequent, particularly when making modifications to existing buildings. However, these openings compromise the stiffness and load-bearing capacity of the slabs, necessitating strengthening measures. All of the available investigations were carried out on strengthening RC one- and two-way solid slabs with openings. However, a noticeable research gap exists, as none of these studies have delved into the strengthening of RC one-way ribbed slabs with openings. This gap was bridged in this study by conducting a comprehensive experimental inquiry into the effectiveness of utilizing fiber-reinforced polymer (FRP) laminates to restore the flexural capacity of RC one-way ribbed slabs featuring flexure openings. The experimental program comprised four half-scale one-way ribbed slabs (having three ribs) divided into one unstrengthened specimen without openings to act as a reference, one unstrengthened specimen with a single opening located in the peak-moment region, and two FRP-strengthened slabs each having a single opening located in the peak-moment region. The dimensions of each slab were 2600 mm (length) × 825 mm (width) × 175 mm (thickness). The openings were square (side length = 400 mm), which included cutting the middle rib. The slabs were tested under four-point flexure until failure. It was revealed that strengthening slabs using FRP sheets fully restored the flexural capacity, which was even exceeded by up to 8%. However, the secant stiffness and dissipated energy were partially restored compared with the unstrengthened slab without opening, and these response parameters were reduced by up to 19% and 32%, respectively. Moreover, the displacement ductility for strengthened specimens was moderately reduced compared with the unstrengthened specimen without opening. Furthermore, an analytical procedure was suggested based on section analysis for quick and reasonable assessment of the peak load for both unstrengthened and strengthened one-way ribbed slabs with and without flexure openings.

1. Introduction

Openings and shafts in RC slabs cannot be avoided in construction sites. They are often provided for MEP considerations and architectural purposes, such as drainage, plumbing, electrical pipes, and heating systems. Large-size openings are occasionally needed in existing RC slabs for stairs, elevator shafts, and skylights. However, these cutouts may adversely affect the structural integrity of existing slabs, and it is recommended to evaluate the slabs for probable moment redistribution prior to deciding on the locations and sizes of the cutouts. This research studied one of the most common slab types used in the Middle East region, RC one-way ribbed slab systems. Post-construction openings in existing RC one-way ribbed slabs significantly decrease their stiffness and capacity, and thus they require strengthening.
This research investigated the strengthening of ribbed slabs using FRP composites. FRP composites have been effectively used for flexural strengthening of RC beams [1,2,3,4,5,6], RC beams with openings [7,8], and RC beam-column joints [9]. This is attributed to their advantages, such as speed and ease of application, resistance to corrosion, and minimal increases in the slab weight [10]. The fiber-reinforced polymer composite materials have been recently gaining the attention of researchers [11,12].
Zhu et al. [13] reviewed the state-of-the-art techniques for flexural strengthening of RC beams and slabs using ultra-high performance concrete (UHPC). The review covered various aspects, including materials, application procedures, and effectiveness in enhancing the flexural capacity of concrete members. Baig et al. [14] examined experimentally the strengthening of slab–column connections using external steel shear bolts. The authors evaluated the effectiveness of the shear bolts in enhancing the punching shear resistance of the connections. Zheng et al. [15] employed a hybrid technique that combined CFRP and steel plates for strengthening RC slabs. Kim et al. [16] employed textile-reinforced concrete (TRC) for flexural strengthening of RC slabs. El-Mandouh et al. [17] performed experimental and numerical investigations on one-way RC slabs strengthened using different systems. The authors explored and analyzed the performance of these strengthening techniques, shedding light on their effectiveness and practical application in enhancing the load-carrying capacity of the slabs. Zainal et al. [18] used macro and micro synthetic fibers for the flexural strengthening of RC slabs.
Vasquez and Karbhari [19] investigated experimentally the performance of FRP-strengthened RC one-way solid slabs with cutouts. Four slabs (with dimensions of 6000 mm × 3200 mm × 180 mm) were tested. A central opening of dimensions 1600 mm × 1000 mm was present in each slab. Two slabs were used as control specimens, and the other two specimens were upgraded with externally bonded pultruded CFRP strips. The investigated parameters were the location of the applied load and the CFRP configuration. The strengthening schemes almost restored the flexural capacity of the tested slabs. Tan and Zhao [20] examined experimentally the performance of CFRP-strengthened RC one-way solid slabs with a single opening. A total of eight slabs (length = 2700 mm, width = 2400 mm, and depth = 150 mm) were tested. The studied parameters were the location and size of the opening, the location of the applied load, and the strengthening scheme. Two strengthening systems were studied. They were CFRP sheets versus precured CFRP strips. Both systems were effective in increasing the ultimate load of the slabs compared with the unstrengthened specimens with or without opening.
An experimental study was conducted by Smith and Kim [21] on the upgrading of RC one-way solid slabs with central openings using FRP composites. Six slabs (length = 3400 mm, width = 2500 mm, and depth = 160 mm) were tested. The studied parameters were the presence of the cutouts and the location of the applied load. Tests revealed that all FRP-upgraded specimens had higher ultimate load than the unstrengthened slabs. A case study was examined by Seliem et al. [22] on the restoration of the load-carrying capacity of RC continuous one-way solid slabs with cutouts using different strengthening techniques. Five tests were carried out on different slabs of an actual building. Three upgrading techniques were investigated: externally attached CFRP plates, anchored CFRP plates, and near-surface mounted (NSM) CFRP strips. Among studied schemes, the use of CFRP plates with anchors fully restored the peak load of the specimens with openings. In another study, Anil et al. [23] examined experimentally the upgrading of RC one-way solid slabs with openings with the help of CFRP strips. A total of 13 slabs (length = 3000 mm, width = 1000 mm, and depth = 150 mm) were tested, involving one control slab without openings, six slabs without retrofitting, and six upgraded slabs. Square openings with sizes varying from 300 mm to 500 mm were studied. Openings were located in flexure and shear zones. CFRP strips around the openings were used to upgrade the slabs with openings. The results revealed an average increase in maximum load by up to 48% for specimens with flexure openings.
Floruţ et al. [24] conducted tests on CFRP-upgraded RC two-way solid slabs with openings. The test matrix involved eight specimens. Examined parameters were the size and location of the opening, and the strengthening system. Slabs were strengthened by bonding CFRP layers to their soffit in two directions. The suggested retrofitting system enhanced the peak load of specimens by up to 57% and 121% for slabs without and with openings, respectively. Victor and Syed [25] conducted a numerical analysis on retrofitting of waffle slab with a center opening with the help of CFRP laminates. Three finite element (FE) models were created: one unstrengthened slab without an opening, one unstrengthened specimen with a center opening, and one CFRP-upgraded slab with a center opening. In the retrofitted specimen, the CFRP laminates were applied on the tension face around the opening. The strengthened specimen had very good performance compared to the unstrengthened specimen with an opening. Shehab et al. [26] conducted a research study on upgrading cutouts in one-way solid slabs using CFRP sheets. The experimental matrix involved five specimens. Examined parameters were the location of cutouts, width and thickness of CFRP layers, and CFRP configurations around the cutouts. The results showed that upgrading cutouts in RC one-way solid slabs with the help of CFRP laminates enhanced the ultimate capacity by about 10.7% and decreased the deflection by about 23%.
Mahlis et al. [27] studied the influence of openings on the response of RC two-way solid slabs. Ten square slabs were constructed and tested. The retrofitting was conducted with the help of an NSM system and externally bonded CFRP laminates. The NSM system was effective in restoring the peak load of slabs. The results also concluded that provision of additional internal steel rebars around the opening considerably increased the maximum load of specimens by 15% to 51%. Eskandarinadaf and Esfahani [28] investigated the retrofitting of RC two-way solid slabs with a central opening. Seven specimens of full scale were tested under monotonic and cyclic loading until failure. The employed strengthening methods were either GFRP laminates or NSM steel rebars. The test results revealed that strengthening slabs with a central opening using GFRP laminates and NSM steel rebars could restore 88% and 70%, respectively, of the maximum load of the control specimen. Golham and Al-Ahmed [29] investigated the behavior of GFRP-reinforced concrete slabs with openings that were strengthened using CFRP strips. Choi et al. [30] examined experimentally the strengthening of RC one-way solid slabs having symmetric openings with the help of GFRP beams. Four slabs of one-half scale with two openings were constructed and tested. Test parameters included the location of GFRP beams around openings. Three schemes of GFRP beams were employed. Test results revealed that retrofitting of slabs increased their ultimate load by up to 29% over that of the control specimen.
As identified from the above research studies, all of the available investigations were carried out on strengthening RC one- and two-way solid slabs with openings. However, a noticeable research gap exists, as none of these studies delved into the strengthening of RC one-way ribbed slabs with openings. This study aims to bridge this gap by achieving several key objectives. Firstly, it seeks to experimentally investigate the extent of stiffness and strength reduction in RC one-way ribbed slabs having openings in both the slab and joist sections within the flexure zone. Secondly, the study endeavors to devise an optimal experimental strengthening approach capable of partially or entirely restoring the loss in stiffness and strength of RC one-way ribbed slabs having openings in the flexure zone. Lastly, the study develops an analytical model capable of predicting the ultimate load-bearing capacity of both unreinforced and reinforced RC one-way ribbed slabs possessing flexure openings.

2. Experimental Program
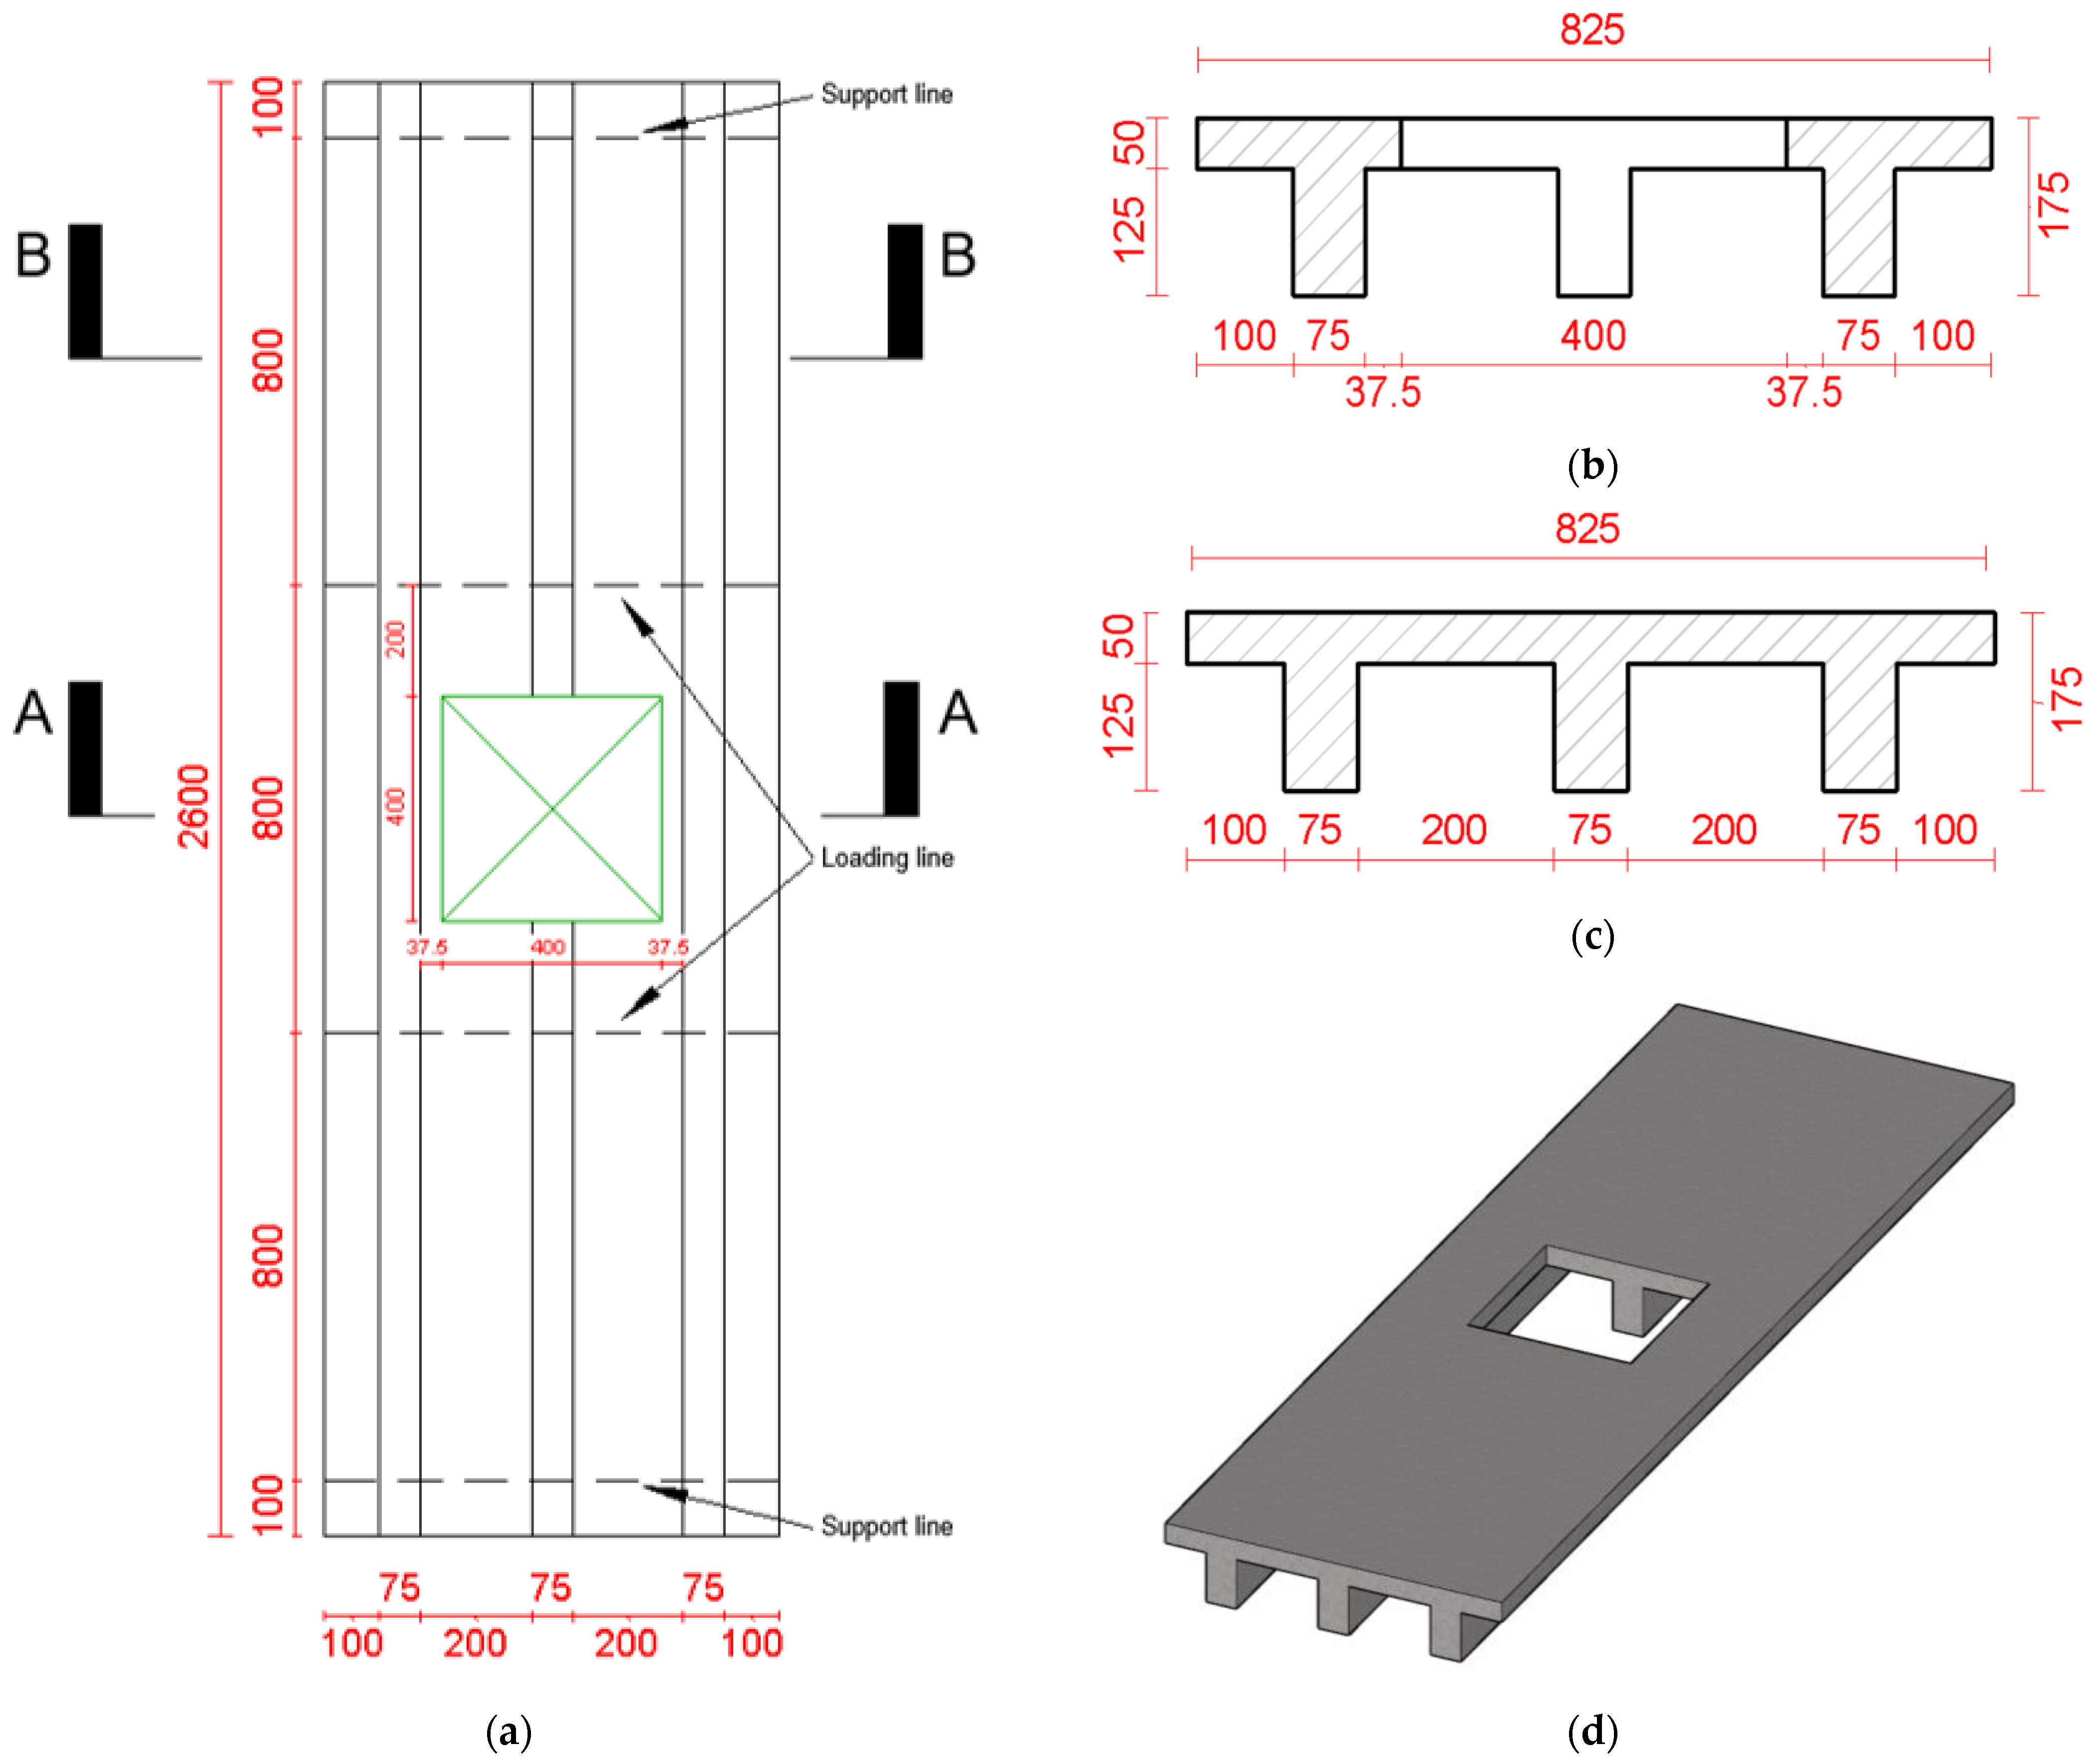
2.1. Test Matrix

Table 1 presents the test matrix. The experimental program consisted of four half-scale RC one-way ribbed slabs (having three ribs) divided into one unstrengthened specimen without openings to act as a reference, one unstrengthened specimen with a single opening located in the peak-moment region, and two FRP-strengthened slabs each having a single opening located in the peak-moment region. Figure 1 and Figure 2 illustrate the dimensions and reinforcement of the control slab and the slabs having an opening, respectively.
The dimensions of each slab were 2600 mm (length) × 825 mm (width) × 175 mm (thickness). The openings were square (side length = 400 mm), which included cutting the middle rib. It should be mentioned that in the labeling of slabs seen in Table 1, the letter “S” stands for slab specimen; the symbol “FO” signifies flexure opening; the letter “C” denotes control specimen; and the symbol “S1” stands for strengthening scheme 1, and “S2” denotes strengthening scheme 2. As identified in Figure 1 and Figure 2, each specimen had three ribs and a top slab. Each rib had longitudinal reinforcement of 2∅8 mm bottom rebars and 1∅8 mm top rebar, in addition to transverse stirrups of ∅6 mm at 200 mm spacing. The thickness of the top slab was 50 mm, and it was reinforced in both ways with ∅6 mm rebars spaced at 250 mm (see Figure 1).

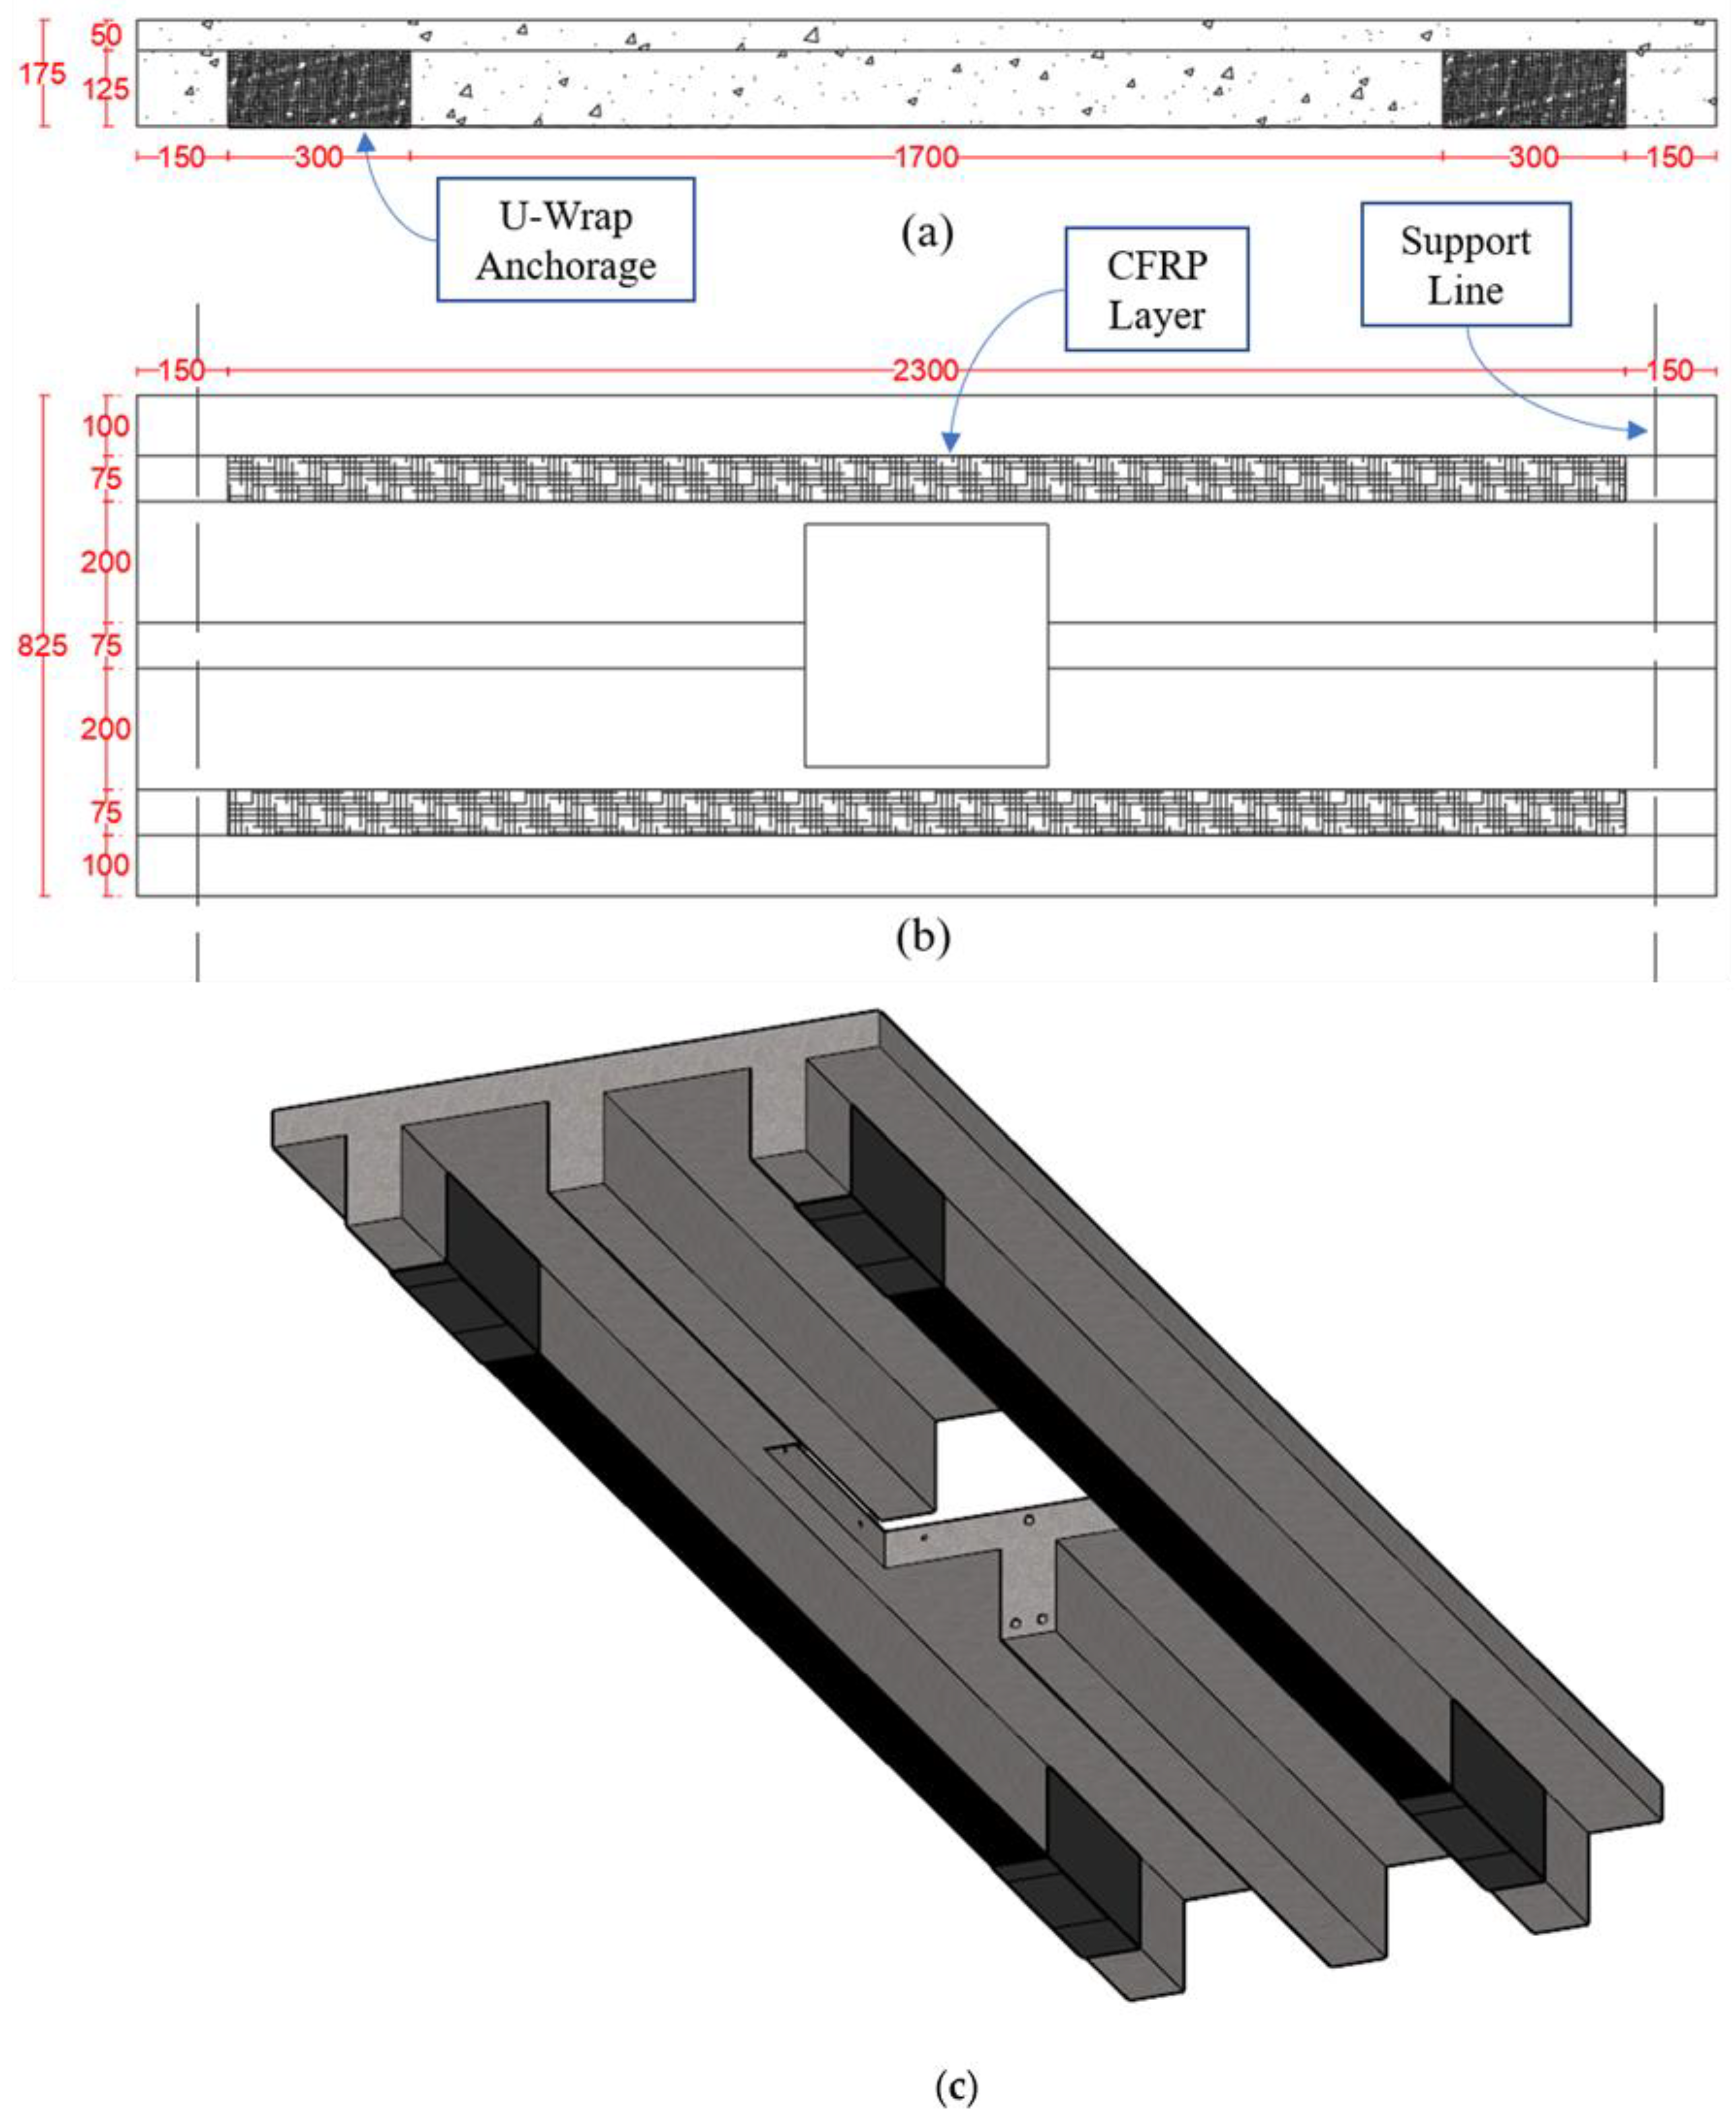
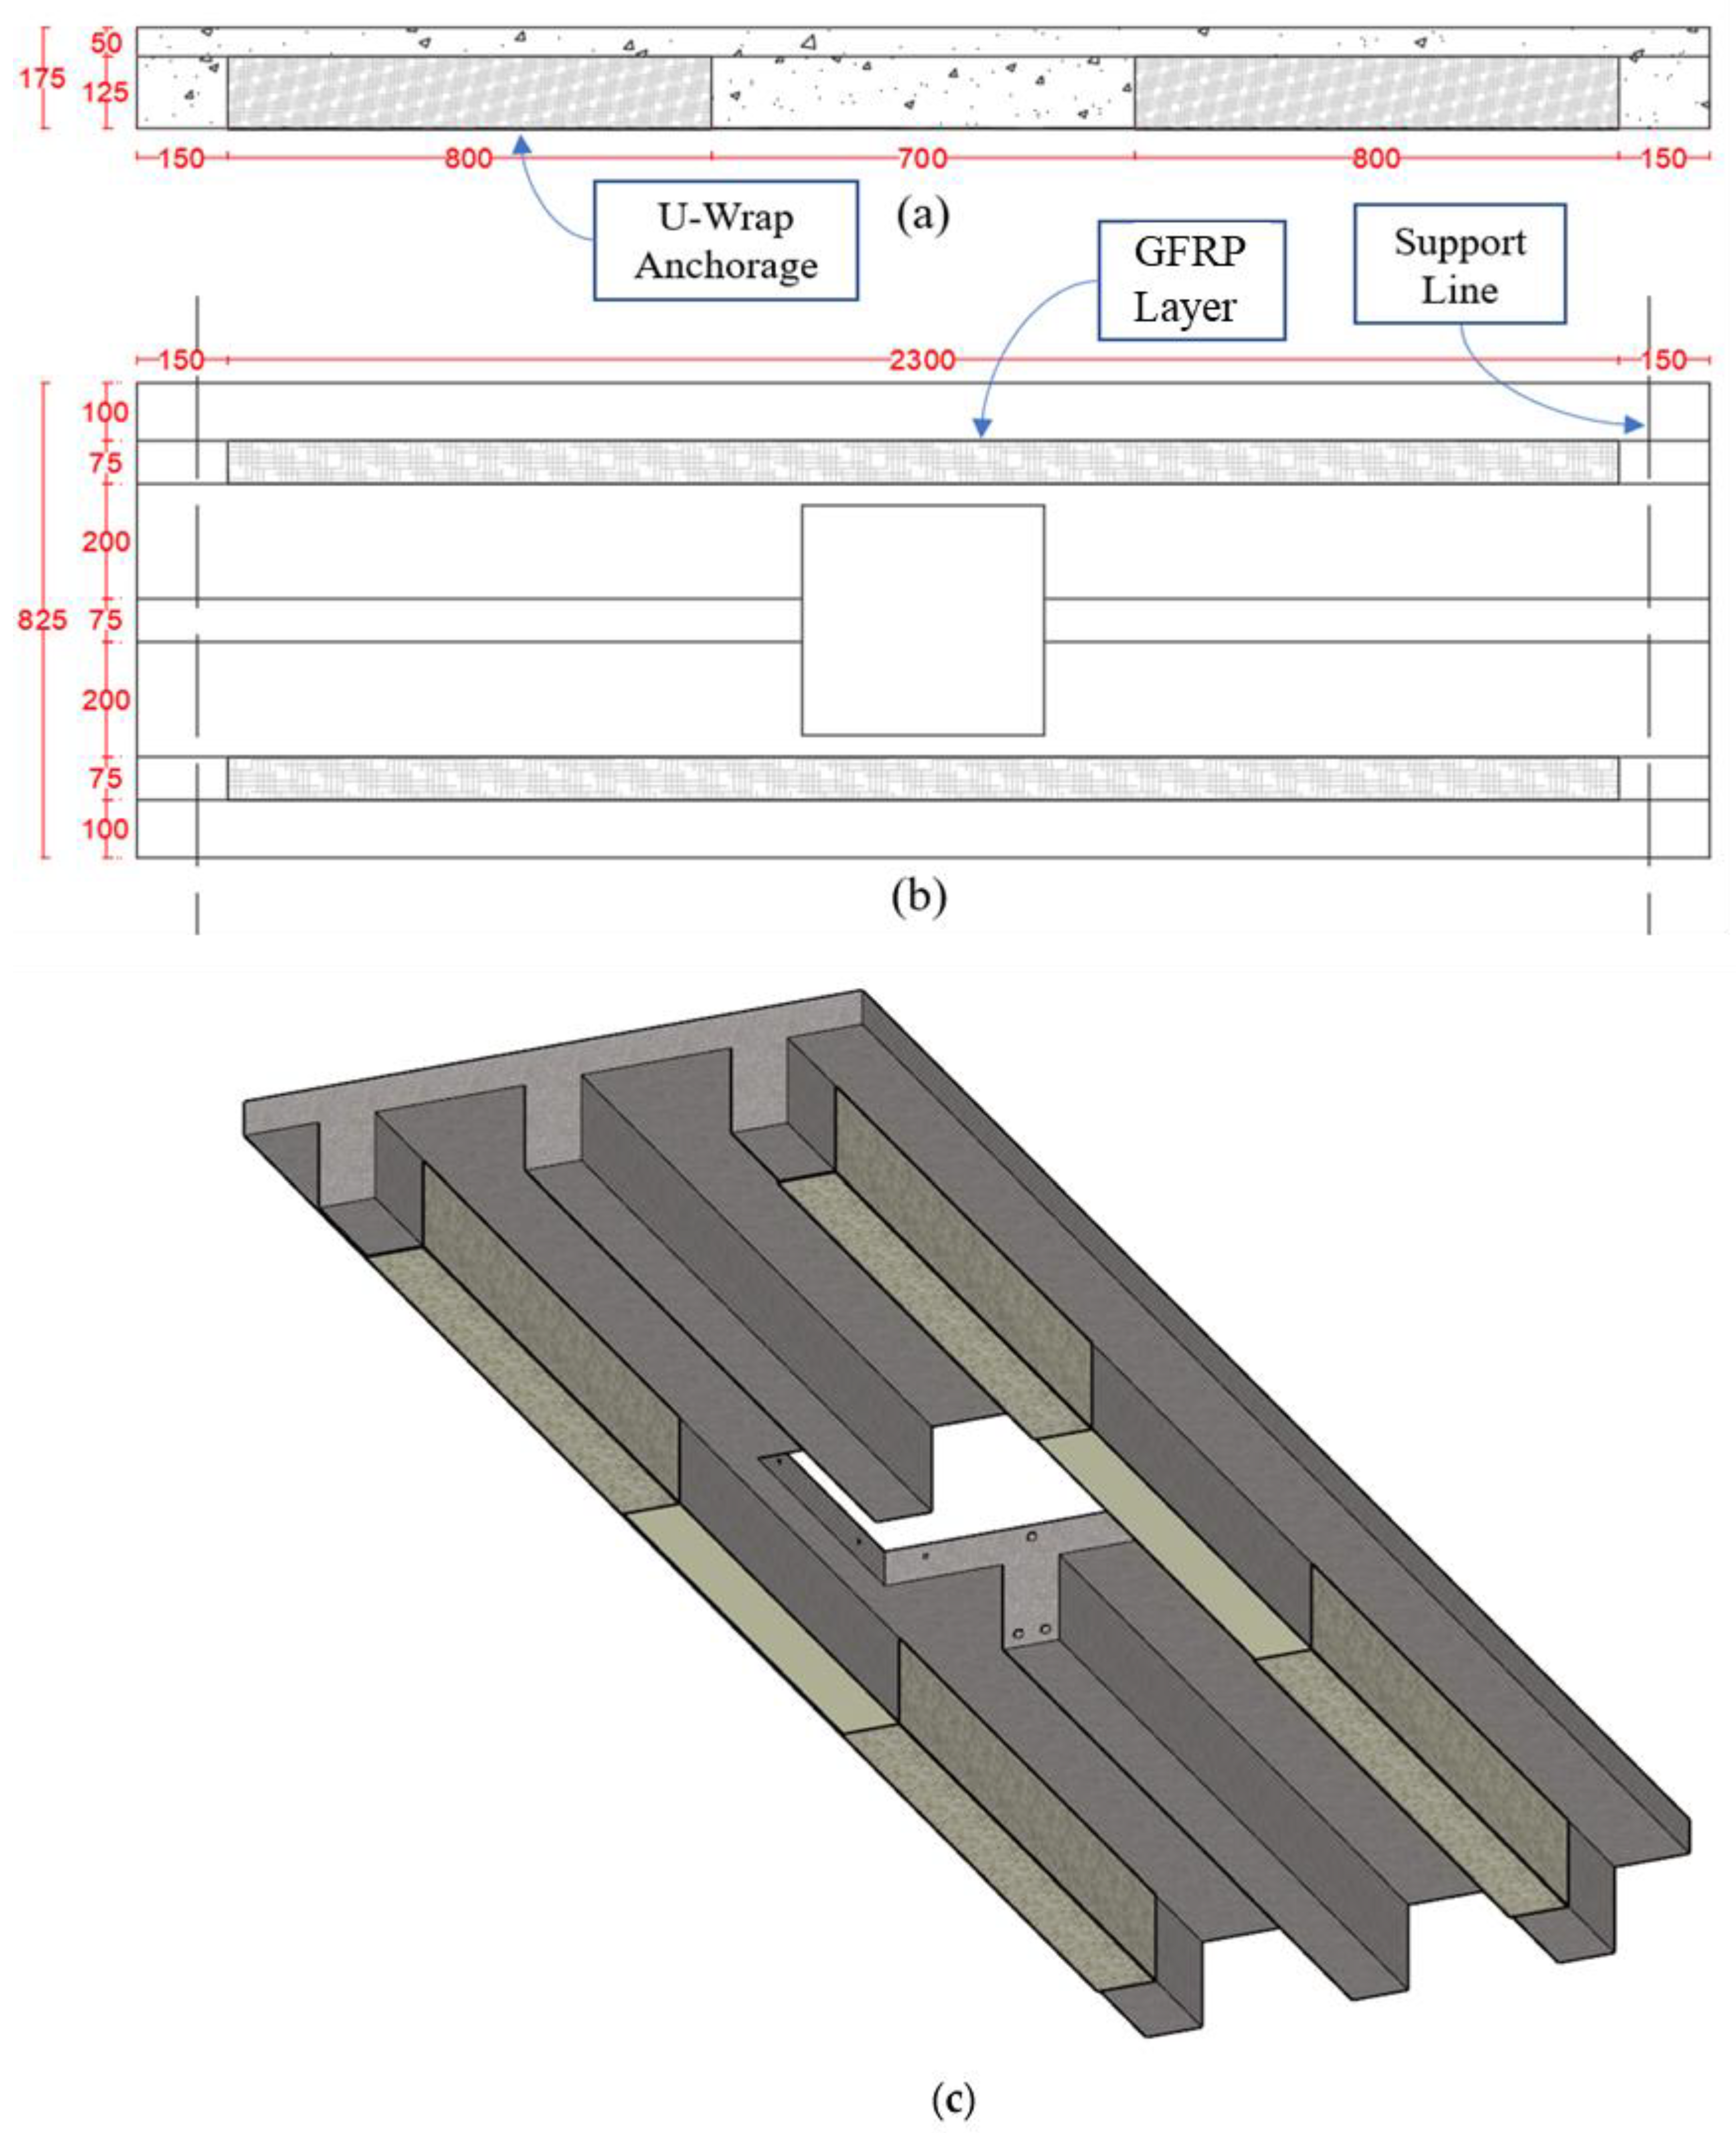
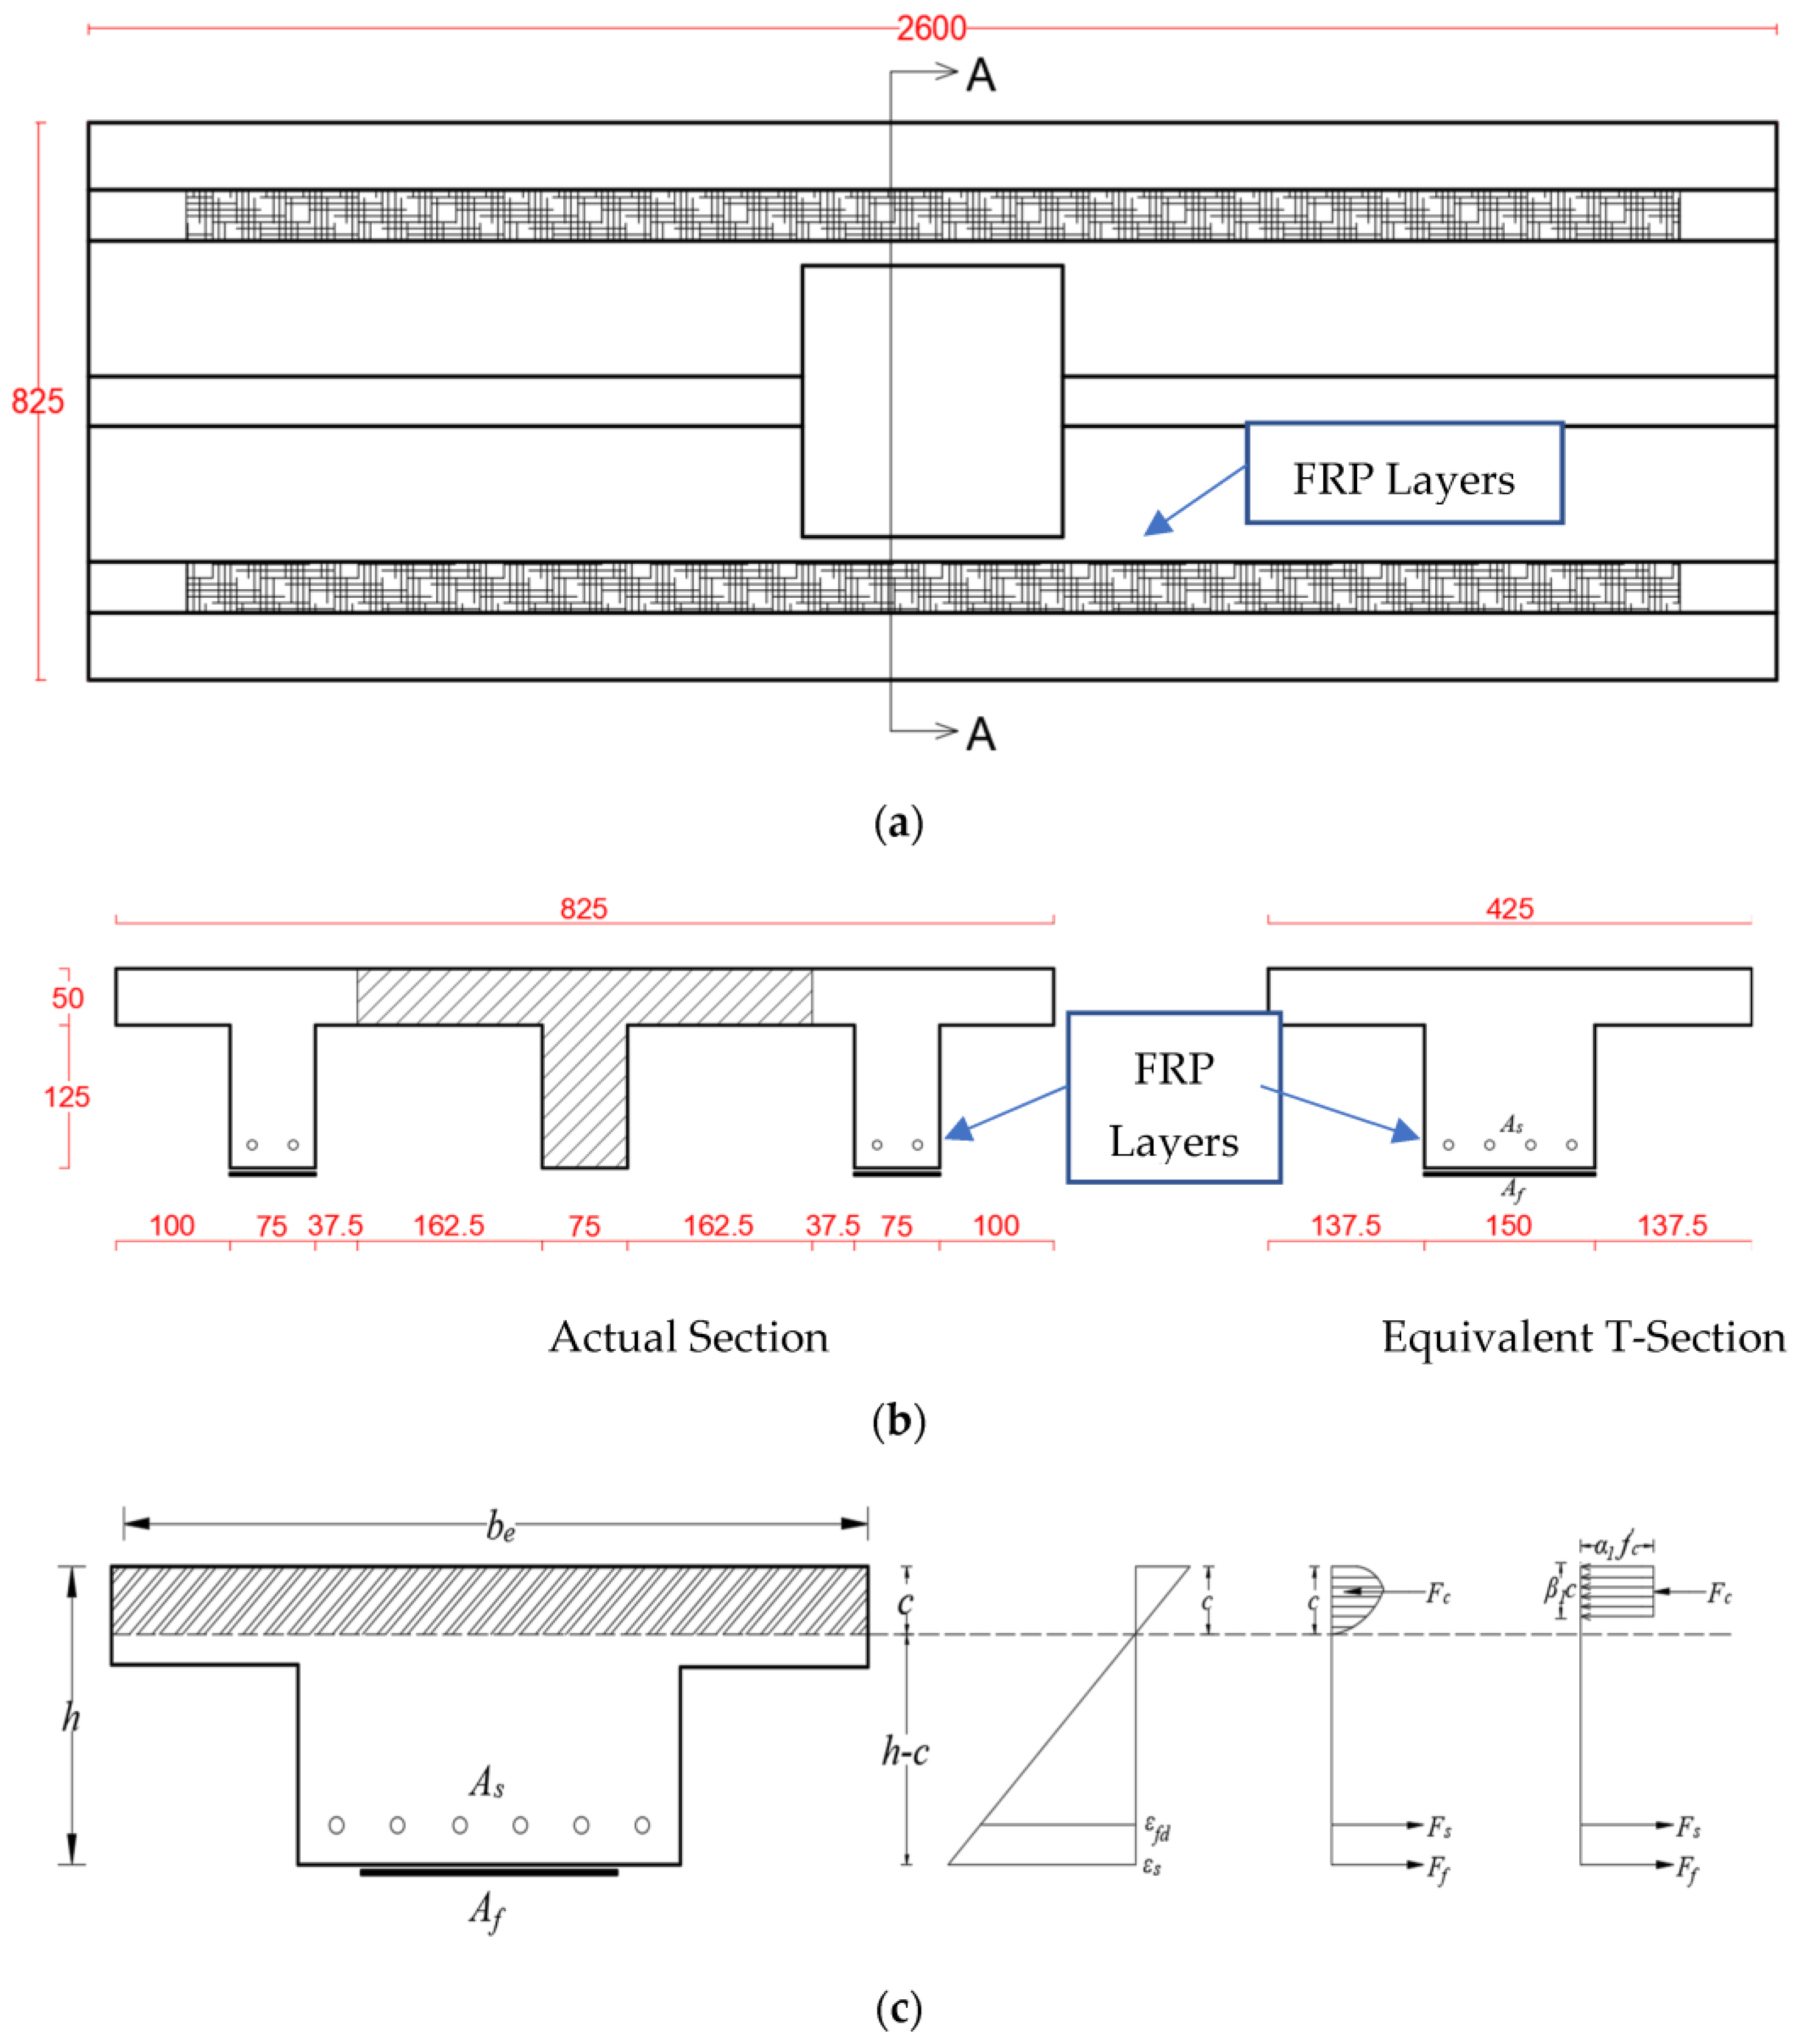
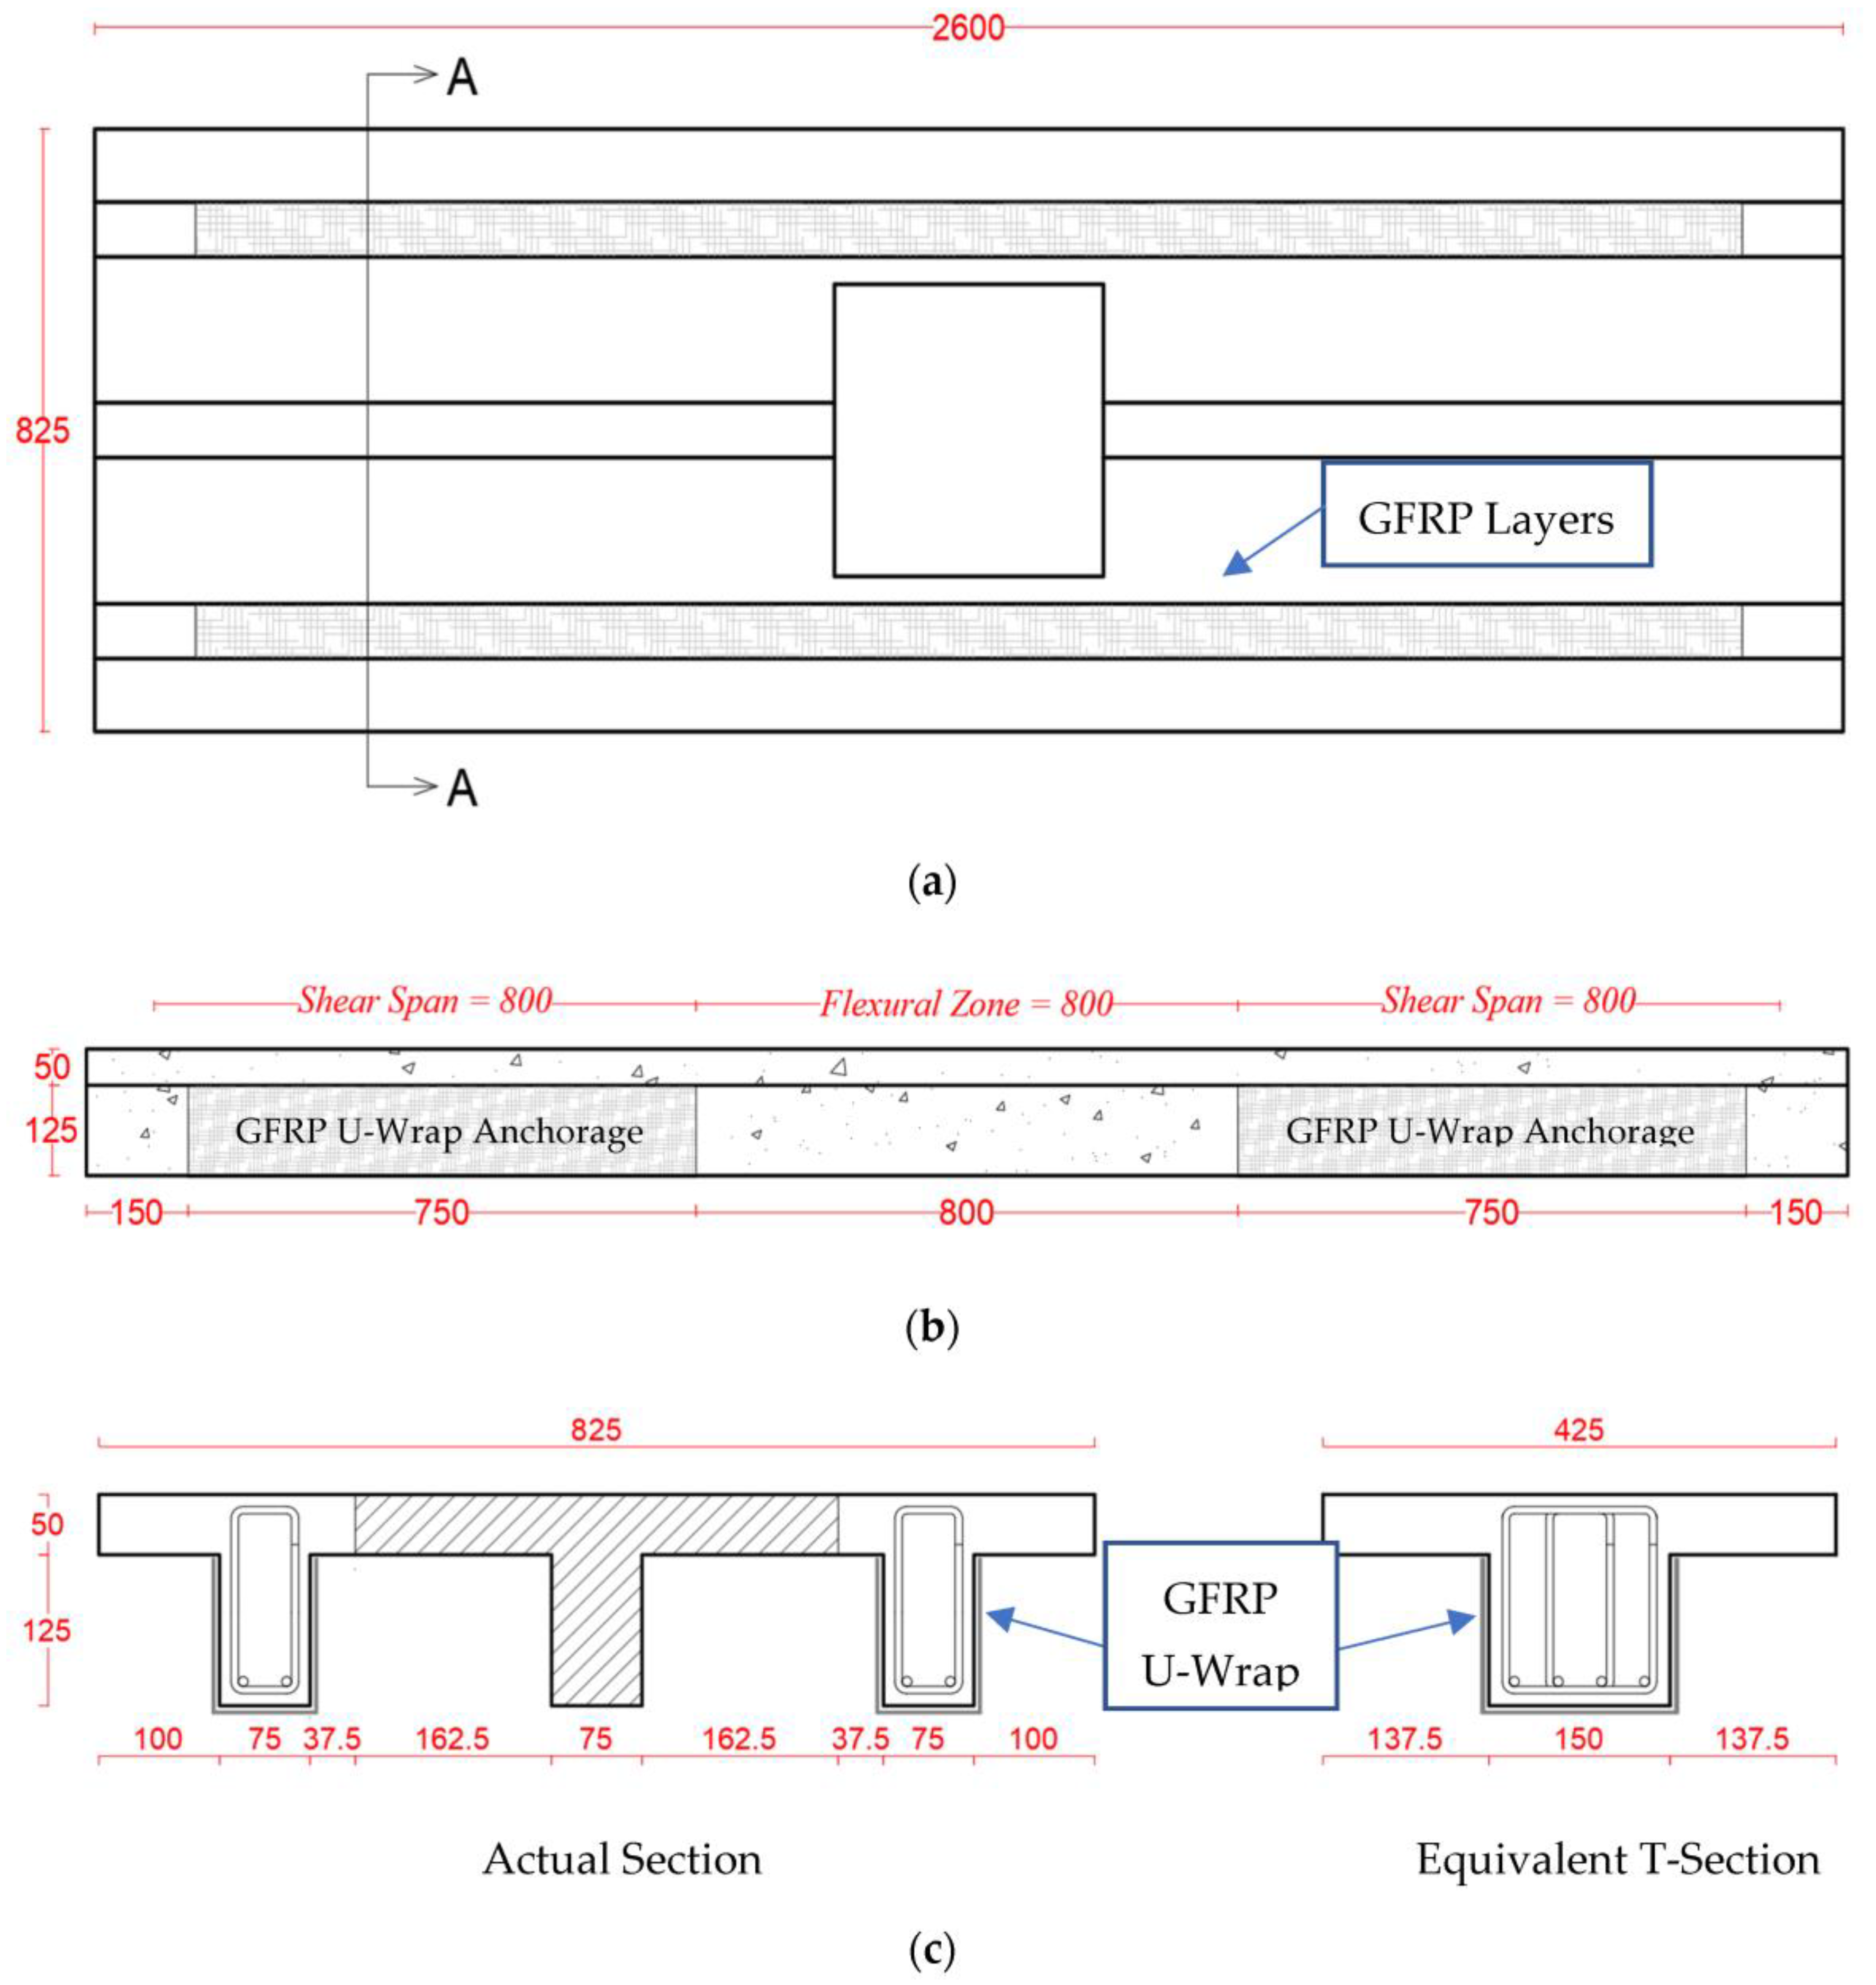
2.2. Strengthening Schemes

Figure 3 and Figure 4 show, respectively, details of the first and second strengthening schemes. The first strengthening scheme for specimen S-FO-S1 was by applying a bottom single CFRP layer to strengthen both edge ribs with carbon fibers running in the longitudinal direction of the ribs. This longitudinal CFRP layer was anchored at the ends using a single layer of CFRP U-wrap extended for twice the depth, as illustrated in Figure 3. It should be noted that the design of this scheme was as per the equations of the ACI 440.2R-17 [31], by which a strengthened section was designed to have almost the same capacity as the unstrengthened slab without opening (S-C).
In specimen S-FO-S2, the second scheme was used for flexural strengthening. This scheme is identical to the first one except that the single CFRP layer was replaced by two GFRP layers (to give almost the same flexural strength enhancement). Similarly to scheme-1, two layers of GFRP U-wrap were provided as end anchorage for the longitudinal GFRP layers. For avoiding the intermediate flexural shear crack debonding failure noticed in one of the ribs of specimen S-FO-S1 (as will be discussed later in Section 3.1), it was decided to extend the U-wrap anchorage in specimen S-FO-S2 to the whole shear span, as seen in Figure 4.

2.3. Properties of Constituent Materials

Table 2 shows the properties of different materials. Ready-mix concrete was employed for the casting of slabs. Concrete cylinders of size 150 mm × 300 mm were prepared and tested as per ASTM C39/C39M [32] for assessing the compressive strength at 28 days and during the testing of slabs. Locally manufactured ∅8 mm steel rebars were utilized as longitudinal reinforcement for ribs, while ∅6 mm steel rebars were employed for both stirrups of ribs and reinforcement of the top slab. Tensile tests were carried out on the steel rebars in accordance with ASTM E8/E8M [33]. To strengthen slabs with flexure openings, CFRP and GFRP sheets were utilized. Standard tensile coupons of CFRP and GFRP sheets were prepared and tested as per ASTM D3039/D3039M [34].

2.4. Preparation of Slab Specimens
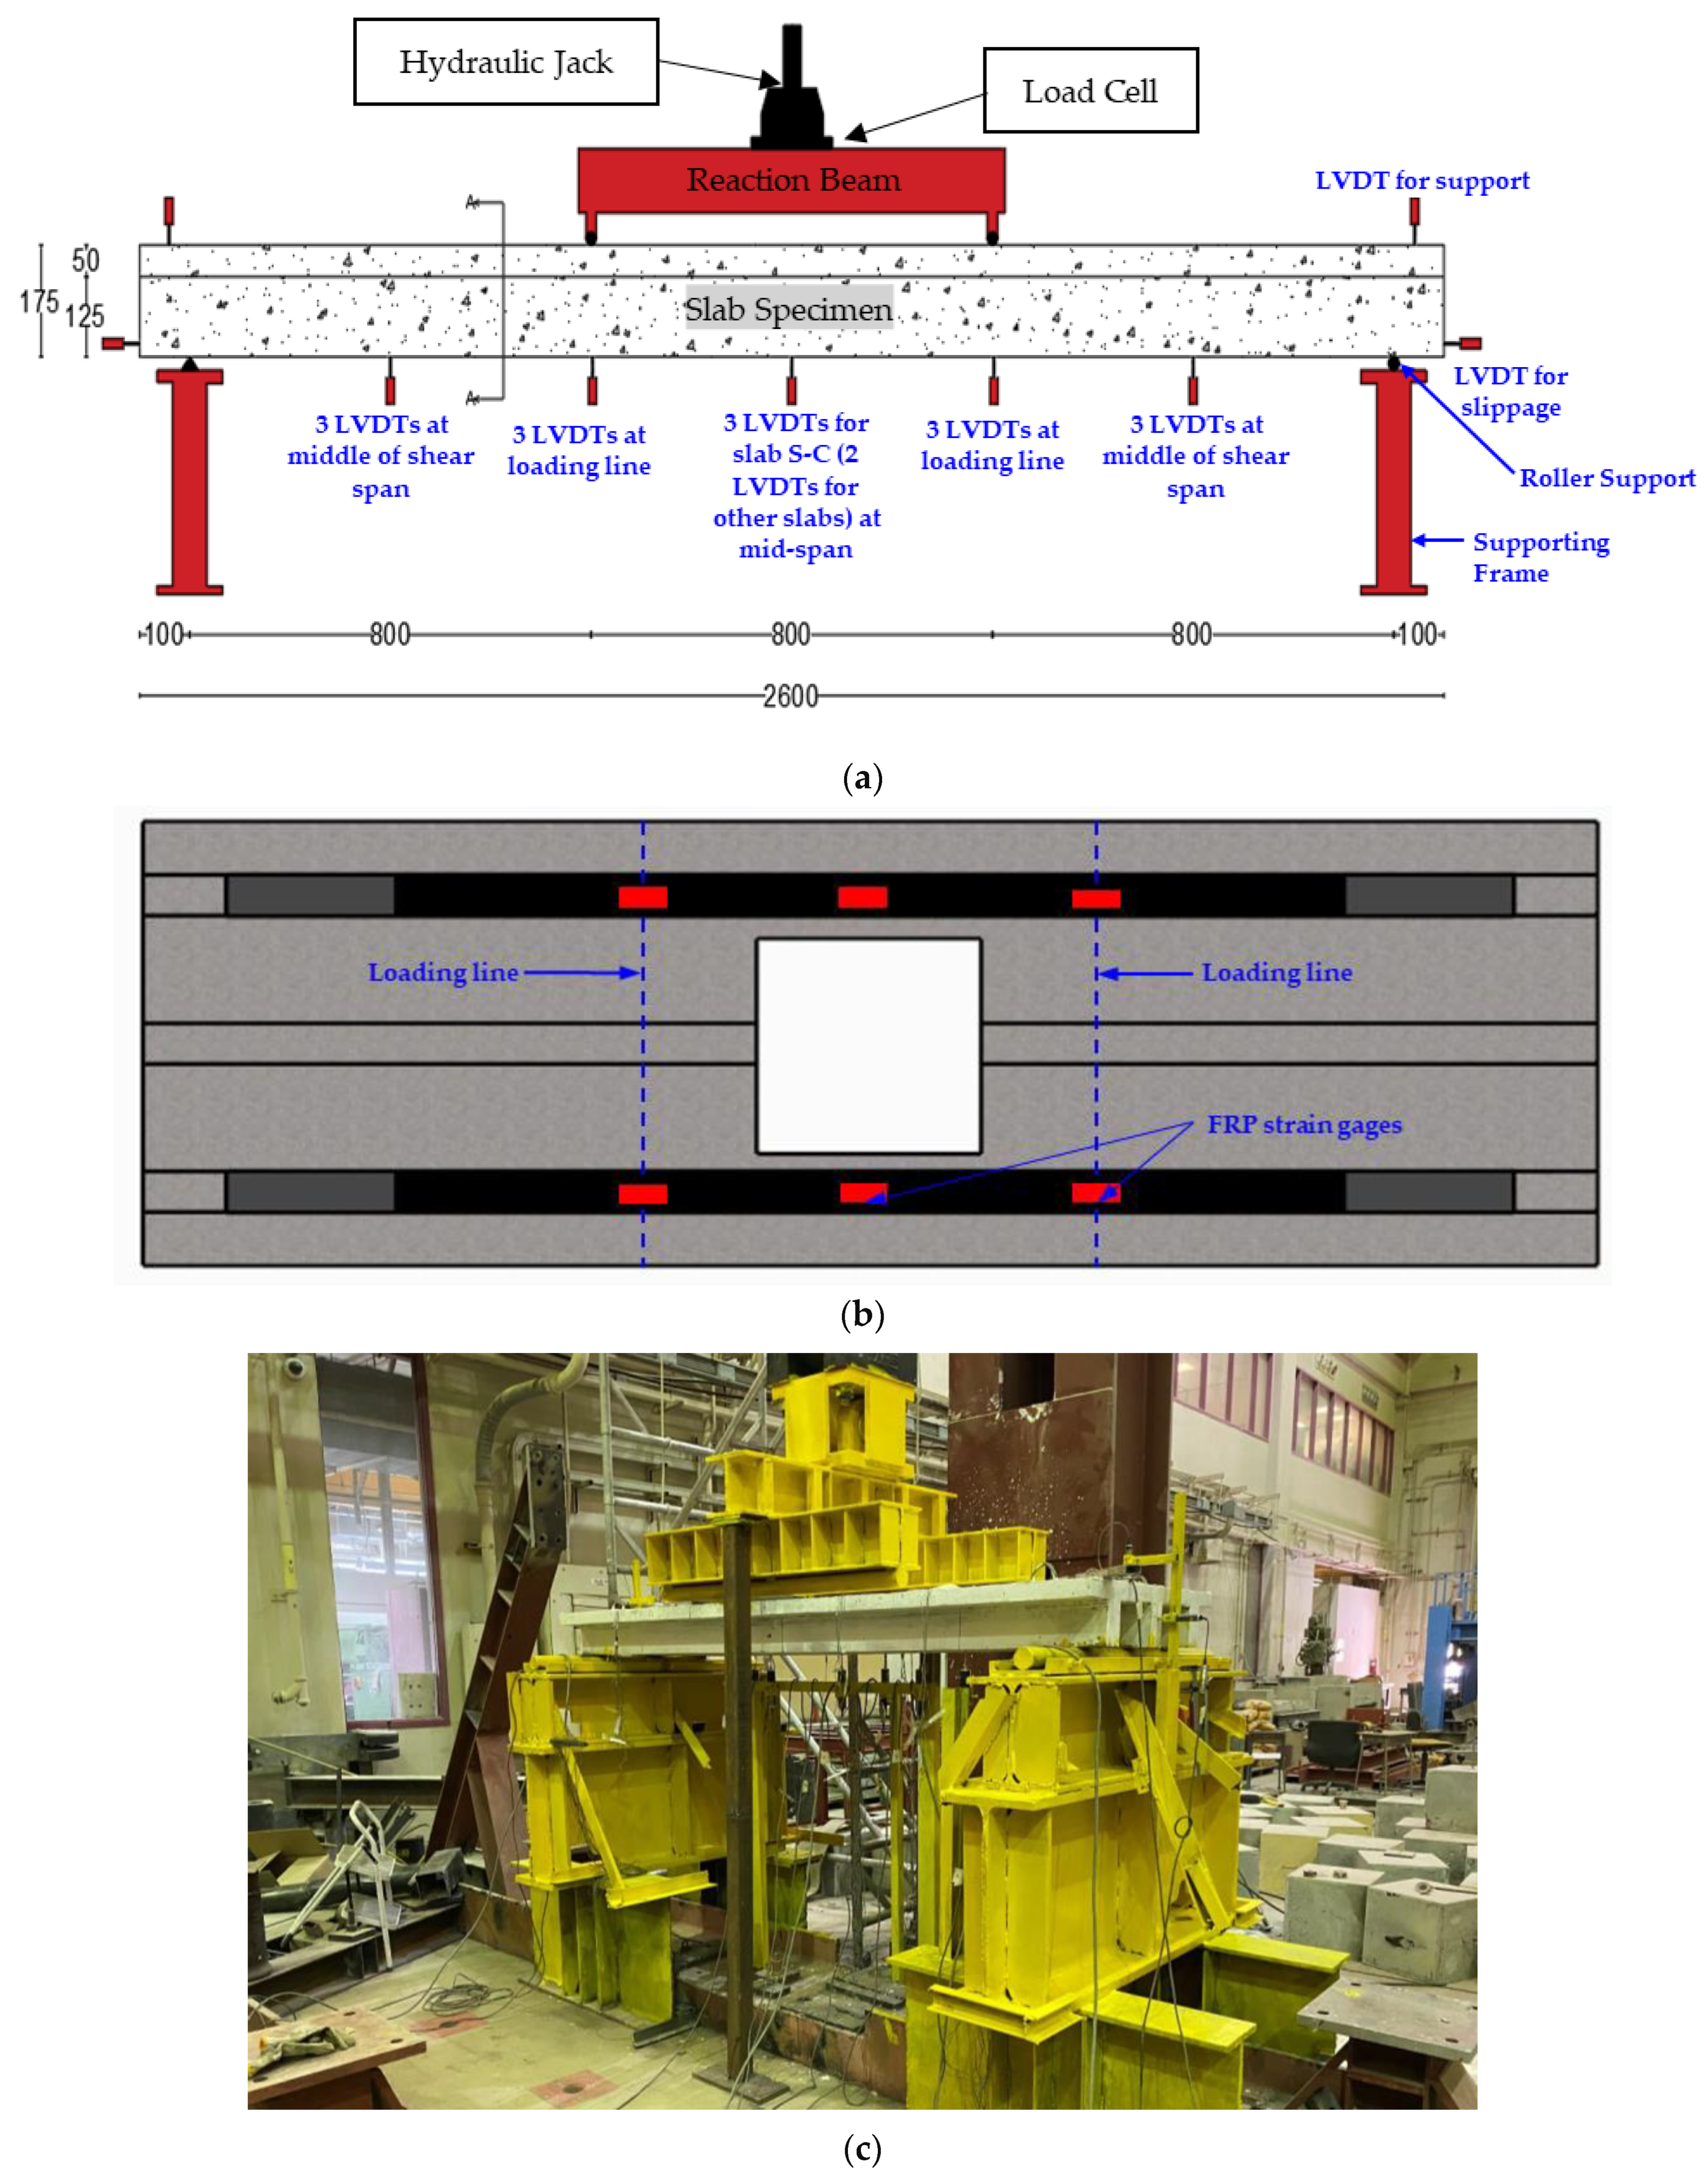
Cages of steel rebars were prepared and checked as per the design plans. After that, the wooden formwork was ready. Then, strain gauges were installed on steel rebars as designed in order to carry out test measurements. Then, reinforcement cages were installed inside the formwork with precast concrete spacers attached to it. At the end, final checks were performed for quality assurance and casting approval. The concrete was provided by a local supplier, and all slabs were cast simultaneously to avoid any variations in concrete batches. Figure 5 presents the different phases for the preparation of slabs. After concrete curing, the surfaces of strengthened specimens were prepared for the application of FRP sheets. Bonding of CFRP and GFRP sheets was conducted as per the standard wet-layup method used in typical FRP applications [31].

2.5. Test Setup

Figure 6 presents the test setup and sensor layout for the slab specimens. All slabs were exposed to two-line loading (800 mm spaced) via a steel assembly. The line loads were acting on the entire width of slabs (Figure 6a).
The load was applied utilizing a 1000 kN machine. As seen in Figure 6a, specimens were instrumented for recording mid-span deflections using linear variable displacement transducers (LVDTs). Also, strains in longitudinal rebars, transverse stirrups, and FRP composites were measured using electrical resistance strain gauges. Figure 6b shows the location of FRP strain gauges for strengthened specimens. Machine load was applied in a displacement-controlled strategy until failure. A data acquisition system was employed to record load, deflections, and strains at intervals of 1.0 sec. It should be noted that a layer of gypsum was provided under each loading line to ensure the achievement of uniform loading during the testing.

3. Results and Discussion

3.1. Failure Modes

This section describes the failure modes that were noticed during the testing of each specimen. The failure modes of test specimens are presented in Figure 7, Figure 8, Figure 9 and Figure 10. As shown in Figure 7 and Figure 8, the control slabs S-C and S-FO-C had the typical failure of tension-controlled RC members. They failed in flexure through the propagation of flexural cracks at the mid-span with the final mode of failure being concrete crushing at the critical section associated with fracture of the bottom steel rebars of the ribs. However, as presented in Figure 9 and Figure 10, the two FRP-upgraded specimens S-FO-S1 and F-FO-S2 had the typical failure of FRP-upgraded RC members with low to moderate FRP reinforcement ratios [35]. Flexural cracks were developed in the maximum-moment region, and the failure was owing to FRP rupture (combined with intermediate crack-induced FRP debonding for specimen S-FO-S1). The failure was succeeded by fracture of bottom tension rebars of ribs and then crushing of concrete on the compression zone. Further discussions of the failure modes of each specimen are given below.

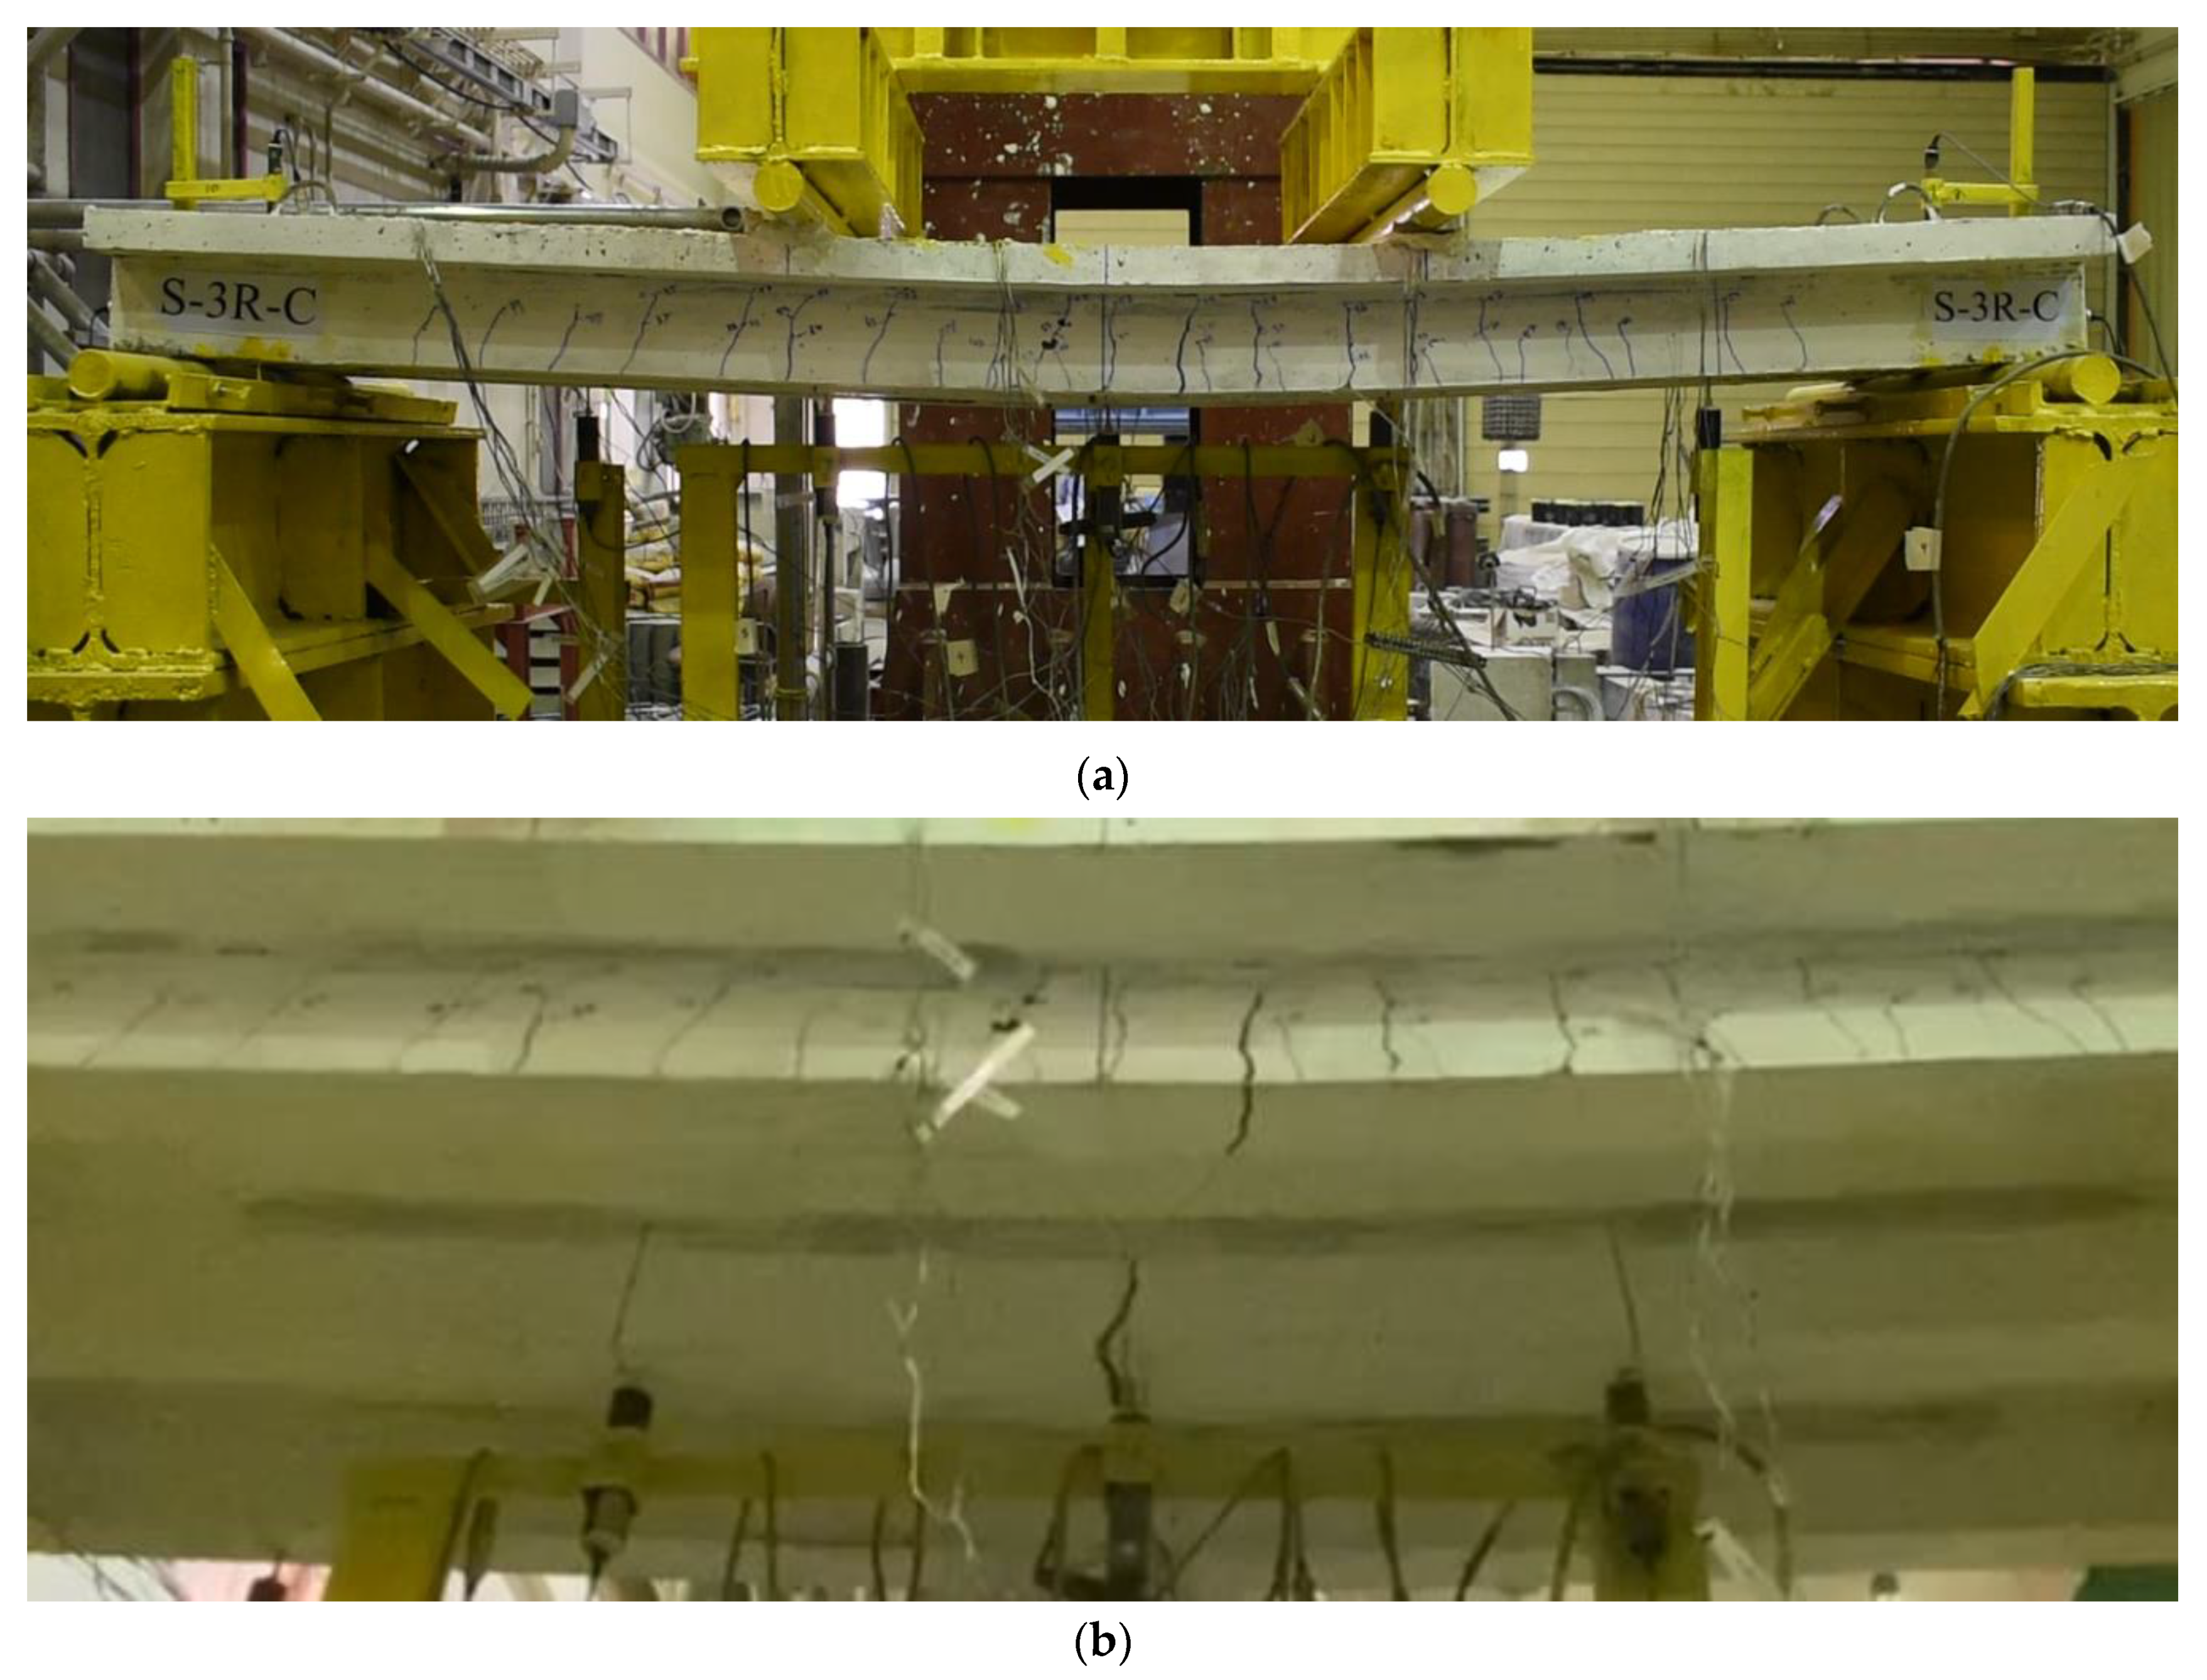
3.1.1. Control Specimen without Opening (S-C)

Figure 7 shows the failure mode of reference slab S-C. The first visible major flexural crack for specimen S-C was observed at a loading of 22 kN (near the mid-span of the specimen), and it was consistent in the three ribs. The slab failed progressively in flexure as the failure occurred first in the middle rib, and it was subsequent by one of the edge ribs. Ultimately, the third rib failed in flexure. In each rib, flexural failure was identified by fracture of the bottom steel rebars at the location of the major flexural cracks, and it was succeeded by crushing of concrete on the top side of the slab, as seen in Figure 7.

3.1.2. Control Specimen with Flexure Opening (S-FO-C)

Figure 8 shows the failure mode of control slab S-FO-C. The first major flexural crack for specimen S-FO-C was observed at a loading of 12 kN (near the mid-span of the specimen), and it was consistent in the two edge ribs. The slab failed progressively in flexure, and the right rib (back rib) failed first owing to the fracture of the bottom steel rebars at the location of a major flexural crack at the peak load of 38 kN. This failure was succeeded by crushing of concrete on the compression side of the right rib. Subsequently, the load went down to about 18 kN, and failure occurred in the left rib (front facing) owing to the fracture in the bottom steel rebars, at which the load dropped down. The failure was also superseded by crushing of concrete on the top of the left rib zone, as seen in Figure 8.

3.1.3. CFRP-Strengthened Specimen (S-FO-S1)

Figure 9 presents the mode of failure for strengthened slab S-FO-S1. As clarified, the failure mode of the left rib was different from that of the right rib. In the right rib, the initial major flexural crack was noted at a loading of 20 kN (near the mid-span of the specimen). With the increase in mid-span deflection, the flexural cracks spread into the maximum-moment region. At the ultimate load of 64 kN, a rupture was noticed in the bottom CFRP layer with delaminating of the bottom concrete cover, and the load suddenly dropped. However, in the left rib, the first major crack was observed close to the loading line, and it was a flexure-shear crack, which extended from the bottom surface toward the compression zone at the top. Upon rupture of the CFRP laminate in the right rib, an intermediate flexure-shear crack (IFSC) debonding was noticed in the left rib at the CFRP/concrete interface. IFSC debonding is induced by a geometric discontinuity of a strengthened member at the location of flexural or shear/flexural cracks [35,36]. The final failure of the slab was owing to the fracture of the bottom steel rebars of the right rib, which was associated with crushing of concrete on the compression side. Nevertheless, the fracture of steel rebars was not observed in the left rib.

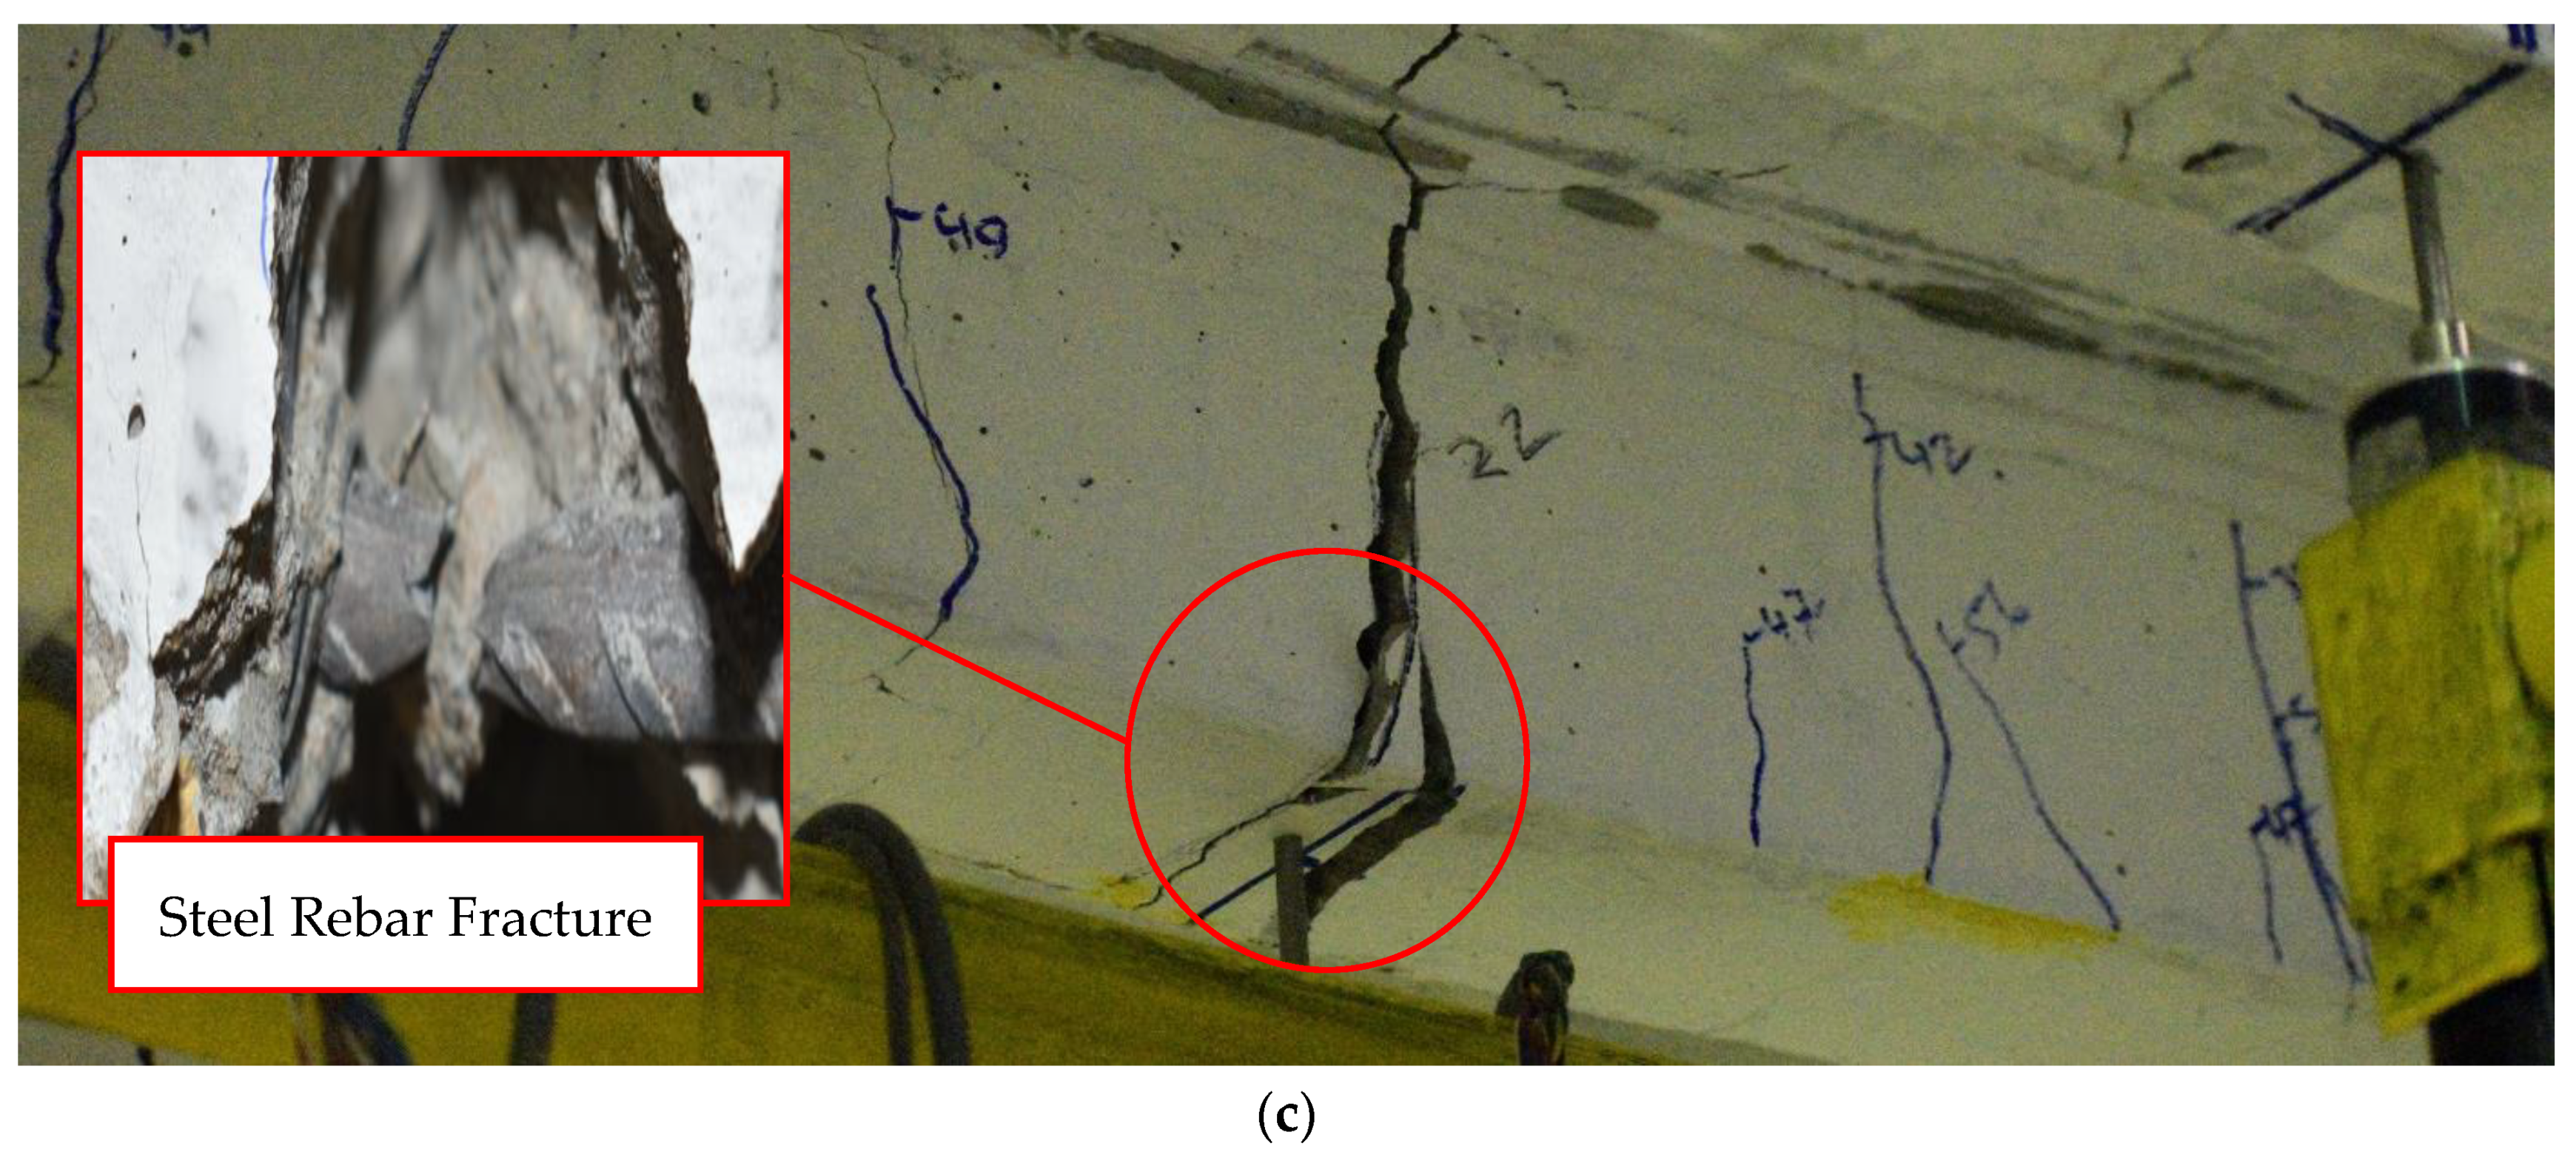
3.1.4. CFRP-Strengthened Specimen (S-FO-S2)

The failure mode of GFRP-strengthened specimen S-FO-S2 is presented in Figure 10. As clarified, the failure patterns of the two ribs were almost identical. Failure was progressive and occurred first in the left rib, then the right rib failed at a later stage. In both ribs, the initial major flexural crack was noted at a loading of about 15 kN (near the mid-span of the specimen). With the increase in mid-span deflection, the flexural cracks spread into the maximum-moment region. At the ultimate load of 60 kN, a rupture was noticed in the bottom GFRP layers of the left rib with partial detachment of the bottom concrete cover. Subsequently, the load dropped, and failure occurred in the right rib owing to the rupture of the GFRP layers. Subsequently, a fracture of the bottom rebars in the left rib occurred, and it was succeeded by crushing of concrete on the compression zone at the top of the slab.

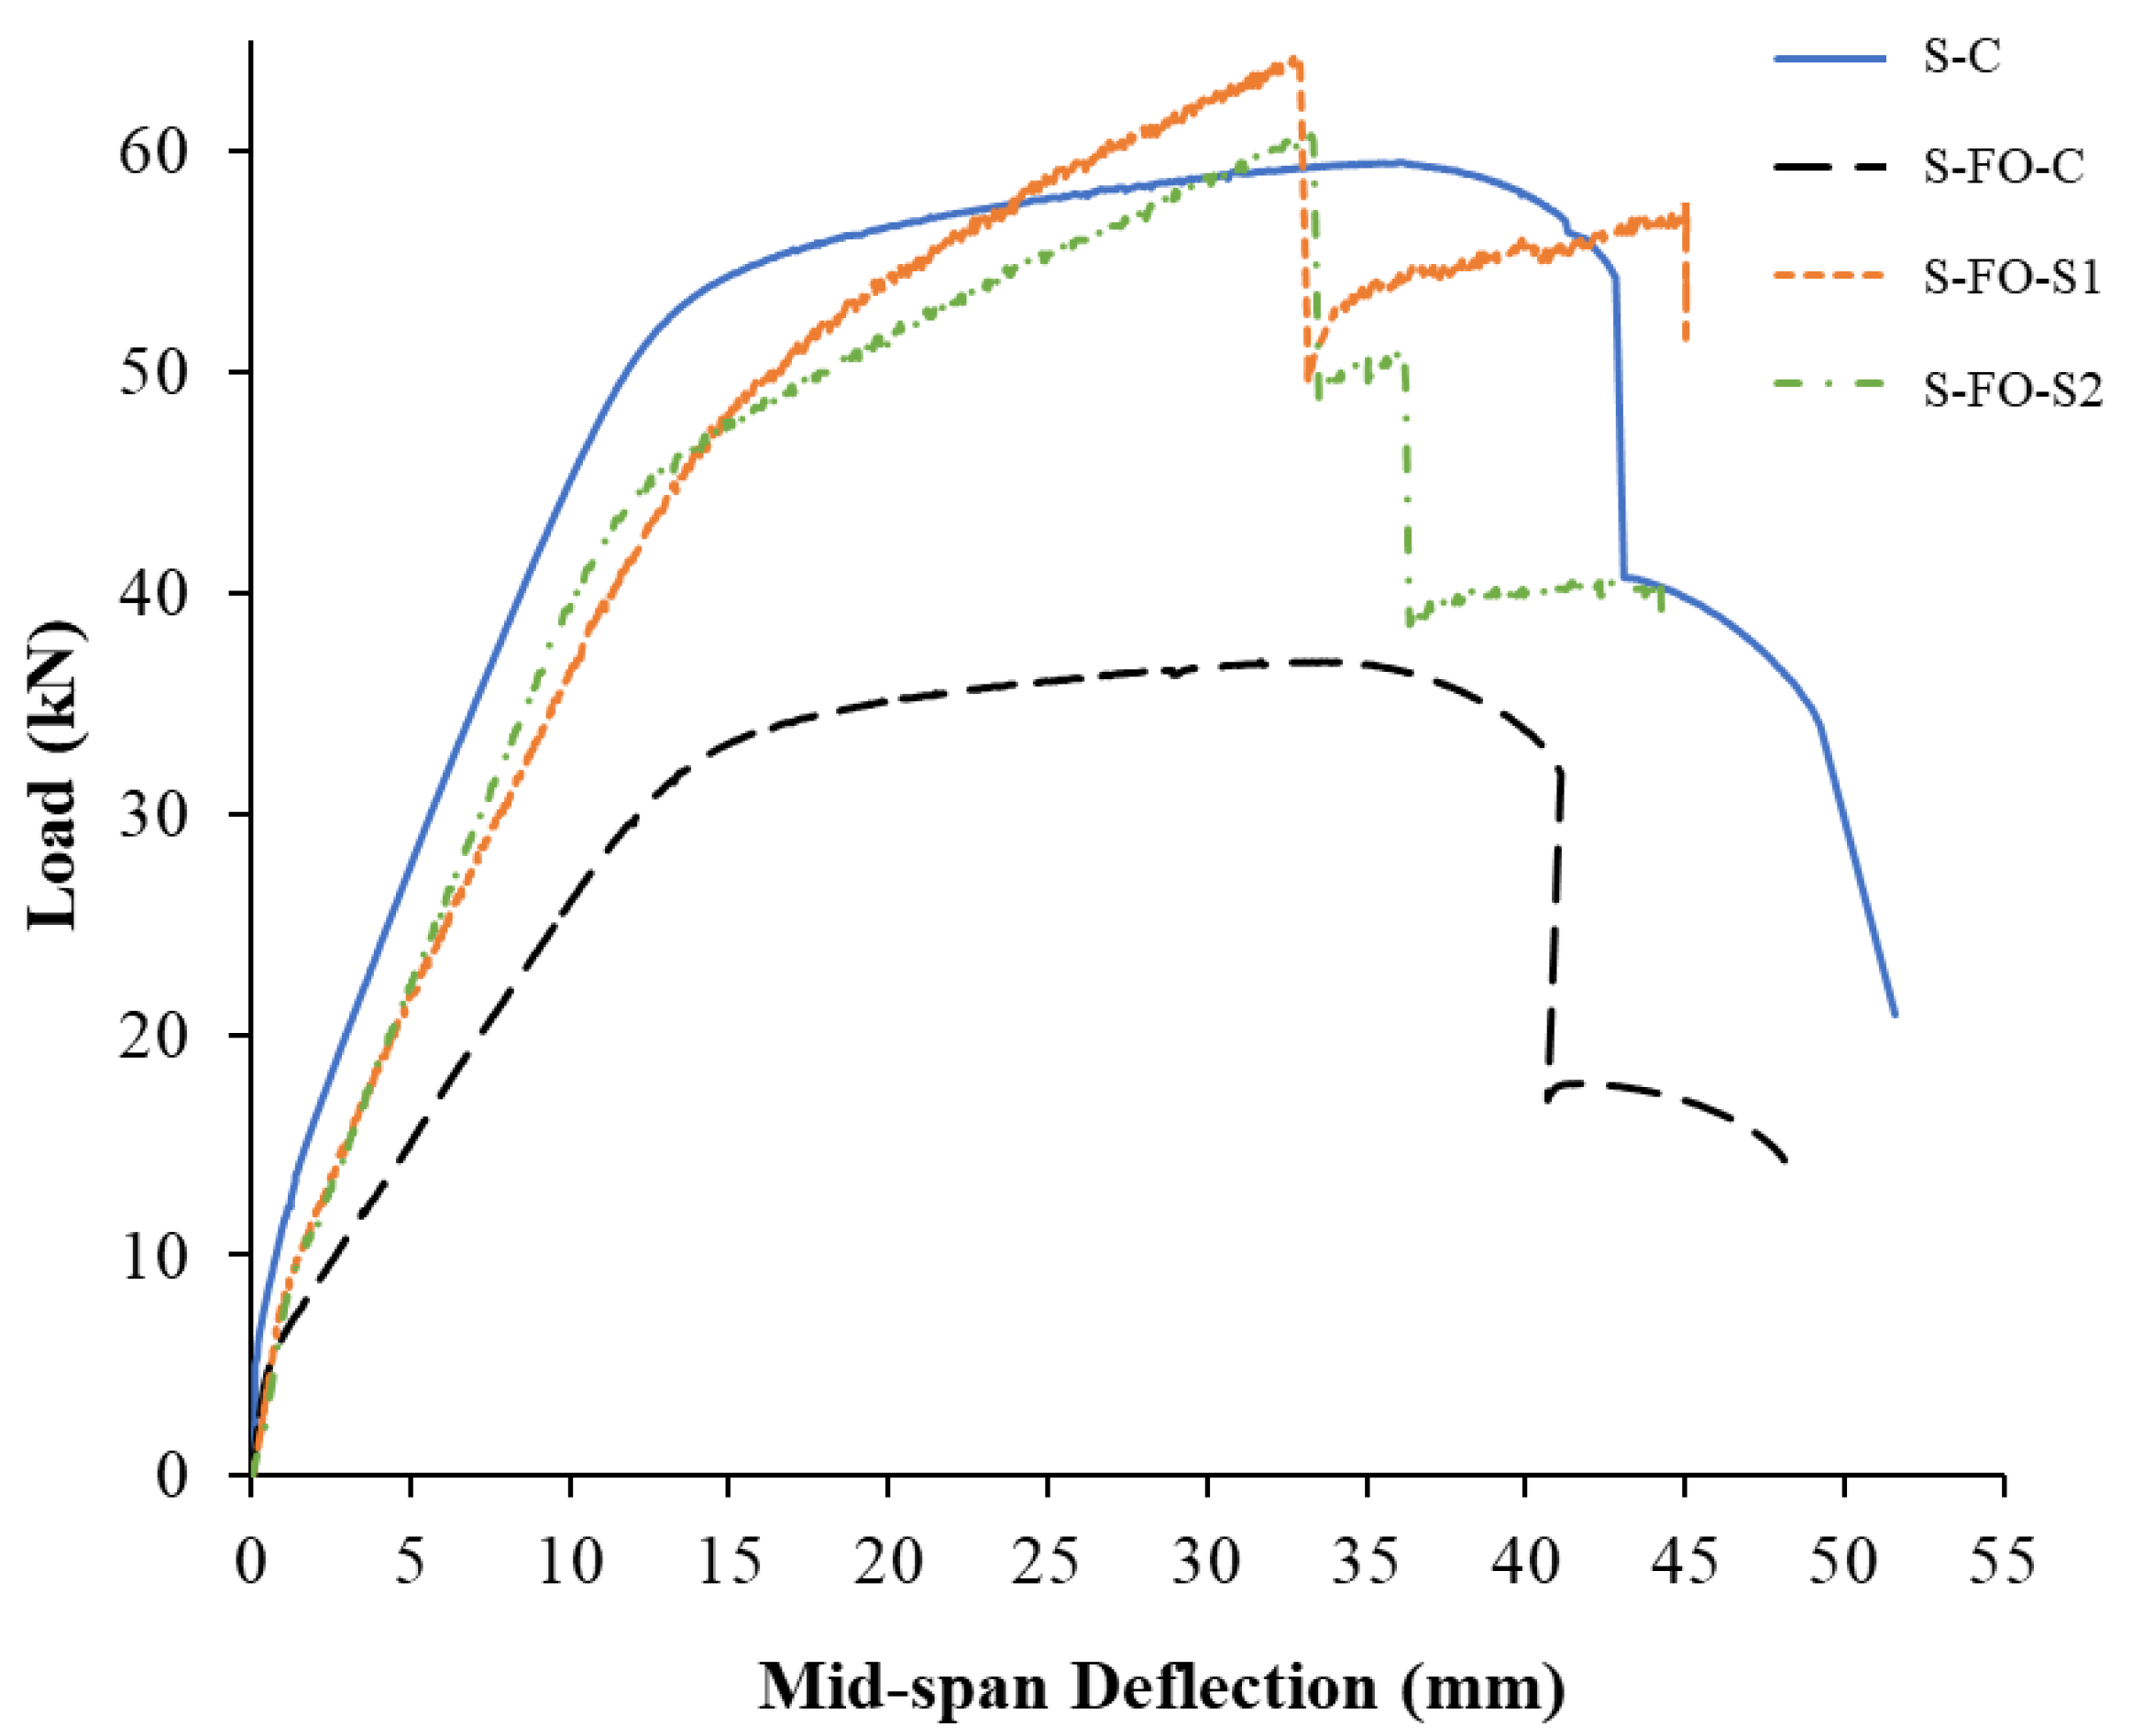
3.2. Relationships of Load versus Mid-Span Deflection

Relationships of load versus mid-span deflection and their characteristics are discussed in this section for the four tested slabs. Figure 11 shows the load–deflection plots for tested slabs. As noted from Figure 11, the control slabs S-C and S-FO-C had the typical trilinear load–deflection curve of tension-controlled RC flexural members. The first slope of the load–deflection plot was the uncracked stiffness. The second slope of the plot was the effective post-cracking pre-yield stiffness. However, the third slope of the curve was the post-yield stiffness, and it was almost flat until flexural failure. Due to the presence of the central flexure opening, both the uncracked and post-cracking pre-yield stiffness of specimen S-FO-C were less than those of the control specimen without flexure opening (S-C). Similarly to the control specimens, it is also depicted in Figure 11 that the two FRP-upgraded slabs had a typical trilinear load–deflection curve up to the peak load. The load-deflection curves of the two strengthened slabs were close to each other. The uncracked stiffness of the upgraded slabs was almost identical to that of the control slab with flexure opening (S-FO-C). However, owing to the FRP strengthening, the second slope of the curve (i.e., the post-cracking pre-yield stiffness) for the two upgraded specimens was considerably larger than that of the control slab S-FO-C. As typically found in FRP-upgraded flexural members, the third slope of the curve (i.e., the post-yield stiffness) of the two strengthened slabs was significantly greater than those of the two control specimens S-C and S-FO-C.
Table 3 presents the crucial experimental results for the load–deflection curves (Figure 11) with respect to: load at onset of concrete cracking; load at onset of rebar yielding; maximum load; mid-span deflections at cracking load, yield load, maximum load, and ultimate state; post-cracking secant stiffness, dissipated energy at ultimate state, and deflection ductility. It was considered in this research that the ultimate state corresponded to a 20% reduction in the peak load [37]. The post-cracking secant stiffness was calculated as the yield load divided by the related mid-span deflection. The dissipated energy was computed as the area under the load versus deflection curve up to the ultimate deflection. The deflection ductility was estimated as the ratio between ultimate and yield mid-span deflections. It is important to note that the peak loads listed in Table 3 are the recordings of the machine load cell, and they do not precisely characterize the moment capacity of the specimens, as they excluded the self-weights of both the specimen and the loading assembly. The self-weight was excluded to simulate the practical aspect of strengthening as the strengthening is done while the slab has already deformed under self-weight.

3.2.1. Control Specimen without Opening (S-C)

As seen in Figure 11, the specimen S-C reached a peak load of 60 kN and a maximum deflection of about 43 mm. The slab progressively failed in flexure upon reaching the capacity of 60 kN; then, the load dropped to about 54 kN and then suddenly to about 40 kN due to failure of the middle rib. Subsequently, the load dropped to about 20 kN owing to the failure of one of the edge ribs, and ultimately, the slab lost its full flexural resistance because of the failure of the second edge rib.

3.2.2. Control Specimen with Flexure Opening (S-FO-C)

As seen in Figure 11, the specimen S-FO-C reached a peak load of 37 kN and a maximum deflection of about 41 mm. It is clear that the maximum load of this slab was about two-thirds of the control slab without opening (S-C) owing to the cutting of the middle rib in the peak-moment region, and hence, the flexural capacity of the specimen was for two ribs only. Upon reaching the flexural capacity of 37 kN, the load dropped to 32 kN and then suddenly to about 17 kN (almost half the flexural capacity) due to the failure of one edge rib. Subsequently, the load continued to drop due to the failure of the second edge rib.

3.2.3. CFRP-Strengthened Specimen (S-FO-S1)

As illustrated in Figure 11, the CFRP strengthening scheme for specimen S-FO-S1 had a major impact on the peak load enhancement, as the ultimate load was about 64 kN with enhancement of about 74% with respect to the reference specimen with an opening (S-FO-C). Also, the strengthening scheme fully restored the peak load of the specimen. Upon reaching the peak load of 64 kN, the load suddenly decreased to about 50 kN owing to the failure of the right rib, which occurred because of the rupture of CFRP laminates. Subsequently, the load slightly increased due to the redistribution of load to the left rib until it reached about 57 kN at a mid-span deflection of 45 mm. After that, the load suddenly dropped due to the failure of the left rib owing to IFSC debonding, as identified earlier.

3.2.4. GFRP-Strengthened Specimen (S-FO-S2)

Figure 11 depicts that the GFRP strengthening scheme for specimen S-FO-S2 was almost identical to that of the CFRP-upgraded slab (S-FO-S1) in terms of load–deflection characteristics. The GFRP strengthening scheme had a substantial impact on the flexural capacity enhancement, as the ultimate load was about 60 kN with an enhancement of about 64% with respect to the reference specimen with an opening (S-FO-C). Also, the strengthening scheme fully restored the ultimate load of the specimen. Upon reaching the peak load of 60 kN, the load suddenly decreased to about 49 kN owing to the failure of the left rib, which occurred because of the rupture of GFRP laminates. Subsequently, the load slightly increased due to the redistribution of load to the right rib until it reached about 51 kN at a mid-span deflection of 36 mm. Then, the load suddenly decreased to about 39 kN due to failure of the right rib owing to rupture of the bottom GFRP laminates. Subsequently, the load continued to drop owing to the fracture of the bottom rebars in the left rib, at which the specimen lost its full flexural resistance.

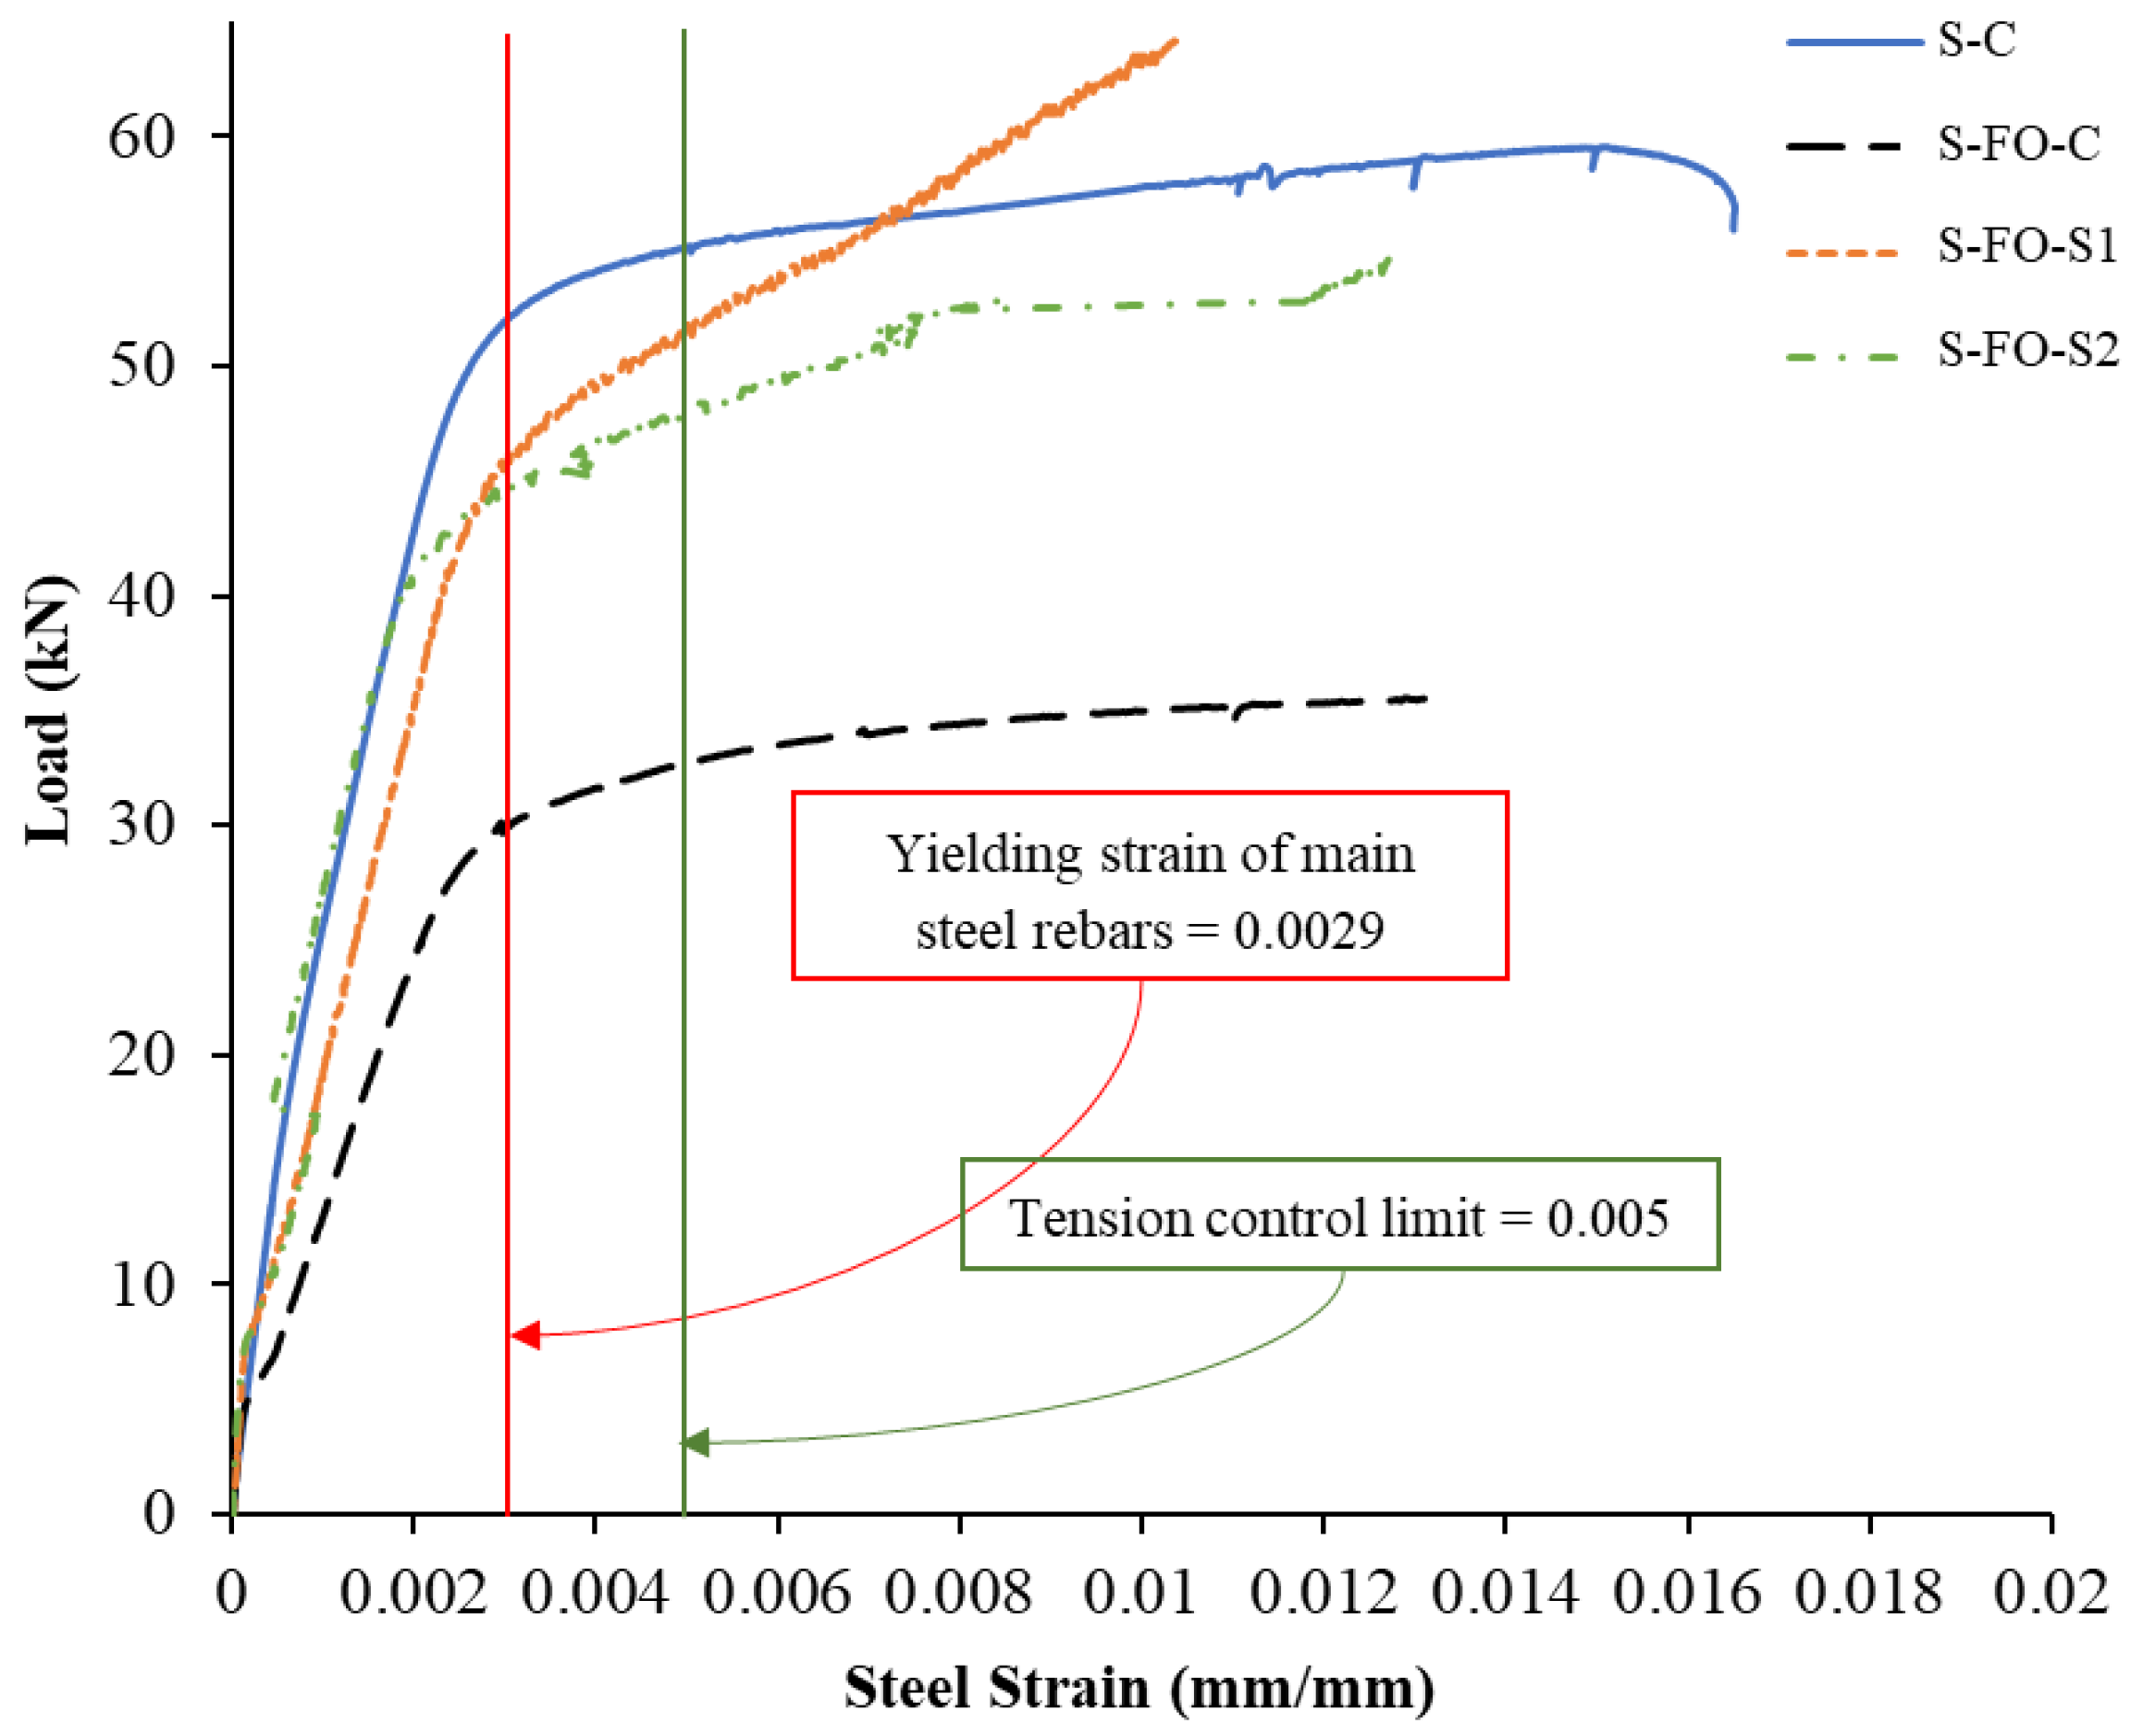
3.3. Relationships of Load versus Strain

This section investigates the load versus strain response in longitudinal tension steel rebars and FRP sheets for the tested specimens. Figure 12 shows load versus strain curves in bottom tension rebars at mid-span for all slabs. Also, Table 4 lists strains in bottom steel rebars at peak load as well as peak strains in steel rebars at mid-span of all specimens. Similarly to Figure 11, the load versus steel strain plots presented in Figure 12 displayed the typical trilinear response of tension-controlled RC members (uncracked stage, post-cracking pre-yield stage, and post-yield phase up to failure). It is noted that all specimens satisfied the tension control limit of the ACI 318-19 code [38], as the peak recorded steel strains significantly exceeded 0.005. It should be mentioned that even though bottom steel rebars fractured in all tested specimens, this was not reflected in Table 4 and Figure 12, as the peak steel strains in all specimens were considerably less than the fracture limit of 0.022. This could be attributed to the damage of the strain gauges at high strain levels. However, this does not affect the interpretation of test results.
Load versus strain curves in FRP laminates at mid-span for the strengthened specimens S-FO-S1 and S-FO-S2 are illustrated in Figure 13. It was identified from Figure 13 that the FRP contribution was almost null in the initial uncracked stage. Upon concrete cracking, the FRP contribution became pronounced, and the measured FRP strains in the two upgraded slabs increased until they reached a value of about 0.004 at a load close to the yielding load. Subsequent to steel yielding, the FRP contribution became more significant, and the FRP tensile strains considerably increased until higher values, as seen in Figure 13. Table 4 lists peak strains in FRP sheets at mid-span of strengthened specimens S-FO-S1 and S-FO-S2. It should be noted that even though rupture occurred in FRP sheets in the two strengthened specimens, this was not reflected in Table 4 and Figure 13, as the peak FRP strains in the two specimens were considerably less than the corresponding rupture limit, especially for the CFRP-strengthened specimen S-FO-S1. The reason is that the failure location occurred away from the strain gauge location. However, for GFRP-strengthened slab S-FO-S2, the failure of GFRP sheets occurred near the location of the strain gauge, which recorded a strain of 86% of the rupture limit, as seen in Table 4.

3.4. Comparison of Experimental Results

A comparison of experimental results of test specimens is discussed in this section. The behavior of the studied upgrading schemes was compared with reference to ultimate load, secant stiffness, dissipated energy, and deflection ductility. The effects of strengthening schemes on the percent increase in ultimate load, post-cracking secant stiffness, and dissipated energy (with respect to the unstrengthened specimen with an opening S-FO-C) are illustrated in Figure 14.
Figure 14a shows that strengthening of slabs using CFRP sheets in specimen S-FO-S1 and GFRP sheets in specimen S-FO-S2 improved their load-carrying capacity by 74% and 64%, respectively, in comparison with the control specimen with an opening (S-FO-C). Furthermore, the capacity was not only fully restored. but it was also slightly improved by 8% and 2%, respectively, compared to the control slab without opening (S-C).
Because of the opening in slab S-FO-C, its secant stiffness decreased by 40%, as seen in Table 3. Strengthening schemes in slabs S-FO-S1 and S-FO-S2 exhibited enhancements in stiffness by 35% and 48%, respectively, in comparison with the unstrengthened slab with an opening (S-FO-C). However, the stiffness was not restored with respect to the control slab without an opening (S-C), and it was decreased by 19% and 11%, respectively, as illustrated in Figure 14b and Table 3.
Owing to the flexure opening in specimen S-FO-C, its dissipated energy decreased by about 42%, as seen in Table 3. Strengthening schemes in specimens S-FO-S1 and S-FO-S2 revealed an increase in the dissipated energy by 19% and 18%, respectively, compared with the unstrengthened specimen with an opening (S-FO-C). Nevertheless, the dissipated energy was not fully restored in comparison with the control slab without opening (S-C), and it was decreased by 31% and 32%, respectively, as presented in Figure 14c and Table 3.
Figure 15 shows a comparison between all tested specimens for deflection ductility. The deflection ductility was not influenced by the existence of the flexure opening in slab S-FO-C compared to the slab without opening (S-C). However, compared with the control slabs S-C and S-FO-C, strengthening schemes reduced the deflection ductility by 29% and 21% for specimens S-FO-S1 and S-FO-S2, respectively, as shown in Figure 15 and Table 3.

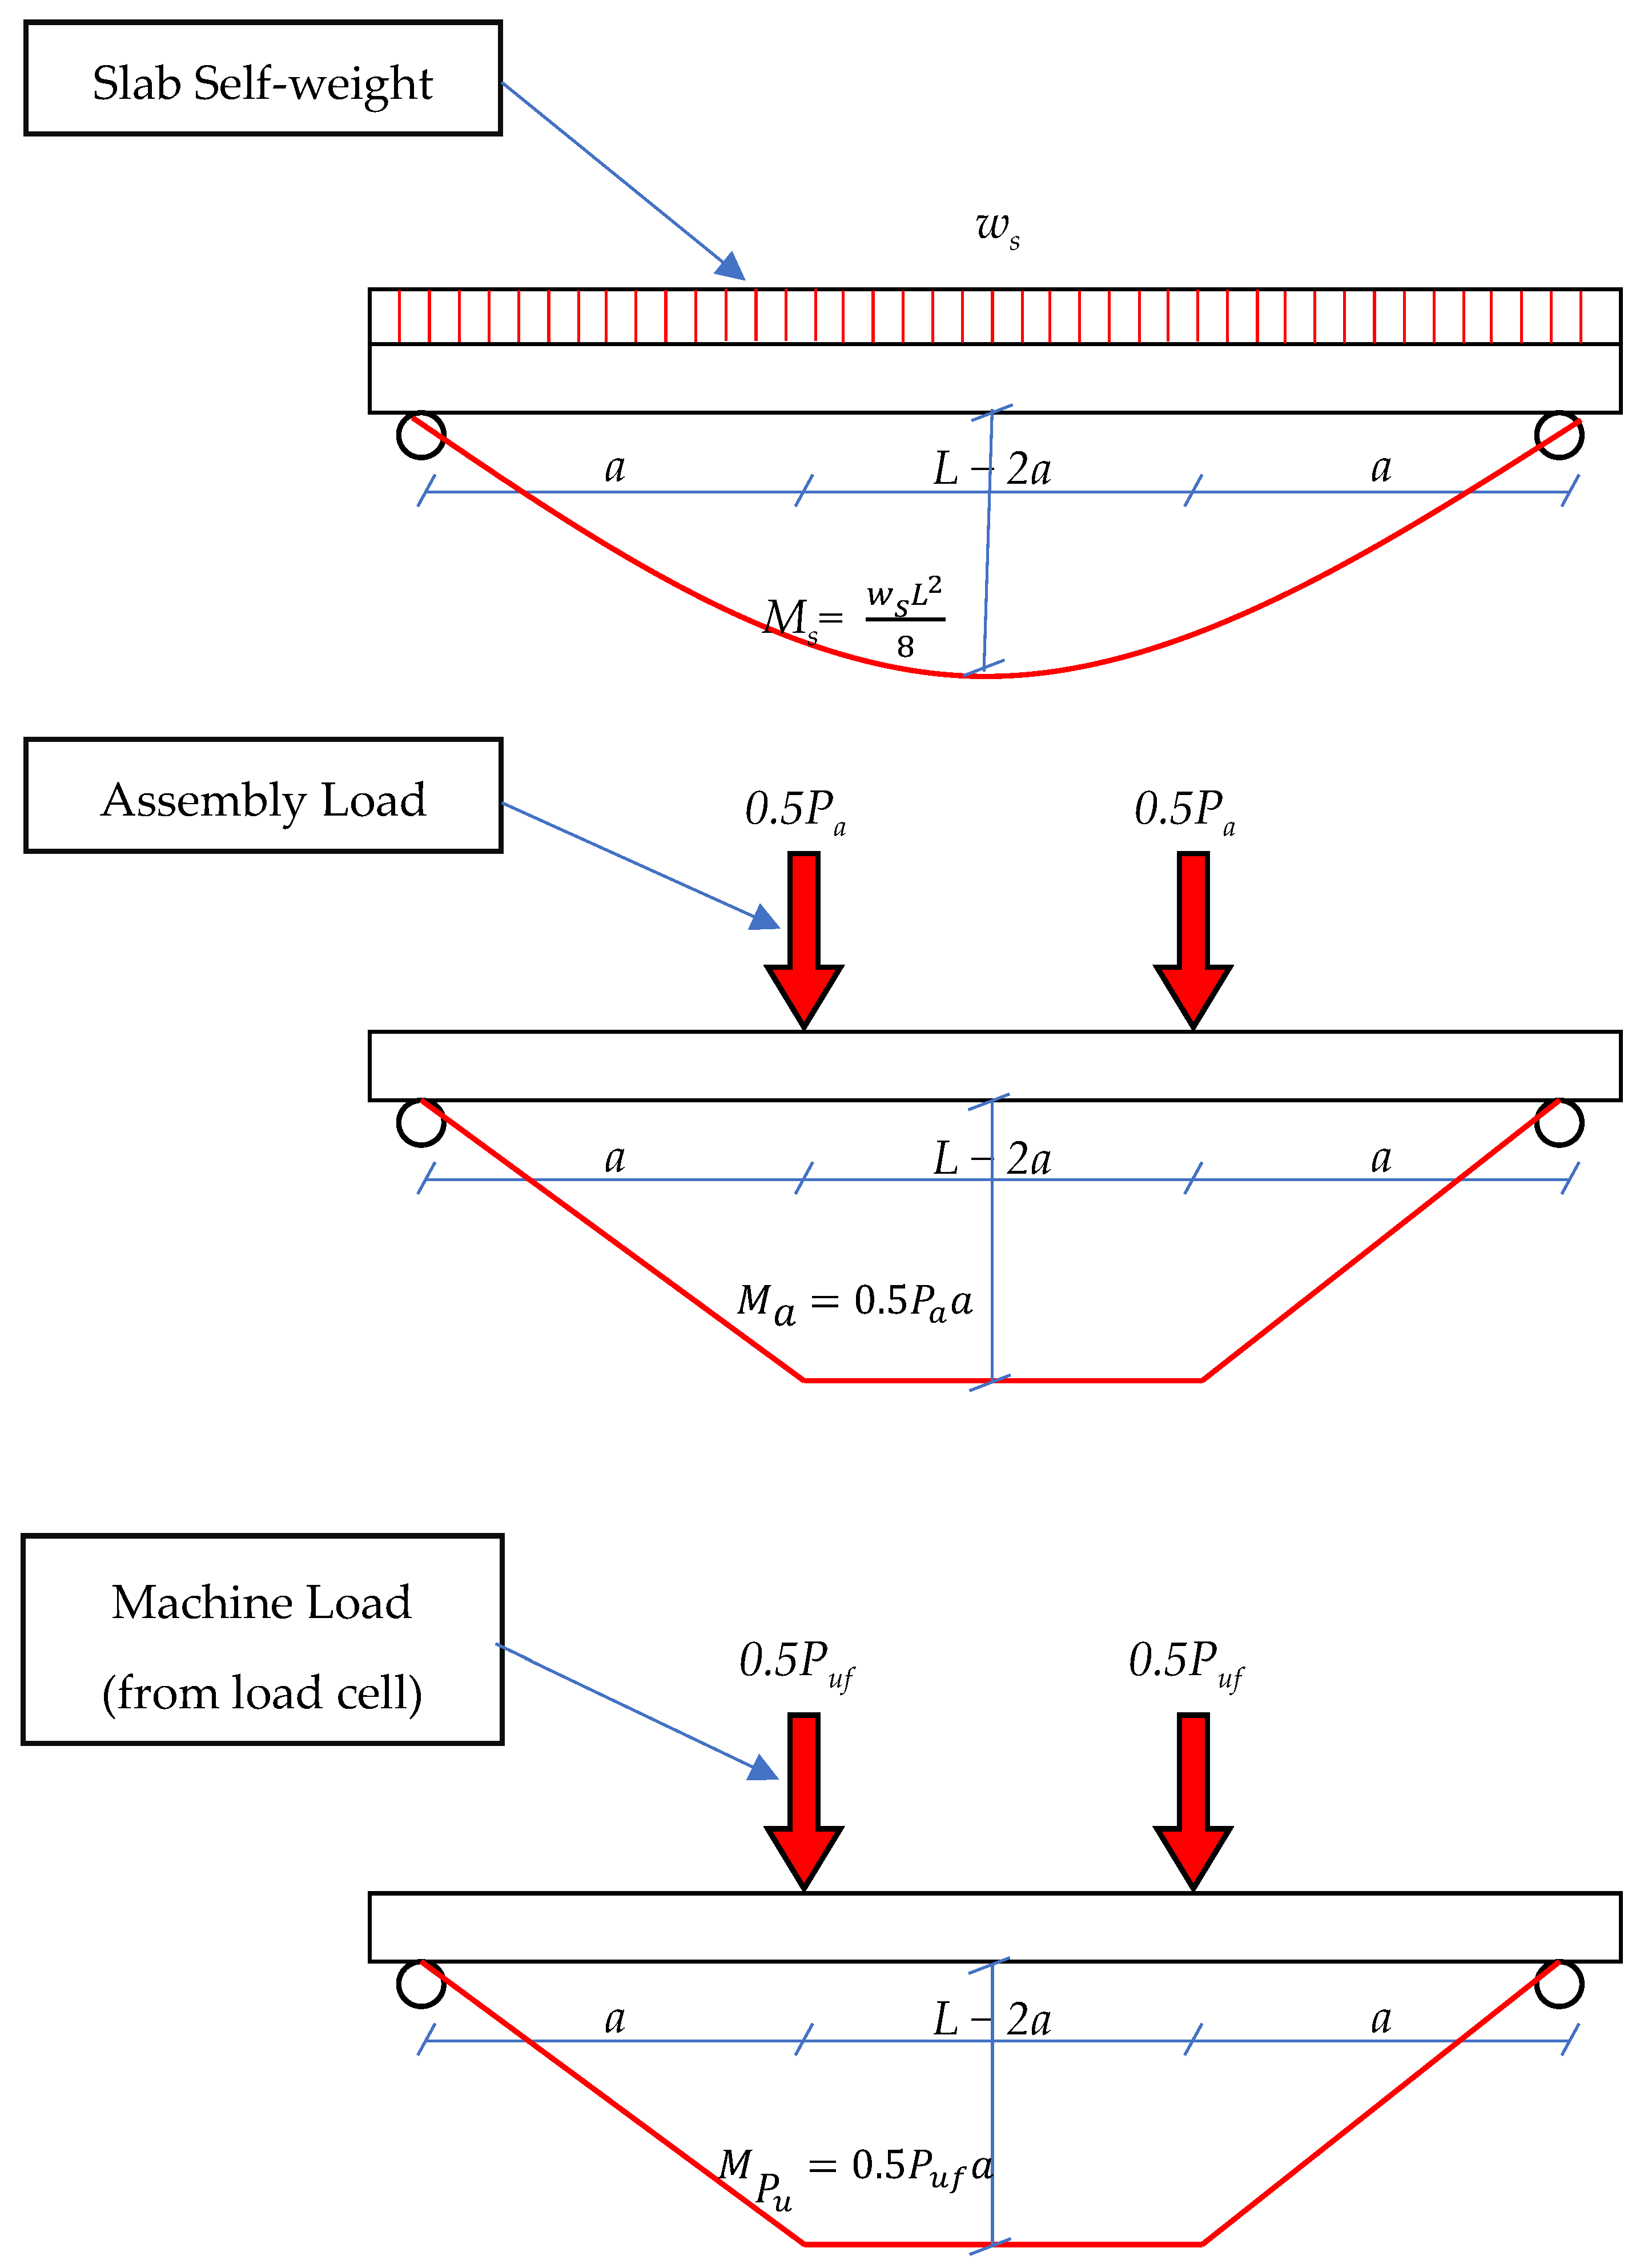
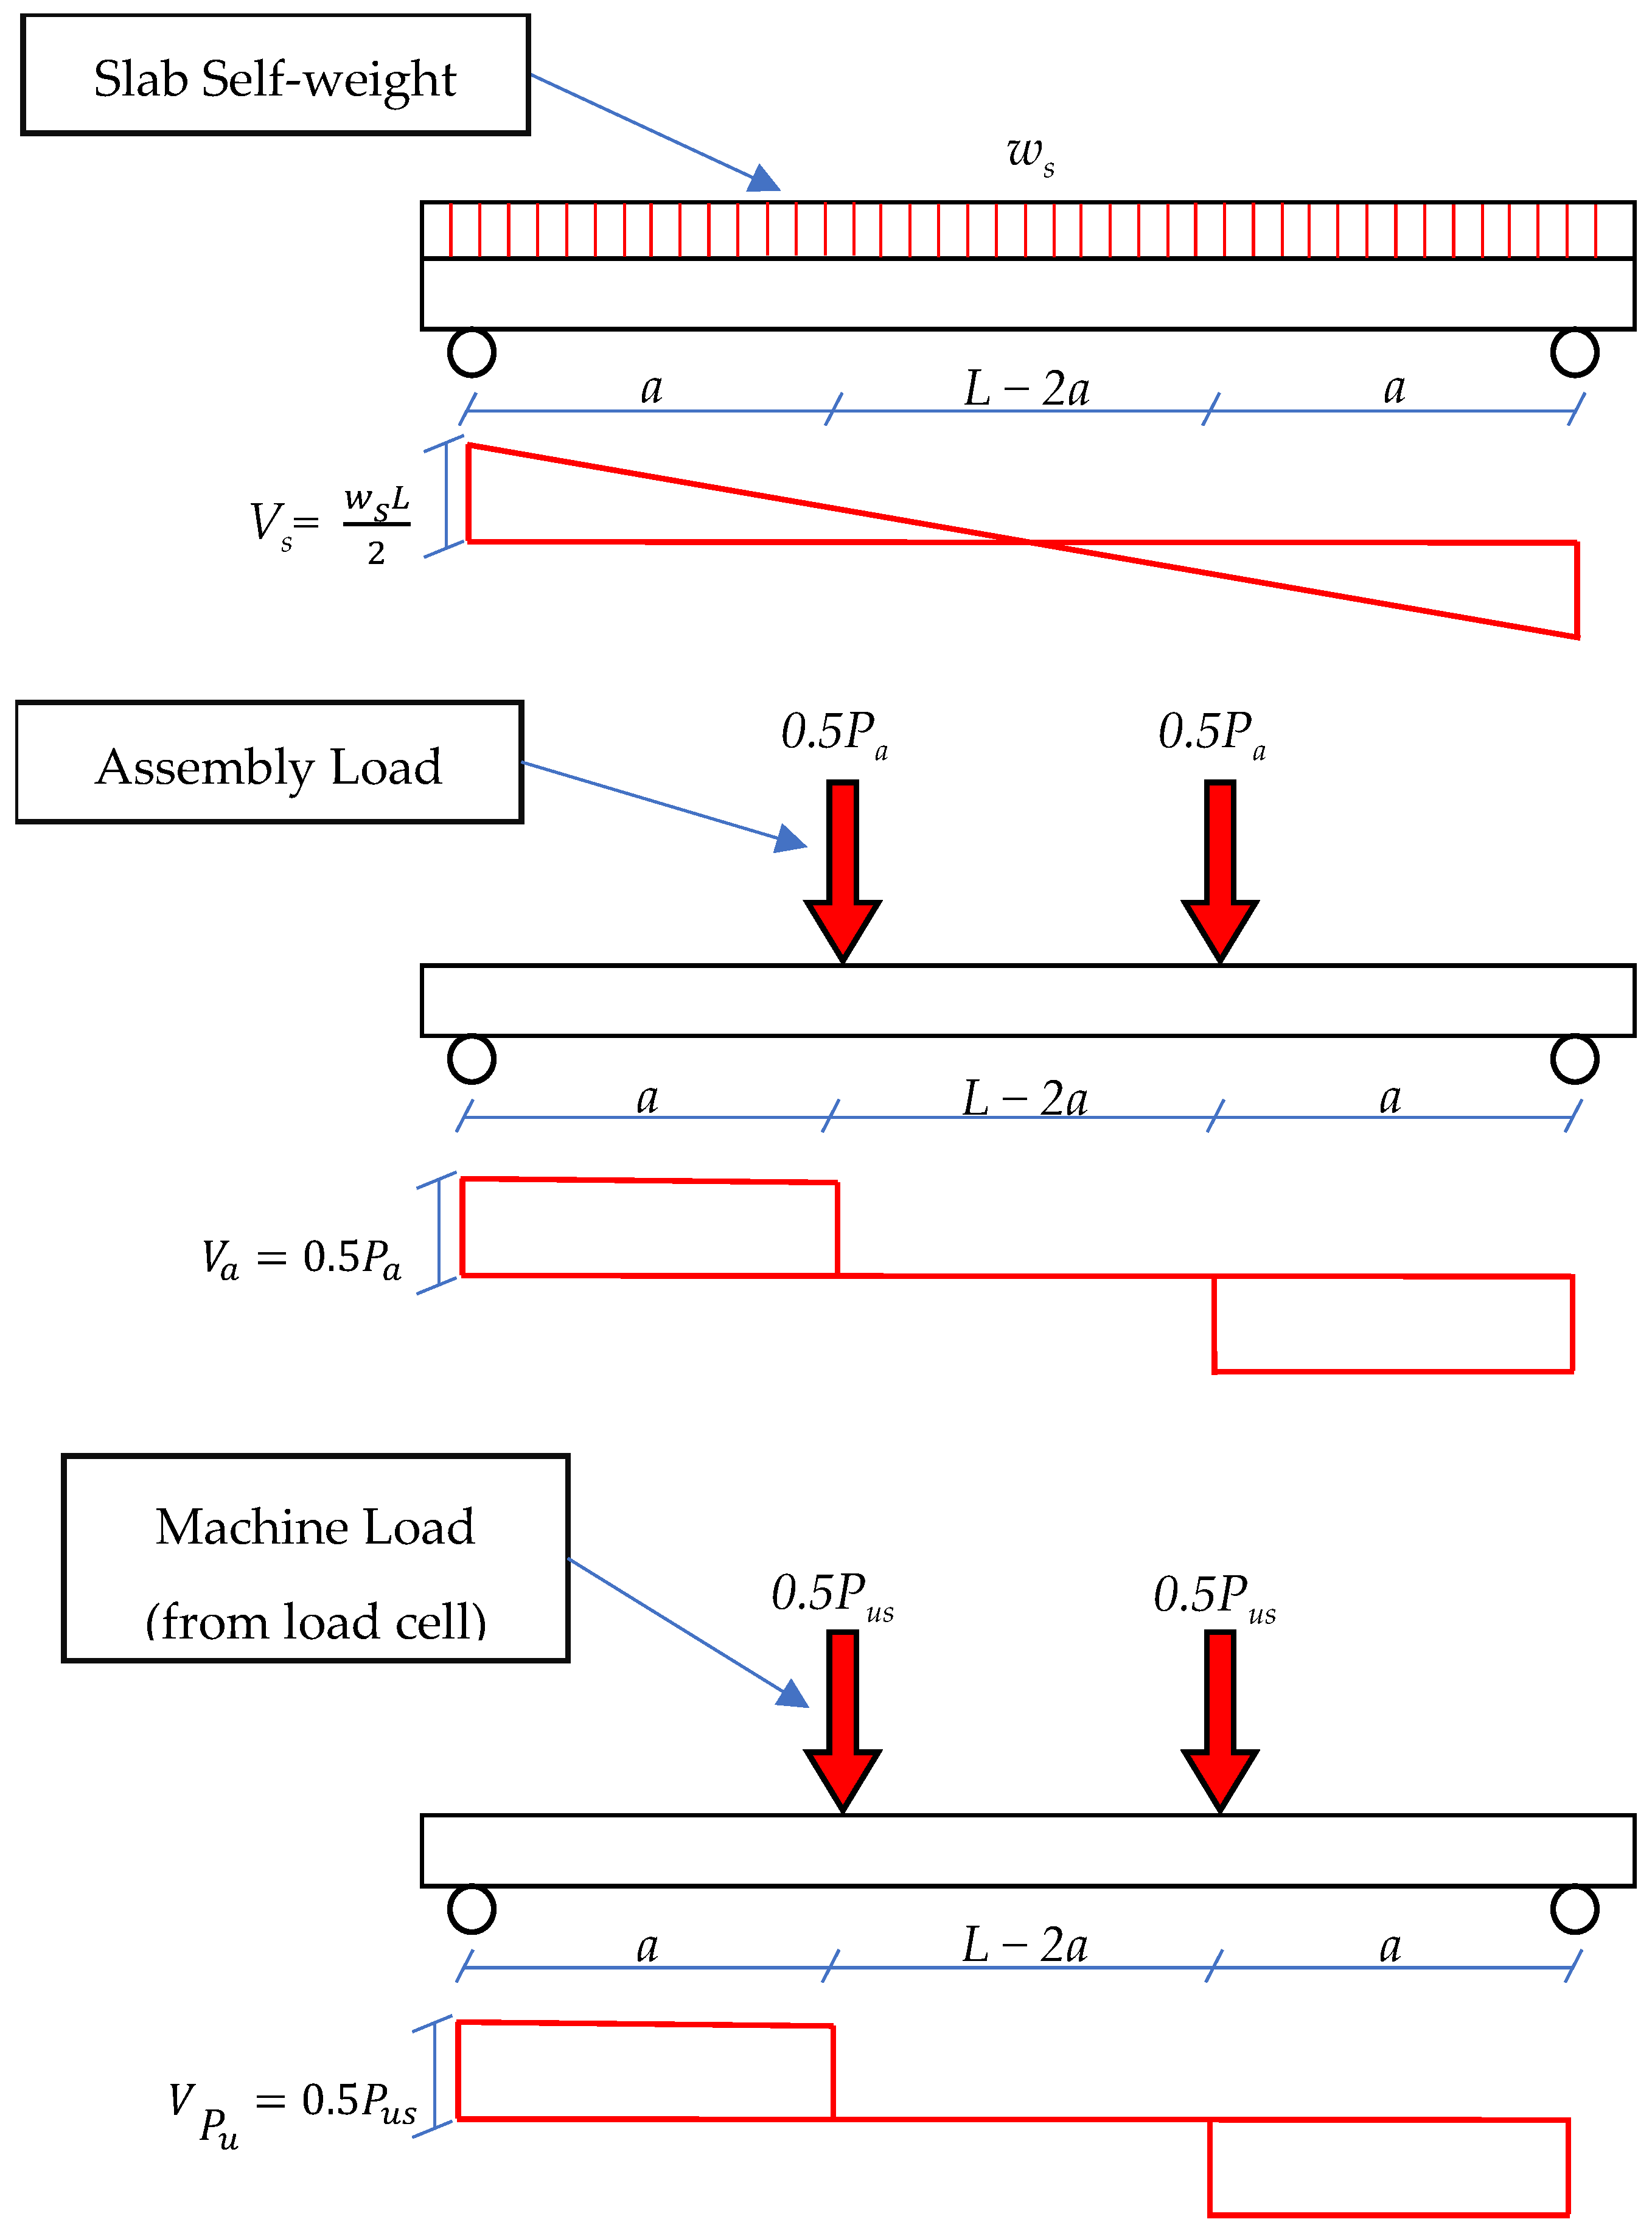
4. Analytical Modeling

In the current research, the flexural and shear strengths of unstrengthened specimens (S-C and S-FO-C) were estimated using the ACI 318-19 code [38], whereas for FRP-upgraded specimens with flexure opening (S-FO-S1 and S-FO-S2), the ultimate flexural and shear capacities were calculated using the ACI 440.2R-17 guidelines [31].

4.1. Control Specimen without Opening (S-C)

For the control specimen without openings (S-C), the whole slab was treated as an equivalent T-section in bending, with the effective flange width b e taken as 825 mm, as seen in Figure 16a,b. The calculation steps are detailed below.

4.1.1. Calculation of Flexural Capacity

Assuming that all tension steel has yielded and the neutral axis is in the flange, the depth of the neutral axis c was assessed from
c = A s t f y 0.85 β 1 f c b e h f
where A s t = area of tension reinforcement (in mm2), f y = yield strength of tension steel rebars (in MPa), f c = specified concrete compressive strength (in MPa), β 1 = Whitney block parameter [38], and h f = thickness of flange (= 50 mm). The tension-control limit was then checked by computing the strain in the centroid of the tension steel εs from the following equation.
ε s = 0.003 d c c 0.005
where d = effective depth of tension steel (in mm). The ultimate moment capacity of the section M u was finally computed from
M u = T d β 1 c 2
The maximum moment in the slab section is the summation of three components: (1) the contribution of the slab self-weight; (2) the moment resulting from the weight of the steel assembly; and (3) the moment induced by the machine. The bending moment diagrams of the three components are depicted in Figure 17. At the critical section, the flexural capacity calculated from Equation (3) is expressed as
M u = w s L 2 8 + 0.5 P a a + 0.5 P u f a
where w s = self-weight of the slab (in kN/m); L = slab span (in m); a = shear span (in m); and P a = weight of the steel assembly (in kN). Then, considering flexure failure, the predicted ultimate load for the specimen (machine load) can be estimated from
P u f = 2 M u 0.25 w s L 2 P a a a

4.1.2. Calculation of Shear Capacity

Using the ACI code [38], the shear capacity of the control specimen without openings (S-C) is calculated from
V u = V c + V s = 1.1 f c 6 b d + A v f y t d s
where V u = ultimate shear resistance of the section, V c = shear resisted by concrete, V s = shear resisted by stirrups, b = total width of the ribs (in mm), f y t = yield strength of shear reinforcement (in MPa), A v = area of stirrups (in mm2), and s = spacing of stirrups (in mm).
For the tested specimens, the shear strength is the summation of three components: (1) the contribution of the slab self-weight; (2) the shear force resulting from the weight of the steel assembly; and (3) the shear force induced by the machine. The shear force diagrams of the three components are depicted in Figure 18.
At the critical section, the shear strength calculated from Equation (6) is expressed as
V u = 0.5 w s L + 0.5 P a + 0.5 P u s
V u = w s L + P a + P u s 2
Then, considering shear failure, the predicted ultimate load for the specimen (machine load) is estimated from
P u s = 2 V u w s L P a
It should be mentioned that the maximum load of specimen S-C is the least of that given by Equations (5) and (9).

4.2. Control Specimen with Flexure Opening (S-FO-C)

The control specimen with flexure opening consisted of two full ribs and a discontinuous third rib. The third rib (middle rib) had a single opening in the peak-moment region. In the analysis, the discontinuous rib was neglected, and the two continuous edge ribs were assumed to carry the load. The whole slab was treated as an equivalent T-section in bending, with the effective flange width be taken as 425 mm, as illustrated in Figure 16c,d. The ultimate load of the specimens was computed using the same approach detailed in Equations (1)–(9).

4.3. FRP-Strengthened Specimens S-FO-S1 and S-FO-S2

4.3.1. Calculation of Flexural Capacity

For FRP-upgraded specimens with flexure opening (S-FO-S1 and S-FO-S2), only one critical section at the mid-span was considered for computing the ultimate flexural capacity, which was calculated as per the ACI 440 guidelines [31]. Similarly to the control slab with flexure opening, the middle rib was ignored in the calculations, and each of the FRP-upgraded specimens was treated as an equivalent T-section in bending, with the effective flange width be taken as 425 mm, as seen in Figure 19. Steps for calculation of the flexural capacity are detailed below.
Assuming that the failure of the FRP laminates preceded the concrete crushing, the initial step in the calculation procedure is to compute the debonding strain of the FRP laminates ε f d from
ε f d = 0.41 f c n E f t f 0.9 ε f u
where n = number of FRP layers, t f = thickness of single FRP layer (in mm), E f = elastic modulus for FRP material (in MPa), and ε f d = strain at rupture of FRP material. The depth of the neutral axis c was firstly assumed = 0.2d, and it was revised after the achievement of force equilibrium in the section. The concrete strain at the top compression fiber was then estimated from
ε c = ε f d c d f c 0.003
where d f = effective depth of FRP flexural reinforcement ≈h. The strain at the centroid of tension steel was, therefore, computed from
ε s = ε f d d c d f c
Forces in steel ( F s ) and FRP sheets ( F f ) were then calculated from
F s = A s t E s ε s A s t f y
F f = A f E f ε f d
where E s = Young’s modulus of steel rebars (in MPa) and A f = area of FRP material (in mm2). The depth of the neutral axis was then recalculated from the following equation.
c = F s + F f α 1 β 1 b e f c
where α 1 and β 1 are stress block factors given by
β 1 = 4 ε c ε c 6 ε c 2 ε c
α 1 = 3 ε c ε c ε c 2 3 β 1 ε c 2
where ε c is the concrete strain at peak stress f c computed from
ε c = 1.7 f c 4700 f c
Using the revised c value, Equations (11)–(15) were repeated until the two successive c values were very close (reach of convergence). Then, the ultimate moment capacity M u of the FRP-strengthened section was computed from
M u = F s d β 1 c 2 + F f d f β 1 c 2
The maximum load of the slabs was computed using Equation (5).

4.3.2. Calculation of Shear Capacity

For the CFRP-upgraded specimen with flexure opening, S-FO-S1, the shear capacity was estimated using the ACI 318-19 code [38]. The CFRP U-wrap anchorage was excluded from the shear calculations because the U-wrap distance was less than the shear span of the specimen. Figure 16d shows the equivalent T-section in shear for specimen S-FO-S1. The peak load of the specimen resulting from shear strength was computed using the same approach detailed in Equations (6)–(9).
For the GFRP-upgraded specimen with flexure opening, S-FO-S2, the shear strength was computed using the ACI 440 [31]. The GFRP U-wrap anchorage was included in the shear capacity calculations for this specimen, since the U-wrap distance was equal to the shear span. Figure 20 shows the equivalent T-section in shear for specimen S-FO-S2. The steps for calculation of the shear strength provided by GFRP U-wrap layers are detailed below.
As per Ref. [31], the shear capacity of the strengthened section was computed from
V u = V c + V s + V f
where V f = shear resisted by FRP U-wrap, which was estimated from
V f = A f v f f e d f v
where A f v = cross-sectional area of FRP U-wrap layers (in mm2); d f v = effective FRP depth (in mm); and f f e = effective stress in the FRP U-wrap layers (in MPa), given by
f f e = κ v E f ε f u 0.004 E f ε f u
where k v = bond-reduction factor estimated from
κ v = k 1 k 2 L e 11 , 900 ε f u 0.75
where k 1 and k 2 = modification factors and L e = effective FRP bond length (in mm). These parameters were computed from
k 1 = f c 27 2 / 3
k 2 = d f v L e d f v
L e = 23,300 ( n t f E f ) 0.58

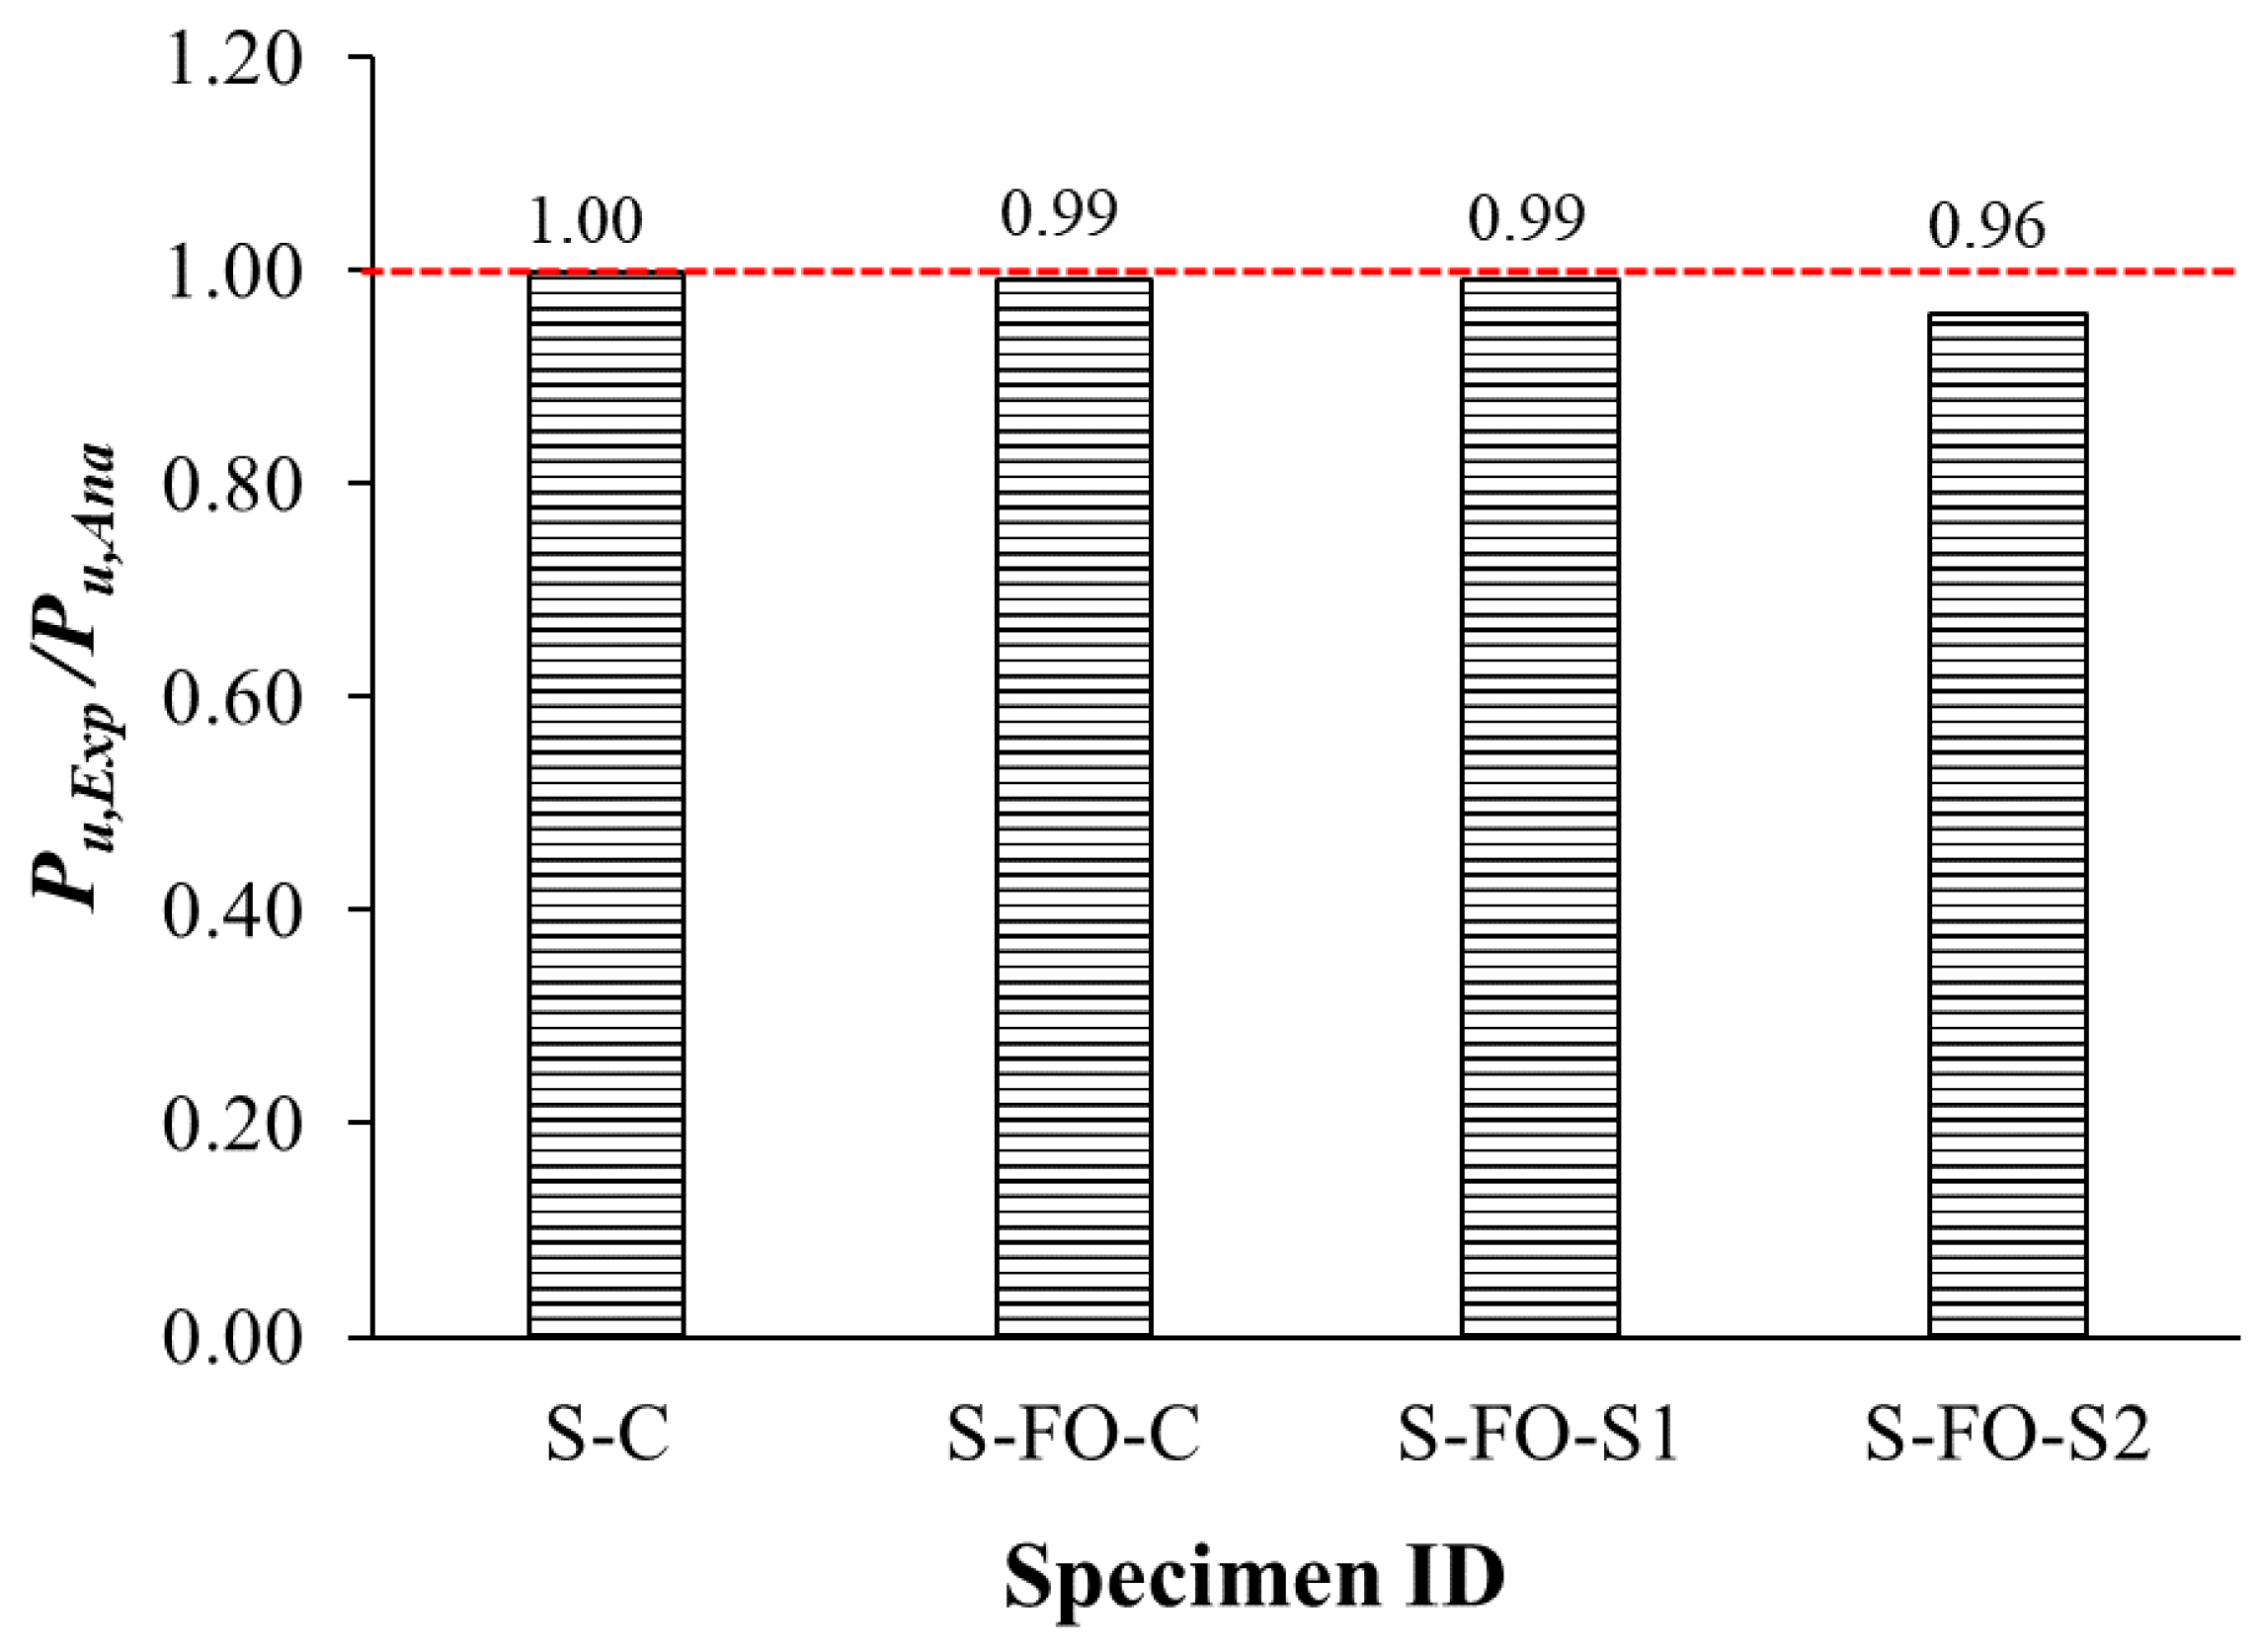
4.4. Experimental versus Analytical Peak Loads

Table 5 and Figure 21 give detailed comparisons between the peak loads from the experiments and the proposed analytical procedure. Table 5 shows that the ultimate load of all specimens was the least of the two loads calculated from flexure (Puf) and shear (Pus) failure. It should be stated that the analytical models predicted the peak load of the specimens very well, with prediction errors up to 4%.

5. Conclusions

This study investigated experimentally the efficacy of using different schemes of externally bonded FRP laminates for the ultimate load restoration of RC one-way ribbed slabs with flexure openings. The experimental matrix comprised four half-scale one-way ribbed slabs (having three ribs) divided into one unstrengthened specimen without openings to act as a reference, one unstrengthened specimen with a single opening in the peak-moment region, and two FRP-strengthened slabs each having a single opening in the maximum-moment zone. Furthermore, an analytical procedure was carried out for quick assessment of the peak load for both unstrengthened and strengthened one-way ribbed slabs with and without flexure openings. The main outcomes of this research are:
  • Both control specimen without opening and control slab with flexure opening were found to have common failure modes, which are flexure failure by fracture of steel rebars followed by crushing of concrete on the compression zone. The failure of both strengthened specimens was due to rupture in the FRP sheets combined with concrete cover delamination, and it was followed by fracture of bottom tension rebars of ribs and then crushing of concrete on the compression zone.
  • The presence of a single opening in the peak-moment region (flexure opening) reduced the slab capacity by about 38% compared with the specimen without an opening. This is attributed to the cutting of the middle rib in the peak-moment region, and hence, the flexural capacity of the specimen was for two ribs only.
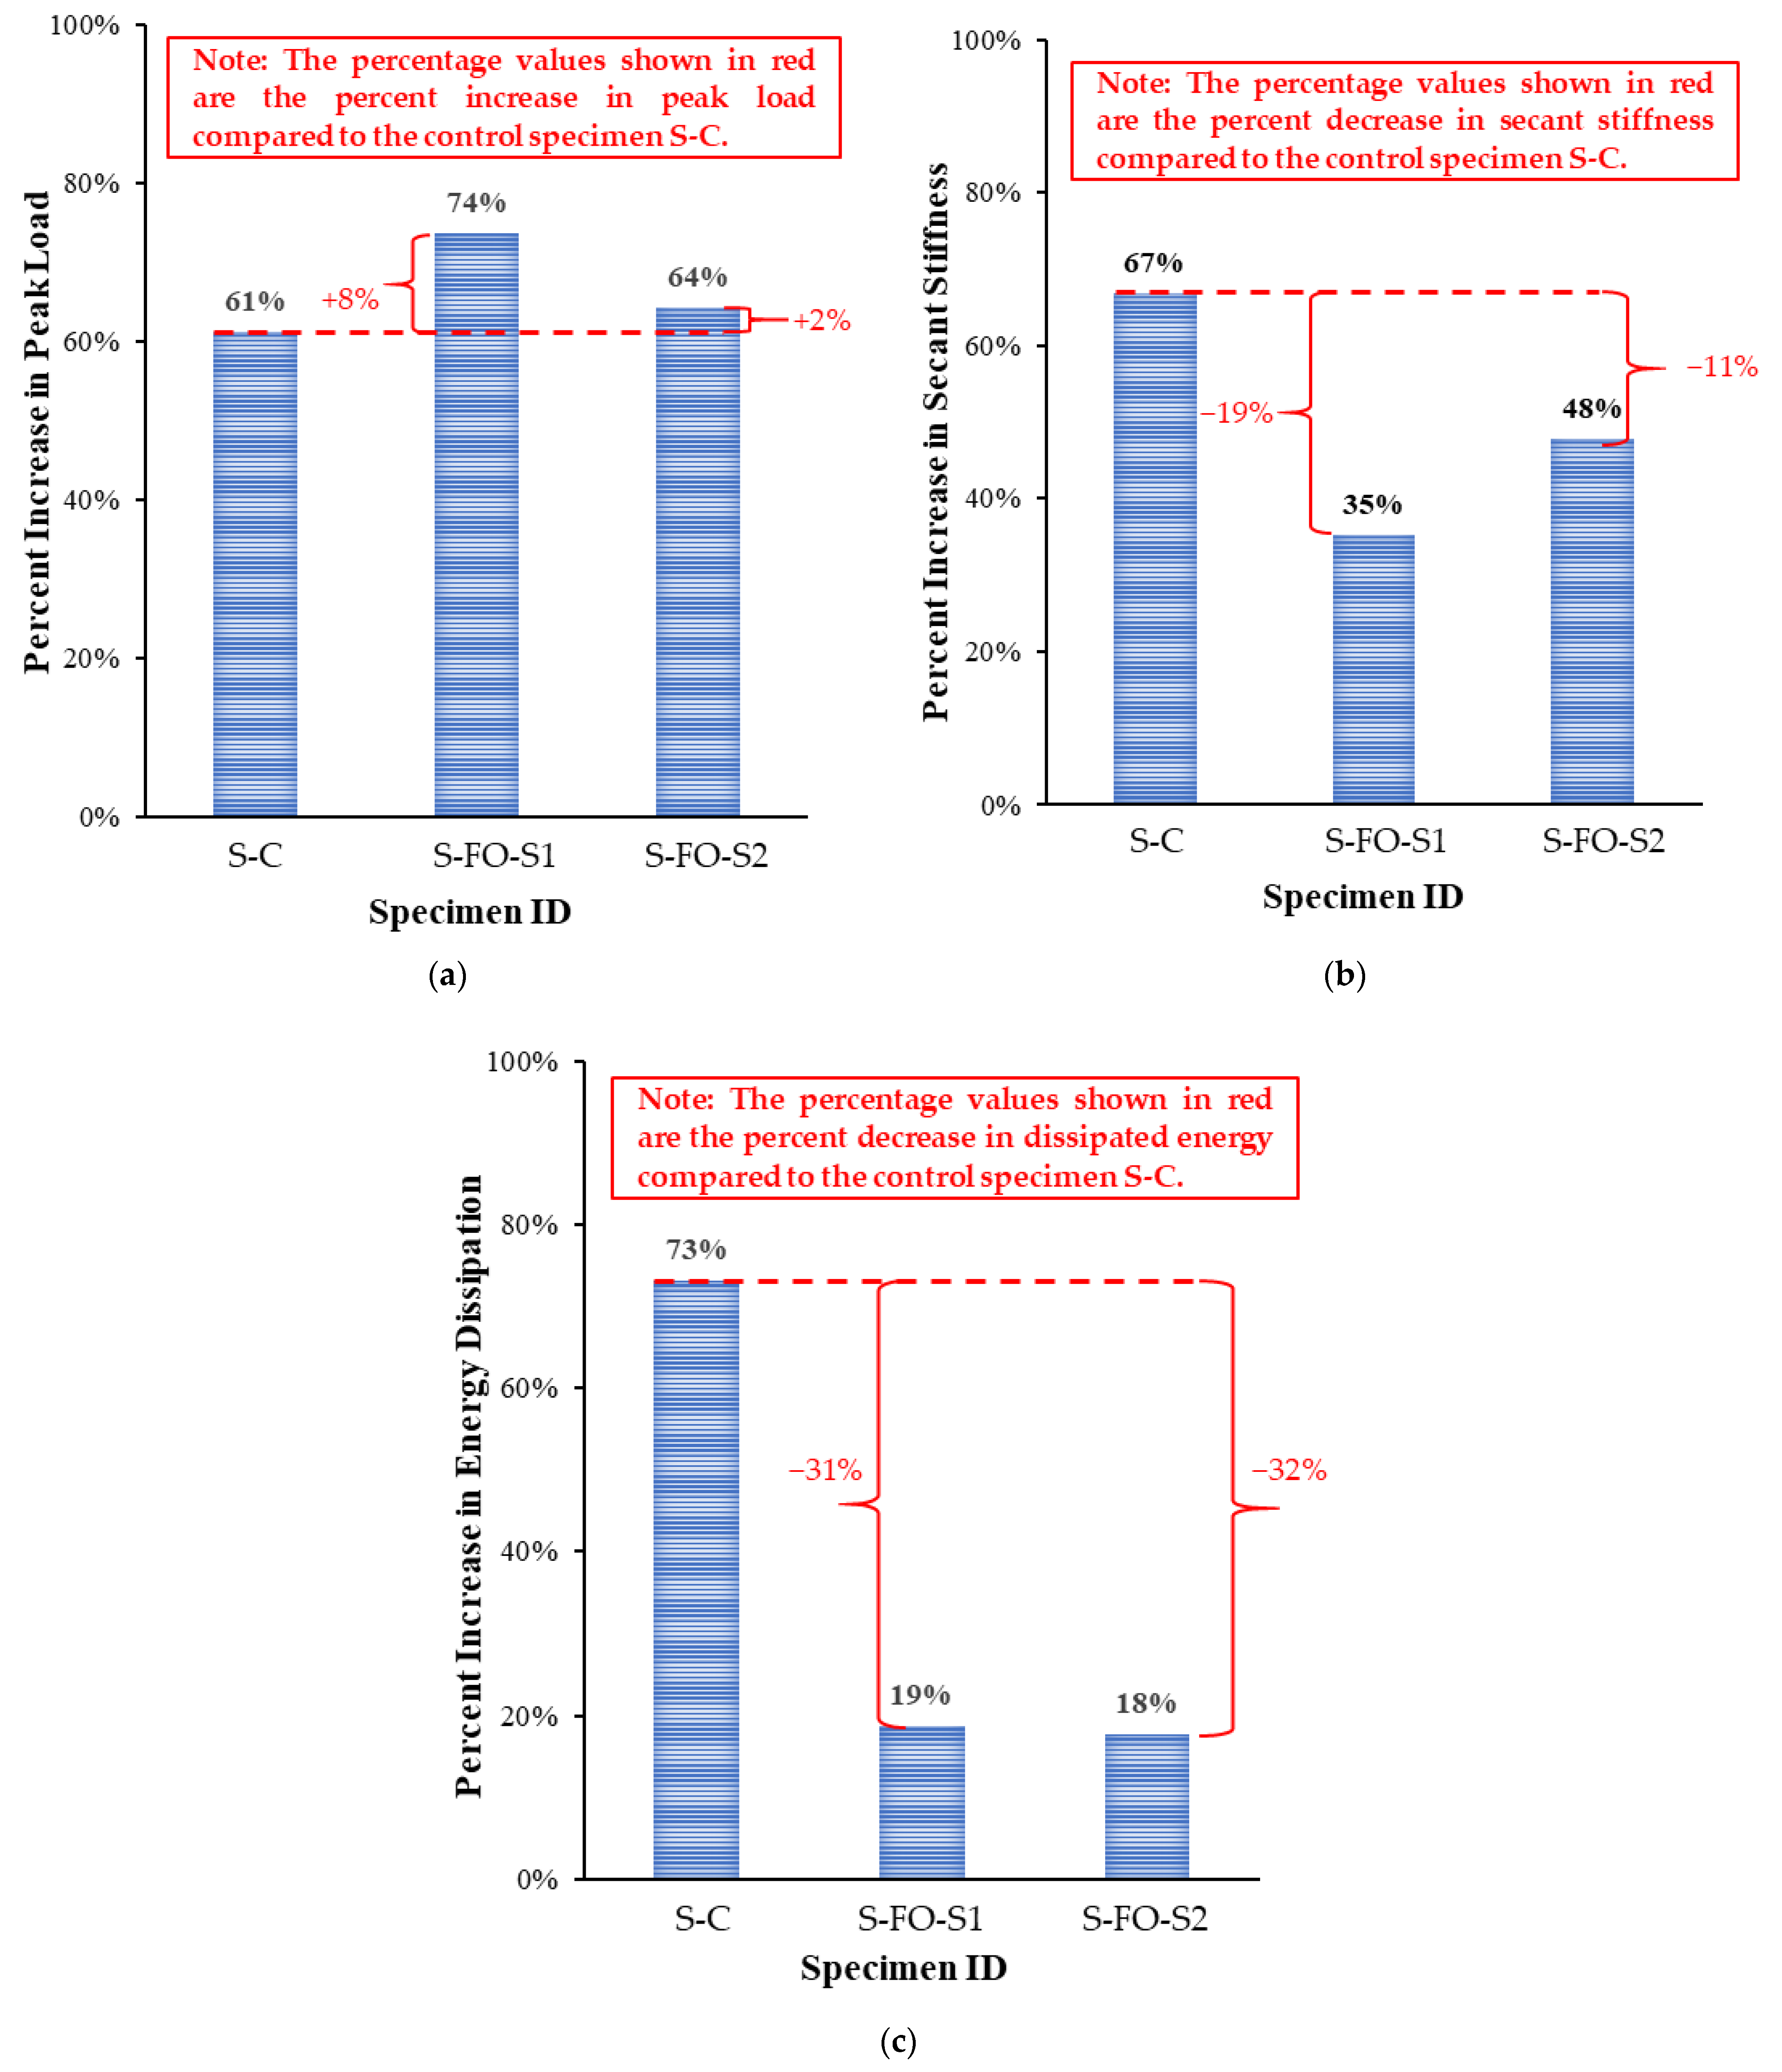
  • Strengthening of slabs using CFRP and GFRP composite sheets not only fully restored the load-carrying capacity but also slightly enhanced the load-carrying capacity by 8% and 2%, respectively, compared to the control slab without opening.
  • Strengthening schemes S1 and S2 revealed an enhancement in stiffness by 35% and 48%, respectively, in comparison with the unstrengthened slab with an opening. However, the stiffness was not restored with respect to the control slab without opening, and it decreased by 19% and 11%, respectively. Also, strengthening schemes S1 and S2 revealed an increase in the energy dissipated in slab failure by 19% and 18%, respectively, compared with the unstrengthened specimen with an opening. Nevertheless, the dissipated energy was not fully restored in comparison with the control slab without opening, and it decreased by 31% and 32%, respectively.
  • Simplified analytical models were suggested in this research for computing the ultimate load of both unstrengthened and strengthened slabs. The models considered all possible flexural and shear failure modes at the critical sections. The analytical procedure predicted the ultimate load of the specimens very well, with prediction errors not exceeding 4%.
  • Although the adopted strengthening schemes were efficient enough to restore the load-carrying capacity of ribbed slab having flexure opening located in the maximum-moment region, there is a need to assess the effectiveness of these schemes when the openings are cut in the shear zone.

Author Contributions

Methodology, validation, writing—original draft, A.A.K.; Conceptualization, methodology, validation, writing—original draft, H.E.; Investigation, writing—review and editing, H.A.; Writing—review and editing, T.A.; Conceptualization, methodology, writing—review and editing, funding acquisition, supervision, Y.A.-S. All authors have read and agreed to the published version of the manuscript.

Funding

The authors extend their appreciation to the Deputyship for Research & Innovation, Ministry of Education in Saudi Arabia for funding this research (IFKSURC-1-2201).

Data Availability Statement

Not applicable.

Acknowledgments

The authors extend their appreciation to the Deputyship for Research & Innovation, Ministry of Education in Saudi Arabia for funding this research (IFKSURC-1-2201).

Conflicts of Interest

The authors declare no conflict of interest.

References

  1. Hadjazi, K.; Sereir, Z.; Amziane, S. Creep response of intermediate flexural cracking behavior of reinforced concrete beam strengthened with an externally bonded FRP plate. Int. J. Solids Struct. 2016, 94, 196–205. [Google Scholar] [CrossRef]
  2. Barris, C.; Sala, P.; Gómez, J.; Torres, L. Flexural behaviour of FRP reinforced concrete beams strengthened with NSM CFRP strips. Compos. Struct. 2020, 241, 112059. [Google Scholar] [CrossRef]
  3. Elsanadedy, H.M.; Abbas, H.; Almusallam, T.H.; Al-Salloum, Y.A. Hybrid UHPC/NSM CFRP strips vs. traditional systems for flexural upgrading of RC beams–Experimental and FE study. Compos. Struct. 2020, 261, 113291. [Google Scholar] [CrossRef]
  4. Zhang, F.; Gao, L.; Wu, Y.F.; Liu, J. Flexural design of reinforced concrete structures strengthened with hybrid bonded FRP. Compos. Struct. 2021, 269, 113996. [Google Scholar] [CrossRef]
  5. Askar, M.K.; Hassan, A.F.; Al-Kamaki, Y.S. Flexural and shear strengthening of reinforced concrete beams using FRP composites: A state of the art. Case Stud. Constr. Mater. 2022, 17, e01189. [Google Scholar] [CrossRef]
  6. Hadi, S. Full-scale experimental evaluation of flexural strength and ductility of reinforced concrete beams strengthened with various FRP mechanisms. Structures 2022, 43, 1160–1176. [Google Scholar] [CrossRef]
  7. Al-Salloum, Y.A.; Siddiqui, N.A.; Elsanadedy, H.M.; Abadel, A.A.; Aqel, M.A. Textile reinforced mortar (TRM) versus FRP as strengthening material of seismically deficient RC beam-column joints. ASCE J. Compos. Constr. 2011, 15, 875–1002. [Google Scholar] [CrossRef]
  8. Almusallam, T.; Al-Salloum, Y.; Elsanadedy, H.; Alshenawy, A.; Iqbal, R. Behavior of FRP-Strengthened RC Beams with Large Rectangular Web Openings in Flexure Zones: Experimental and Numerical Study. Int. J. Concr. Struct. Mater. 2018, 12, 47. [Google Scholar] [CrossRef]
  9. Elsanadedy, H.M.; Al-Salloum, Y.A.; Almusallam, T.H.; Alshenawy, A.O.; Abbas, H. Experimental and numerical study on FRP-upgraded RC beams with large rectangular web openings in shear zones. Constr. Build. Mater. 2019, 194, 322–343. [Google Scholar] [CrossRef]
  10. fib bulletin 14. In Externally Bonded FRP Reinforcement for RC Structures; Technical Report prepared by the Working Party EBR of Task Group 9.3; International Federation for Structural Concrete: Lausanne, Switzerland, 2001.
  11. Modrea, A.; Vlase, S.; Calin, M.R.; Peterlicean, A. The influence of dimensional and structural shifts of the elastic constant values in cylinder fiber composites. J. Optoelecton. Adv. Mater. 2013, 15, 278–283. [Google Scholar]
  12. Teodorescu-Draghicescu, H.; Vlase, S.; Scutaru, L.; Serbina, L.; Calin, M.R. Hysteresis effect in a three-phase polymer matrix composite subjected to static cyclic loadings. Optoelectron. Adv. Mater-Rapid Commun. 2011, 5, 273–277. [Google Scholar]
  13. Zhu, Y.; Zhang, Y.; Hussein, H.H.; Chen, G. Flexural strengthening of reinforced concrete beams or slabs using ultra-high performance concrete (UHPC): A state of the art review. Eng. Struct. 2020, 205, 110035. [Google Scholar] [CrossRef]
  14. Baig, Z.I.; Alsayed, S.H.; Abbas, H. Punching of slab–column connections strengthened using external steel shear bolts. Mag. Concr. Res. 2016, 68, 55–68. [Google Scholar] [CrossRef]
  15. Zheng, X.; Wan, B.; Huang, P.; Huang, J. Experimental study of hybrid strengthening technique using carbon fiber laminates and steel plates for reinforced concrete slabs. Constr. Build. Mater. 2019, 210, 324–337. [Google Scholar] [CrossRef]
  16. Kim, H.Y.; You, Y.J.; Ryu, G.S.; Koh, K.T.; Ahn, G.H.; Kang, S.H. Flexural strengthening of concrete slab-type elements with textile reinforced concrete. Materials 2020, 13, 2246. [Google Scholar] [CrossRef] [PubMed]
  17. El-Mandouh, M.A.; Elsamak, G.; Rageh, B.O.; Hamoda, A.; Abdelazeem, F. Experimental and numerical investigation of one-way reinforced concrete slabs using various strengthening systems. Case Stud. Constr. Mater. 2023, 18, e01691. [Google Scholar] [CrossRef]
  18. Zainal, S.I.; Hejazi, F.; Mafaileh, A.M. Strengthening of Reinforced Concrete slabs using macro and micro synthetic fibers. Structures 2023, 51, 1579–1590. [Google Scholar] [CrossRef]
  19. Vasquez, A.; Karbhari, V. Fiber reinforced polymer composite strengthening of concrete slabs with cutouts. ACI Struct. J. 2003, 100, 665–673. [Google Scholar]
  20. Tan, K.; Zhao, H. Strengthening of opening in one-way reinforced concrete slabs using carbon fiber-reinforced polymer systems. ASCE J. Compos. Constr. 2004, 8, 393–401. [Google Scholar] [CrossRef]
  21. Smith, S.T.; Kim, S.J. Strengthening of one-way spanning RC slabs with cutouts using FRP Composites. Constr. Build. Mater. 2009, 23, 1578–1590. [Google Scholar] [CrossRef]
  22. Seliem, H.M.; Seracino, R.; Sumner, E.A.; Smith, S.T. Case study on the restoration of flexural capacity of continuous one-way RC slabs with cutouts. ASCE J. Compos. Constr. 2011, 15, 992–998. [Google Scholar] [CrossRef]
  23. Anil, Ö.; Kaya, N.; Arslan, O. Strengthening of one-way RC slab with opening using CFRP strips. Constr. Build. Mater. 2013, 48, 883–893. [Google Scholar] [CrossRef]
  24. Floruţ, S.C.; Sas, G.; Popescu, C.; Stoian, V. Tests on reinforced concrete slabs with cut-out openings strengthened with fibre-reinforced polymers. Compos. Part B-Eng. 2014, 66, 484–493. [Google Scholar] [CrossRef]
  25. Victor, J.M.; Syed, S. Analytical study on strengthening of waffle slab with opening using CFRP sheets and stiffening ribs. Int. Res. J. Eng. Technol. 2016, 3, 239–243. [Google Scholar]
  26. Shehab, H.K.; Eisa, A.S.; El-Awady, K.A. Strengthening of cutouts in existing one-way spanning R. C. flat slabs using CFRP sheets. Int. J. Concr. Struct. Mater. 2017, 11, 327–341. [Google Scholar] [CrossRef]
  27. Mahlis, M.; Shoeib, A.E.; Elnaby, S.A.; Sherif, A. The effect of cutting openings on the behavior of two-way solid loaded slabs. Structures 2018, 16, 137–149. [Google Scholar] [CrossRef]
  28. Eskandarinadaf, A.; Esfahani, M.R. Strengthening of two-way RC slabs with central opening. KSCE J. Civ. Eng. 2019, 23, 1228–1235. [Google Scholar] [CrossRef]
  29. Golham, M.A.; Al-Ahmed, A.H. Behavior of GFRP reinforced concrete slabs with openings strengthened by CFRP strips. Results Eng. 2023, 18, 101033. [Google Scholar] [CrossRef]
  30. Choi, Y.; Park, I.H.; Kang, S.G.; Cho, C.G. Strengthening of RC slabs with symmetric openings using GFRP composite beams. Polymers 2013, 5, 1352–1361. [Google Scholar] [CrossRef]
  31. ACI 440.2R-17; Guide for the Design and Construction of Externally Bonded FRP Systems for Strengthening Concrete Structures. American Concrete Institute: Farmington Hills, MI, USA, 2017.
  32. ASTM C39/C39M; Standard Test Method for Compressive Strength of Cylindrical. ASTM: West Conshohocken, PA, USA, 2018.
  33. ASTM E8/E8M; Standard Test Methods for Tension Testing of Metallic Materials. ASTM: West Conshohocken, PA, USA, 2016.
  34. ASTM D3039/D3039M; Standard Test Method for Tensile Properties of Polymer Matrix Composite Materials. ASTM: West Conshohocken, PA, USA, 2017.
  35. Almusallam, T.H.; Elsanadedy, H.M.; Al-Salloum, Y.A. Effect of longitudinal steel ratio on behavior of RC beams strengthened with FRP composites—Experimental and FE study. ASCE J. Compos. Constr. 2014, 19, 486. [Google Scholar] [CrossRef]
  36. Elsanadedy, H.M.; Abbas, H.; Al-Salloum, Y.A.; Almusallam, T.H. Prediction of intermediate crack debonding strain of externally bonded FRP laminates in RC beams and one-way slabs. ASCE J. Compos. Constr. 2014, 18, 04014008. [Google Scholar] [CrossRef]
  37. NZS 4203; Code of Practice for General Structural Design and Design Loadings for Buildings 1. New Zealand Standard (NZS): Wellington, New Zealand, 1992.
  38. ACI 318-19; Building Code Requirements for Structural Concrete and Commentary. American Concrete Institute: Detroit, MI, USA, 2019.
Figure 1. Details of control specimen S-C (dimensions are in mm): (a) plan view showing concrete dimensions; (b) section (A-A) showing concrete dimensions and steel reinforcement in ribs and top slab; (c) isometric view showing concrete dimensions; (d) isometric view of reinforcement.
Buildings 13 02260 g001
Figure 2. Details of control specimen S-FO-C (dimensions are in mm): (a) plan view showing concrete dimensions; (b) section (A-A) showing concrete dimensions at opening location; (c) section (B-B) showing concrete dimensions at shear-span region; (d) isometric view.
Buildings 13 02260 g002
Figure 3. Details of strengthened specimen S-FO-S1 (dimensions are in mm): (a) side view; (b) bottom view; (c) isometric view.
Buildings 13 02260 g003
Figure 4. Details of strengthened specimen S-FO-S2 (dimensions are in mm): (a) side view; (b) bottom view; (c) isometric view.
Buildings 13 02260 g004
Figure 5. Preparation of test specimens: (a) formwork with steel reinforcement for specimens with and without flexure opening; (b) concrete casting; (c) curing of concrete; (d) sandblasting of ribs for strengthening; (e) strengthening of specimen S-FO-S1 using CFRP composite sheets; (f) strengthening of specimen S-FO-S2 using GFRP composite sheets.
Buildings 13 02260 g005
Figure 6. Instrumentation layout and test setup (dimensions are in mm): (a) schematic front view with locations of LVDTs; (b) schematic bottom view showing location of FRP strain gauges for strengthened specimens; (c) general overview of the test setup showing loading assembly and supports.
Buildings 13 02260 g006
Figure 7. Failure mode of control specimen S-C: (a) final deformed shape; (b) bottom view; (c) close view of the middle rib.
Buildings 13 02260 g007aBuildings 13 02260 g007b
Figure 8. Failure mode of control specimen S-FO-C: (a) final deformed shape; (b) close bottom view of an edge rib; (c) close side view of top slab.
Buildings 13 02260 g008aBuildings 13 02260 g008b
Figure 9. Failure mode of strengthened specimen S-FO-S1: (a) final deformed shape of both left and right ribs; (b) bottom view.
Buildings 13 02260 g009
Figure 10. Failure mode of strengthened specimen S-FO-S2: (a) final deformed shape of both left and right ribs; (b) bottom view; (c) close side view of the left rib.
Buildings 13 02260 g010
Figure 11. Load versus mid-span deflection for tested specimens.
Buildings 13 02260 g011
Figure 12. Load versus steel strain at mid-span for tested specimens.
Buildings 13 02260 g012
Figure 13. Load versus FRP strain at mid-span for strengthened specimens.
Buildings 13 02260 g013
Figure 14. Comparison of tested specimen with regard to percent increase in: (a) peak load; (b) secant stiffness; (c) dissipated energy.
Buildings 13 02260 g014
Figure 15. Deflection ductility comparison for tested specimens.
Buildings 13 02260 g015
Figure 16. Analysis of critical section for control specimens: (a) equivalent section in flexure for specimen S-C; (b) equivalent section in shear for specimen S-C; (c) equivalent section in flexure for specimen S-FO-C; (d) equivalent section in shear for specimen S-FO-C.
Buildings 13 02260 g016
Figure 17. Bending moment diagrams in the slab due to different load components.
Buildings 13 02260 g017
Figure 18. Shear force diagrams in the slab due to different load components.
Buildings 13 02260 g018
Figure 19. Location of critical section for flexure of strengthened specimens S-FO-S1 and S-FO-S2: (a) bottom view of specimens S-FO-S1 and S-FO-S2; (b) equivalent T-section for analysis; (c) distribution of strains and stresses.
Buildings 13 02260 g019
Figure 20. Location of critical section for shear of specimens S-FO-S2: (a) bottom view; (b) side view; (c) equivalent T-section for shear analysis.
Buildings 13 02260 g020
Figure 21. Experimental-to-analytical peak load ratio for tested specimens.
Buildings 13 02260 g021
Table 1. Test matrix.
Specimen IDOpening PresenceNo. of Openings and LocationStrengtheningNo. of Specimens
S-CNoneNoneControl1
S-FO-CYesSingle–Mid-spanControl1
S-FO-S1YesSingle–Mid-spanScheme-1: CFRP sheets1
S-FO-S2YesSingle–Mid-spanScheme-2: GFRP sheets1
Table 2. Properties of materials.
Concrete
Average compressive strength after 28 days38 MPa
Average   compressive   strength   on   the   day   of   testing ,   f c 40 MPa
Steel reinforcement
Bar diameterYield strengthUltimate strength
Ø 6 mm400 MPa447 MPa
Ø 8 mm580 MPa629 MPa
FRP composite system
CFRPGFRP
Elastic modulus of FRP laminates70 GPa25 GPa
Fracture strain0.0150.0168
Ultimate tensile strength1126.6 MPa422 MPa
Thickness per layer0.6 mm0.56 mm
Table 3. Key experimental results for load–deflection response *.
Specimen IDPcr
(kN)
Py
(kN)
Pu
(kN)
Δcr
(mm)
Δy
(mm)
Δpu
(mm)
Δu
(mm)
ks
(kN/mm)
Eu
(kN.mm)
μΔ
S-C5.151.659.60.112.536.443.14.1221363.4
S-FO-C4.630.136.90.412.231.741.12.4712343.4
S-FO-S17.345.964.20.813.732.733.23.3414652.4
S-FO-S27.644.960.71.012.333.133.63.6514512.7
* Pcr = load at onset of concrete cracking; Py = load at onset of tension steel yielding; Pu = peak load; Δcr = deflection of mid-span measured at cracking load; Δy = deflection of mid-span measured at yield load; Δpu = deflection of mid-span measured at peak load; Δu = ultimate deflection of mid-span; ks = secant stiffness = Py/Δy; Eu= dissipated energy; μΔ = deflection ductility = Δu/Δy.
Table 4. Experimental strains for test specimens.
Specimen IDStrain in Bottom Steel Rebars at Peak LoadPeak Strain in Bottom Steel RebarsPeak Strain in FRP Sheets
S-C0.01560.0168-
S-FO-C0.01310.0132-
S-FO-S10.01040.01340.0103
S-FO-S20.01280.01440.0144
Table 5. Comparison between experimental and analytical peak load for test specimens *.
Specimen IDPu,Exp
(kN)
Puf,Ana
(kN)
Pus,Ana
(kN)
Pu,Ana
(kN)
Pu,Exp/Pu,Ana
S-C59.659.7183.559.71.00
S-FO-C36.937.2119.837.20.99
S-FO-S164.264.7119.864.70.99
S-FO-S260.763.3185.663.30.96
* Pu,Exp = peak experimental load; Puf,Ana = peak analytical load based on flexural failure; Pus,Ana = peak analytical load based on shear failure; Pu,Ana = peak analytical load taken as the smaller of Puf,Ana and Pus,Ana.
Disclaimer/Publisher’s Note: The statements, opinions and data contained in all publications are solely those of the individual author(s) and contributor(s) and not of MDPI and/or the editor(s). MDPI and/or the editor(s) disclaim responsibility for any injury to people or property resulting from any ideas, methods, instructions or products referred to in the content.

