Article

Simulation Study on Natural Ventilation Performance in a Low-Carbon Large-Space Public Building in Hot-Summer and Cold-Winter Region of China

1
Shanghai Construction Group Co., Ltd., Shanghai 200080, China
2
School of Environment and Architecture, University of Shanghai for Science and Technology, Shanghai 200093, China
*
Author to whom correspondence should be addressed.
Buildings 2023, 13(9), 2263; https://doi.org/10.3390/buildings13092263
Submission received: 8 August 2023 / Revised: 29 August 2023 / Accepted: 29 August 2023 / Published: 6 September 2023

Abstract

:
Recently, climate governance has entered a new phase of accelerating decarbonization. In order to achieve low-carbon buildings, natural ventilation has been widely used as it requires no fan power. However, there are great challenges for achieving effective natural ventilation in large-space public buildings especially in areas characterized by hot-summer and cold-winter climatic regions, due to empirically unsuitable ambient temperatures and theoretically complex joint effect of wind pressure and thermal buoyancy. Therefore, this numerical study was conducted on the performance of a natural ventilation strategy in a large-space public building in a hot-summer and cold-winter region by using computational fluid dynamics (CFD) methods. Simulations were performed by applying FLUENT software for obtaining airflow distributions within and around a typical low-carbon public building. The temperature distribution in the atrium of the building was simulated particularly for analyzing the natural ventilation performance in a large-space area. Results demonstrated that thermal pressure was dominant for the large-space building in the case study. The average indoor airflow velocities on different floors ranged from 0.43 m/s to 0.47 m/s on the windward side which met indoor ventilation requirements. Most areas of wind velocities could meet ventilation requirements. The natural ventilation performance could be improved by increasing the relative height difference between the air inlets and air outlets. These findings could help provide references and solutions for realizing natural ventilation in low-carbon large-space public buildings in hot-summer and cold-winter regions.

1. Introduction

Global climate change has a significant impact on both natural environment and human society. To prevent the severe hazards caused by global warming, organizations have proposed limiting the global temperature increase to 1.5 °C and advocated for achieving global carbon neutrality by approximately 2050 [1]. China has suggested a dual carbon national goal with the aim of reaching a carbon peak before 2030 and achieving carbon neutrality before 2060. In China, the building sector accounts for 45% of the total energy consumption, and 50.6% of the total carbon emission [2]. In order to reduce both energy consumption and carbon emission in buildings, the Ministry of Housing and Urban-Rural Development has established the 14th Five-Year Plan for the Development and Planning of Energy Conservation in Building and Green Buildings, demanding the compulsory implementation of a national standard for green buildings in new constructions, and the construction of ultralow and near-zero-energy-consumption building demonstration projects will exceed 50,000,000 m2 by 2025 [3].
Among different types of buildings, public buildings are essential for modern society, while contributing significantly to energy consumption and carbon emissions [4]. Particularly, large-space public buildings symbolize urban modernization with their spacious layouts, complex designs, and diverse functions [5], with a concern for large energy consumption. Recently, natural ventilation has been regarded as a preferable ventilation method in large-space public buildings [6] for maintaining excellent air quality and thermal comfort in indoor environment and contributing to energy efficiency and human health [7]. Natural ventilation, which results from the joint effect of thermal buoyancy and wind pressure, may be divided into three categories: wind-driven ventilation, buoyancy-driven ventilation, and ventilation caused by the interaction of wind and buoyancy [8]. Natural ventilation is a sustainable solution by reducing cooling energy consumption [9]. Previous research also indicated that excessive heat and humidity can be removed by permitting natural ventilation in large-space public buildings [10], providing the inhabitants with a high-quality living environment [11]. Therefore, natural ventilation has proved to be a promising low-carbon solution to public buildings with its impact on energy conservation and cost reduction.
The Yangtze River Delta, with a typical hot-summer and cold-winter climate, is taking actions to attain carbon emission reduction while maintaining its economic growth objectives. It is distinguished by a significant number of large-space public buildings [12] and thus require effective low-carbon designs such as natural ventilation. However, the ambient temperature in this region is often above 28 °C in summer and below 10 °C in winter [13], which bring great challenges in applying proper natural ventilation strategies in buildings of this region. On the other hand, it is crucial to understanding the driving forces and principles of natural ventilation in large-space public buildings. Previous researchers and practitioners have put a great effort in solving these problems.
As a strategy for improving natural ventilation, atriums are often applied in large-space public buildings and have proved to be capable of providing satisfactory indoor thermal environment with a semienclosed form [14,15,16]. Hussain et al. [17] conducted a numerical study on a three-story atrium building and analyzed the influence of sunshine duration and solar intensity at different geographical locations on the airflow velocity and temperature distribution of the buoyancy-driven natural ventilation. Zhang et al. [18] performed simulations on a simplified low-rise atrium building in Shanghai and found that the atrium had a favorable thermal environment, and that fully open external windows of the atrium could significantly improve the subjective evaluation of the indoor environment by the occupants. Cheng [19] used steady-state CFD method to simulate the airflow distribution and airflow velocity at various positions in a simplified sports stadium and found that the coordination between thermal pressure and wind pressure dynamics resulted in good ventilation performance in the main functional spaces in the stadium. Nevertheless, previous research on atriums has mostly concentrated on conventional atriums with a uniform shape which occupies several floors. Atriums with a unique shape and special spatial arrangements with irregular floor layouts, however, are seldom investigated. For complex atrium space forms, Xu [20] proposed the atrium body shape coefficients related to the design and verified the influence of geometric design parameters on energy consumption of near-zero-energy office buildings in cold regions. However, that study was in cold regions, and the climatic conditions are very different from the cold-winter and hot-summer regions in which our study is located. Further explorations are needed to analyze the performance of natural ventilation in atriums in these regions.
In order to gain a better understanding of natural ventilation in large-space buildings, Lu et al. [21] developed a vertical temperature node model to predict thermal stratification based on the airflow pattern of a low-level wall supply and studied the heat transfer process in large-scale spaces. They revealed that vertical temperature stratification is a key factor for implementing natural ventilation in large-scale buildings. Tan [22] investigated the influence of outdoor wind environment on natural ventilation in large-space public buildings from the perspectives of the building layout, environmental factors, and boundary conditions. They used CFD simulation to identify controllable factors for improving the outdoor wind environment and summarized site design principles favorable for a natural ventilation design. Guo et al. [23] combined building energy modeling (BEM) with CFD to assess the influence of climate conditions and building form on natural ventilation in a medium-sized subtropical sports stadium and demonstrated that thermal buoyancy played a positive role in the air change rate (ACH) and wind velocity conditions. Kong [24] conducted research on the wind and thermal environment in a large football stadium in Xi’an, which indicated that the wind environment had a greater impact than the thermal environment. For the spectator area of large buildings, the wind comfort should be emphasized. Li [25] proposed a natural-ventilation strategy (Strategy NV), which combined the two thermal comfort models with the airflow network model and applied it to a case study based on a seven-floor office building located in hot-summer and cold- winter regions. Building energy consumption was significantly reduced by the Strategy NV. However, the specific impact of the interaction of wind and buoyancy on an indoor ventilation environment, especially under natural ventilation, has not been further revealed.
Despite the extant literature, important gaps could be found in these works. Firstly, the joint effect of wind pressure and thermal buoyancy has not been studied thoroughly in low-carbon public buildings with complex structures in hot-summer and cold-winter regions. Secondly, little information can be found on the natural ventilation performance of atriums with special spatial arrangements and irregular floor layouts. The present work addresses these issues and focuses on the simulation of natural ventilation in a typical large-space public building during midseason, considering the joint effect of wind pressure and thermal pressure. In view of the existing problems and deficiencies, the objective of this study is to discuss the effectiveness of natural ventilation in low-carbon large-space buildings from the perspectives of wind pressure and thermal pressure. Simulations were performed by using FLUENT to obtain airflow distributions within and around the building. The temperature distribution in the atrium of the building was simulated particularly for analyzing the natural ventilation performance in a large-space area. A case study of an office building located in a hot-summer and cold-winter region is given. The main findings in this study could help provide references and solutions for realizing natural ventilation in low-carbon large-space public buildings.

2. Materials and Methods

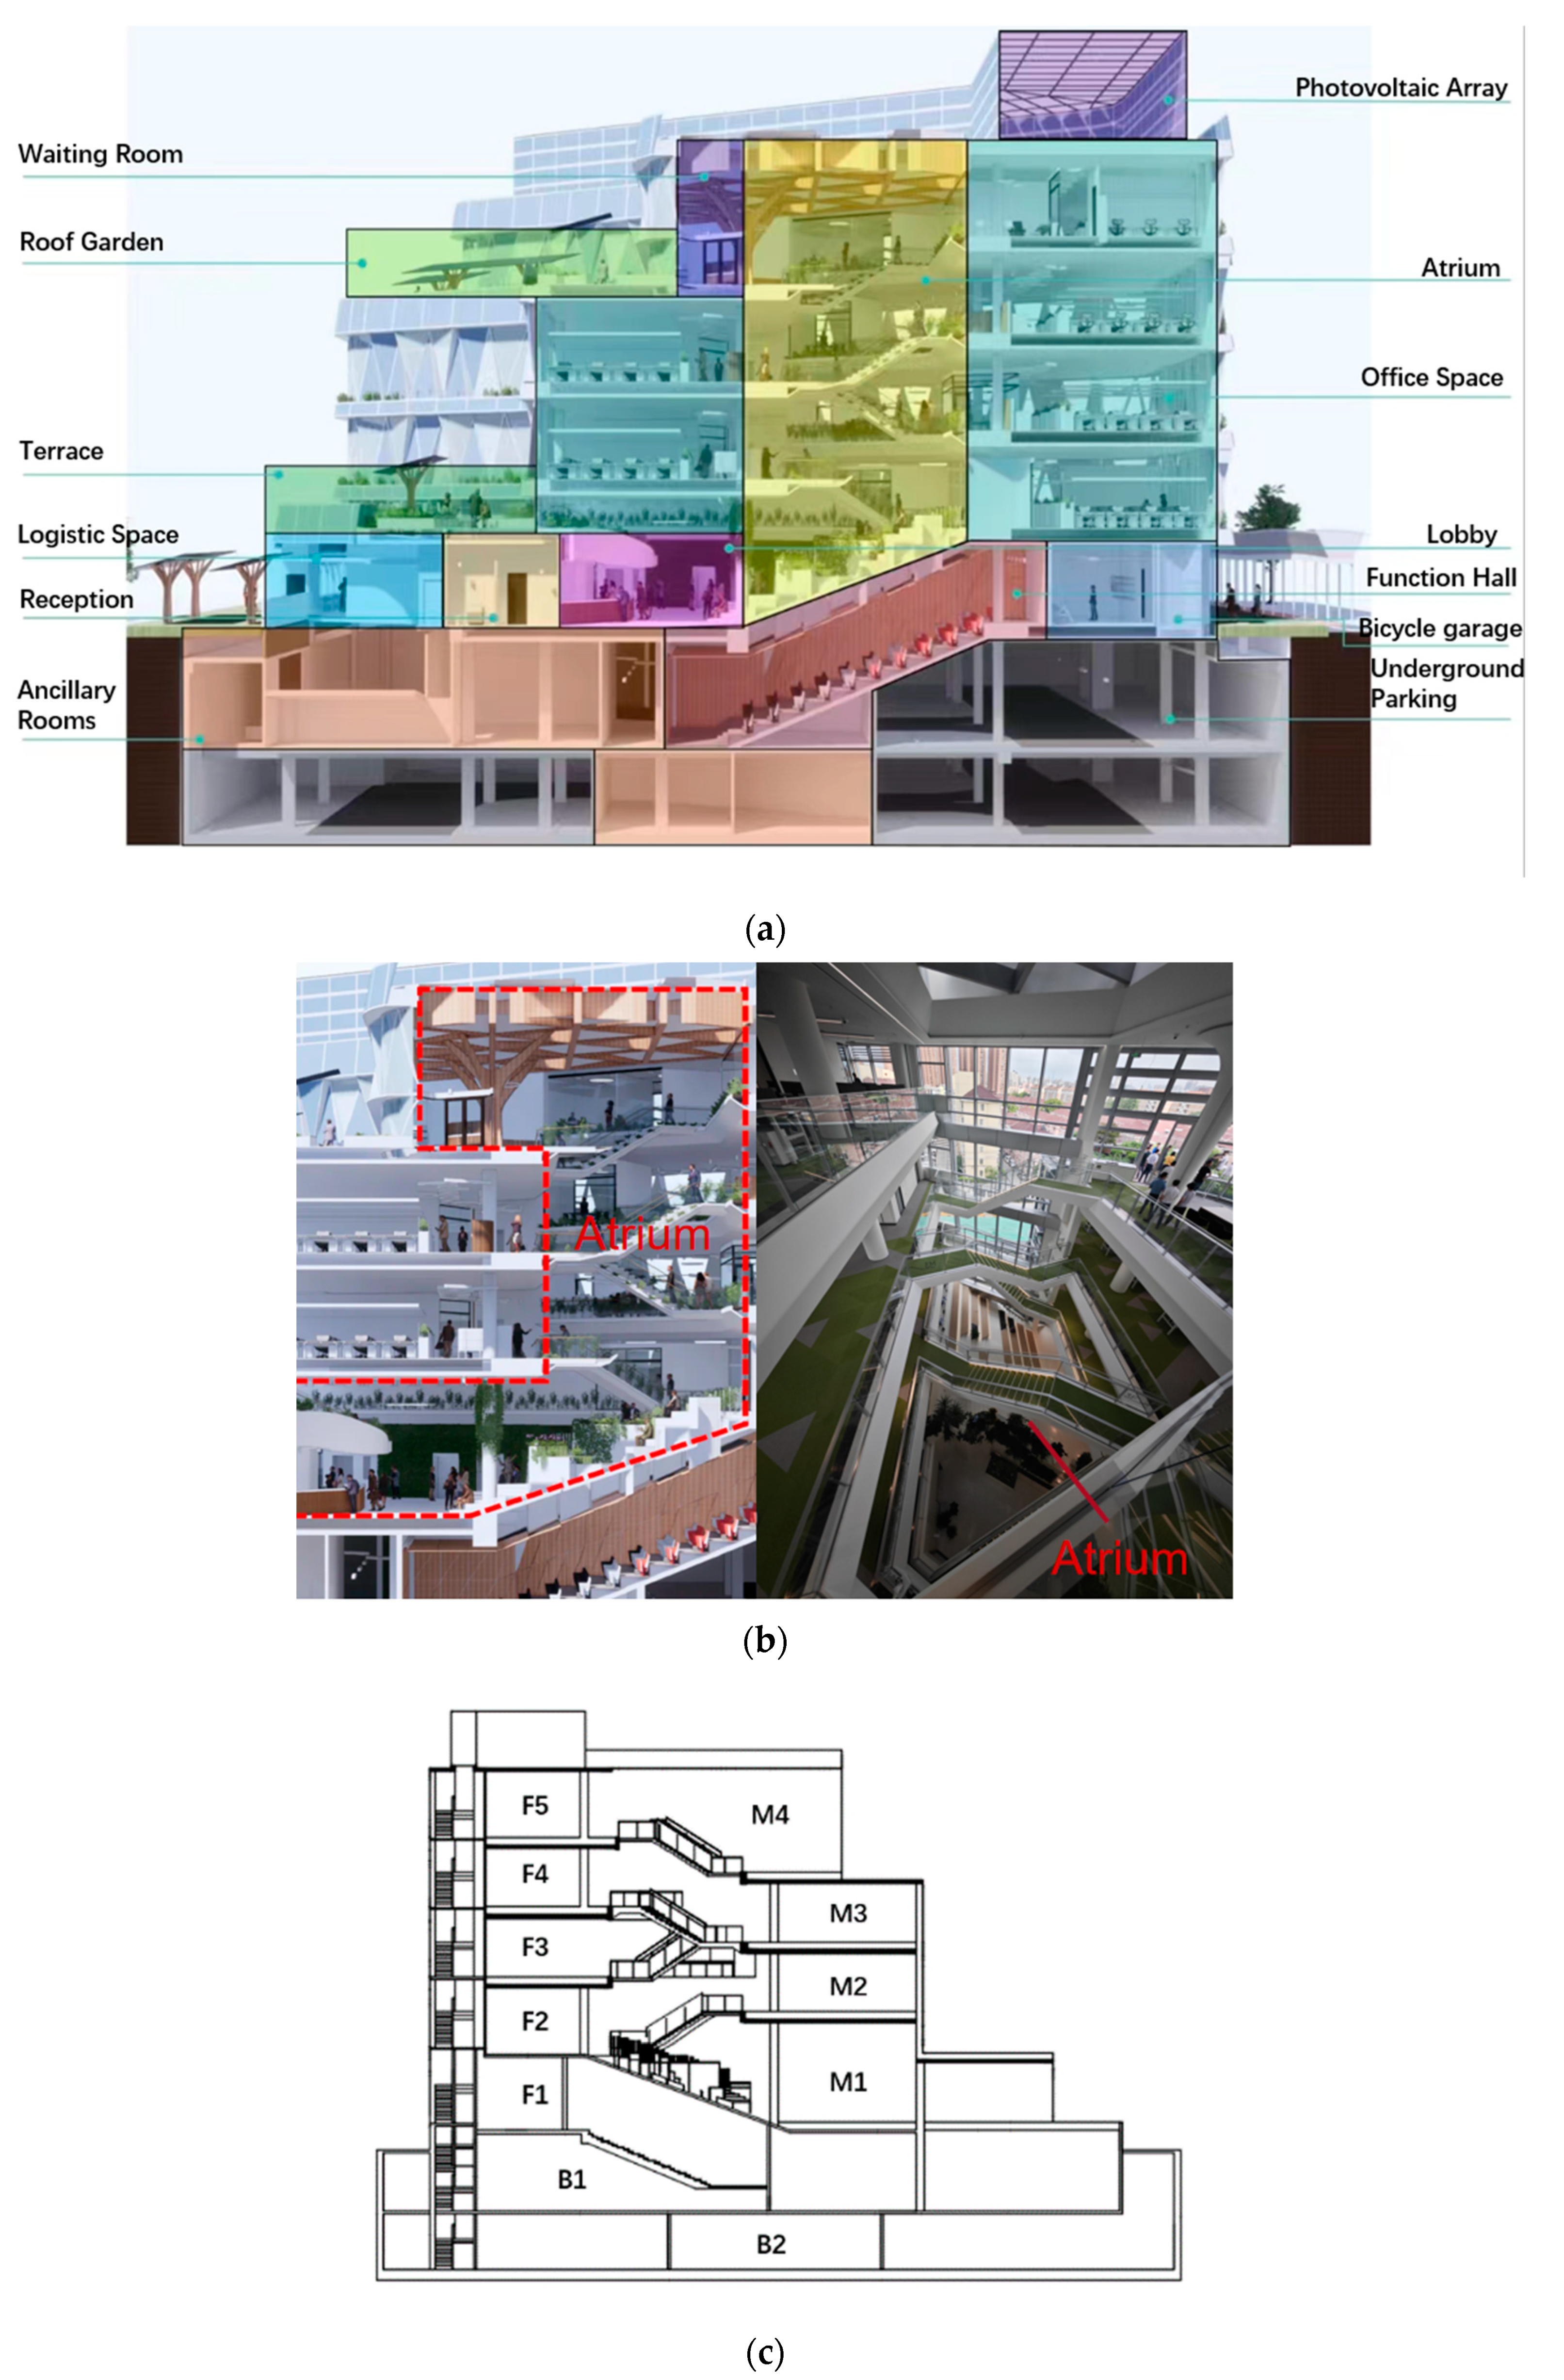
2.1. Description of the Low-Carbon Building
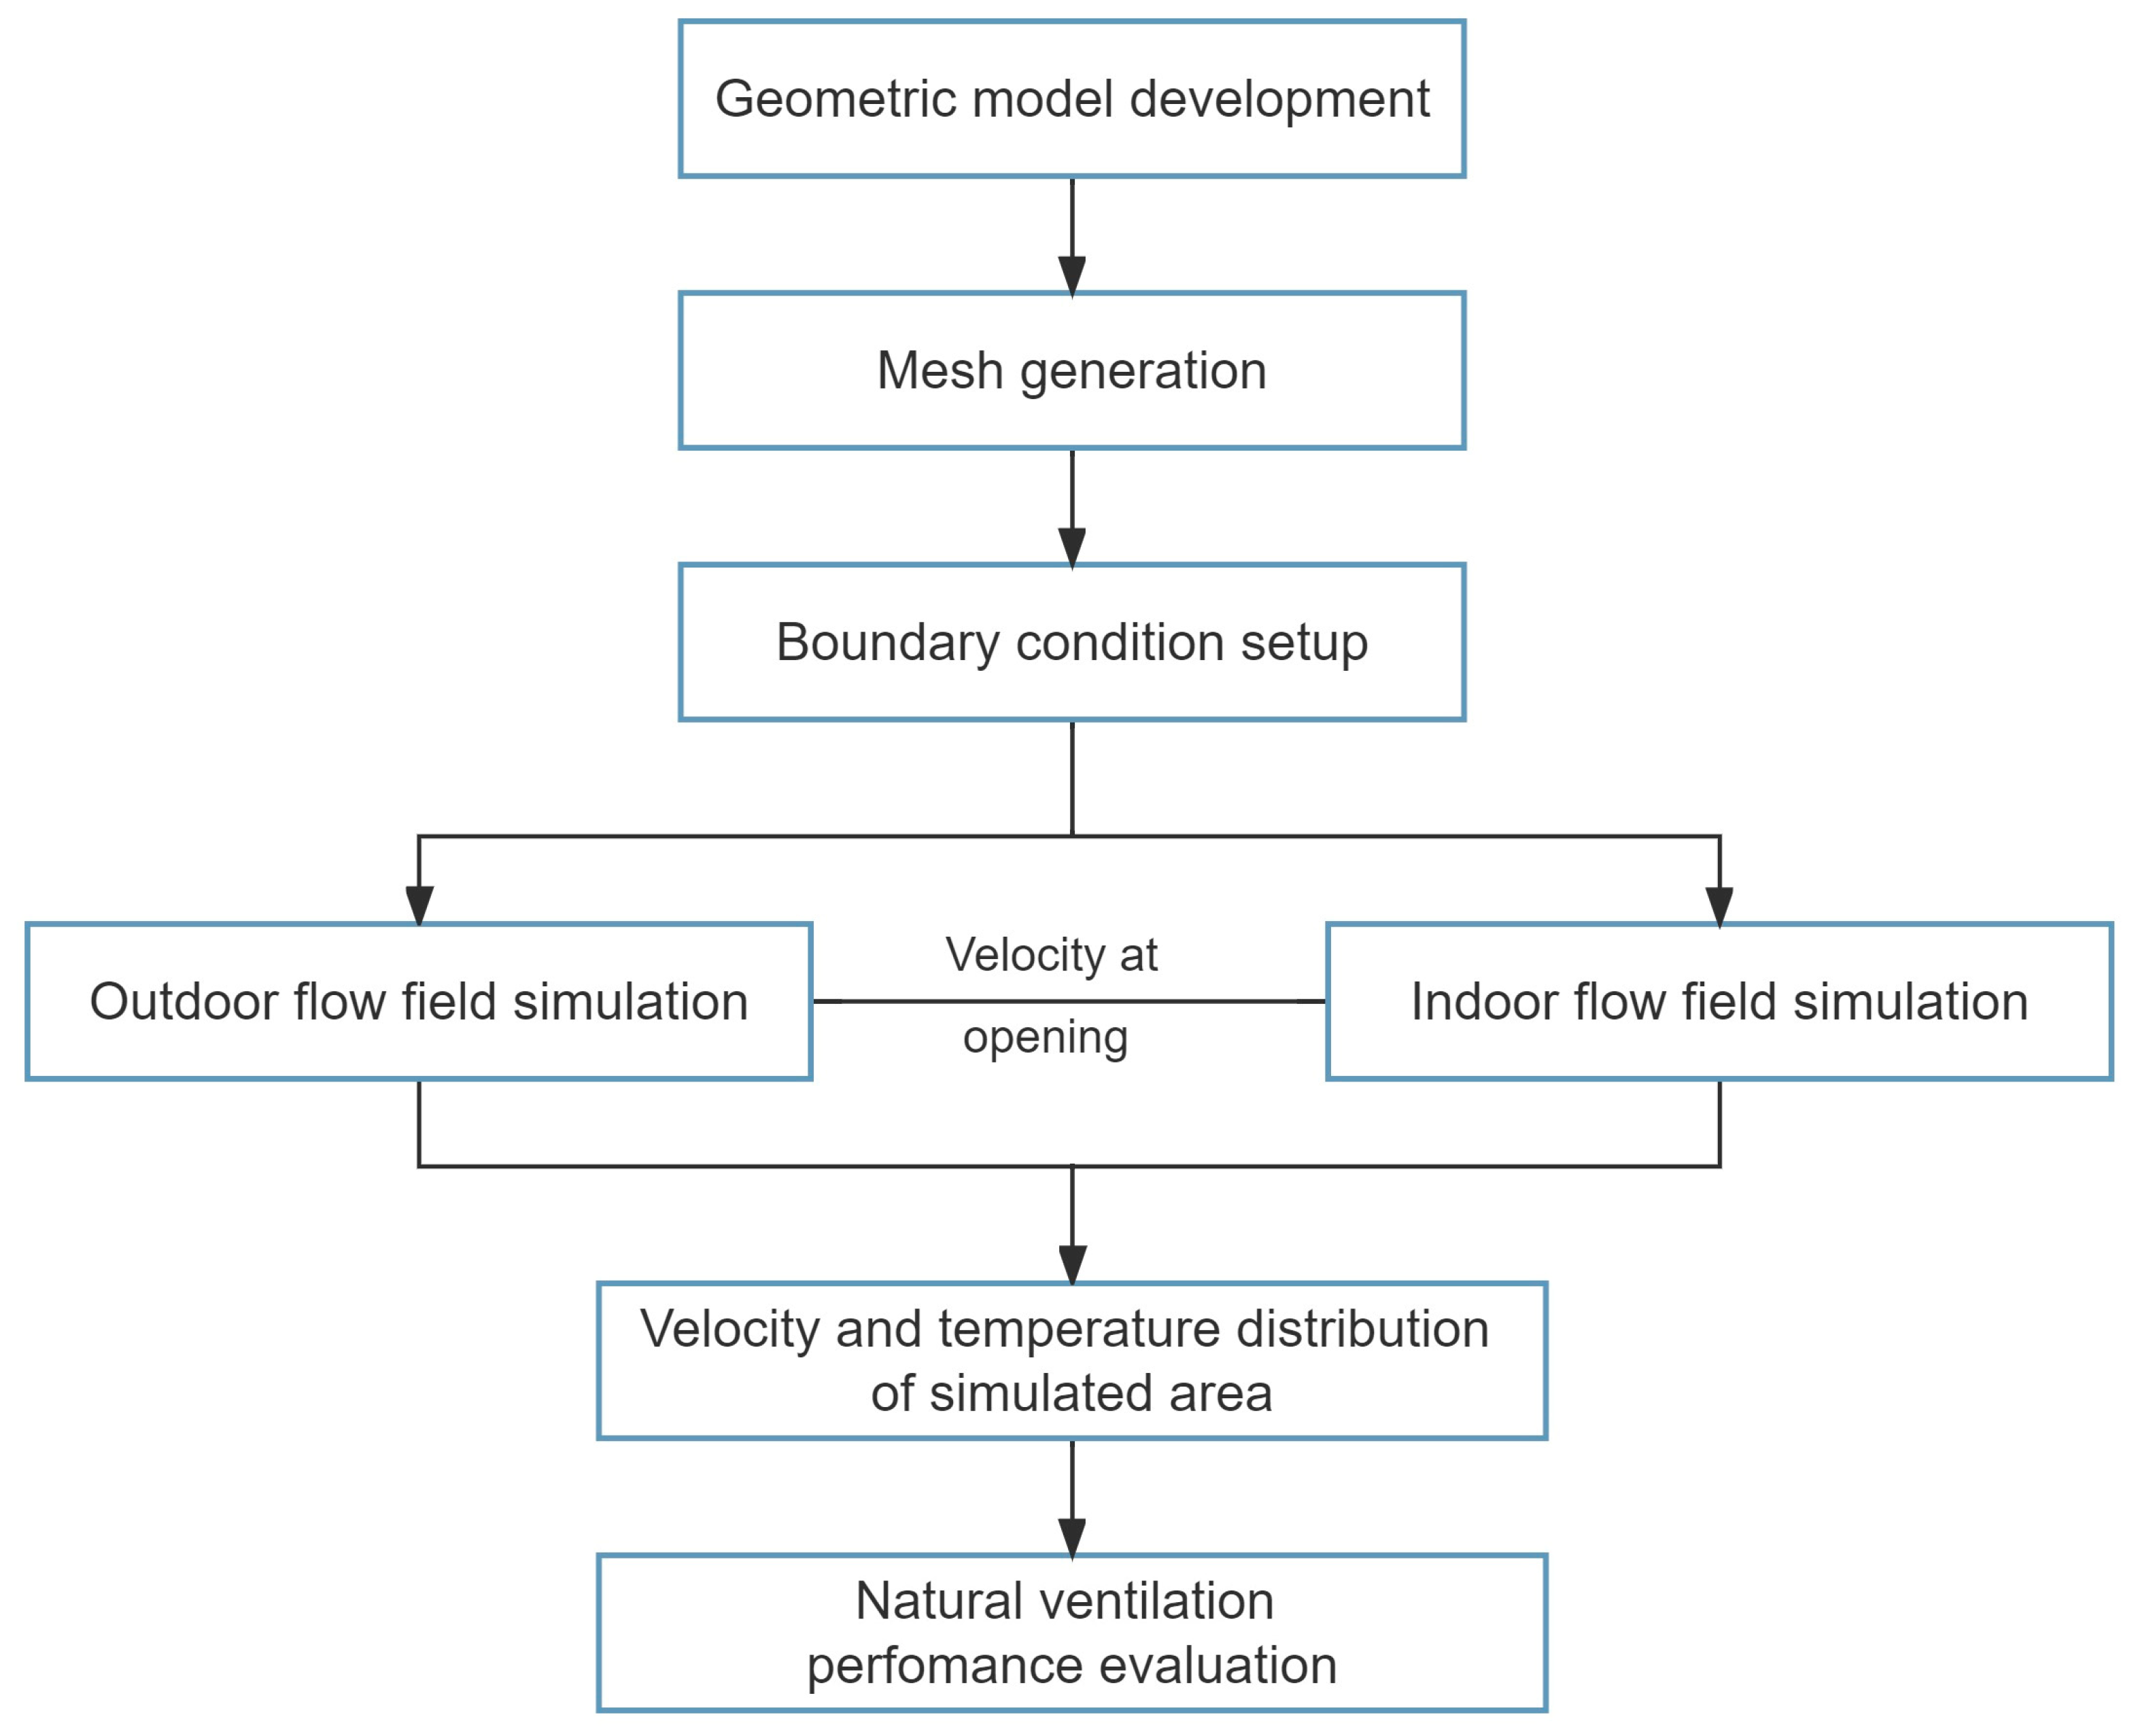
The structural diagram of the building is shown in Figure 1. The low-carbon building for the case study was located in Shanghai and was a 23.7 m high office building consisting of seven floors (with two floors underground and five floors above-ground), and the five floors above the ground were simulated in this study. The total area of the building was 11,782 m2. Each side of the building glazing facade had several operable openings which measured 2000 mm × 750 mm. There was an atrium in the eastern part of the building (Figure 1b), which was directly connected to the entrance, while the rest area of the building was occupied by rooms of varied areas. As shown in Figure 1c, the building was separated into two sections according to their structure and functions. Section M had four floors, and the height was 7.15 m for floors M1-2, and 4.5 m for floors M3-4. Section F had five floors, with F1 being the highest with a height of 4.9 m and the remaining floors had a height of 4.5 m. Since the atrium enabled the joint effect of wind and thermal pressure between the M and F sections, it was investigated separately in this study.

2.2. CFD Model

CFD (computational fluid dynamics) is a commonly used method for evaluating the natural ventilation performance of buildings since it can provide more detailed and accurate information than physical experiments, especially in complex flow systems [26,27]. In this study, a series of simulations with CFD methods were carried out by using FLUENT software to reveal the conditions of airflow fields or temperature distributions in outdoor and indoor environments. A two-stage simulation was conducted including stage 1, the airflow velocity and static pressure around the building for the outdoor environment; and stage 2, the airflow velocity and temperature distributions of selected floors for the indoor environment. For the outdoor flow field simulation, the building was regarded as an enclosure with the external openings (windows and doors) on the building envelopes kept open as velocity inlets in order to calculate the airflow velocities at the inlets and outflow, which were employed in the boundary conditions’ setup for the indoor environment simulation. The flow chart of the two-stage simulation is shown in Figure 2.
The airflow distributions in this study were nonstationary three-dimensional incompressible turbulent flow, and the buoyancy force term in the indoor flow was calculated using the Boussinesq assumption [28]. The dynamical component was constant, and the influence of the buoyancy force on the airflow was caused by the air density and pressure gradient. The airflow in the turbulent viscous model satisfied the continuity equation, while the momentum equation was represented by the Navier–Stokes equations [29]:
u i x i = 0
The momentum equation was:
ρ u i t + ρ u i u j x j = p x i μ e f f u i u j + u j x i + ρ β T 0 T g i
The energy conservation equation was:
ρ T t + ρ v j T x j = x j Γ T , s f f T x j + q C p
where Γ T , e f f is the effective turbulent diffusion coefficient of the temperature.
Γ T , e f f = μ e f f p r e f f = 0
where p r e f f is the effective Prandtl number, with a value of 0.9.
Each of the above equations were expressed in terms of the following generic equation:
d i v ρ V φ = d i v Γ ϕ g r a d φ + s ϕ
where Γ ϕ is the diffusion coefficient, s ϕ is the source term of the generic equation, where φ is a distinct physical quantity; the general equation transforms into the physical quantity control equation.
Both the momentum equation and the energy equation were expressed uniformly in a right-angle coordinate system as follows:
x ρ u ϕ Γ ϕ ϕ x + y ρ v ϕ Γ ϕ ϕ y + z ρ w ϕ Γ ϕ ϕ z = s ϕ
where φ can represent u, v, w, or T. To facilitate numerical calculations, the control volume integration approach was used to discretize the differential control equations.
The pressure–velocity coupled SIMPLEC technique was used as the solution for the simulations. To increase the simulation accuracy and ensure the authenticity of the physical results, each governing equation was discretized using a second-order upwind approach. The convergence criteria for the residual values were set to less than 10−6.
A steady-state simulation was conducted in this study. The Reynolds averaged Navier–Stokes (RANS) equations were adopted since it offers a faster computational speed as compared to a large-eddy simulation (LES). For the turbulence model, RANS methods provide different models such as the standard k-ε model, RNG k-ε model, and realizable k-ε model. The realizable k-ε model was selected since the fluid flow was assumed to be incompressible fluid, and the realizable k-ε model offers a better computational accuracy and convergence velocity in both external and internal ventilation of buildings compared to the standard k-ε model. Mayank et al. [30] verified the accuracy of the model by using the realizable k-ε model to perform two-dimensional numerical simulations of a specially designed turbulent channel. Ami et al. [31] used the realizable k-ε model to simulate constrained buoyant turbulent jets, where the accuracy of the model was verified by comparing the results of experiments and simulations. Stavrakaki et al. [32] used the realizable k-ε model in an experimental study which validated the model.
In the realizable k-ε model, the transport equations for k and ε can be expressed in a general form as follows [23]:
ρ k t + ρ k u i x i = x j u + u t σ k k x j + G k ρ ε
( ρ ε ) t + ( ρ ε u i ) x i = x j ( u + u t σ ε ) ε x j + ρ C 1 E ε ρ C 2 ε 2 k + ν ε
where ρ is the density, u is the dynamic viscosity, k is the thermal conductivity, ε is the dissipation rate of the turbulent kinetic energy, ν is the kinematic viscosity, η is the turbulent viscosity, and E is the turbulent kinetic energy.
Moreover,
σ k = 1.0 , σ ε = 1.2 , C 2 = 1.9
C 1 = max ( 0.43 , η η + 5 )
η = ( 2 E i j · E i i ) 1 2 k ε
E i j = 1 2 u i x j + u j x i

2.3. Boundary Conditions

The setups of the boundary conditions in this study are presented in Table 1. According to the Technical Code for Numerical Simulation of Building Environment (DB31/T 922-2015) [33] of Shanghai, the simulation date was 20 March, with a predominant southeast wind direction and an average outside wind velocity of 3.8 m/s. The average wind velocity in the predominant wind direction was 3.51 m/s when the wind direction was set perpendicular to the building. According to the Chinese Standard Weather Data (CSWD), the average outdoor temperature in Shanghai during the transitional season (May) is 24 °C. The temperature of the first floor was 22 °C, with a 0.4 °C gradient as the temperature rose up the height of the building. Equation (12) is used to compute the wind velocity at the air inlet using the urban gradient wind model
u - u 0 = ( z z 0 ) a
where u - is the wind velocity of the height h (m/s), u 0 is the wind velocity of the reference height (in m/s, the value was 3.8 m/s), z 0 is reference height (in m, the value was 10 m), a is the local sub-bedding surface roughness coefficient (the value was 0.3). These values were compiled into a user-defined function (UDF) file to be used as the gradient wind parameters for the inlet boundary:
I = 0.1 ( z z g ) 0.25
k = 0.5 ( u - · I ) 2
ε = 0.0 9 3 4 · k 3 2 l
where I is the turbulence intensity at the entrance, zg is the gradient wind height (450 m). k is the turbulent kinetic energy, ε is the dissipation rate of the turbulent kinetic energy, and l is the turbulence scale.
Several assumptions were made as follows [34,35,36]:
  • The airflow within the building was continuous and was treated as an incompressible fluid.
  • Only steady-state ventilation was considered, with the environmental impact on the airflow field ignored.
  • Direct solar radiation that entered the inside through windows was ignored.
  • The roof temperature was supposed to be extremely high and comparable to the external temperature due to the direct and dispersed solar radiation.

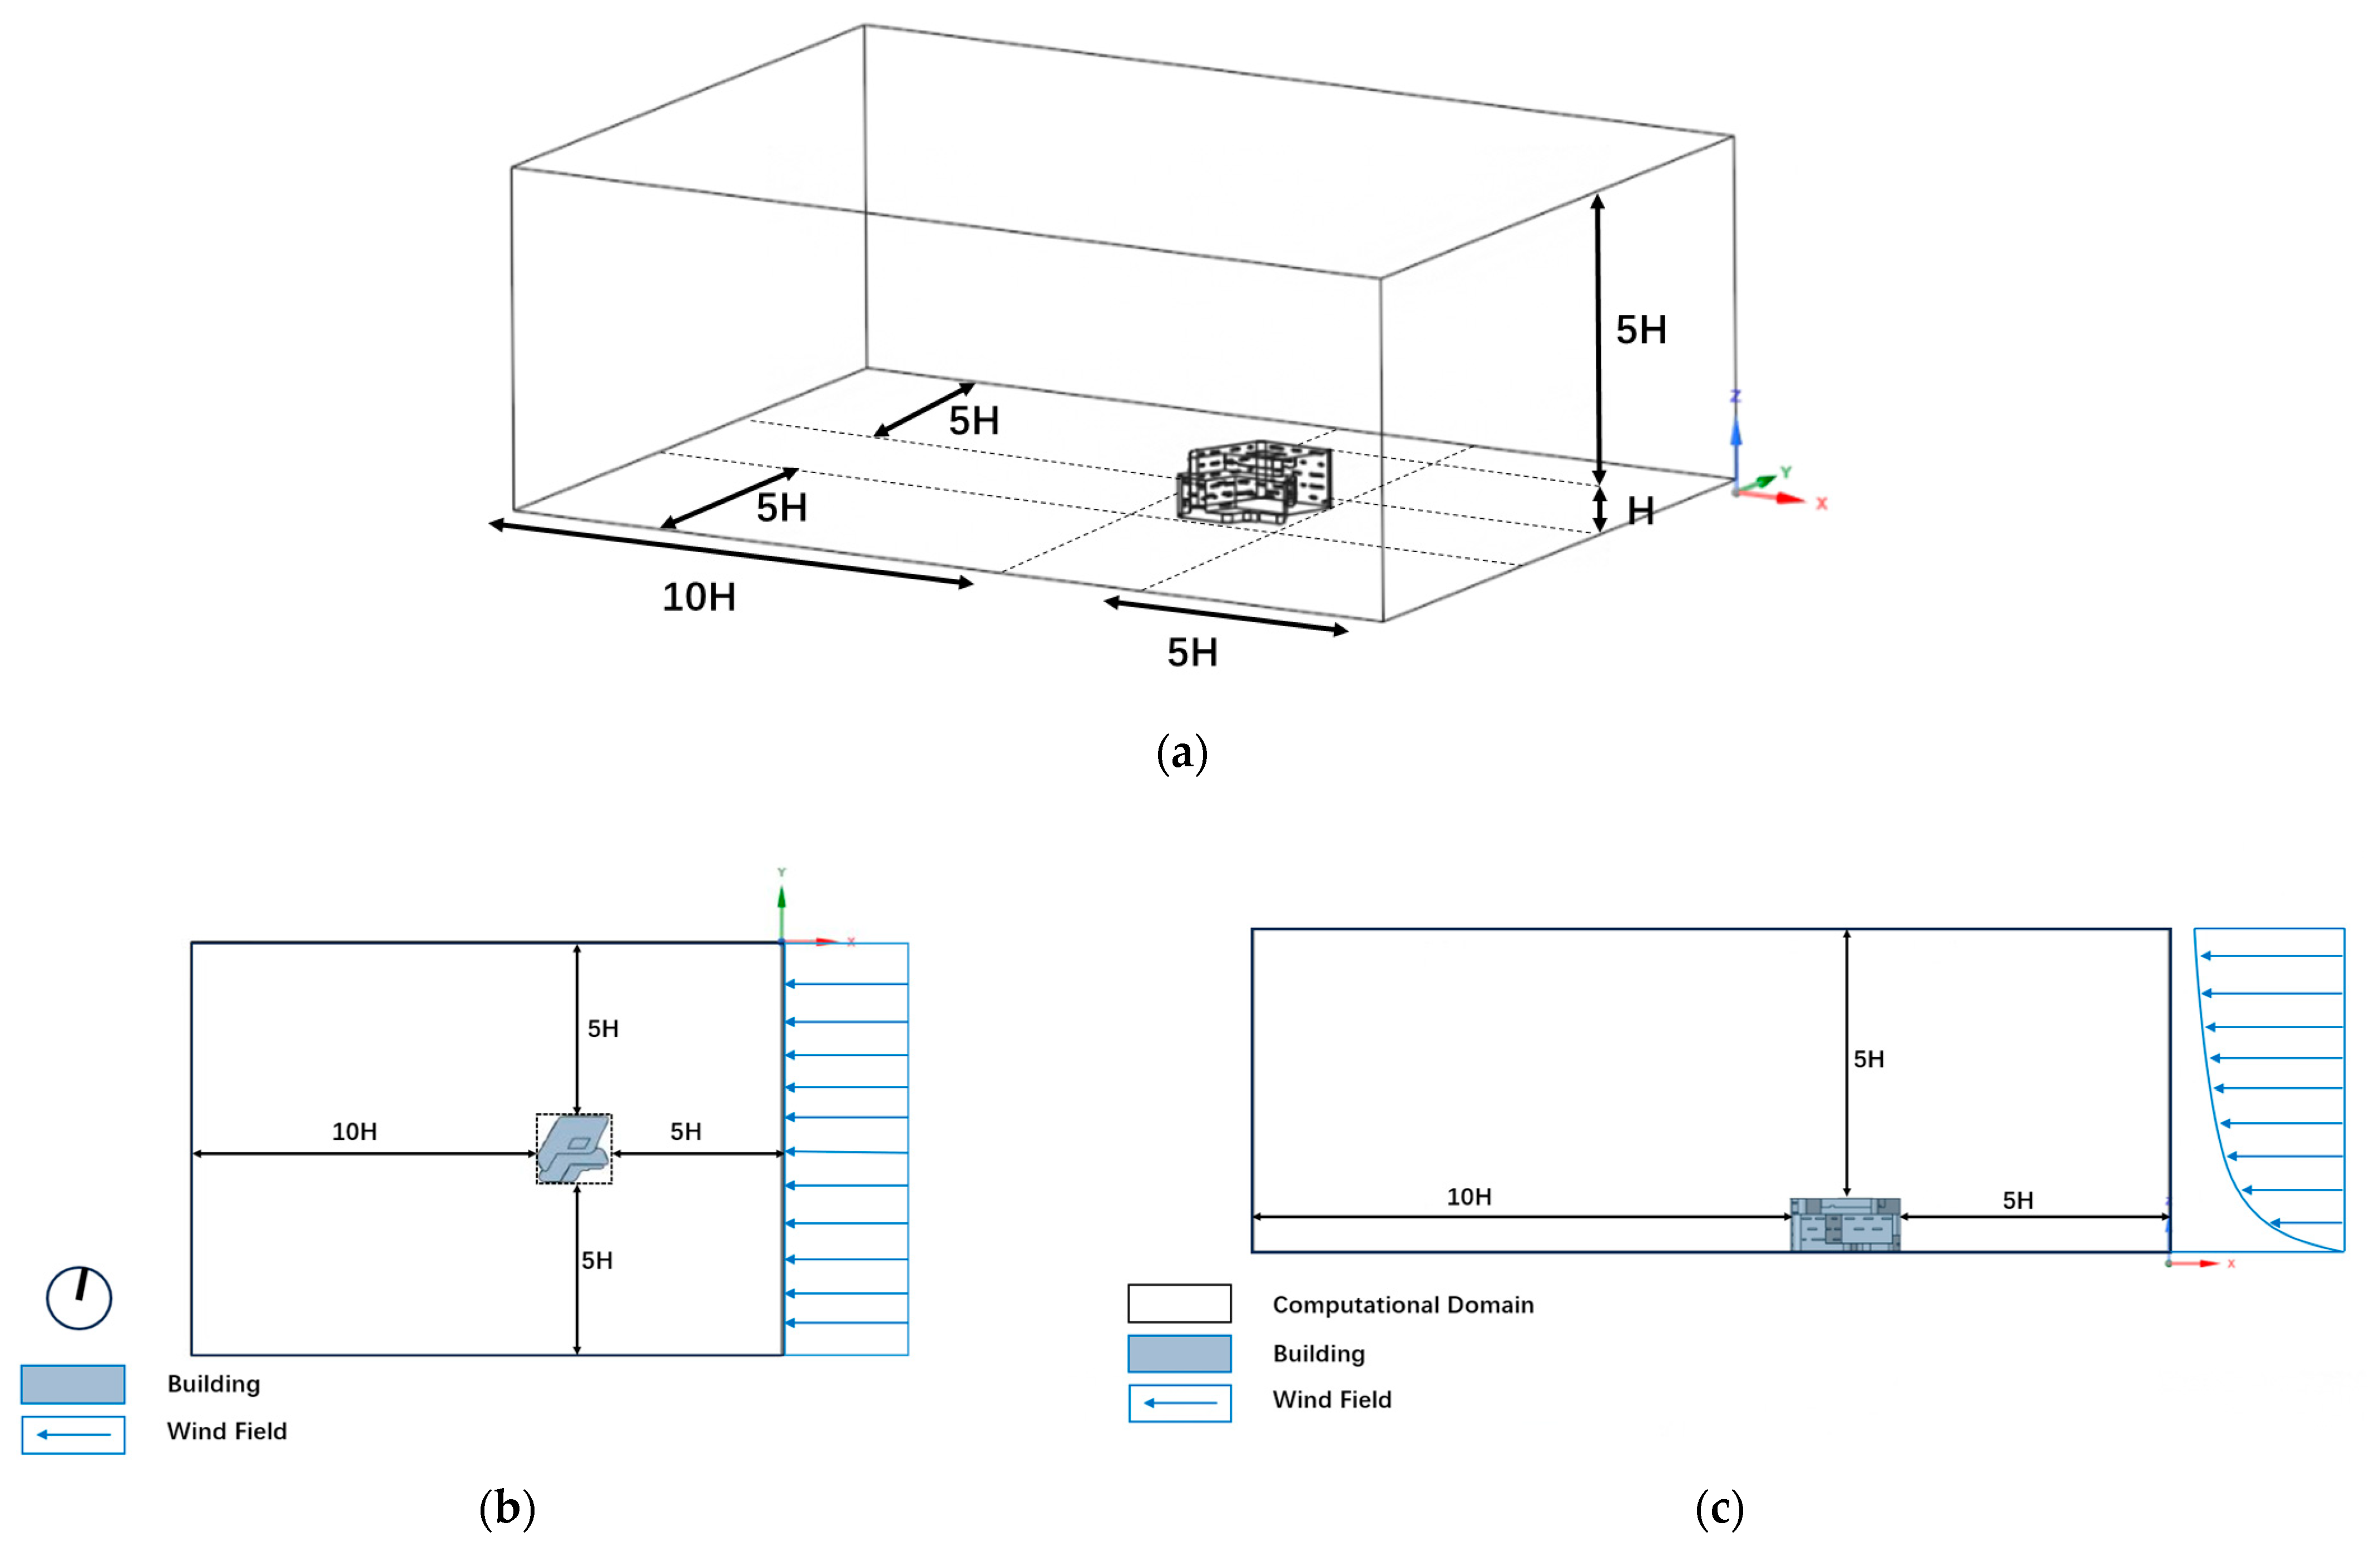
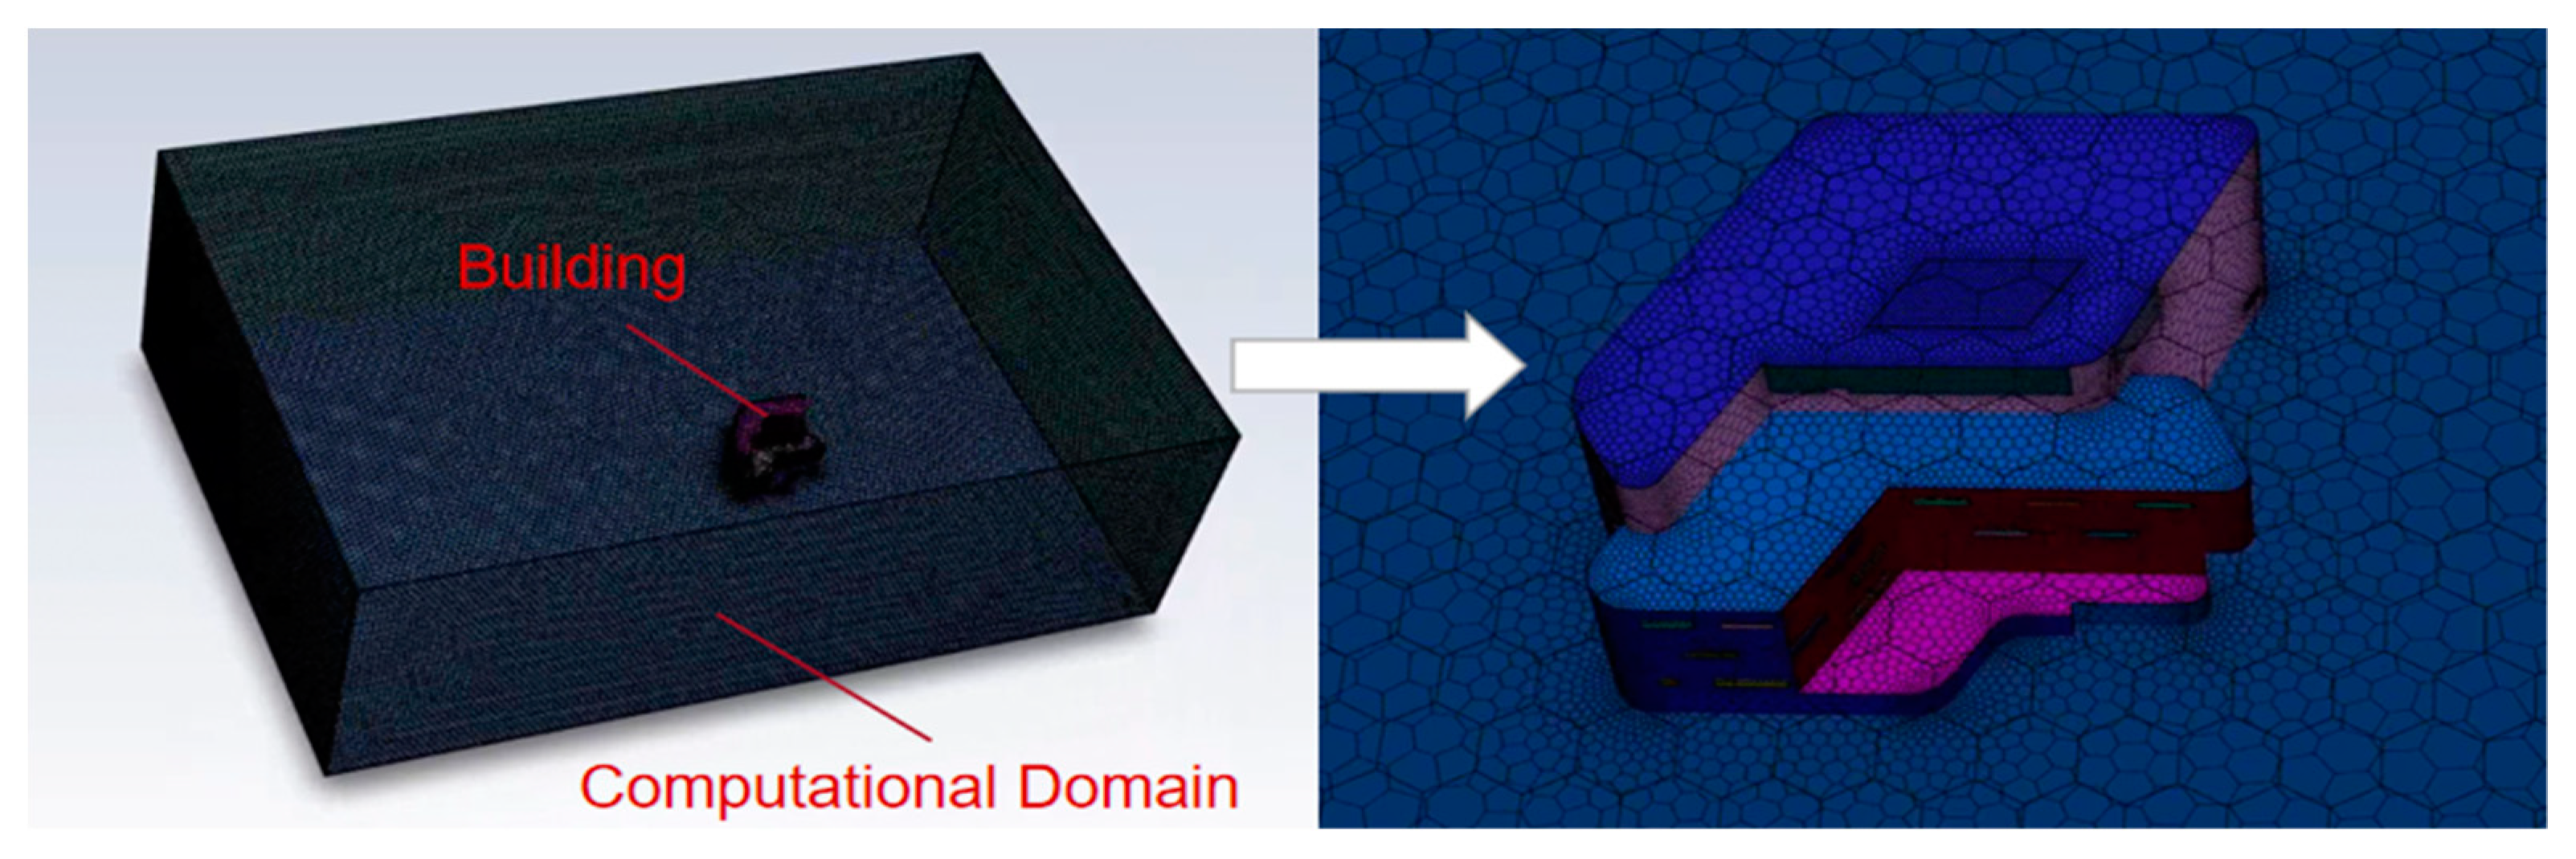
2.4. Computational Domain and Grid Generation

The computational domain was divided into outdoor and indoor models for the two-stage simulation, which could achieve accurate simulation results while reducing computing time. For the indoor environment simulation, the M2, F1, and F5 floors were chosen as representative since the crowd was more concentrated on the M2 and F1 floors, and we explored whether the temperature of the F5 floor met the requirements. The floor partitions and the main openings are shown in Figure 3. As shown in Figure 4, the dimensions of the computational domain in this study were determined as 366.4 m × 251.9 m × 137.4 m (length × width × height). Using the building height (H) as a reference, the distance between the inlet of the computational domain and the building was 5H, while the distance between the outlet and the building was 10H. The distance from the sidewalls and the top of the computational domain to the building surface was 5H.

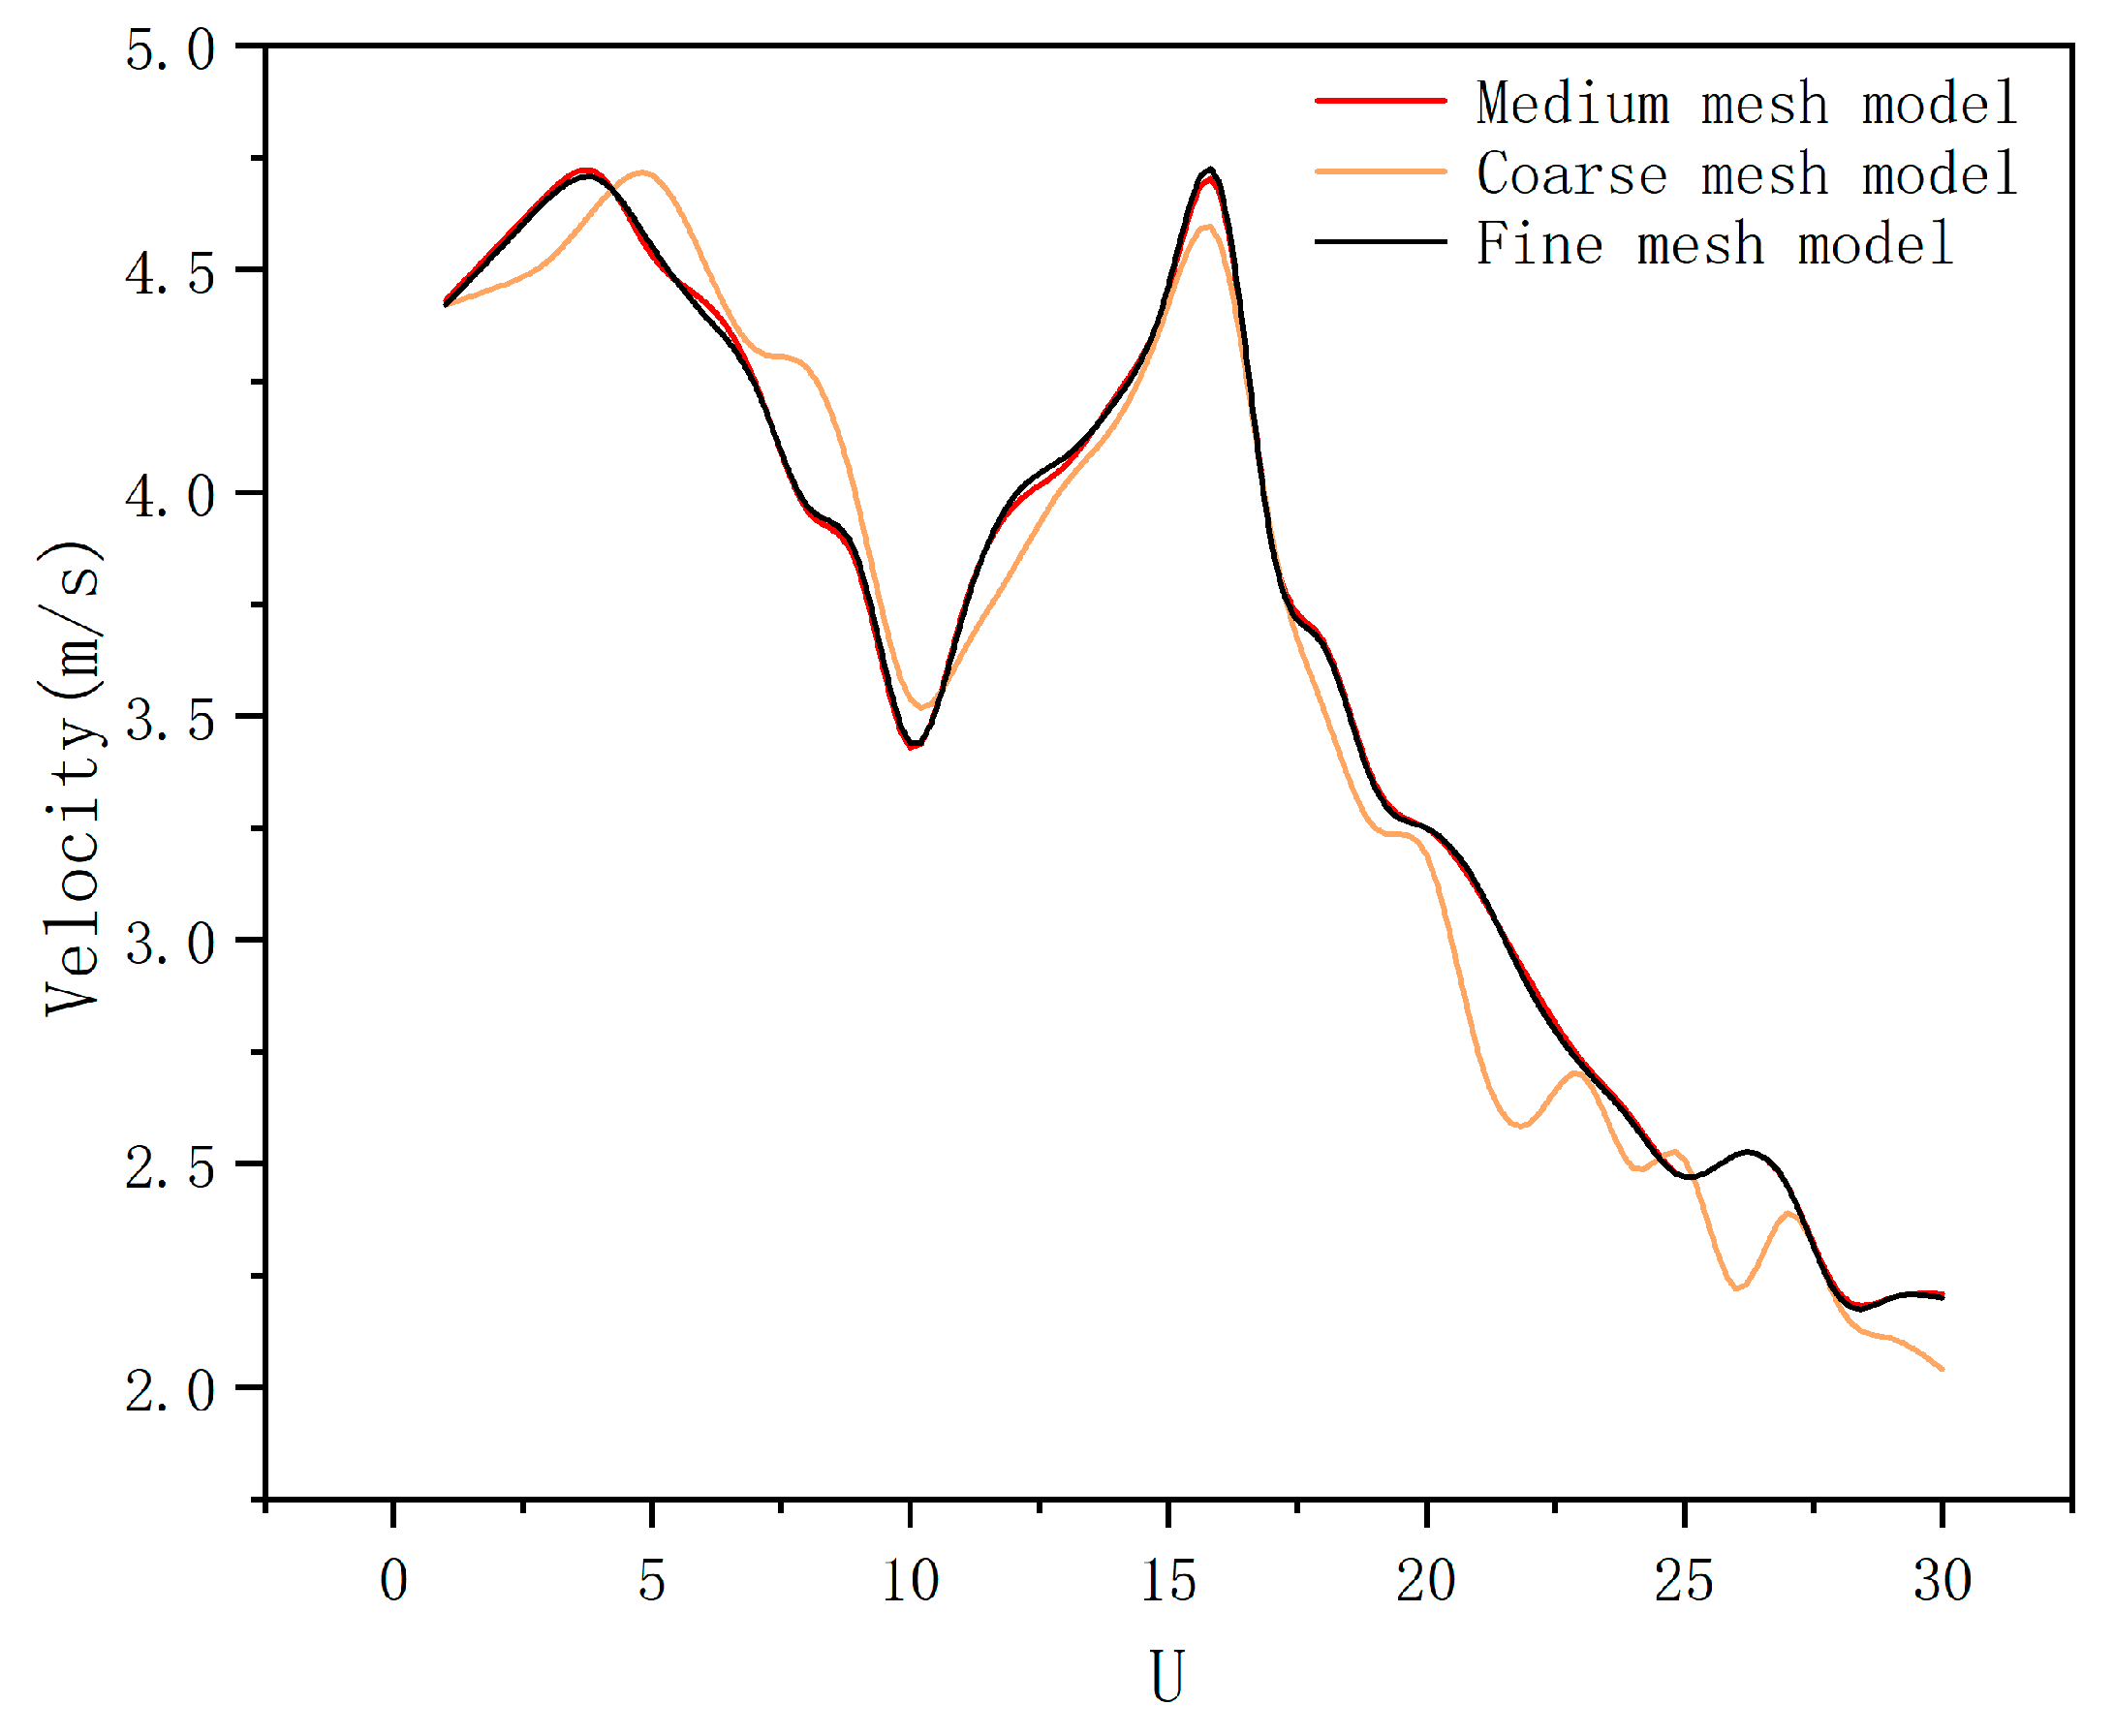
2.5. Mesh Dependency Test

An unstructured hexahedral mesh was generated in the computational domain with refined meshes close to the building and the openings on the envelope. The grid size of the openings in this study was less than 0.4 m. At least five boundary layers were generated at pedestrian heights (1.5 m) near the surfaces of the building and the ground. In order to validate the accuracy of the internal model, the mesh dependency test [37] was conducted to create three different mesh models: a coarse mesh model (mesh number: 597,709), a medium mesh model (mesh number: 1,206,857), and a fine grid model (mesh number: 2,421,152), where U is the relative value of the position coordinate and the length of the measuring axis. Figure 5 shows the velocity variation at the outlet reference point. It can be seen that among these mesh models, the medium mesh model presents a certain level of accuracy, as compared to the coarse mesh model. Therefore, the medium mesh model was selected, and the mesh model is presented in Figure 6.

3. Results and Discussion

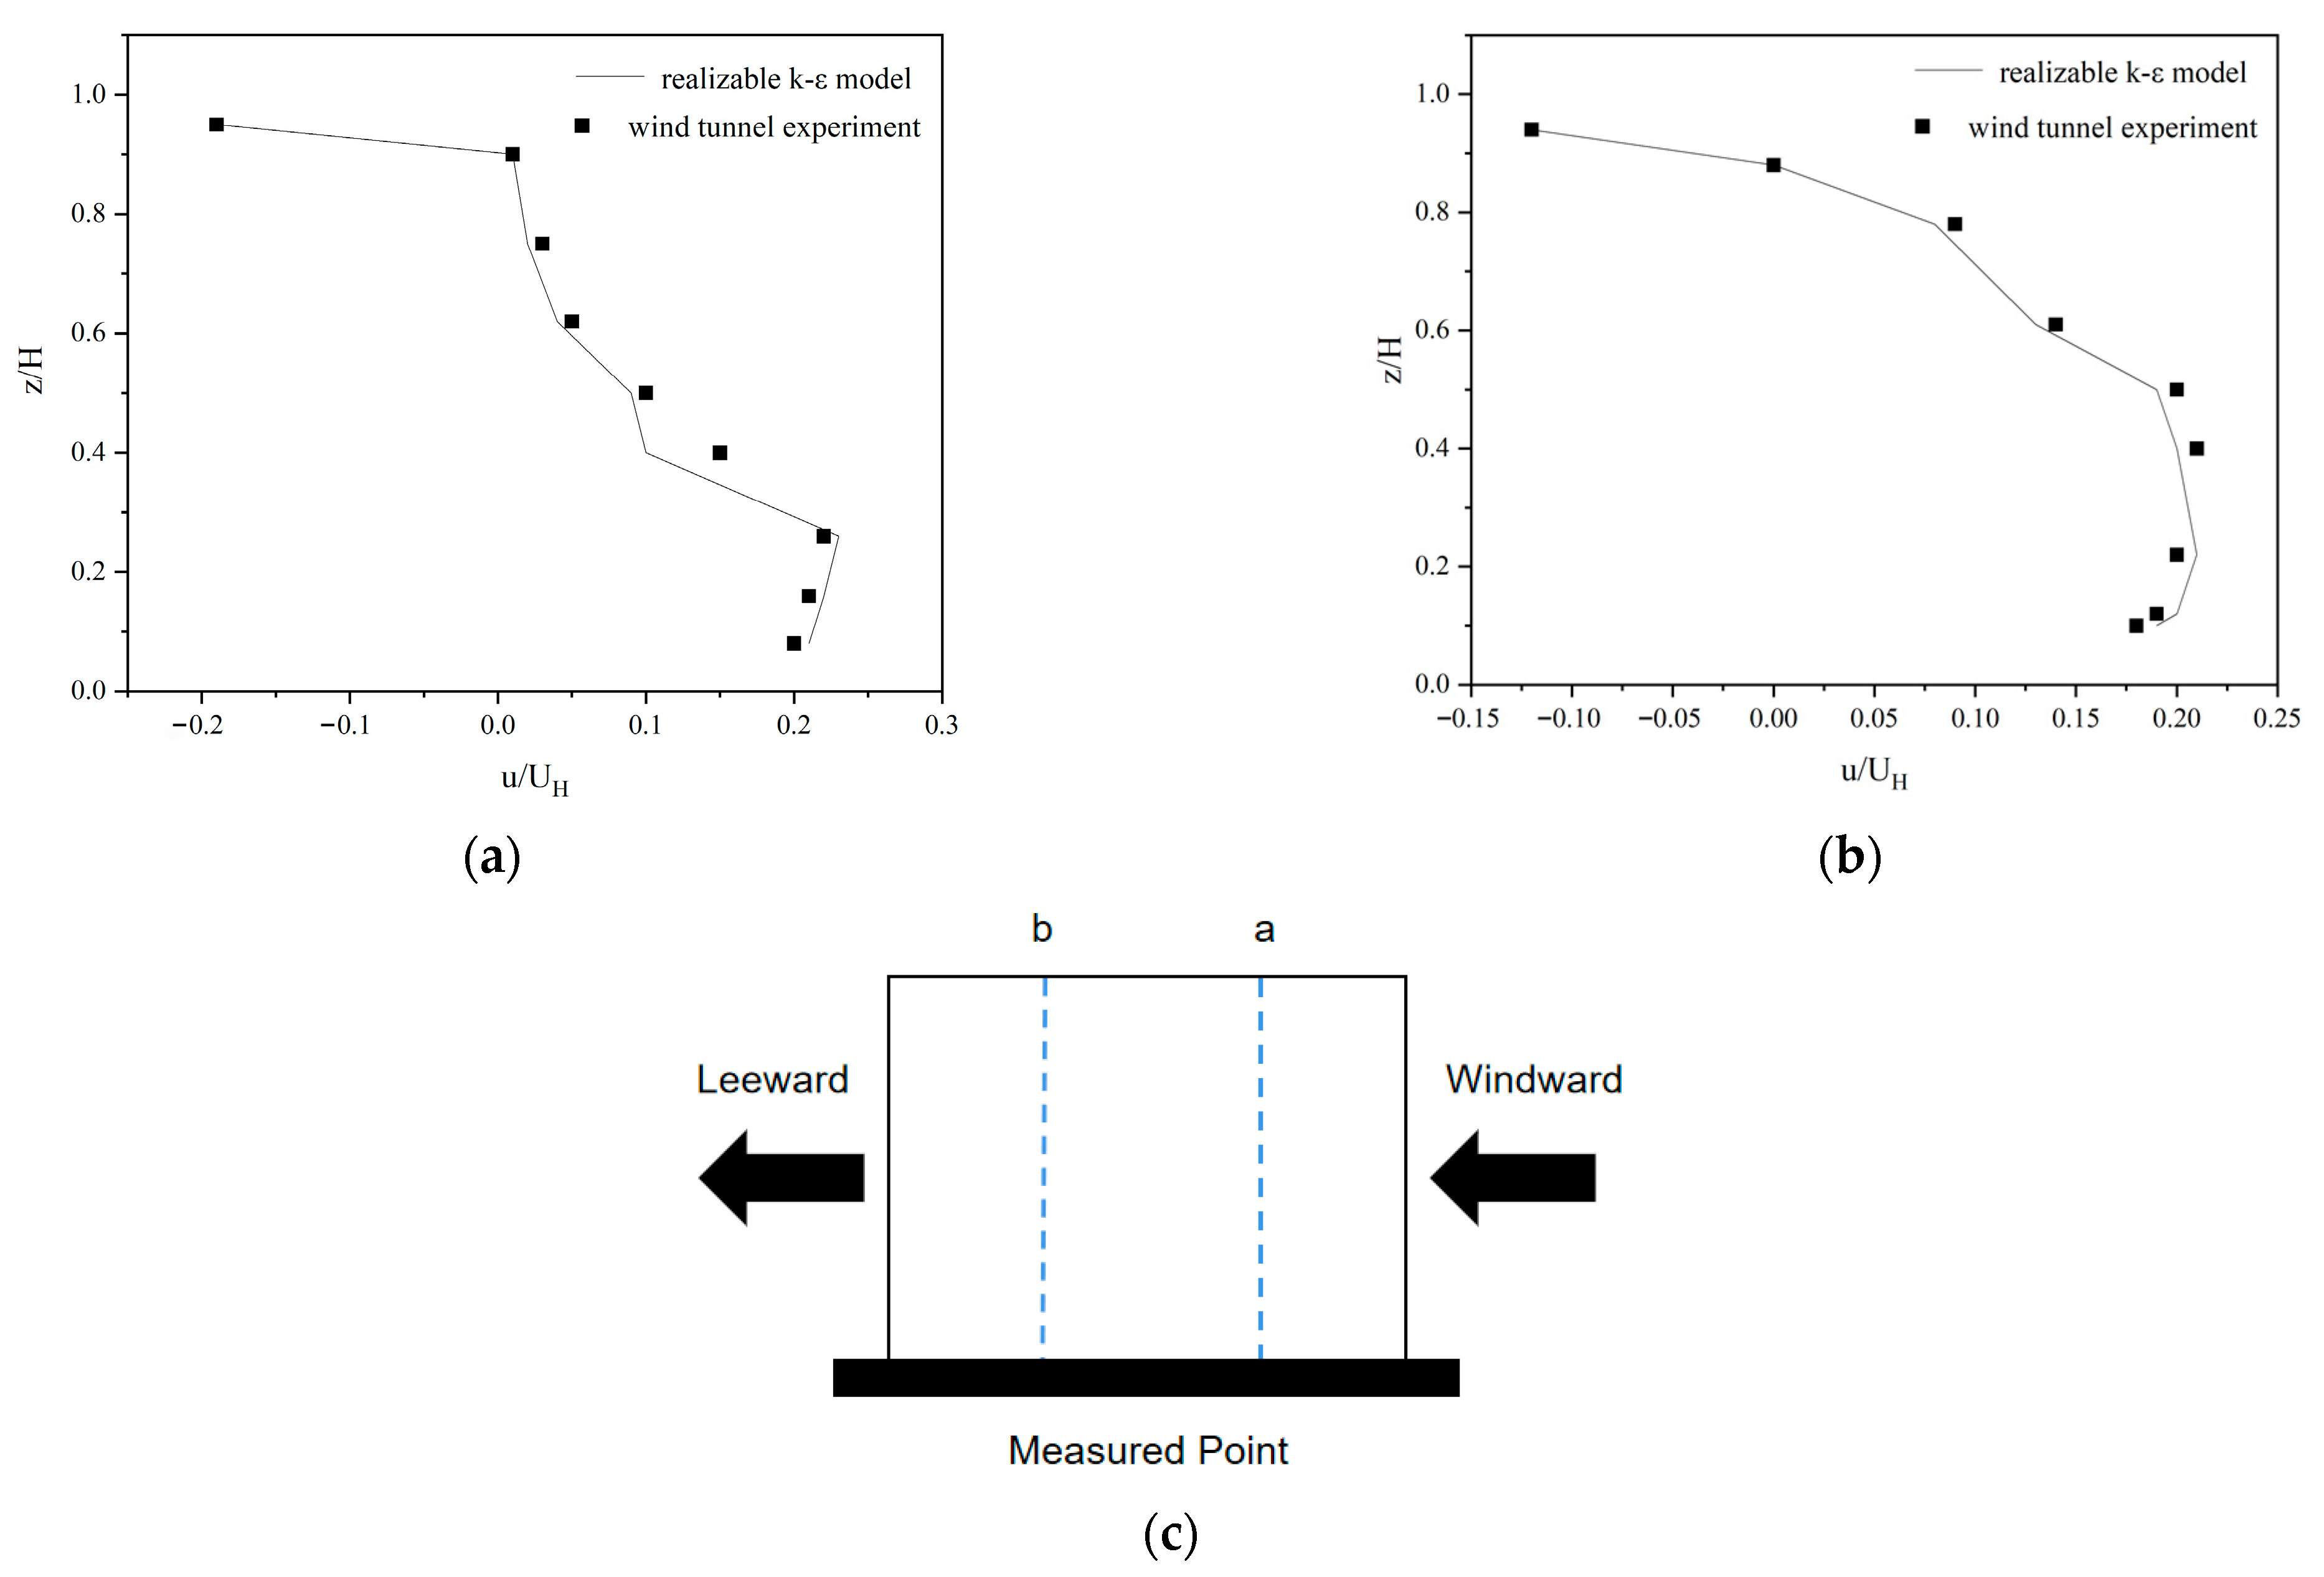
3.1. Validation of CFD Model

The CFD model used in this study was validated in recent studies, i.e., see Refs. [38,39,40]. Figure 7 shows the realizable k-ε model to simulate the airflow distribution of natural ventilated building with the air-inlet velocity (UH = 2.2 m/s) [41]. A comparison of a wind tunnel test [42] and simulated values of u/UH at different points in the building are shown in Figure 7, where u is the velocity at the measured point, u/UH is the relative velocity at the measured point against UH, z is the height of the measured point, H is the height of building, and z/H is the relative height of the measured point against the building. The results indicate that the simulated indoor flow field of the building and the experimental test results are consistent with each other when UH is 2.2 m/s. Therefore, the validation results prove that the CFD models is reliable to evaluate the natural ventilation performance in this case study.

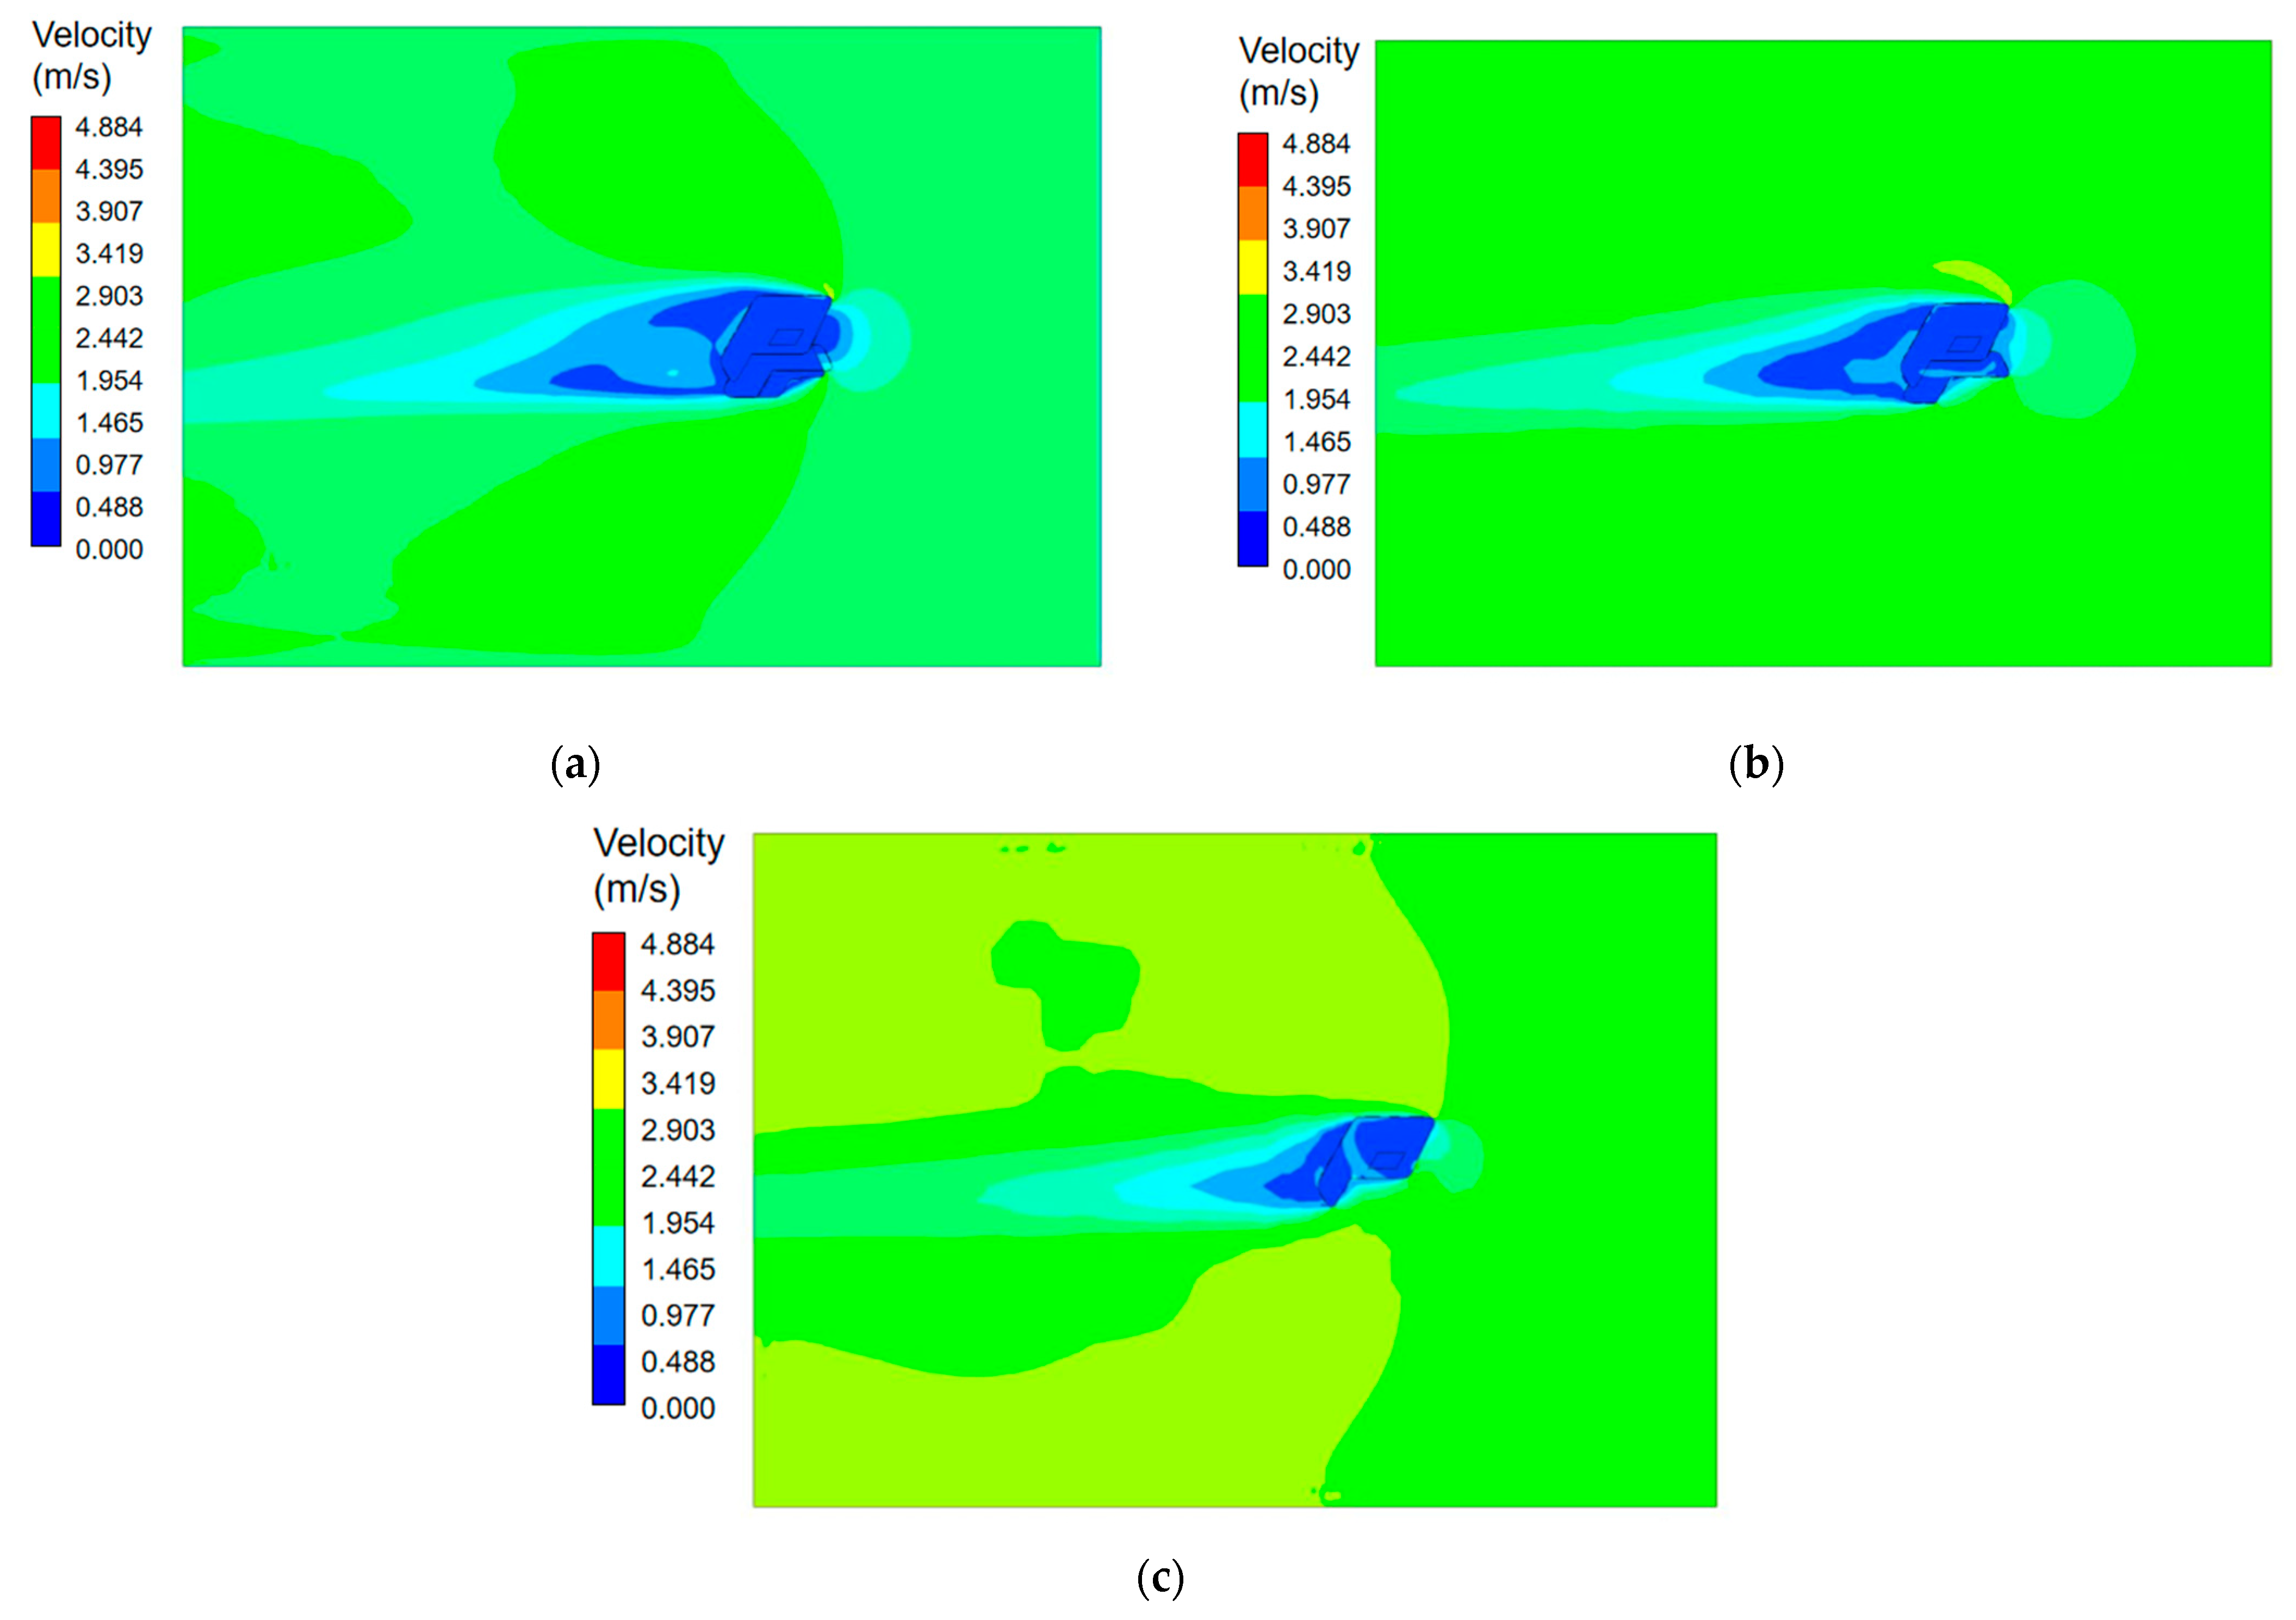
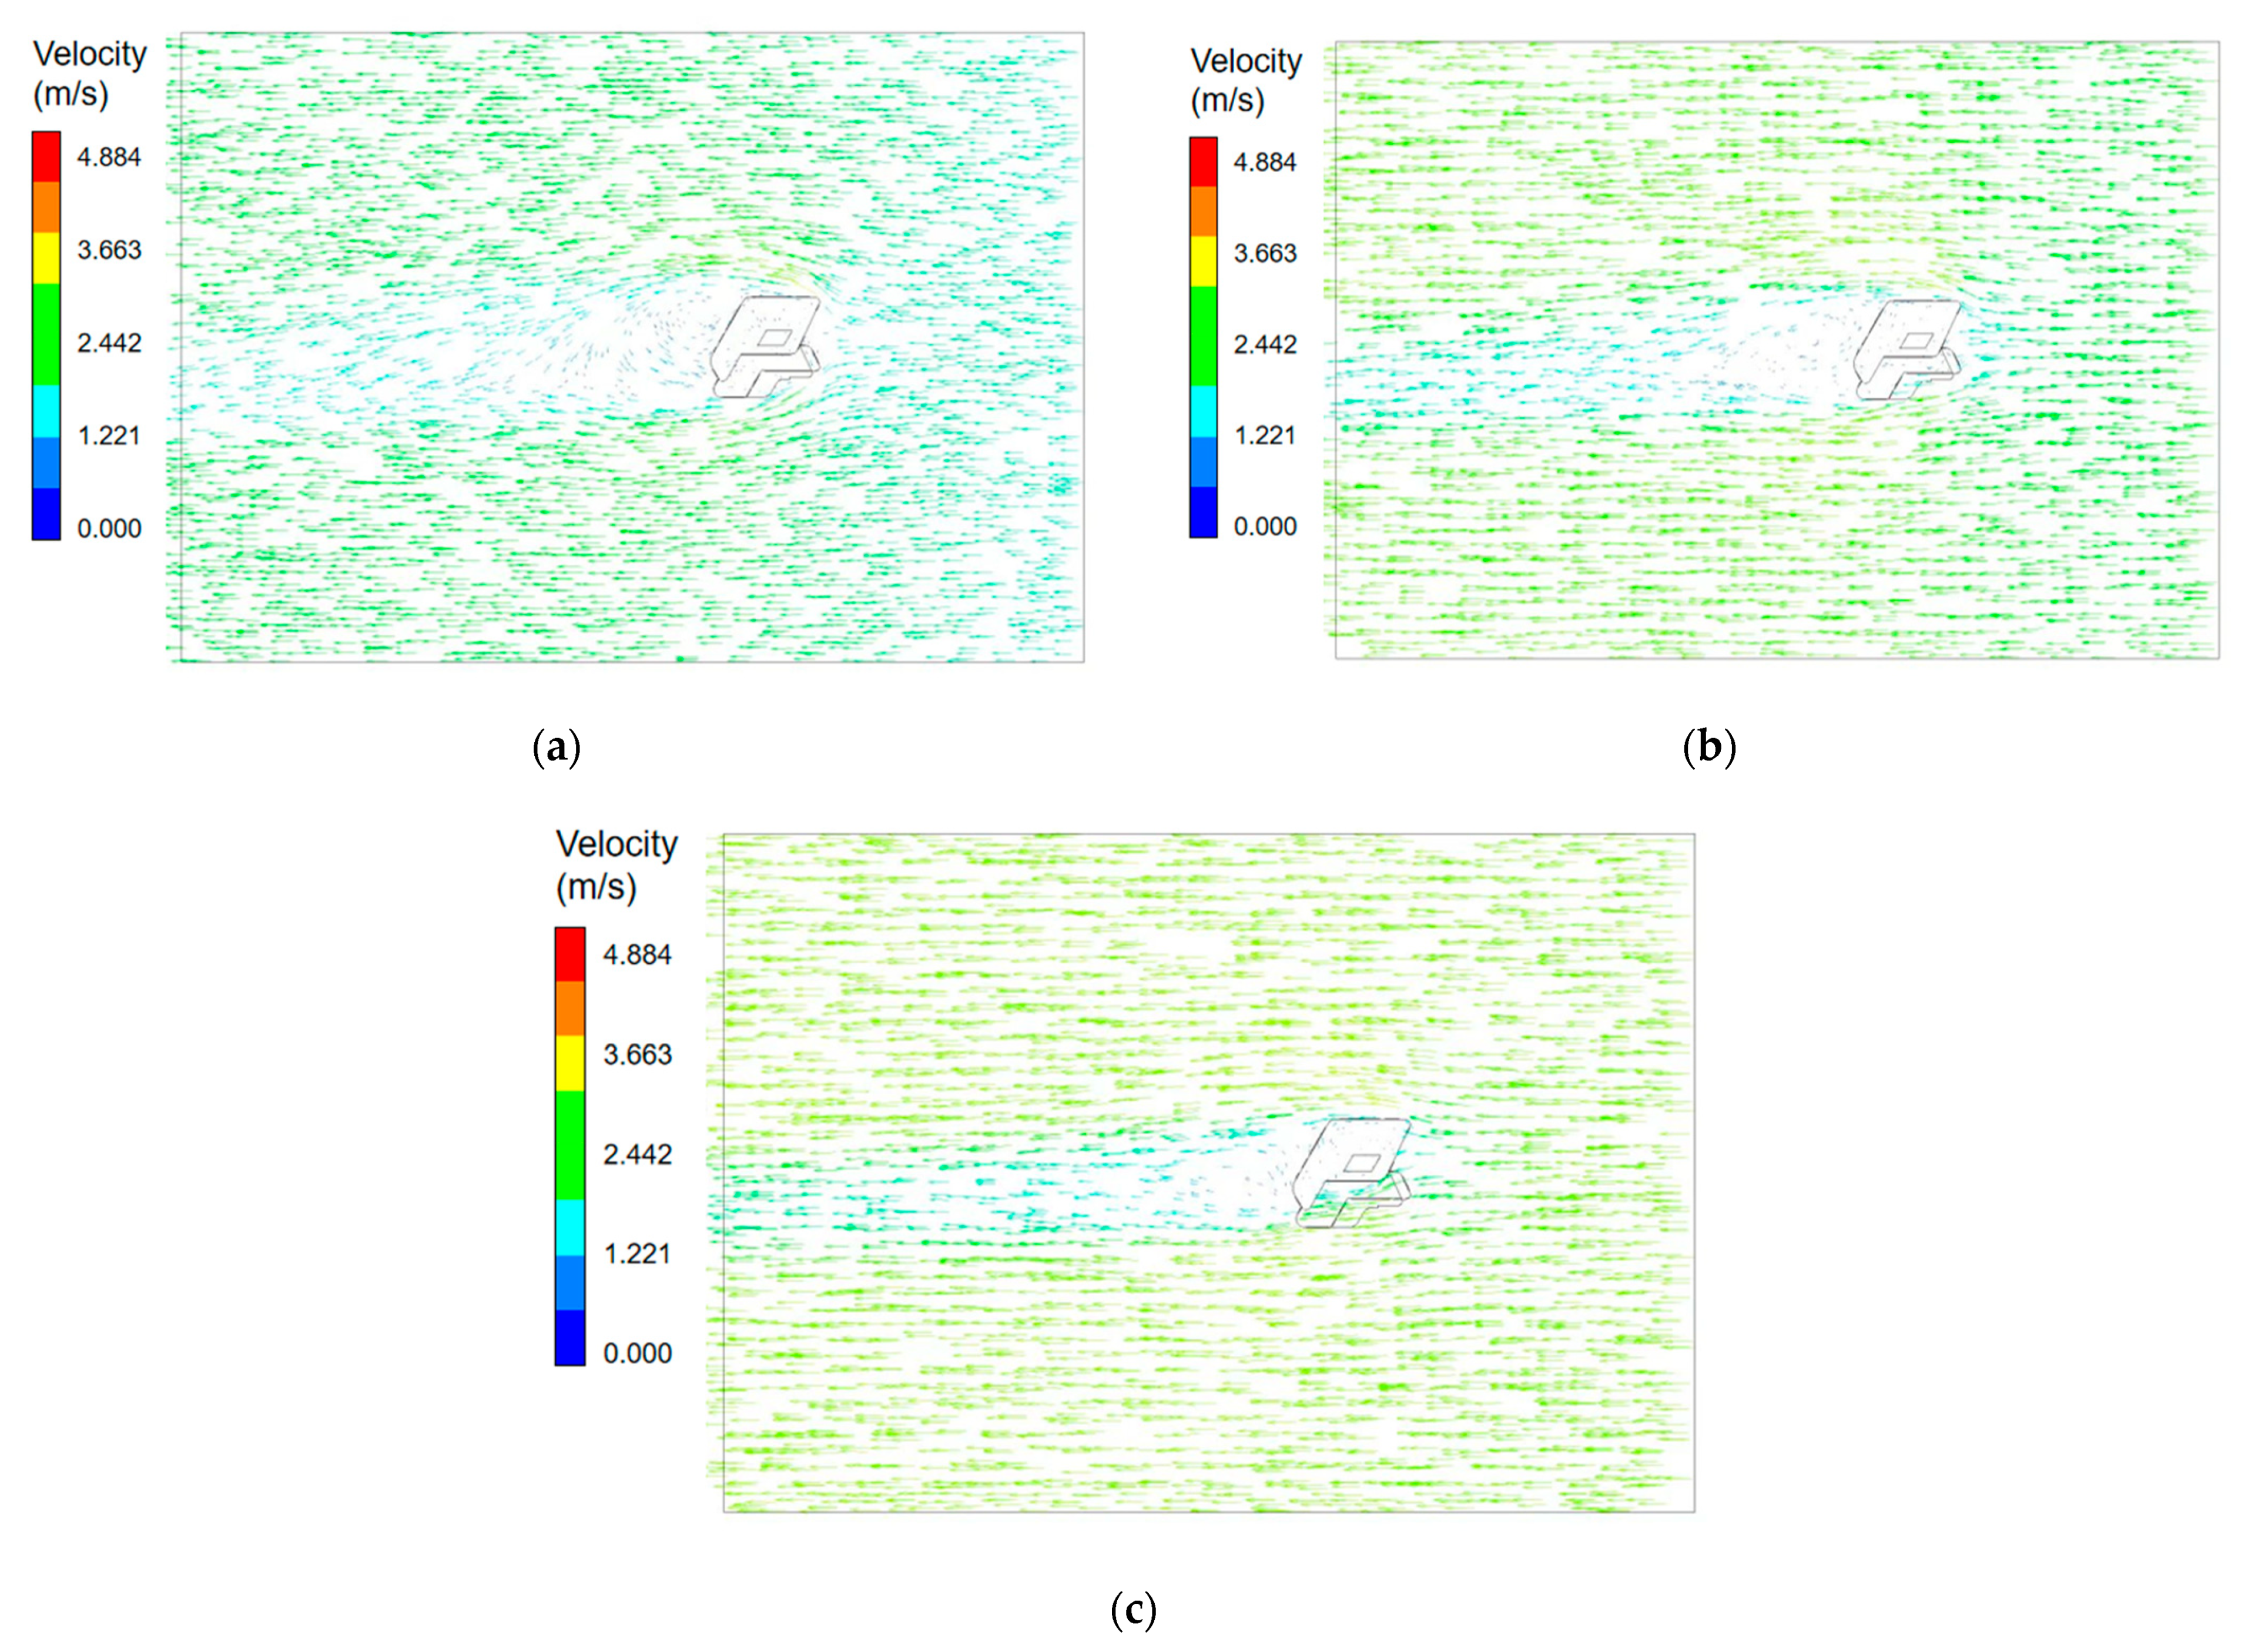
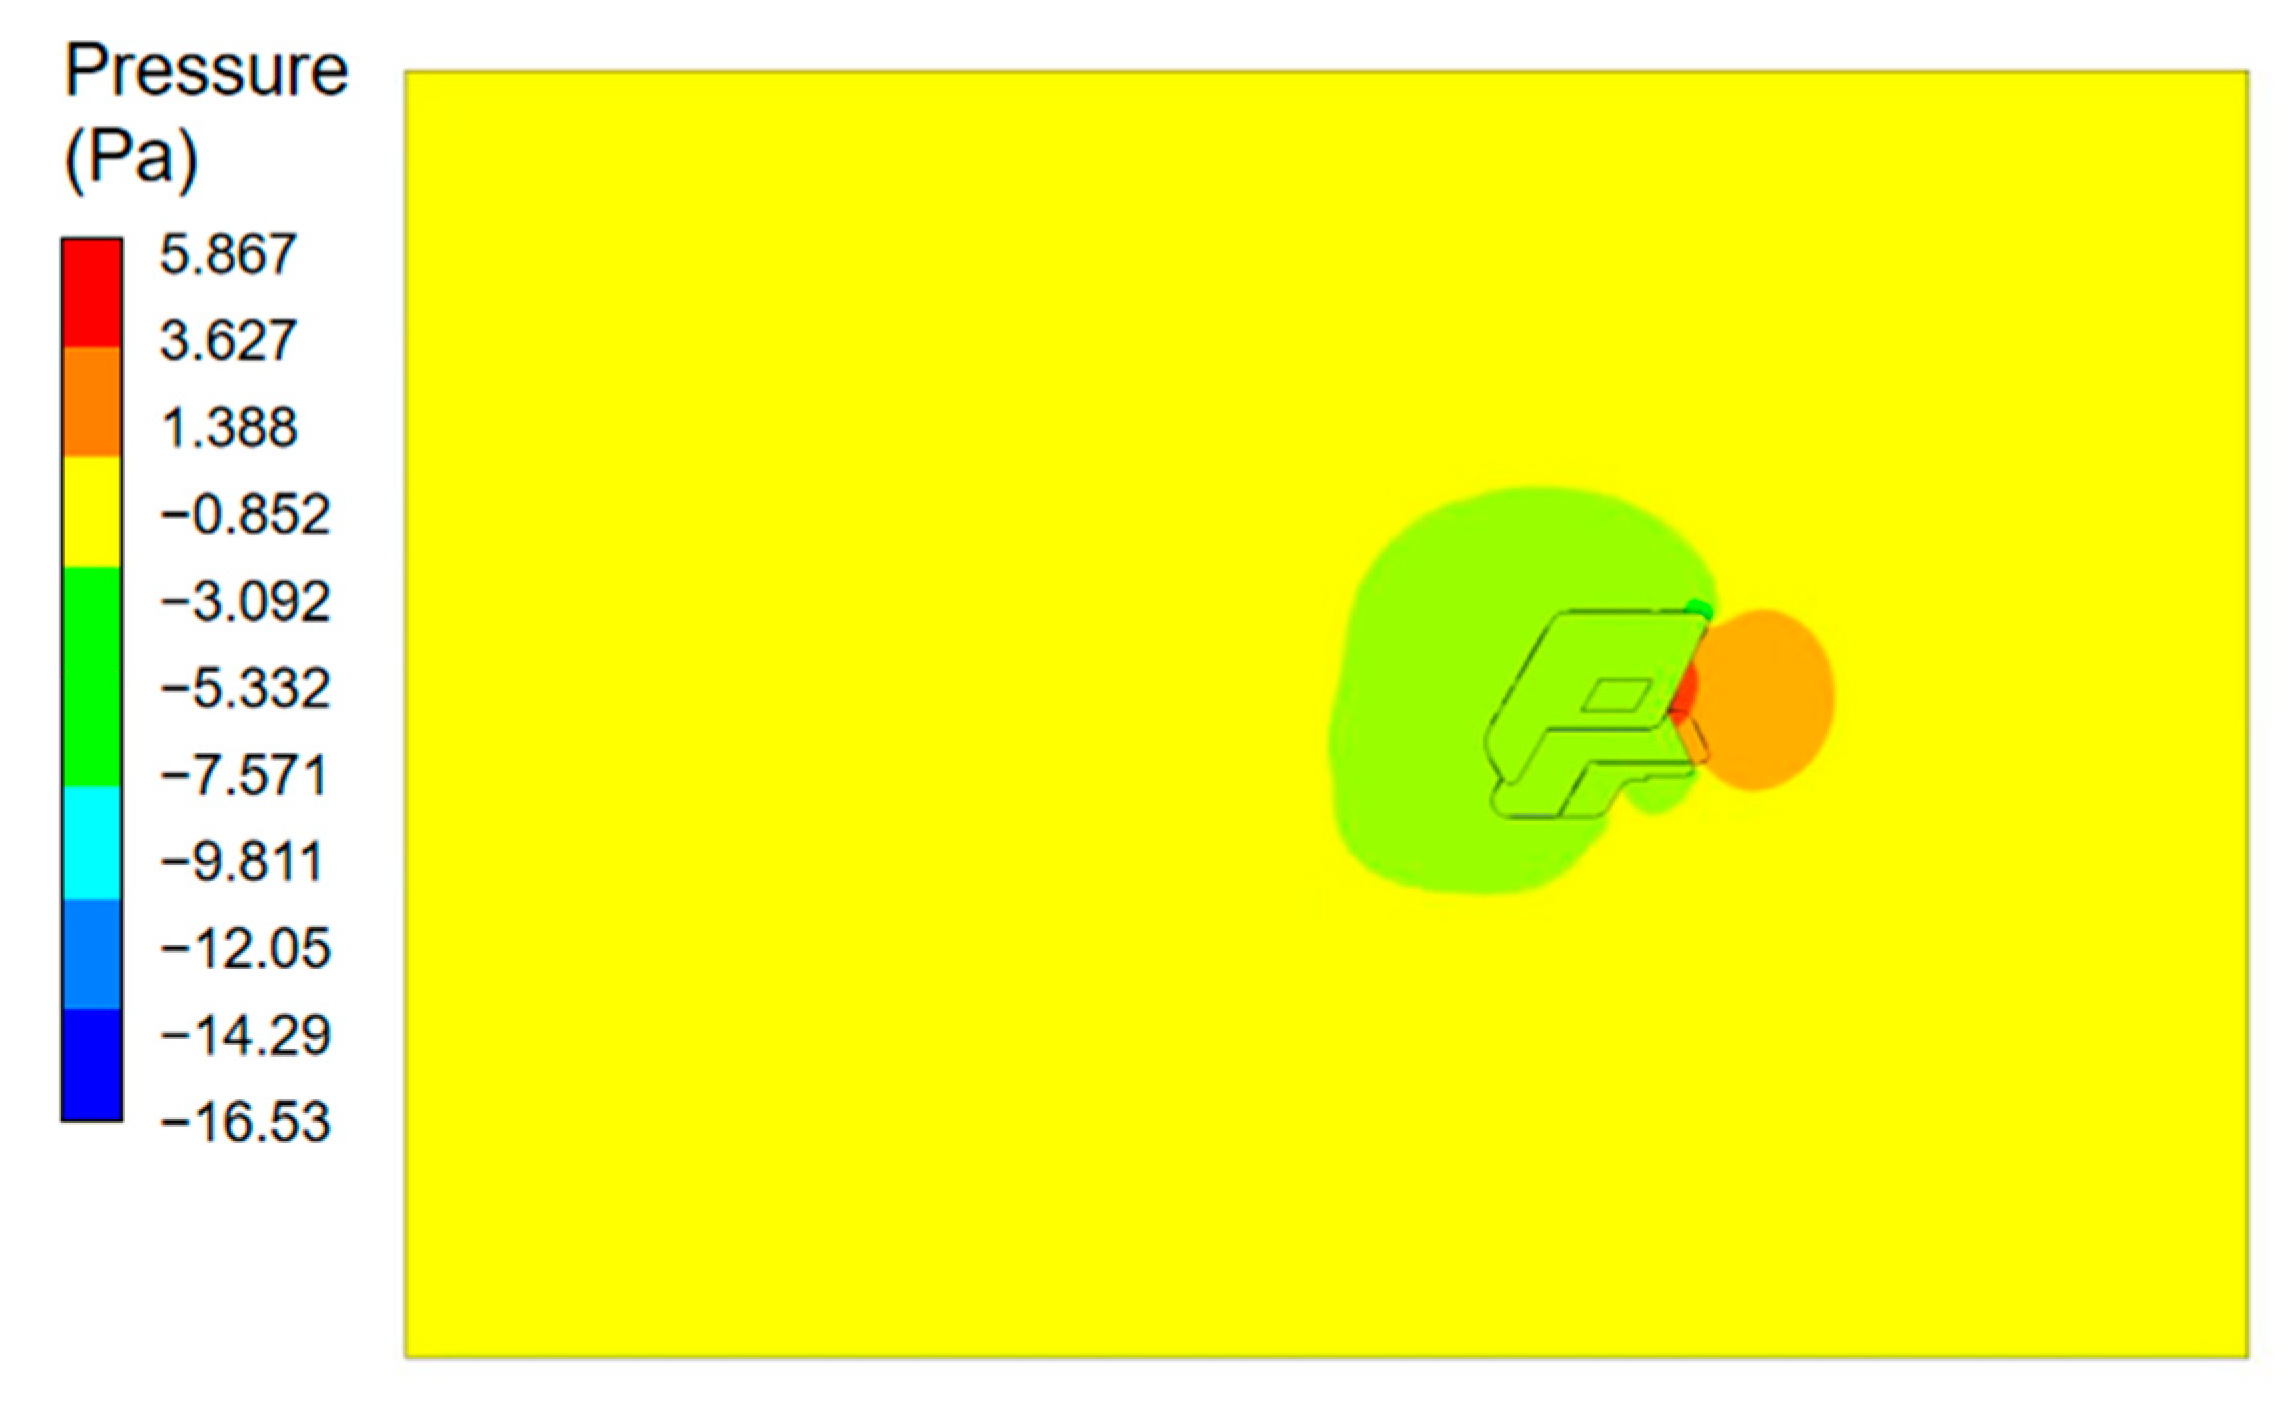
3.2. Results of Outdoor Flow Field

The contour and vector plot of the outdoor wind velocity in the Y-direction (building width direction) at the center of the building are shown in Figure 8. Figure 9 shows the results of different section views along the Z-direction at a distance of 1.5 m above the ground level. The results indicate that the airflow runs from east to west along the eastern wall due to the impact of the southeast wind. Indoor wind velocity variations range from 0 m/s (lowest) to 4.88 m/s (highest). The upstream airflow in the indoor area has a higher velocity, allowing air to flow smoothly from outdoor to indoor environments through the skylight, resulting in a natural ventilation in the atrium. Due to barrier effect of the building’s east wall, the airflow downstream progressively becomes a horizontal flow with an approximate angle of 0 degrees to the wall surface. The variable wind directions and the small pressure difference between indoor and outdoor environment result in inadequate external conditions for natural ventilation at the east windows in the downstream area. Meanwhile, the wind velocities of the areas farther from ventilation openings are lower. The effects of natural ventilation are better on floors that are nearer the skylight, while the F1 floor is least influenced. In order to improve indoor air quality during the midseason, it is recommended to increase the opening area on the F1 floor or open more windows to introduce fresh air. As presented in Figure 10, it can be observed that the wind velocity is higher at the south and north exit positions of the building, which may have an impact on pedestrians in the office area. The outdoor wind is obstructed by the building, resulting in airflow vortices forming around the south and north exits and the leeward side of the building’s eastern wall.
The distribution of positive and negative pressure zones around the building is shown in Figure 11. The maximum static pressure on the windward side is 5.87 Pa, while on the leeward side, it is −0.53 Pa. The pressure difference between the front and back of the building is 5.31 Pa, which exceeds 5 Pa. The building’s front and rear are under different pressures, which promotes air circulation and improves the efficiency of natural ventilation.
The wind velocities at each window on the building envelopes were determined by the simulation results of the outdoor wind velocity and were used to set up the boundary conditions for the indoor environment simulation.

3.3. Results of Indoor Flow Field

Based on the complex design of the building with a central atrium, three different heights of the simulated office building were selected for the analysis: F1 floor (4.9 m), M3 floor (11.65 m), and F5 floor (22.9 m). All windows and the doors of functional rooms on each floor were open. Due to the complexity of the structure and floor layout, the atrium was simulated separately to obtain detailed velocity and temperature distribution results.

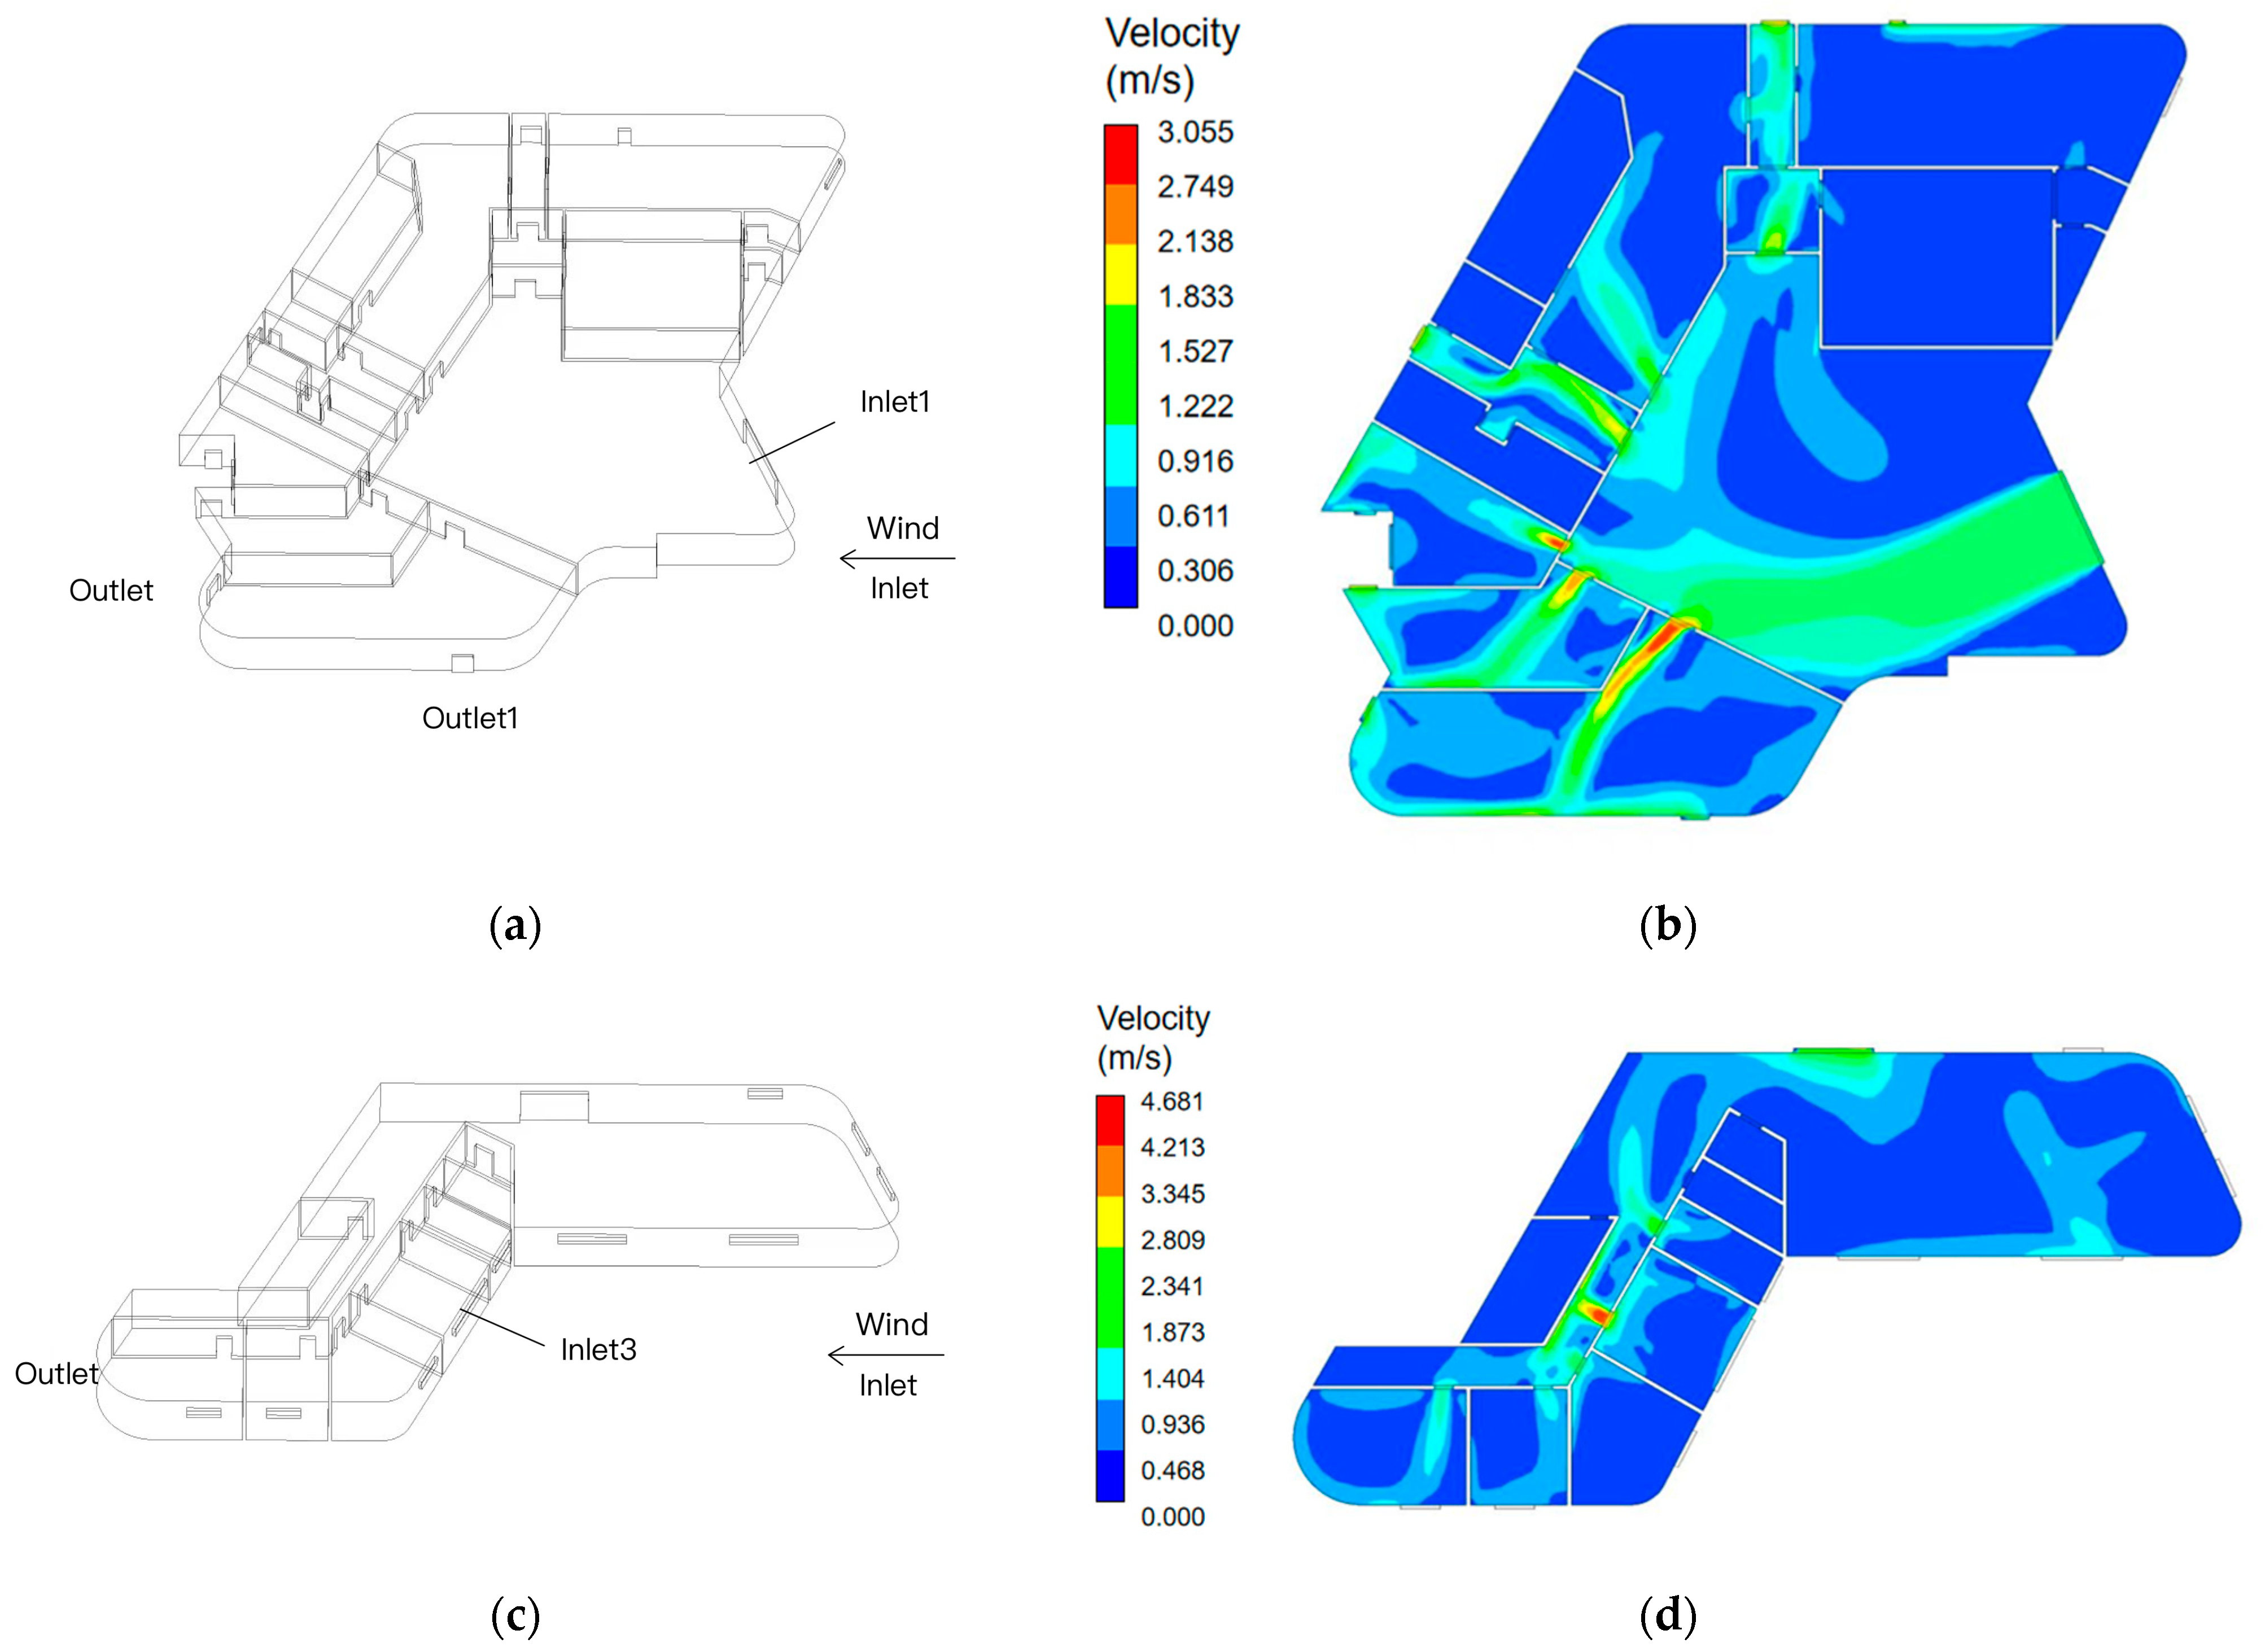
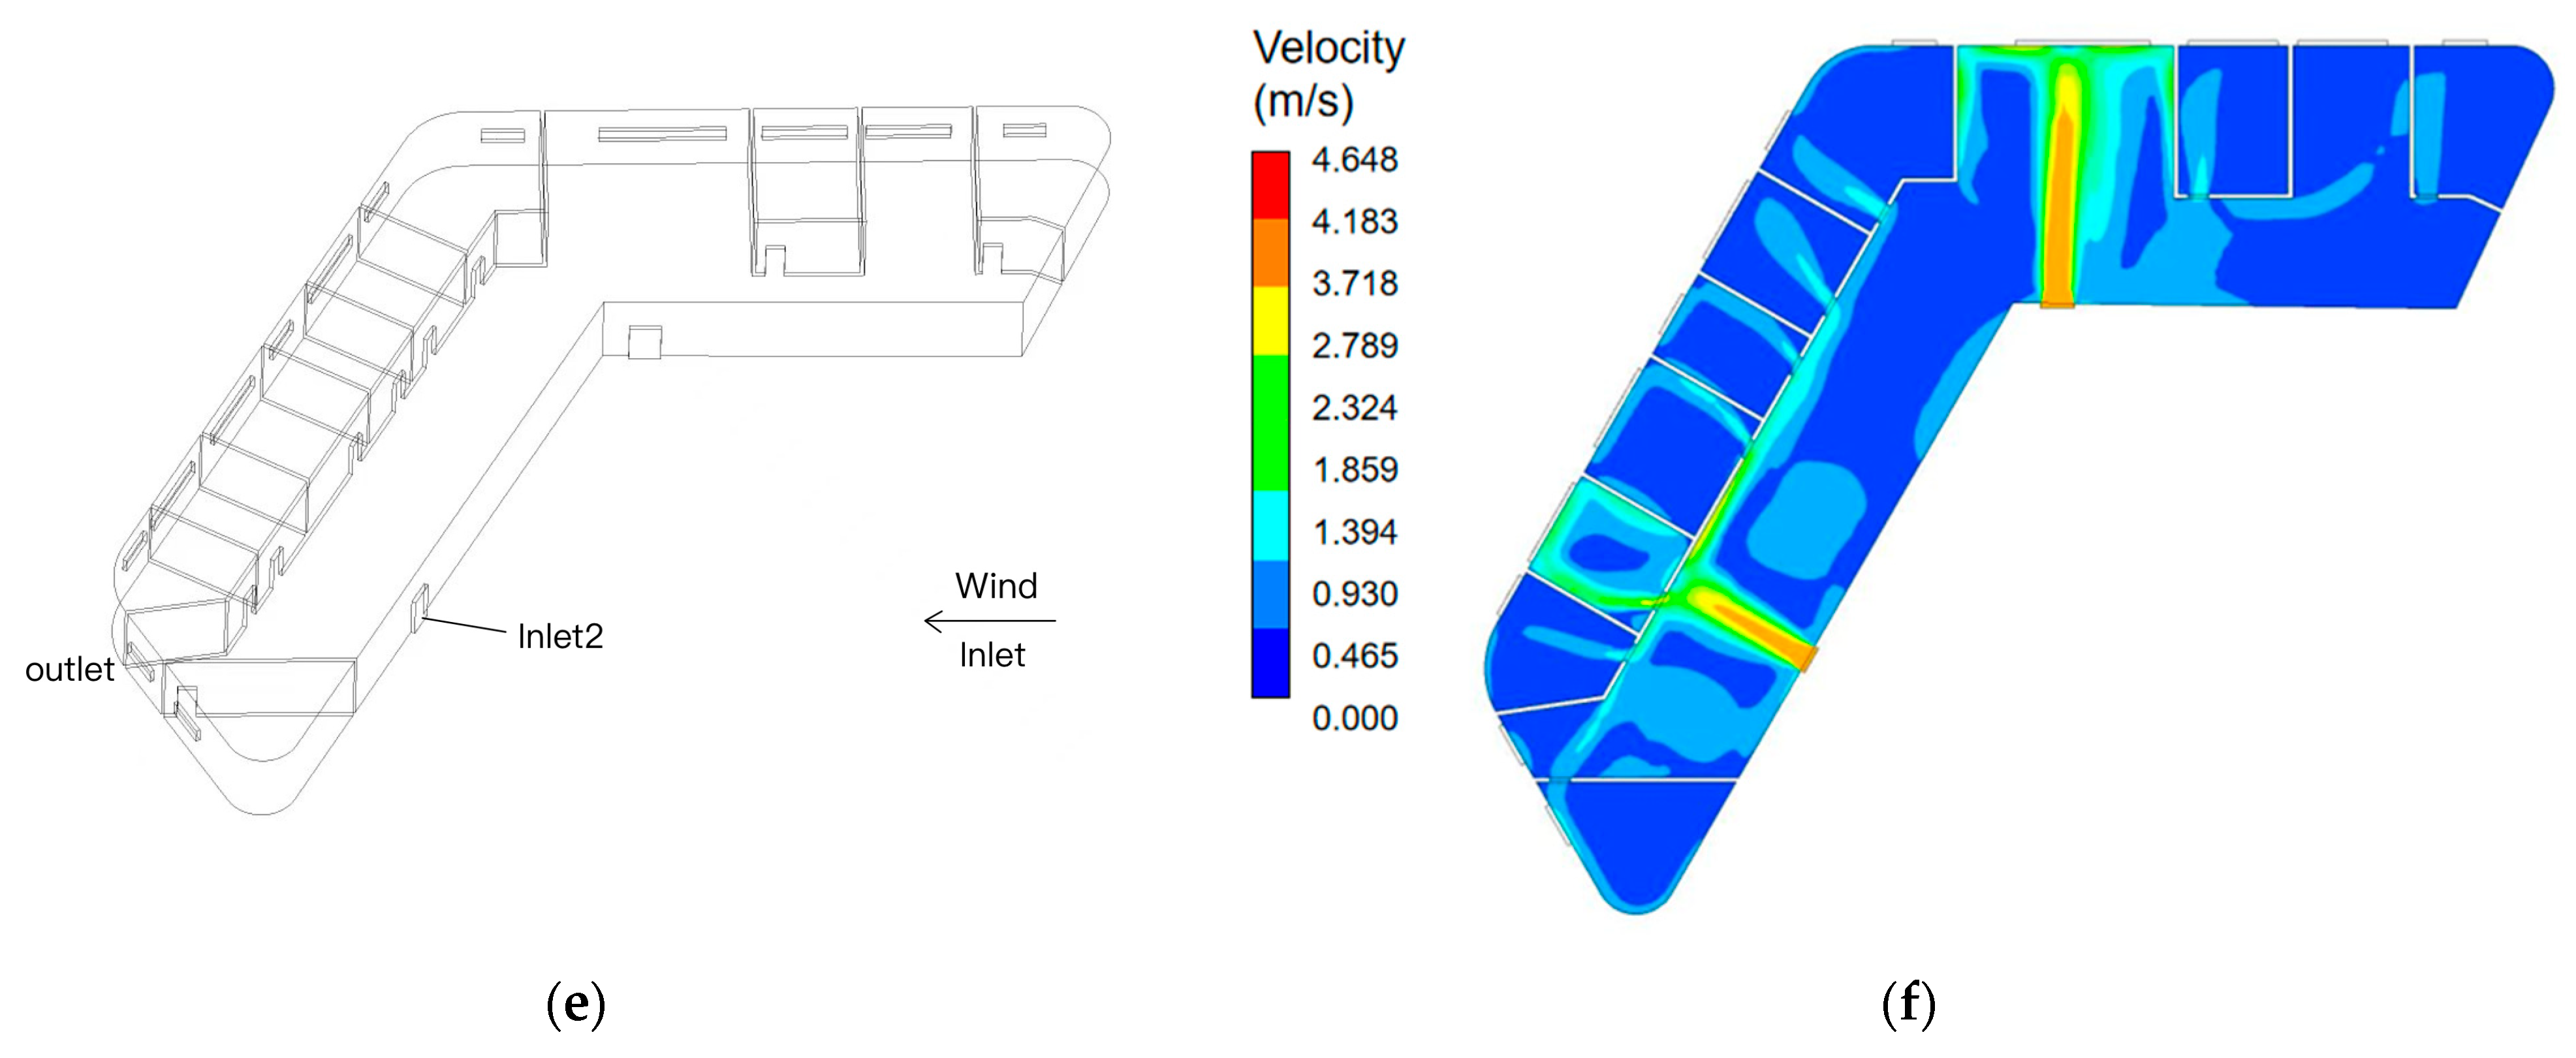
3.3.1. Indoor Airflow Distribution on Each Floor

According to the outdoor simulation results, the wind velocities at various windows on each floor were obtained, and the inlet air velocity was set up as shown in Table 2. The distribution of the air velocity for each floor is shown in Figure 12. The results show that the average wind velocities on the F1 floor, M3 floor, and F5 floor is 0.43 m/s, 0.44 m/s, and 0.47 m/s, respectively, and the average wind velocities of all floors are in the comfort zone. These wind velocity values are within the acceptable and observable wind velocity range from 0.25 m/s to 0.5 m/s [43]; the evaluation of the indoor air velocity is shown in Table 3. The highest wind velocity is 4.68 m/s, occurring at the entrances and exits, which can meet the basic comfort requirement defined by GB 50189-2015 [44].
From the wind velocity distribution, the results show that the entrance areas of the rooms on the F1 floor have higher wind velocities as compared to other areas of the floor.
The airflow at the entrance accelerates as it passes through narrow passages, creating accelerated air channels. This problem can be remedied by closing the doors, and it has no substantial impact on occupants’ comfort. The wind velocity uniformity on the F1 floor is low, and the region around the auditorium has a huge stagnant zone and dead zones for ventilation, requiring forced ventilation to achieve optimal comfort. A higher suction force can be caused by the combined impact of wind and temperature pressure on the F1 floor when the skylights are open.
According to the results from the wind velocity distribution, it can be seen that on the M3 floor, the south corridor and the northeast long corridor form an accelerated air channel with a maximum wind velocity of 4.3 m/s. This area corresponds to the restrooms on the leeward side, which has worse air quality. Great interior air quality is ensured by the fast airflow in this space, which may swiftly remove contaminants and stop their diffusion. The airflow distribution on the F5 floor is found to be rather consistent according to the wind velocity distribution, and there is noticeable air movement in all the rooms. Due to its proximity to the skylight exhaust, there are hardly any large stagnant zones or dead zones for ventilation. Additionally, the southeast openings offer beneficial ventilation to the primary functioning public spaces. Due to the blockage of the structure, some external wind rushes around the building and enters the floors through the south-facing apertures. Meanwhile, the west and north functional areas are improved by the internal circular corridor, and the east and south functional spaces display considerable air movement, leading to better natural ventilation.

3.3.2. Indoor Temperature Distribution on Each Floor

The temperature distribution contours for each floor are shown in Figure 13. When the skylights are open, the average temperature on each floor varies from 19.8 to 23.6 °C, which can meet the basic comfort requirement defined by ASHRAE Standard 55-2004 (namely, 18−24 °C) [45]. The F1 floor has a maximum temperature of 22 °C, the M3 floor of 26 °C, and the F5 floor of 27 °C. Higher temperatures are found in places distant from the occupied zones on the lower floors where external air enters, with a temperature differential of roughly 5 °C from the entrance. However, a sufficient walking distance can alleviate the discomfort caused by the temperature difference. The temperature differential between the F5 floor and the outside air exceeds 6.7 °C as a result of the vertical temperature stratification. Although temperatures in high-rise zones without external air introduction are greater, temperature changes within the same floor are modest, resulting in no substantial discomfort for walkers. The horizontal and indoor–outdoor temperature differences are unusually large on the west side of the M3 floor, where there are no windows connecting to the outdoors. The east-side research area has adequate air circulation and a comfortable temperature sense of roughly 20 °C. The average temperature in the indoor high-rise floors is nearly 21.7 °C, suggesting a high degree of comfort and meet the low-carbon building evaluation standards [46].

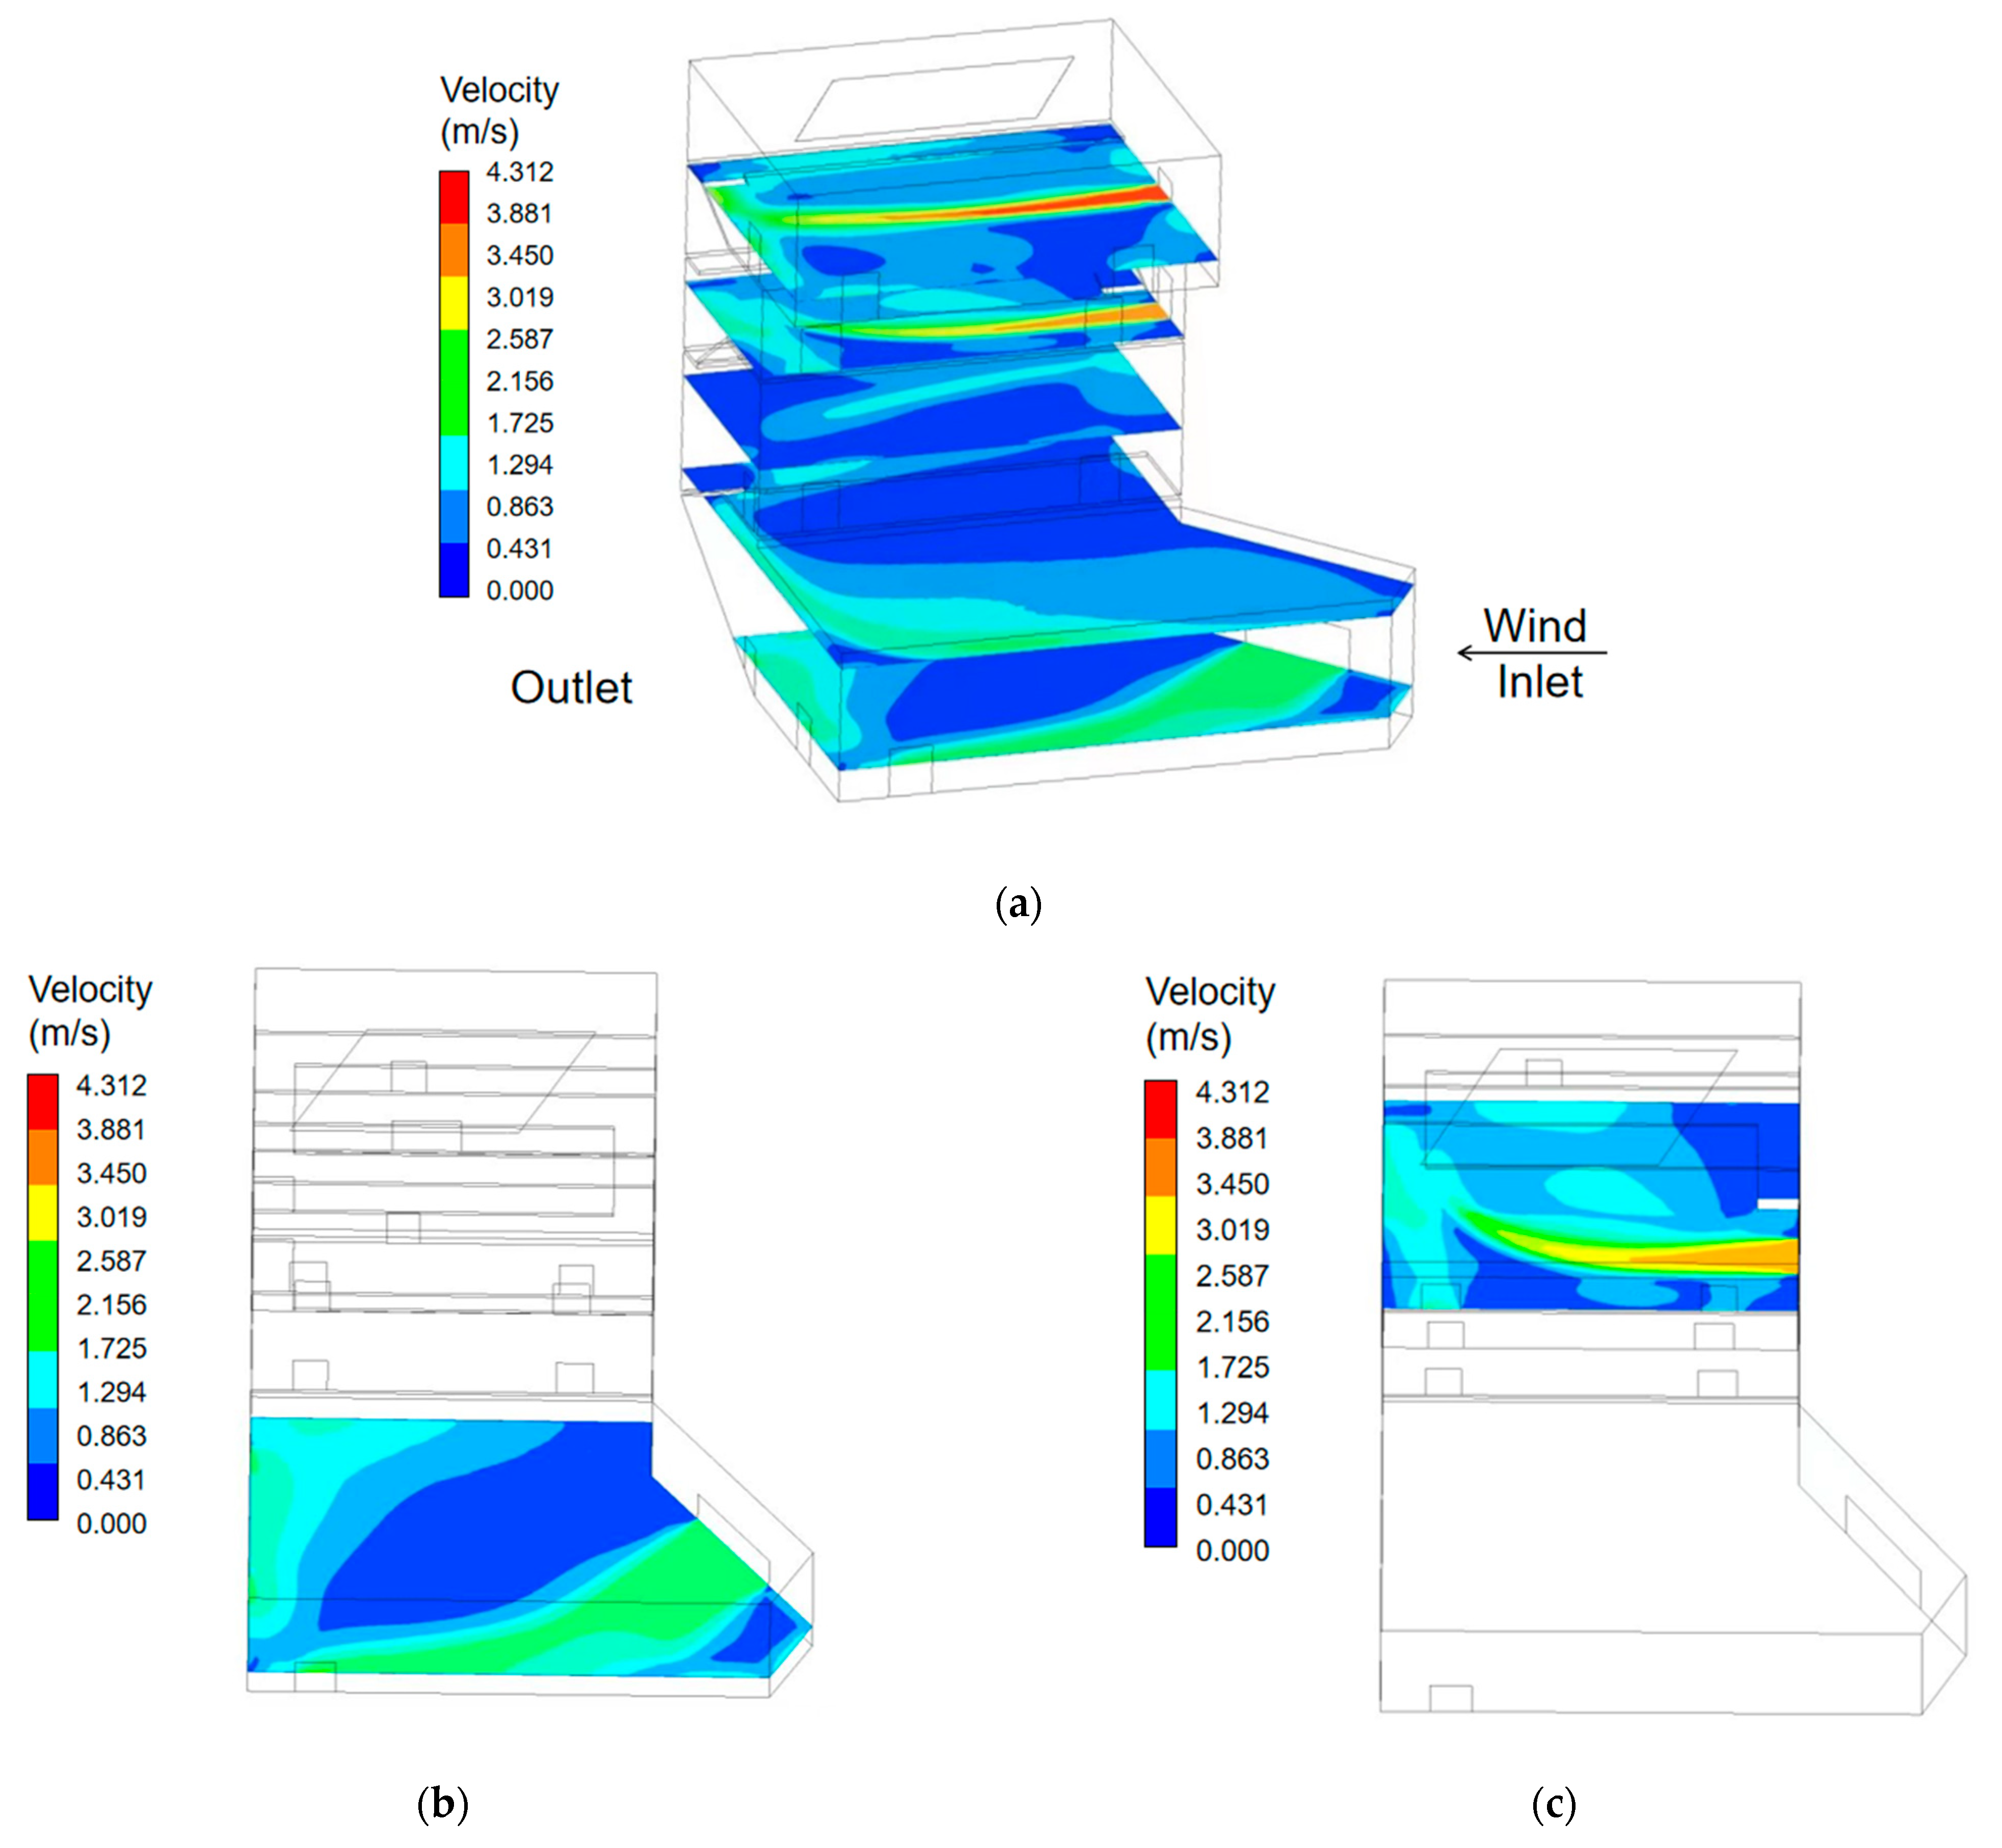
3.4. Results of Flow Field in the Atrium

3.4.1. Velocity Distribution

The velocity distribution at the 1.5 m pedestrian level in the central atrium of the building is shown in Figure 14. According to Figure 14a, the vertical upward airflow is consistent and well-organized when the skylights are open. The upward airflow increases the wind velocities around the atrium. As the building height increases, the wind velocity on each floor also increases. From the results given in Figure 14a, the wind velocity distribution in the interior central atrium region is unequal. The high-velocity zones are mostly centered along the eastern border of the F1 floor’s central atrium and the middle section of the F5 floor’s central atrium. The maximum wind velocity on the F1 floor is found on the southern side of the eastern central atrium, reaching 1.87 m/s. On the F5 floor, the maximum wind velocity is observed in the eastern central atrium, reaching 3.12 m/s. The low-velocity regions are concentrated in the rest areas on the north and south sides, with an average wind velocity close to 0.5 m/s. This satisfies the criteria for occupant comfort during activities by giving the occupants a cozy atmosphere without creating a drafty feeling.
From Figure 14b,c, it can be seen that the average wind velocity in the central atrium area on the F1 floor is roughly 0.86 m/s, while the total wind velocity on the F2 floor is approximately 0.58 m/s. The central atrium area on the F5 floor has a higher total wind velocity than that of the F2 floor, with an average of roughly 1.09 m/s. The central atrium area is influenced by the chimney effect, resulting in higher wind velocities, with a maximum velocity of approximately 4.32 m/s. Higher wind velocities are experienced on the windward side of the central atrium space, which is connected to the outside world, suggesting effective ventilation. The wind velocities are significantly lower on the leeward side due to coupled wind and thermal effects, although they rise near corridors and small tunnels. In general, the influence of external airflow on indoor room wind velocities is minor when compared to the effect on the central atrium area. Figure 14d shows the wind velocity of the central atrium in the Y-direction (along its width) varies from 0.40 m/s to 1.65 m/s. Lower wind velocities are found in the middle area of atrium, while higher wind velocities are seen in the vertically linked portions on both sides and near the top exhaust vents, reaching a maximum velocity of roughly 4.3 m/s. Significant vortices are also visible close to the top exhaust vents. The wind velocity varies in the depth direction (along the length) from 0.42 m/s to 1.73 m/s, as shown in Figure 14e. The results show that thermal pressure leads to a noticeable chimney effect for the atrium, which causes more air to travel vertically upward along the height of the building and helps improve natural ventilation in the atrium.

3.4.2. Temperature Distribution

The temperature distribution analysis focused on the thermal environment changes in the central atrium and its connected spaces. The temperature distribution at a height of 1.5 m above the floor in each cross section of the central atrium is shown in Figure 15.
From the analysis, it is observed that the temperature increases noticeably from the F3 to F5 floors in the central atrium space. Figure 15a shows the temperature distribution on the F3 floor is relatively uniform, with an average temperature of approximately 21.4 °C. The temperature distribution becomes less uniform on the F5 floor, with temperatures steadily increasing from the peripheral towards the center, reaching a maximum temperature of almost 27.8 °C. The lowest temperature on the F5 floor is found on the windward side of the atrium, at around 21.2 °C, which is influenced by the chimney effect created by the airflow within the atrium. The results show that the air temperature at the ceiling level is higher than at the floor level due to the driving force of thermal pressure. The average air temperature is significantly higher on higher floors compared to lower floors. A better temperature uniformity and lower temperatures are exhibited in the F1 floor than the F5 floor. The temperatures on lower floors are more pleasant and have a better thermal stability. From Figure 15b,c, it can be seen that lower floors have a higher thermal stability and more suitable temperature perception in the case of coupled wind and heat effects. Thermal pressure may be used to efficiently regulate the temperature in the primary operating sections of green buildings. From Figure 15d, it can be found that the inside airflow caused by thermal pressure efficiently serves the rest areas on the north and south sides of the building that are on the windward side when thermal buoyancy is present, resulting in a more pleasant feeling of temperature there. Due to the internal stairs and resting platforms in the atrium, there is a notable vertical temperature stratification from the F3 to F5 floors. There is an approximate 3 °C change in temperature on each floor.
These results show that thermal pressure is the dominant effect for natural ventilation in the atrium as compared with the wind pressure. Natural ventilation can achieve a favorable indoor thermal environment for the central atrium when the outside temperature is between 17 and 25 °C. Using thermal buoyancy effectively may be the key to optimizing the natural ventilation environment of a complicated atrium architecture.

4. Conclusions

This study used computational fluid dynamics (CFD) methods to evaluate the natural ventilation performance in a low-carbon large-space building in hot-summer and cold-winter regions. The impact of outdoor airflow on various indoor spaces was investigated, and the influence of the joint wind and thermal pressure on the natural ventilation in the building for the case study was analyzed. The main conclusions of this study are as follows:
  • With fully open windows, horizontal airflow created by thermal pressure is dominant in the building. The opening at the top of the atrium has a major effect on the temperature distribution of higher rooms.
  • The average indoor airflow velocities on different floors ranges from 0.43 m/s to 0.47 m/s on the windward side which can meet indoor ventilation requirements.
  • Natural ventilation can achieve a favorable indoor thermal environment for the central atrium when the outside temperature is between 17 and 25 °C. The ventilation performance is improved by a larger relative height difference between the air inlets and air outlets.
However, certain limitations still exist and potential areas for further investigations are recommended as follows:
  • The impacts of various types of ventilation openings on the internal airflow environment of the building could be investigated.
  • Simulations under summer and winter conditions with hybrid ventilation should be conducted to analyze the potential of natural ventilation throughout the year.

Author Contributions

Conceptualization, Z.L. and X.P.; data curation, W.H. and Y.L.; formal analysis, Z.L. and W.H.; investigation, Z.L.; methodology, X.P. and W.H.; project administration, Z.L.; resources, X.P.; software, W.H.; supervision, Y.L.; validation, W.H.; visualization, Y.L.; writing—original draft, Z.L. and W.H.; writing—review and editing, X.P. and Y.L. All authors have read and agreed to the published version of the manuscript.

Funding

This research received no external funding.

Data Availability Statement

The data that support the findings of this study are available from Shanghai Construction Group Co., Ltd., but restrictions apply to the availability of these data, which were used under license for the current study, and thus are not publicly available. However, data are available from the authors upon reasonable request and with permission from Shanghai Construction Group Co., Ltd.

Conflicts of Interest

The authors declare no conflict of interest.

References

  1. Hu, A.G. China’s Peak Carbon Goal by 2030 and Main Ways to Achieve It. J. Beijing Inst. Technol. Soc. Sci. Ed. 2021, 21, 1–15. [Google Scholar]
  2. Wu, Y. Building Development Strategy and Implementation Path under the Background of “Dual Carbon”; Architecture: Beijing, China, 2022. [Google Scholar]
  3. Hepburn, C.; Qi, Y.; Stern, N.; Ward, B.; Xie, C.; Zenghelis, D. Towards Carbon Neutrality and China’s 14th Five-Year Plan: Clean Energy Transition, Sustainable Urban Development, and Investment Priorities. Environ. Sci. Ecotechnol. 2021, 8, 100130. [Google Scholar] [CrossRef] [PubMed]
  4. Zhang, C.; Luo, H. Research on Carbon Emission Peak Prediction and Path of China’s Public Buildings: Scenario Analysis Based on LEAP Model. Energy Build. 2023, 289, 113053. [Google Scholar] [CrossRef]
  5. Shi, C.; Han, Y.; Sun, C. Simulation and Analysis of Thermal Environment of Complex Atrium Space in Cold Land under Natural Ventilation Conditions; New Architecture: Wuhan, China, 2020. [Google Scholar]
  6. Guo, P.; Wang, S.; Xu, B.; Meng, Q.; Wang, Y. Reduced-Scale Experimental Model and Numerical Investigations to Buoyance-Driven Natural Ventilation in a Large Space Building. Build. Environ. 2018, 145, 24–32. [Google Scholar] [CrossRef]
  7. Feng, Q.; Zhang, C.; Lu, J.; Cai, H.; Chen, Z.; Yang, Y.; Li, F.; Li, X. Source Localization in Dynamic Indoor Environments with Natural Ventilation: An Experimental Study of a Particle Swarm Optimization-Based Multi-Robot Olfaction Method. Build. Environ. 2019, 161, 106228. [Google Scholar] [CrossRef]
  8. Xi, J.; Li, J. Analysis of Natural Ventilation Design Methods for Terminal Buildings in Hot Summer and Cold Winter Regions; Construction Science and Technology: Beijing, China, 2023. [Google Scholar]
  9. Song, J.; Huang, X.; Shi, D.; Lin, W.E.; Fan, S.; Linden, P.F. Natural Ventilation in London: Towards Energy-Efficient and Healthy Buildings. Build. Environ. 2021, 195, 107722. [Google Scholar] [CrossRef]
  10. Hu, H.; Kikumoto, H.; Ooka, R.; Lin, C.; Zhang, B. Comprehensive Validation of Experimental and Numerical Natural Ventilation Predictions Based on Field Measurement with Experimental House. Build. Environ. 2022, 207, 108433. [Google Scholar] [CrossRef]
  11. Ilieș, D.C.; Safarov, B.; Caciora, T.; Ilieș, A.; Grama, V.; Ilies, G.; Huniadi, A.; Zharas, B.; Hodor, N.; Sandor, M.; et al. Museal Indoor Air Quality and Public Health: An Integrated Approach for Exhibits Preservation and Ensuring Human Health. Sustainability 2022, 14, 2462. [Google Scholar] [CrossRef]
  12. Zhu, W.; Dong, W.; Qin, G.; Yang, Y. Coordinated Carbon Reduction Mechanism and Policy Design to Achieve Carbon Peak and Neutrality Goals in the Yangtze River Delta. Sustain. Energy Technol. Assess. 2023, 56, 103113. [Google Scholar] [CrossRef]
  13. Liu, W.; Mei, H.; Zhao, C. Carbon Neutral Public Buildings: A Study of Carbon Emission Methods and Carbon Reduction Strategies for Large-Space Public Buildings; Contemporary Architecture: Harbin, China, 2023. [Google Scholar]
  14. Fang, Z.; Zhang, H. Study on the Design Patterns and Key Technologies of Green Public Buildings Adapted to Hot Summer and Cold Winter Climate in Yangtze River Delta Region; Architecture: Beijing, China, 2022. [Google Scholar]
  15. Yang, Y.; Cai, Y.; Huang, Y.; Liu, Z.; Xu, F. Fuzzy Optimization Research on Thermal Comfort of Atrium Space in Office Buildings under Natural Ventilation Environment. West. J. Habitat Environ. 2022, 37, 119–125. [Google Scholar] [CrossRef]
  16. Xu, F.; Li, C.; Tang, H. Influence Analysis of Space Configuration on Cooling Load of a Large Semi-Closed Atrium in Hot and Humid Region. Build. Environ. 2022, 225, 109670. [Google Scholar] [CrossRef]
  17. Hussain, S.; Oosthuizen, P.H. Numerical Study of Buoyancy-Driven Natural Ventilation in a Simple Three-Storey Atrium Building. Int. J. Sustain. Built Environ. 2012, 1, 141–157. [Google Scholar] [CrossRef]
  18. Zhang, W.; Xiao, W.; Zhang, T. Numerical Investigations on Natural Ventilation in Atria of China’s Southern Yangtze Vernacular Dwellings. Sustain. Cities Soc. 2023, 89, 104341. [Google Scholar] [CrossRef]
  19. Cheng, Z. Research on Design Strategy of Gymnasium Based on Natural Ventilation Simulation. Master’s Thesis, Harbin Institute of Technology, Harbin, China, 2017. [Google Scholar]
  20. Xu, X. Optimization Study on Geometric Parameters of Atrium of Near-Zero Energy Multistory Office Building in Cold Region. Master’s Thesis, Shandong University of Architecture, Shandong, China, 2023. [Google Scholar]
  21. Lu, Y.; Dong, J.; Wang, Z.; Wang, Y.; Wu, Q.; Wang, L.; Liu, J. Evaluation of Stack Ventilation in a Large Space Using Zonal Simulation and a Reduced-Scale Model Experiment with Particle Image Velocimetry. J. Build. Eng. 2021, 34, 101958. [Google Scholar] [CrossRef]
  22. Tan, L. Research on Natural Ventilation Design of Large Space Public Buildings in Hot Summer and Cold Winter Areas. Master’s Thesis, Hunan University, Hunan, China, 2016. [Google Scholar]
  23. Guo, W.; Liang, S.; He, Y.; Li, W.; Xiong, B.; Wen, H. Combining Energy Plus and CFD to Predict and Optimize the Passive Ventilation Mode of Medium-Sized Gymnasium in Subtropical Regions. Build. Environ. 2022, 207, 108420. [Google Scholar] [CrossRef]
  24. Kong, J. Research on the Optimization Design Strategy of Large Professional Soccer Stadium Spectator Area Comfort Based on CFD Wind-Thermal Coupling. Master’s Thesis, Xi’an University of Architecture and Technology, Xi’an, China, 2022. [Google Scholar]
  25. Li, C.; Chen, Y. A Multi-Factor Optimization Method Based on Thermal Comfort for Building Energy Performance with Natural Ventilation. Energy Build. 2023, 285, 112893. [Google Scholar] [CrossRef]
  26. Chen, C.; Gorlé, C. Full-Scale Validation of CFD Simulations of Buoyancy-Driven Ventilation in a Three-Story Office Building. Build. Environ. 2022, 221, 109240. [Google Scholar] [CrossRef]
  27. Cui, P.-Y.; Li, Z.; Tao, W.-Q. Wind-Tunnel Measurements for Thermal Effects on the Air Flow and Pollutant Dispersion through Different Scale Urban Areas. Build. Environ. 2016, 97, 137–151. [Google Scholar] [CrossRef]
  28. Tominaga, Y.; Stathopoulos, T. CFD Simulations of Near-Field Pollutant Dispersion with Different Plume Buoyancies. Building and Environment 2018, 131, 128–139. [Google Scholar] [CrossRef]
  29. Saleh, A.; Lakkis, I.; Moukalled, F. A Modified K-ω Turbulence Model for Improved Predictions of Neutral Atmospheric Boundary Layer Flows. Building and Environment 2022, 223, 109495. [Google Scholar] [CrossRef]
  30. Bhola, M.; Singh, S. Analysis of Heat Transfer of Turbulent Channel Using Different Geometries Using ANSYS. Mater. Today Proc. 2022, 64, 1223–1228. [Google Scholar] [CrossRef]
  31. El-Amin, M.F.; Al-Ghamdi, A.; Salama, A.; Sun, S. Numerical Simulation and Analysis of Confined Turbulent Buoyant Jet with Variable Source. J. Hydrodyn. 2015, 27, 955–968. [Google Scholar] [CrossRef]
  32. Stavrakakis, G.M.; Koukou, M.K.; Vrachopoulos, M.G.; Markatos, N.C. Natural Cross-Ventilation in Buildings: Building-Scale Experiments, Numerical Simulation and Thermal Comfort Evaluation. Energy Build. 2008, 40, 1666–1681. [Google Scholar] [CrossRef]
  33. DB31/T 922-2015; Technical Code for Numerical Simulation of Building Environment. Shanghai Provincial Standard of the People’s Republic of China: Shanghai, China, 2015.
  34. Zheng, L.; Lu, W.; Wu, L.; Zhou, Q. A Review of Integration between BIM and CFD for Building Outdoor Environment Simulation. Building and Environment 2023, 228, 109862. [Google Scholar] [CrossRef]
  35. Liu, J. Study on the Influence of Large Space Atrium Morphology on Natural Ventilation Based on Numerical Simulation. Master’s Thesis, Kunming University of Science and Technology, Kunming, China, 2014. [Google Scholar]
  36. Zhang, X.; Weerasuriya, A.U.; Tse, K.T. CFD Simulation of Natural Ventilation of a Generic Building in Various Incident Wind Directions: Comparison of Turbulence Modelling, Evaluation Methods, and Ventilation Mechanisms. Energy Build. 2020, 229, 110516. [Google Scholar] [CrossRef]
  37. Kang, L.; van Hooff, T. Influence of Inlet Boundary Conditions on 3D Steady RANS Simulations of Non-Isothermal Mechanical Ventilation in a Generic Closure. Int. J. Therm. Sci. 2022, 182, 107792. [Google Scholar] [CrossRef]
  38. Kumar, N.; Kubota, T.; Tominaga, Y.; Shirzadi, M.; Bardhan, R. CFD Simulations of Wind-Induced Ventilation in Apartment Buildings with Vertical Voids: Effects of Pilots and Wind Fin on Ventilation Performance. Build. Environ. 2021, 194, 107666. [Google Scholar] [CrossRef]
  39. Dai, Y. Design Strategies for Indoor Natural Ventilation in Atrium-Style Residential Buildings in Hot-Summer and Cold-Winter Regions. Master’s Thesis, Xi’an University of Architecture and Technology, Xi’an, China, 2015. [Google Scholar]
  40. Van Druenen, T.; Van Hooff, T.; Montazeri, H.; Blocken, B. CFD Evaluation of Building Geometry Modifications to Reduce Pedestrian-Level Wind Speed. Build. Environ. 2019, 163, 106293. [Google Scholar] [CrossRef]
  41. Tominaga, Y.; Stathopoulos, T. CFD Modeling of Pollution Dispersion in a Street Canyon: Comparison between LES and RANS. Journal of Wind Engineering and Industrial Aerodynamics 2011, 99, 340–348. [Google Scholar] [CrossRef]
  42. Tominaga, Y.; Blocken, B. Wind Tunnel Analysis of Flow and Dispersion in Cross-Ventilated Isolated Buildings: Impact of Opening Positions. J. Wind Eng. Ind. Aerodyn. 2016, 155, 74–88. [Google Scholar] [CrossRef]
  43. Hou, S. Experimental Study of Air Flow on Human Thermal Sensation. Master’s Thesis, University of Engineering, Hebei, China, 2018. [Google Scholar]
  44. GB 50189-2015; Design Standard for Energy Efficiency of Public Buildings. Ministry of Housing and Urban–Rural Development: Beijing, China, 2015.
  45. ASHRAE Standard 55-2004; Thermal Environmental Conditions for Human Occupancy. ASHRAE Standards Committee: Atlanta, GA, USA, 2004. Available online: https://www.doc88.com/p-90259421996263.html (accessed on 7 August 2023).
  46. Qiao, J.; Zhang, X.; Hao, C.; Liu, S.; Zhang, Y.; Xing, K.; Yang, P. Post-Occupancy Evaluation of the Actual Performance of a Low-Carbon Building. Energy Rep. 2023, 10, 228–243. [Google Scholar] [CrossRef]
Figure 1. (a) Section view of the case study building. (b) Atrium in the building; (c) schematic diagram of sections.
Buildings 13 02263 g001
Figure 2. The flow chart of the two-stage simulation in the study.
Buildings 13 02263 g002
Figure 3. (a) Simulative partitions of building. (b) Some openings of the building.
Buildings 13 02263 g003
Figure 4. (a) Simulative model and computational domain (b) Schematic diagram of the horizontal distribution of the inlet wind field (c) Schematic diagram of the vertical distribution of the inlet wind field.
Buildings 13 02263 g004
Figure 5. Fitting results of three meshes for the outlet velocity.
Buildings 13 02263 g005
Figure 6. Partitioning of the computational mesh model (right: a zoomed-in view of the internal model).
Buildings 13 02263 g006
Figure 7. Comparison of wind tunnel test and simulated values of u/UH at different locations. (a) Point 1; (b) Point 2; (c) location of measured points.
Buildings 13 02263 g007
Figure 8. Outdoor flow field of the building in the Y-direction: (a) velocity contour; (b) velocity vector.
Buildings 13 02263 g008
Figure 9. Velocity contour of the outdoor flow field in the Z-direction: (a) F1 floor; (b) M3 floor; (c) F5 floor.
Buildings 13 02263 g009
Figure 10. Vector of the outdoor flow field in the Z-direction: (a) F1 floor; (b) M3 floor; (c) F5 floor.
Buildings 13 02263 g010
Figure 11. Static pressure distribution of a cross-section at 1.5 m on the F1 floor.
Buildings 13 02263 g011
Figure 12. (a,b) F1 floor model and velocity contour; (c,d) M3 floor model and velocity contour; (e,f) F5 floor model and velocity contour.
Buildings 13 02263 g012aBuildings 13 02263 g012b
Figure 13. (a,b) F1 floor model and temperature contour; (c,d) M3 floor model and temperature contour; (e,f) F5 floor model and temperature contour.
Buildings 13 02263 g013aBuildings 13 02263 g013b
Figure 14. (a) Velocity contours on each floor of the atrium. (b) F1 floor. (c) F5 floor. (d) The center of the atrium in the width direction. (e) The center of the atrium in the depth direction.
Buildings 13 02263 g014aBuildings 13 02263 g014b
Figure 15. (a) Summary of temperature contours at each floor of the atrium. (b) F1 floor. (c) F5 floor. (d) The center of the atrium in the width direction. (e) The center of the atrium in the depth direction.
Buildings 13 02263 g015
Table 1. Boundary conditions of the study.
TypeValue
Air inlets 1, 2, 3, 4Velocity inletRated value: 3.51 m/s,
varying according to Equation (12)
Gradient temperature: 18 °C
Air outlets 1, 2, 3, 4pressure outlet0 Pa
Air outdoorTemperature24 °C
Walls F1, F2, F3, F4, F5TemperatureF1:22 °C, F1~F5 according to 0.4 °C/floor increment
Walls M2, M3TemperatureM2: 22.6 °C
M3: 23 °C
GroundTemperatureAdiabatic
RoofTemperature26 °C
Table 2. Simulation results of the wind velocity of the target external windows on each floor.
FloorLocationVelocity (m/s)
F1Inlet 11.79
M3Inlet 23.27
F5Inlet 34.11
Table 3. Simulation results of the wind velocity of the target external windows on each floor [40].
Indoor Wind Velocity (m/s)Comfortable Level
≤0.25No blowing feeling
0.25–0.50Comfortable
0.50–1.00Slightly comfortable
1.00–1.50Slightly uncomfortable
>1.50Uncomfortable
Disclaimer/Publisher’s Note: The statements, opinions and data contained in all publications are solely those of the individual author(s) and contributor(s) and not of MDPI and/or the editor(s). MDPI and/or the editor(s) disclaim responsibility for any injury to people or property resulting from any ideas, methods, instructions or products referred to in the content.

