Article

3D-Printed Clay Enhanced with Graphene Nanoplatelets for Sustainable and Green Construction

1
Department of Civil and Architectural Engineering, Qatar University, Doha P.O. Box 2713, Qatar
2
Tajarub for Research and Development, Doha P.O. Box 12627, Qatar
3
Department of Civil and Environmental Engineering, Texas A&M University, College Station, TX 77843-3136, USA
4
Department of Civil Engineering, Aqaba University of Technology, Aqaba P.O. Box 11947, Jordan
5
Department of Construction Management, University of Houston, Houston, TX 77204-4020, USA
*
Author to whom correspondence should be addressed.
Buildings 2023, 13(9), 2321; https://doi.org/10.3390/buildings13092321
Submission received: 21 July 2023 / Revised: 22 August 2023 / Accepted: 10 September 2023 / Published: 13 September 2023
(This article belongs to the Section Building Materials, and Repair & Renovation)

Abstract

:
This paper presents a study on the effects of graphene nanoplatelets (GNPs) on the mechanical behavior of 3D-printed burnt clay, the most sustainable and green construction material, under constant printing parameters. Mixes with different nanofilament contents—0.1%, 0.2%, and 0.3% by clay weight—were printed and tested under compression and bending loadings. The results obtained on the printed samples were compared with those fabricated using the molding method. The samples’ microstructures were then analyzed using a scanning electron microscope (SEM). Energy dispersive X-ray (EDX) analysis was employed to obtain the elemental distributions. The testing results were then statistically analyzed using a t-statistical method to investigate the impact of using GNPs on the properties of 3D-printed clay. Strength test results showed that mixes containing a low GNP content, i.e., 0.1 wt.%, attained higher compressive and flexural strengths than those containing higher contents, i.e., 0.2 and 0.3wt.%. The results additionally highlighted that the efficiency of GNPs was better observed in the printed samples rather than the molded ones, indicating that the printing process contributed to a better and more uniform dispersion of GNPs in the clay matrix. The t-statistical analysis confirmed that a significant improvement in compressive strength could be obtained using a GNP content of 0.1 wt.%, regardless of the fabrication method. On the other hand, significant flexural strength improvements were observed in the printed samples at all GNP dosages. Micrographs of GNP-modified clay supported the strength results obtained in this study. In summary, this research work signified the importance of using nanofilaments in 3D printing applications in order to achieve the desired elements’ mechanical properties.

1. Introduction

Three-dimensional printing (3DP) is a newly developed manufacturing technology that has engaged widespread attention and is a tremendous development in the construction industry [1]. The fundamental principle of 3D printing is based on extruding building materials’ predefined shapes through large 3D printers attached to computer-aided design software. The technology is innovative and provides various advantages to the construction process in terms of cost, time efficiency, and labor safety [2]. Moreover, 3D printing has the potential to reduce environmental hazards by significantly mitigating CO2 emissions in the construction and civil engineering sectors through several key mechanisms, such as material and design optimization by allowing for the precise mixing of materials; optimizing the composition to reduce cement content; and incorporating supplementary cementitious materials (SCMs) such as fly ash, slag, or silica fume [3]. Furthermore, 3D printing’s layer-by-layer approach reduces material waste by only depositing material where it is needed, minimizing excess. Automated 3D printing systems also require less human labor compared to conventional construction methods. This not only reduces labor-related emissions, but also increases the speed of construction, minimizing the project’s overall carbon footprint [4]. This method has great potential in several construction applications, such as cheap housing projects, military shelters, and complex structures where formwork erection is difficult. Recently, a few 3D-printed buildings have already been completed and utilized worldwide, even though the technology is still in its early stages [5].
However, the limitation of printable materials, which can further expand the 3D printing technique in the industrial sector, remains a major challenge. Most of the existing 3D-printed structures were built using concrete materials [6]. This constitutes an obstacle to the implementation of this type of construction in remote regions devoid of services, where industrial building materials may still be a challenge to obtain. On the other hand, research into the use of available local materials in the field of 3D printing for construction applications is still lagging behind. Clay, in particular, is one of the oldest human-made materials, and is still widely utilized in construction and infrastructure today [7]. It is easily accessible, affordable, fire-resistant, and, arguably, the most earth-friendly material available. Clay is a fine-grained natural soil with a high content of hydrous aluminum phyllosilicate minerals, e.g., kaolin and Al2Si2O5(OH)4, which is responsible for its plasticity [8]. Building construction with clay has many applications in the 21st century, since it has superior thermal mass characteristics compared to any other material. Clay acts as a buffer to exterior temperature fluctuations by delaying the release of absorbed solar energy, resulting in a stable interior [9].
Nowadays, combining the latest technology, such as 3D-Printing, with traditional, easily available, and low-cost materials, such as clay, has started to attract the interest of researchers and industry professionals [10]. Thus, it has become necessary to develop the properties of clay to print more sustainable buildings. To date, a few studies in this area have dealt with the performance of 3D-printed clays under different conditions and printing parameters. For instance, Manikandan et al. [11] investigated the mechanical properties of clay components using various printing parameters, and provided a guideline for nozzle geometry selection for civil infrastructure 3D-printed clay. Sangiorgio et al. [12] used a numerical simulation of finite element modeling to investigate the possibility of developing new 3D-printed clay bricks for building construction that has complex inner geometries.
However, research on 3D-printed ceramic (i.e., burnt clay) for construction applications is still in its early stages [13], and research on the impact of using various additives such as nanomaterials is absent. Recently, nano-inclusions have been of great interest for building materials due to their exceptional properties at the nanoscale [14]. Graphene nanoplatelets (GNPs) are one of the most promising nanofillers used to develop high-performance cement-based materials due to their distinct properties [15]. Past research findings have shown that small additions of GNPs can effectively enhance cementitious composites’ rheological, mechanical, and microstructural characteristics [16,17,18,19]. However, research on the use of this technology to advance the production of 3D-printed clay elements is still missing or nonexistent.
The proposed research aims to combine GNPs’ reinforcement with additive manufacturing to produce an innovative 3D-printed clay, and to determine the optimum GNP content required to achieve 3D-printed clay with the best compressive and flexural strengths. By understanding the effects of GNPs on the 3D printed clay properties, it may be possible to develop a new material that is stronger, stiffer, and less water-absorbent than traditional clay. This could contribute to the development of sustainable construction practices and offer a novel approach to constructing eco-friendly and resource-efficient buildings, thereby addressing pressing challenges related to sustainability and resource conservation in the construction industry.

2. Research Methodology

Three different GNPs-to-clay dosages of 0.1, 0.2 and 0.3 wt.% were used to evaluate the molded and printed clay mechanical properties. Study samples were divided into two groups: printed and molded, with and without GNPs. Table 1 summarizes the experimental setup, including the test groups, prepared mixes, production methods, and nano-material dosage. The experimental methodology consisted initially of sample preparation. Then, the compressive and flexural strengths were determined. After that, a qualitative scanning electron microscope (SEM) was utilized to analyze the microstructures of the shattered samples from each batch. Finally, the significance of the mechanical test results was analyzed using the t-statistical test, and the findings were reported accordingly.

2.1. Materials and Equipment

  • Clay: The clay used in this study was a high-quality Italian clay paste with a solid appearance, as shown in Figure 1, which was supplied by COLOROBBIA S.P.A., Florence, Italy. Table 2 summarizes the clay composition.
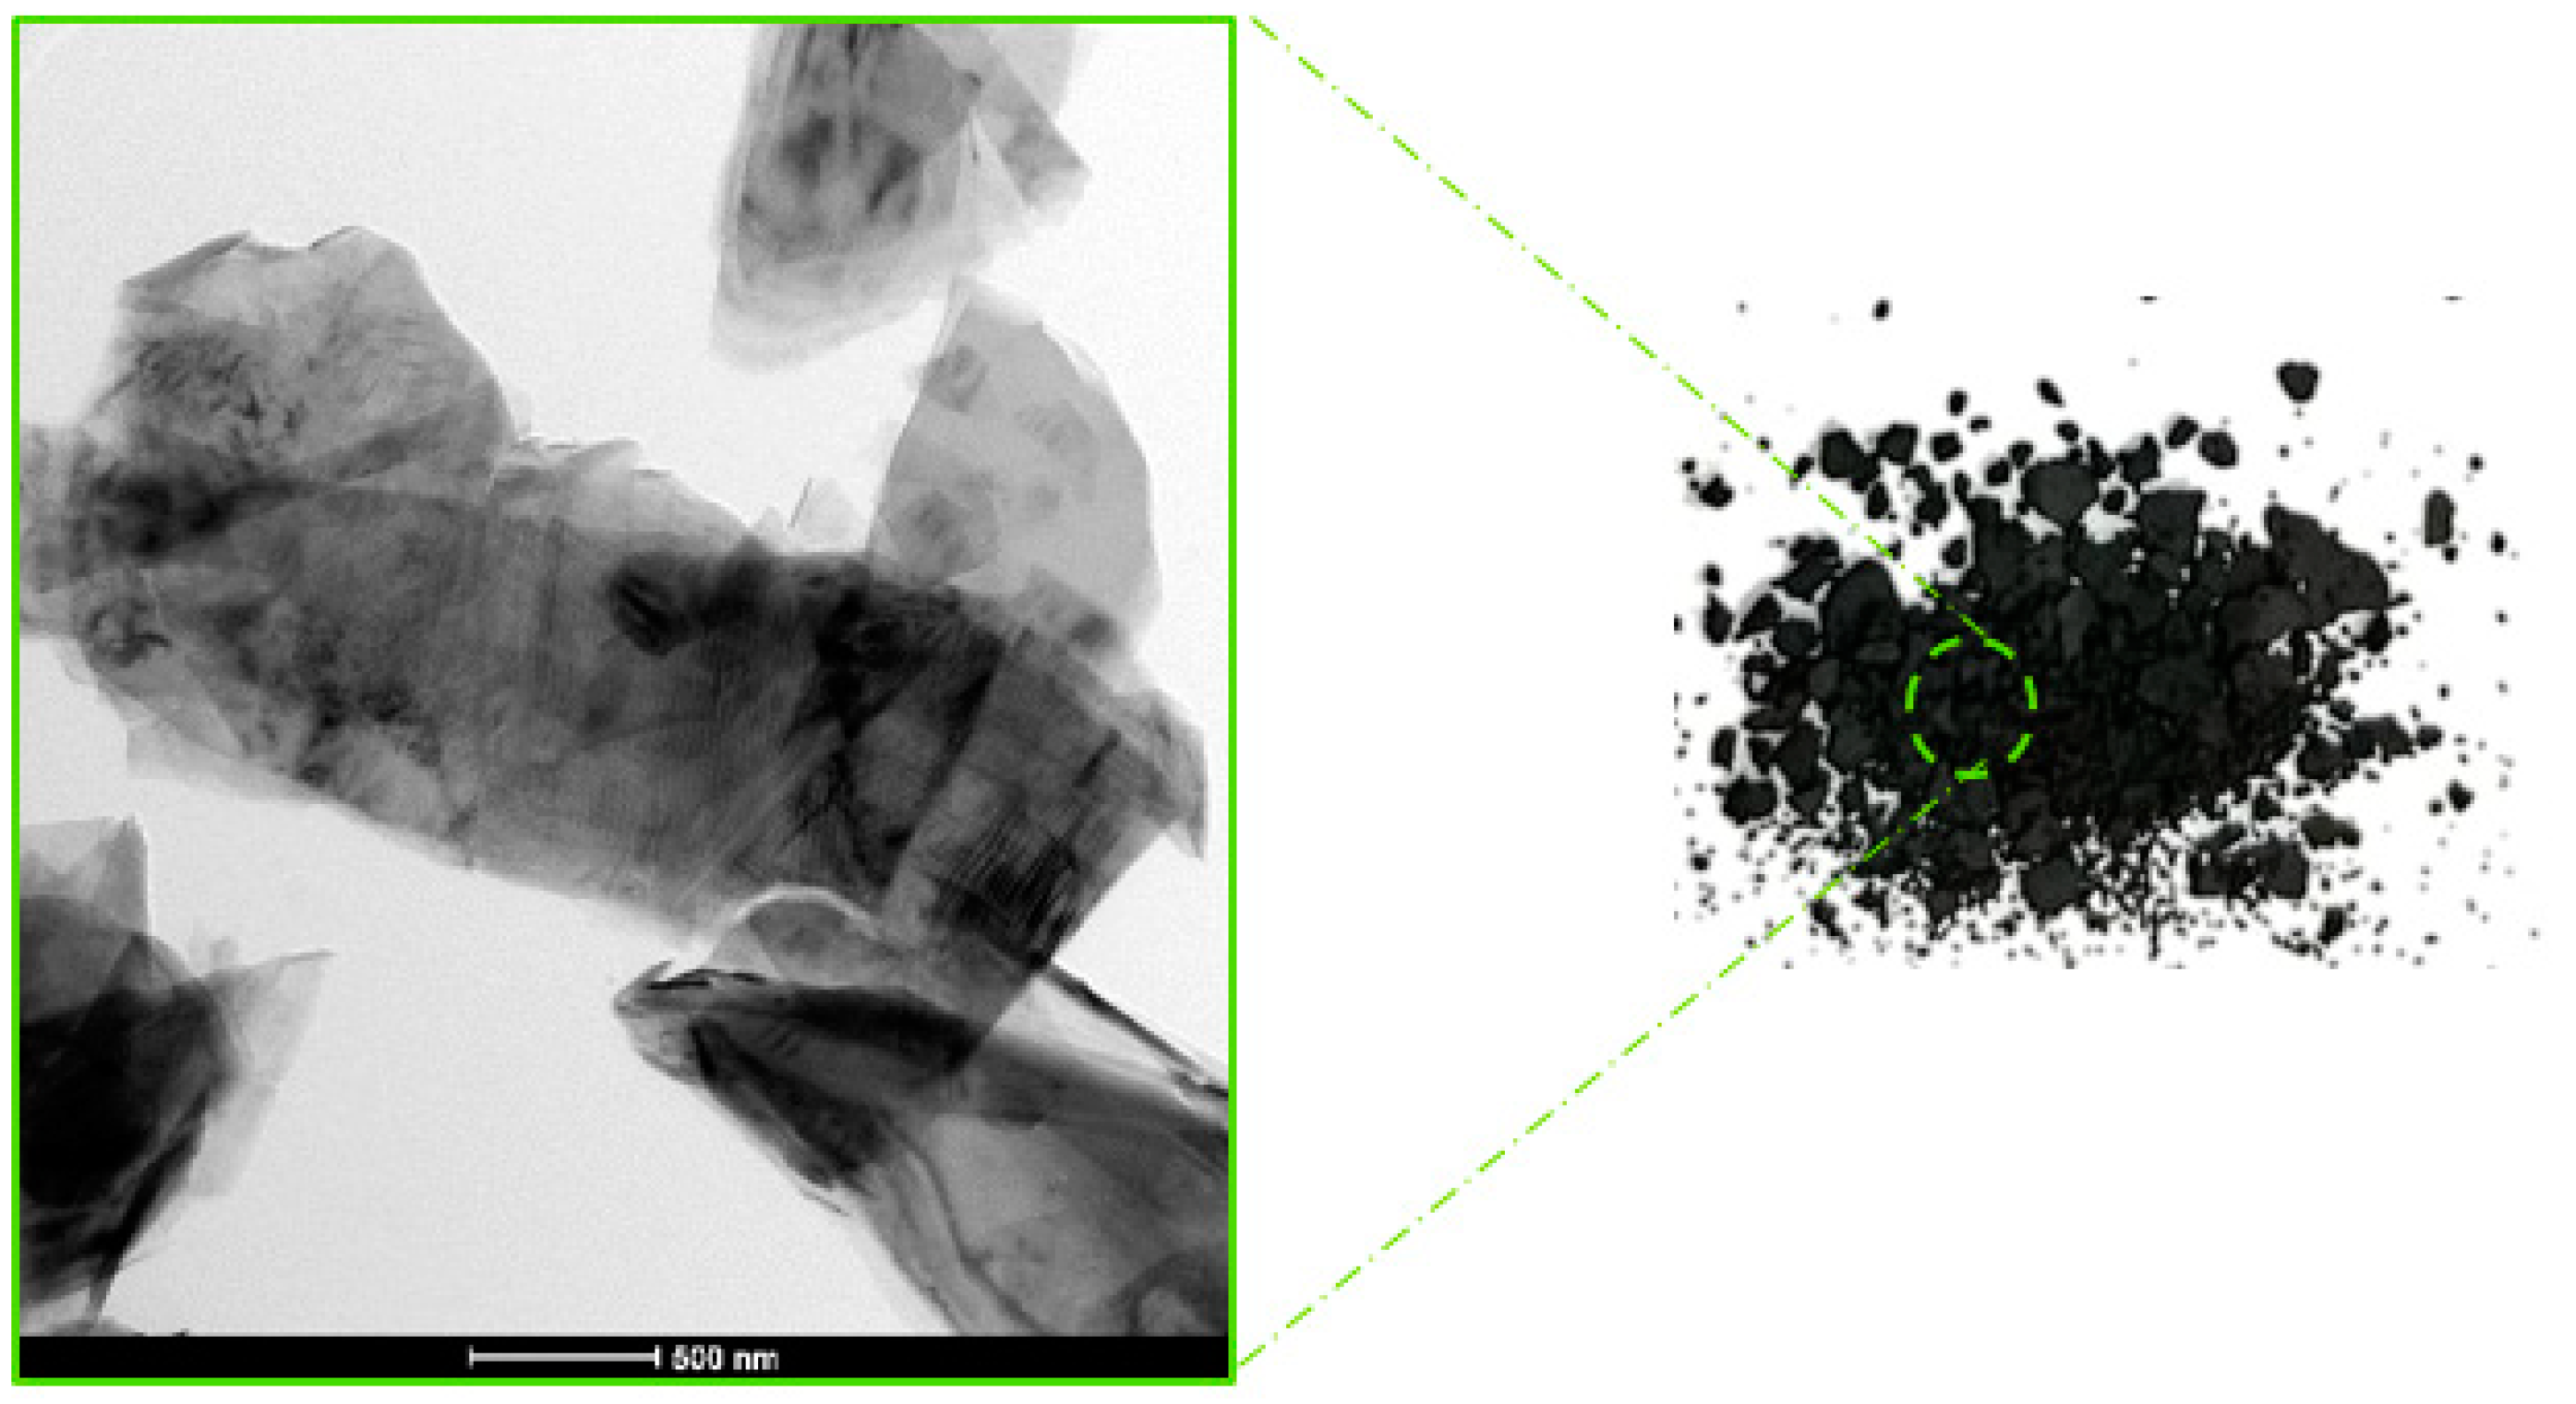
  • Graphene nanoplatelets (GNPs): The GNPs were industrial-grade 4COOH graphene nanoplatelets obtained from “Cheap Tubes Ink”. According to the supplier, the GNPs consist of several sheets of graphene that were chemically segregated from natural graphene. Figure 2 shows a TEM image of GNPs. Table 3 presents the GNPs’ specifications.
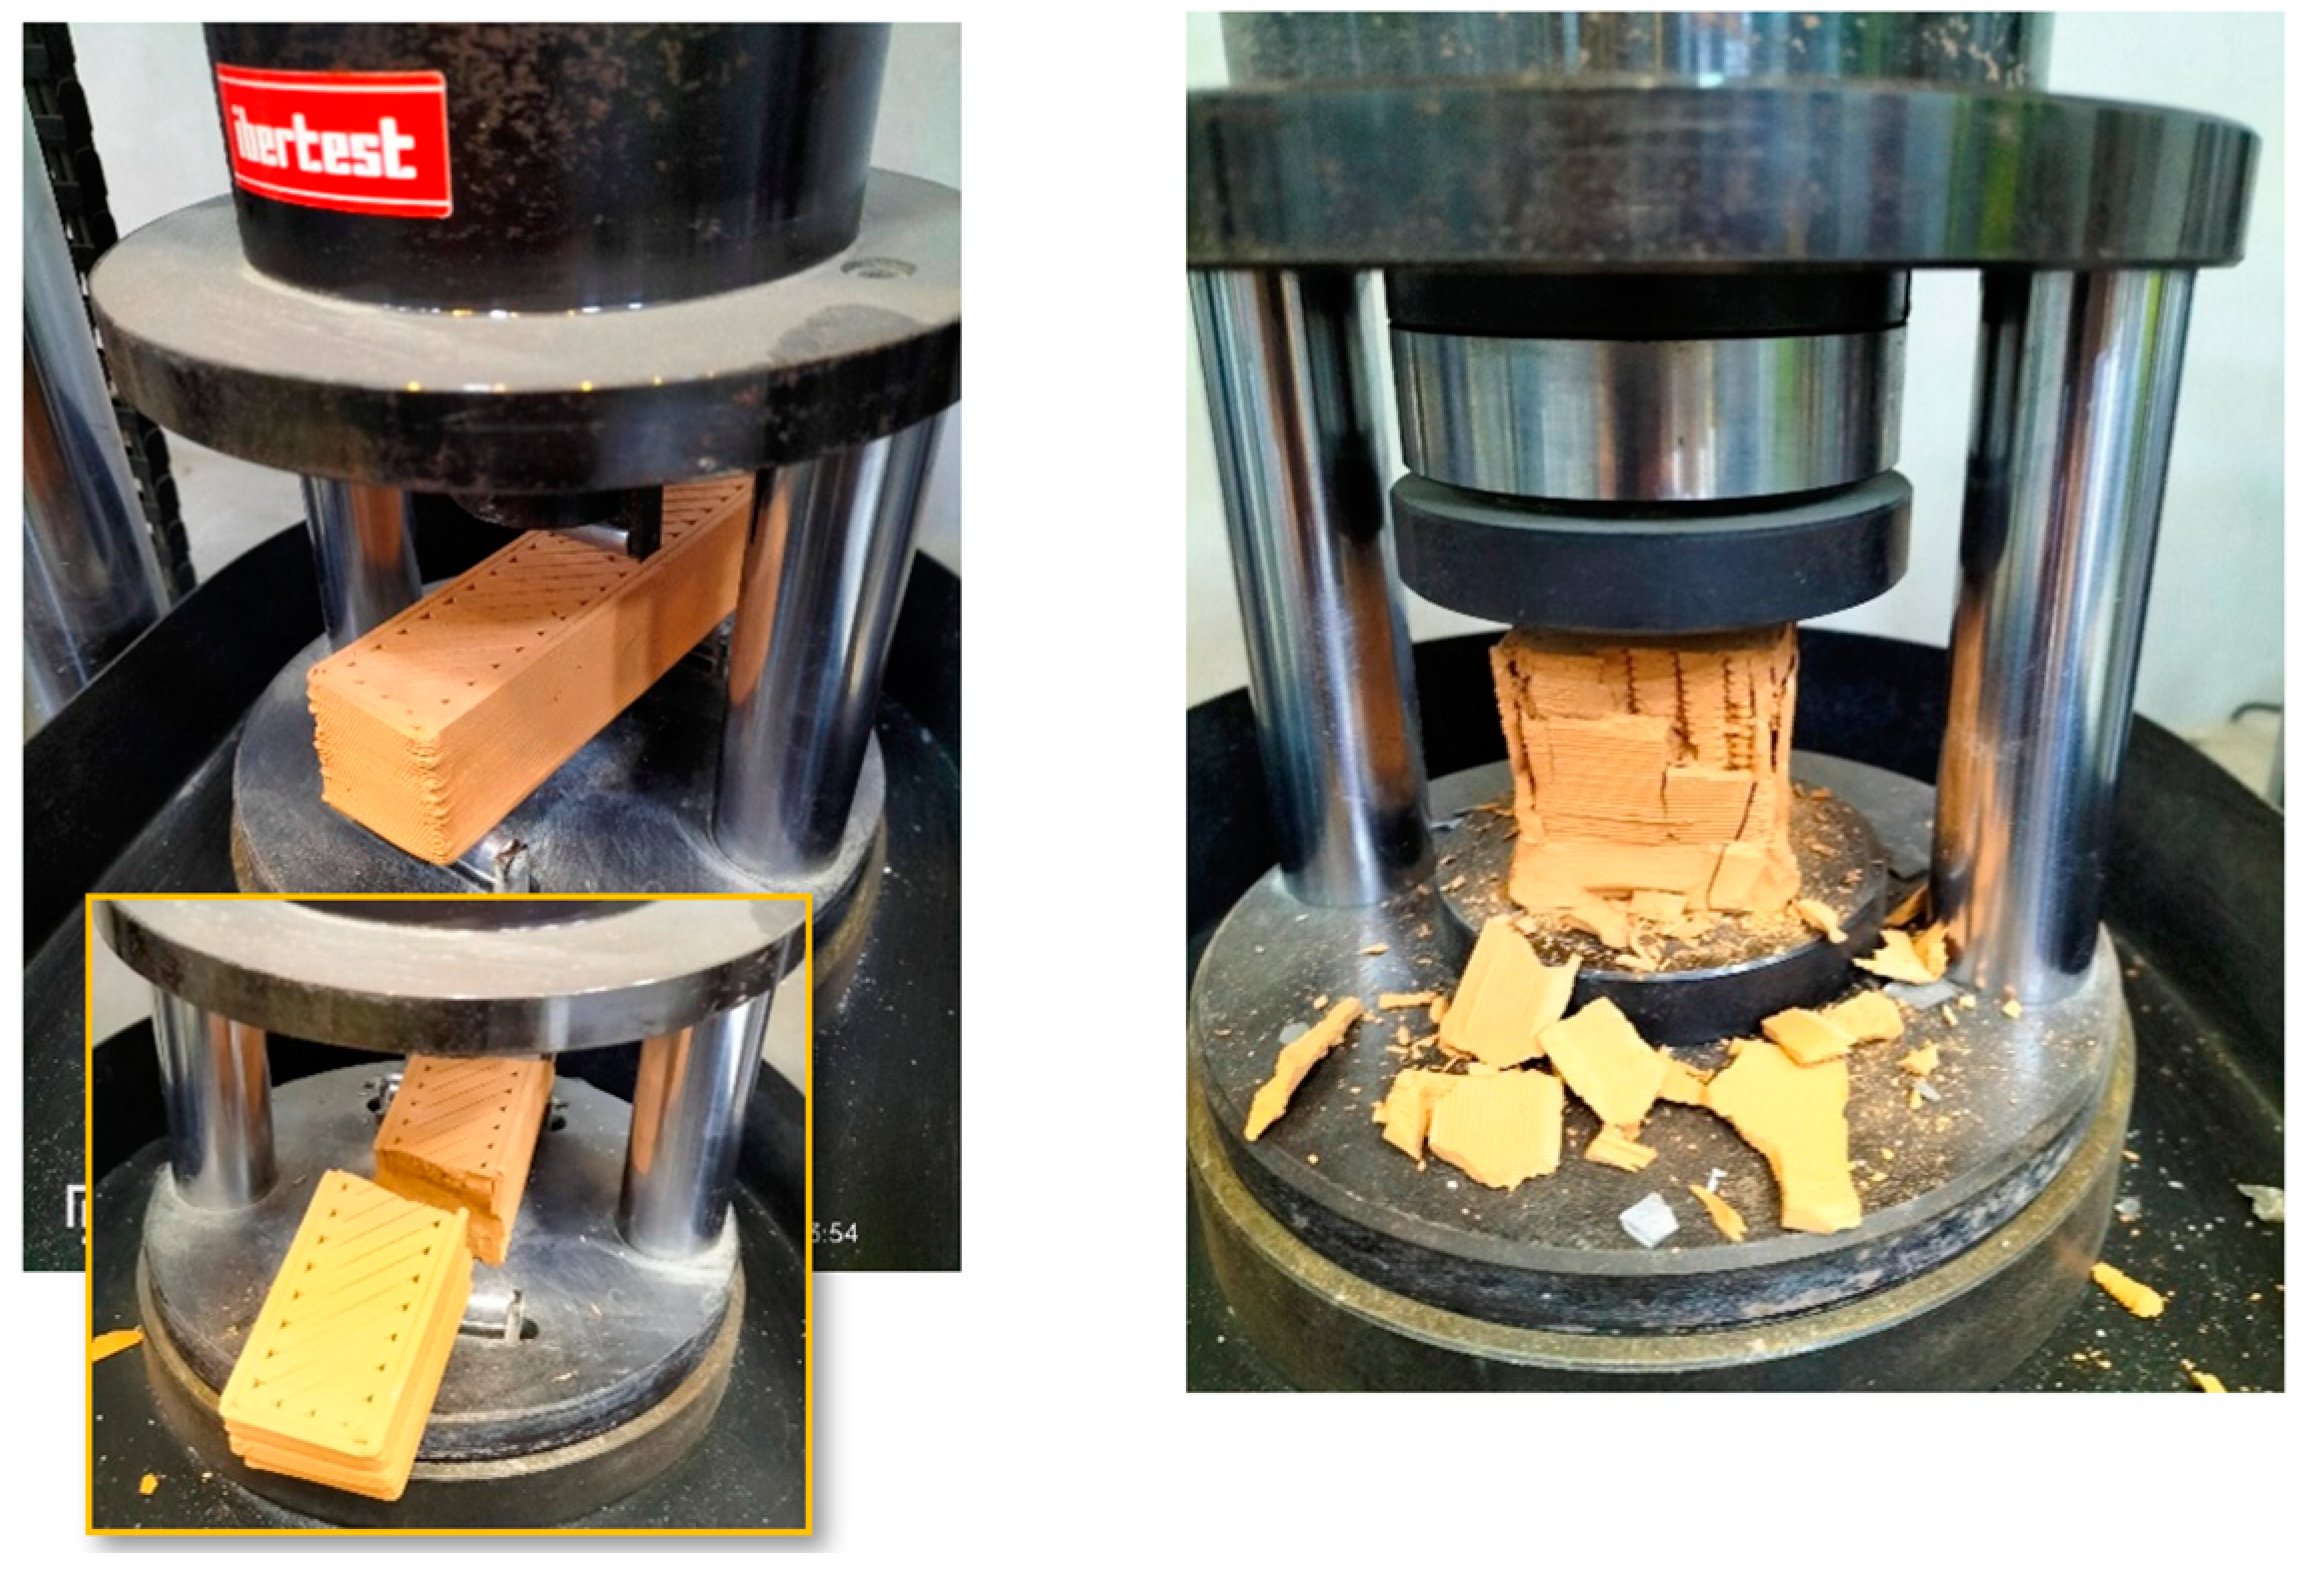
  • Equipment: A variety of equipment was used to perform the experiment, including: (i) Delta WASP 2040 clay 3D printer, supplied by WASP; (ii) an ultrasonic wave mixer, VCX 750 model, provided by Sonics and Materials Inc., Newton, CT, USA; (iii) steel molds with a size of 50 × 50 × 50 mm and 40 × 40 × 160 mm for compressive and flexural strengths testing, respectively; (iv) strength testing machine supplied by IBERTEST, Madrid, Spain; (v) an electric ceramic kiln; and (vi) a scanning electron microscope (SEM), Nova Nano SEM model, manufactured by FEI Inc., Hillsboro, OR, USA.

2.2. Experimental Procedure

  • GNP dispersion: To achieve good GNP dispersion within the clay matrix, an ultrasonic wave mixer was used. The dispersion process involved the following tasks: (i) the water temperature was kept at 25 °C, then the GNPs were added and mixed according to the mix specified percentages; and (ii) using an ultrasonic wave mixer, the aqueous solution was then sonicated for 30 min at only 40% of the maximum power (400 W) to avoid nano-filaments particles damage.
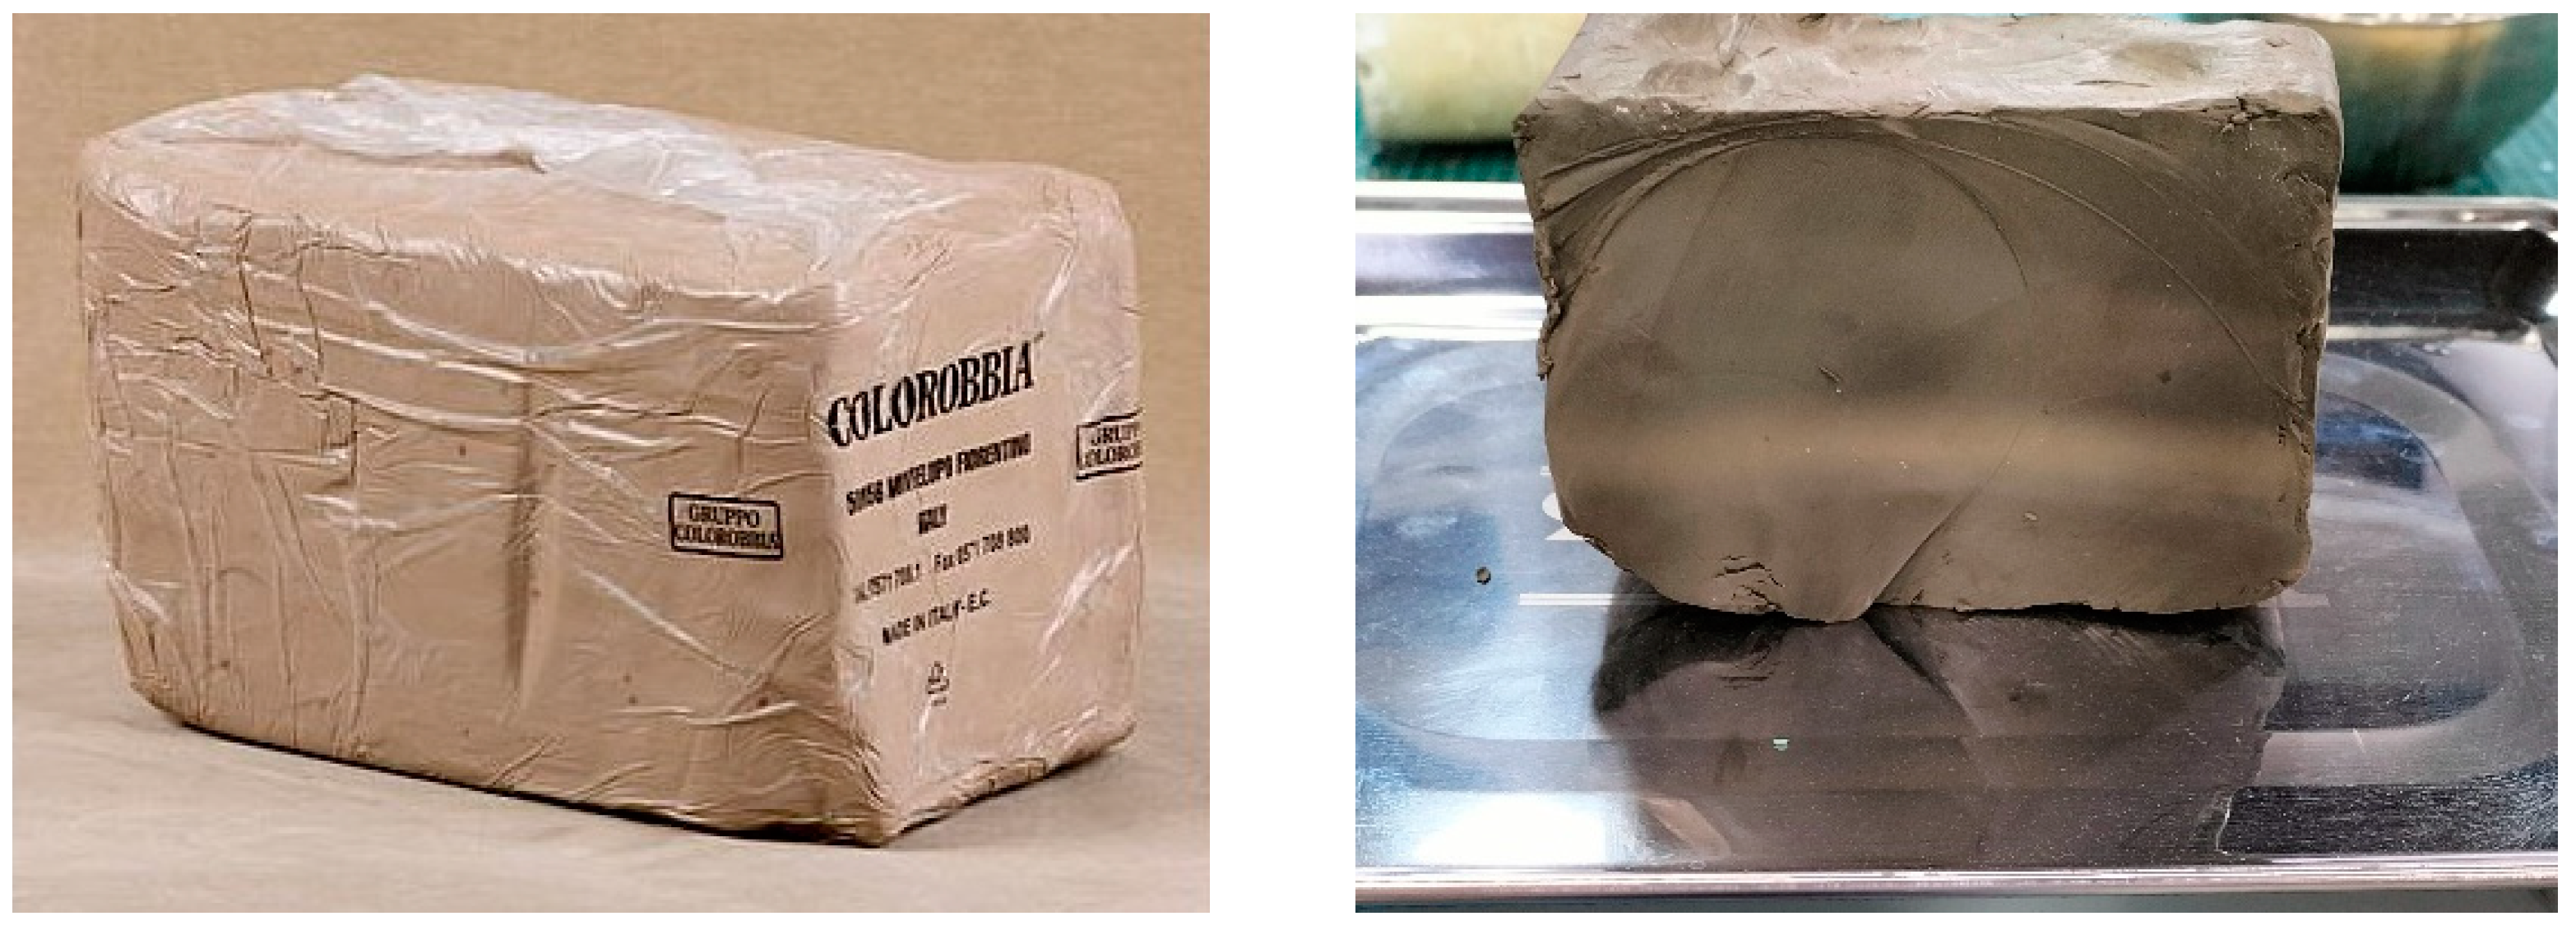
  • Preparation of clay mixtures for 3D printing and molding: The mix design for the clay mixtures was evolved based on a trial-and-error method. The clay preparation was performed manually by mixing the clay paste with the appropriate amount of water for control mixtures, and by using the sonicated solution for nano-modified ones, as indicated above. The same type of clay was used for all batches with a constant water-to-clay ratio of 0.05. Only the GNP content was varied, which had no effect on the final consistency of the mixture. The hard clay was cut first into small pieces, as shown in Figure 3a. Then, the aqueous solution was added gradually to the clay, as shown in Figure 3b. The optimal water-to-clay ratio was determined after several trials. The clay was kneaded manually until it became homogeneous, and then its printability was checked through two manual tests. In the first test, the clay was shaped by hand and pressed lightly. If it contained many cracks, the clay was hard, and more water would need to be added to it. However, if it tended to stick on hand, the clay was soft and needed to be mixed with the hard clay. Several attempts were made until a clay mixture that was free of cracks and not sticking on hand was obtained. After that, the second test, which was the manual extrusion test, was carried out using a medical syringe with a removed tip. The syringe tank was filled with clay, which was slowly extruded onto a flat surface. The ideal clay was the one that was not completely standing or tilting too much, as illustrated in Figure 3c; hence the clay was ready for use. Thereafter, the air bubbles were removed by spreading the clay paste on a flat surface using a trowel. The paste was then formed in a cylindrical shape, filled once in the printer’s tank, and compacted well to remove air bubbles. Finally, the piston was plugged tightly. Mixes of the same proportions for each printed batch were prepared to make the same size molded specimens.
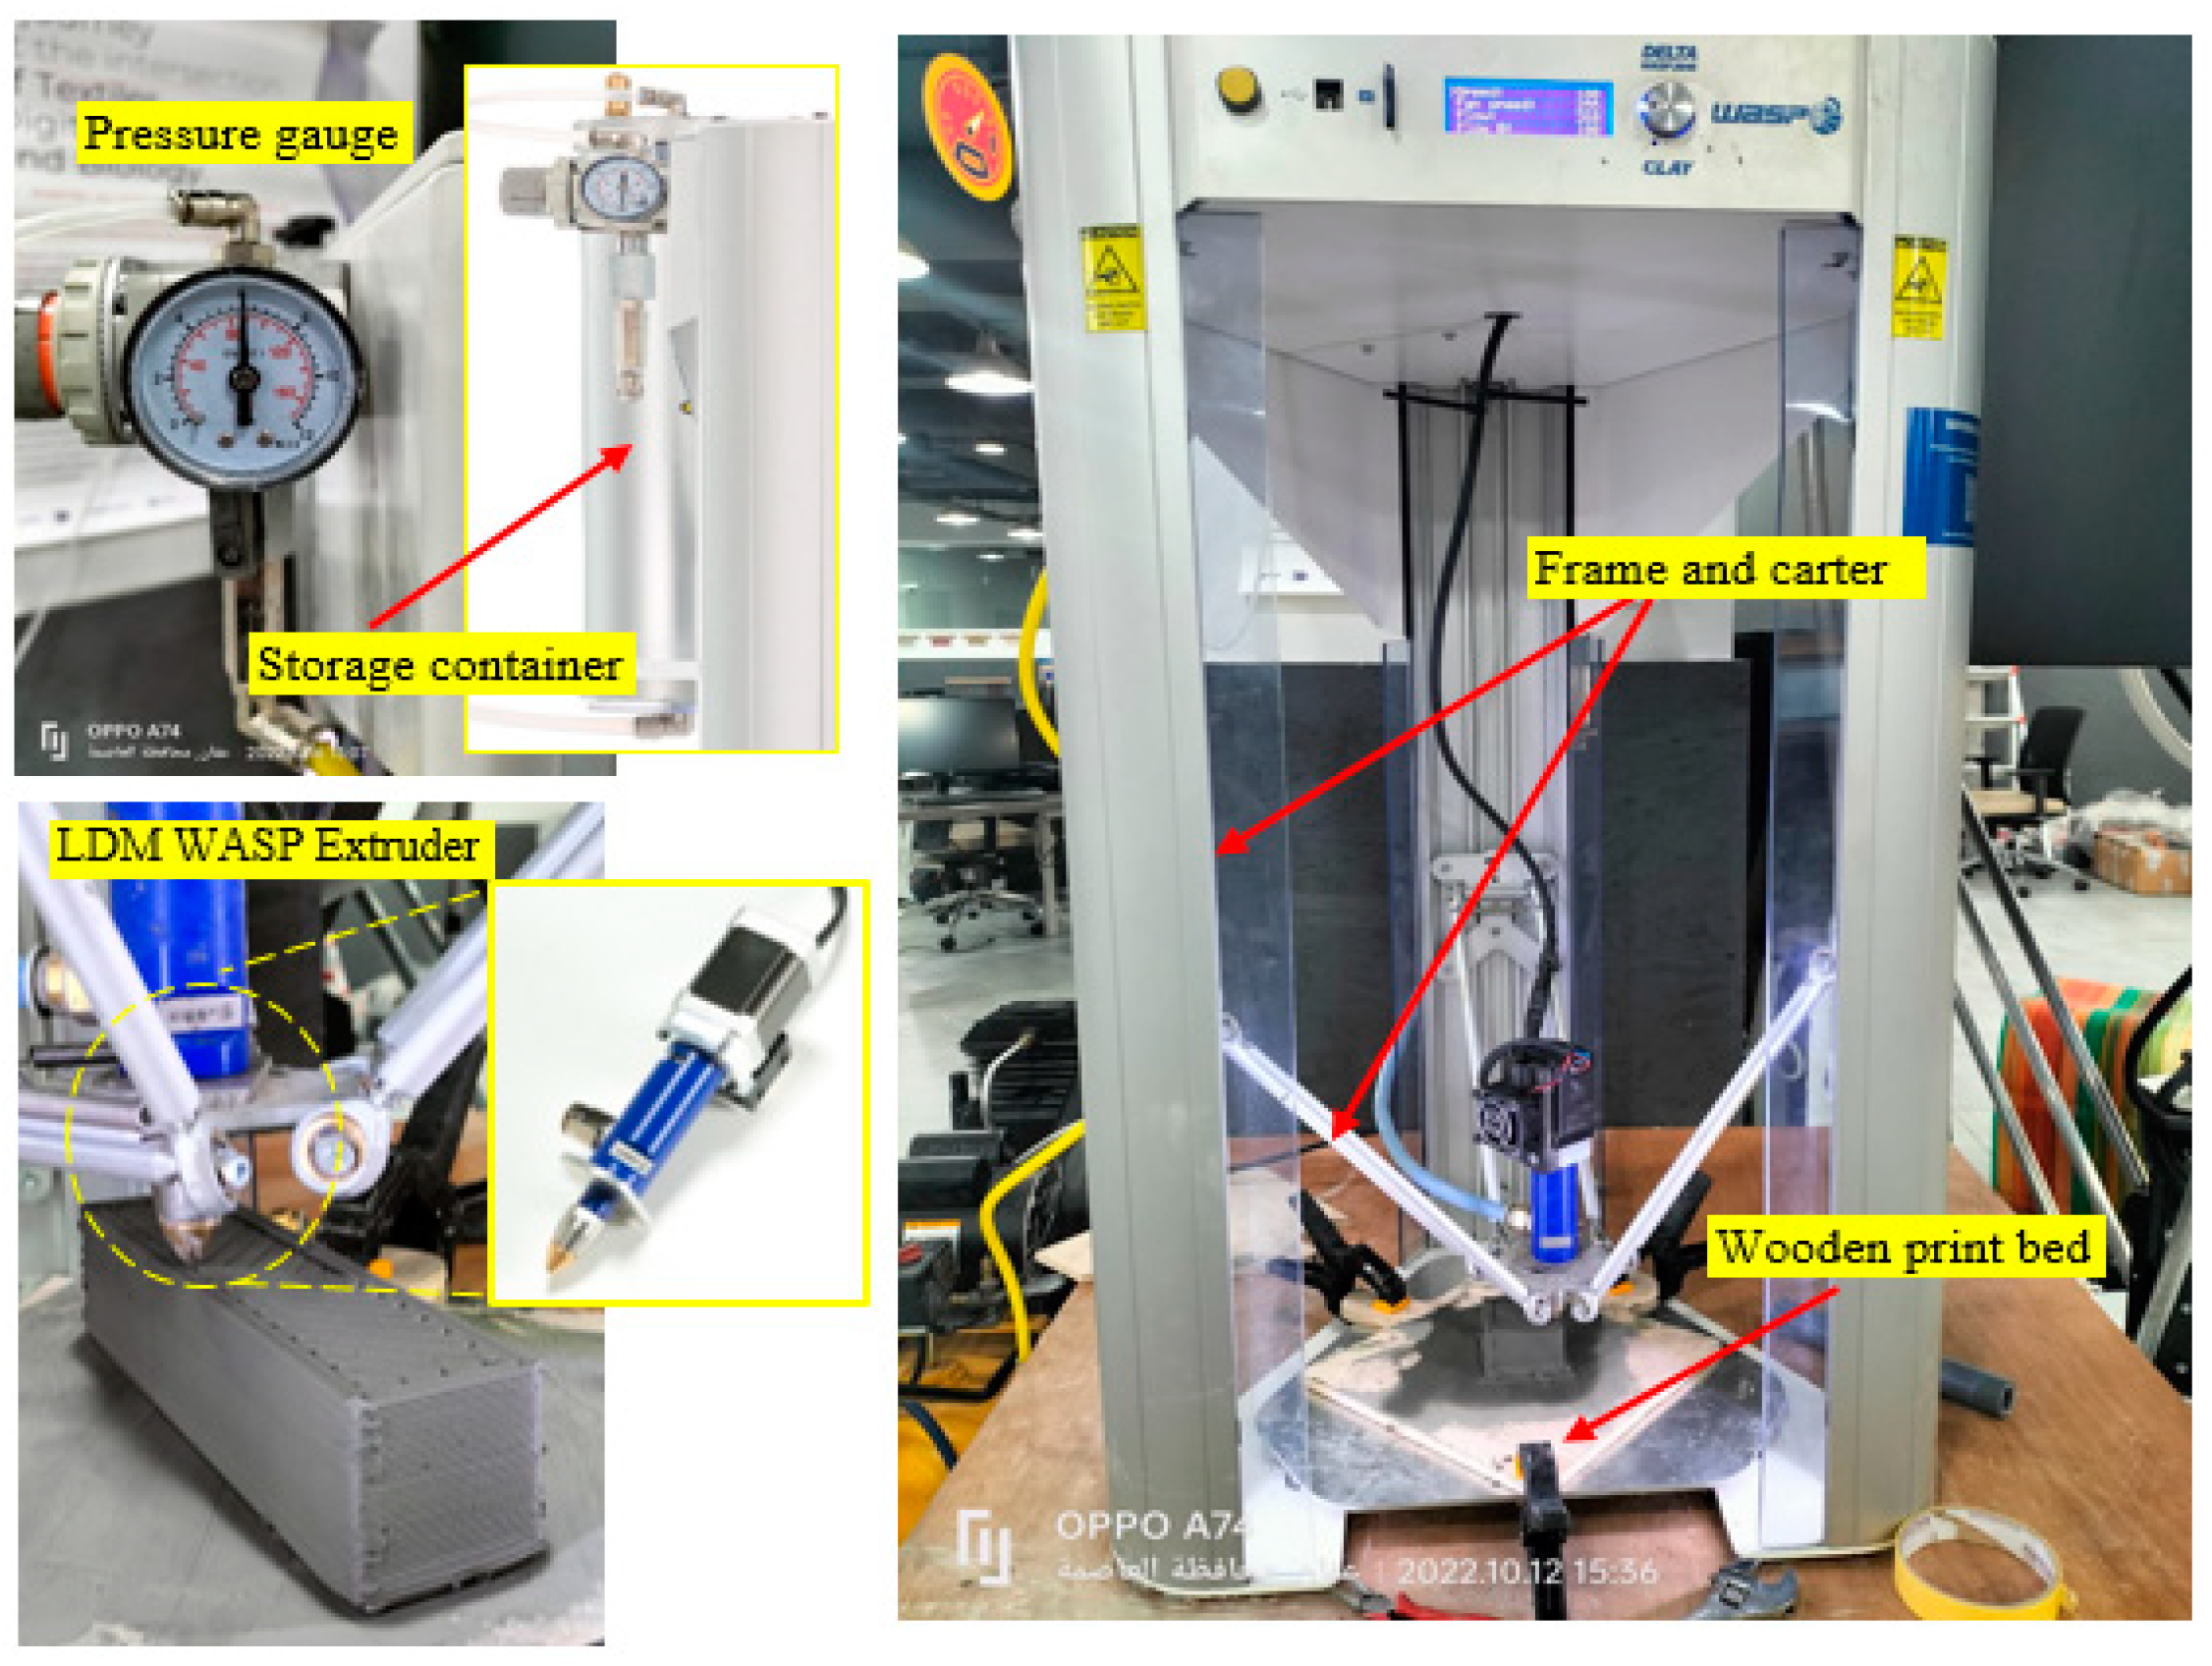
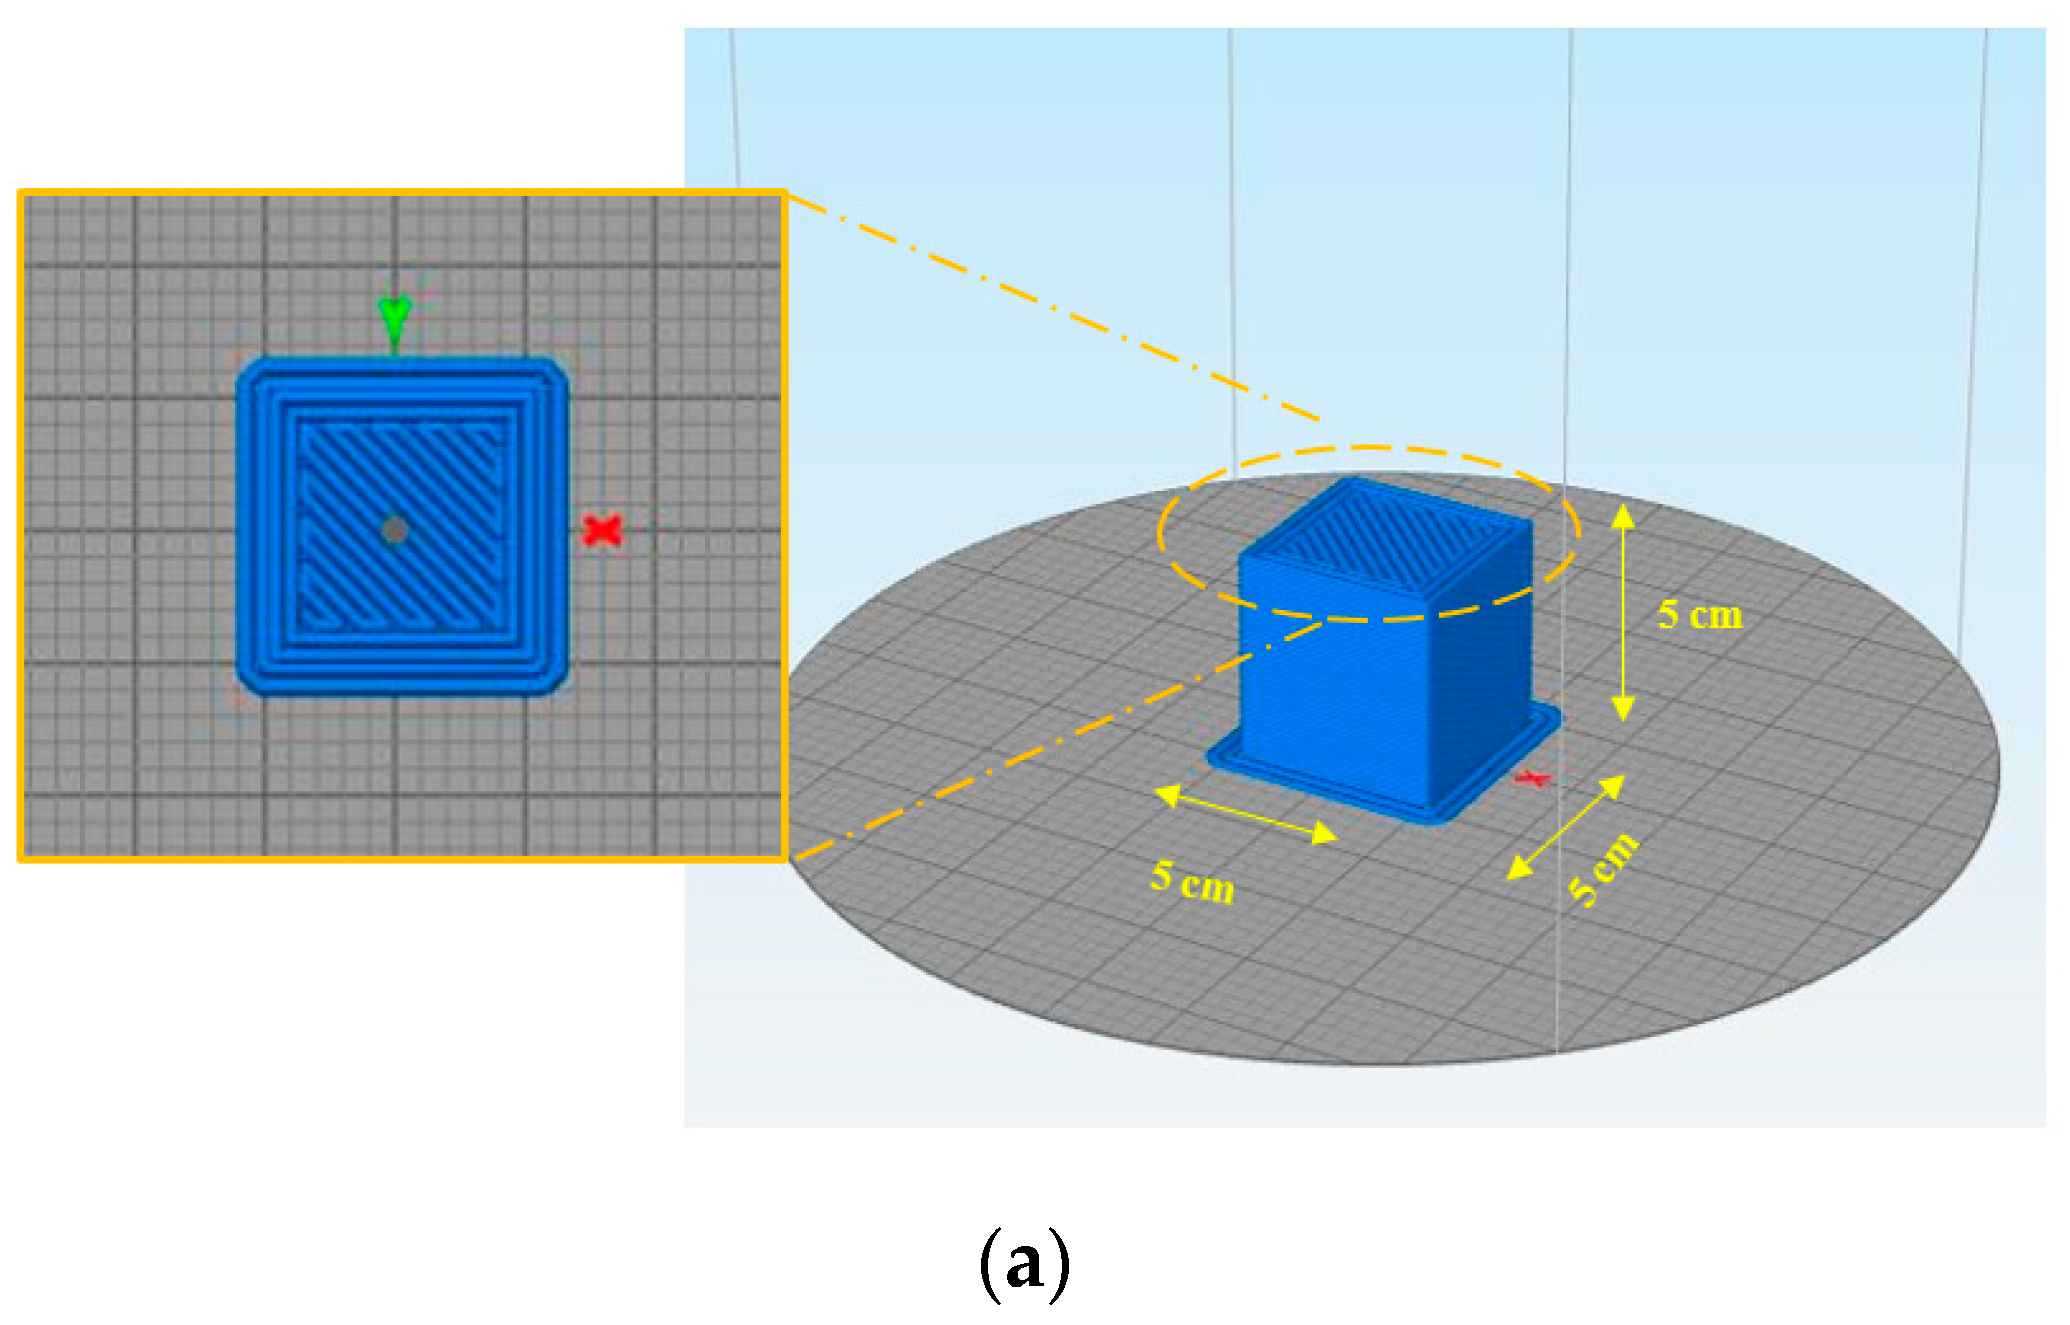
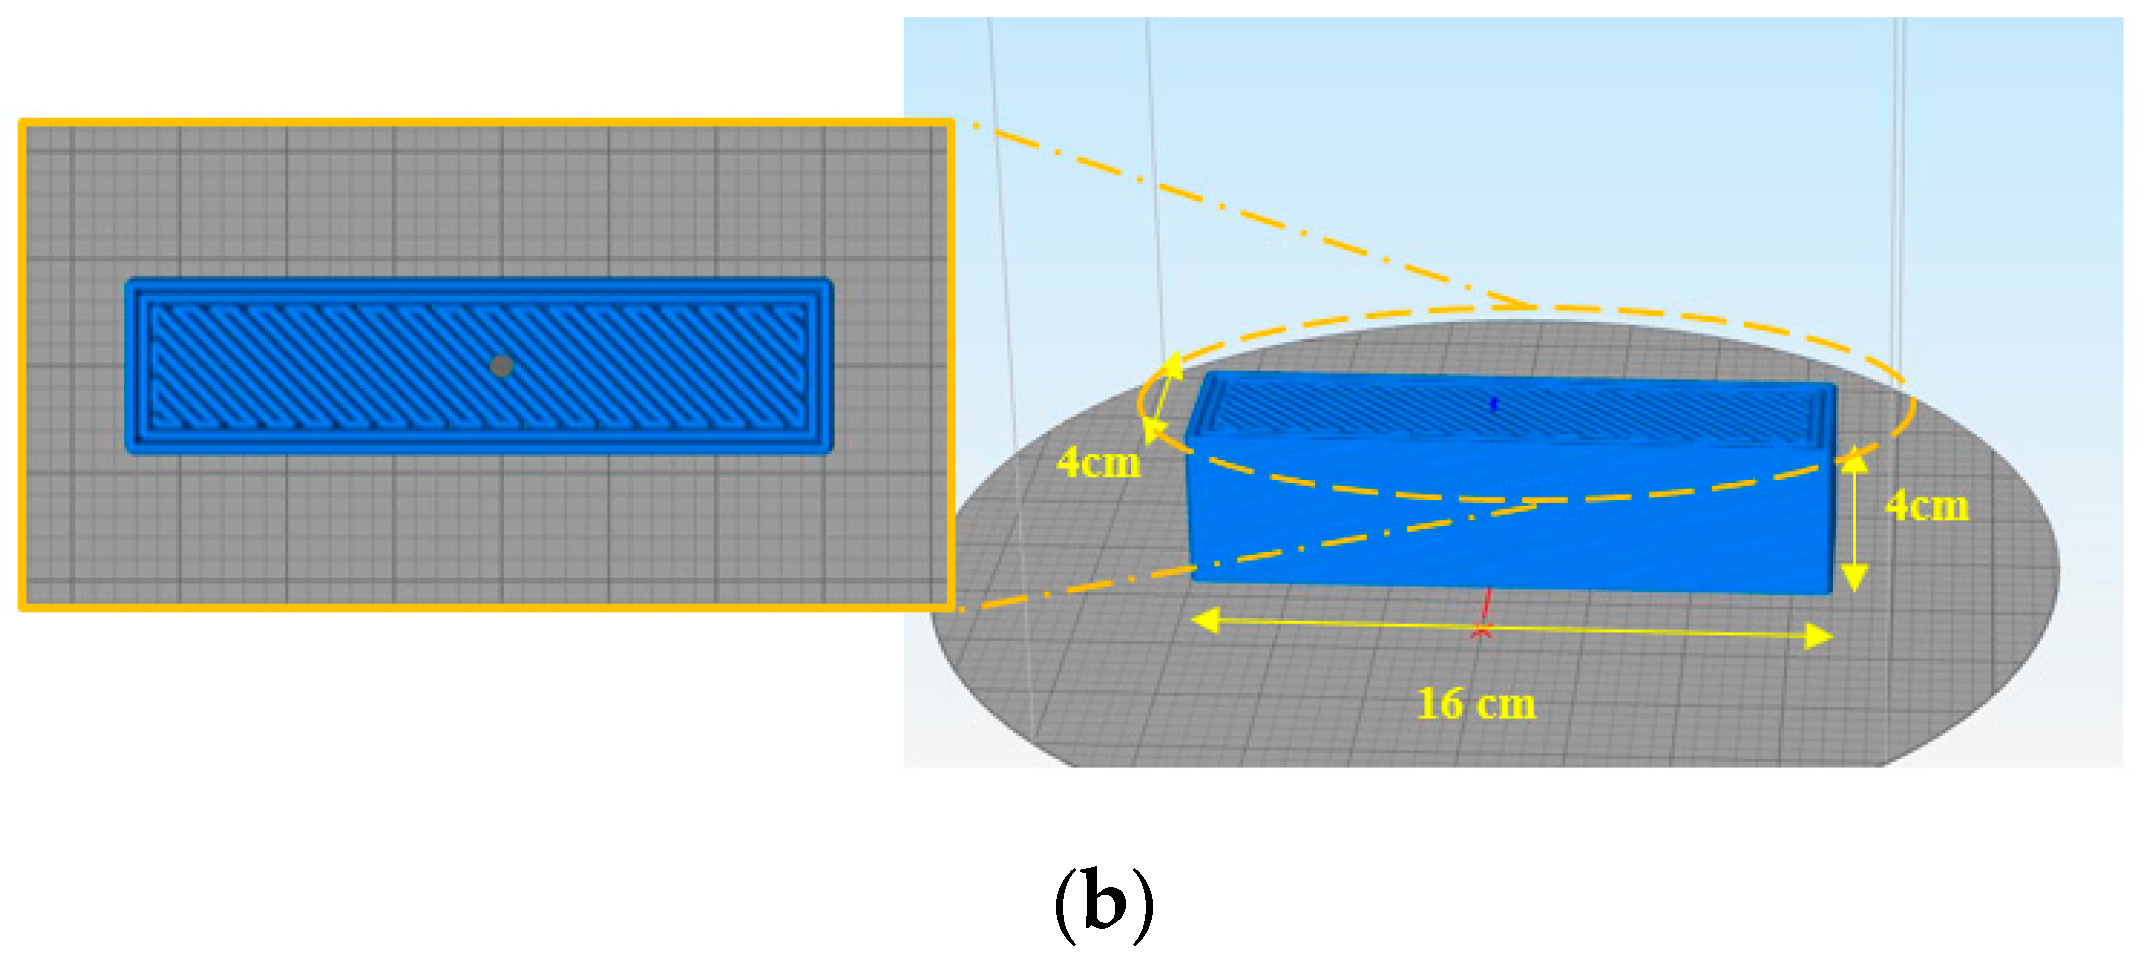
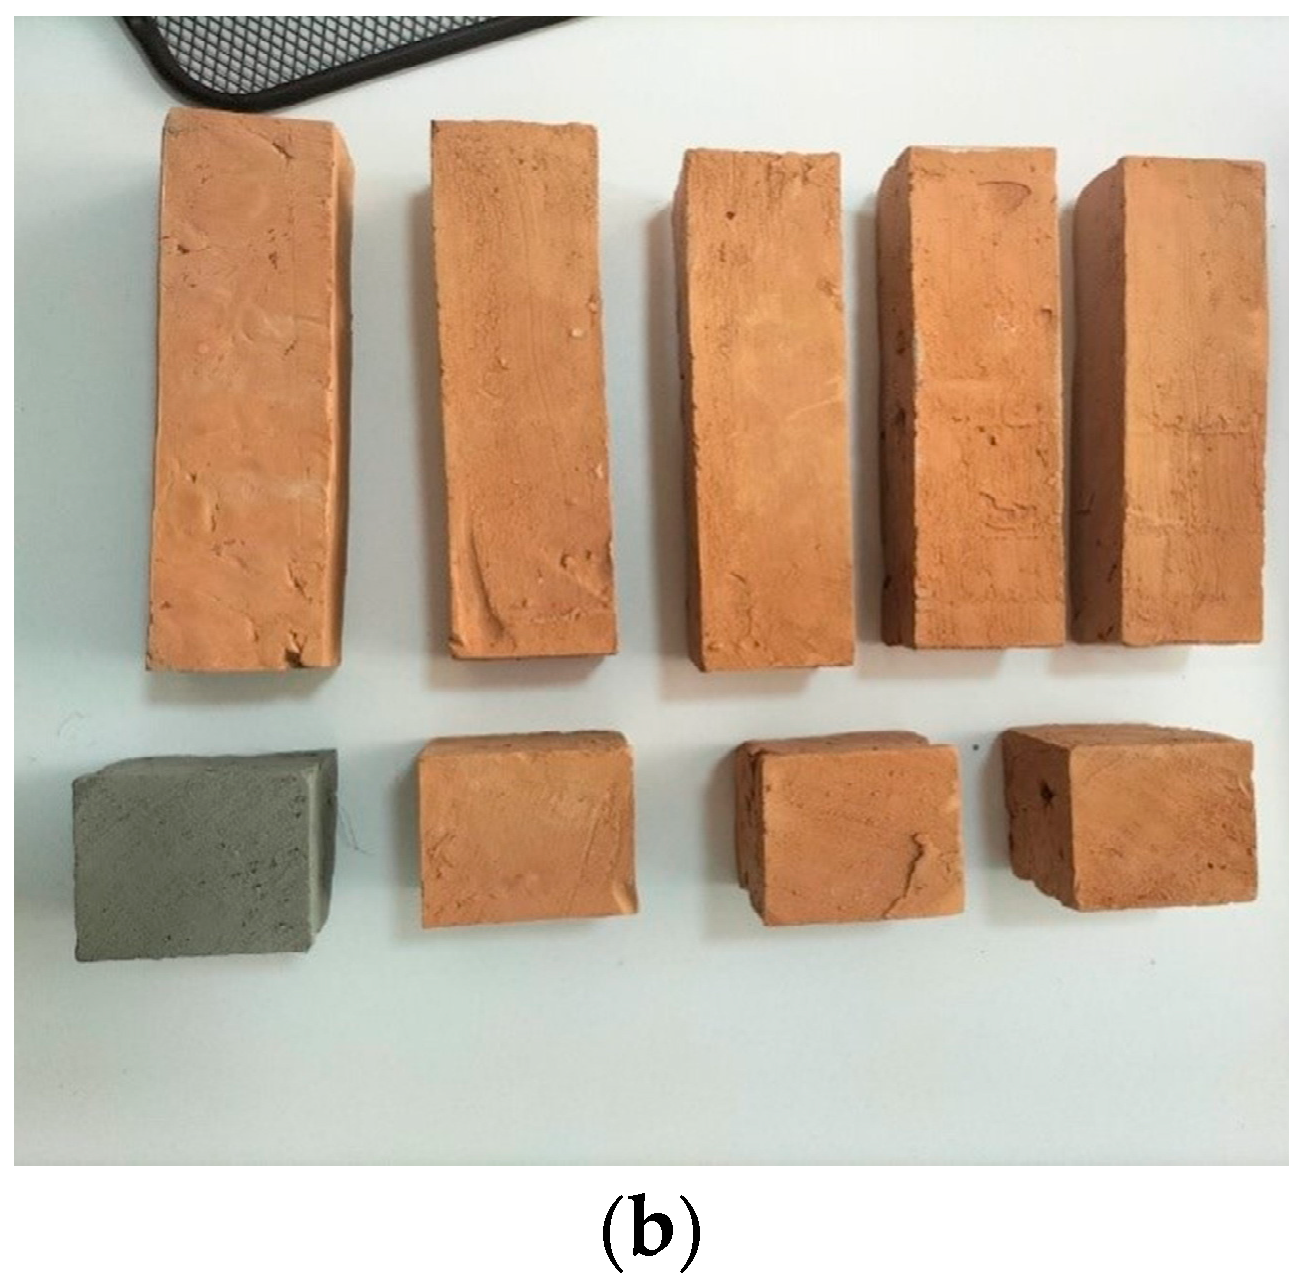
  • Printing system and sample preparation: The printing of clay samples was performed using a DeltaWASP 2040 3D Printer, along with an LDM WASP Extruder with a 3-mm diameter nozzle supplied by WASP, Lombarda, Italy. The printer was equipped with a screw system capable of regulating the clay output flow, allowing a rapid flow interjection, and a good retraction control. An external compressor was used with the printer to deliver the material under pressure. The details of the 3D printer used in this research are shown in Figure 4. The printed specimens were sketched using the computer-aided design software, Onshape 1.157 version. Additionally, a 3D printing slicing software, simplifying 3D, was used to create g-code print paths. The configurations of the compression and flexure samples, and the layered printing plan made with the Simplifying 3D software are presented in Figure 5. After preparing the clay mixtures, they were directly loaded into the 3D-printing system storage container. Then, a pressure of six bars was applied on the storage container piston and kept constant at this value during specimen printing, which was accomplished within an average of 20 min and 40 min for the cube and prism, respectively. Table 4 presents the printing and modeling parameters that yielded the best results. The printed cubes and prisms, along with their molded counterparts, are displayed in Figure 6.
  • Burning process: A high-temperature kiln was used to produce ceramic from raw clay. The printed and mold-cast samples were heated progressively during a 12 h time period from a low to a high temperature of 1000 °C (1830 °F) inside the electric ceramic kiln, as shown in Figure 7a. A red-colored cube after burning is shown in Figure 7b.

2.3. Mechanical Testing

Compressive and flexural strength tests were conducted on molded and printed samples.
Flexural strength: Printed and molded 40 × 40 × 160 mm prisms were tested on three-point bending, based on ASTM C348 [20]. Four batches were prepared for printed and molded samples. Three prisms were tested from each batch. The applied load direction was perpendicular to the layer’s staking direction, as shown in Figure 8, and the loading rate was set at 40 N/s until failure. The maximum load was recorded and the flexural strength in MPa was calculated as follows:
S f = 0.0028   P
where S f = flexural strength, MPa; and P = maximum load, N.
Compressive strength: According to the ASTM C109 [21], 50 mm cube samples (molded and printed) were used to determine the compressive strength. Four batches were also prepared for printed and molded cubes. Three samples were tested from each prepared batch. The direction of the applied load was similar to the flexural test, and the loading rate was set at 1400 N/s. Figure 9 shows the experimental set-up for flexure and compression testing.
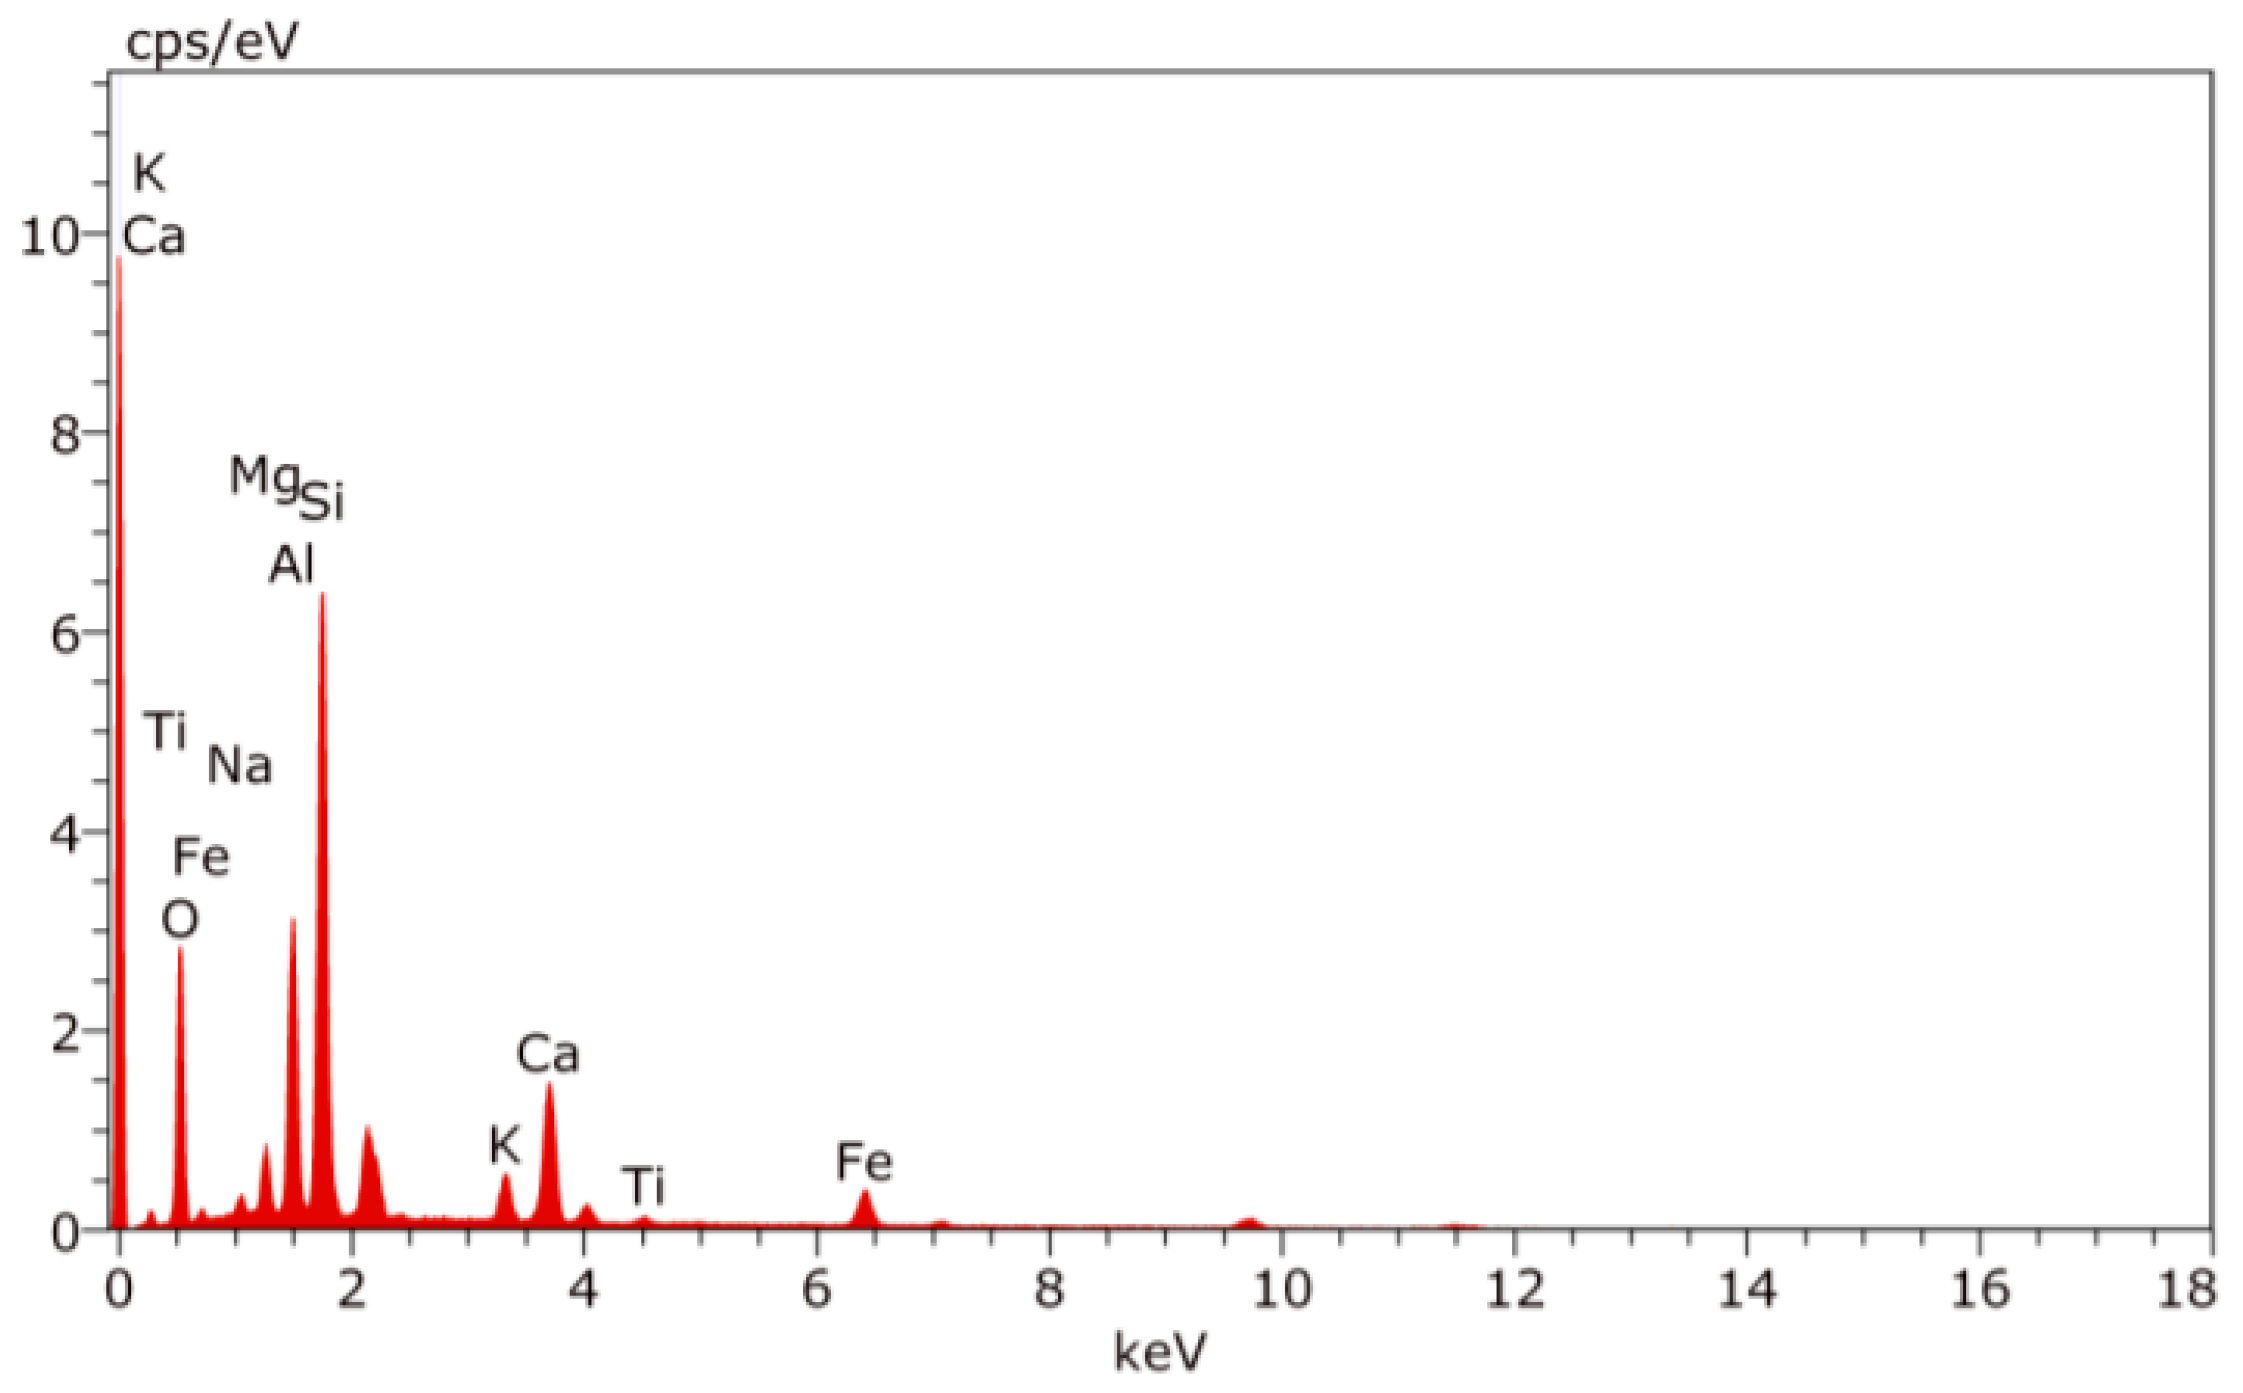
  • Microstructural and Elemental Analysis: The dispersion of GNPs within the clay matrix and their effect on strength factor were qualitatively examined by microscopic analysis. The analysis was carried out on the fractured surfaces of the samples using SEM secondary imaging techniques. The samples were cut into 1.5 mm thick pieces, and then they were dried in a vacuum chamber. After that, the surfaces were sprayed with a 10 nm thick gold-palladium coating every 40 min in order to dissipate any overcharges and to increase surface conductivity. The scanning process was then commenced, and varied images were captured for each mix sample at different scales. Simultaneously, the elemental compositions of the fractured sample surfaces were determined using an Energy Dispersive X-ray (EDX).

2.4. T-Statistical Test

The mechanical strength data were statistically analyzed using t-statistical tests to assess the significance of using GNPs when compared with the control clay batches. The test determines if a difference in the two groups’ means occurred due to a random possibility. The following conditions were taken into consideration:
-
A two-tailed significance level of 0.05 was considered.
-
The null hypothesis is correct when the average strength values of the control and GNPs mixes are equal.
-
The null hypothesis is rejected if the t-statistic ( s t ) is equal to or larger than the critical t-test value ( c r ).
-
When the null hypothesis is rejected, the strength values of the GNPs and control mixes are considered not equivalent, indicating that the use of GNPs in the mixes improved the strength significantly.
-
The degree of freedom ( D f ) was determined as:
D f = [ ( S 1 2 / y 1 ) + ( S 2 2 / y 2 ) ] 2 / [ [ ( S 1 2 / y 1 ) 2 / ( y 1 1 ) ] + [ ( S 2 2 / y 2 ) 2 / ( y 2 1 ) ] ]
where S 1 and S 2 are the standard deviations of samples 1 and 2, and y 1 , y 2 are the sizes of samples 1 and 2.
-
The standard error ( S E ) was computed using the following equation:
S E = ( S 1 2 / y 1 ) + ( S 2 2 / y 2 )
-
The t-statistics value (st) was determined by:
s t   =   | ( μ 1 μ 2 ) / S E |
where μ 1 = average value of sample 1, and μ 2 = average value of sample 2.

3. Results and Discussion

3.1. Mechanical Strength

Table 5 summarizes the average compressive and flexural strength results for all batches using three samples for each mix. It also presents the percent change in the strengths for the molded and printed samples under different GNP contents relative to the control samples of each series. The variation in experimental data is also expressed by the dispersion measurement of the coefficient of variation (1sd), which was computed using the following formula:
1 s d   ( % ) = S Y × 100 %
where: S = the standard deviation, and Y = the mean value.
All samples were examined after burning to assess hardness.
During the sample preparation stage, a trial compressive strength tests was performed for plain samples of raw clay (i.e., before burning). Tests results showed that only compressive strengths of 1.8 and 6.2 Mpa could be obtained using the printed and molded samples, respectively. This increment reflects a compressive strength increment of 92.1% and 74.3% for plain printed and molded samples after burning, respectively. It can thus be concluded that the burning process has a more significant effect on the printed samples than the molded ones, owing to the role of heat in layer fusion, making the 3DP clay stronger and denser, thereby increasing the layer bonding and reducing voids resulting from the printing process, which was definitely less than in the mold fabricated samples. Moreover, the burning process evaporated water from the 3DP clay, causing it to shrink and close voids. On the other hand, the less porous molded clay exhibited less shrinkage and sintering during firing, resulting in less effective void closures. It should be noted that accelerated temperatures increase the pozzolanic reactions in clay, and ultimately leads to higher early strengths.

3.1.1. Effect of GNPs’ Content on the Flexural Strength of Clay Samples

Figure 10 shows the 3-point bending test results for samples fabricated using both preparation methods. The molded samples exhibited the maximum flexural strength (18.4 Mpa) at 0.1 wt.% GNP, with an improvement of 7.5% compared to the molded control (MC). A further increase in GNP content decreased the flexural strength due to the GNPs’ aggregation in the matrix. This can be attributed to the clay’s solid structure, which restricts a good GNP dispersion inside the matrix at higher GNP contents, causing particle agglomeration that has a detrimental effect on strength. On the other hand, the GNPs’ efficiency was better exhibited in the printed samples as the printing process might contribute to a better and more uniform dispersion of GNPs in the clay matrix, even at higher concentrations. The highest flexural strength of 14.3 Mpa was obtained in the P-0.2%GNPs batch, resulting in a 21.1% increase in flexural strength in comparison with the printed control (PC) batch. Finally, it is worth noting that the layered structure of the printed samples contributed to the lower flexural strengths when compared with the molded samples.

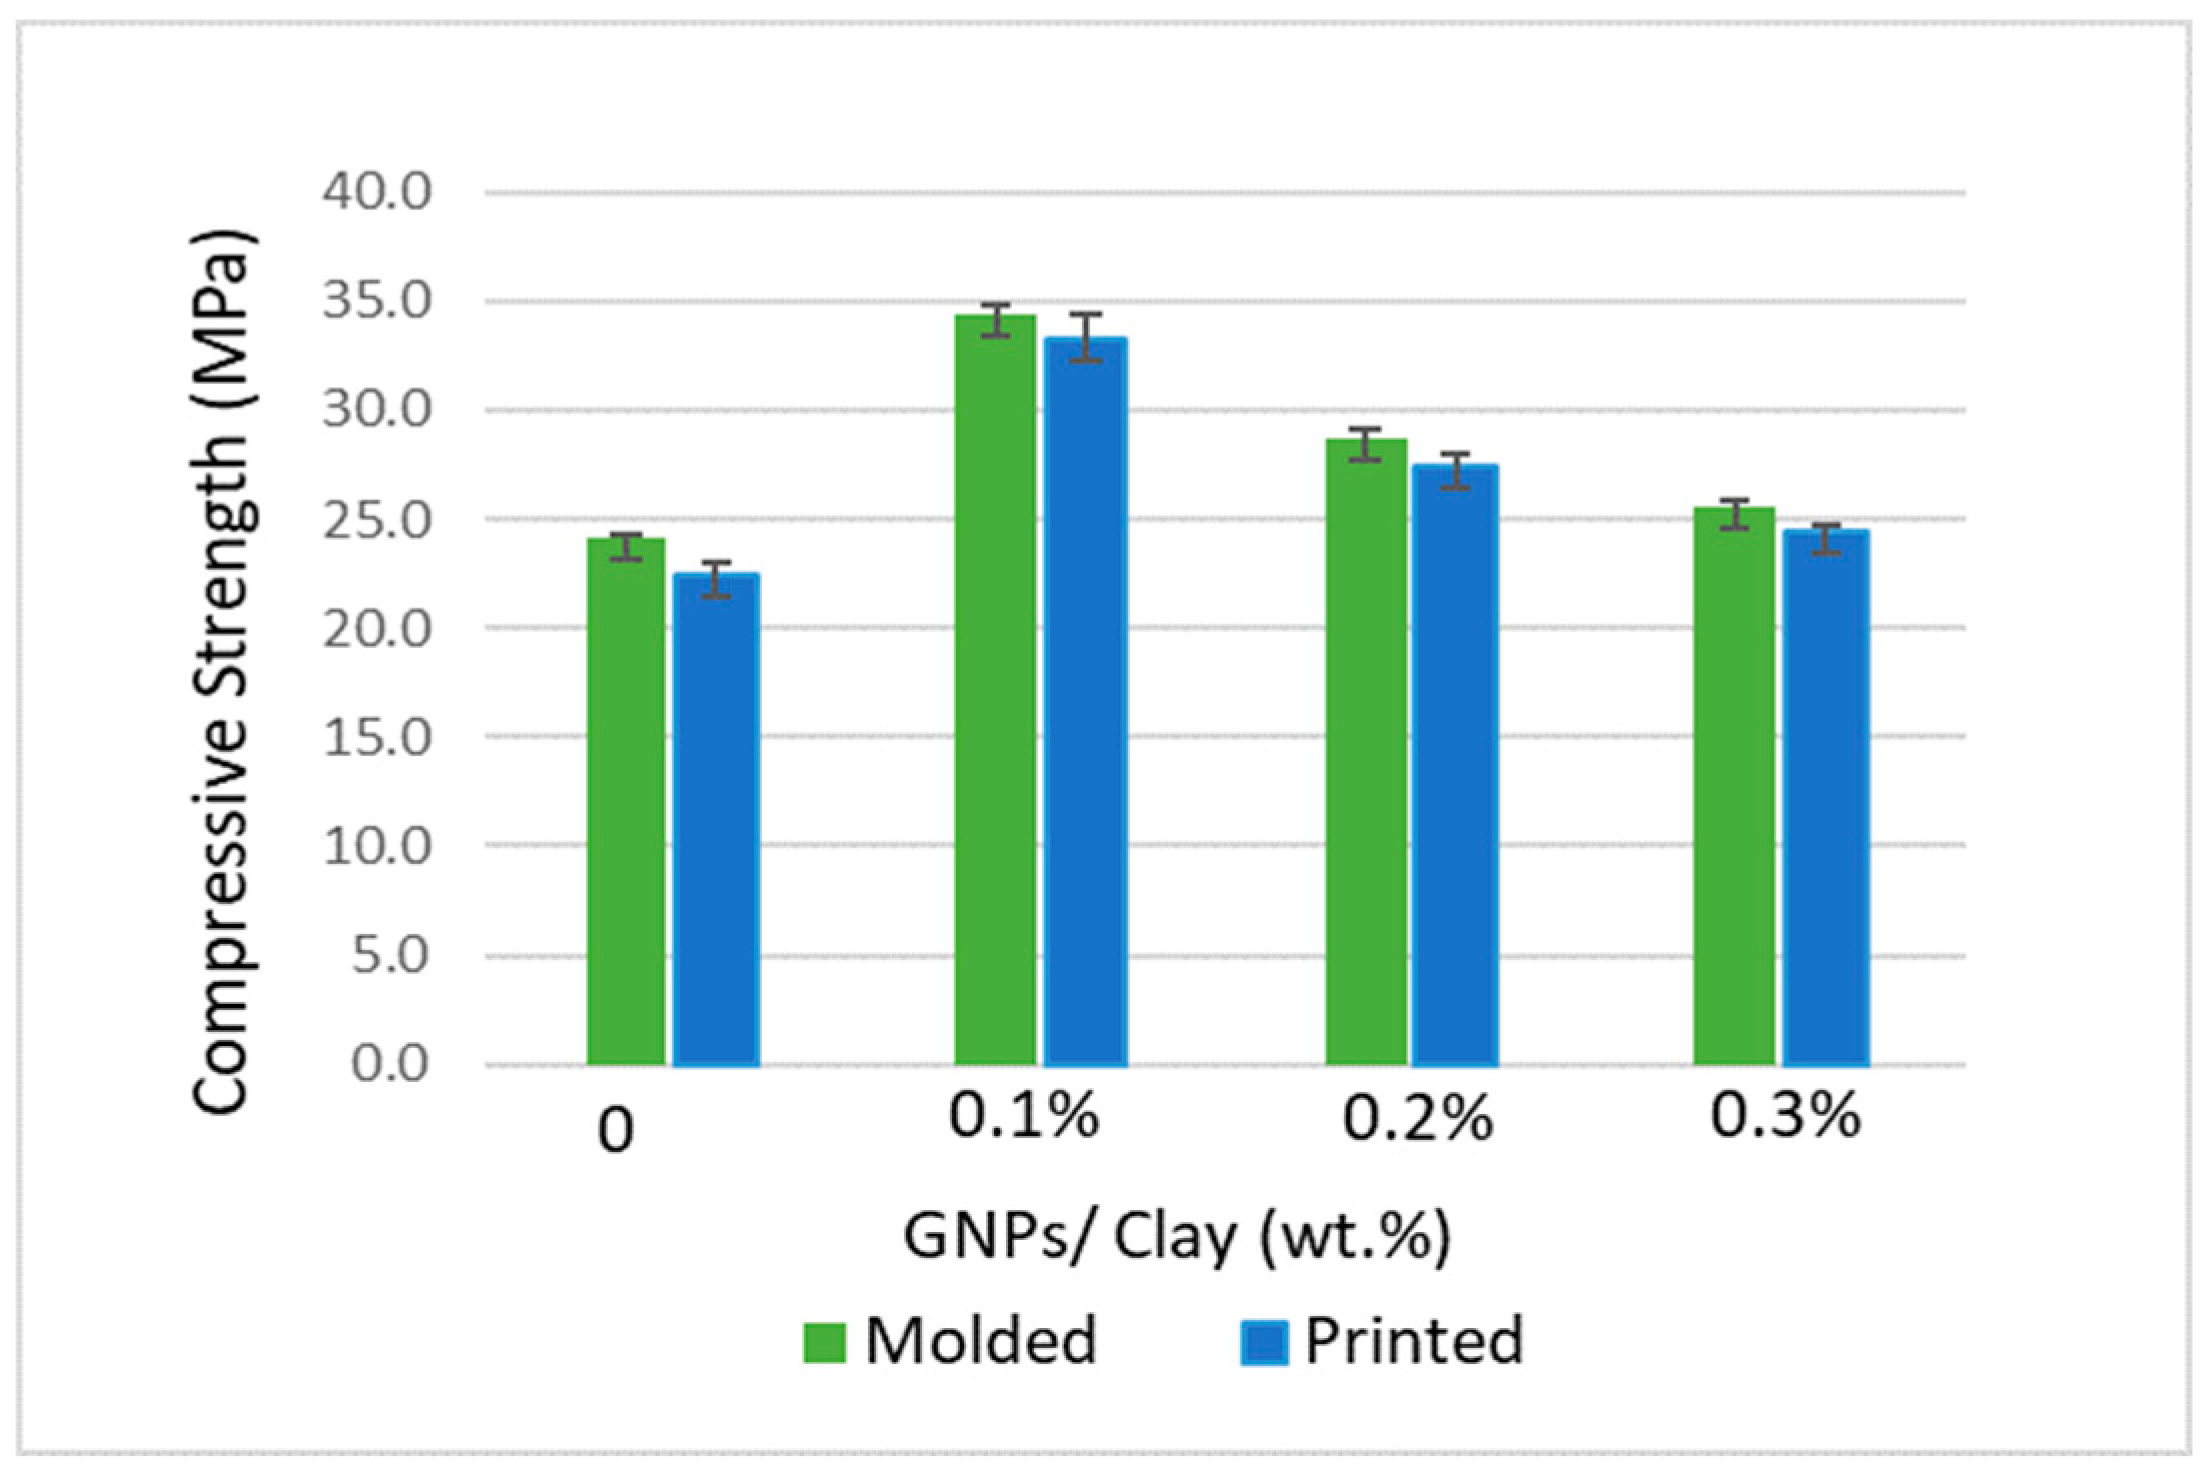
3.1.2. Effect of GNPs’ Content on the Compressive Strength of Clay Samples

Figure 11 compares the compressive strength results obtained for the molded and printed batches prepared using the three GNP dosages. Both fabrication methods resulted in approximately equivalent compressive strength values, as the differences between the results of those samples prepared with the same mixture proportions do not exceed 6% for the control batches and 1% for the nano-modified ones. Clay with a relatively low GNP content (0.1 wt.%) exhibited a 47% increase in compressive strength. While higher contents of GNPs reduced the compressive strength to an almost similar strength to the control samples. The combination of the bridging impact and pore-filling of GNPs at low concentrations were considered responsible for this improvement pattern.

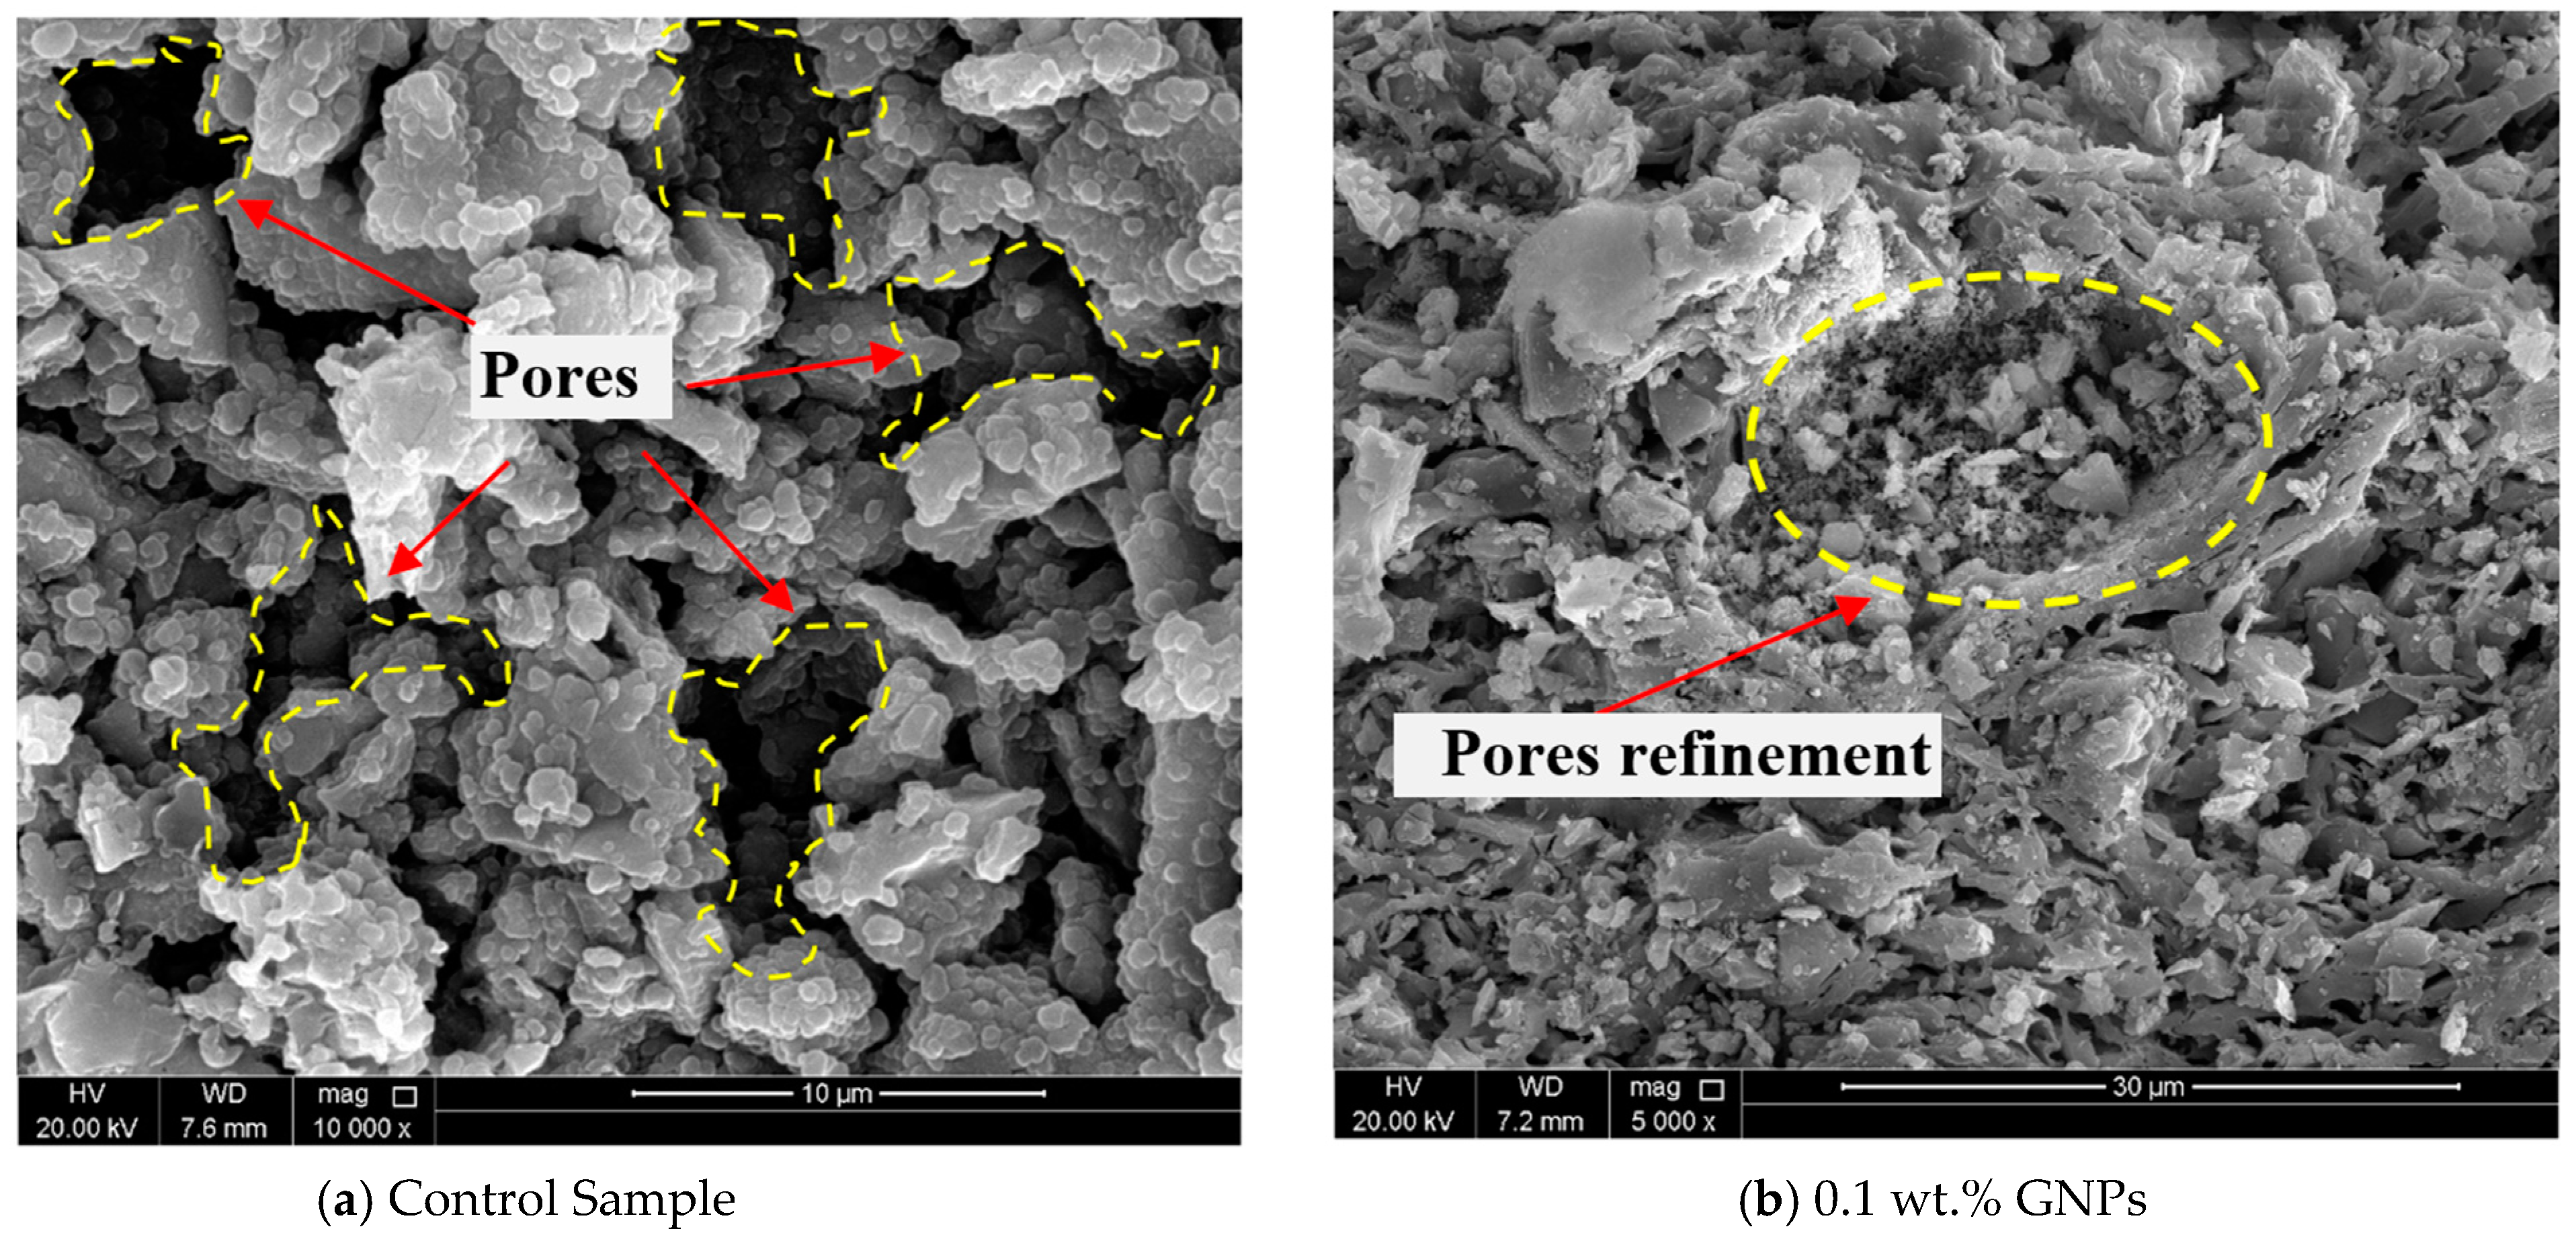
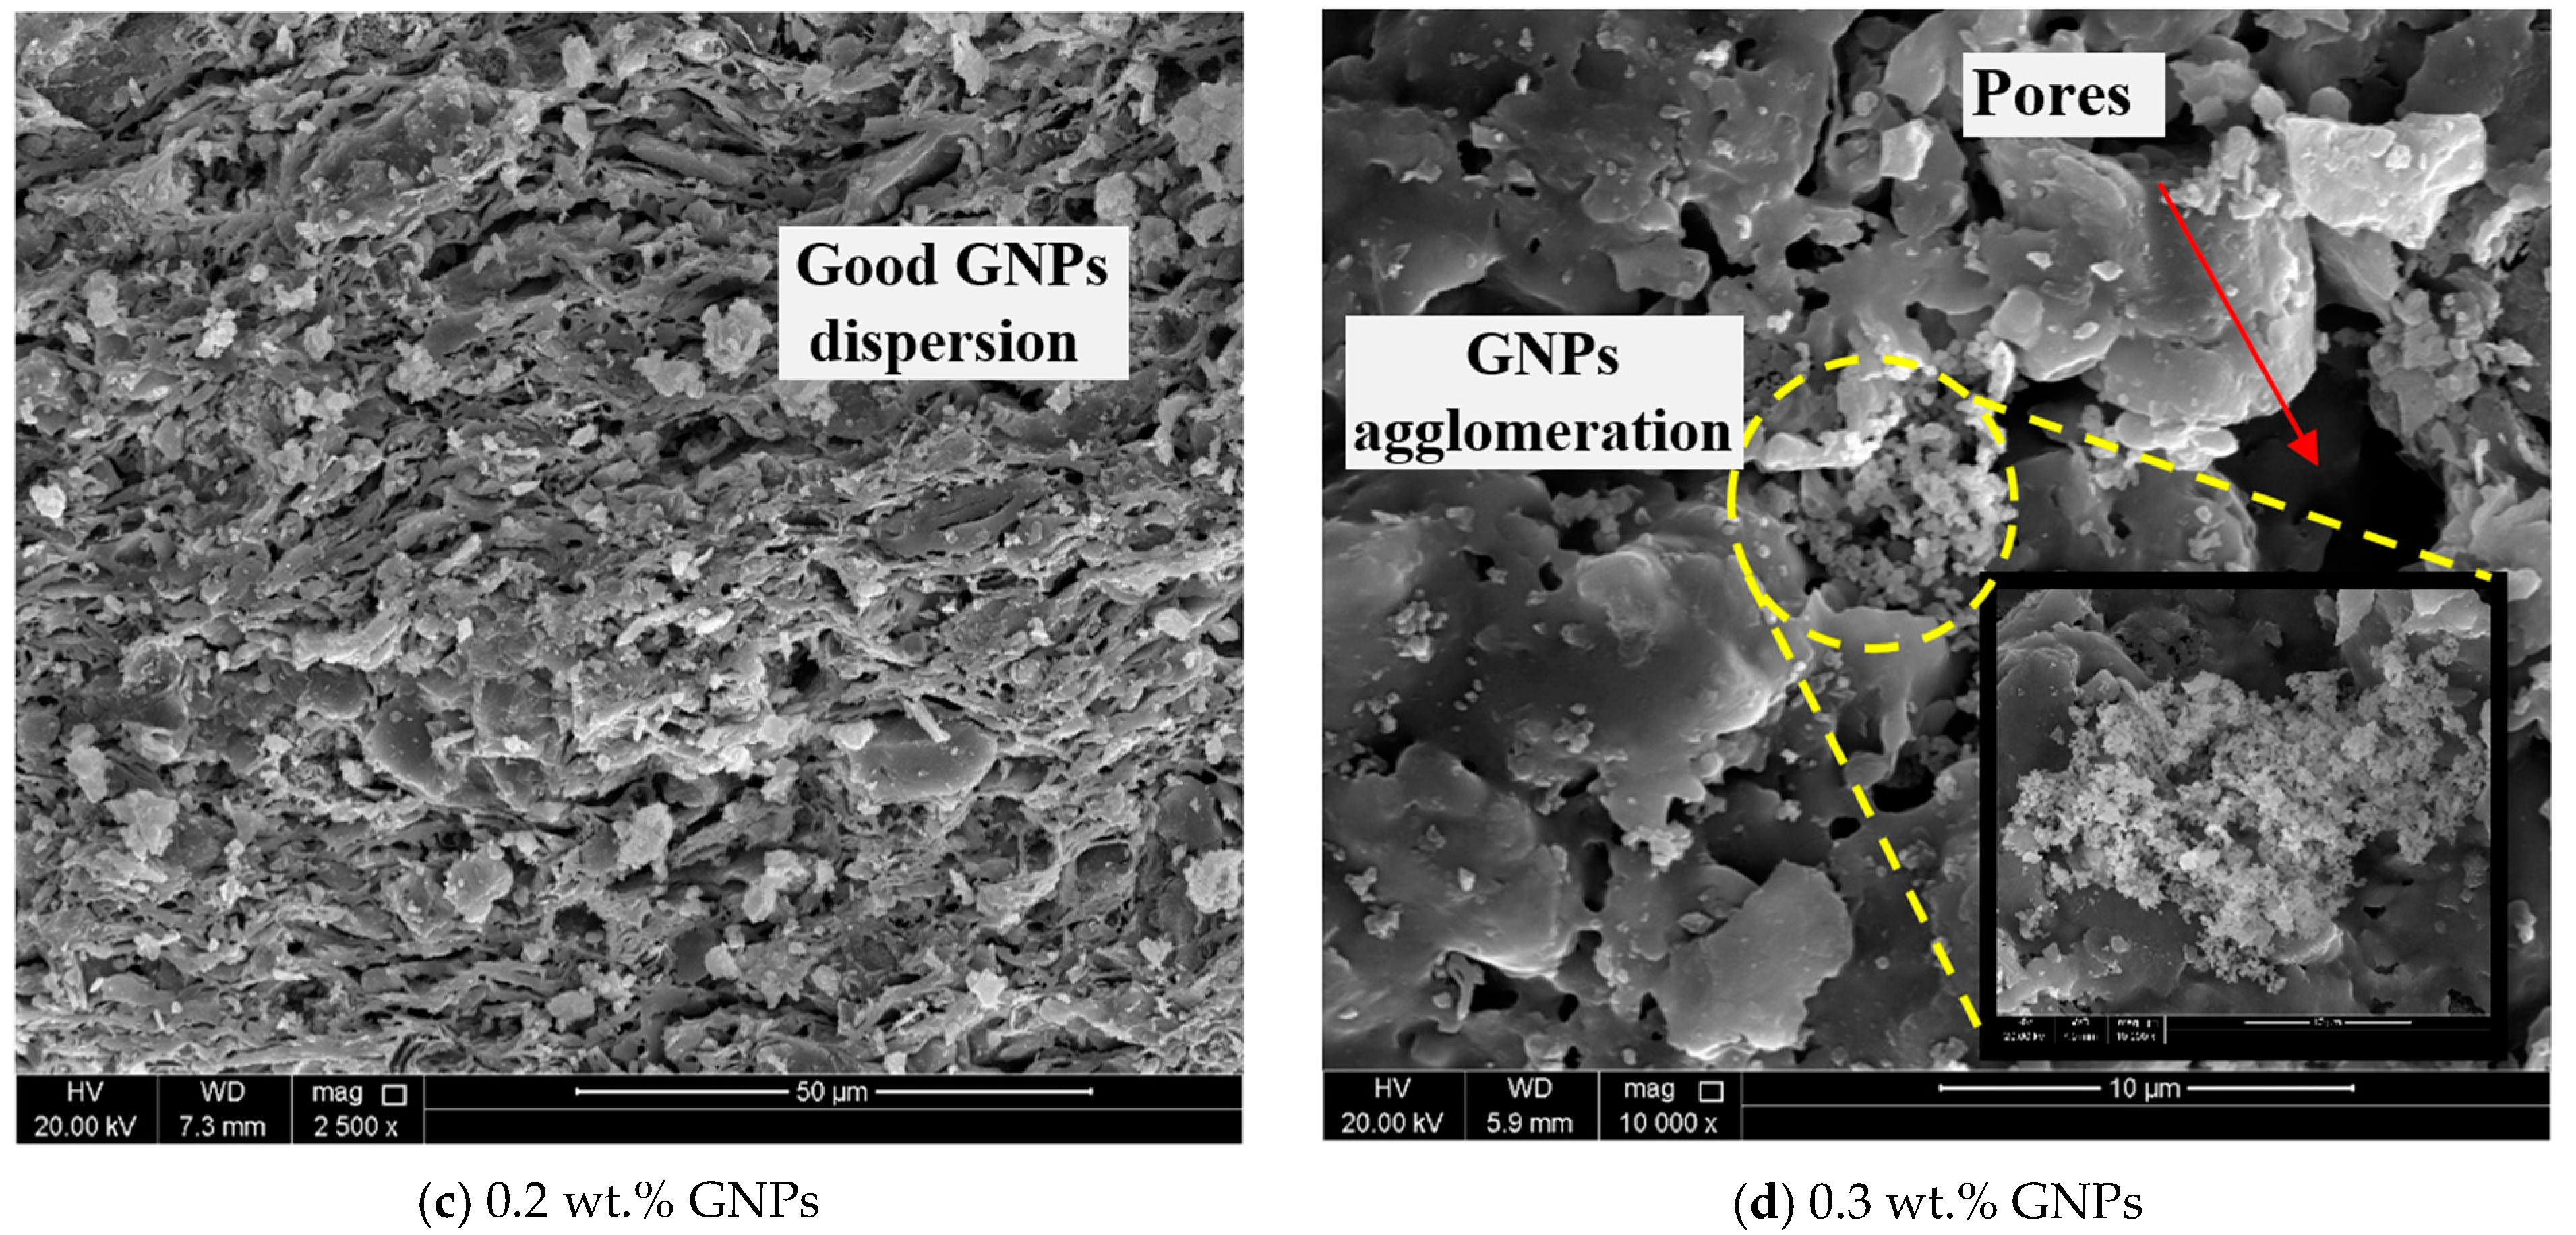
3.2. SEM Microstructural Analysis and EDX

A microstructural analysis was performed at different magnification ranges, i.e., 10 µm, 30 µm, and 50 µm, to better assess the reinforcing mechanism provided by GNPs in the burnt clay samples. The SEM micrographs shown in Figure 12 revealed several insights regarding GNP dispersion and agglomeration, as well as pore volume and distribution. The control burnt clay (Figure 12a) showed many scattered pores probably caused by the printing process, despite the relatively consistent and homogeneous microstructure. From Figure 12b,c, it can be observed that the samples prepared using low GNP dosages showed a compacted structure with more filled pores and a good distribution of GNPs within the clay matrix. Conversely, the microstructure of samples incorporating high GNP contents was porous, which could be attributed to the poor dispersion and aggregation of GNPs (Figure 12d). The SEM images support the reduction in compressive strength in relation to an increasing GNP content.
Along with SEM, the energy-dispersive X-ray (EDX) technique was used to make a qualitative and quantitative analysis that identified the elemental composition of the clay samples. The EDX spectrum displays peaks corresponding to the energy levels for which the most X-rays have been received. Each peak is specific to an atom and therefore represents a single element. The higher the peak in a spectrum, the more concentrated the element in the sample. A remarkable homogeneity of the clay and GNPs’ carbonaceous component was observed in the EDX analysis. For instance, Figure 13 shows the EDX analysis carried out on a selected area of 0.2 wt.% GNPs modified-clay batch. As illustrated, the sample composition contains the following major components: oxygen (42.05%), nitrogen (1.26%), silicon (21.91%), carbon (10.25%), magnesium (2.63%), aluminum (11.62%), calcium (10.25%), potassium (1.25%), titanium (0.25%), and iron (6.03%). The corresponding SEM images show that all these elements were uniformly distributed among the selected area of the sample, indicating the high homogeneity of the components’ distribution. Furthermore, the clay/GNP composite EDX results are similar to those of pure clay, indicating that there were no significant perturbations of the silicate bands caused by the interaction with the GNPs’ carbonaceous components, which are consistent with the findings of Hitzky et al. [22].

3.3. T-Statistical Analysis

T-Statistical analyses of the flexural and compressive test results are shown in Table 6 and Table 7, respectively. The analysis of the flexural strength data revealed that no significant enhancement occurred in the molded batches that were modified with GNPs in comparison with the control batch. On the other hand, all printed batches with different GNP contents exhibited significant improvement in their flexural strength compared to the plain mix. For compressive strength, the statistical analysis reported significant improvements in all batches regardless of the fabrication method or GNP weight fraction. Batches prepared using a low GNP weight fraction of 0.1% attained a much higher t-statistical value than the critical t-value when compared with those mixtures prepared using the high GNP contents of 0.2 and 0.3%, indicating the significant compressive strength improvement of those batches. Thus, these findings indicate the significance of adding GNPs to increase both the compressive and flexural strength of 3D-printed clay.

4. Conclusions

This research assessed the compressive and flexural strengths of nano-modified 3D-printed clay samples. The effect of GNP weight fractions on the microstructure properties was also analyzed. The results obtained for the printed samples were compared with those for molded ones. The statistical significance of using GNPs on the mechanical properties of 3D-printed clay was also determined. The following findings are warranted at this time:
  • Printed and molded nano-modified clay exhibited distinct results in terms of flexural strengths; however, the fabrication method used was the key parameter in impacting GNP dispersion.
  • Among all molded batches, the one prepared with 0.1 wt.% GNPs achieved the highest flexural strength, while the printed batch prepared using 0.2 wt.% GNPs resulted in the highest flexural strength, with an increment of 7.5% and 21.1%, respectively.
  • The compressive strength results showed a similar trend for the clay samples fabricated by both methods, using different GNP dosages.
  • Clay that incorporated 0.1 wt.% GNPs attained the highest improvement in compressive strength of 47.8% and 42.7%, for both printed and molded samples, respectively, when compared to control samples for each group. This enhancement could be attributed to pore filling and the uniform dispersion of GNPs at low content.
  • The high-resolution SEM images revealed a clear vision of the reinforcing mechanism provided by different GNP ratios to the clay, either positively with a good nano-sheet dispersion, or negatively due to the existence of a porous structure along with the aggregation, which supports the mechanical strength results.
  • EDX analysis indicated a similarity between the results of the clay/GNP composites and those of pure clay, showing that the interaction with the GNPs’ carbonaceous components did not significantly alter the silicate bands.
  • The t-statistical analysis results revealed the efficiency of using different weight fractions of GNPs to significantly improve the flexural and compressive strengths of 3D printed clay, as all measured t-statistical values were higher than the critical t-values.
  • The t-statistical analysis confirmed the significance of using a low GNP content of 0.1 wt.% in increasing the compressive strength of molded and printed clay.
  • In summary, 3D-printed clay enhanced with GNPs shows promise for sustainable and green construction by potentially improving material properties, reducing waste, and enhancing energy efficiency. However, further research and development are necessary to fully understand its long-term viability and address associated challenges such as cost-effectiveness, scalability, and the environmental impact of graphene production. Additionally, the long-term durability and the behavior of these materials under various environmental conditions needs to be further studied.

Author Contributions

M.O.M.: conceptualization, methodology, software, resources, writing—review and editing, visualization, project administration, and funding acquisition. M.M.A.-D.: writing—original draft, experimental work and testing, methodology, software, formal analysis, investigation, and data curation. M.O.A.: methodology, experimental work and testing, formal analysis, investigation, and data curation. R.T.: writing—review and editing, and project administration. A.A.T.: writing—review and editing, and project administration. A.S.: writing—review and editing, and project administration. K.N.: methodology, resources, and funding acquisition. All authors have read and agreed to the published version of this manuscript.

Funding

Tajarub Research and Development, Qatar, funded this work under the Program [MO 1-010922-001].

Data Availability Statement

The data used to support the findings of this study are available upon request from the corresponding author.

Acknowledgments

We gratefully acknowledge the generous assistance and valuable information provided by the Crown Prince Foundation’s Fablab in Jordan (TechWorks), particularly for the support provided by their technical team and for their clay additive manufacturing machines. Additionally, we express our sincere appreciation and gratitude to the Department of Quality Control at Cementra Jordan Factory for their aid in testing samples. Furthermore, we acknowledge the deanship of scientific research at Aqaba university of Technology for their support. The statements made herein are solely the responsibility of the authors.

Conflicts of Interest

The authors declare that they have no known competing financial interests or personal relationships that could have appeared to influence the work reported in this paper.

References

  1. Ngo, T.D.; Kashani, A.; Imbalzano, G.; Nguyen, K.T.; Hui, D. Additive manufacturing (3D printing): A review of materials, methods, applications and challenges. Compos. Part B Eng. 2018, 143, 172–196. [Google Scholar] [CrossRef]
  2. Romdhane, L.; El-Sayegh, S.M. 3D Printing in Construction: Benefits and Challenges. Int. J. Struct. Civ. Eng. Res 2020, 9, 314–317. [Google Scholar] [CrossRef]
  3. Rollakanti, C.R.; Prasad CV, S.R. Applications, performance, challenges and current progress of 3D concrete printing technologies as the future of sustainable construction—A state of the art review. Mater. Today Proc. 2022, 65, 995–1000. [Google Scholar] [CrossRef]
  4. El-Sayegh, S.; Romdhane, L.; Manjikian, S. A critical review of 3D printing in construction: Benefits, challenges, and risks. Arch. Civ. Mech. Eng. 2020, 20, 34. [Google Scholar] [CrossRef]
  5. Sakin, M.; Kiroglu, Y.C. 3D Printing of Buildings: Construction of the Sustainable Houses of the Future by BIM. Energy Procedia 2017, 134, 702–711. [Google Scholar] [CrossRef]
  6. Camacho, D.D.; Clayton, P.; O’Brien, W.J.; Seepersad, C.; Juenger, M.; Ferron, R.; Salamone, S. Applications of additive manufacturing in the construction industry–A forward-looking review. Autom. Constr. 2018, 89, 110–119. [Google Scholar] [CrossRef]
  7. Moropoulou, A.; Bakolas, A.; Anagnostopoulou, S. Composite materials in ancient structures. Cement and concrete composites 2005, 27, 295–300. [Google Scholar] [CrossRef]
  8. Weaver, C.E.; Pollard, L.D. The Chemistry of Clay Minerals; Elsevier: Amsterdam, The Netherlands, 2011. [Google Scholar] [CrossRef]
  9. Rael, R.; San Fratello, V. Clay bodies: Crafting the future with 3D printing. Architectural Design 2017, 87, 92–97. [Google Scholar] [CrossRef]
  10. Palumbo, J. Is this 3D-printed home made of clay the future of housing. CNN. Retrieved Oct. 2021, 10, 2021. Available online: https://edition.cnn.com/style/article/tecla-3d-printed-house-clay/index.html (accessed on 22 September 2022).
  11. Manikandan, K.; Jiang, X.; Singh, A.A.; Li, B.; Qin, H. Effects of nozzle geometries on 3D printing of clay constructs: Quantifying contour deviation and mechanical properties. Procedia Manuf. 2020, 48, 678–683. [Google Scholar] [CrossRef]
  12. Sangiorgio, V.; Parisi, F.; Fieni, F.; Parisi, N. The New Boundaries of 3D-Printed Clay Bricks Design: Printability of Complex Internal Geometries. Sustainability 2022, 14, 598. [Google Scholar] [CrossRef]
  13. Wolf, A.; Rosendahl, P.L.; Knaack, U. Additive manufacturing of clay and ceramic building components. Autom. Constr. 2022, 133, 103956. [Google Scholar] [CrossRef]
  14. Balaguru, P.; Chong, K. Nanotechnology and concrete: Research opportunities. Proc. ACI Sess. Nanotechnol. Concr. Recent Dev. Future Perspect. 2006, 254, 15–28. [Google Scholar] [CrossRef]
  15. Shen, M.Y.; Chang, T.Y.; Hsieh, T.H.; Li, Y.L.; Chiang, C.L.; Yang, H.; Yip, M.C. Mechanical properties and tensile fatigue of graphene nanoplatelets reinforced polymer nanocomposites. J. Nanomater. 2013, 2013, 565401. [Google Scholar] [CrossRef]
  16. Wang, B.; Jiang, R.; Wu, Z. Investigation of the mechanical properties and microstructure of graphene nanoplatelet-cement composite. Nanomaterials 2016, 6, 200. [Google Scholar] [CrossRef] [PubMed]
  17. Mohsen, M.O.; Al-Diseet, M.M.; Aburumman, M.O.; Taha, R.; Al Ansari, M.S.; Taqa, A.A. Hybrid effect of GNPs, GOs, and CNTs on the flexural and compressive strengths of cement paste. J. Build. Eng. 2023, 73, 106679. [Google Scholar] [CrossRef]
  18. Baomin, W.; Shuang, D. Effect and mechanism of graphene nanoplatelets on hydration reaction, mechanical properties, and microstructure of cement composites. Constr. Build. Mater. 2019, 228, 116720. [Google Scholar] [CrossRef]
  19. Tao, J.; Wang, X.; Wang, Z.; Zeng, Q. Graphene nanoplatelets as an effective additive to tune the microstructures and piezoresistive properties of cement-based composites. Constr. Build. Mater. 2019, 209, 665–678. [Google Scholar] [CrossRef]
  20. ASTM C348; Standard Test Method for Flexural Strength of Hydraulic-Cement Mortars. ASTM: West Conshohocken, PA, USA, 2021.
  21. ASTM C109/C109M; Standard Test Method for Compressive Strength of Hydraulic Cement Mortars (Using 2-in. or [50-mm] Cube Specimens). ASTM International: West Conshohocken, PA, USA, 2016.
  22. Ruiz-Hitzky, E.; Sobral MM, C.; Gómez-Avilés, A.; Nunes, C.; Ruiz-García, C.; Ferreira, P.; Aranda, P. Clay-graphene nanoplatelets functional conducting composites. Adv. Funct. Mater. 2016, 26, 7394–7405. [Google Scholar] [CrossRef]
Figure 1. Colorobbia Clay.
Buildings 13 02321 g001
Figure 2. TEM Image of GNPs at 500 nm Scale.
Buildings 13 02321 g002
Figure 3. Clay Mixture Preparation (a) clay cutting into small pieces, (b) addition of aqueous solution to the clay, and (c) ideal clay for printing.
Buildings 13 02321 g003
Figure 4. 3D-Printer and Extrusion System Details.
Buildings 13 02321 g004
Figure 5. Details of Ready-to-Print 3D Models of (a) Cube for Compressive Strength and (b) Prism for Fexural Strength.
Buildings 13 02321 g005aBuildings 13 02321 g005b
Figure 6. Fabricated Clay Samples Produced from (a) 3D Printing, and (b) Molding.
Buildings 13 02321 g006aBuildings 13 02321 g006b
Figure 7. (a) Ceramic Oven Utilized, and (b) Burnt vs Unburnt Clay Samples.
Buildings 13 02321 g007
Figure 8. Schematic of Loading Direction for Bending Test.
Buildings 13 02321 g008
Figure 9. Printed Samples During Flexural and Compressive Strengths Testing.
Buildings 13 02321 g009
Figure 10. Flexural Strength of Molded vs. Printed Clay Mixtures Prepared Using Different GNPs’ Contents.
Buildings 13 02321 g010
Figure 11. Compressive Strength of Molded vs. Printed Clay Mixtures Prepared Using Different GNPs’ Contents.
Buildings 13 02321 g011
Figure 12. SEM Micrographs of Pure and GNP-Modified Burnt Clay.
Buildings 13 02321 g012aBuildings 13 02321 g012b
Figure 13. EDX Spectra of a Clay Sample Containing 0.2 wt.% GNPs After 30 min of Immersion in 1.0 M HCl Solution (pH 4).
Buildings 13 02321 g013
Table 1. Test Matrix.
Test GroupProduction Technique Batch
#
Batch CodeGNPs/Clay
Weight Fraction (wt.%)
Molded GroupMolding1MC0.0
2M-0.1%GNPs0.1
3M-0.2%GNPs0.2
4M-0.3%GNPs0.3
Printed Group3D printing 5PC0.0
6P-0.1%GNPS0.1
7P-0.2%GNPS0.2
8P-0.3%GNPS0.3
M: molded, P: printed, C: control.
Table 2. Clay Composition www.colorobbia.com (accessed on 7 May 2022).
IdentificationContent %
Quartz40–60
Aluminum oxide 9–25
Yellow iron oxide 5–9
Table 3. Properties of Graphene Nanoplatelets www.cheaptubes.com/product-category/graphene-nanoplatelets/ (accessed on the 1 February 2022).
PropertyMaterial Specification
Average thicknessFriable to <4 nm
# of layers Friable to <4 layers
Surface Area Friable to >700 m2/g
Primary functionalityCOOH
Other Functionalities COH, C=O, other oxygen
Purity>99 wt.%
Source Material Natural graphite
Table 4. Printing and Modeling Parameters.
Printing Parameters
Average speed 90 mm/s
Flow 250–300%
Pressure 6 bar
Modelling Parameters
Layer height 1 mm
Infill percentage 100%
Infill shape Rectilinear
Table 5. Flexural and Compressive Strength of Clay Mixtures Prepared Using Different GNPs’ Contents.
GroupBatch No.Batch NameCompressive Strength
(MPa)
Flexural Strength
(MPa)
CS% Change1sd%FS%Change1sd%
Mold-cast Group1MC24.1-0.8117.1-1.7
2M-0.1%GNPs34.442.681.1418.47.56.2
3M-0.2%GNPs28.819.251.4314.8−13.87.7
4M-0.3%GNPs25.55.831.459.4−45.24.5
Printed Group5PC22.5-2.0411.1-2.1
6P-0.1%GNPS33.347.813.4611.86.32.7
7P-0.2%GNPS27.421.822.0514.321.12.5
8P-0.3%GNPS24.58.770.8213.715.92.4
CS: Compressive strength, FS: Flexural Strength.
Table 6. Flexural Strength Results t-Test.
MixDegree of Freedom (DF)Standard Error (SD)T-Statistic Value (Tst)Critical t-Test ValueRemarks
M-0.1%GNPS20.6761.914.303A
M-0.2%GNPS20.6800.604.303A
M-0.3%GNPS20.5941.74.303A
P-0.1%GNPS40.2283.092.776R
P-0.2%GNPS30.24413.093.182R
P-0.3%GNPS40.23011.272.776R
A: Accept Null Hypothesis, No Significant Enhancement. R: Reject Null Hypothesis, Significant Enhancement.
Table 7. Compressive Strength Results t-Test.
MixDegree of Freedom (DF)Standard Error (SD)T-Statistic Value (Tst)Critical t-Test ValueRemarks
M-0.1%GNPS30.25440.603.182R
M-0.2%GNPS30.26317.653.182R
M-0.3%GNPS30.2425.823.182R
P-0.1%GNPS30.71615.033.182R
P-0.2%GNPS40.41911.722.776R
P-0.3%GNPS30.2896.823.182R
A: Accept Null Hypothesis, No Significant Enhancement. R: Reject Null Hypothesis, Significant Enhancement.
Disclaimer/Publisher’s Note: The statements, opinions and data contained in all publications are solely those of the individual author(s) and contributor(s) and not of MDPI and/or the editor(s). MDPI and/or the editor(s) disclaim responsibility for any injury to people or property resulting from any ideas, methods, instructions or products referred to in the content.

