Article

Exploring the Layout Optimization of Commercial Service Space Affecting Energy Consumption in Communities Using Machine Learning

1
School of Architecture and Urban Planning, Shandong Jianzhu University, Jinan 250000, China
2
School of Architecture and Built Environment, Deakin University, Melbourne 3220, Australia
3
School of Innovative Design, City University of Macau, Macau 999078, China
*
Author to whom correspondence should be addressed.
Buildings 2024, 14(1), 108; https://doi.org/10.3390/buildings14010108
Submission received: 21 November 2023 / Revised: 23 December 2023 / Accepted: 29 December 2023 / Published: 31 December 2023
(This article belongs to the Special Issue AI and Data Analytics for Energy-Efficient and Healthy Buildings)

Abstract

:
The current design of commercial service spaces in many communities faces issues like incoherence, irrational resource allocation, and low utilization rates. These challenges contribute to increased energy consumption in communities, hindering the overall sustainable development of cities. As a representative community space in the urban environment, the commercial space within the campus requires continuous energy input. Its energy-efficient layout aligns with the principles of sustainable development. This paper uses the university campus as a case study to examine energy-efficient commercial space layout and community practices for environmental protection. Various factors influence the layout of inter-community commercial spaces, and the parameters for measuring the layout structure are diverse, considering the large sample size. Employing machine learning and big data processing to quantify development indicators across various industries and optimize their structure, resource allocation, and energy use has emerged as a viable tool for sustainable urban planning practices. This research seeks to utilize machine learning and data-driven optimization techniques to formulate a comprehensive framework for the sustainable allocation and design of business service spaces within communities. Firstly, we conduct a comprehensive investigation, which includes data collected by applying questionnaire surveys and field research, to assess and model the factors influencing the spatial layout of commercial services on university campuses. Secondly, the AEL machine learning model is constructed by combining the analytic hierarchy process to determine subjective weights, the entropy weight method to calculate objective weights, and the Lagrange algorithm to determine comprehensive weights. Thirdly, we assess and improve the layout of commercial service spaces. Then, by training and testing the Neural Network Model, we apply cases to ensure the accuracy of the machine learning calculation results. Qualitative analysis elucidates the varying factors influencing the sustainable layout of different commercial spaces. Quantitative analysis indicates that, within university campuses, the distance between commercial service spaces and residence halls is a crucial factor in fostering a more sustainable layout. Other significant factors include their location along major student routes and proximity to teaching areas. This study makes contributions not only to the specific field of optimizing commercial service space in communities but also to the broader discourse on sustainable urban development. It advances our understanding of the complex dynamics involved in crafting urban environments that are both efficient and environmentally friendly. Beyond theoretical considerations, the study provides practical solutions and recommendations applicable to implementing tangible improvements in resource allocation. These contributions aim to foster urban environments that are not only environmentally conscious but also economically viable.

1. Introduction

Low carbon, resilience, health, social equity, digital transformation, and the upgrading of various industries have highlighted the critical content of sustainable development. Driven by computers and artificial intelligence, the development of multiple research directions and industries has shown a quantitative trend [1]. Not only are universities responsible for propagating the notion of sustainable development in society, but the open research environment on university campuses facilitates the integration of sustainable development theories into real-world applications. University campuses can significantly contribute to global sustainability through educational initiatives and operational frameworks [2]. Indicator assessment is still the most appropriate and straightforward method for assessing its influencing factors. However, the current evaluation of commercial service space on university campuses needs to address the problem of insufficient integration of subjective and objective indicators, making the framework of upper and lower limit indicators unreasonable. In addition, existing studies tend to focus on a single research instrument, so overall structural indicators need more comprehensiveness and accuracy in large samples and multi-factor studies [3]. The allocation of commercial spaces on university campuses is a multifaceted challenge characterized by its intricate and diverse nature.
Leveraging the capabilities of machine learning algorithms presents an opportunity to comprehensively dissect and navigate this complexity, offering a potent and adaptable solution for optimizing spatial arrangements across communities of varying sizes and intricacies [4]. The advancement of machine learning and artificial intelligence has bestowed powerful tools for navigating the intricacies of open systems, particularly in the context of commercial space management within communities. Leveraging machine learning, an extensive dataset of this multifaceted system can be systematically categorized to establish a comprehensive set of indicators, thereby quantifying its sustainable development and defining its scope [5]. Machine learning algorithms can integrate subjective survey data and objective measurement data to establish a unified community commercial space evaluation index. Constructing a comprehensive analysis framework and a machine learning model and program allows for analyzing relationships among various indicators, including human flow, traversal, and accessibility in communities [6]. Additionally, machine learning model algorithms exhibit a degree of dynamism, enabling the prediction of future development trends through the analysis of historical data and real-time information collection. This capability allows business service spaces to more effectively adapt to the evolving needs of the communities [7]. Ultimately, machine-learning-generated index data becomes increasingly accurate as the sample size increases. This precision is achieved through continuous learning and improvement based on feedback data, incorporating suggestions for spatial optimization for layout from various angles [8].
This paper integrates machine learning algorithms to optimize campus commercial service space layout to reduce campus energy consumption. It uses machine learning to establish a fundamental model for determining campus commercial space evaluation indicators. The process involves three key steps: (1) Defining subjective factors impacting campus commercial space layout and specifying the objects for evaluation. (2) Measuring the actual campus commercial space layout and structural parameters, analyzing the relationship between parameters and their standardized weights through machine learning. (3) Utilizing a substantial dataset, the paper constructs a comprehensive model for evaluating the sustainability of campus commercial space. This research addresses the determination of evaluation indicator weights for communities’ commercial service spatial layout and delves into the factors influencing this layout based on the evaluation system. The proposed approach not only enhances decision-making accuracy for the layout of various business service spaces in communities but also integrates considerations for energy consumption. Factors such as regional location, overall planning, and investment priorities are systematically analyzed to optimize both the functional arrangement of commercial services and energy-efficient practices [9].

2. Literature Review

The development of the economy and advancements in science and technology have increasingly emphasized the design and planning of communities. Nevertheless, various issues arise during community design and planning, including insufficiently rational planning and design of community commercial facilities, a lack of scientifically structured layouts, weak interconnections among community functions, and the inability to achieve resource optimization [10]. Versteijlen examined the travel patterns of university students in the Netherlands [11], and the findings indicate that many university students contribute to air pollution to some extent by emitting greenhouse gases during their daily commute to and from classes. The spatial arrangement of commercial service spaces assumes paramount significance as a critical determinant in the comprehensive sustainable development of the entire campus, meticulously designed layouts for commercial spaces can significantly curtail the direct distance separating the served population and commercial areas, thereby preventing energy wastage due to excessive communities’ transportation [12]. This approach aids in curtailing greenhouse gas emissions and enhancing the effectiveness of public-resource utilization, enhancing the overall utilization of community areas and minimizing the need for expanding construction onto green spaces, thereby increasing the coverage of green vegetation and biodiversity [13]. The flexible layout of commercial service spaces in communities allows seamless integration with sustainable infrastructure, promoting energy-efficient practices. During community retail space reconfiguration, there is an opportunity to establish a versatile community supporting sustainable development through energy-efficient design, renewable-energy utilization, and landscape enhancements [14]. Some institutions are actively working toward achieving sustainability in their communities. These efforts encompass several approaches, including the implementation of environmental management systems, which comply with the ISO 14001 standard [15] and the Eco-Management and Audit Scheme (EMAS) regulations, on communities [16,17], and the regular assessment and publication of sustainable development reports [18]. In recent years, research on low energy consumption in communities’ commercial service spaces has gained prominence. Scholars have explored various aspects of sustainable communities’ development, with a focus on reducing energy consumption. Partially, scholars investigate sustainable strategies for enhancing energy efficiency in community commercial spaces, with an emphasis on the integration of renewable-energy sources and building design, and they examine occupant behavior as a significant factor in enhancing the energy efficiency of community commercial spaces [19]. Furthermore, the study aims to evaluate sustainable transportation choices that can contribute to energy conservation in communities’ commercial districts and highlight the importance of rigorous evaluation metrics and monitoring systems to assess the impact of sustainability initiatives in communities’ commercial areas [20].
However, most of the existing literature has mainly focused on the relationship between the overall space of communities and sustainable development [21]. Theoretical research on commercial service space in communities needs to be more comprehensive, while practical research on community commercial service space layout is even scarcer [22]. Notable examples in the literature research include, in 2021, a research scholar assessed the integration and accessibility of public service facilities within universities, utilizing the concept of a living circle and employing space syntax analysis to adjust various functional components throughout the community life cycle [23]. The same year, the researcher examined students’ movement patterns, heat dispersion along their pathways, contentment levels, and conceptual designs for community commercial facilities. Factors like road accessibility to commercial services were analyzed using space syntax analysis [24]. In 2011, researchers concentrated on improving allocation strategies for communities’ public service facilities, aligning resource allocation, and establishing collaborative mechanisms [25].
Drawing from the existing literature, this study is guided by the following central research inquiries:
1.
What specific attitudes and preferences do community users hold regarding the incorporation of sustainable development practices in in-community commercial spaces?
2.
How can we create a standardized and scientifically sound evaluation index for community commercial spaces, considering the current layout?
3.
What sustainable development strategies should be employed for the layout of communities’ commercial spaces, aligning with energy-consumption-reduction goals and principles?
In light of these inquiries, this study aims to delineate the role of machine learning in creating metrics for assessing energy consumption in communities’ commercial spaces and offer suggestions for enhancing sustainability strategies in communities. The communities of Shandong Jianzhu University serve as a case study for this energy-efficient campus. It involves relevant quantitative data analysis and the examination of survey data.

3. Materials and Methods
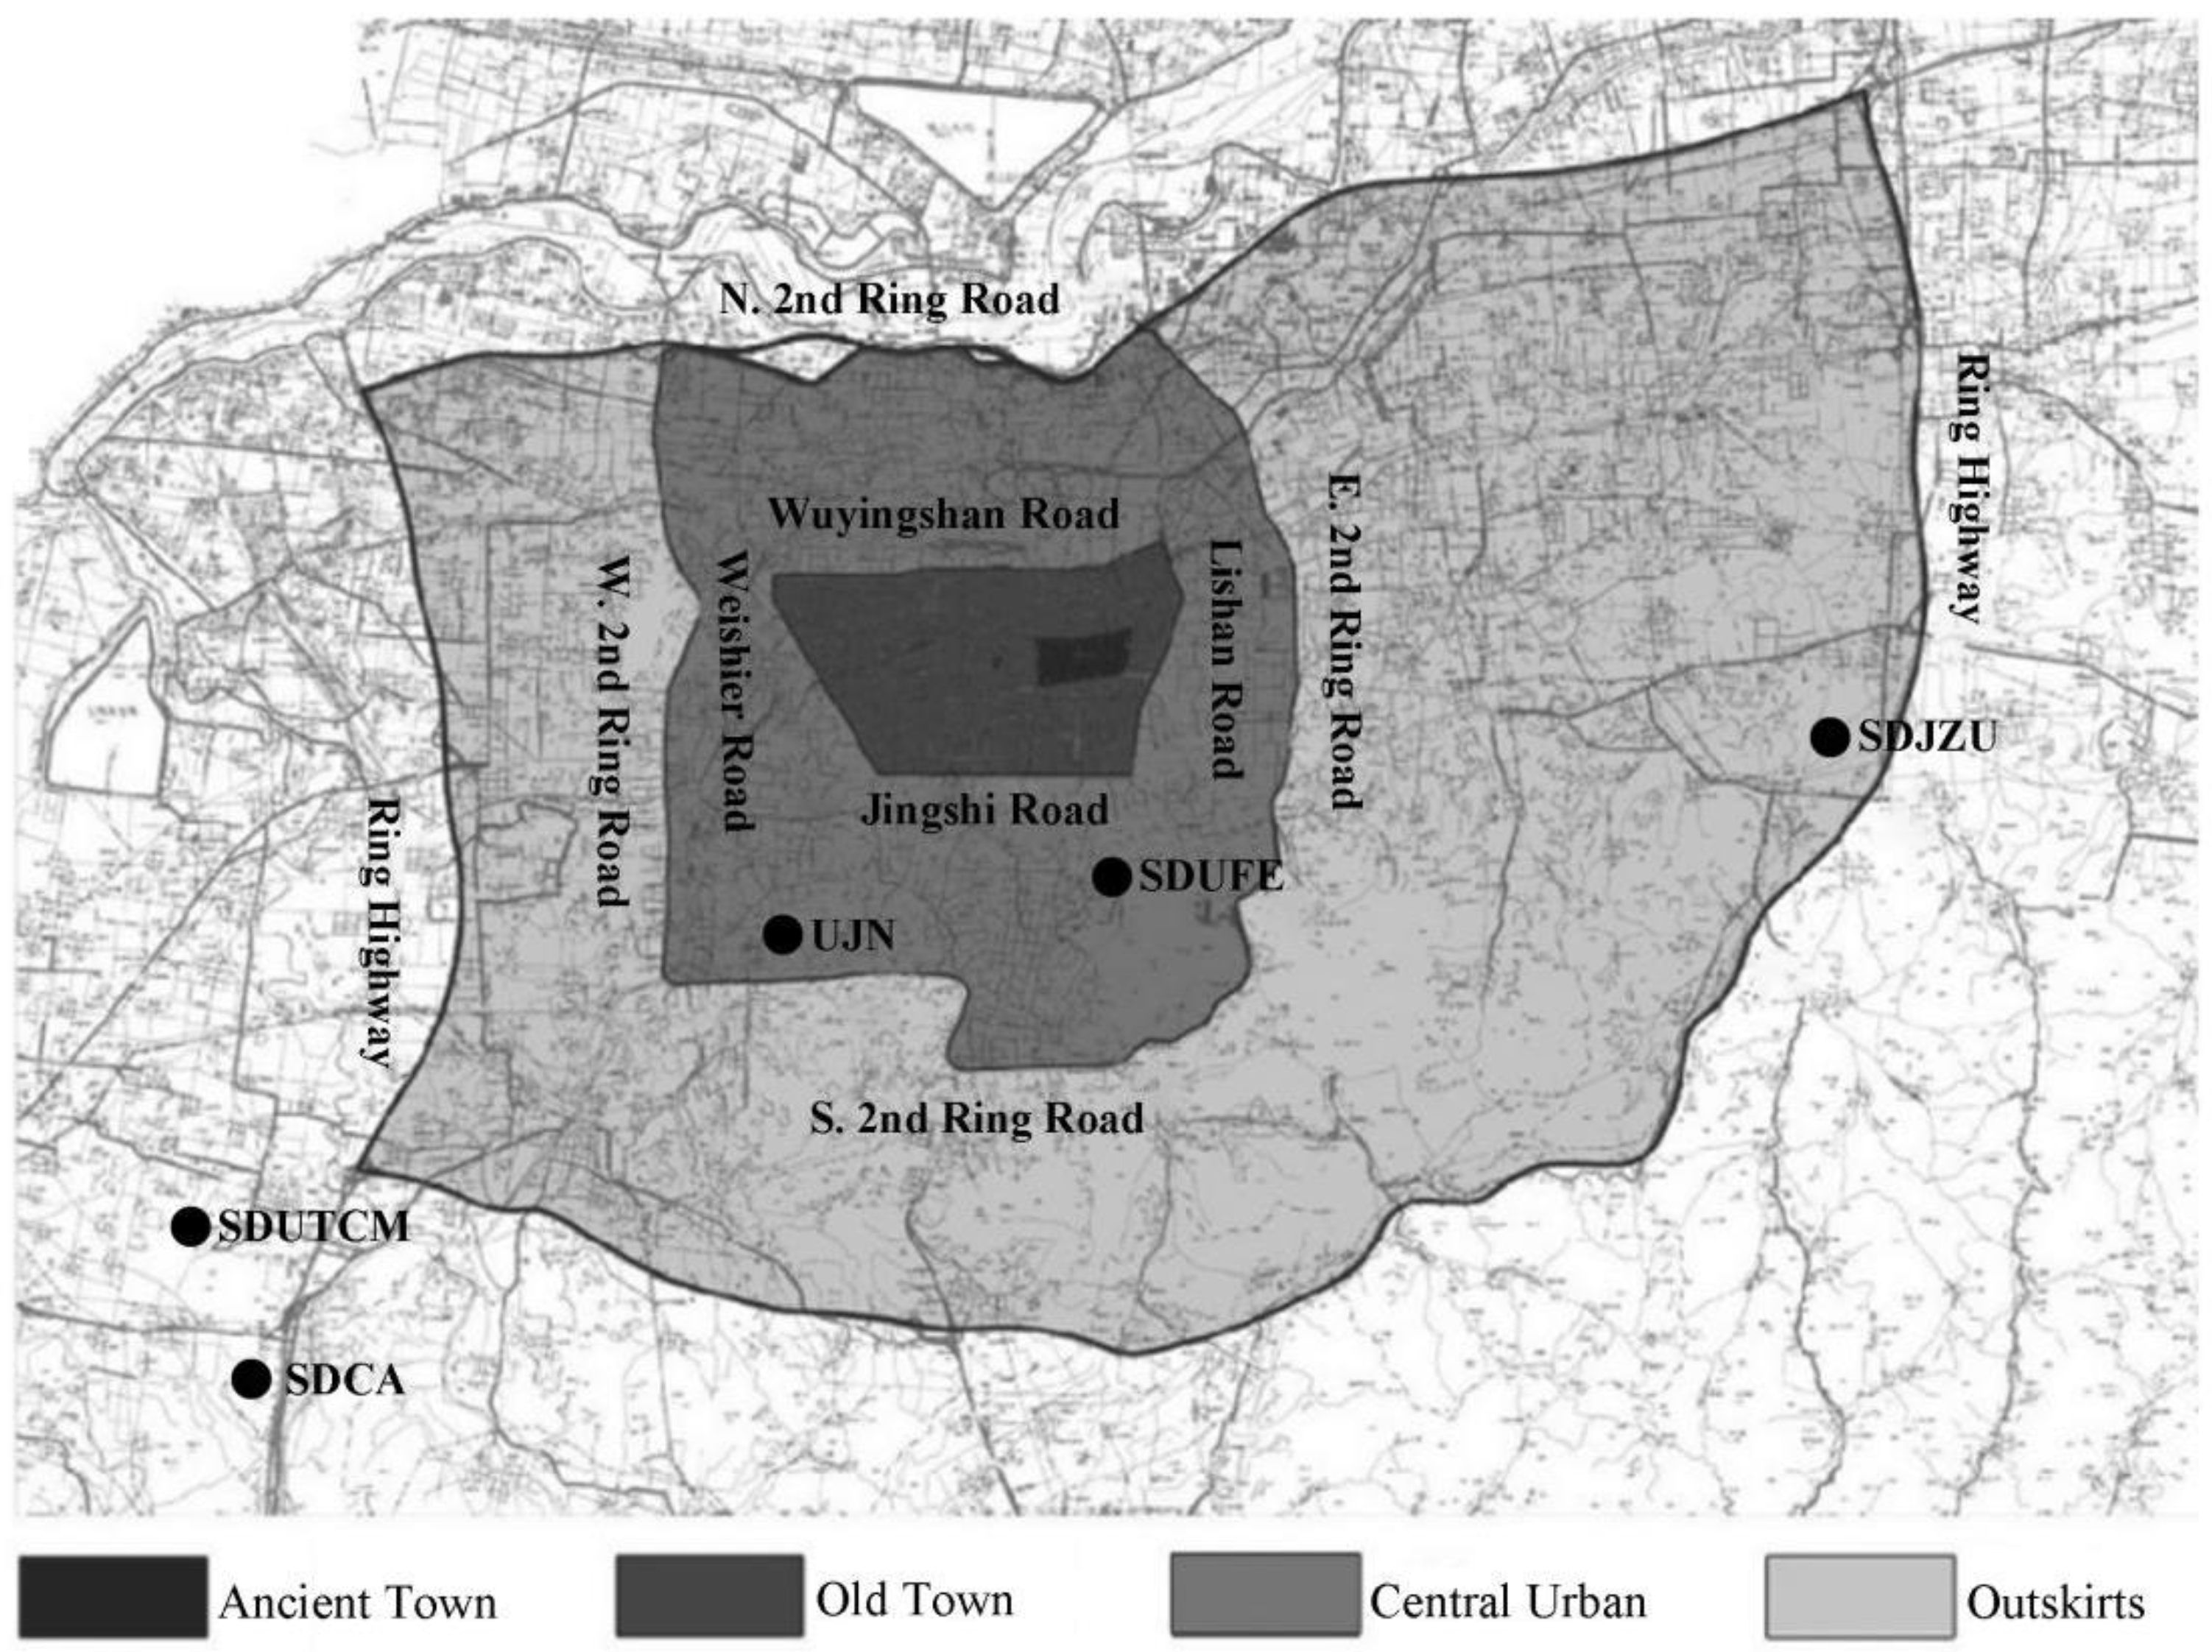
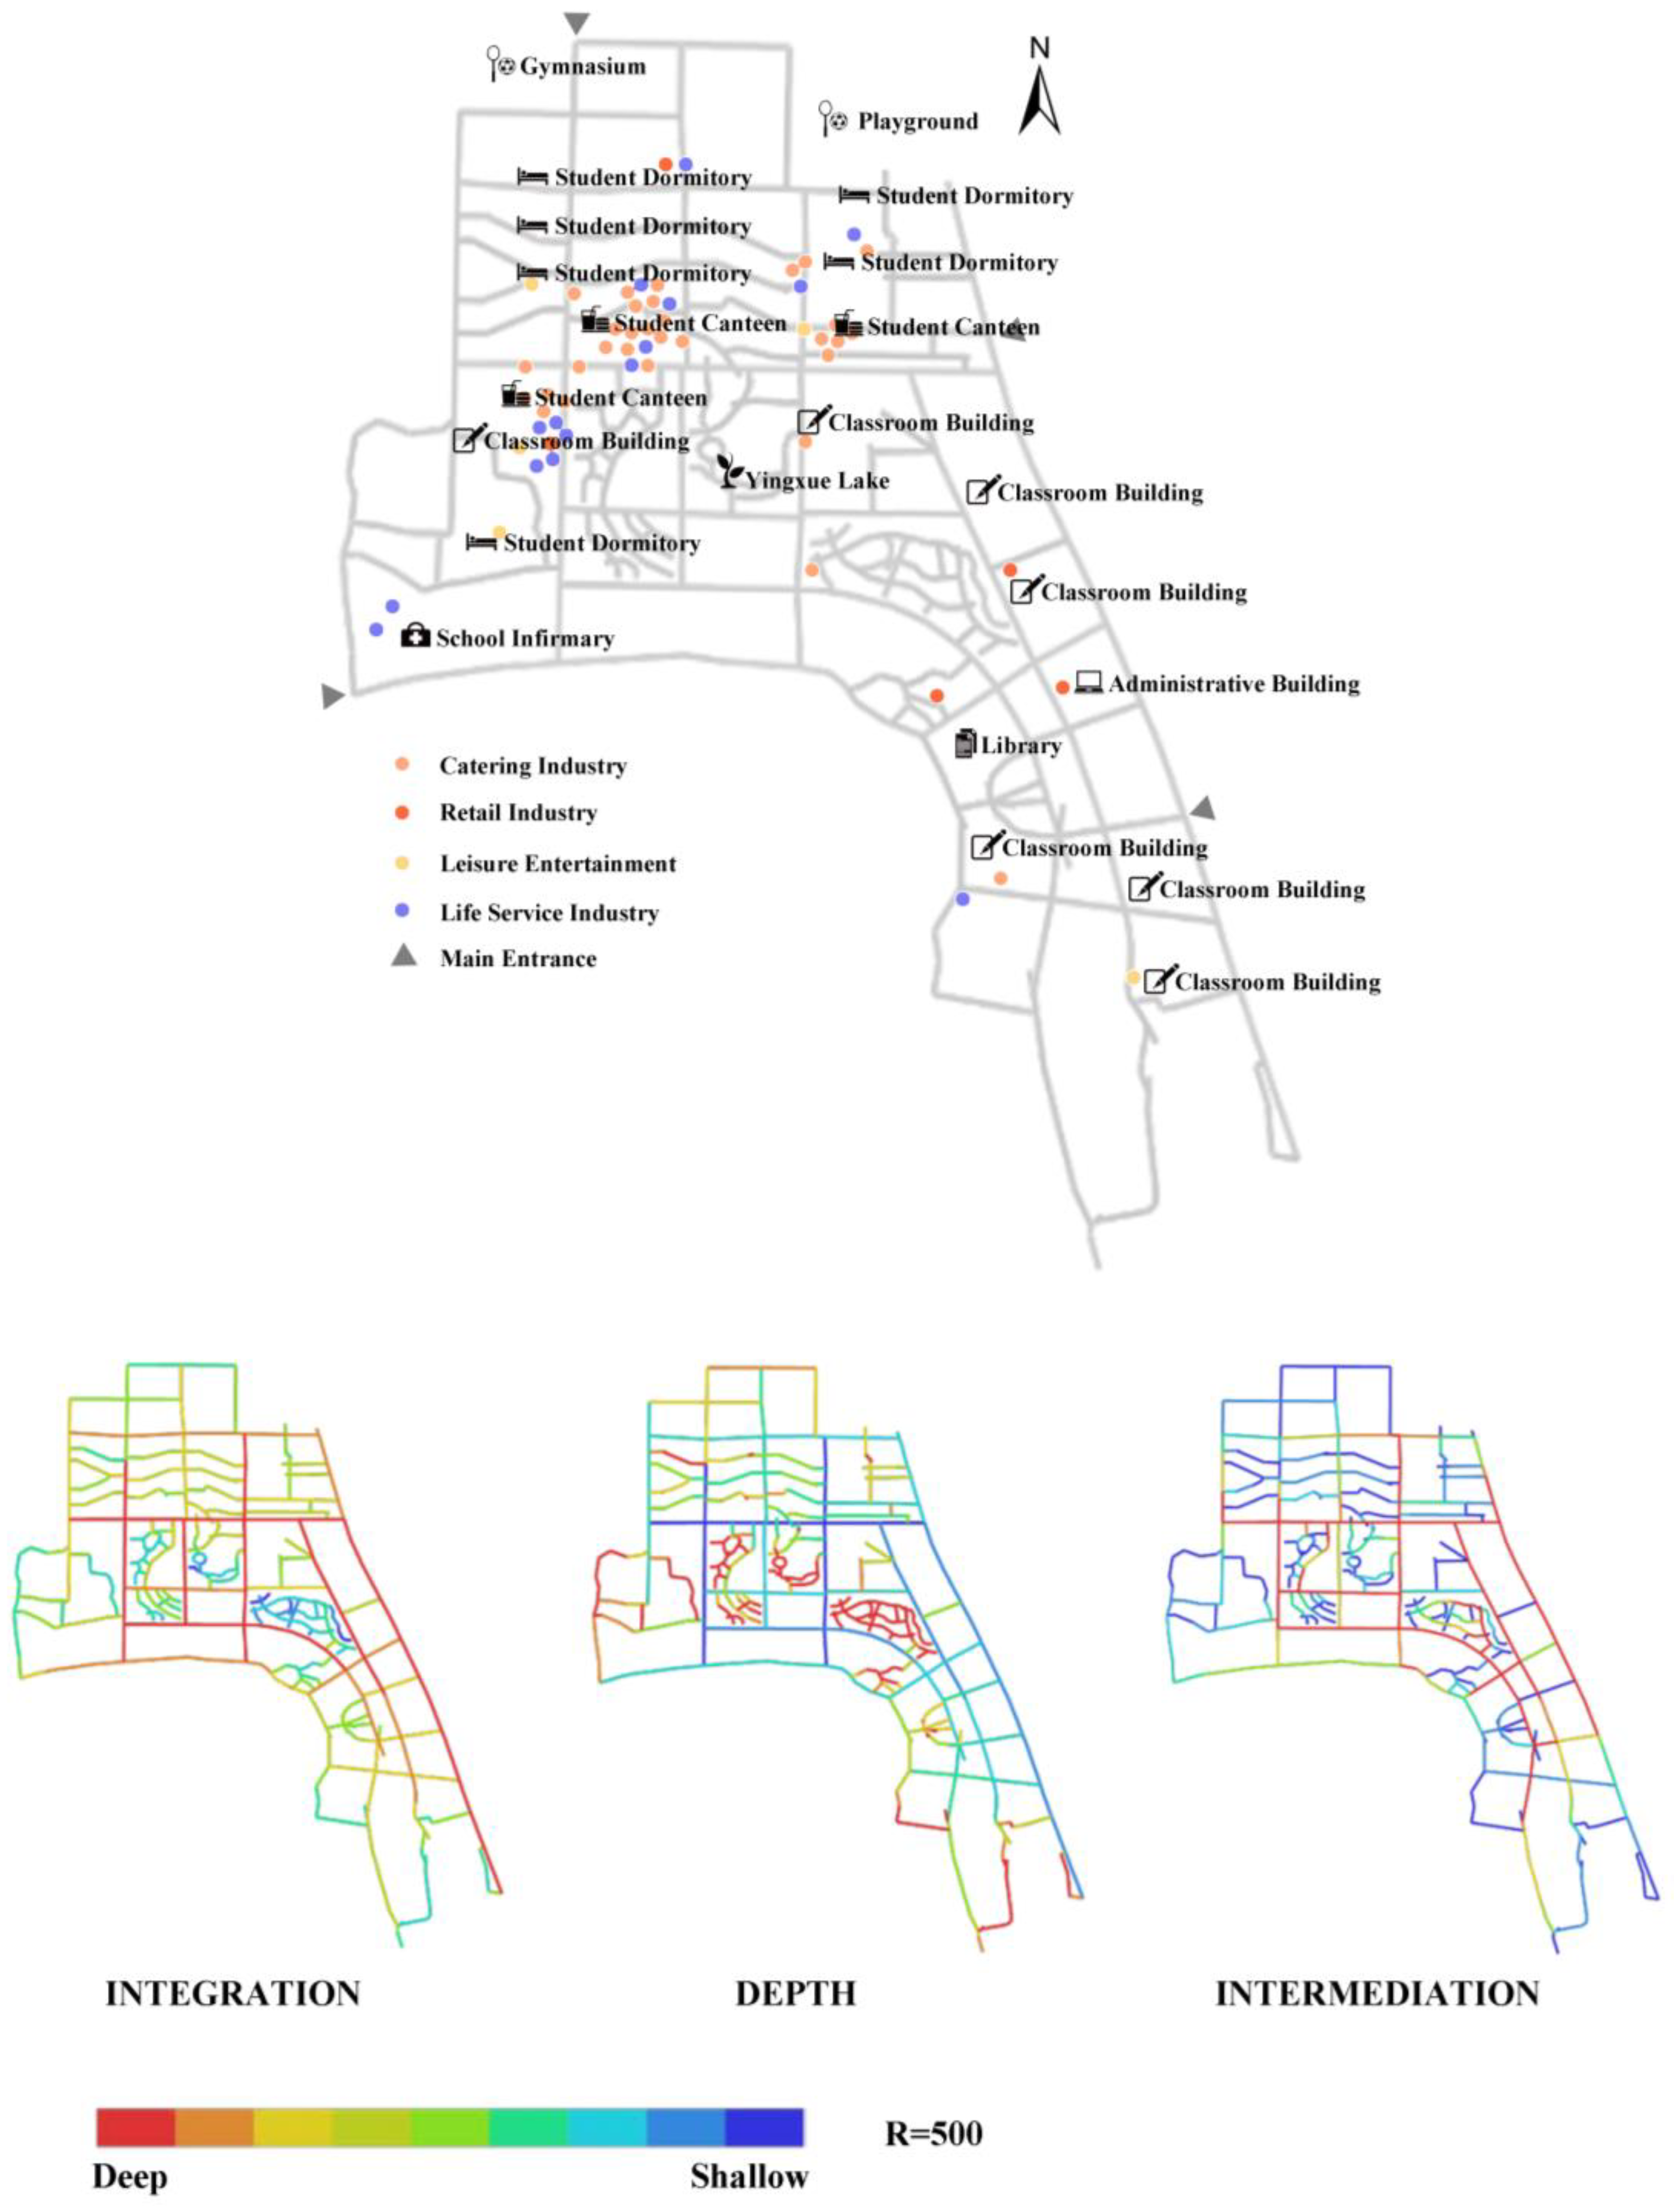
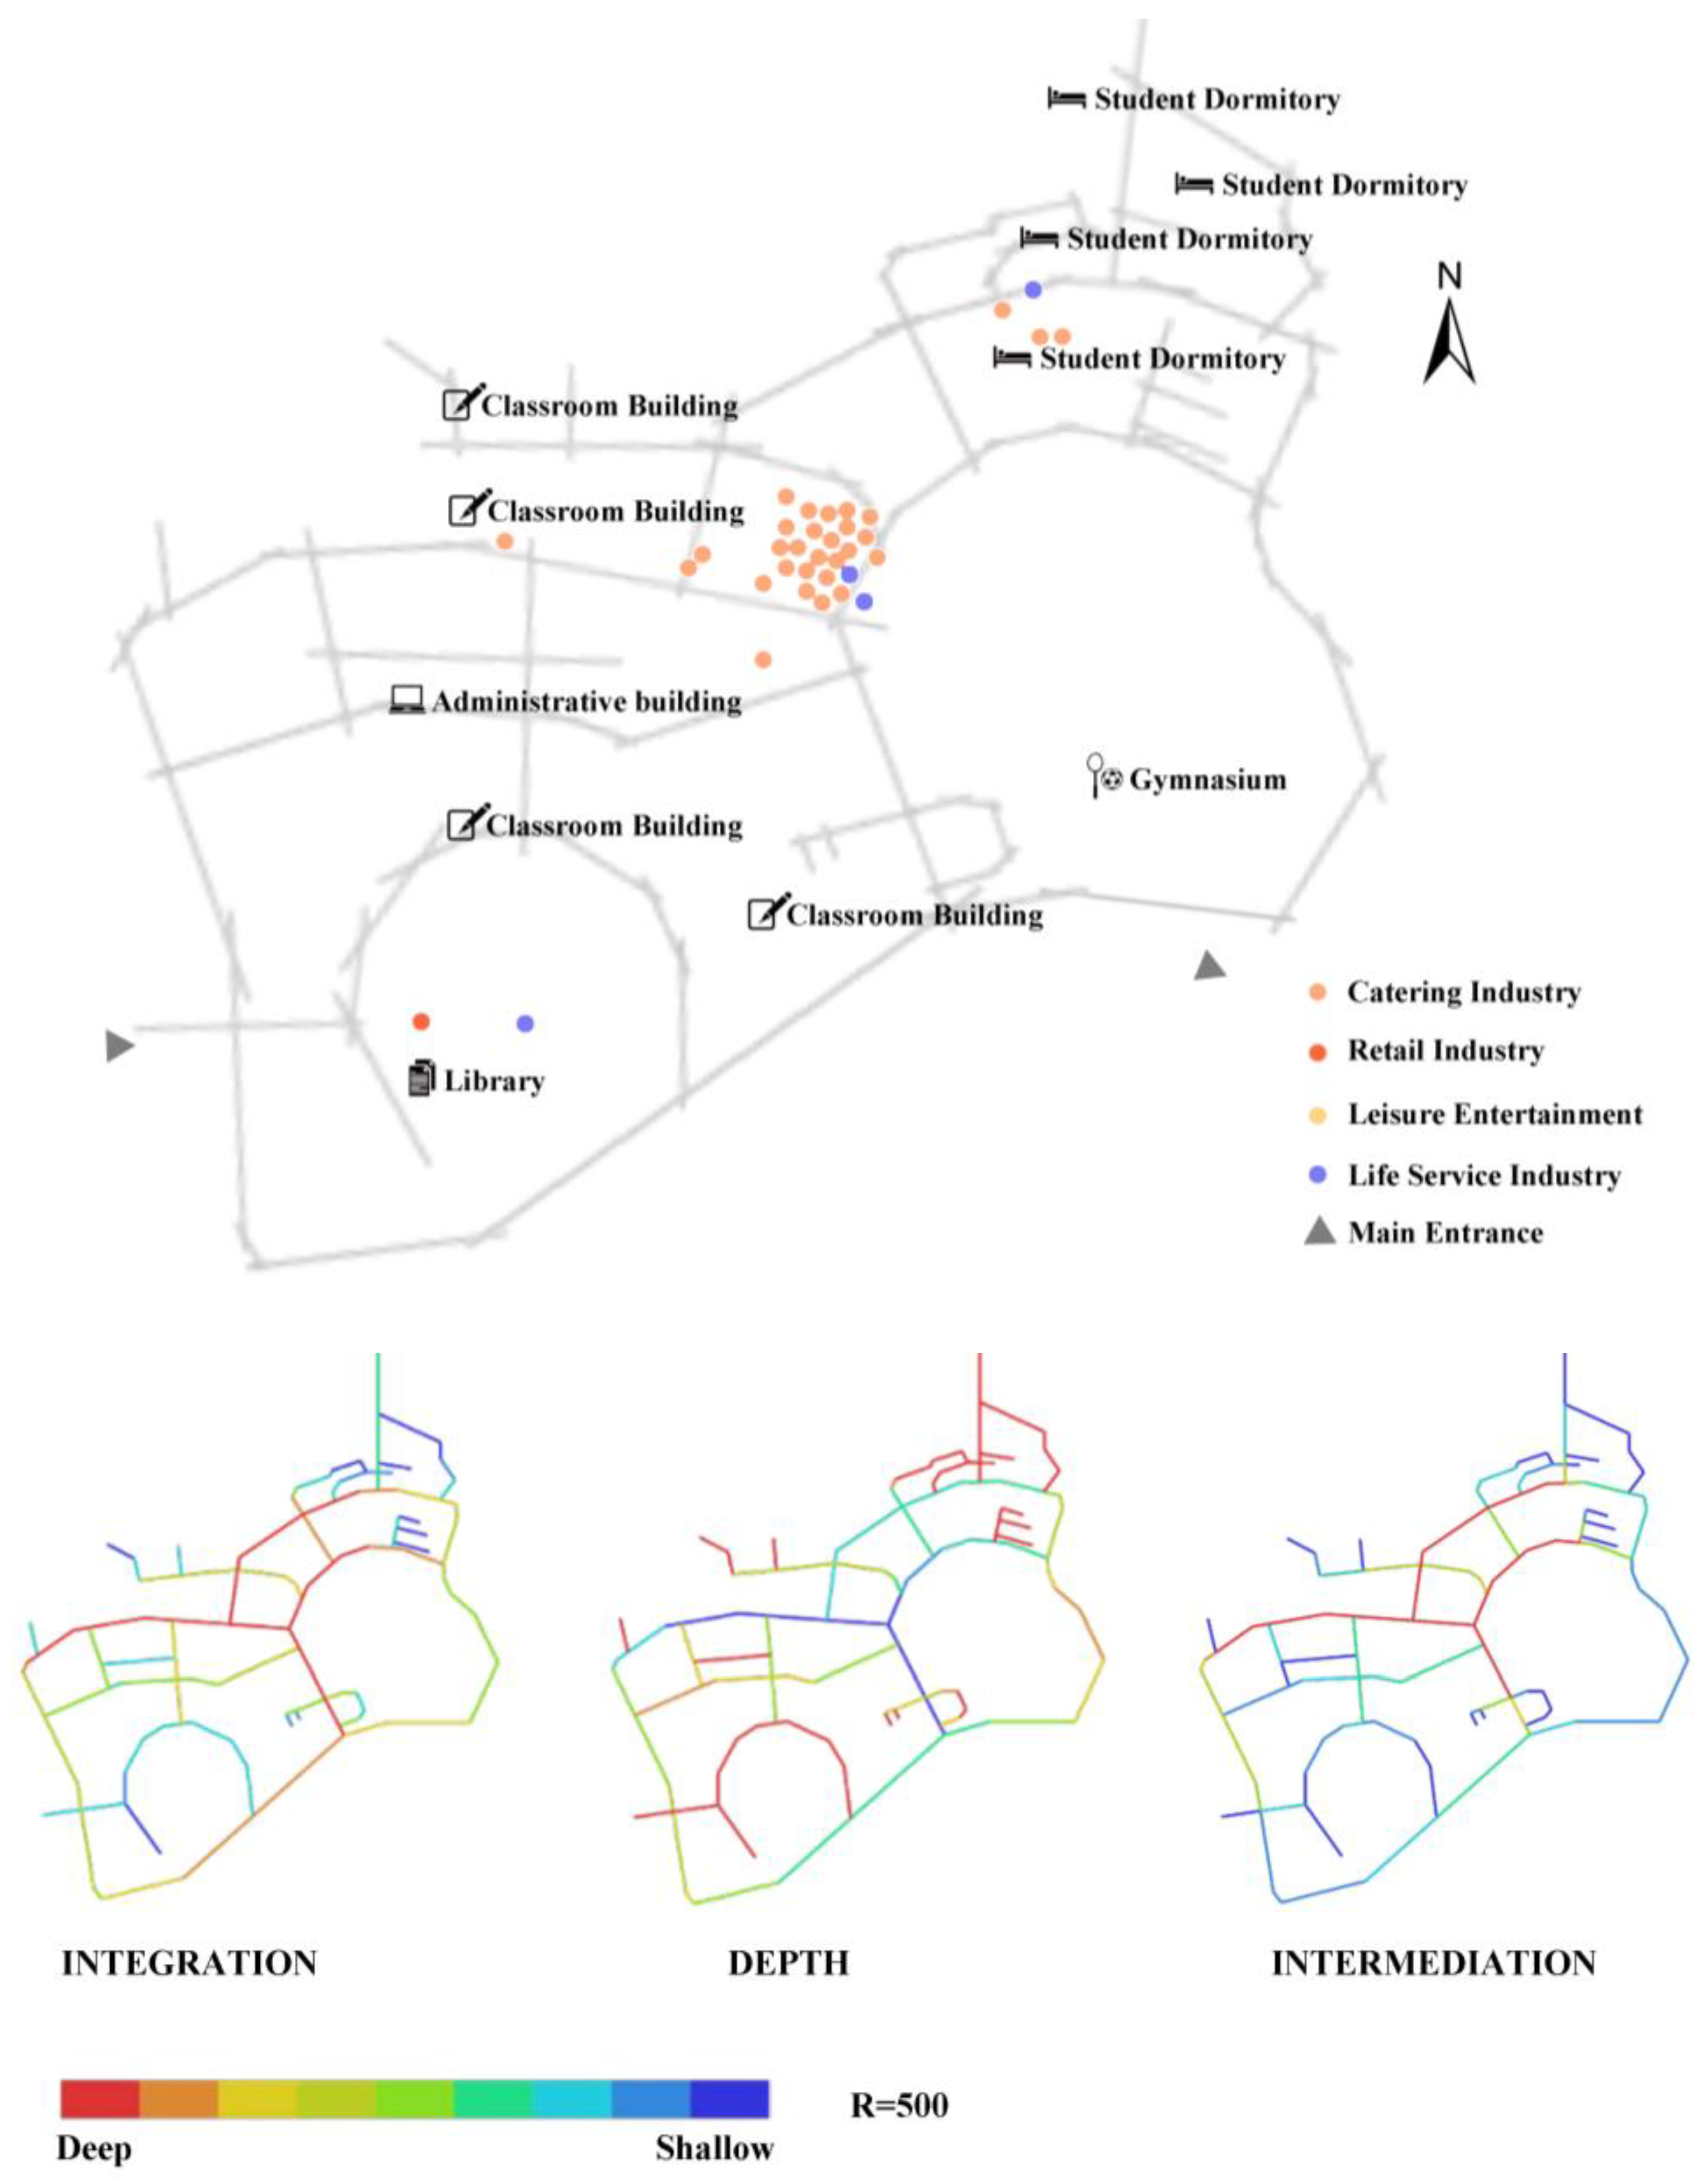
3.1. Study Area

This study aims to facilitate the development of well-considered strategies and plans that align with the specific requirements and preferences of subjects in different regions, ultimately contributing to research on the sustainable development of educational institutions. The study primarily focuses on universities in Jinan City, selecting Shandong University of Finance and Economics (SDUFE), Shandong Traditional Chinese Medicine University (SDUTCM), College of Arts (SDCA), University of Jinan (UJN), and Shandong Jianzhu University (SDJZU) as research samples based on location, subject orientation, and construction era (Figure 1). SDUFE is situated in the city center, where most universities are older, resulting in high urbanization and strong integration with the city. Numerous urban facilities cater to the needs of campus residents, and the commercial service space is predominantly integrated [26]. SDUTCM and SDCA are situated on the city’s outskirts, where these new suburban campuses are uniformly designed as university towns with comprehensive amenities, including supermarkets, dining options, banks, and recreational facilities, and resemble small satellite cities independent of the central urban area. Students can fulfill their daily shopping needs without commuting to the city, and commercial services are primarily concentrated [27]. The concentration of commercial services on campus does not inherently guarantee that all students’ specific needs are met. Factors such as the variety of available products, affordability, and accessibility should be considered to ascertain whether the campus truly meets the comprehensive commercial service needs of its student population. University of Jinan (UJN) and Shandong Jianzhu University (SDJZU) are situated on the urban–suburban boundary, featuring mixed commercial service spaces on their campuses. To cater to the varied requirements of students and to promote resource sharing between specific living systems and the city, campus transportation, among other measures, has been enhanced. This optimization strategy focuses on maximizing the utilization of existing resources [28,29].
In April 2023, the research team conducted two preliminary surveys in the study area. Subsequently, based on the preliminary findings, the questionnaire was revised and improved before the formal survey took place in June–July 2023. The questionnaire comprises three parts: (1) Characteristics of respondents, covering gender, occupation, educational institution, usage of the business district, demand, and satisfaction. (2) Characteristics of commercial space, encompassing categories and the current status of commercial spaces. Drawing on previous research, the team categorized commercial service spaces into catering, retail, lifestyle services, and entertainment [26,28]. Subsequently, secondary indicators were decomposed, and field research was conducted to assess their distribution proportions. The analysis of the current situation includes an examination of scale, layout, management, comfort, energy consumption, parking, and other relevant aspects. (3) A comparison between the expected and actual demand of users for commercial space (Appendix A, Table A1). The study collected responses from 243 men and 232 women, resulting in a total of 497 questionnaires, of which 475 were considered valid.

3.2. Research Framework

Quantitative indices are currently lacking in planning and designing campus commercial space because colleges and universities typically base their plans on factors like campus size, total student population, and nearby retail amenities [10]. In the research process, it is imperative to minimize the impact of subjective elements on campus commercial space layout, especially concerning energy consumption. In this study, the determination of weights follows a structured approach. The subjective weight is established using the analytic hierarchy process, providing a methodical framework for capturing subjective preferences and hierarchies within decision-making. Subsequently, the objective weight is derived through the application of the entropy weight method, which is a technique known for its effectiveness in handling diverse and complex datasets. The integration of these subjective and objective weights is achieved through the utilization of the Lagrange algorithm. This algorithm, renowned for its capability to handle optimization problems with constraints, plays a pivotal role in determining the comprehensive weight. By incorporating both subjective and objective considerations, the comprehensive weight reflects a balanced synthesis that accommodates various influencing factors within the study. Finally, to validate the model’s performance and the weights obtained, a neural network is employed for verification. The neural network serves as a robust tool for testing the effectiveness and generalizability of the weights in processing and analyzing the data. This verification step enhances the reliability and applicability of the constructed model, providing a rigorous assessment of its performance. In essence, the study employs a multi-step process, integrating different methodologies—analytic hierarchy process, entropy weight method, Lagrange algorithm—to determine weights systematically. The subsequent verification using a neural network adds a layer of validation, ensuring the robustness and applicability of the proposed methodology. Figure 2 illustrates the comprehensive framework for determining the consequences of factors influencing commercial service space on university campuses through machine learning algorithms.

3.3. Methods

3.3.1. Determination of Influencing Factors

In their research literature, Luo Nianan and Cao Lin [26,28] categorized university campus commercial formats into catering, retail, entertainment, and service facilities, providing a helpful reference. It categorized these spaces based on the behavior characteristics of college students, determining the types and quantities of commercial areas surrounding the campuses. The layout of the on-campus commercial service space was segmented into four categories, forming the primary layer of the evaluation system: catering, retail, life services, and entertainment. Various methods were employed to select evaluation indicators, including campus field questionnaires, expert interviews, and literature reviews. Expert consultations and principal component analysis were then applied to screen these indicators, identifying specific factors influencing energy consumption in university campus commercial spaces. The resulting index evaluation system comprises 16 primary indicators, such as “Distance from the functional area”, “Distance from traffic flow line”, and “Environmental elements of the business itself”, which are considered significant factors affecting energy consumption. Additionally, 38 secondary indicators, including further subdivisions of the primary indicators, were identified. Finally, considering the attributes of each factor, the target layer was decomposed to establish a structural model, presenting the primary and secondary indexes outlined in Table 1. The following factors were created:
U = Z1∪Z2∪Z3∪Z4
Z1 = {Z11, Z12, Z13, Z14}
Z2 = {Z21, Z22, Z23, Z24}
Z3 = {Z31, Z32, Z33, Z34}
Z4 = {Z41, Z42, Z43, Z44}

3.3.2. AEL Evaluation Index Model

Analytic Hierarchy Process: The Analytic Hierarchy Process (AHP) is employed to analyze the data, systematically assigning weights to each element based on the decision problem to determine the optimal scheme, which is the one with the highest importance. The calculation formula is presented in Equation (1), where ‘n’ signifies the count of hands.
ω A i = 1 n j = 1 n a i j k = 1 n a k j ( j = 1 , 2 , , n )
Entropy Weight Method: Entropy is employed to describe the uncertainty linked with a random phenomenon, evaluating the object’s degree of randomness and disorder. Suppose there are ‘i’ evaluation objects, each containing ‘j’ evaluation indicators. The original matrix is X = (xij) with xij denoting the value of the ‘j-th’ evaluation index for the ‘i-th’ evaluation object. The matrix is normalized to compute the normalized value pij for the j-th evaluation index of the i-th evaluation object as Equation (2).
p i j = x i j i = 1 n x i j
Sequentially, we calculated the information entropy ej for each index as Equation (3) and derived the corresponding weight value on the calculated information entropy for each index as Equation (4).
e j = 1 1 n n i = 1 n p i j ln ( p i j ) , ( 0 e j 1 )
ω B j = 1 - e j i = 1 n a j ( j = 1 , 2 , n )
Lagrange Multiplier Method: The choice of the Lagrange algorithm in constructing the AEL machine learning model is driven by its adeptness at handling constrained optimization problems, making it a valuable tool for integrating various constraints and achieving the desired optimization outcomes in the context of determining comprehensive weights [30]. Utilizing the Lagrange multiplier method optimization to reconcile subjective and objective weights, the optimal combined consequences ωCK can be determined, mitigating the drawbacks of single assignments. ωAi represents the weight subjectively determined for the i-th index, while ωBi represents the weight objectively determined for the j-th index, which leads to the derivation of ωCK = [ωC1, ωC2,…, ωCn] as the ultimate optimal composite weight [30]. Equation (5) depicts the calculation formula.
ω C K = ω A i ω B j i = 1 n ω A i ω B j

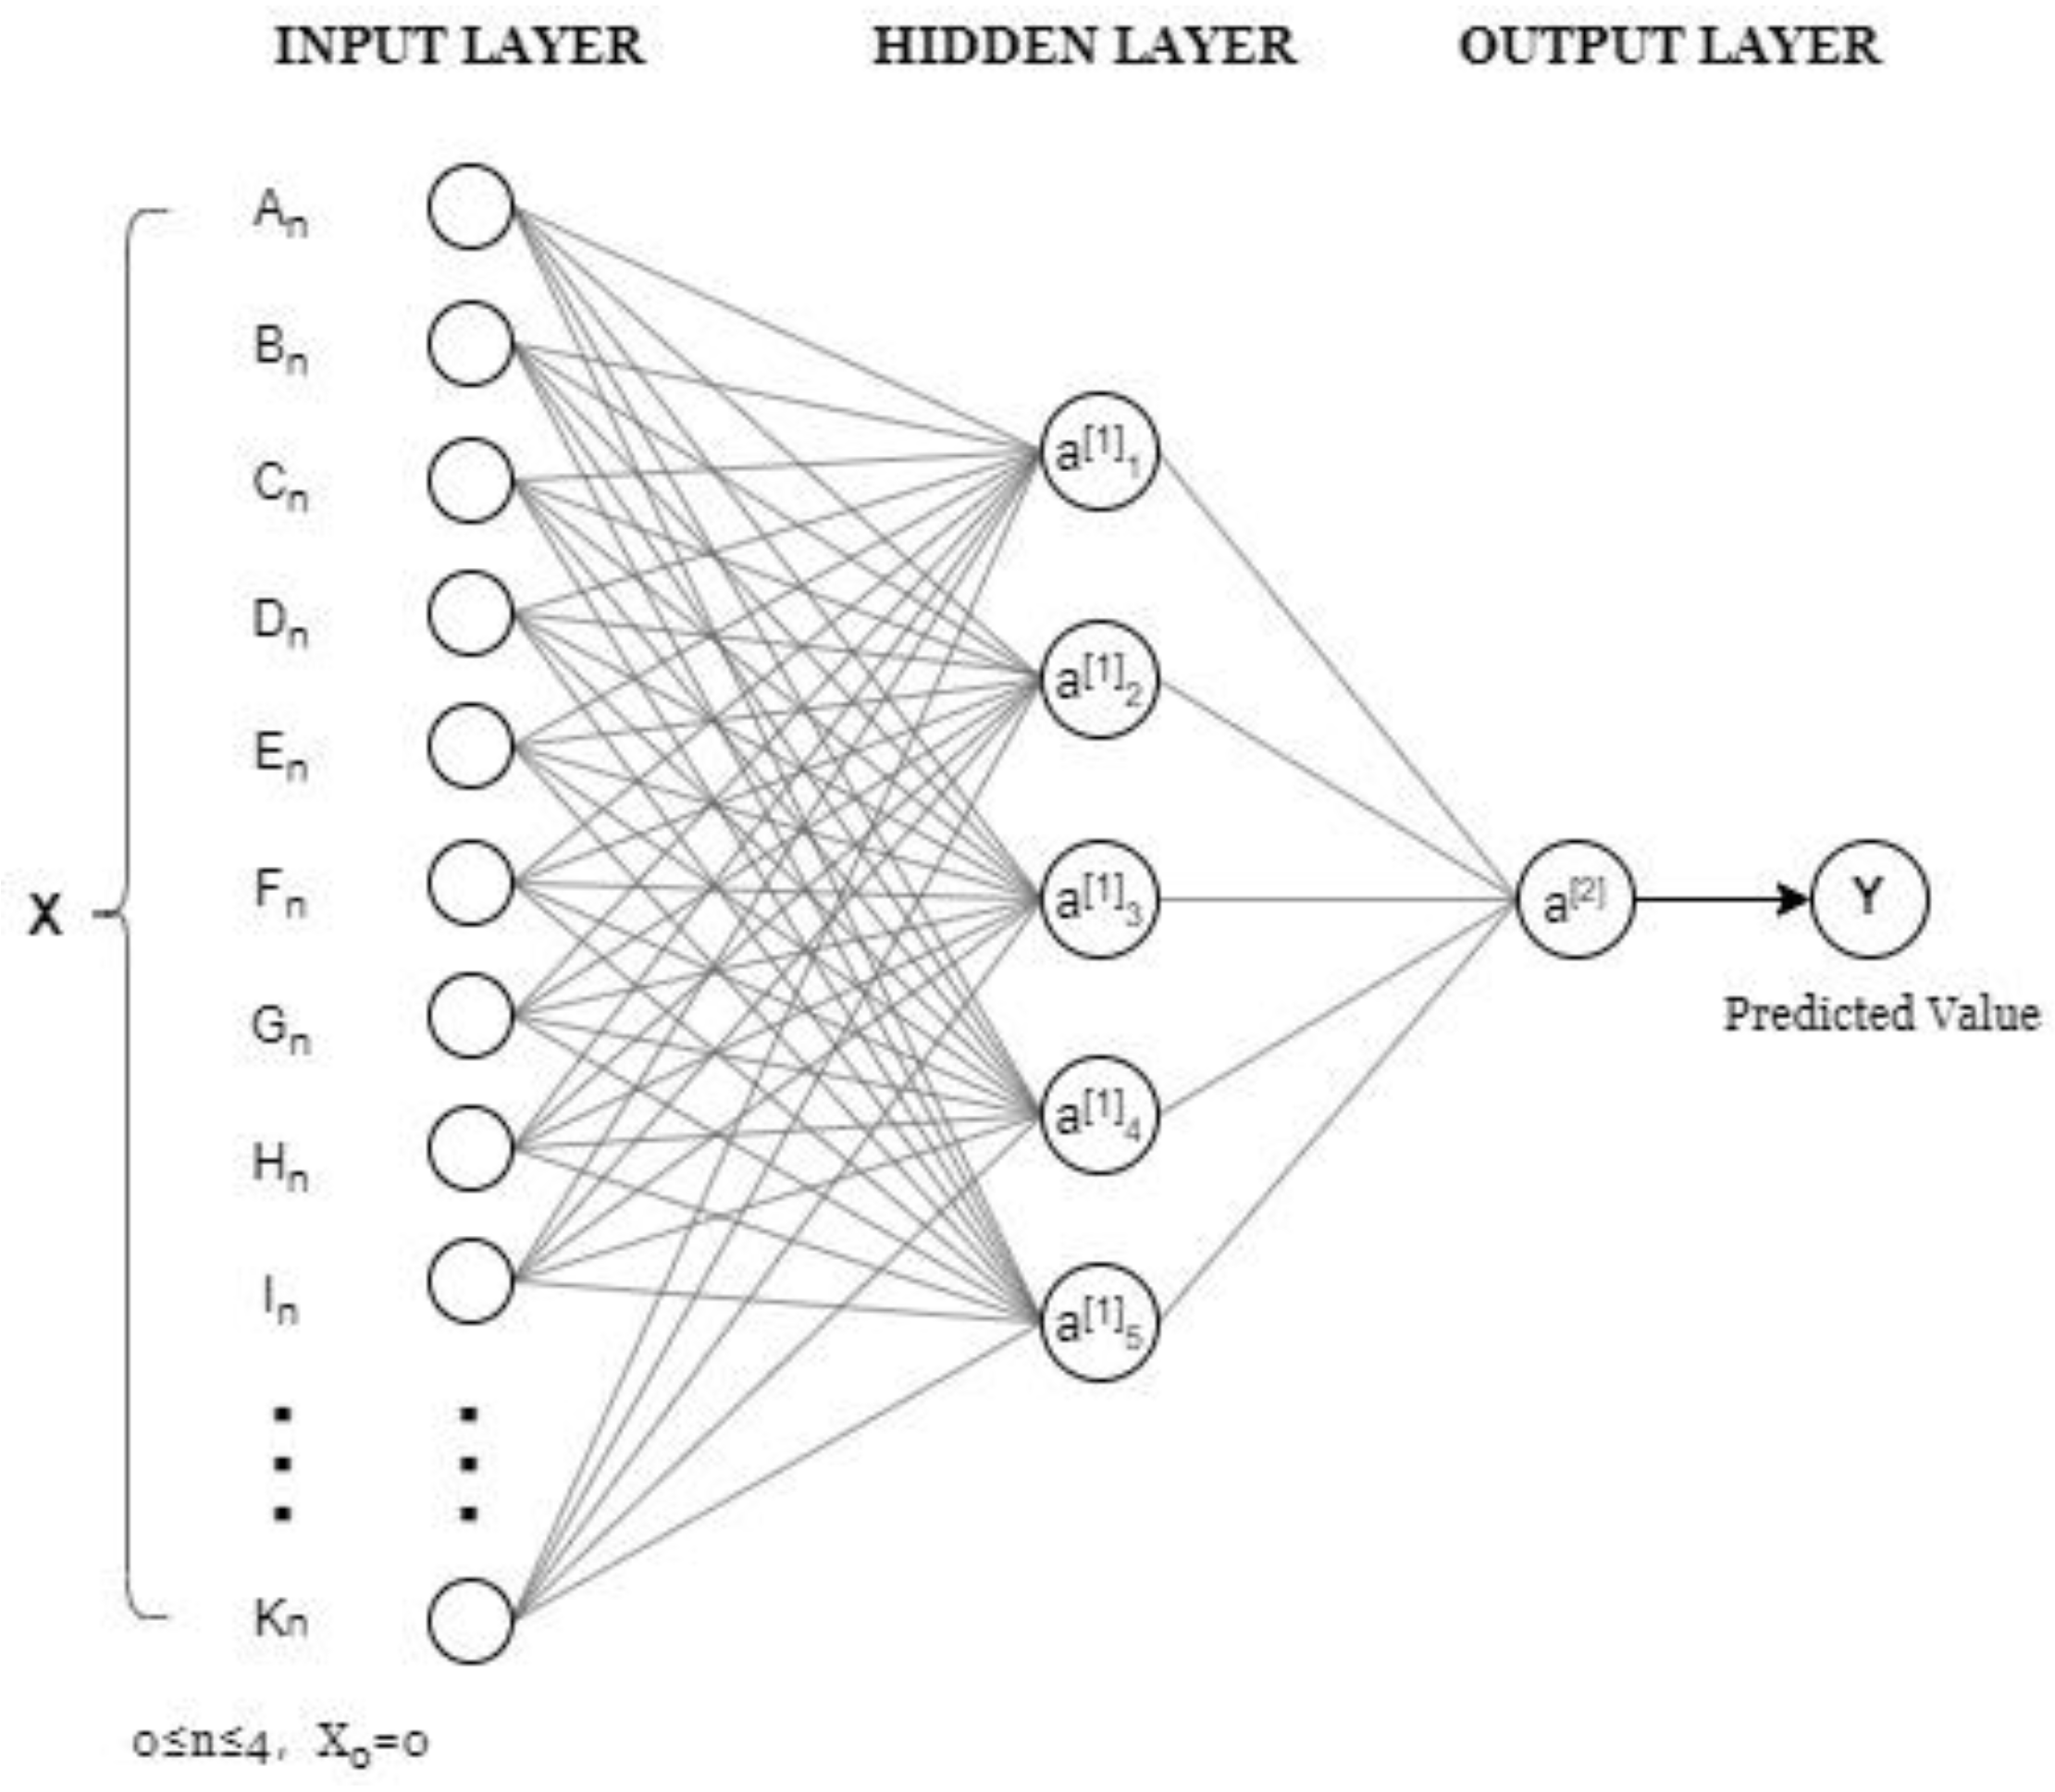
3.3.3. Neural Network Training Model

A neural network, specifically a feedforward neural network, iteratively adjusts its weights and thresholds through multiple training samples, ultimately establishing the corresponding input-output relationship [31]. The network comprises an input layer, an output layer, and a hidden layer. The prevalent configuration is a three-layer neural network with a singular hidden layer, as MathWorks exemplifies. BP neural network training can simplify the comprehensive evaluation process by using the established weight of the final comprehensive index.
The primary function utilized in neural network construction is new. The ‘net’ parameter is employed for neural network creation. ‘P’ represents the matrix encompassing the input vector’s value range. ‘T’ denotes the number of hidden layers and output neurons in the network, depicted through a row vector. ‘S’ signifies the aggregate of hidden layers within the network, illustrated as a cell array. The activation function for the output layer is determined. The requisite training function for the neural network is ‘train’. Subsequently, the ‘sim’ function is tested. The neural network training procedure is visualized in Figure 3.

4. Results and Analysis

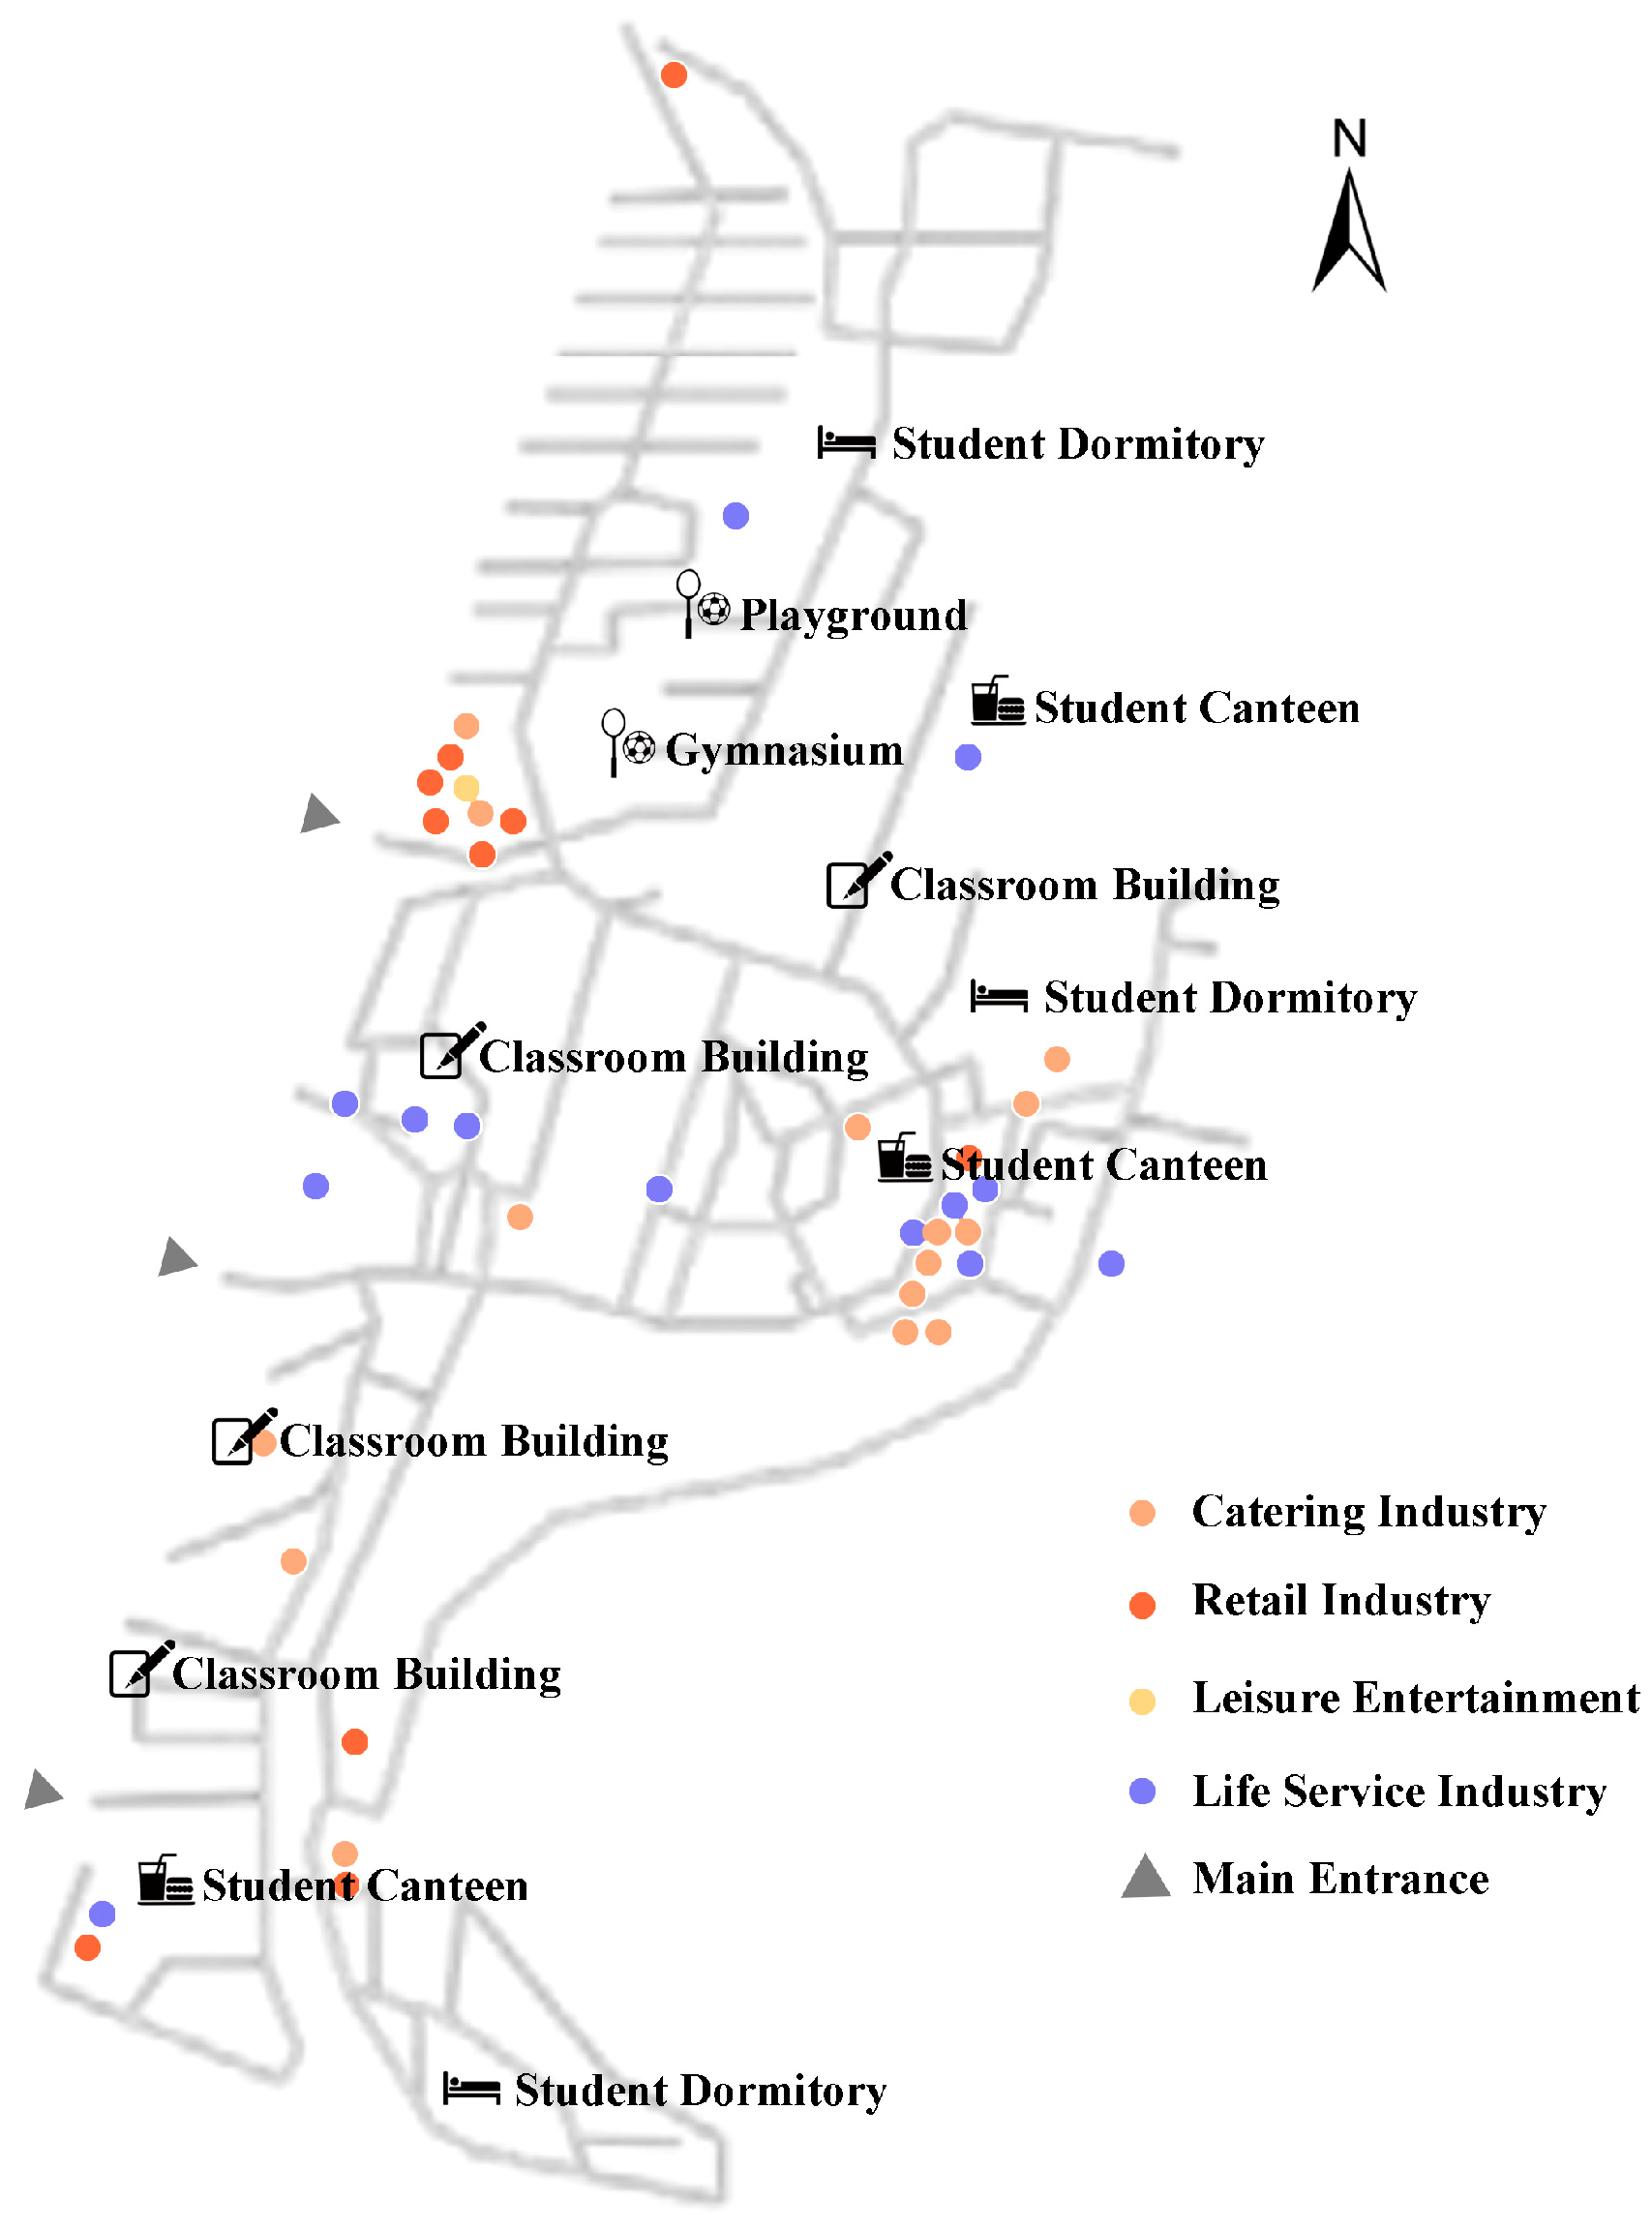
4.1. The Characteristics of the Commercial Space on the Jinan Campus

We conducted on-site investigations at five schools in Jinan. We analyzed the commercial space layout, integration degree, depth value, and traversal degree of each axis on the university campus. The color scale was divided into ten segments, with red representing the highest value and blue representing the lowest value. Based on students’ daily travel distances, search radii of 200 m, 500 m, and 800 m are defined (Figure 4, Figure 5, Figure 6, Figure 7 and Figure 8). We find that the characteristics of commercial service space on the Jinan university campus are as follows:

4.1.1. Inadequate Planning and Arrangement

An analysis of the school’s business service space layout reveals the absence of appropriate commercial service space in numerous high-traffic areas, leading to extended pathways between these spaces and other commuting destinations. Additionally, field investigations of commercial service spaces indicate that many of these spaces emerge organically through reconstruction and construction in densely populated regions. Insufficient initial planning during campus development has resulted in disorganized space interfaces and a lack of integration with the natural environment, resulting in poor alignment with the campus aesthetics. Furthermore, instances occur where commercial spaces lack adaptability and renewal options during peak traffic congestion periods, which diminishes resource-utilization efficiency and does not meet the dynamic demands of college students for retail space, affecting the overall flexibility and sustainability of campus areas.

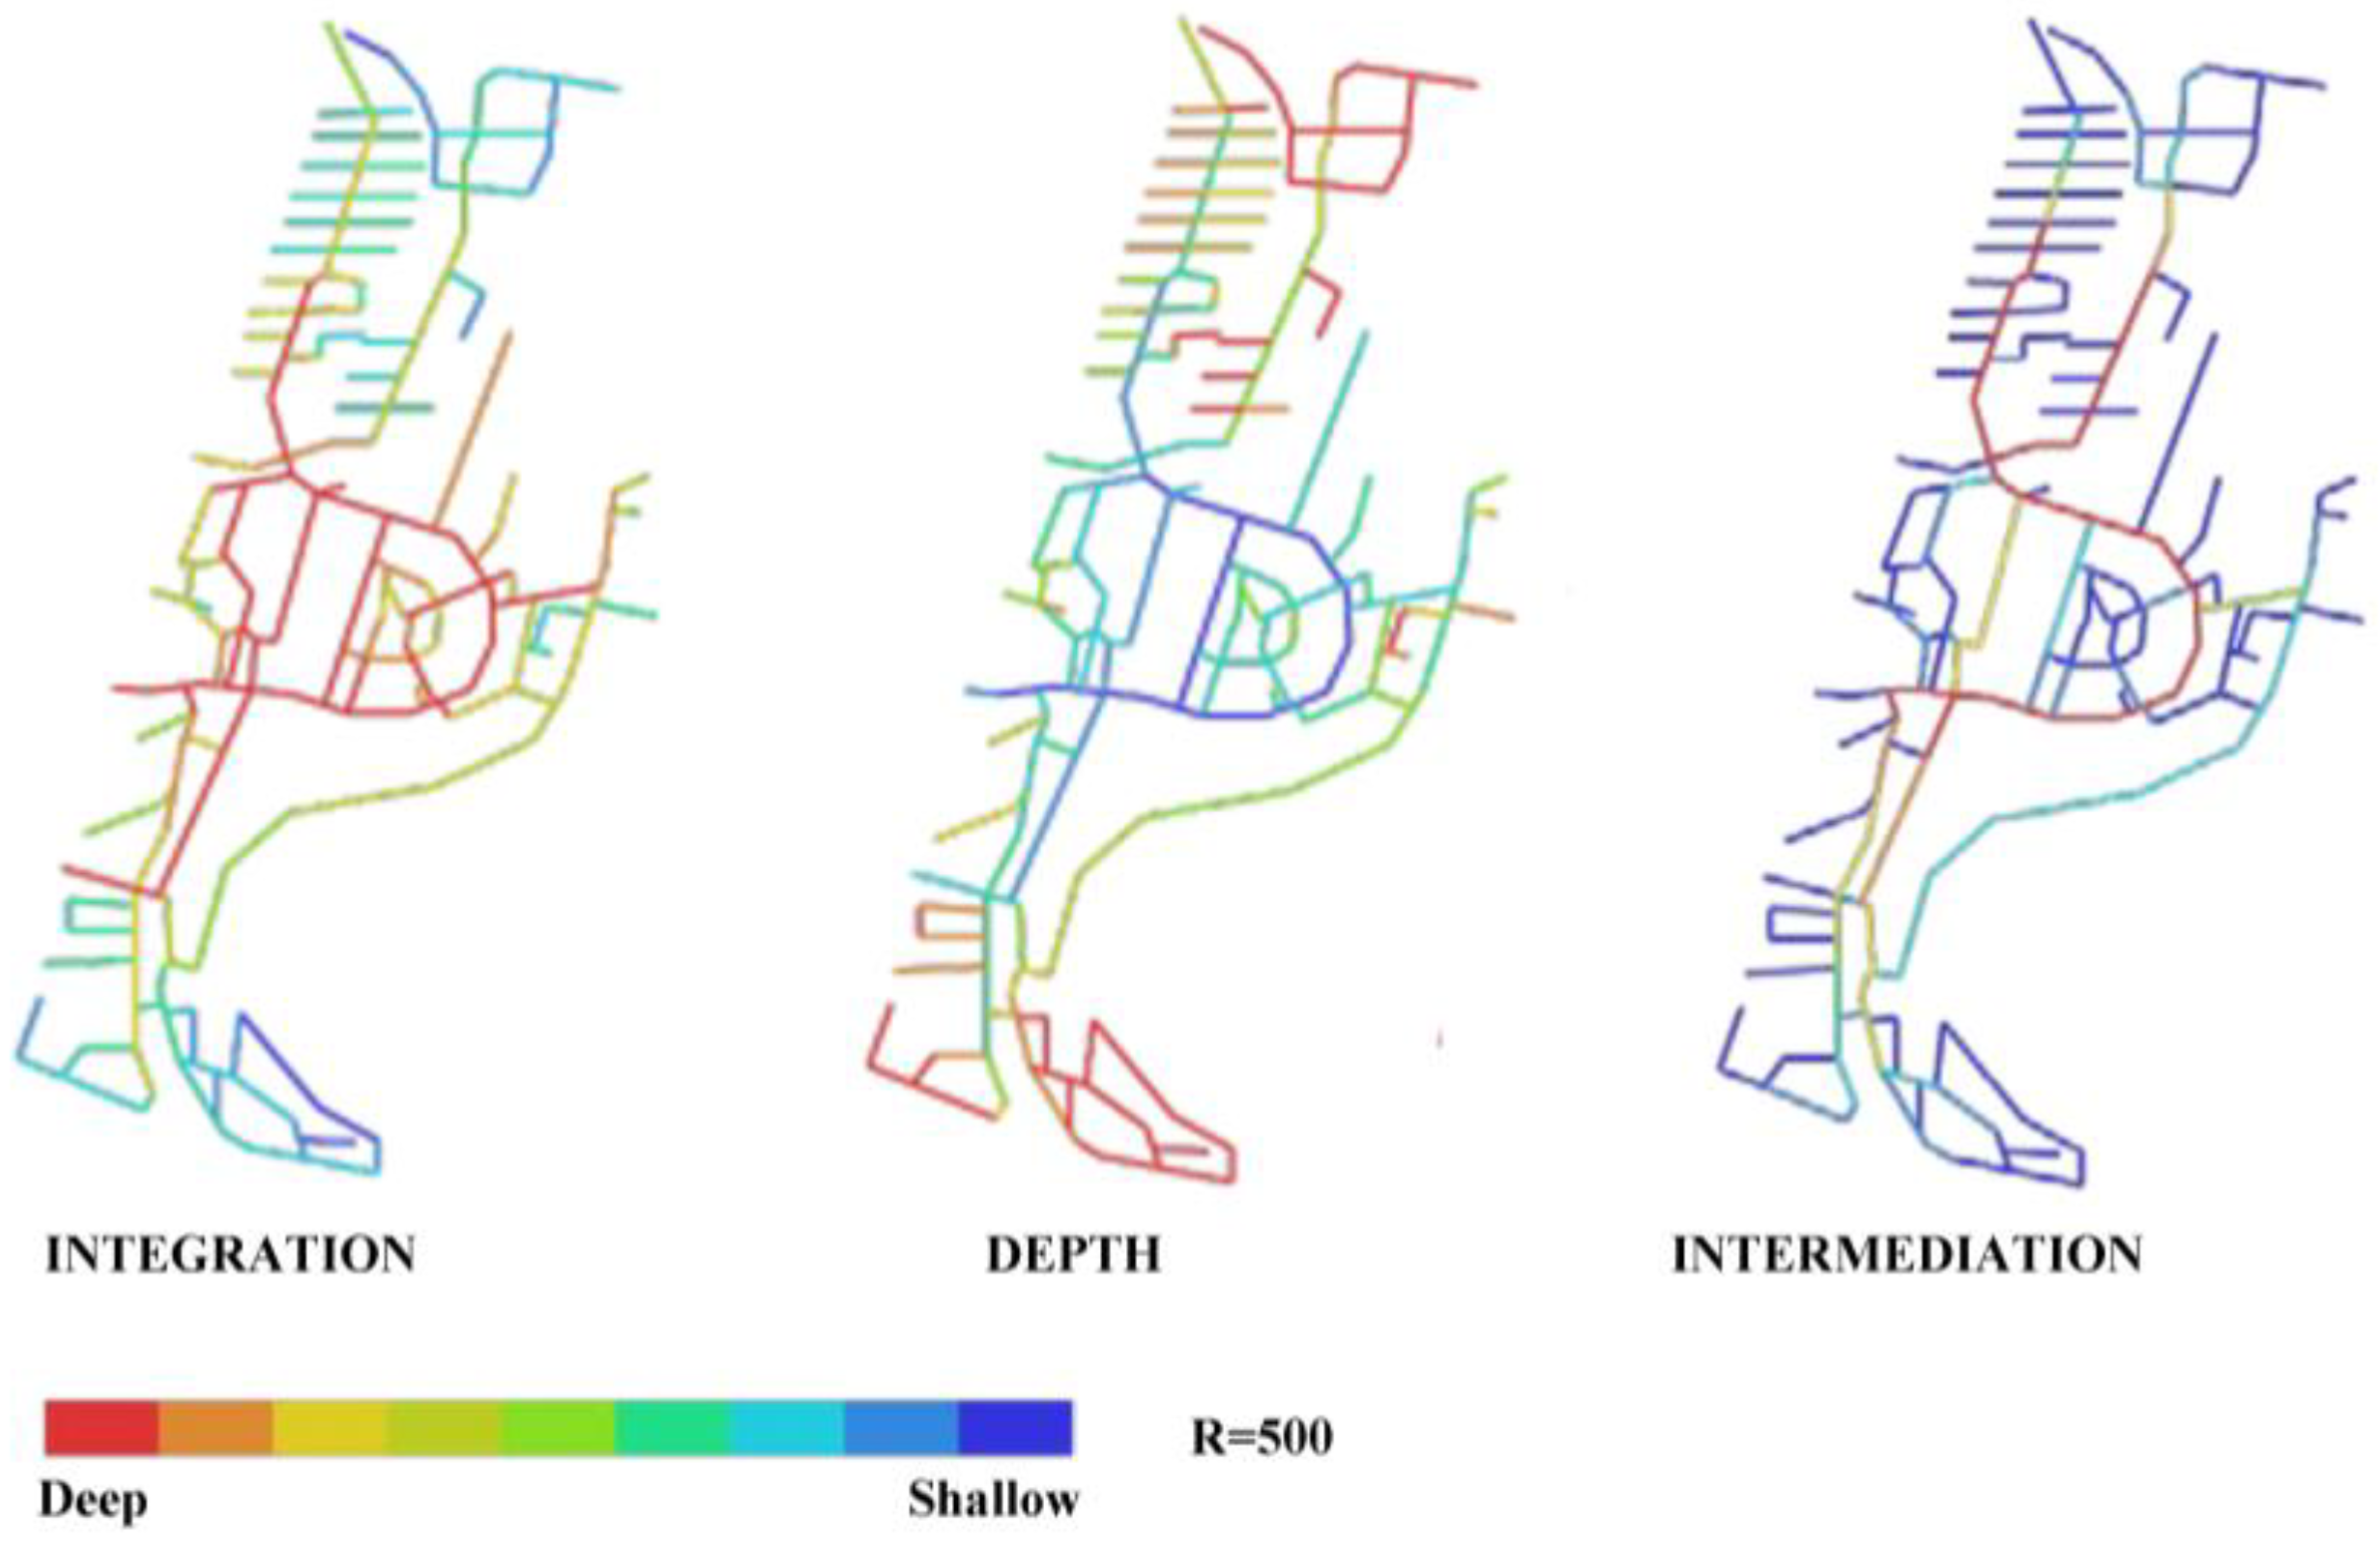
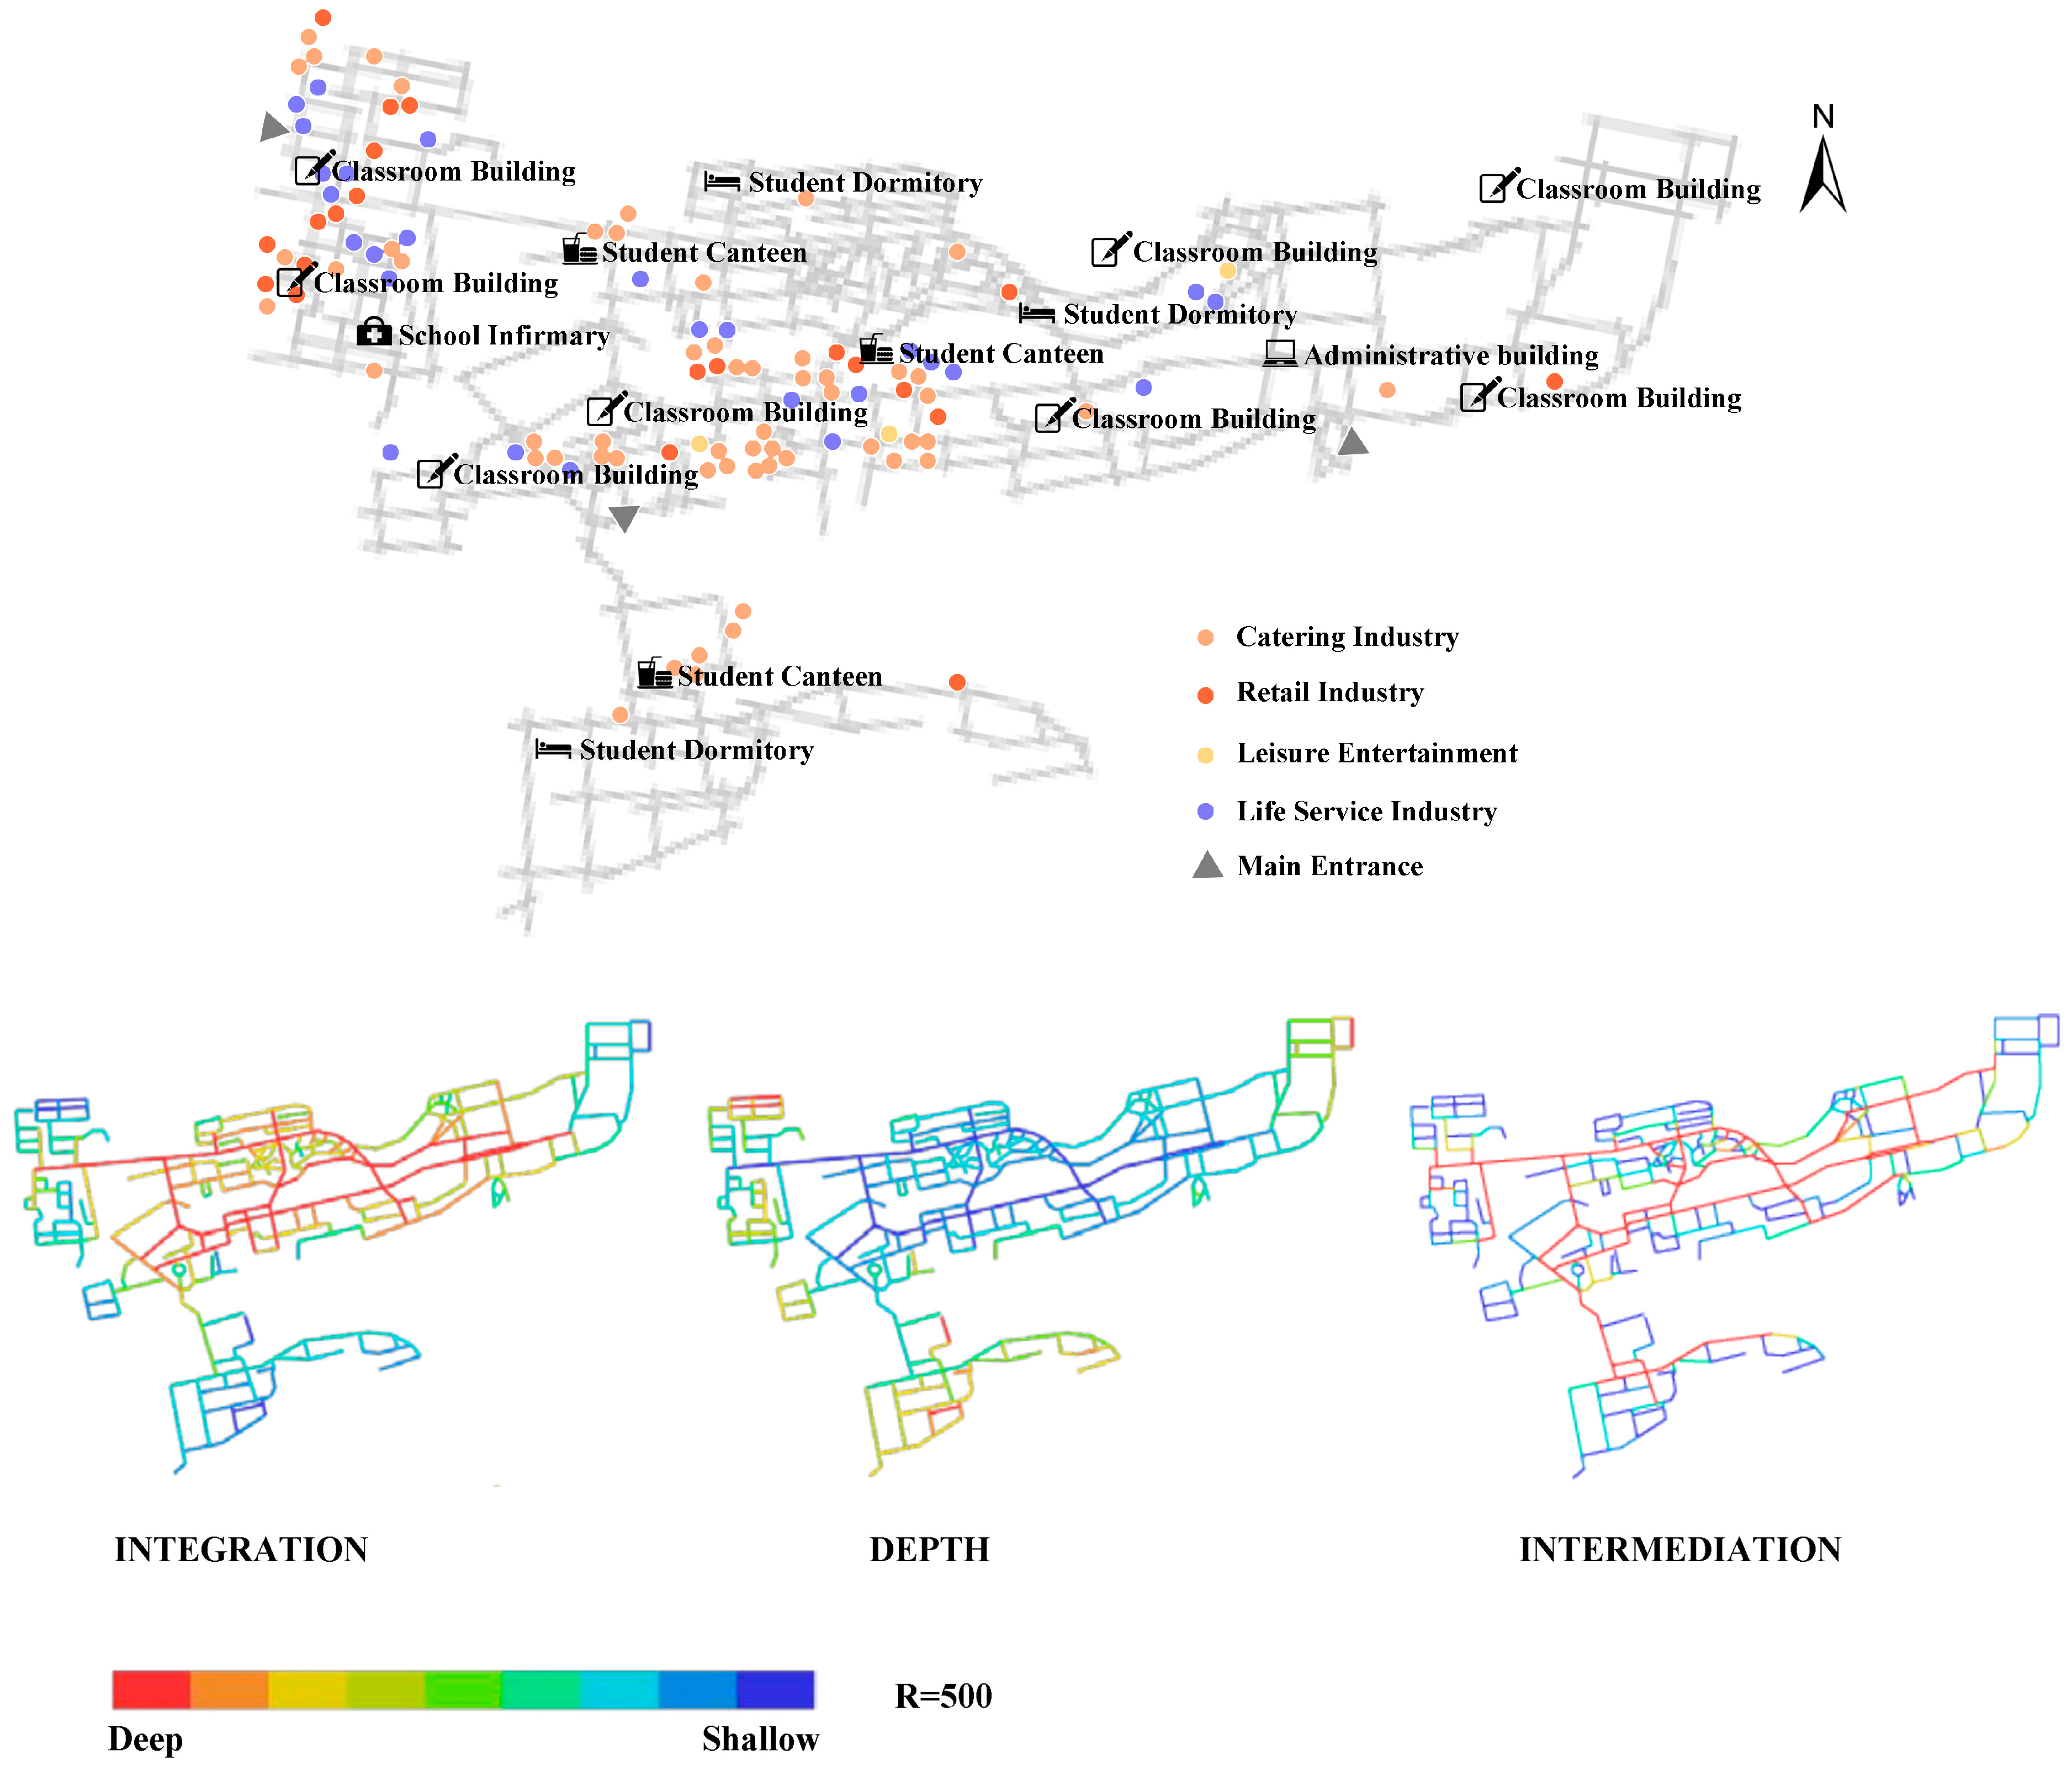
4.1.2. Limited Traffic Network Accessibility

The accessibility of campus roads, environmental quality, and construction conditions significantly impact students’ mobility and, consequently, the utilization of campus commercial spaces [32]. Typically, pathways for teachers and students traveling to and from classrooms, dining areas, entertainment facilities, and other daily activity spots on campus remain relatively fixed, and commercial spaces are usually strategically positioned along these pathways, promoting student usage and contributing to the sustainable development of campus commerce. Nevertheless, an investigation and analysis reveal that certain institutions only offer excellent road accessibility within a limited number of critical functional zones, often failing to cover students’ living quarters, classrooms, and primary activity locations. The design of well-planned and easily accessible campus roadways can enhance resource utilization, effectively reducing resource wastage and the unnecessary carbon footprint resulting from detours when using transportation.

4.1.3. Absence of Sustainability Practices

Low-energy practices in the university campus’ business services sector have not received significant attention from decision-makers, leading to the neglect of low-energy initiatives. The higher expected cost of implementing sustainable practices influences the decisions of the university campus and related enterprises, resulting in these initiatives being overlooked. Although sustainable practices offer long-term benefits, the initial investment budget cannot be ignored. Moreover, due to limited resources on campus, small business service spaces often lack the necessary resources, expertise, and capacity to implement sustainable practices. Consequently, they prioritize short-term goals and immediate profits over methods with more extended payback periods.

4.2. Results of Machine Learning Algorithms

4.2.1. Subjective Weight

In this study, experts employ the proportional scale method to perform pairwise comparisons among 38 indicators and calculate each indicator’s weight (ωAi). The calculation formula is presented in Equation (1). The calculation result of subjective weight is as follows:
  • ωA1 = [0.2432, 0.0625, 0.0351, 0.1349, 0.0829, 0.0610, 0.1714, 0.0170, 0.0963, 0.1255, 0.0443]. For the spatial layout of the catering business, “Distance from the dormitory area A1” (0.2432), “Whether it is on the student’s main flow line G1” (0.1714) weight scores the highest.
  • ωA2 = [0.3253, 0.0877, 0.0525, 0.0409, 0.1242, 0.0147, 0.0619, 0.2726, 0.0202]. For retail commercial space layout, “Distance from the dormitory area A1” (0.2432), “Whether it is on the student’s main flow line G1” (0.1714) weight scores the highest.
  • ωA3 = [0.3104, 0.025, 0.0901, 0.0621, 0.0717, 0.2273, 0.1474, 0.066]. For the spatial layout of life service businesses, “Distance from the dormitory area A3” (0.3104) and “Store space F3” (0.2273) scored the highest weight.
  • ωA4 = [0.2515, 0.0642, 0.0163, 0.1692, 0.1287, 0.0293, 0.0572, 0.068, 0.0258, 0.1898]. For the spatial layout of entertainment businesses, “Distance from the dormitory area A4” (0.2515) and “Parking convenience J4” (0.1898) scored the highest weight.

4.2.2. Objective Weights

The Entropy Weight Method (EWM) provides an objective means to ascertain the weight of each attribute by computing their information entropy. A lower calculated entropy value indicates a higher significance of the evaluation index and, thus, a more significant weight, while a higher entropy leads to a lower weight. The calculation formula is presented in Equations (2)–(4), and the objective weight is calculated as follows (ωBj):
  • ωB1 = [0.2265, 0.1754, 0.0214, 0.1018, 0.0745, 0.0524, 0.1897, 0.0147, 0.0245, 0.0865, 0.0326]. For the spatial layout of the catering business, “Distance from the dormitory area A1” (0.2265) and “Whether it is on the student’s main flow line G1” (0.1897) weigh the highest score.
  • ωB2 = [0.2451, 0.1345, 0.0845, 0.0564, 0.1789, 0.0679, 0.0689, 0.1384, 0.0254]. For the spatial layout of retail businesses, “Distance from the dormitory area A2” (0.2451), “Whether it is on the student’s main flow line E2” (0.1789) weight score the highest.
  • ωB3 = [0.3217, 0.0285, 0.1654, 0.0545, 0.0852, 0.1894, 0.0865, 0.0688]. For the spatial layout of life service businesses, “Distance from the dormitory area A3” (0.3217) and “Store space F3” (0.1894) scored the highest weight.
  • ωB4 = [0.2654, 0.0656, 0.0256, 0.1325, 0.0706, 0.0354, 0.0585, 0.0965, 0.0354, 0.2145]. For the spatial layout of entertainment businesses, “Distance from the dormitory area A4” (0.2654) and “Parking convenience J4” (0.2145) scored the highest weight.

4.2.3. Synthetic Weight

In the AEL machine learning model, comprehensive weights play a crucial role in the decision-making process. These weights are determined by considering both subjective and objective factors. The Lagrange algorithm facilitates the determination of these comprehensive weights by optimizing the model under the given constraints, providing a balanced and well-considered set of weights [33]. The synthetic weight (ωCK) is determined using the Lagrange algorithm (Equation (5)). The calculation results based on the Lagrange algorithm are as follows:
  • Z 1 ( i = 1 n ω A i ω B i ) = 1.0060 , ωC1 = [0.2333, 0.1041, 0.0272, 0.1165, 0.0781, 0.0562, 0.1792, 0.0157, 0.0483, 0.1036, 0.0378]. For the spatial layout of the catering business, “Distance from the dormitory area A1” (0.2333) and “Whether it is on the student’s main flow line G1” (0.1792) weigh the highest.
  • Z 2 ( i = 1 n ω A i ω B i ) = 0.9685 , ωC2 = [0.2916, 0.1121, 0.0688, 0.0496, 0.1539, 0.0326, 0.0674, 0.2006, 0.0234]. For retail commercial space layout, “Distance from the dormitory area A2(0.2451)(0.2916),” Store space H2 “(0.2006) weight score the highest.
  • Z 3 ( i = 1 n ω A i ω B i ) = 0.9889 , ωC3 = [0.3195, 0.0270, 0.1234, 0.0588, 0.0790, 0.2098, 0.1142, 0.0681]. For the spatial layout of life service businesses, “Distance from the dormitory area A3” (0.3195) and “Store space F3” (0.2098) scored the highest weight.
  • Z 4 ( i = 1 n ω A i ω B i ) = 0.9918 , ωC4 = [0.2605, 0.0654, 0.0206, 0.1510, 0.0961, 0.0325, 0.0583, 0.0817, 0.0305, 0.2034]. For the spatial layout of entertainment businesses, “Distance from the dormitory area A4” (0.2605) and “Parking convenience J4” (0.2034) scored the highest weight.
Table 2 presents the calculation results of indicator weights influencing the sustainable layout of four types of businesses within university campuses. Comparison of the calculation results reveals disparities between subjective and objective evaluations. Data indicates that the accurate weight significantly influences the combination weight. Indicator weights can elucidate the primary factors influencing the sustainable layout of commercial space on university campuses, facilitating more precise decision-making and judgment regarding various types of campus commercial space layouts.
In the final comprehensive weight score, the highest weight score was attributed to the distance between food and beverage businesses and dormitory areas (Weight = 0.2333). The second highest weight was assigned to determine whether the company is located along the main-student-flow route (Weight = 0.1792), followed by the distance from public activity spaces (Weight = 0.1165). Since students primarily engage in daily activities within classrooms and dormitories, and catering is necessary for regular attendance, reducing the proximity between catering services and students’ activity areas is paramount for energy conservation.
Among the array of retail businesses, the foremost factor dictating the comprehensive weight score is the proximity to the dormitory area (Weight = 0.2916), succeeded by the dimensions of the store space (Weight = 0.2006), the location along the primary student flow pathway (Weight = 0.1539) and the adjacency to the teaching zone (Weight = 0.1121). This prioritization stems from the pronounced impact of college students’ engagement with on-campus retail establishments. Given students’ penchant for proximity, concurrently reducing the spatial divide between retail enterprises and students’ daily activities aids in carbon footprint mitigation. Additionally, prudently managing the size of retail spaces is crucial. Larger commercial areas inherently demand more resources, including energy for temperature control and illumination. Strategically optimizing commercial space dimensions through the analysis of student behavior plays a pivotal role in effective resource utilization, ultimately curbing overall resource consumption across the campus.
Within the life service category, the highest composite weight score corresponds to the proximity from the dormitory area (Weight = 0.3195). The subsequent ranks include the store space dimensions (Weight = 0.2098) and the alignment with the primary student traffic route (Weight = 0.1234). In the life service category, the distance from the dormitory area received the highest comprehensive weight score (Weight = 0.3195), followed by store size (Weight = 0.2098) and whether it is located on the main student flow path (Weight = 0.1234). The dormitory area’s proximity is the primary factor influencing energy consumption in life service businesses’ layout. Additionally, store size and layout comfort are significant considerations for students regarding life service businesses. Therefore, focusing on retail store size and product quality near student dormitories or high-traffic-activity areas can further reduce energy consumption.
Within the recreational category, the highest distance weight score is attributed to proximity (Weight = 0.2605), followed by parking convenience (Weight = 0.2034) and proximity to central campus roads (Weight = 0.1510). Leisure and entertainment establishments experience less frequent patronage from college students, typically limited to specific timeframes [34]. Consequently, regarding layout considerations, students prioritize travel convenience, proximity to dormitories, and parking accessibility. The minimized distances between recreational enterprises and residence halls, as well as proximity to primary campus thoroughfares and accessible parking, contribute to energy conservation by mitigating poor-accessibility-induced waste and effectively curtailing greenhouse gas emissions.

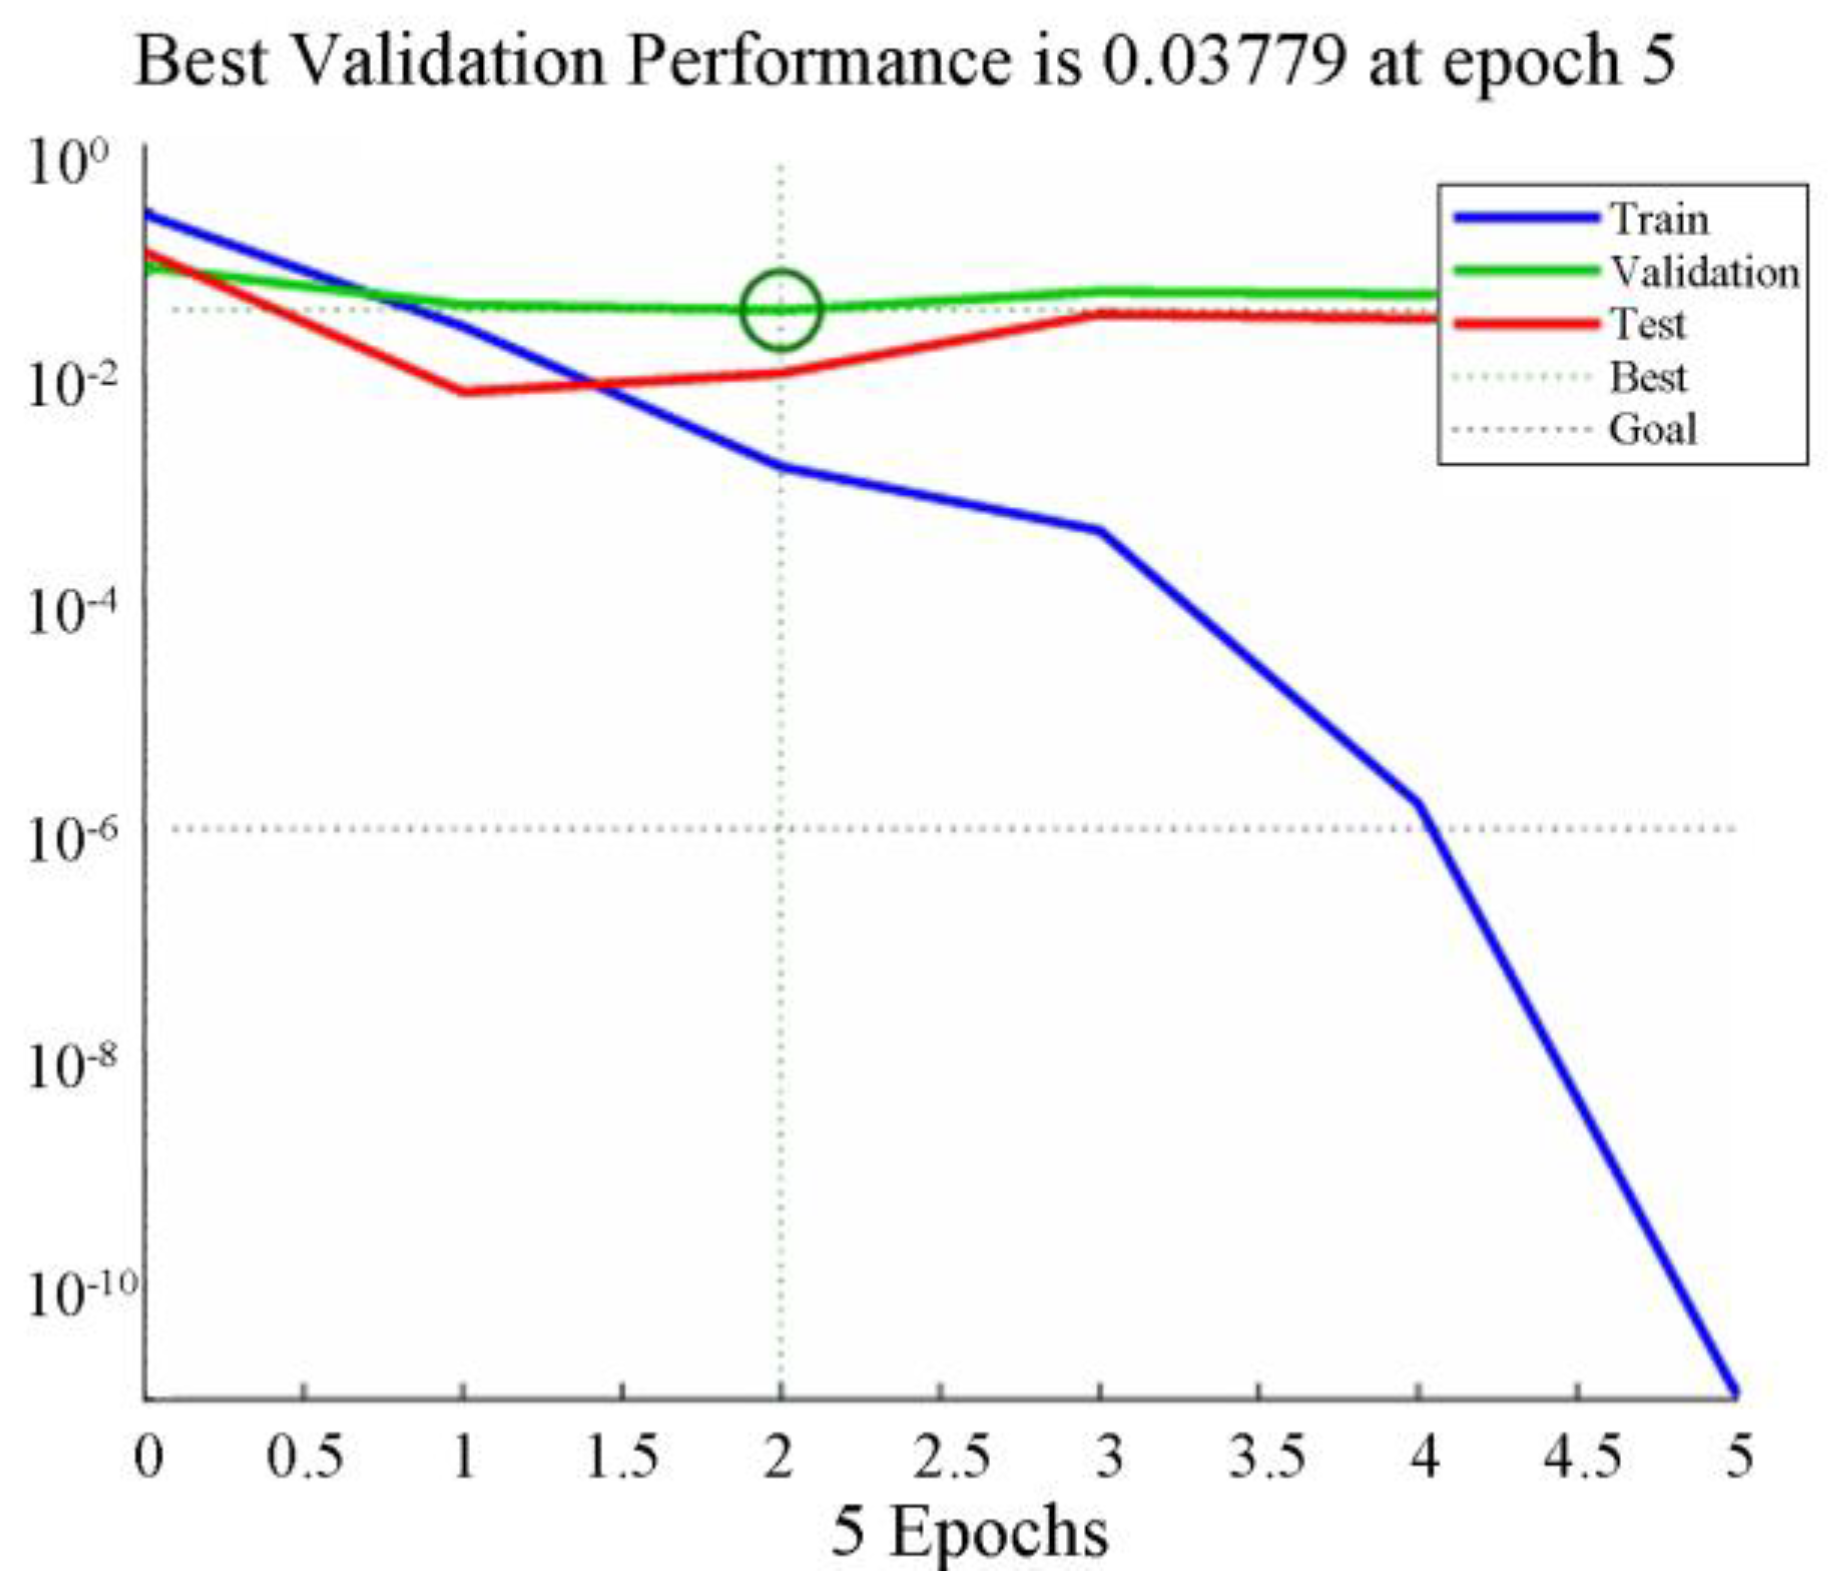
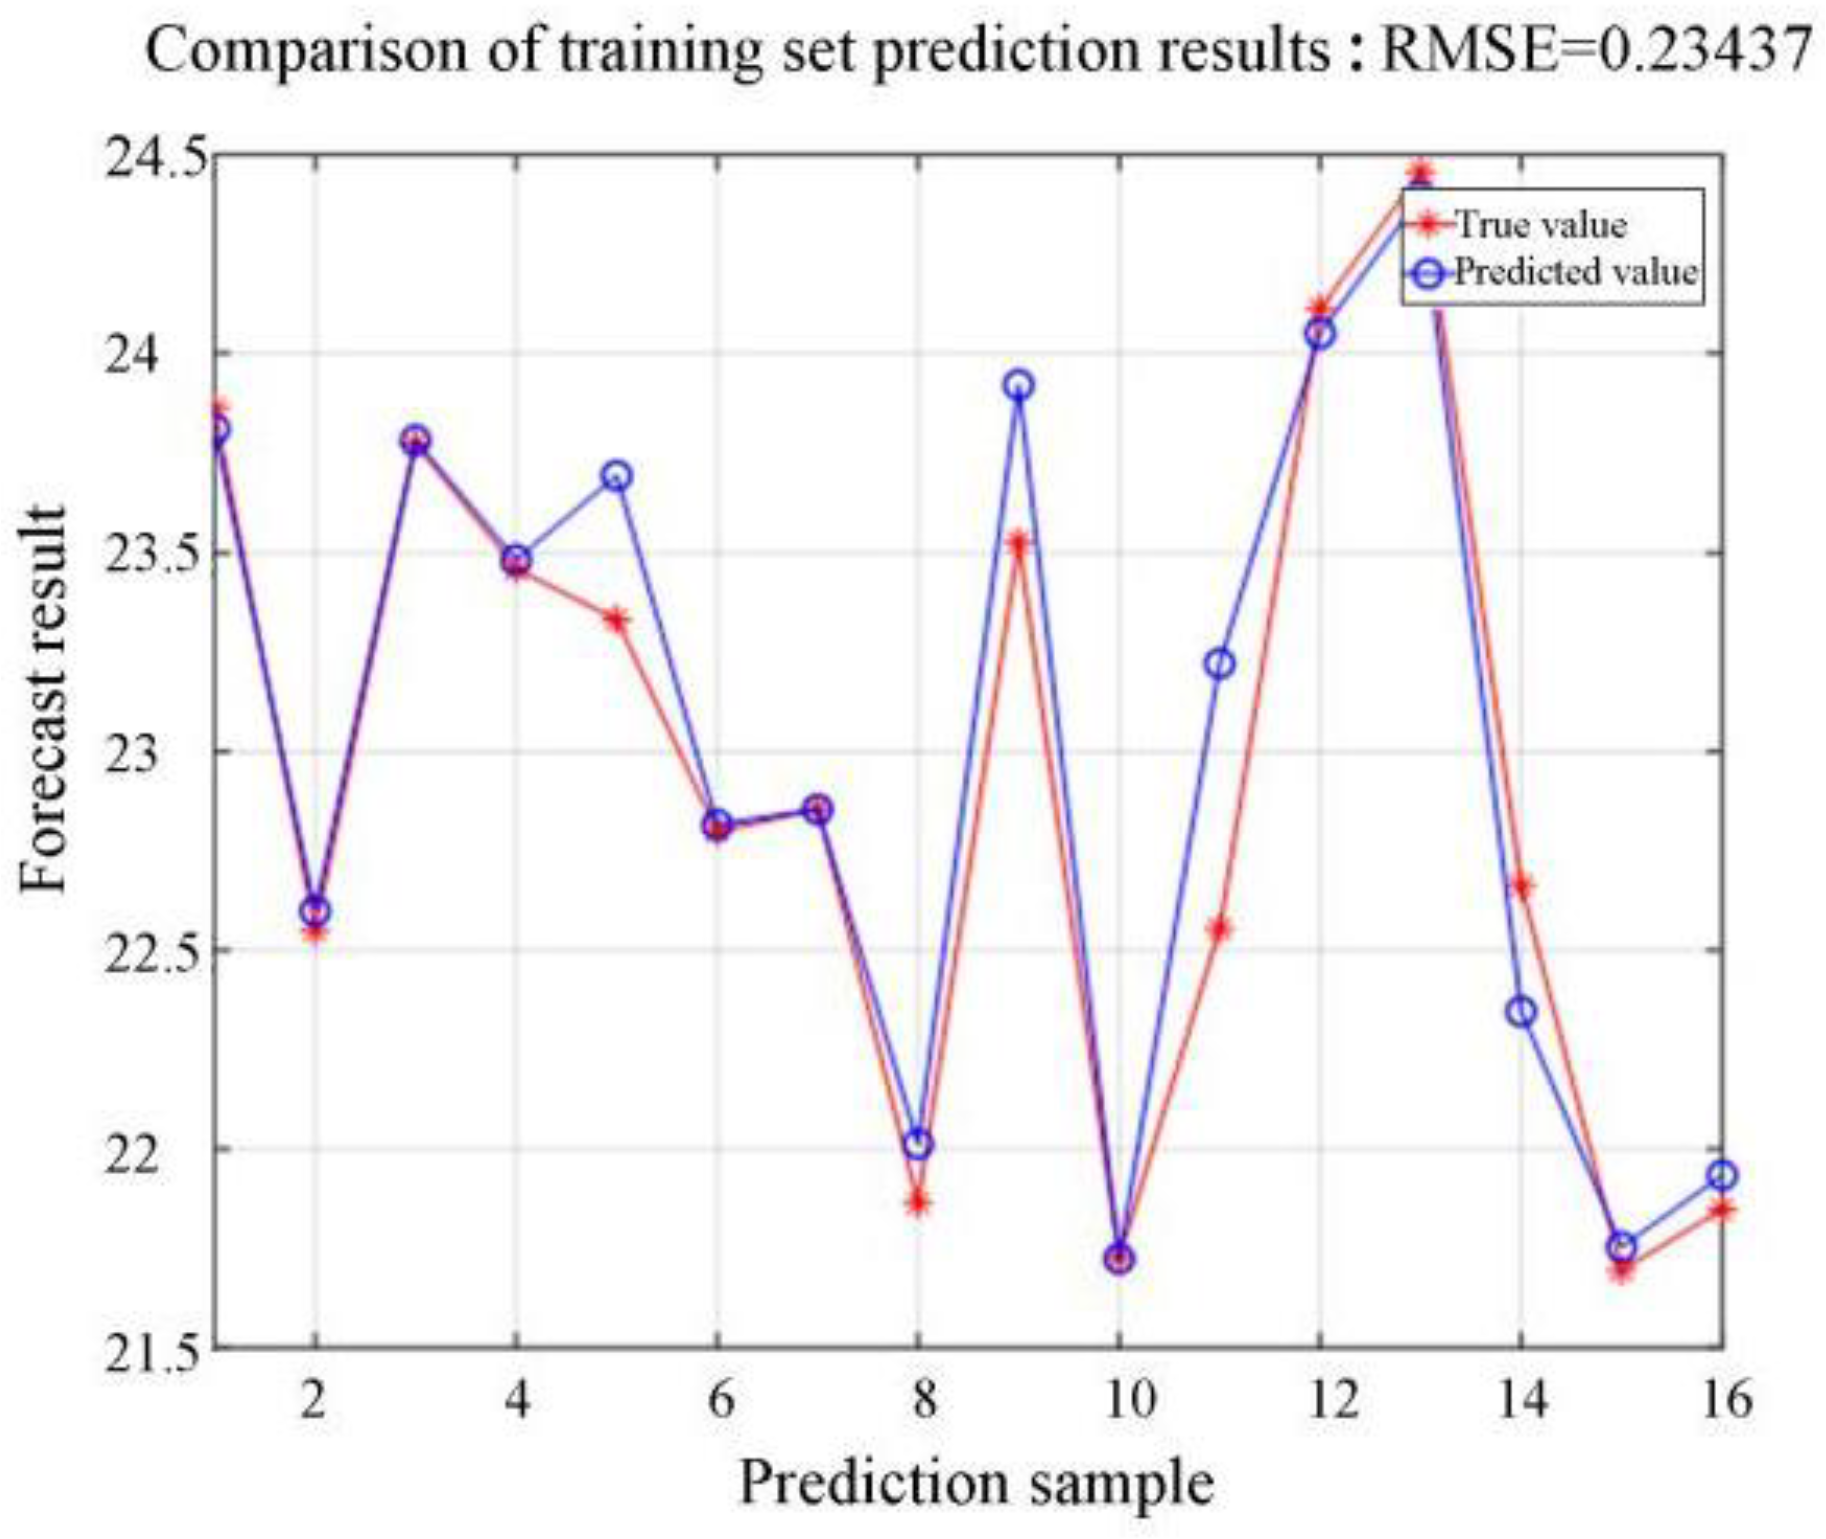
4.2.4. Neural Network Simulation
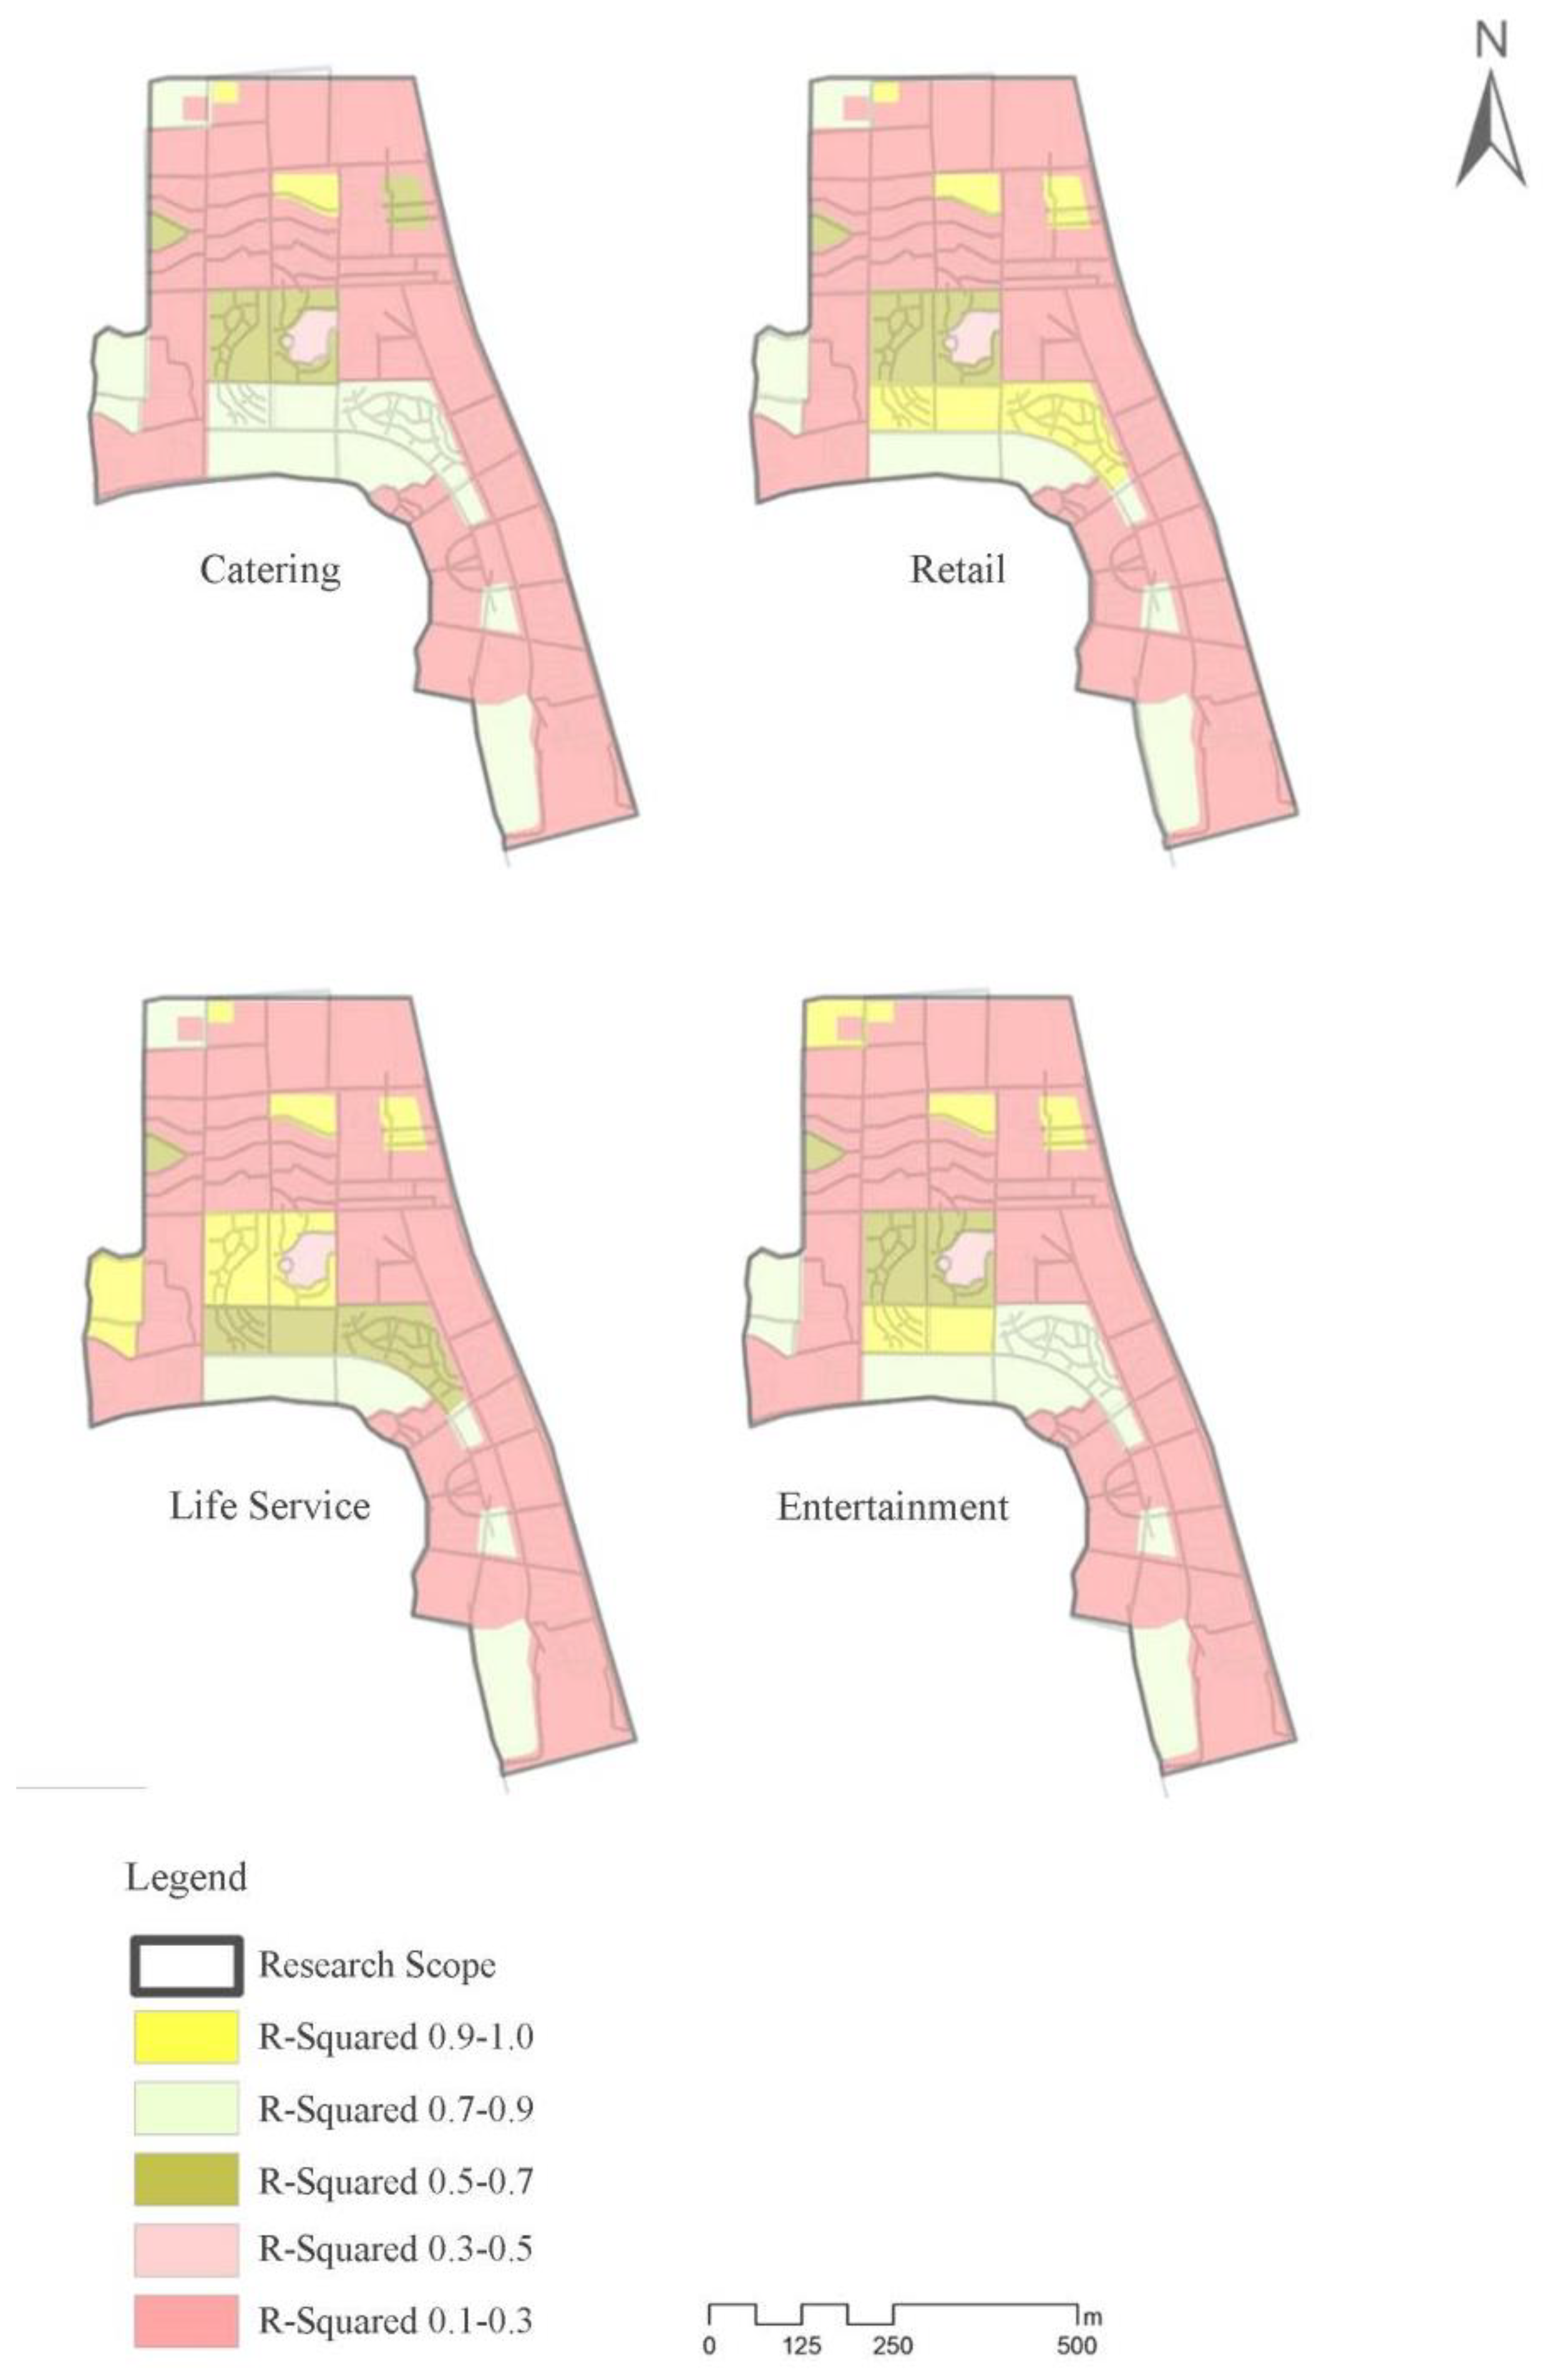
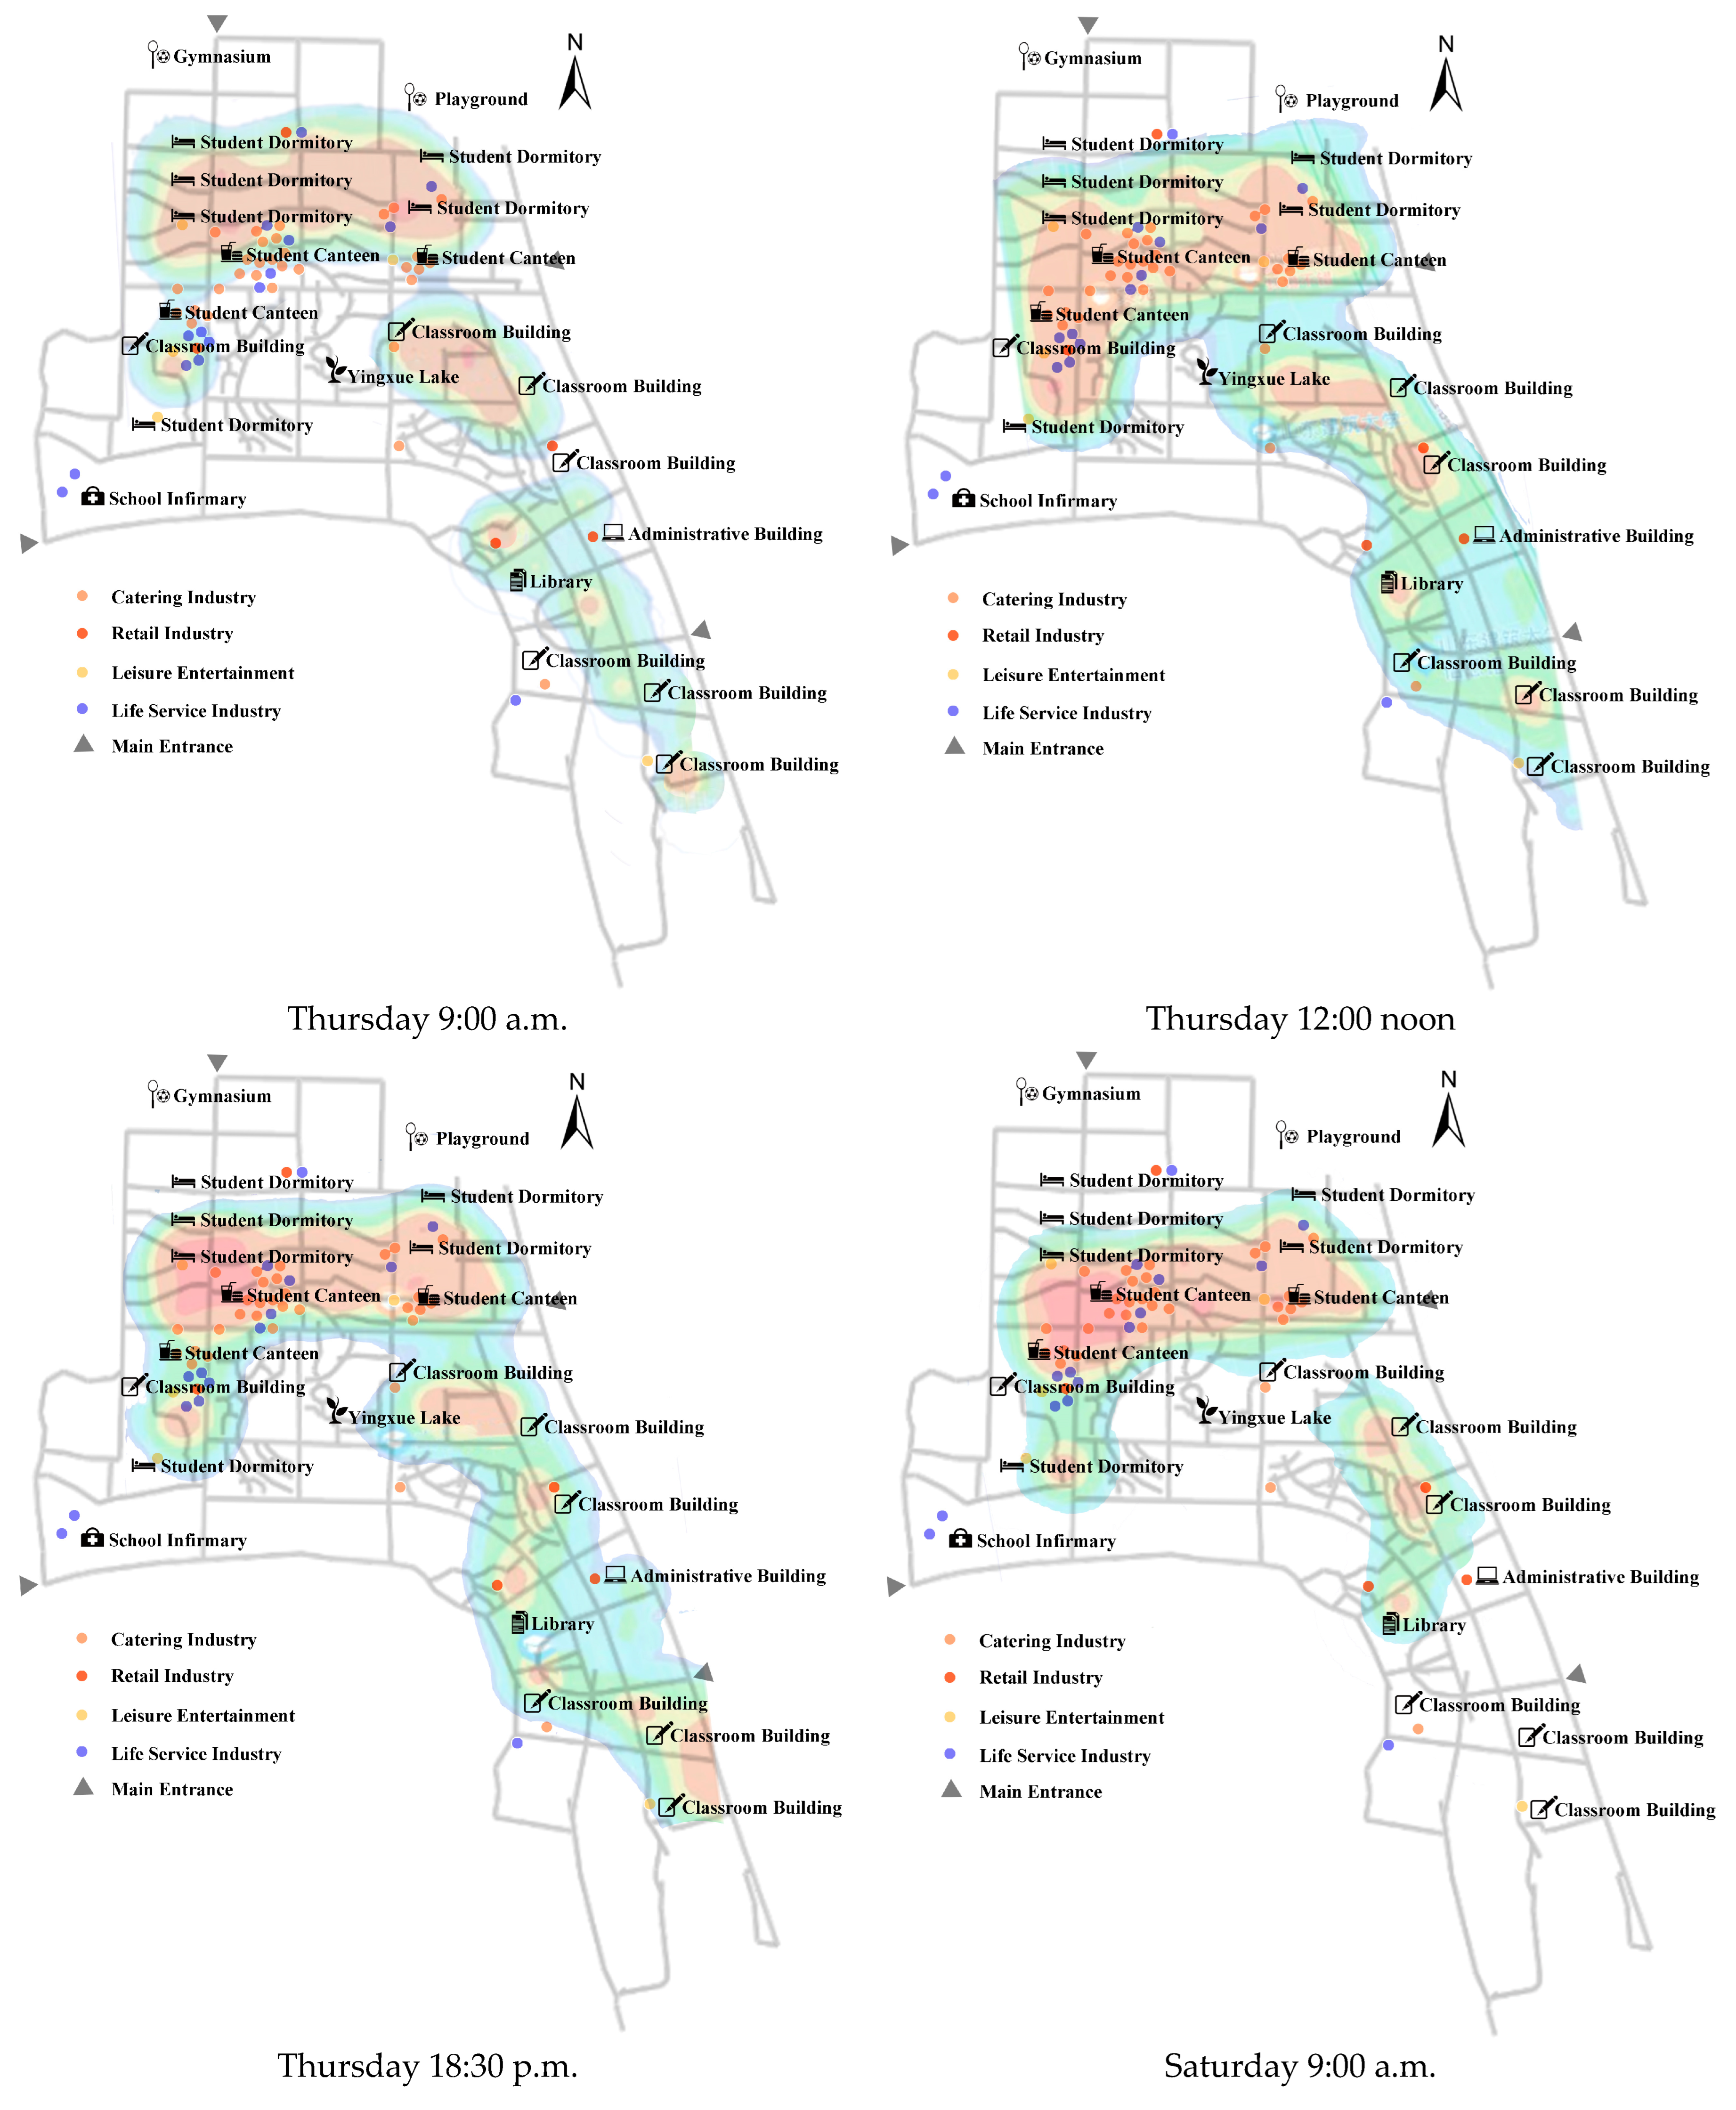
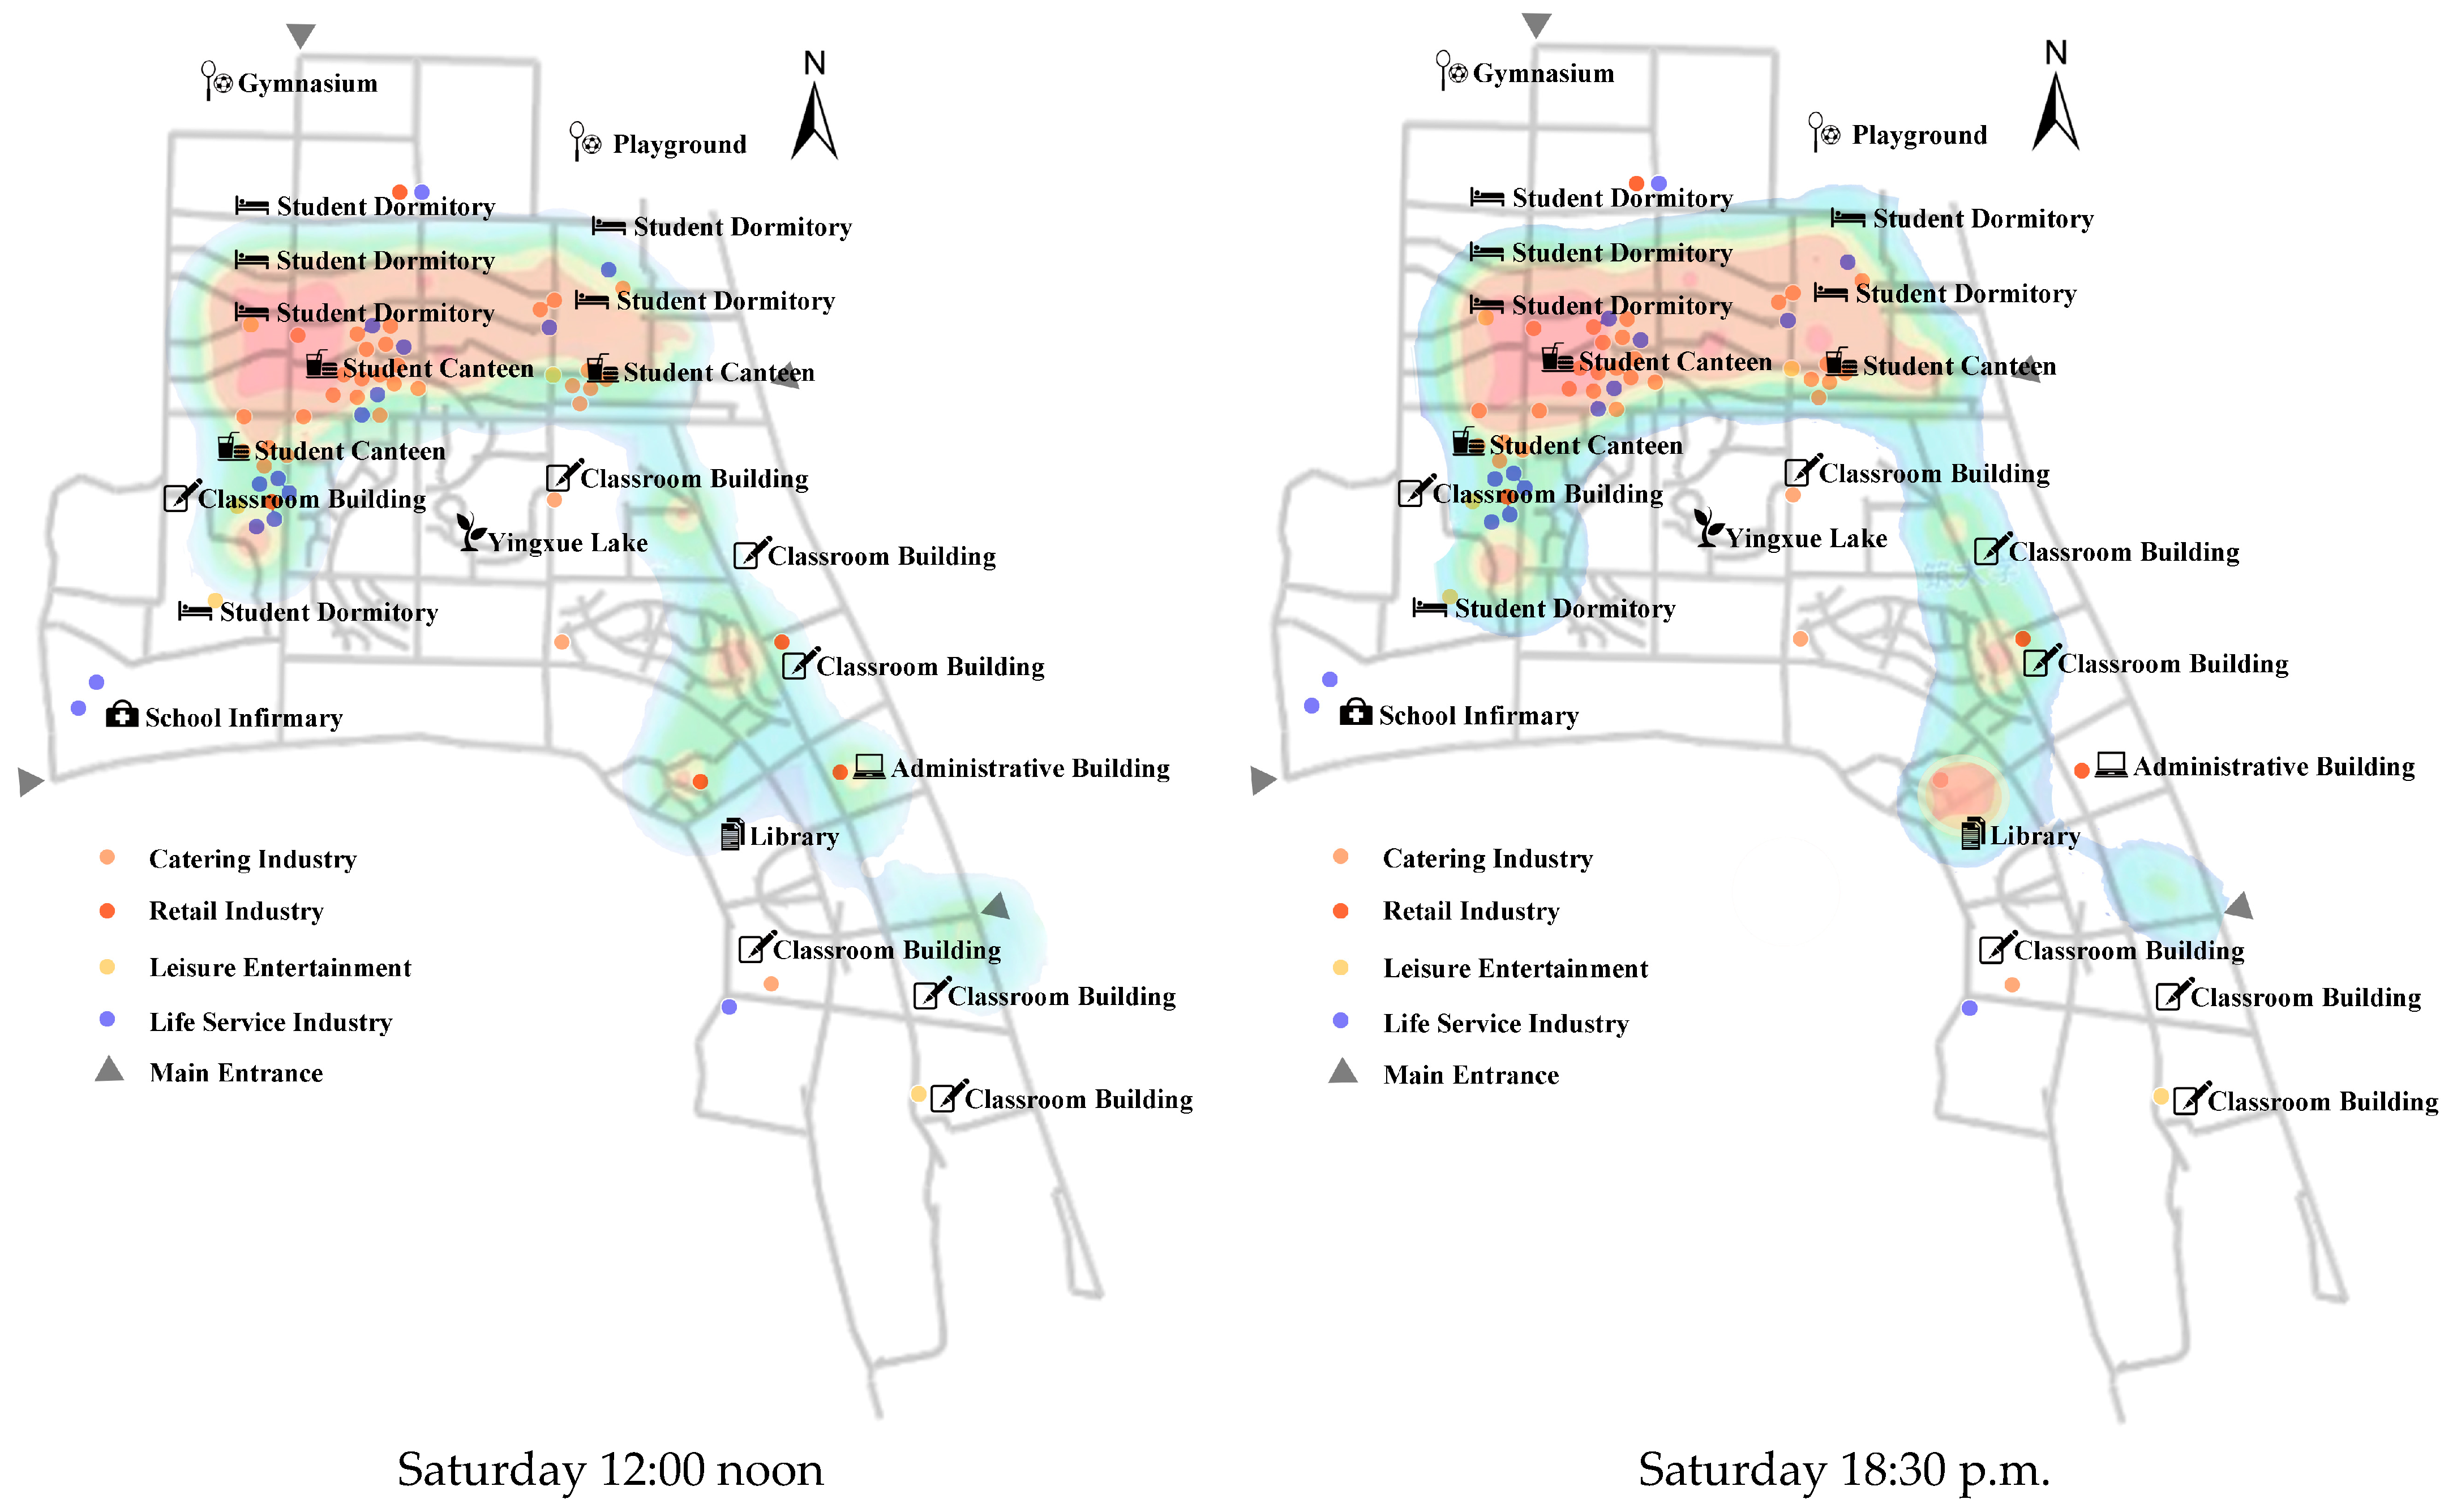
In this study, Matlab 2023 was employed for simulation testing. Upon building the neural network, the factors influencing the spatial arrangement of on-campus commercial services received scoring from a focus group utilizing a 10-point scale. Subsequently, the score data is used as the input variable, and the determined index combination weight vector is employed as the output value to compute the comprehensive evaluation score for the university campus [35]. Out of these, sixteen samples were utilized for learning and four for testing, of which the weights corresponding to the 38 third-level indicators are W = (W1, W2, …, W38) and the corresponding scores are X = (X1, X2, …, X38). The score representing the influence of factors on the spatial arrangement of commercial services within the university campus is calculated as Y = WX (Appendix A, Table A2). The neural network’s architecture is depicted in Figure 9. The S-type activation function was utilized during the testing phase to normalize the algorithm. The normalization principle is represented as Y = (X − Min)/(Max − Min), which results in values ranging between 0 and 1. A training network was created using the command “net = newff(p_train, t_train, 5)”, with the input layer containing 38 nodes. Through repeated testing and following the formula L = (M × N)/2 for calculating the number of hidden layer nodes, it is conclusively established that the network comprises five remote layer nodes and one output layer node. During the simulation testing phase, guided by training prerequisites, a precision threshold of 10−6 is set. The maximum training iterations are capped at 1000, while the learning rate is 0.01. The training procedure is depicted in Figure 10.
Figure 11 and Figure 12 depict the training and test results of the neural network data, while Figure 13 illustrates the fitting outcomes. As described in the figure, the value of R surpasses 0.9 and closely approaches 1, indicating minimal error. Both training and verification test values exceed 95%, underscoring the robust predictive precision of the model developed in this study, rendering the network suitable for simulation. Furthermore, test result analysis indicates that the relative error between the test and output sets remains within an acceptable range, validating the scientific rigor of the constructed model. Consequently, the latent factors influencing the arrangement of campus commercial service spaces can be authenticated, and their corresponding weights are determined based on output values.

4.3. Case Study

Shandong Jianzhu University, situated in Jinan City, within Shandong Province, is an industrial university covering an area of 1.6 square kilometers and accommodating over 27,000 full-time students. The university boasts a distinctive natural topography characterized by “one mountain, one ditch, and one pit”. The school building layout creatively utilizes the natural terrain, creating an elevated frame and dividing the campus into upper and lower layers to optimize natural light utilization. The campus’s natural landform informs the unique characteristics of its commercial space layout. Leveraging the natural features of “one mountain, one ditch, and one pit,” the campus adopts “one axis and three points” as the fundamental framework for a rational layout encompassing teaching, residential, and recreational areas. In the comprehensive campus planning, a meticulous approach to outdoor environment construction is employed to align with the natural surroundings, fostering the development of an ecologically green campus. The university’s overall form is relatively comprehensive based on research data from Shandong Jianzhu University. This paper utilized Shandong Jianzhu University as a case study to validate the accuracy of the weight results.
The choice of an R-squared threshold serves as a critical aspect in statistical analysis, particularly when validating simulation results. A high R-squared value indicates that a large proportion of the variability in the dependent variable (simulated outcomes) can be explained with the independent variable (calculated index weights). A threshold value exceeding R-squared > 0.9 signifies a robust correlation between the calculated index weight and simulation results. This implies high accuracy and reliability in the simulation outcomes, with the calculated index weight exhibiting strong predictive capabilities. This level of correlation is crucial for practical applicability, as it suggests that the identified optimal locations for commercial spaces are not merely coincidental but reliably determined through the established methodology. Figure 14 assesses the suitability of four business types’ layouts.
Based on simulation analysis, the optimal distribution for catering commercial service space is evident. The most suitable locations are the central area of the north-side dormitories and the entrance of the school’s north gate (R-Squared > 0.9). Additionally, favorable sites include the northwest region, adjacent to the high-traffic Yingxue Lake and the teaching area (0.7 < R-Squared < 0.9). The calculation outcomes emphasize that the critical spatial factors for catering services are their proximity to dormitories and their alignment with main student routes. Simulation results indicate that the two most suitable locations closely coincide with dormitory areas, reinforcing the alignment of index weight calculation with simulation findings.
According to the simulation analysis results, the retail and commercial service space is most suitable to be distributed in the south of the playground and the north of the dormitory area, the entrance of the north gate, and the south of Yingxue Lake, which is on the main flow line for students to and from classes (R-Squared > 0.9). Secondly, they are best suited to be distributed in the northwest dormitory area and near the teaching area (0.7 < R-Squared < 0.9). According to the above analytical outcomes, the most influential factor in retail business indicators is their proximity to dormitories, teaching areas, and alignment with main student-traffic routes. The evaluation of the two most suitable layout strategies indicates that they would be one which is dispersed along the primary student pathway and the other concentrated within the student residential region. The calculated index weight outcomes exhibit a strong correlation with the simulated results.
Life service businesses encompass barbershops, laundries, and related establishments. Based on the outcomes of the simulation analysis, the optimal allocation for life service commercial spaces appears to be in the southern part of the playground, the northern vicinity of the dormitory area, the north gate entrance, the west gate entrance, and the surroundings of Yingxue Lake (R-Squared > 0.9). Examining the impact factor weights reveals higher scores for the distance between service businesses and the dormitory area and their alignment with the main student traffic routes. This observation aligns with the simulation outcomes of the specific case.
Based on the outcomes of the simulation analysis, the optimal allocation for entertainment commercial service spaces is found at the north gate entrance, the southern part of the playground, the northern vicinity of the dormitory area, and the south region of Yingxue Lake (R-Squared > 0.9). According to the above analysis results, the influential factors with high weights for entertainment commercial service spaces include their proximity to the dormitory area, parking convenience, and distance from the main campus road. The traffic conditions in the suitable regions determined through simulation are convenient and proximity to the dormitory area, aligning well with the calculated index weight results.
To enhance the effectiveness of simulation results and validate the accuracy of commercial space planning at Shandong Jianzhu University, actual monitoring data were incorporated into this study. Live observations monitored real student traffic, usage patterns, and preferences on university campuses, collecting direct feedback from students regarding location preferences for dining, retail, life services, and entertainment commercial spaces. The flow of people on campus exhibits variations across different days of the week. Conducting observations over both weekdays and weekends allows for the capture of patterns associated with academic schedules, events, or activities. Given the presence of regular or occasional events on campus, such as sporting events, conferences, or festivals, it would be advantageous to include them in the observation period. Consequently, the detection period spans two weeks, from 16 October to 29 October 2023, with observations conducted at 9 a.m., 12 noon, and 6:30 p.m. Monitoring data reveal that student activities on campus exhibit concentration and stability. Accordingly, a working day (Thursday, October 19) and a rest day (Saturday, October 28) are randomly chosen for analysis within the observation period (Figure 15). During working days, high crowd density is concentrated in the dormitory and dining areas on the north side, followed by the teaching area and the region near the east-side library. On rest days, high crowd density is observed in the dormitory and dining areas on the north side, while other areas exhibit relatively low crowd density. A notable crowd gathers in the library area around 6 p.m. on Saturday due to an academic lecture. Monitoring data align with empirical findings. The integration of monitoring and empirical data offers a more comprehensive perspective, enhancing the efficacy of optimizing commercial space allocation at Shandong Jianzhu University. This approach guarantees that simulation results are not only theoretically robust but also reflect the authentic behaviors and preferences of the university community.
The simulation analysis considers critical spatial factors influencing the layout of commercial spaces, such as proximity to dormitories and teaching areas. These factors mirror real-world conditions. The study emphasizes aligning commercial space layout with eco-green development goals, enhancing both the ecological sustainability of the campus and supporting the overall mission and vision of the university. This study applies not only to university campuses but also to organizing sustainable commercial spaces in various communities. The consistently high R-square values across different types of business services (catering, retail, lifestyle services, entertainment) reinforce the validity of the case studies. The calculated index weight results exhibit a robust correlation with the impact factor weight, enhancing the reliability of the simulation outcomes. The case study’s validity is further supported by the institution’s specificity, the realism of the simulation analysis, and the results’ consistency across business service types.

5. Discussion and Conclusions

5.1. Future Directions

(1)
Improve the rationality of spatial layout
The layout of community commercial service spaces should transition from the current centralized and scattered pattern to a multi-point centralized, linear penetration and scattered supplement arrangement. During the initial phases of community planning and construction, the allocation of commercial service spaces should be integrated into the comprehensive community planning. Depending on the communities’ construction conditions, these retail spaces’ scale, format, layout, and visual design should be progressively determined. The arrangement of the entire communities’ commercial service facilities adopts a grid and hierarchical structure, facilitating the establishment of a coherent layout system.
The communities have established a business hub centered around the restaurant, resulting from deliberate planning and long-term commercial space development. A small business center should be tailored to users’ primary needs to optimize this clustered business space. This centralized commercial layout not only streamlines the supply chain, reducing transportation distances between employees and suppliers but also caters to the diverse requirements of users, lessening their reliance on transportation and significantly curbing transport-related carbon emissions. A centralized layout promotes shared infrastructure and services, enhancing energy efficiency through collective heating, cooling, and lighting systems and centralized waste recycling points. Retail commerce follows linear patterns, facilitating integration with community buses and bus stations. This approach offers the advantage of standardized shelter and circuit design, convenient restocking, and optimized resource allocation. Scattered supplementary commercial spaces in communities, mainly dedicated to retail and life services, should be strategically placed in dormitory buildings, teaching facilities, public areas, and other locations with heavy foot traffic.
(2)
Enhance the rationality of the service radius
Through an analysis of users’ satisfaction with community business service spaces, it is evident that users prefer prompt access to basic catering, retail, and select life service establishments. The highest satisfaction is achieved within the first five minutes of arrival. For particular life service and entertainment businesses, pleasure can be appropriately extended within ten minutes of arrival. The commercial spaces can be categorized into community-level business circles, group-level business circles, and neighborhood-level business circles based on varying service radii and demand levels to optimize the use of community resources [36]. The spatial attributes of the community business district are presented in Table 3.
The community-level business district has limited facilities, but they are substantial and serve all or most of the communities’ staff, fostering a strong sense of community. Typically, users should not have to travel more than 15 min to reach this area, which should offer a wide variety of business service spaces to meet users’ essential and routine needs. Currently, community-level business service spaces are located in the central canteen or areas with the highest overall integration and a travel radius of 500 m to 1000 m. The group-level business circle offers numerous services but operates on a smaller scale, providing essential services like barbershops and print shops. It has a service radius of 300 m to 400 m, allowing users to reach it within five to six minutes. Positioned at the heart of users’ lives, this business circle caters to users’ essential needs in catering, retail, and life services. In areas lacking canteen services, such business circles are strategically established within travel radii of 300 m and 500 m to maximize accessibility and convenience. Neighborhood-level business circles are small in scale and limited in number, consisting mainly of supplementary services like small retail stores, newsstands, vending machines, and similar setups. These services are accessible within a 100 m to 200 m radius, allowing users to reach them in one to two minutes. Such business circles should be strategically placed between accommodation and office space or established in areas with the highest accessibility within the 100 m to 200 m travel radius to meet the retail needs of nearby users.
(3)
Strengthen sustainable building practices
During the initial construction phase of the new communities, it is crucial to consider the flexibility of commercial spaces. Designating adaptable areas based on users’ pathways and peak gathering times will enable future adjustments, aligning with users’ changing needs and societal trends, ultimately fostering the sustainable development of the communities. The flexibility in the layout and architectural design of commercial spaces enables the implementation of energy-efficient building practices, including energy-efficient lighting, sustainable building materials, and intelligent technologies. Linhave shown that smart thermostats and HVAC control systems can be programmed to enhance heating and ventilation efficiency, lowering energy consumption while ensuring comfort [37]. Integrating commercial spaces with green landscapes promotes biodiversity, reducing the urban heat island effect and improving air quality in communities, as Yang observed [38]. Moreover, repurposing existing heritage buildings or historic structures in communities can minimize the environmental impact of new construction while fostering a distinctive community business culture.
Nevertheless, autonomous action within the campus’s commercial service space remains improbable without dedicated institutions, incentives, or a compelling push from users and faculty for sustainable endeavors. As society increasingly emphasizes environmental preservation, energy efficiency, and sustainable progress, many communities are projected to prioritize the sustainable advancement of commercial service spaces in the foreseeable future. Governments and institutions might also implement policies or incentives to prompt community-based businesses to consider sustainable development.

5.2. Conclusions

Employing fieldwork methodologies and utilizing university campuses as exemplars, this research intricately focuses on the optimization of commercial service spaces within communities with the overarching aim of reducing energy consumption. The study pioneers the establishment of an innovative AEL (Analytic Hierarchy Process, Entropy Weight Method, and Lagrange Algorithm) evaluation index model specifically tailored for commercial service spaces. This model is further enhanced by the integration of machine learning technology and validated through a neural network. To uphold the precision of the calculation results, the model undergoes meticulous verification using a campus as a real-world example. Delving into the current state of commercial service spaces, the research not only analyzes the existing situation but also forecasts the future development of community business service areas with a dedicated focus on sustainability. Consequently, this study not only contributes invaluable insights into the sustainable transformation of commercial spaces within communities but also offers a pioneering machine learning methodology for calculating joint subjective and objective weights of multiple indicators. Beyond its immediate application in commercial space optimization, the developed methodology holds broader implications for diverse fields. The research findings can be harnessed to support the establishment of community-energy-consumption databases or monitoring platforms, making a significant contribution to the realm of low-carbon and low-energy buildings. In essence, this study not only enhances our understanding of sustainable commercial space transformation but also extends its impact to advance methodologies applicable across various domains, thereby making a lasting contribution to the knowledge base in the pursuit of environmentally conscious urban development.
This study has limitations, particularly regarding the quantity of data used in the analysis. Biased training data can result in inaccurate calculations, as machine learning models depend significantly on the quality and amount of available training data. Despite the specific limitations of the data-driven model in this paper, the research outcomes offer a general guideline for optimizing the sustainability of communities’ commercial spatial layouts and underscore the significance of machine learning in index weight analysis. This approach has global applicability and can assist communities across different countries in formulating tailored sustainable directives for their commercial space layouts.

Author Contributions

Conceptualization, Y.Y.; methodology, X.W. and C.L.; software, X.W.; investigation, Y.W.; data curation, Y.Y.; writing—original draft, Y.L.; writing—review & editing, C.L., J.Z. and Y.Y.; funding acquisition, J.Z. All authors have read and agreed to the published version of the manuscript.

Funding

This research was funded by the National Natural Science Foundation of China grant number 51578326 and the Natural Science Foundation of Shandong Province grant number ZR2023ME220 and The APC was funded by Yang Yang.

Data Availability Statement

Data is contained within the article or Supplementary Material. The data presented in this study are available in Appendix A.

Conflicts of Interest

The authors declare no conflict of interest.

Appendix A

Table A1. Analysis of personal traits and commercial space features.
Personal CharacteristicsOptionsPercentageCharacteristics of Commercial SpacesOptionsPercentage
SexMale51.16%CategoryCatering Large restaurant36.07%
Female48.84%Small restaurant15.46%
Respondent’s occupationCollege students82.42%Upscale restaurant48.47%
School staff13.37%Retail Large supermarket64.33%
Expert4.21%Small supermarket22.38%
Respondent’s educational institutionsArt category31.27%Household goods7.45%
Science and technology category37.32%Convenience store5.84%
Literature and history category31.41%.Life Services Large-scale entertainment76.65%
User Activity in the Commercial ZoneWithin 30 min63.03%Small-scale entertainment24.35%
30 min–1 h24.54%Entertainment Joint operation85.44%
1 h–2 h7.35%Independent operation14.56%
More than 2 h5.08%
Respondent’s NeedsCoffee and tea beverages56.85%Current situationSmall-scale68.29%
Bookstore37.92%
Self-study room67.26%Unreasonable layout41.46%
Gym49.45%
Specialty Dining51.95%Inadequate Management26.83%
Supermarket62.23%
Respondent’s satisfactionSatisfied43.32%Low comfort level49.23%
Neutral 46.03%Difficult parking14.63%
Dissatisfied10.65%Inefficient energy use56.79%
Comparison of Expected and Actual Weighting
Weight of Responder NeedsCatering27.33%Actual WeightCatering38.33%
Retail25.67%Retail27.12%
Life Services32.02%Life Services25.67%
Entertainment14.98%Entertainment8.88%
Table A2. Simulation training test samples.
Index
SortA1B1C1D1E1F1G1H1I1J1K1A2B2C2D2E2F2G2H2I2A3B3C3D3E3F3G3H3A4B4C4D4E4F4G4H4I4J4Desired Output
1952654813628454635728273536494266345276.4510
2953654712638454635738363436393174535366.2730
3972653823428563744529274545584266345366.3802
4952744614648454635738253436494175436276.3529
5852554823527654535618474544292466444256.0197
6773654812638465654728263556484154355476.3606
7952663723628554553747475535394256444276.2460
8852554613629473635528273546495166335346.1501
9953652833517455743729364635574355245276.2249
10972654714628364635638273536493166344156.2600
11852654813628454635728274536594266335276.4068
12955653832638454635737463436393274535356.2041
13772653923529563544529274445584266345366.3183
14952744614648463635638253436494175435376.2925
15852564824527554535629574545293456444256.1450
16774655812638365654728264356484254445476.3428
17952663923628554553747465535374256444276.1723
18852554614629463635528273546495166335346.1342
19954652833517455743719364435574355245266.1314
20972654724628354635638273536493246344156.1616

References

  1. Abdul Razak, D.; Sanusi, Z.A.; Jegatesen, G.; Khelghat-Doost, H. Alternative University Appraisal (AUA): Reconstructing Universities’ Ranking and Rating toward a Sustainable Future. Sustainability Assessment Tools in Higher Education Institutions: Mapping Trends and Good Practices around the World; Springer International Publishing: Berlin/Heidelberg, Germany, 2013; pp. 139–154. [Google Scholar] [CrossRef]
  2. Gu, Y.; Zhao, J.; Herzog, T.; Mao, Q.; Latz, P. Exploring the space use mechanism of high-density campus in urban Beijing. Habitat Int. 2019, 91, 102024. [Google Scholar] [CrossRef]
  3. Quevedo, T.C.; Geraldi, M.S.; Melo, A.P. Applying machine learning to develop energy benchmarking for university buildings in Brazil. J. Build. Eng. 2023, 63, 105468. [Google Scholar] [CrossRef]
  4. Versteijlen, M.; van Wee, B.; Wals, A. Exploring sustainable student travel behaviour in the Netherlands: Balancing online and on-campus learning. Int. J. Sustain. High. Educ. 2021, 22, 146–166. [Google Scholar] [CrossRef]
  5. Zheng, N.; Li, S.; Wang, Y.; Huang, Y.; Bartoccid, P.; Fantozzid, F.; Huang, J.; Xing, L.; Yang, H.; Chen, H.; et al. Research on low-carbon campus based on ecological footprint evaluation and machine learning: A case study in China. J. Clean. Prod. 2021, 323, 129181. [Google Scholar] [CrossRef]
  6. Topuz, B.; Alp, N.Ç. Machine learning in architecture. Autom. Constr. 2023, 154, 105012. [Google Scholar] [CrossRef]
  7. Tamke, M.; Nicholas, P.; Zwierzycki, M. Machine learning for architectural design: Practices and infrastructure. Int. J. Archit. Comput. 2018, 16, 123–143. [Google Scholar] [CrossRef]
  8. Chen, W.; Zou, W.; Zhong, K.; Aliyeva, A. Machine learning assessment under the development of green technology innovation: A perspective of energy transition. Renew. Energy 2023, 214, 65–73. [Google Scholar] [CrossRef]
  9. Lu, Y.; Chen, Q.; Yu, M.; Wu, Z.; Huang, C.; Fu, J.; Yu, Z.; Yao, J. Exploring spatial and environmental heterogeneity affecting energy consumption in commercial buildings using machine learning. Sustain. Cities Soc. 2023, 95, 104586. [Google Scholar] [CrossRef]
  10. Tao, W. Research on Commercial space in University campuses under the new situation: A case study of Jiulong Lake Campus of Southeast University. Mod. Urban Res. 2022, 12, 65–67. [Google Scholar]
  11. Venkatraj, V.; Dixit, M.K.; Yan, W.; Caffey, S.; Sideris, P.; Aryal, A. Toward the application of a machine learning framework for building life cycle energy assessment. Energy Build. 2023, 297, 113444. [Google Scholar] [CrossRef]
  12. Williamsson, J. Business model design for campus-based autonomous deliveries–A Swedish case study. Res. Transp. Bus. Manag. 2022, 43, 100758. [Google Scholar] [CrossRef]
  13. Torrijos, V.; Dopico, D.C.; Soto, M. Integration of food waste composting and vegetable gardens in a university campus. J. Clean. Prod. 2021, 315, 128175. [Google Scholar] [CrossRef]
  14. Aghamolaei, R.; Fallahpour, M. Strategies towards reducing carbon emission in university campuses: A comprehensive review of both global and local scales. J. Build. Eng. 2023, 76, 107183. [Google Scholar] [CrossRef]
  15. ISO14001; Environmental Management Systems—Requirements with Guidance for Use. ISO: Geneva, Switzerland, 2015.
  16. Lidgren, A.; Rodhe, H.; Huisingh, D. A systemic approach to incorporate sustainability into university courses and curricula. J. Clean. Prod. 2006, 14, 797–809. [Google Scholar] [CrossRef]
  17. Amaral, L.; Martins, L.; Gouveia, J. Quest for a sustainable university: A review. Int. J. Sustain. High. Educ. 2015, 16, 155–172. [Google Scholar] [CrossRef]
  18. Gomez, F.; Saez-Navarrete, C.; Lioi, S.; Marzuca, V. Adaptable model for assessing sustainability in higher education. J. Clean. Prod. 2014, 107, 475–485. [Google Scholar] [CrossRef]
  19. Chen, L.; Wang, H. Occupant Behavior and Its Role in Campus Commercial Space Energy Efficiency. Sustain. Dev. J. 2020, 7, 89–104. [Google Scholar]
  20. Rodriguez, M. Metrics and Monitoring for Assessing Sustainable Campus Commercial Space Initiatives. J. Sustain. Metr. 2018, 4, 67–82. [Google Scholar]
  21. Soares, I.; Yamu, C.; Weitkamp, G. The relationship between the spatial configuration and the fourth sustainable dimension creativity in university campuses: The case study of Zernike Campus, Groningen, The Netherlands. Sustainability 2020, 12, 9263. [Google Scholar] [CrossRef]
  22. Abdelkafi, N.; Hilbig, R.; Laudien, S.M. Business models of entrepreneurial universities in the area of vocational education—An exploratory analysis. Int. J. Technol. Manag. 2018, 77, 86–108. [Google Scholar] [CrossRef]
  23. Fang, N.; Zou, W.; Huang, J. Research on the layout of campus public service facilities based on the concept of living circle—A case study of Yunnan University. Urban Archit. 2021, 18, 112–116. [Google Scholar]
  24. Chen, C. Research on Spatial Layout of Service Facilities Based on Campus Behavior of University Students. Master’s Thesis, Dalian University of Technology, Dalian, China, 2021. [Google Scholar]
  25. Luo, J.; Chen, W.; Chen, S. Optimize the function matching and sharing mechanism of the linkage effect of the newly built university campus. J. Cent. China Archit. 2011, 29, 123–126. [Google Scholar]
  26. Lin, C. Research on Commercial Space Layout of University Campus Based on Students’ Daily Consumption Behavior. Master’s Thesis, Dalian University of Technology, Dalian, China, 2017. Available online: https://kns-cnki-net-443.webvpn.sdjzu.edu.cn/kcms/detail/detail.aspx?FileName=1017823276.nh&DbName=CMFD2018 (accessed on 24 July 2023).
  27. Xu, S.; Cheng, B.; Huang, Z.; Liu, T.; Li, Y.; Jiang, L.; Guo, W.; Xiong, J. Impact of the COVID-19 on electricity consumption of open university campus buildings—The case of Twente University in the Netherlands. Energy Build. 2022, 279, 112723. [Google Scholar] [CrossRef] [PubMed]
  28. Nianan, L. Design and Research of University Campus Commercial Space. Master’s Thesis, Xi‘an University of Architecture and Technology, Xi’an, China, 2004. Available online: https://kns-cnki-net-443.webvpn.sdjzu.edu.cn/kcms/detail/detail.aspx?FileName=2004072704.nh&DbName=CMFD2004 (accessed on 24 July 2023).
  29. Qiaran, H.; Liu, C.-Y.; Zhang, Y.-Y.; Hong, W.-X. Performance evaluation of sponge city based on AHP entropy weight method and matter-element extension model: A case study of Qingdao. J. Qilu Univ. Technol. 2019, 37, 74–80. [Google Scholar]
  30. Gong, K.; Nan, D.; Yang, Z. Research on comprehensive decision method of heating scheme based on AHP-EWM. Build. Energy Effic. 2022, 50, 91–95. [Google Scholar]
  31. MathWorks. Statistics and Machine Learning Toolbox Documentation—MathWorks. 2022. Available online: https://ww2.mathworks.cn/help/stats/index.html?s_tid=CRUX_lftnav (accessed on 5 August 2023).
  32. Wang, X.; Svenning, J.C.; Liu, J.; Zhao, Z.; Zhang, Z.; Feng, G.; Si, X.; Zhang, J. Regional effects of plant diversity and biotic homogenization in urban greenspace–The case of university campuses across China. Urban For. Urban Green. 2021, 62, 127170. [Google Scholar] [CrossRef]
  33. Yu, Z.; Dong, H.; Liu, C. Research on Swing Model and Fuzzy Anti Swing Control Technology of Bridge Crane. J. Mach. 2023, 11, 579. [Google Scholar] [CrossRef]
  34. Ramakreshnan, L.; Fong, C.S.; Sulaiman, N.M.; Aghamohammadi, N. Motivations and built environment factors associated with campus walkability in the tropical settings. Sci. Total Environ. 2020, 749, 141457. [Google Scholar] [CrossRef]
  35. Huntingford, C.; Jeffers, E.S.; Bonsall, M.B.; Christensen, H.M.; Lees, T.; Yang, H. Machine learning and artificial intelligence to aid climate change research and preparedness. Environ. Res. Lett. 2019, 14, 124007. [Google Scholar] [CrossRef]
  36. Li, H. China’s current situation and future development trend of university campus planning. J. Urban Archit. 2021, 17, 26–28. [Google Scholar]
  37. Lin, C.; Gao, Y.; Huang, J.; Shi, D.; Feng, W.; Liu, Q.; Du, X. A novel numerical model for investigating macro factors influencing building energy consumption intensity. Sustain. Prod. Consum. 2020, 24, 308–323. [Google Scholar] [CrossRef]
  38. Yang, G.; Lin, B.R.; Zhu, Y.X. Comparative study on indoor environmental quality of green office buildings with different levels of energy use intensity. Build. Environ. 2020, 168, 106482–106494. [Google Scholar] [CrossRef]
Figure 1. Study-object-distribution map.
Buildings 14 00108 g001
Figure 2. The general framework for machine learning algorithms to determine weights.
Buildings 14 00108 g002
Figure 3. The training process of the BP neural network.
Buildings 14 00108 g003
Figure 4. Space syntax analysis of Shandong University of Finance and Economics.
Buildings 14 00108 g004aBuildings 14 00108 g004b
Figure 5. Space syntax analysis of Jinan University.
Buildings 14 00108 g005
Figure 6. Space syntax analysis of Shandong Jianzhu University.
Buildings 14 00108 g006
Figure 7. Space syntax analysis of Shandong College of Art.
Buildings 14 00108 g007
Figure 8. Space syntax analysis of Shandong Traditional Chinese Medicine University.
Buildings 14 00108 g008
Figure 9. Neutral network structure.
Buildings 14 00108 g009
Figure 10. Neural network training process. The horizontal axis of the figure represents the number of training iterations, while the vertical axis represents the mean square error value. The green circle in the figure indicates the iteration number and corresponding network performance when achieving optimal mean square error on validation set.
Buildings 14 00108 g010
Figure 11. Comparison of the training set prediction results.
Buildings 14 00108 g011
Figure 12. Comparison of test set prediction results.
Buildings 14 00108 g012
Figure 13. Result of fit degree. The figure includes the data correlation of training set, verification set, test set and overall result after training. The abscissa represents the target output, and the ordinate represents the fit function between the predicted output and the target output.
Buildings 14 00108 g013
Figure 14. Layout suitability analysis for four types of business.
Buildings 14 00108 g014
Figure 15. Campus traffic real-time monitoring data.
Buildings 14 00108 g015aBuildings 14 00108 g015b
Table 1. Energy-consumption factors of campus commercial space.
TargetFirst-Grade FactorsSecond-Grade Factors
Influencing factors of catering Z1Distance from functional area Z11Distance from the dormitory area A1
Distance from teaching area B1
Distance from sports venues C1
Distance from public activity space D1
Distance from traffic flow line Z12Distance from the main entrance and exit of campus E1
Distance from main campus road F1
Whether it is on the student’s main flow line G1
Elements of the business itself Z13Distance from other businesses of the same type H1
Front square space I1
Store space J1
Environmental element Z14Parking convenience K1
Influencing factors of retail Z2Distance from functional area Z21Distance from the dormitory area A2
Distance from teaching area B2
Distance from living service area C2
Distance from recreation area D2
Distance from traffic flow line Z22Whether it is on the student’s main flow line E2
Elements of the business itself Z23Distance from other businesses of the same type F2
Distance from public activity space G2
Store space H2
Environmental element Z24Parking convenience I2
Influencing factors of life services Z3Distance from functional area Z31Distance from the dormitory area A3
Distance from teaching area B3
Distance from traffic flow line Z32Whether it is on the student’s main flow line C3
Elements of the business itself Z33Distance from other businesses of the same type D3
Distance from other different types of business E3
Store space F3
Environmental element Z34Surrounding environment and greenery G3
Parking convenience H3
Influencing factors of entertainment Z4Distance from functional area Z41Distance from the dormitory area A4
Distance from teaching area B4
Distance from public activity space C4
Distance from traffic flow line Z42Distance from main campus road D4
Whether it is on the student’s main flow line E4
Elements of the business itself Z43Distance from other businesses of the same type F4
Front square space G4
Store space H4
Environmental element Z44Surrounding environment and greenery I4
Parking convenience J4
Table 2. University campus commercial spatial layout evaluation index weight.
First-Grade FactorsSecond-Grade FactorsSubjective WeightObjective WeightSynthetic WeightRank
Catering Z1Distance from functional area Z11Distance from the dormitory area A10.24320.22650.23331
Distance from teaching area B10.06250.17540.10414
Distance from sports venues C10.03510.02140.027210
Distance from public activity space D10.13490.10180.11653
Distance from traffic flow line Z12Distance from the main entrance and exit of campus E10.08290.07450.07816
Distance from main campus road F10.06100.05240.05627
Whether it is on the student’s main flow line G10.17140.18970.17922
Elements of the business itself Z13Distance from other companies of the same type H10.01700.01470.015711
Front square space I10.09630.02450.04838
Store space J10.12550.08650.10365
Environmental element Z14Parking convenience K10.04430.03260.03789
Retail Z2Distance from functional area Z21Distance from the dormitory area A20.32530.24510.2916 1
Distance from teaching area B20.08770.13450.1121 4
Distance from living service area C20.05250.08450.0688 5
Distance from recreation area D20.04090.05640.0496 7
Distance from traffic flow line Z22Whether it is on the student’s main flow line E20.12420.17890.1539 3
Elements of the business itself Z23Distance from other companies of the same type F20.01470.06790.0326 8
Distance from public activity space G20.06190.06890.0674 6
Store space H20.27260.13840.2006 2
Environmental element Z24Parking convenience I20.02020.02540.0234 9
Life services Z3Distance from functional area Z31Distance from the dormitory area A30.31040.32170.3195 1
Distance from teaching area B30.02500.02850.0270 8
Distance from traffic flow line Z32Whether it is on the student’s main flow line C30.09010.16540.1234 3
Elements of the business itself Z33Distance from other companies of the same type D30.06210.05450.0588 7
Distance from other different types of business E30.07170.08520.0790 5
Store space F30.22730.18940.2098 2
Environmental element Z34Surrounding environment and greenery G30.14740.08650.1142 4
Parking convenience H30.0660.06880.0681 6
Entertainment Z4Distance from functional area Z41Distance from the dormitory area A40.25150.26540.2605 1
Distance from teaching area B40.06420.06560.0654 6
Distance from public activity space C40.01630.02560.0206 10
Distance from traffic flow line Z42Distance from main campus road D40.16920.13250.1510 3
Whether it is on the student’s main flow line E40.12870.07060.0961 4
Elements of the business itself Z43Distance from other companies of the same type F40.02930.03540.0325 8
Front square space G40.05720.05850.0583 7
Store space H40.0680.09650.0817 5
Environmental element Z44Surrounding environment and greenery I40.02580.03540.0305 9
Parking convenience J40.18980.21450.2034 2
Table 3. The spatial characteristics of the campus business district.
TypeWalking TimeType of BusinessFeature
Communities-level business circles10–15 minAll business typesHigh frequency of use, longer usage time, medium reachability requirements
Group-level business circles5–10 minCatering, retail, life serviceHigh frequency of use, shorter usage time, high reachability requirements
Neighborhood-level business circles<5 minMainly retailMedium frequency of use, shorter usage time, high reachability requirements
Disclaimer/Publisher’s Note: The statements, opinions and data contained in all publications are solely those of the individual author(s) and contributor(s) and not of MDPI and/or the editor(s). MDPI and/or the editor(s) disclaim responsibility for any injury to people or property resulting from any ideas, methods, instructions or products referred to in the content.

