Article

Mechanical Consequences of Suffusion on Gap-Graded Soils with Stress Anisotropy: A CFD–DEM Perspective

1
Haining Water Resources Construction Management Co., Ltd., Jiaxing 314499, China
2
College of Civil Engineering, Zhejiang University of Technology, Hangzhou 310023, China
3
Power China Huadong Engineering Co., Ltd., Hangzhou 310005, China
4
School of Civil Engineering, Sun Yat-sen University, Zhuhai 519082, China
5
State Key Laboratory for Tunnel Engineering, Guangzhou 510275, China
*
Author to whom correspondence should be addressed.
Buildings 2024, 14(1), 122; https://doi.org/10.3390/buildings14010122
Submission received: 15 November 2023 / Revised: 16 December 2023 / Accepted: 18 December 2023 / Published: 2 January 2024
(This article belongs to the Section Construction Management, and Computers & Digitization)

Abstract

:
Natural soil in geotechnical engineering is commonly in the anisotropic stress state, but the effect of stress anisotropy on soil suffusion remains unclear. In this study, the coupled computational fluid dynamics–discrete element method was utilised to simulate the complete suffusion process of gap-graded soils by introducing a vertical seepage flow through the soil assembly. The mechanical consequences of suffusion on gap-graded soils were evaluated by comparing the triaxial shear responses of soil specimens before and after suffusion. The results indicated that the specimens with greater stress anisotropy are more vulnerable to suffusion, particularly those with the principal stress that is coincident with the principal flow direction. Compared with the isotropically consolidated specimens, the specimens with greater stress anisotropy exhibited more pronounced reduction in shear strength and secant stiffness after suffusion. The effects of stress anisotropy on the suffusion and mechanical properties of gap-graded soils were also evaluated from a microcosmic perspective in terms of force chain, coordination number, and fabric tensor.

1. Introduction

Soft soils in urban coastal areas are rich in groundwater and render these areas susceptible to disasters under complex hydroclimatic and geologic conditions. During rainstorms, the sudden increase in the groundwater level induces rapid changes in the seepage field, causing suffusion and severe soil deterioration, which in turn results in the settlement of soil foundations [1] and destruction of infrastructure such as flood embankments [2,3,4]. Investigating the mechanism of suffusion and soil damage is crucial for preventing and mitigating seepage-induced disasters affecting coastal infrastructure.
The suffusion susceptibility of soils is primarily dependent on the particle geometry, stress history, and seepage conditions. Numerous studies have been conducted in this regard via laboratory tests [5,6,7,8]. For example, Sterpi [9] conducted conventional triaxial tests using specimens with various densities and initial fine-particle contents and investigated the effects of fine-particle loss on the elastic modulus, Poisson’s ratio, and internal friction angle of soil. Chen et al. [10] replaced soil particles with salt particles and investigated the effects of fine-particle loss on the shear properties of sand–soil mixtures by controlling the dissolution of salt particles and changing the soil gradation. With respect to seepage–stress coupling, Chang and Zhang [11,12] and Ke and Takahashi [13] improved the conventional triaxial apparatus, compared the mechanical responses of sand before and after seepage erosion under complex stress paths such as axial tension and compression, and explored the conditions of seepage-induced erosion and the damage process. The aforementioned studies revealed that suffusion is often accompanied by the loss of fine particles. The soil gradation changes owing to the seepage force, which loosens the soil structure, decreases the shear strength of soil, and ultimately induces infrastructure failures. Muir Wood et al. [14,15] investigated the effect of gradation change on soil strength using a discrete element method (DEM) and established a relationship between seepage-induced soil gradation changes and the critical state of soil. Similarly, Scholtès et al. [16] used the open-source DEM package YADE to study the stress–strain response of sand under varying gradation conditions; furthermore, they proposed a computational model capable of considering suffusion-induced soil deformation and changes in mechanical parameters. Hicher [17] further analysed the influence of particle loss on soil parameters and proposed a soil constitutive model considering the evolution of suffusion.
However, suffusion is usually accompanied by the local clogging of particles and changes in the soil skeleton. The flow of fluids through the pores in soil exhibits non-uniform characteristics. The conventional DEM artificially modifies the gradation, which differs considerably from the real suffusion and affects the accuracy of the calculation results. In recent years, with the advancement of fluid–solid coupling simulation techniques, the investigation of solid–fluid interactions through numerical simulations has progressively emerged as a focal point of research [18,19,20,21,22,23]. Coupled computational fluid dynamics–DEMs (CFD–DEMs) can reveal the macroscopic mechanical properties of soils during the suffusion and shear processes from a microscopic viewpoint in terms of force chains, coordination numbers, and force chain networks. EI Shamy and Aydin [24] used the fluid–solid coupling module in PFD-3D to achieve a fully coupled simulation of embankment–flood–foundation soil. Zhao et al. [25] and Shan et al. [26] investigated the formation process of underwater sand piles and the evolution mechanism of landslides in reservoir areas. Hu et al. [27] studied the effect of an anisotropic stress state on the seepage erosion of gap-graded sand under various average stresses. Liu et al. [28] investigated the macroscopic and microscopic evolutions of discontinuous graded sand under three-dimensional coupling in various flow directions under anisotropic conditions, considering that the mean effective stress p′ considerably influences the evolutionary pattern of suffusion and mechanical response in gap-graded soil. However, there have been few reports in the previous literature on the study of stress anisotropy on gap-graded soil under identical average effective stress p′. Consequently, further investigation is required into the results of suffusion on gap-graded soils under identical average effective stress p′.
In this study, the suffusion of anisotropically consolidated gap-graded soils was modelled under the same effective average stress p′ using a CFD–DEM to investigate the microscopic evolution of fine-particle loss and the structural characteristics of gap-graded soils during suffusion. Furthermore, the specimens before and after suffusion were subjected to drained shear tests, enabling a comparative examination of the macro- and micro-mechanical modifications influenced by suffusion throughout the drained shear tests.

2. CFD–DEM Coupling Simulation

In this study, an open-source CFD–DEM was utilised to simulate the suffusion process of gap-grade soil specimens under varying stress conditions. The open-source CFD package OpenFOAM and the DEM package LIGGGHTS were used. This method was first proposed by Goniva and Kloss et al. [29,30]. The governing equations, fluid–solid interaction model, and fluid–solid coupling process are described in the following sections.

2.1. Solid and Fluid Governing Equations

Consistent with traditional DEMs, the motion of particles follows Newton’s second law, and the translation and rotation control equations of particle i are as follows:
m i d U i p d t = c F i j c + F i g + F i f ,
I i d ω i d t = c M i j c ,
Here, U i p and ωi represent the translational and rotational velocities of particle i, respectively; F i j c and M i j c represent the contact force and torque moment of particle j acting on particle i, respectively; F i g represents the gravity of particle i; F i f represents the fluid–solid interaction force acting on particle I; and mi and Ii represent the mass and moment of inertia of particle i, respectively.
Considering the complex fluid–soil interaction forces during suffusion, the continuity equation of fluid motion and momentum equations can be calculated by introducing soil porosity correction as follows:
n t + ( n U f ) = 0 ,
( n ρ f U f ) t + ( n ρ f U f U f ) n ( μ f U f ) = p f f p + n ρ f g ,
Here, n represents the soil porosity within the fluid unit, Uf represents the average flow velocity within the fluid unit, ρf represents the density of seepage water, p represents the pressure of seepage water, μf represents the hydrodynamic viscosity coefficient, and f f p represents the force exerted by the particles in the fluid unit on the water supply, i.e., f f p = i = 1 m F p i f / Δ V , where ΔV represents the volume of the fluid unit, m represents the number of particles in the fluid unit, and g represents the gravitational acceleration, taken as 9.81 m/s2.

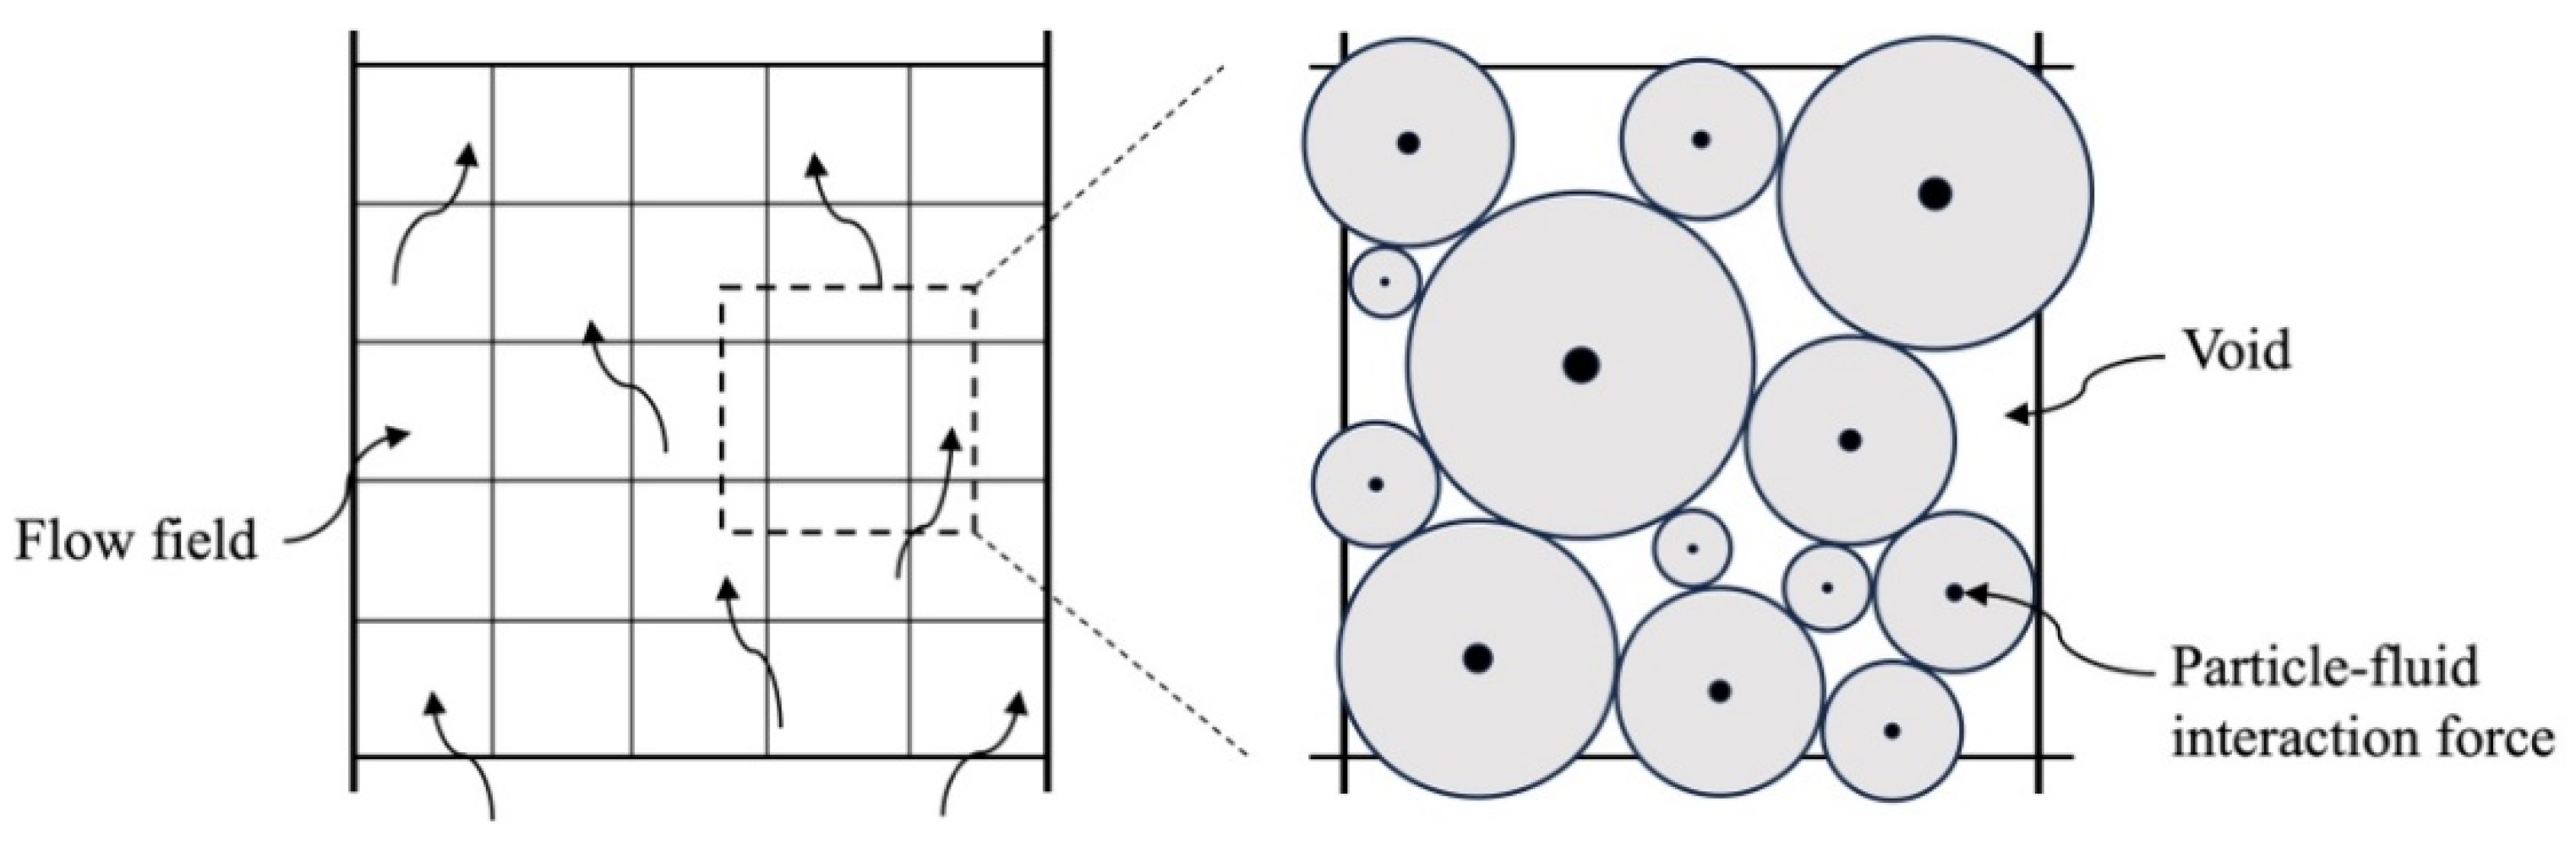
2.2. Fluid–Solid Interaction Model

The non-linear elastic Hertz–Mindlin contact relationship is used to simulate the interaction force Fc between particles, including the normal force Fn and the tangential force Ft:
F c = F n + F t = ( k n δ n i j γ n v n i j ) + ( k t δ t i j γ t v t i j ) ,
Here, kn and kt represent the particle’s normal and tangential stiffness, respectively; γn and γt represent the normal and tangential damping of the particle, respectively; δnij and δtij represent the normal and tangential contact distance between particles, respectively; and vnij and vtij represent the relative velocity of the normal and tangential contact between particles, respectively.
Real soil generally exhibits irregular shapes with evident ‘interparticle locking’. To incorporate such an effect on particle motion and strength characteristics, the rolling resistance Mr is introduced between particles [31,32]:
M r = ω rel | ω rel | μ r F n R r ,
Here, ωrel represents the relative angular velocity between particles, μr represents the rolling resistance coefficient, and Rr represents the average rolling radius, i.e., Rr = rirj/(ri + rj), where ri and rj represent the radii of particles i and j, respectively.
The interaction forces between particles and seepage water include hydrostatic and hydrodynamic pressures. The hydrostatic pressure includes gradient force while the hydrodynamic pressure includes drag, viscous, Basset and virtual mass forces. The suffusion is mainly affected by the gradient force Fg, drag force Fd, and viscous force Fv, namely F p f = F d + F v + F g . The gradient force is generated by the pressure difference at the inlet of the seepage flow, Fg = −Vsp, and the viscous force is caused by the shear action of the solid–liquid contact surface, Fv = −Vsτ, where Vs represents the particle volume and τ represents the shear force acting on particles. The drag force is caused by the velocity difference between the two consolidation terms and can be calculated based on the Di Felice model as follows [33]:
F d = 1 2 C d ρ f π r p 2 | U f U p | ( U f U p ) n 2 χ ,
Here, rp and Up represent the radius and velocity of the particles, respectively, and Cd represents the drag force coefficient, which is determined using the Reynolds number of the system:
C d = ( 0.63 + 4.8 Re p ) 2 .
The Reynolds number Rep is defined thus:
Re p = 2 n ρ f r p | U f U p | μ f .
In Equation (7), n2−χ represents the drag force correction coefficient of adjacent particles within the fluid unit, where χ can be calculated as follows:
χ = 3.7 0.65 exp [ ( 1.5 log 10 R e p ) 2 2 ] .
The DEM calculation step size must meet Rayleigh and Hertz maximum time step criteria (dtr and dth) to ensure the calculation stability, which can be calculated as follows [34]:
d t r = π r p 0.1631 ν + 0.8766 ρ p G ,
d t h = 2.87 ( m 2 r p E 2 v max ) 0.2 ,
Here, ρp, rp, G, m, and υ represent the density, shear modulus, radius, mass, and Poisson’s ratio of particles, respectively, and vmax represents the maximum relative velocity between particles. The maximum time step is usually assumed thus: dtmax < 0.2dtr and 0.2dth. Additionally, the introduction of the inertia coefficient during the shearing process is for the evaluation of the equilibrium state of the system, ensuring that the specimen remains in a quasi-static equilibrium condition. A general assumption is that the specimen is in a quasi-static state when the inertia force coefficient I < 0.001 [35], and the calculation is as follows:
I = 2 ε ˙ r p p / ρ p ,
Here, ε ˙ and p represent the shear rate and pressure condition of the specimen, respectively.

2.3. Fluid–Solid Coupling Simulation Process

First, the soil particles in the DEM domain are initialised and the contact between particles is identified. Next, the normal and tangential contact forces between particles are calculated and the particle position and velocity are outputted to the CFD programme. The porosity within each fluid unit is then calculated based on the current position of the particles and used to solve the locally averaged Navier–Stokes equation for obtaining the seepage velocity, seepage pressure field, and fluid–solid interaction forces. The updated fluid–solid force is transmitted back to the DEM programme to address the force and motion situation of the next cycle until the coupling calculation is completed. The DEM programme generally updates the CFD programme once every 50–100 steps to improve parallel computing efficiency. The fluid cell size is usually assumed as being 3–5 times the average particle diameter to accurately calculate the porosity within a fluid unit. The porosity of the fluid grids can be calculated using the centre point and volume-fraction methods [21]. A volume-fraction method with high accuracy and computationally efficient was used in this study to measure the fluid porosity by calculating the volume percentage of a single particle within the fluid unit (Figure 1). The coupled CFD–DEM has been validated for its accuracy and reliability in multiple cases. For example, Zhao and Shan [25,26] conducted experiments on the hydrodynamic characteristics of a rigid sphere falling and a Terzaghi one-dimensional consolidation simulation; the results of both experiments were in good agreement with their respective analytical solutions. Tao et al. [36] simulated liquefaction bed tests and verified the reliability of their results by comparing them with experimental results. Li and Zhao [37] used the coupled CFD–DEM to study the surface transport trend for debris flow in Newtonian and non-Newtonian fluids, which was in agreement with the results simulated using commercial software.

3. Simulation Procedures

3.1. Establishment of the Model and the Selection of Parameters

A 25 mm × 25 mm × 25 mm cube element was used in this study for modelling, and servo walls were set on each of the six faces of the cube. Further, 40,000 particles were used in the calculation domain to accurately demonstrate the suffusion and triaxial stress responses of the specimens. The coarse- and fine-particle sizes ranged from 2.08 to 2.40 mm and 0.42 to 0.5 mm, respectively. According to Gong et al. [38], when the ratio of the sample size to the maximum particle size is greater than 5, the effect of the specimen size can be eliminated. Therefore, the ratio of the specimen size to the maximum particle size selected for this study took this into account. Figure 2 shows the grain size distributions of gap-graded soil. The Kézdi criterion for determining the stability of sand specimens [39] reveals that the particle size ratio of the specimen d 15 c   /   d 85 f > 4 ( d 15 c and d 85 f represent the coarse- and fine-particle portions with a mass passing of 15% and 85%, respectively) used for the calculation indicates that the specimen is prone to fine-particle migration loss under seepage. In the CFD calculation domain, the flow field is ensured to cover the DEM domain completely, and the fluid flows from the bottom to the top, forming a unidirectional flow. The surrounding surfaces are all free-slip boundaries. The parameters used in the CFD–DEM simulation are listed in Table 1.

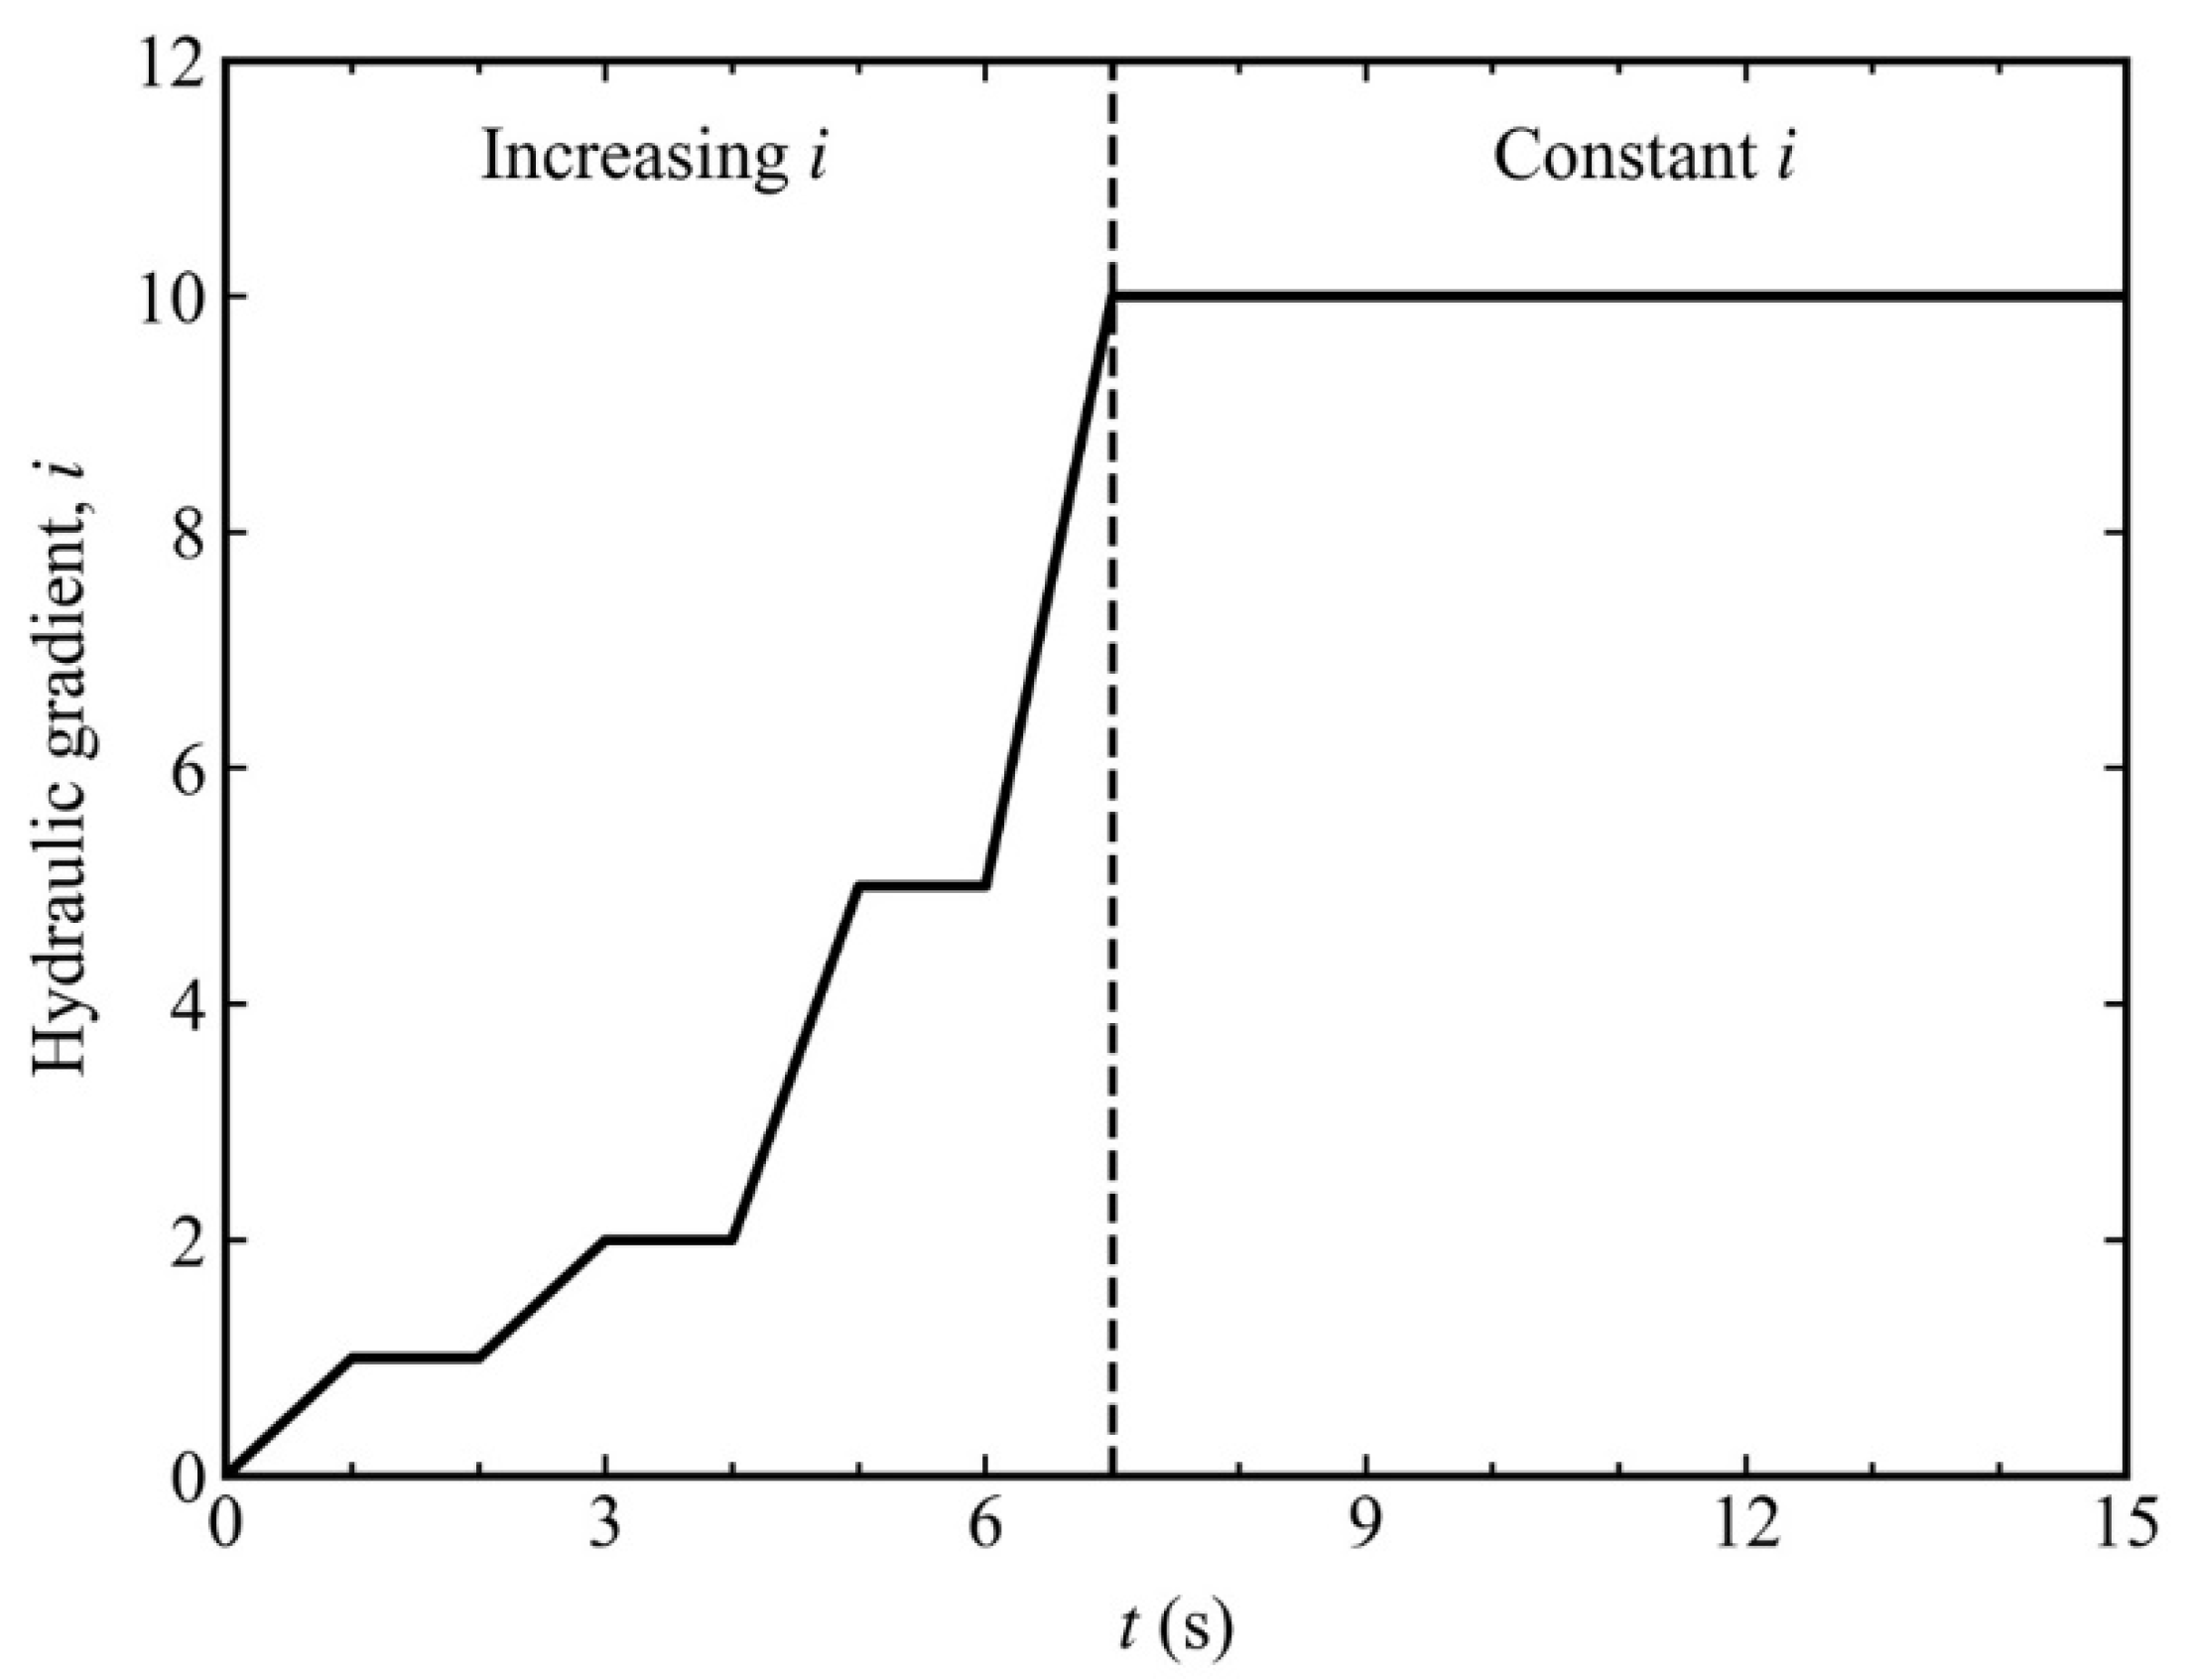
3.2. Simulation of Anisotropic Consolidation and Suffusion

In the consolidation stage, all specimens were first isotropically consolidated to achieve the target confining pressure. Subsequently, the average stress p′ = 100 kPa was controlled to remain constant, while the vertical pressure acting on the top of the servo wall was changed to achieve anisotropic consolidation. It is worth noting that particle gravity was not activated at this stage to prevent the accumulation of fine particles at the bottom of the sample. Figure 3 shows the initial stress state of all specimens after the consolidation stage. Furthermore, after the consolidation stage, the top-boundary conditions were modified to allow the fine particles to freely flow through the top boundary, while the coarse particles were confined within the specimen for reconsolidation. During the reconsolidation stage, a small quantity of fine particles may have been lost from the top boundary. This stage aimed to prevent a substantial loss of fine particles in a short period of time due to a sudden change in the condition of the top boundary during the subsequent suffusion. Furthermore, the void ratios of specimens T1, T2, and T3 after reconsolidation, which were 0.398, 0.399, and 0.398, respectively, were consistent as a result of an adjustment in the coefficient of the friction between particles during consolidation. Table 2 shows the initial parameters for all specimens. Gravity was activated before the onset of suffusion, and its activation over the entire process of suffusion was ensured. Throughout the suffusion process, the stress state of the specimen was kept constant. Introducing bottom–up seepage and gradually increasing the hydraulic gradient from zero helped avoid a sudden change in the hydraulic gradient that would disturb the soil skeleton. After t = 7 s, the hydraulic gradient i = 10 was kept constant until the end of seepage erosion; the change in the applied hydraulic gradient with elapsed time is shown in Figure 4. The substantial hydraulic gradient provides the simulation conditions for 15 s suffusion. The simulation of a 15 s erosion process for a specimen took 100 h on a workstation with 16 GB DDR4 RAM and a 16-core 3.60 GHz Intel CPU. Notably, in practical engineering applications, suffusion development is an extended process, and the extent of soil susceptibility to suffusion varies considerably under different stress histories and seepage conditions.

3.3. Simulation of Drained Shear

After suffusion, the upper boundary wall was changed to an impermeable servo stress wall. Drained shear tests were conducted on all specimens, and the non-eroded specimens were also subjected to drained shears for comparison. Gravity was not imposed in this simulation stage to ensure consistency with the conventional DEM simulation. The drained shear simulation maintained a constant shear rate of 2.5%/s. The calculation results obtained using Formula (13) conformed to the quasi-static loading condition, i.e., the inertial force coefficient I < 0.001. Shearing was stopped when the axial strain reached 30% to ensure that the shearing of the specimens reached the critical state.

4. Results and Discussion

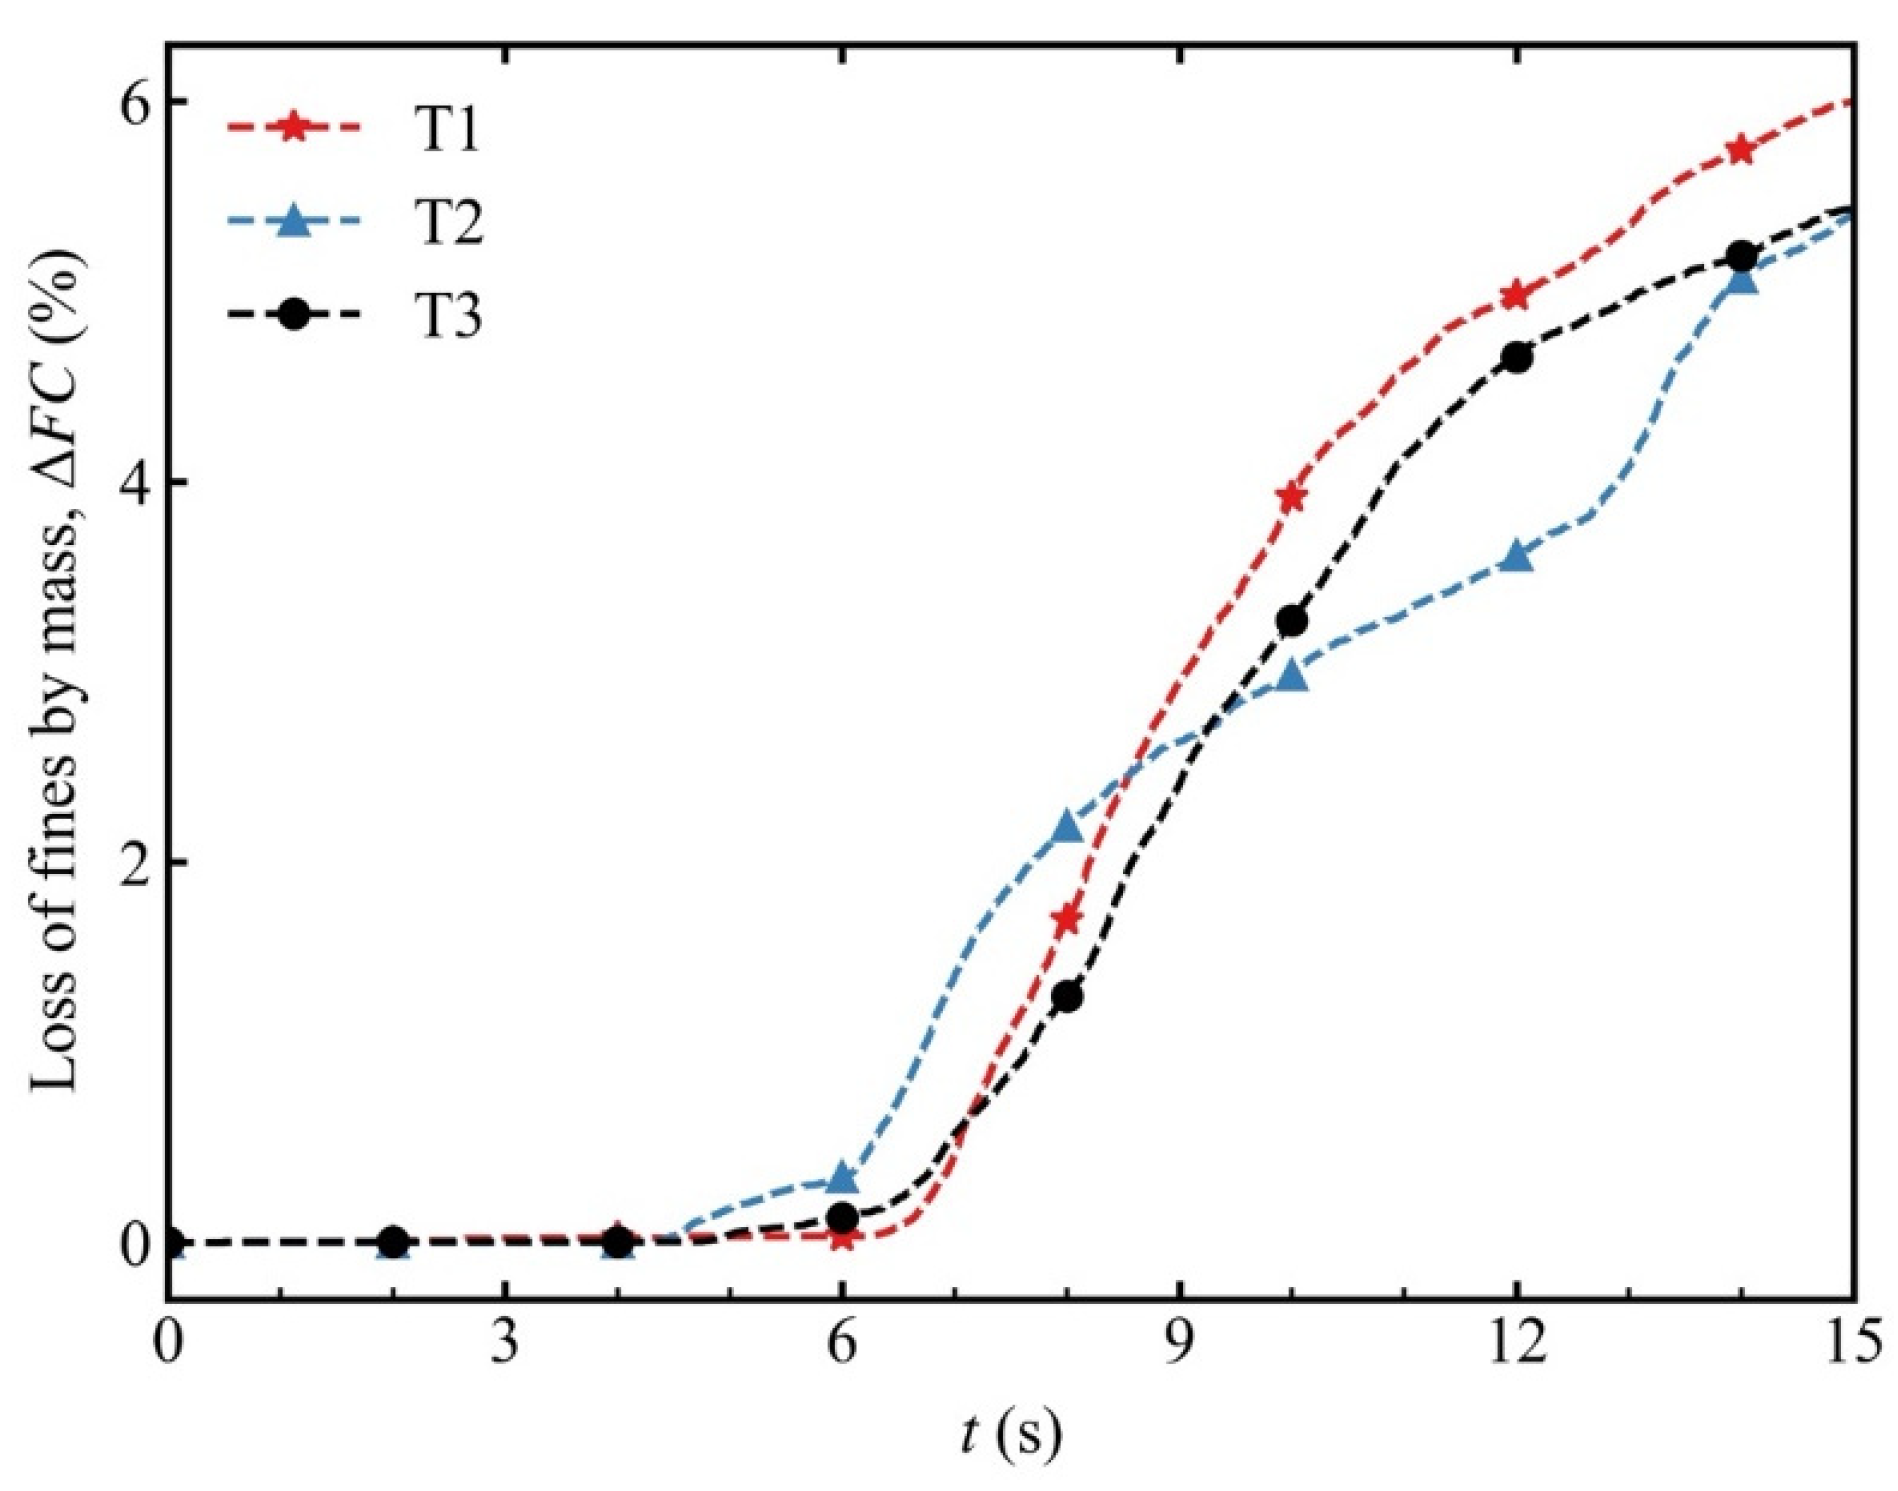
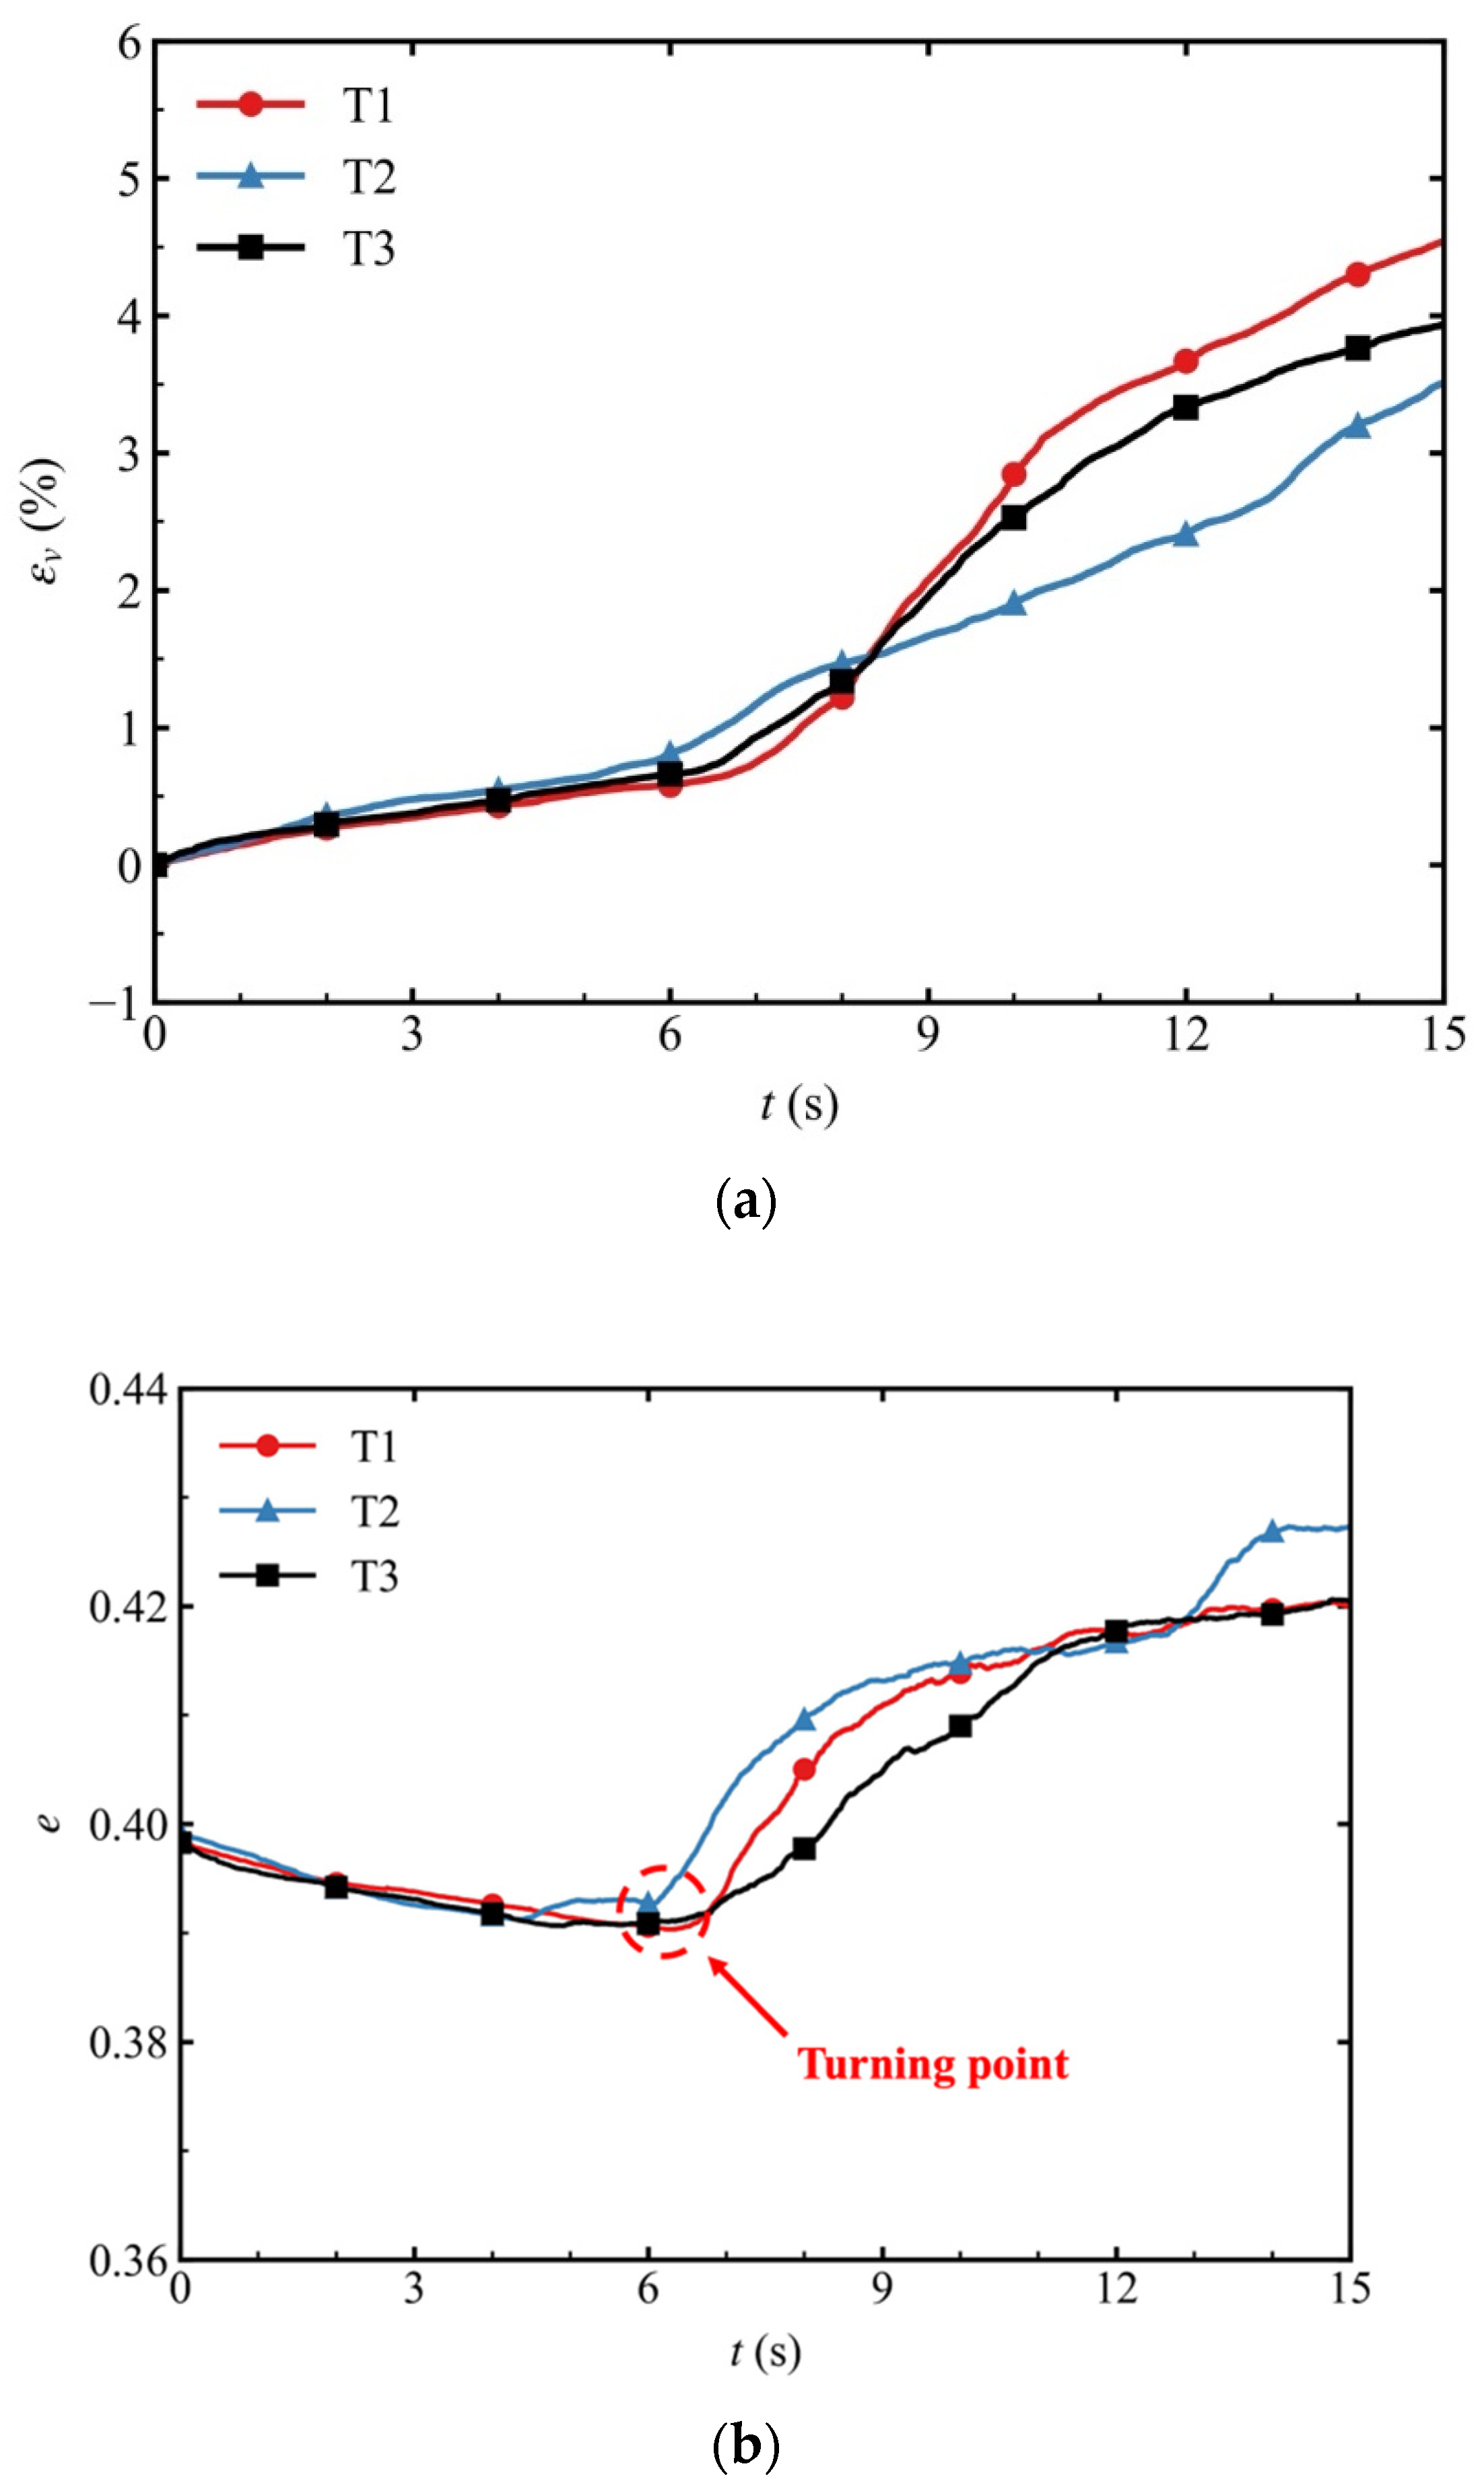
4.1. Macroscopic Response and Microscopic Analysis in the Suffusion Stage

The force chain networks of all specimens were visualised after consolidation, and the normal distributions of their contact were plotted as rose diagrams (Figure 5). A clear distribution of strong force chains in the vertical direction was observed for specimen T1, as indicated by a red dashed line in Figure 5a, and the direction of these strong force chains was consistent with the direction of the principal stress. The rose diagrams for the probability density distribution of normal contact forces are presented in Figure 5b, which shows that the distribution in the vertical direction was dominant compared with that in the horizontal direction, displaying an approximately elliptical shape. In addition, the force chain distribution of specimen T2 was consistent with the stress state imposed on it. The force chain distribution exhibited a relatively uniform characteristic of the isotropically consolidated specimen T3 without revealing a clear dominant trend in a specific direction; further, the rose diagrams of the probability density distribution of normal contact for this specimen exhibited an approximately circular shape. The difference in force chain distribution caused by initial anisotropic consolidation considerably affected the evolution of the macroscopic and microscopic mechanical properties of soil during the subsequent suffusion process.
Figure 6 shows the evolution of fine-particle mass loss as a function of time during the suffusion of all specimens. The fine-particle mass loss ΔFC represents the ratio of the cumulative loss of fine-particle mass mc to the total mass m0 of each specimen before suffusion. Under the conditions of small hydraulic gradients, almost no fine particles are lost owing to the insufficient upwards seepage force to drive fine particles to overcome gravity and frictional force generated via contact between particles. However, with the gradual increase in the hydraulic gradient, the mass loss of fine particles begins to increase when a specific hydraulic gradient is applied, indicating a critical hydraulic gradient corresponding to the initiation of suffusion. A comparison of the initiation moments of suffusion for all specimens revealed that specimen T2 was eroded at t = 4.5 s, earlier than the T1 and T3 specimens. This difference can be attributed to the main contact force chain in specimen T2 that was mainly distributed along the horizontal direction (Figure 5). This conclusion is consistent with the following observation reported by Chang [11]: the specimens under triaxial tensile stress have a higher critical hydraulic gradient than those under triaxial compressive stress. Furthermore, the vertical force chain was considerably weak and encountered difficulties in resisting the upwards seepage force. Therefore, the fine particles could easily migrate in the vertical direction. However, in the case of specimen T1, the loss of fine particles along the suffusion direction needed to overcome the large force in the vertical direction owing to the principal stress in the vertical direction, resulting in an extension of the suffusion initiation time. With the development of suffusion, numerous fine particles in the soil skeleton were washed away, resulting in considerable changes in the structure of the direct contact between the particles inside the specimen, which substantially affected the macroscopic mechanical response of soil.
Figure 7 presents a comparative analysis of force chain networks before and after suffusion for all specimens. The orientation of cylinders in these force chain networks indicates the direction along which forces are acting upon the particles; additionally, the dimensions and colours of these cylinders imply the magnitudes of these force chains. After suffusion, a considerable reduction is observed in the number of fine force chains in all specimens, accompanied by a notable increase in the number of coarse force chains. This can be attributed to the fact that suffusion causes a considerable reduction in fine particles, while the rigid top wall obstructs the flow of coarse particles, thereby converting fine-particle contact into coarse-particle contact. All specimens show a tendency towards a more homogeneous distribution of the force chain distribution in the vertical and horizontal directions after suffusion. This suggests that suffusion changes the arrangement of particles, moving the specimen towards an isotropic stress state.
Figure 8 shows the evolution of volume strain and void ratio over time during the suffusion stage. During the initial seepage disturbance, a small number of fine particles were lost, and the specimen underwent a slight volume shrinkage and void ratio reduction. The change in the void ratio exhibited a turning point and began to increase with an increasing hydraulic gradient relative to the critical hydraulic gradient, at which point a considerable reduction in specimen volume was observed. This phenomenon can be attributed to the substantial loss of the fine particles originally filled in the soil skeleton, resulting in a decrease in the proportion of solid phases. Overall, all specimens showed an overall increasing trend in terms of void ratio, demonstrating increasing volume shrinkage over time. In particular, the degree of volume change was the highest for specimen T1, for which the direction of the principal stress coincided with the direction of suffusion.
Figure 9 shows the evolutions of the coordination number Z and mechanical coordination number Zm with the elapsed time for all specimens during suffusion. The coordination number Z represents the average contact number of each particle, while the mechanical coordination number Zm represents the average contact number of active particles with two or more contact points [40]. The fine particles in the specimen are categorised into active and inactive particles. Active particles usually refer to particles with contact numbers that are ≥2. These particles play an important and active role in the simulation as they directly participate in the processes of interaction, force transfer, and collision between particles. The calculation formulas for the coordination number Z and mechanical coordination number Zm are as follows:
Z = 2 C N ,
Z m = 2 C N 0 N N 0 N 1 ,
Here, C is the total contact number, N is the number of particles in the soil matrix, N0 and N1 denote the numbers of particles having no or only one contact number with other particles, and the difference between Z and Zm indirectly reflects the number of inactive fine particles in the specimen. The results indicate that the coordination number Z, for all specimens, slowly increased in the initial stage of suffusion owing to an increase in the seepage force. Subsequently, this phenomenon exhibited a decreasing trend owing to the loss of fine particles. Notably, no considerable changes were observed in the coordination number Z, for all specimens, at the onset and end of suffusion. Severe fluctuations in the Z values were observed during suffusion in all specimens, which had resulted from the repeated blockage, detachment, migration, and collision of soil particles within the specimens. An overall decline was observed in the mechanical coordination number Zm, suggesting that certain active fine particles that were formerly in contact migrated and were lost owing to suffusion. Furthermore, the variation in the coordination number Z and mechanical coordination number Zm was substantially greater for specimen T1 than for specimens T2 and T3. This is attributed to the fact that the soil particles in specimen T1 were highly vulnerable to the disruptive effects of seepage water, leading to pronounced erosion and detachment. This inference can be used to explain why specimen T1 lost the most fine-particle mass at the end of suffusion. In addition, from the beginning to the end of suffusion, the coordination number Z and mechanical coordination number Zm of the isotropically consolidated specimen T3 were considerably higher than those of specimens T1 and T2. This finding indicates that the anisotropic stress weakened the connectivity within specimens, leading to a decrease in the coordination number of the anisotropically consolidated specimen.
The coordination numbers of various contact types, including C-C contact between two coarse particles, C-F contact between the coarse and fine particles, and F-F contact between two fine particles, were studied to comprehensively investigate the force transfer mode and evolution involving various particle types. The coordination numbers of the three types of contacts are represented as ZC-C, ZC-F, and ZF-F, and their evolution with the elapsed time is shown in Figure 10. The isotropically consolidated specimen T3 exhibited the maximum value for ZC-C, ZC-F, and ZF-F before the onset of suffusion. With increasing suffusion, the ZC-C values of all specimens continued to increase, while the ZC-F values gradually decreased. This finding reflects the loss of fine particles caused by seepage erosion, resulting in reduced contact between coarse and fine particles. Correspondingly, the force originally borne via the contact between coarse and fine particles was transferred to the contact between coarse particles, resulting in an increase in the ZC-C value. The ZF-F value remained generally stable throughout the entire suffusion stage. Under different initial stress-state conditions, specimen T3, which was isotropically consolidated, exhibited the fewest changes in ZC-C and ZC-F during suffusion. This suggests that the isotropically consolidated specimen was less affected by suffusion and exhibited better resistance to the changes in soil microstructure due to suffusion. Furthermore, the values of ZC-C and ZC-F fluctuated most drastically for the initially compressed anisotropically consolidated specimen T1, consistent with the trend of changes in the coordination number Z and mechanical coordination number Zm.

4.2. Macroscopic Response and Microscopic Analysis in the Drained Shear Stage

Drained shear tests were performed on all specimens after suffusion. To comparatively investigate the effect of suffusion on gap-graded soils, identical drained shear tests were performed on the non-eroded specimens in the same stress state. The names and seepage conditions of each group of specimens are indicated by the legends shown in Figure 11, wherein Y and N represent the eroded and non-eroded specimens, respectively. Figure 11a shows the stress–strain relationship curves of all specimens obtained during drained shear tests. These curves show that the initial anisotropic stress of the specimen changes the peak shear strength of soil. Among the non-eroded specimens, specimen T2-N, with initial tensile static deviator stress, exhibited the maximum shear strength. This may be attributed to the largest confining pressure σ′r of specimen T2-N under the same average stress p′, which improved its peak shear strength. A comparison of the eroded and non-eroded specimens reveals that the peak shear strength of the eroded specimen was considerably lower than that of the non-eroded specimen, regardless of its initial stress state. In addition, the axial strain εa, corresponding to the maximum deviatoric stress q reached during shearing, increased for all the eroded specimens. Considering specimen T2 as an example, the peak strength corresponding to the axial strain without suffusion was approximately εa = 5% but increased to εa = 8% after suffusion. Figure 11b shows the evolution of the volume strains of all specimens as a function of axial strain during the drained shear tests. The curves shown in Figure 11b reveal that the shear expansion of the eroded specimen decreased compared with that of the non-eroded specimen.
The secant stiffness, corresponding to half of the peak shear stress E50, was introduced to evaluate the stiffness characteristics of soil under small shear strain because of the non-linear relationship between stress and the strain of soil during loading (Figure 12a). Figure 12b presents the changes in the secant stiffness for all specimens under different initial stresses before and after suffusion during the drained shear tests. The data presented in Figure 12b show that the secant stiffness E50 decreased significantly after suffusion regardless of the initial stress. The secant stiffness E50 after suffusion was reduced by approximately 27%, 23%, and 13% for specimens T1, T2, and T3, respectively compared with the non-eroded specimens. The secant stiffness E50 of the anisotropically consolidated specimens (specimens T1 and T2) significantly decreased compared with the isotropically consolidated specimen T3. This finding confirms that soil strength is highly susceptible to the suffusion on gap-graded soils under anisotropic stress. Therefore, in practical engineering applications, such as the hydraulic engineering of dams and other structures, attention should be focused on the stress states of slope foundations and the influence of the coupling effect of suffusion.
Hu et al. [21] normalised the normal contact force using the average value of the normal contact force F n / F n ¯ (where F n and F n ¯ represent the normal contact force and the average value of the normal contact force, respectively) and found that this normalised normal contact force is distributed in the range of 0–0.1. This study classified normal contact forces into two categories based on the normalised magnitude of the normal contact force: the strong force chain ( F n / F n ¯   0.1 ) represented by F n s and the weak force chain ( F n / F n ¯ < 0.1 ) represented by F n w . The distribution of the strong and weak force chains before (εa = 0%) and after shearing (εa = 30%) for the eroded and non-eroded specimens T1, T2, and T3 are listed in Table 3. The data presented in this table show that the proportion of weak force chains exceeded the proportion of strong force chains in all specimens prior to shearing. The proportion of weak chain forces was approximately 96%. During the shearing process, the proportions of weak and strong force chains decreased and increased, respectively. The percentage of strong force chains was higher in the eroded specimens than in the non-eroded specimens when sheared to the critical state. For example, at the end of shear, the F n s proportion in specimen T1-Y was 28.5% while that in specimen T1-N was 17.3%. The difference in the F n s proportion was more pronounced in the case of specimen T1 than in specimens T2 and T3 because specimen T1 lost more fine particles during suffusion than the other specimens, leaving fewer particles to absorb the external force. In the case of specimens T3-N and T3-Y, the percentages of strong and weak force chains at the end of shearing were considerably similar, suggesting that the specimens were less susceptible to the effects of suffusion under isotropic stress conditions than under the anisotropic condition. This difference further explains the macroscopic phenomenon of a significant reduction in the secant stiffness E50 of anisotropically consolidated specimens after suffusion.
Figure 13 shows the evolutions of the coordination number Z and mechanical coordination number Zm as a function of axial strain during drained shear tests. In the initial state (εa = 0%), to some extent, the coordination number Z of all specimens is smaller than the mechanical coordination number Zm, indicating that some fine particles did not participate in the transmission of contact force at the initial moment. With increasing shearing, the coordination number Z and the mechanical coordination number Zm show a gradually decreasing trend. This phenomenon indicates that the coarse and fine particles that were originally involved in force transfer transitioned to a state where they no longer participated in force transfer after shearing. Under a small strain state (εa < 5%), compared with the non-eroded specimen, the eroded specimen demonstrated a considerable decrease in the coordination number Z while the change in the mechanical coordination number Zm was marginal. The coordination number Z decreased and eventually stabilised with increasing strain. This phenomenon explains why the shear strengths of all specimens no longer changed significantly when sheared to the critical state (Figure 11a). Although all specimens exhibited different values of the coordination number Z before shearing, the coordination number Z tended to be the same when they were sheared to the critical state. This suggests that although the initial particle arrangements differ in the specimens in different stress states, the particles in the specimens ‘pursue’ a state of mechanical equilibrium with increasing shearing.
The degree of mechanical anisotropy is used to evaluate the fabric evolution of the specimen [41], as shown below:
χ i j n = 1 N c N f n n i n j 1 + a k l c n k n l ,
Here, f n represents the absolute value of the normal contact force and n i represents the unit vector in the direction of normal contact force. The second-order anisotropy tensor a i j c is the deviatoric and symmetric and characterises the fabric anisotropy in terms of normal contact, and is calculated as follows:
ϕ i j = 1 N c N n i n j ,
a i j c = 15 2 ϕ i j ,
Here, ϕ i j represents the normal contact stress tensor and ϕ i j represents the deviatoric stress tensor of the normal contact stress tensor ϕ i j . The definition of the normal contact forces’ anisotropic tensor is as follows:
a i j n = 15 2 χ i j n f 0 ¯ ,
f 0 ¯ = χ i j n ,
Here, χ i j n represents the partial tensor of χ i j n and f 0 ¯ represents the average normal contact force.
Using scalars a n to evaluate the mechanical anisotropy of all specimens, the calculation formula can be expressed as follows:
a n = 3 2 a i j n a i j n .
The evolution of normal contact force anisotropy during the drained shear test of the specimens is shown in Figure 14. The results presented in this figure indicate that the normal contact force anisotropy of the eroded specimen was slightly higher than that of the non-eroded specimen before shearing, possibly because the space between the coarse particles was not filled by the fine particles in the specimen after suffusion; therefore, the eroded specimen was more susceptible to anisotropic external forces. With increasing shearing, the an value increased for all specimens. When the strain in all specimens reached approximately 15%, an began fluctuating violently. Notably, the fluctuations in the an value were more drastic for the eroded specimens than for the non-eroded specimens. In addition, regardless of whether the specimen was eroded or not, the anisotropy of specimen T2 under the initial tensile-stress condition was the largest whereas the anisotropy of specimen T1 under the initial compressive-stress-state condition was the smallest when sheared to the critical state. This result suggests that the initial anisotropic stress state changes the arrangement of particles, resulting in a different evolution of normal contact force anisotropy in the specimen during the drained shear test.

5. Conclusions

This study investigated the effect of stress anisotropy on suffusion and drained shear behaviours after suffusion in gap-graded soil using the coupled CFD–DEM method. A series of specimens with different stress ratios were prepared under the same effective average stress p′. The suffusion and shear behaviours of the specimens were simulated and the underlying micromechanics were investigated. The main conclusions are as follows:
(1)
The specimen in which the principal stress aligned with the seepage-flow direction exhibited the highest critical hydraulic gradient because this specimen was resisted by the highest external force along the suffusion direction, which inhibited the migration of the fine particles.
(2)
For all specimens, the volume decreased while the void ratio increased owing to the loss of fine particles during suffusion. The specimen in which the principal stress aligned with the seepage-flow direction demonstrated the highest fine-particle mass loss and the most prominent reduction in volume, indicating its high vulnerability to erosion.
(3)
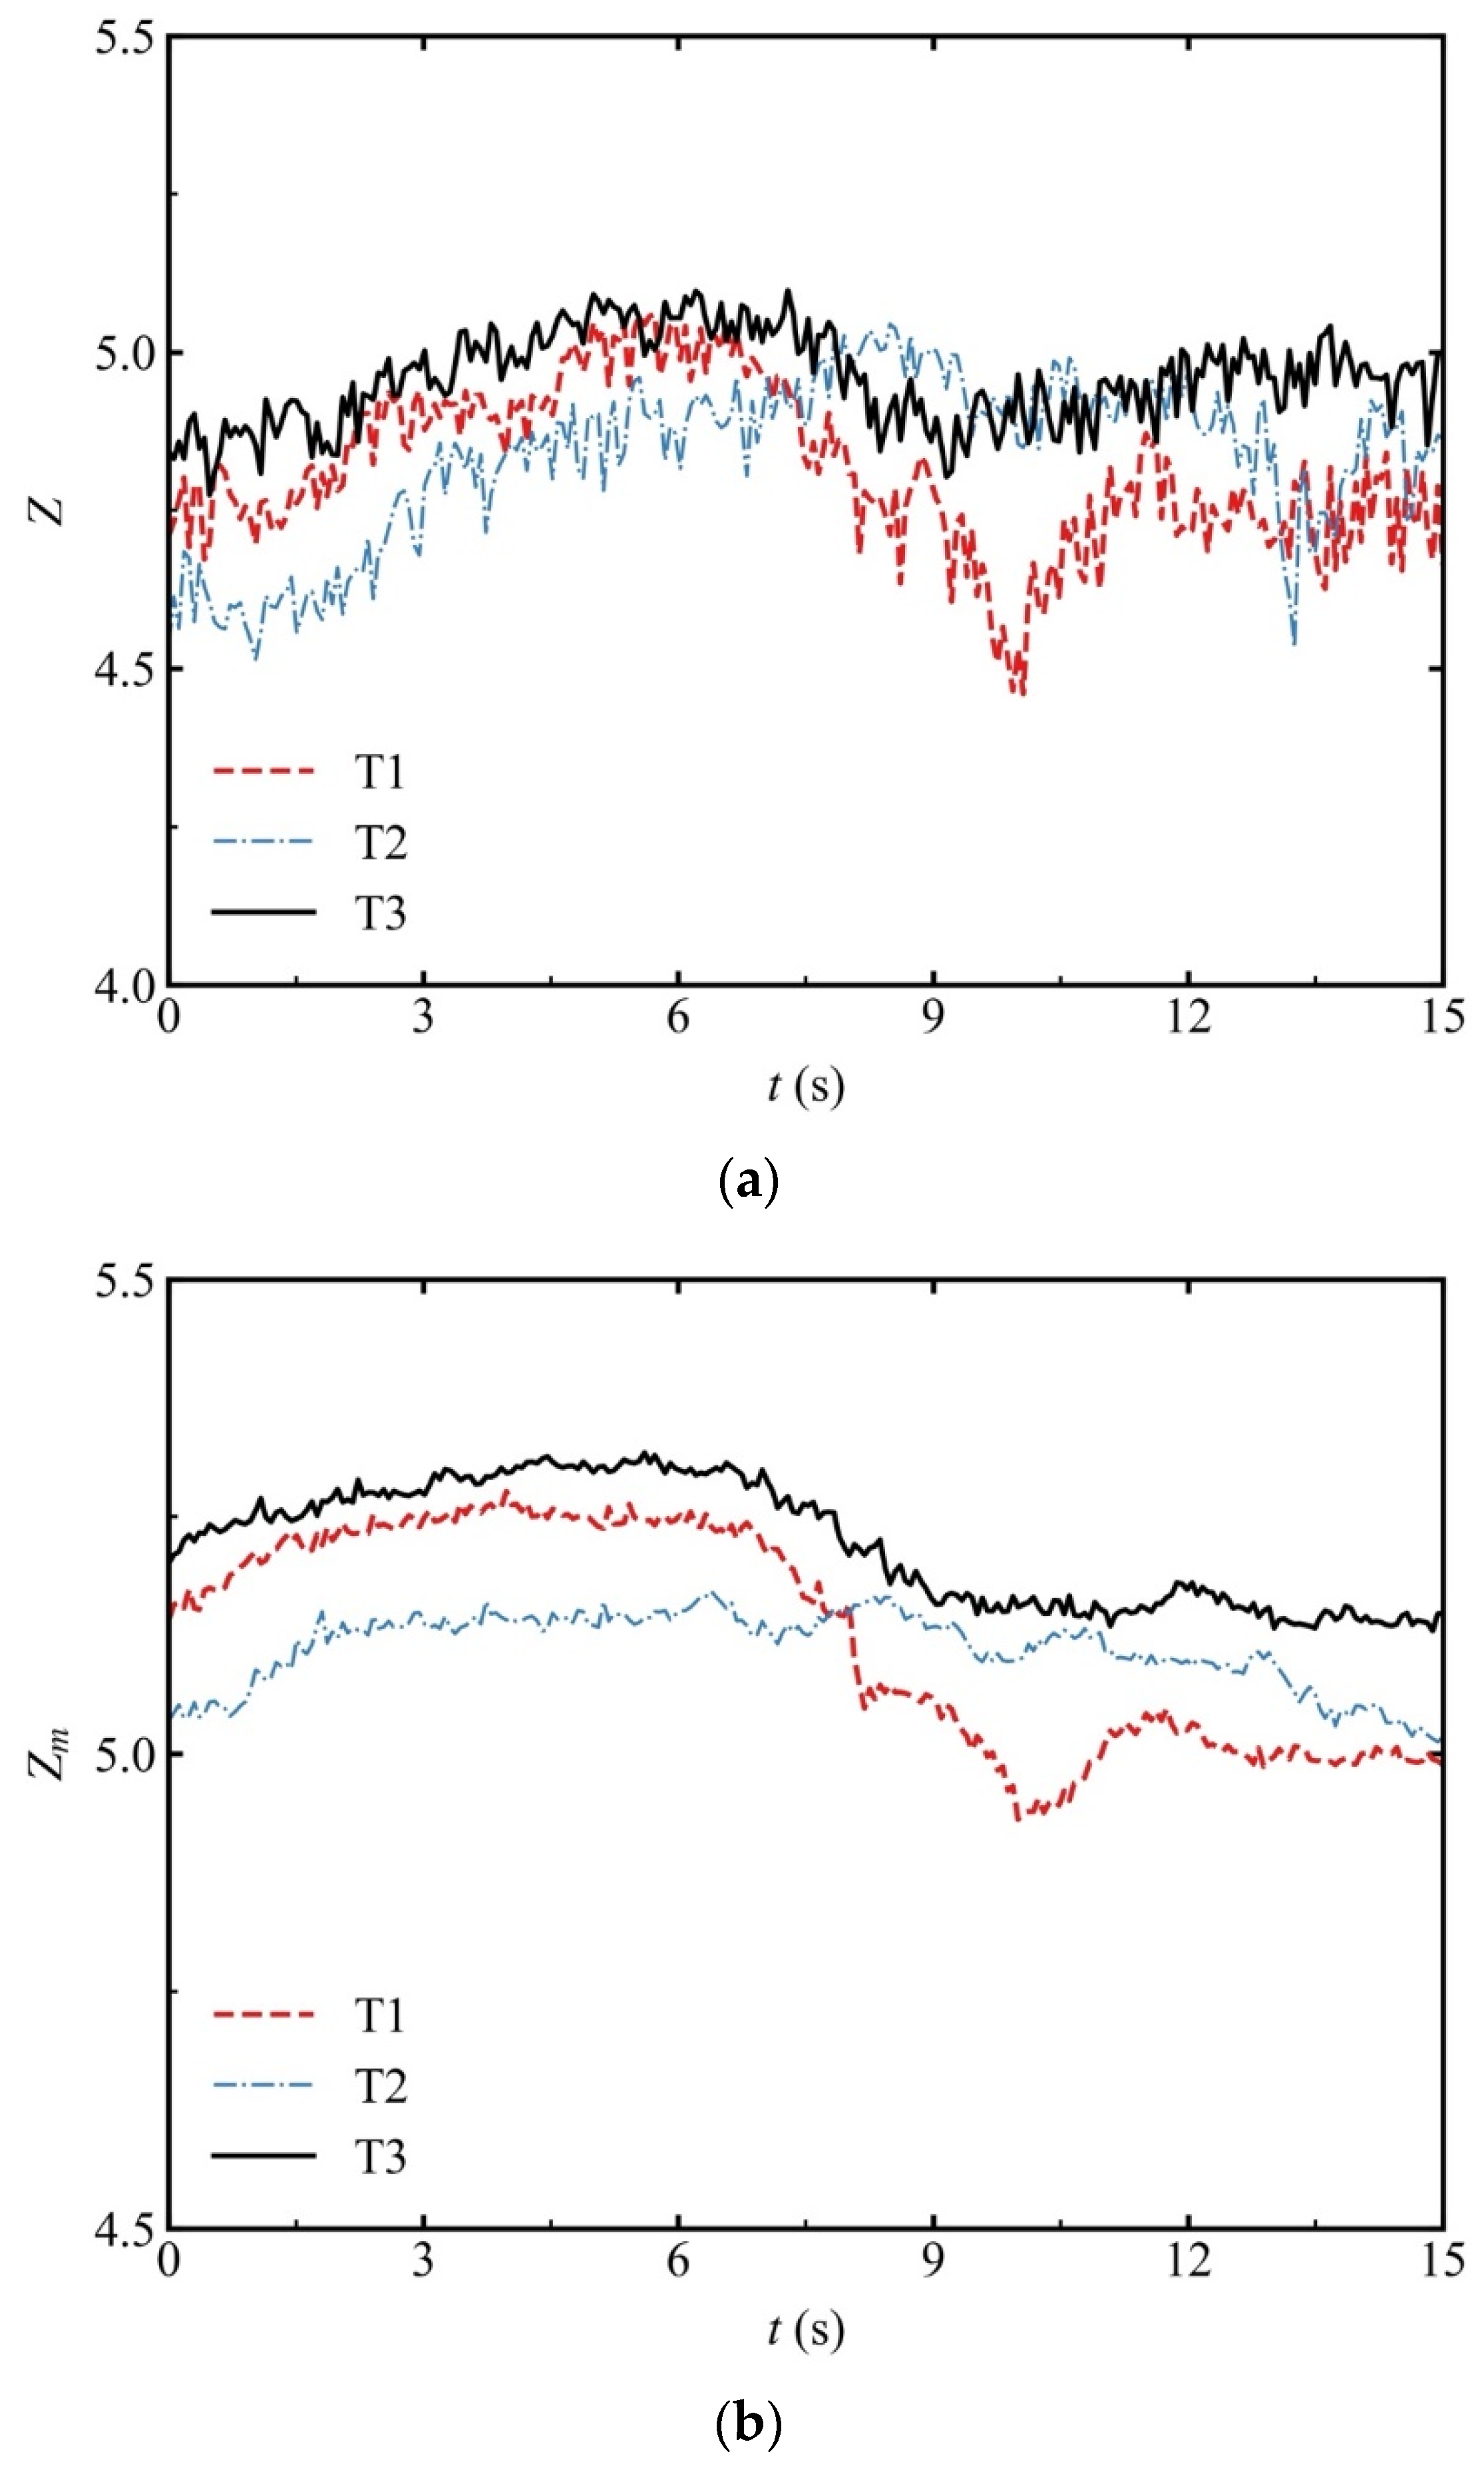
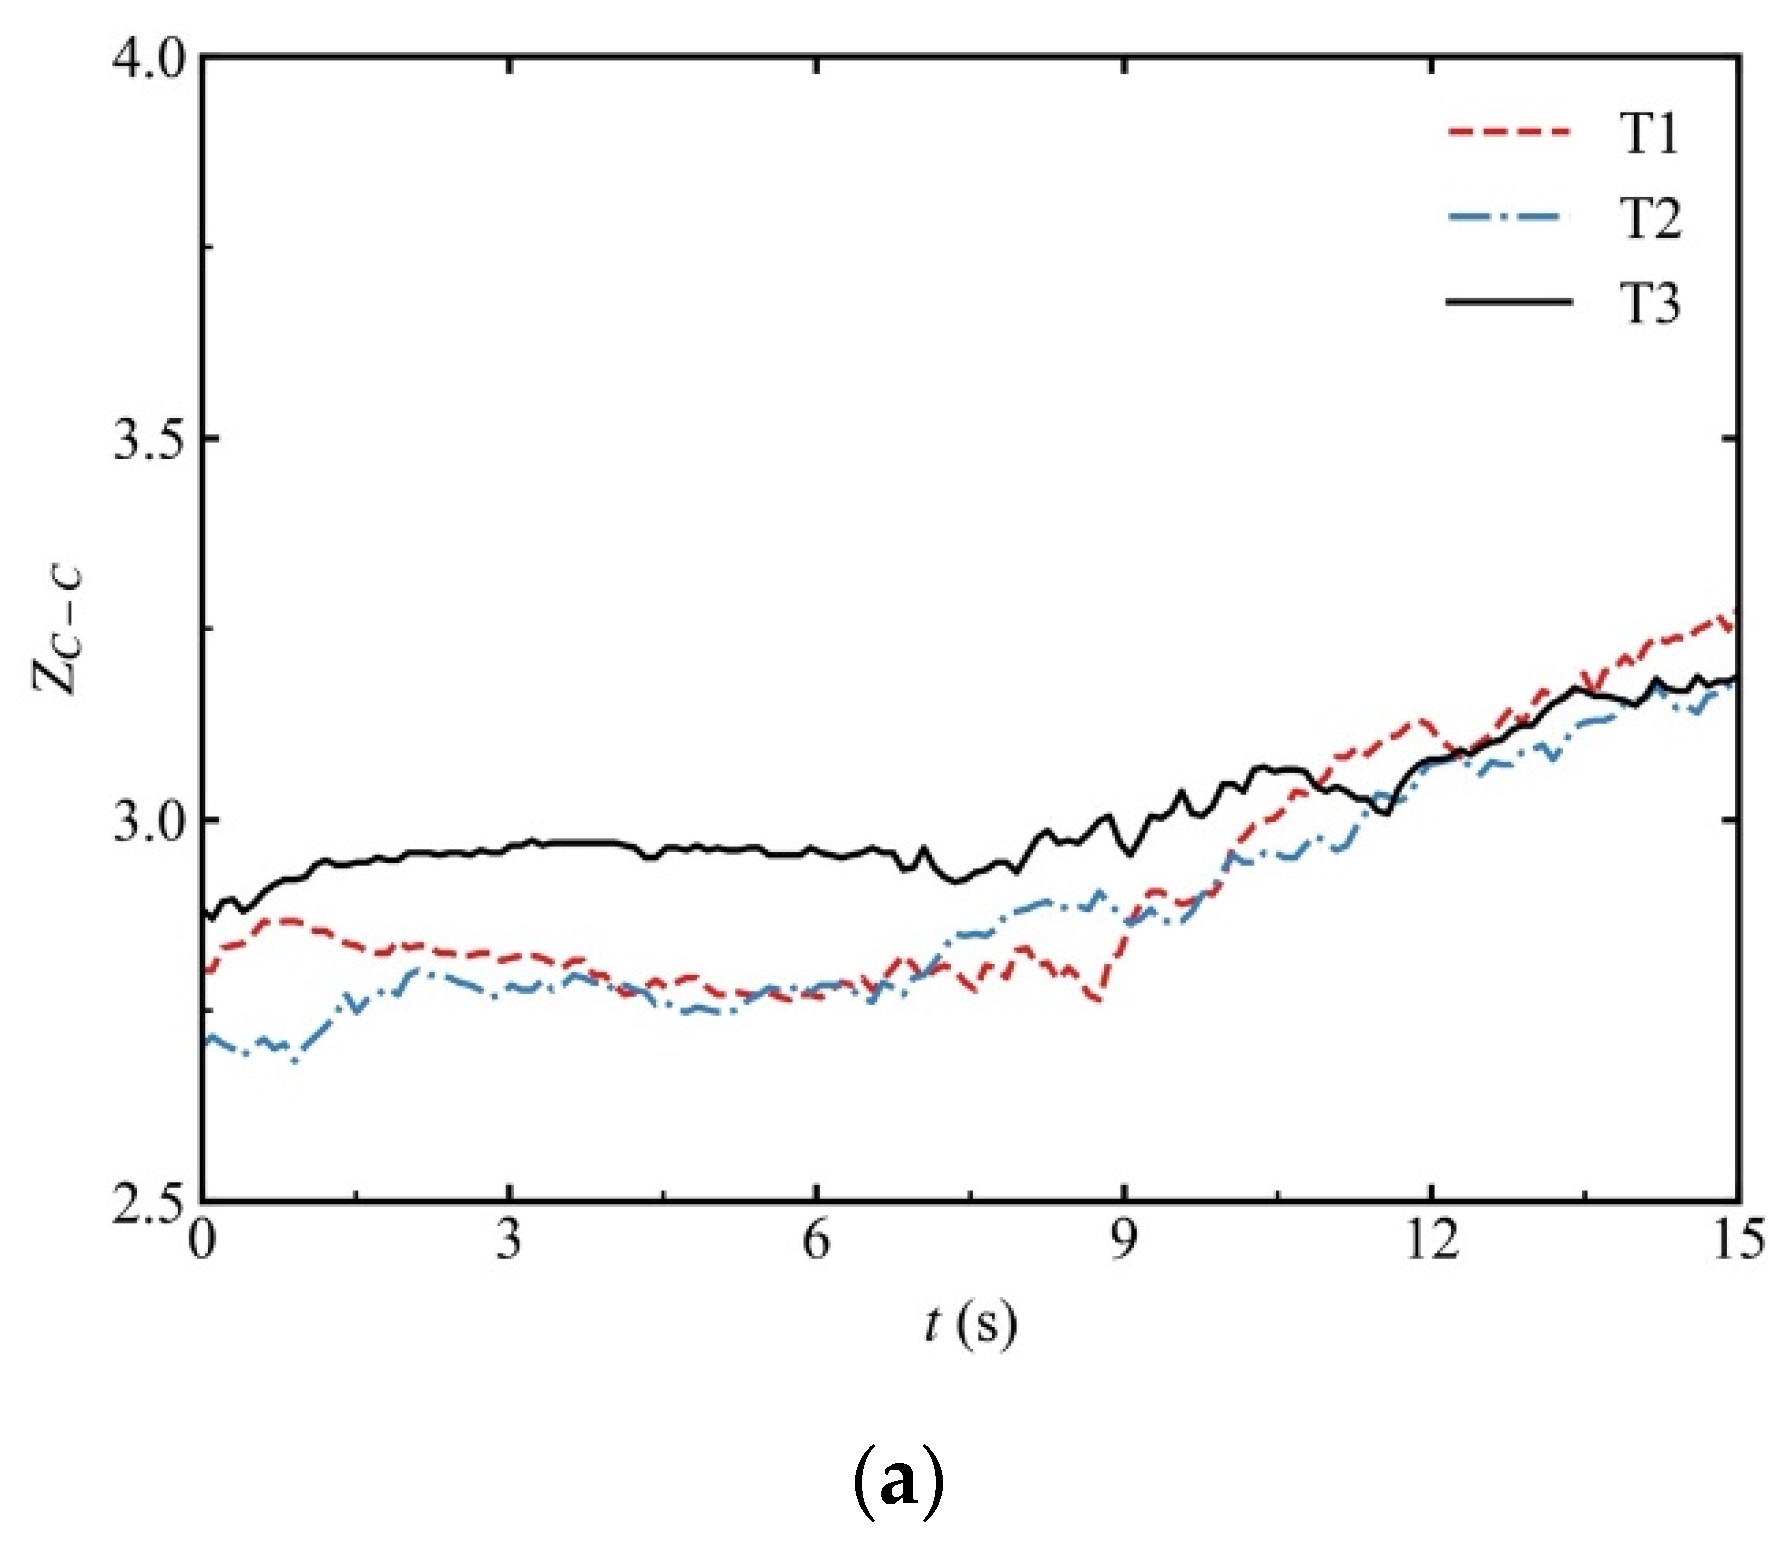
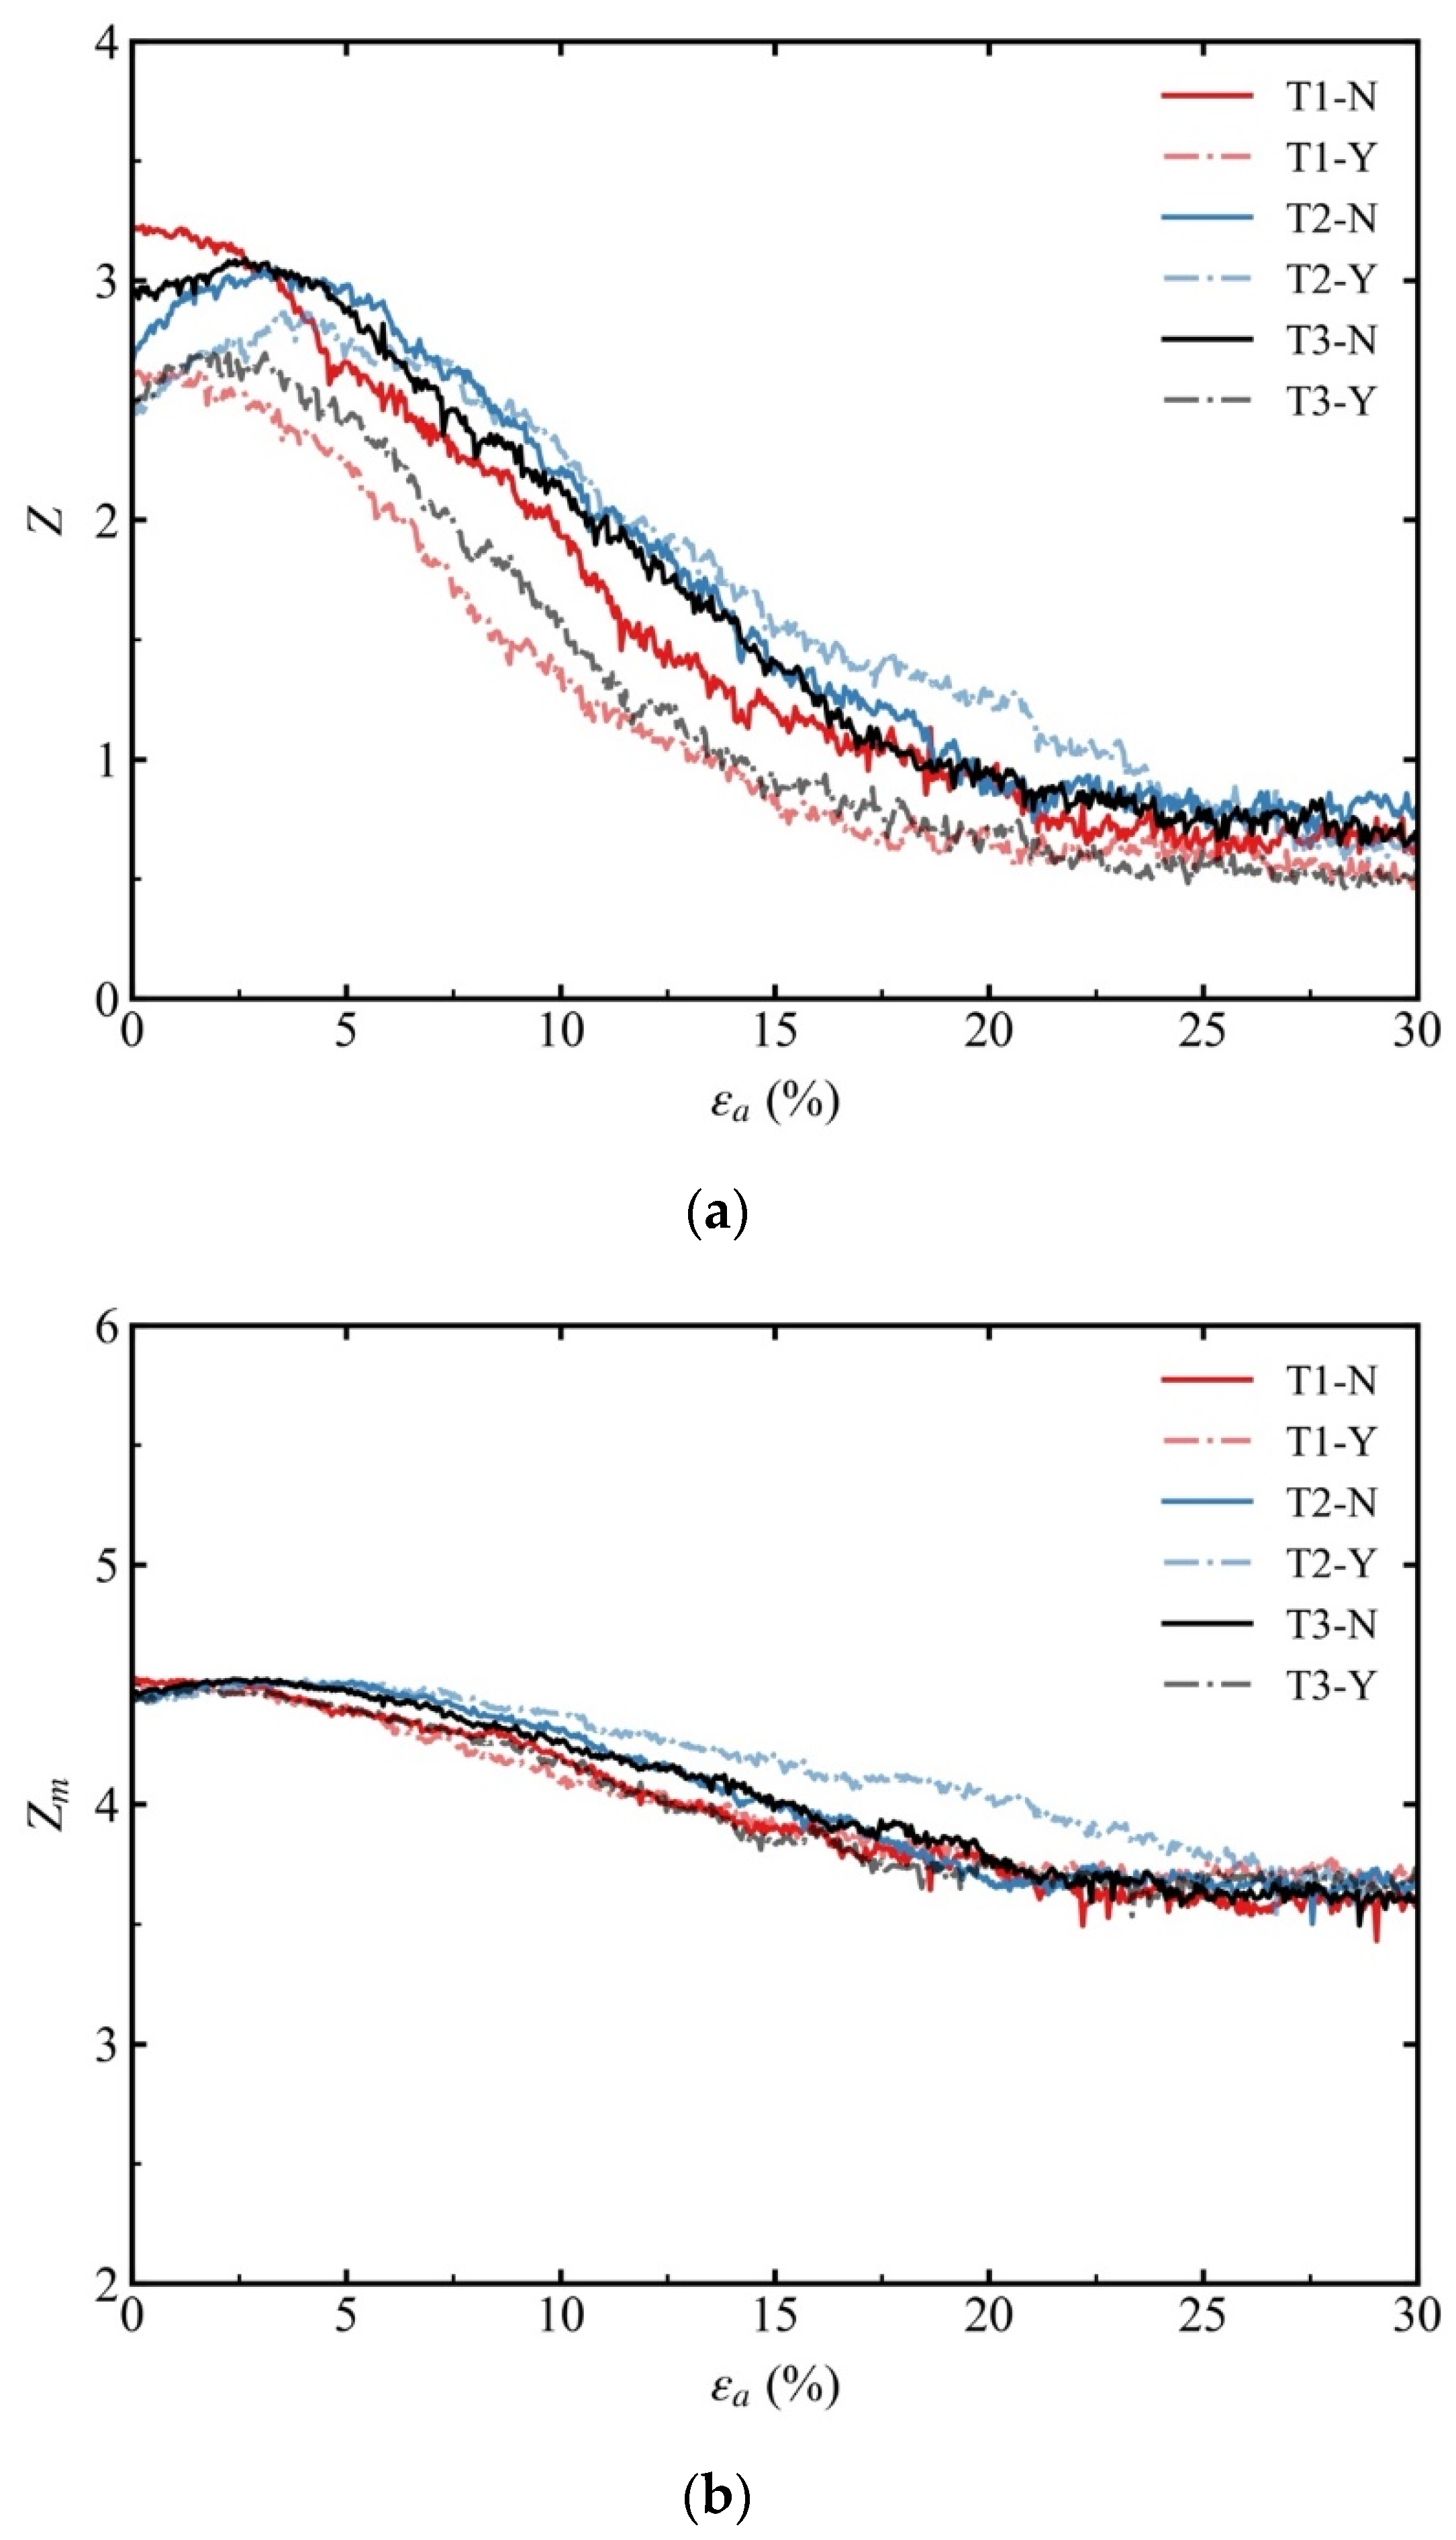
The coordination number Z and mechanical coordination number Zm of the isotropically consolidated specimens were always greater than those of the anisotropically consolidated specimens during suffusion. This suggests that the skeleton structure of the anisotropically consolidated specimens was more perturbed by suffusion than that of the isotropically consolidated specimens.
(4)
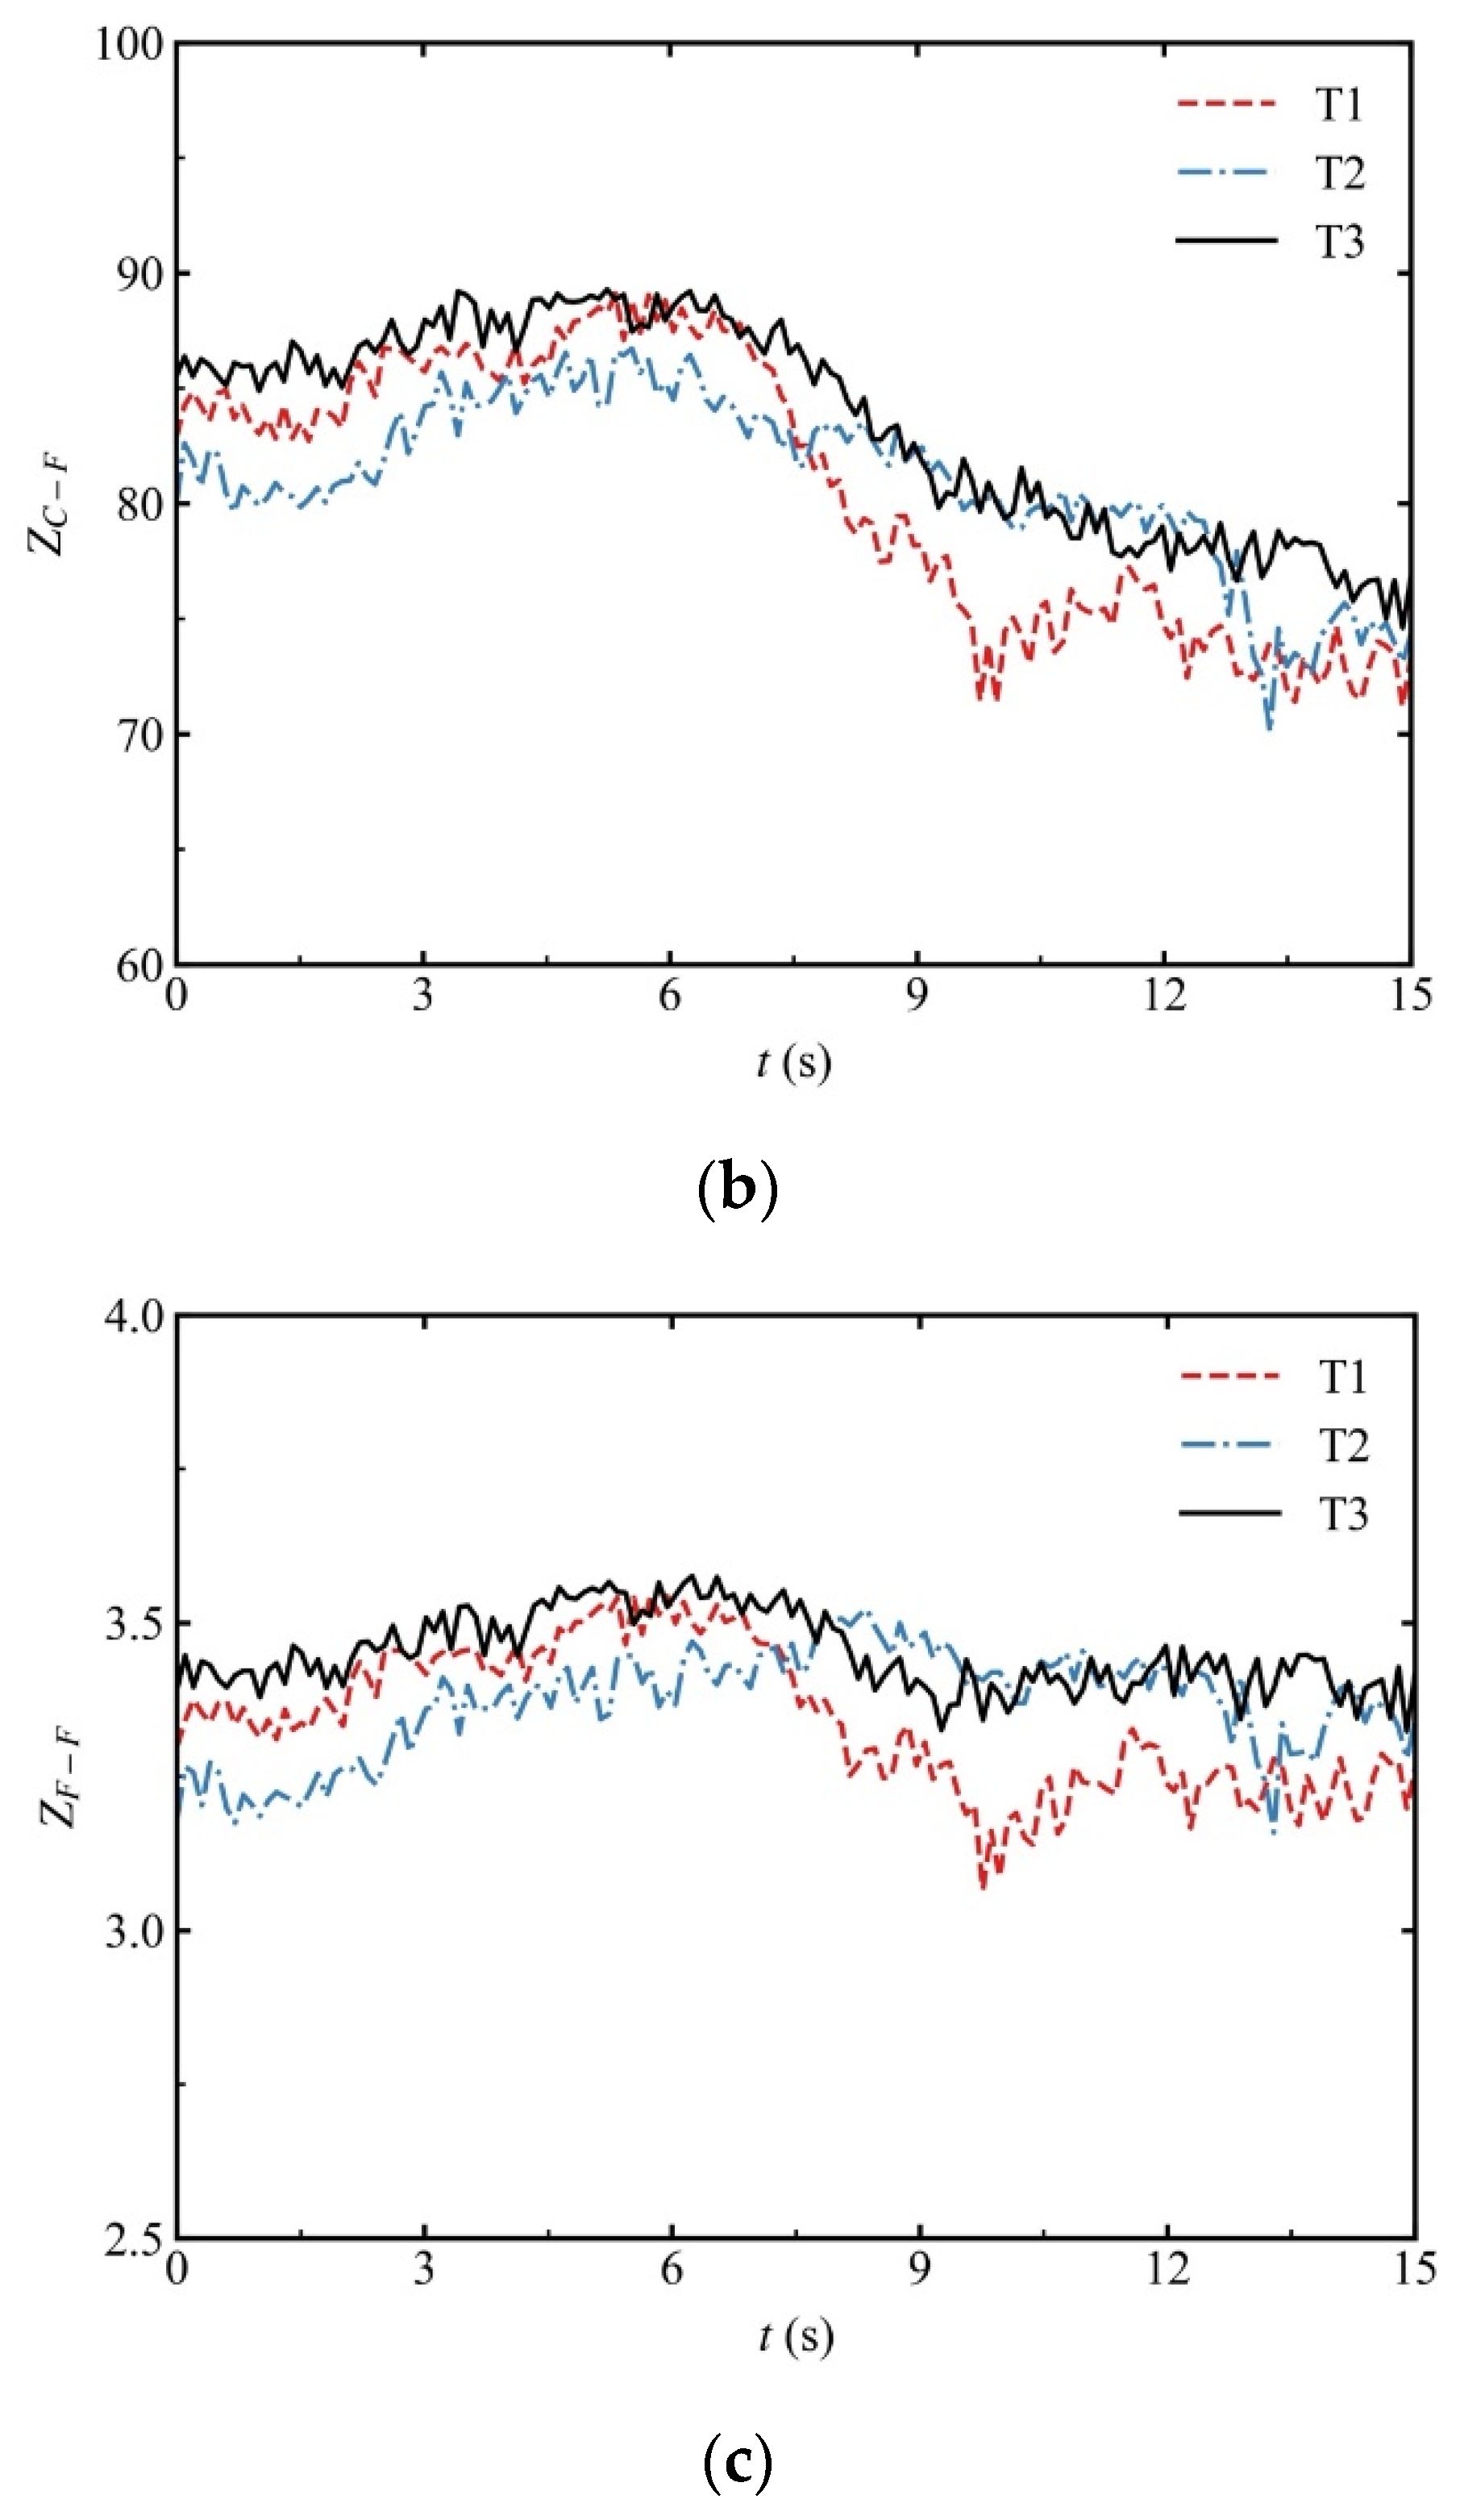
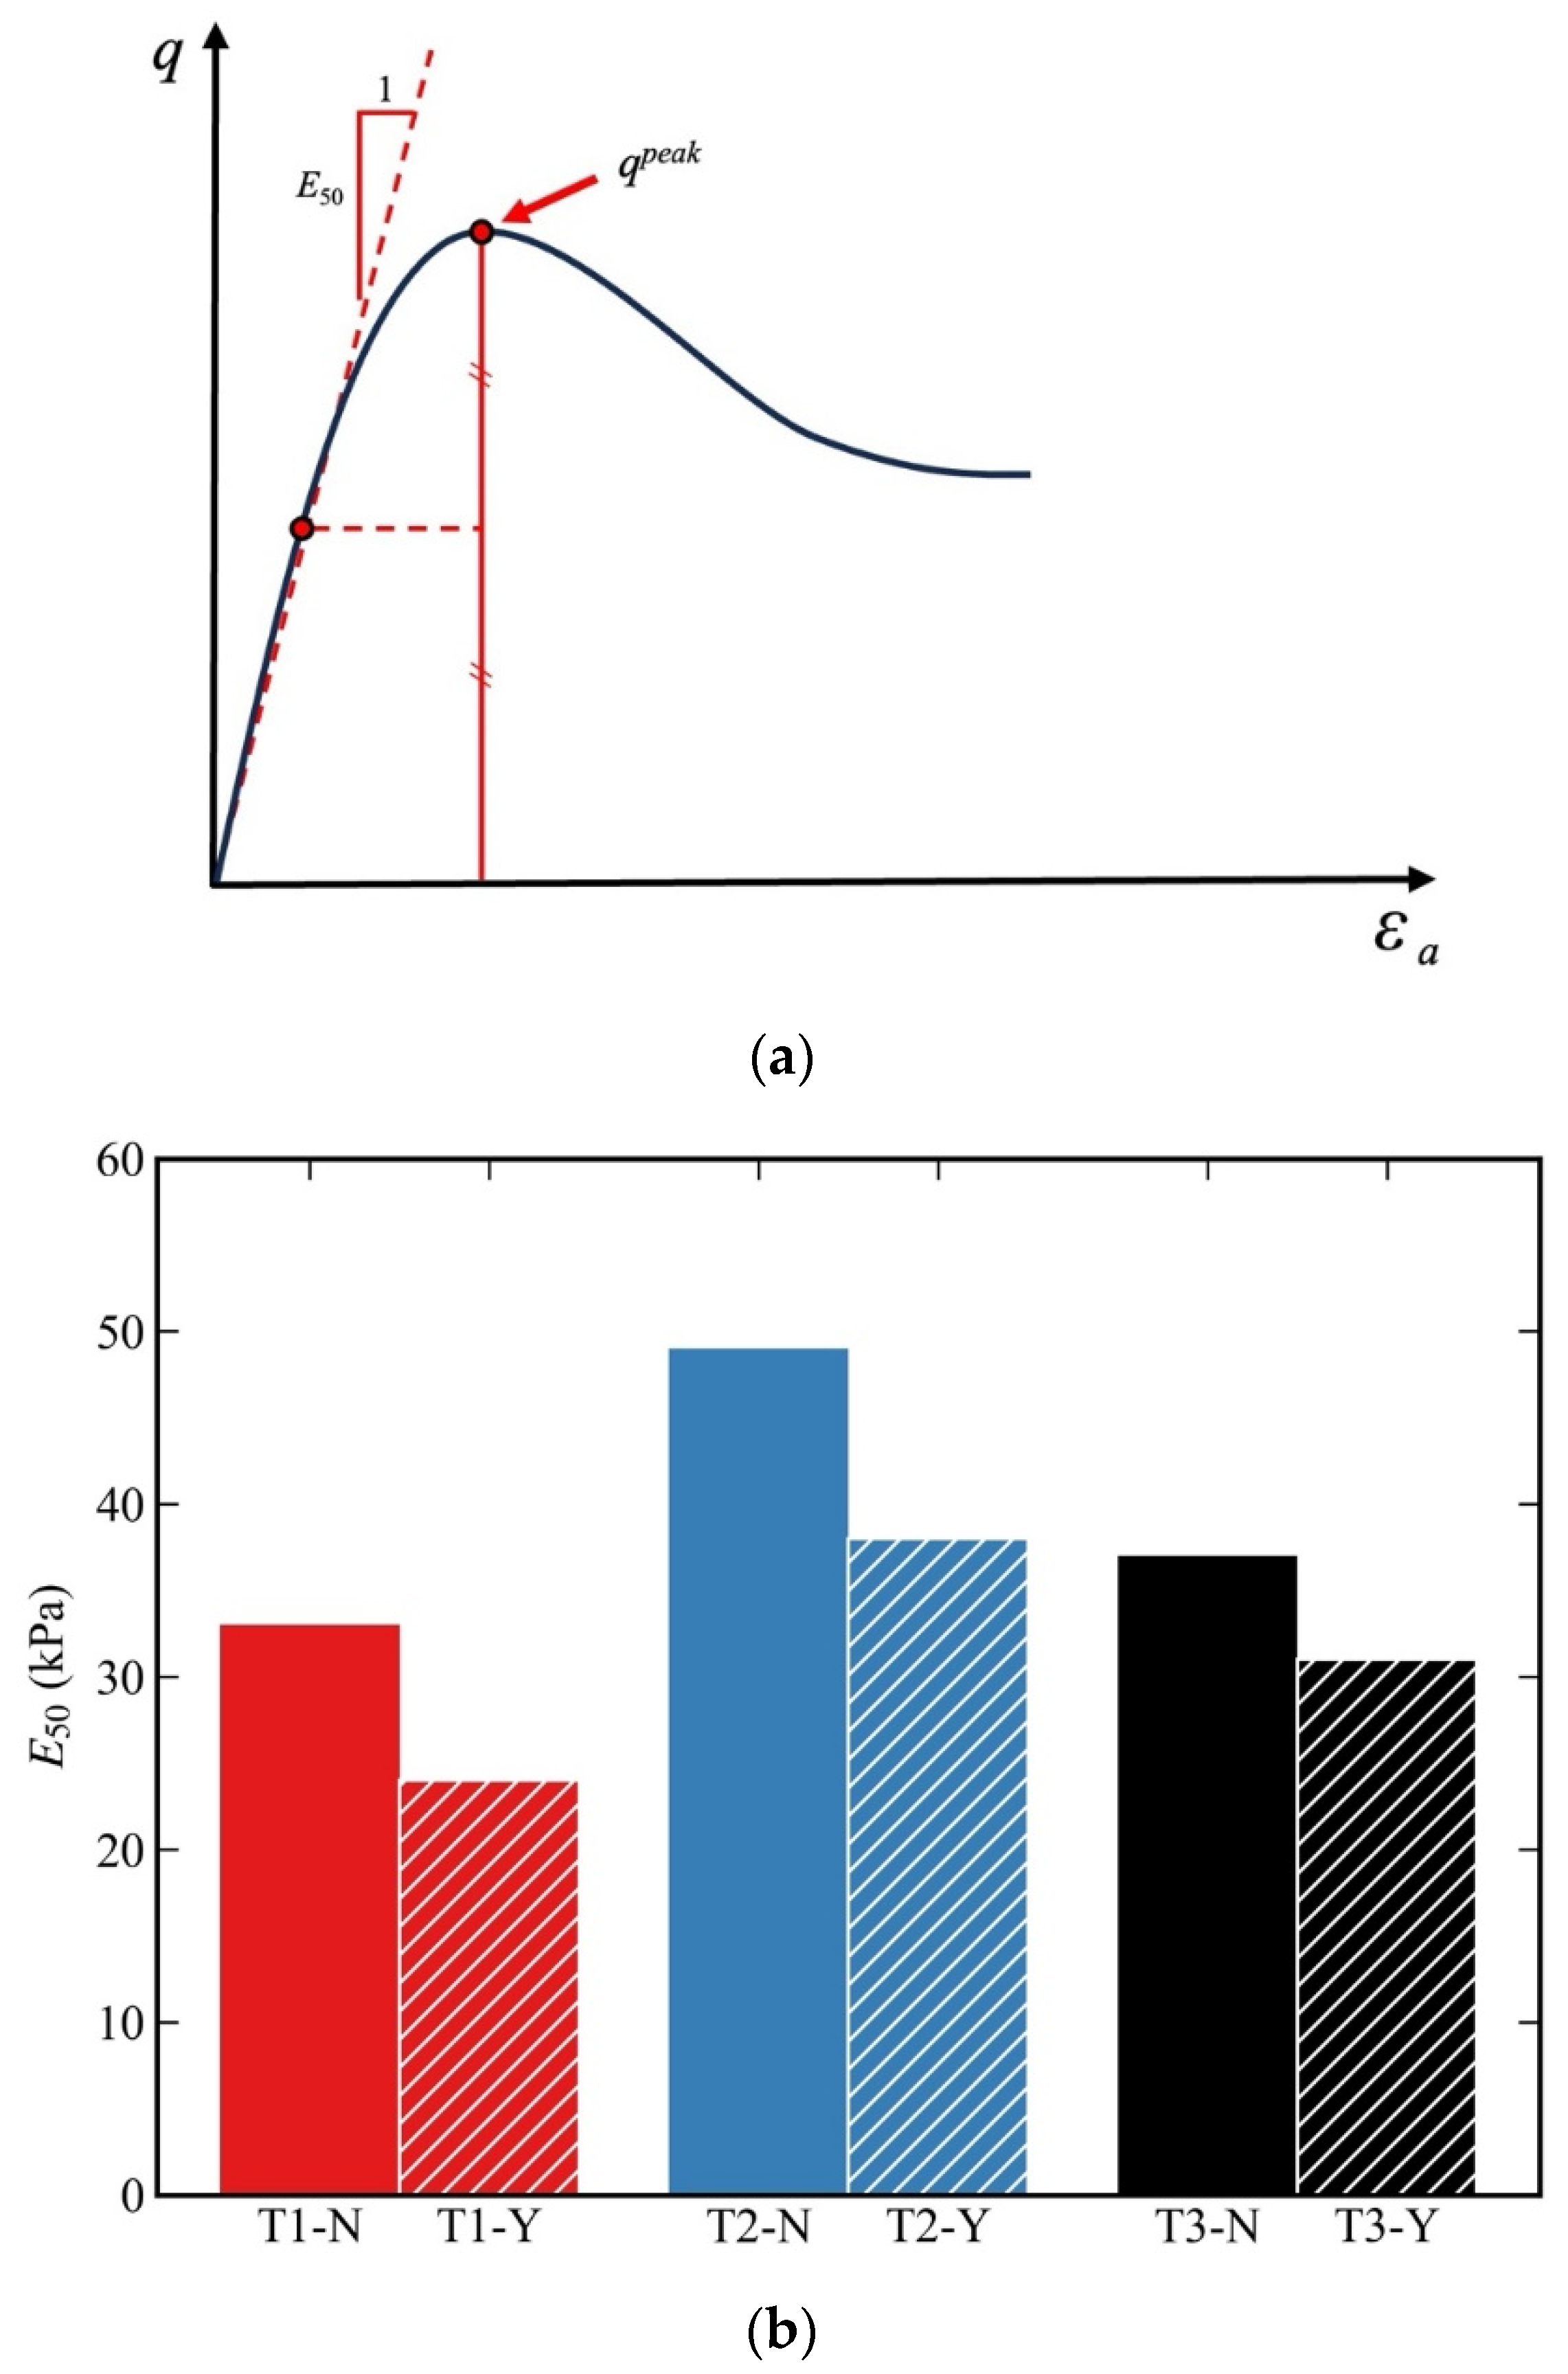
Regardless of the initial stress state of the specimens, the shear strength, secant stiffness, and volume dilatancy of the eroded specimens decreased compared with those of the non-eroded specimens during drained shear tests. Furthermore, the secant stiffness E50 decreased more considerably in the anisotropically consolidated specimens than in the isotropically consolidated specimens after suffusion.
(5)
The percentage of weak force chains was considerably greater than that of strong force chains in the gap-graded soils. When the specimens were sheared to the critical state, the changes in the distribution of the strong and weak force chains between the non-eroded and eroded specimens were smallest in the isotropically consolidated specimens, indicating that the specimens in the isotropic stress state were less susceptible to suffusion than those in the anisotropic stress state.
(6)
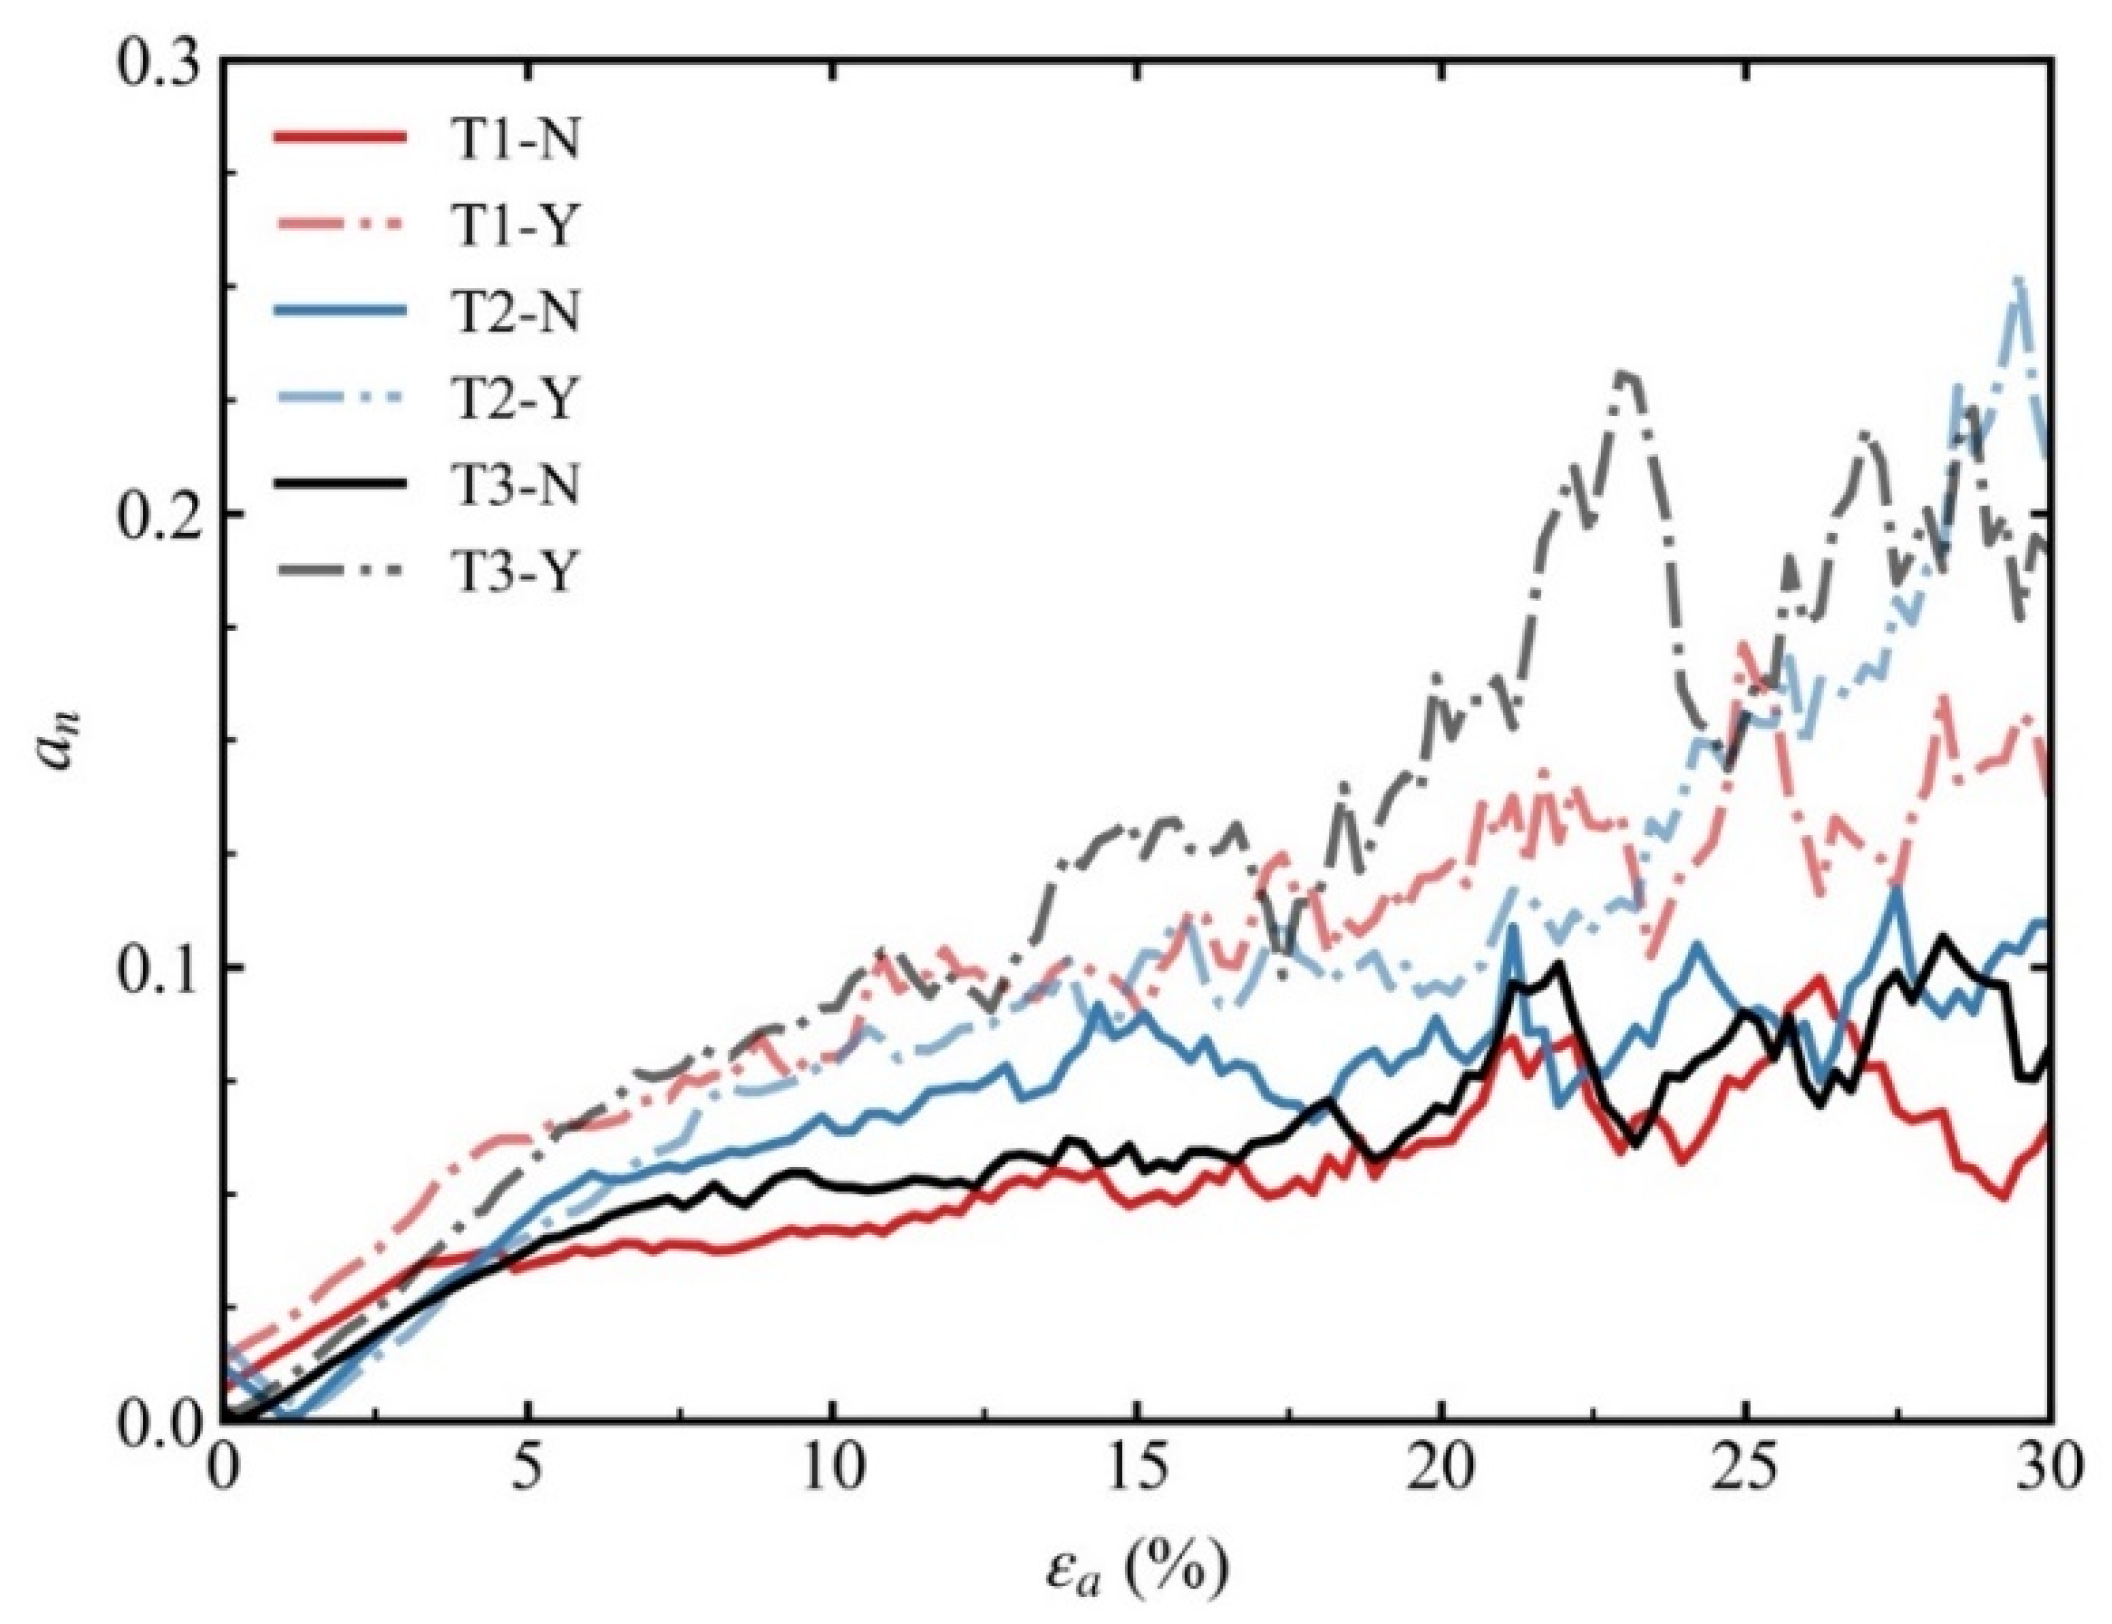
The normal contact force anisotropy of the eroded specimen was greater than that of the non-eroded specimen. The specimen with initial tensile stress had greater anisotropy of normal contact force.
This study focused on the effect of stress anisotropy on the suffusion and shear behaviour of gap-graded soil. Note that natural soils normally have irregular particle shapes and are exposed in complex hydraulic conditions. Further work will focus on evaluating the effect of irregular particle shapes on suffusion evolution and the mechanical responses of gap-graded soil specimens.

Author Contributions

Conceptualisation, G.Y.; data curation, G.Y. and C.Y.; investigation, G.Y. and Z.F.; methodology, Z.H. and J.J.; validation, J.J.; writing—original draft, C.Y.; supervision, K.P.; writing—review and editing, K.P. and Z.H. All authors have read and agreed to the published version of the manuscript.

Funding

The research described was funded by the Natural Science Foundation of China (Grant Nos. 52008409, 52178362, U2239251), the Guangdong Provincial Natural Science Foundation of China (Grant No. 2023A1515012140), and the Fundamental Research Funds for the Provincial Universities of Zhejiang (Grant No. 2022RB01).

Data Availability Statement

The data generated in this study are available from the corresponding author upon reasonable request. The data are not publicly available due to privacy.

Conflicts of Interest

Author Gengfeng Yu was employed by the company Haining Water Resources Construction Management Co., Ltd. Authors Zunan Fu and Jianguo Jing were employed by the company Power China Huadong Engineering Co., Ltd. The remaining authors declare that the research was conducted in the absence of any commercial or financial relationships that could be construed as a potential conflict of interest.

References

  1. Ślusarek, J.; Łupieżowiec, M. Analysis of damage to structures as a result of soil suffusion. Eng. Fail. Anal. 2021, 120, 105058. [Google Scholar] [CrossRef]
  2. Foster, M.; Fell, R.; Spannagle, M. The statistics of embankment dam failures and accidents. Can. Geotech. J. 2000, 37, 1000–1024. [Google Scholar] [CrossRef]
  3. Richards, K.S.; Reddy, K.R. Critical appraisal of piping phenomena in earth dams. Bull. Eng. Geol. Environ. 2007, 66, 381–402. [Google Scholar] [CrossRef]
  4. Jiang, X.; Zhu, H.; Yan, Z.; Zhang, F.; Li, P.; Zhang, X.; Dai, Z.; Bai, Y.; Huang, B. A state-of-art review on development and progress of backfill grouting materials for shield tunneling. Dev. Built Environ. 2023, 16, 100250. [Google Scholar] [CrossRef]
  5. Kenney, T.C.; Lau, D. Internal stability of granular filters. Can. Geotech. J. 1985, 22, 215–225. [Google Scholar] [CrossRef]
  6. Li, M.; Fannin, R.J. Comparison of two criteria for internal stability of granular soil. Can. Geotech. J. 2008, 45, 1303–1309. [Google Scholar] [CrossRef]
  7. Zheng, H.; Shi, Z.; Shen, D.; Peng, M.; Hanley, K.J.; Ma, C.; Zhang, L. Recent advances in stability and failure mechanisms of landslide dams. Front. Earth Sci. 2021, 9, 659935. [Google Scholar] [CrossRef]
  8. Rochim, A.; Marot, D.; Sibille, L.; Le, V.T. Effects of hydraulic loading history on suffusion susceptibility of cohesionless soils. J. Geotech. Geoenviron. Eng. 2017, 143, 04017025. [Google Scholar] [CrossRef]
  9. Sterpi, D. Effects of the erosion and transport of fine particles due to seepage flow. Int. J. Geomech. 2003, 3, 111–122. [Google Scholar] [CrossRef]
  10. Chen, C.; Zhang, L.M.; Chang, D.S. Stress-strain behavior of granular soils subjected to internal erosion. J. Geotech. Geoenviron. Eng. 2016, 142, 06016014. [Google Scholar] [CrossRef]
  11. Chang, D.S.; Zhang, L.M. Critical hydraulic gradients of internal erosion under complex stress states. J. Geotech. Geoenviron. Eng. 2013, 139, 1454–1467. [Google Scholar] [CrossRef]
  12. Chang, D.; Zhang, L. Extended internal stability criteria for soils under seepage. Soils Found. 2013, 53, 569–583. [Google Scholar] [CrossRef]
  13. Ke, L.; Takahashi, A. Experimental investigations on suffusion characteristics and its mechanical consequences on saturated cohesionless soil. Soils Found. 2014, 54, 713–730. [Google Scholar] [CrossRef]
  14. Muir, W.D. The magic of sands–the 20th Bjerrum Lecture presented in Oslo, 25 November 2005. Can. Geotech. J. 2007, 44, 1329–1350. [Google Scholar]
  15. Wood, D.M.; Maeda, K.; Nukudani, E.; Bolton, M.D.; Nakata, Y.; Cheng, Y.P.; Gens, A.; Yang, J.; Dai, B. Modelling mechanical consequences of erosion. Géotechnique 2010, 60, 447–457. [Google Scholar] [CrossRef]
  16. Scholtès, L.; Hicher, P.-Y.; Sibille, L. Multiscale approaches to describe mechanical responses induced by particle removal in granular materials. Comptes Rendus Mec. 2010, 338, 627–638. [Google Scholar] [CrossRef]
  17. Hicher, P.-Y. Modelling the impact of particle removal on granular material behavior. Géotechnique 2013, 63, 118–128. [Google Scholar] [CrossRef]
  18. Zhou, Z.; Li, Z.; Ranjith, P.G.; Wen, Z.; Shi, S.; Wei, C. Numerical simulation of the influence of seepage direction on suffusion in granular soils. Arab. J. Geosci. 2020, 13, 669. [Google Scholar] [CrossRef]
  19. Gu, D.M.; Huang, D.; Liu, H.L.; Zhang, W.G.; Gao, X.C. A DEM-based approach for modeling the evolution process of seepage-induced erosion in clayey sand. Acta Geotech. 2019, 14, 1629–1641. [Google Scholar] [CrossRef]
  20. Xiong, H.; Wu, H.; Bao, X.; Fei, J. Investigating effect of particle shape on suffusion by CFD-DEM modeling. Constr. Build. Mater. 2021, 289, 123043. [Google Scholar] [CrossRef]
  21. Hu, Z.; Zhang, Y.; Yang, Z. Suffusion-induced deformation and microstructural change of granular soils: A coupled CFD–DEM study. Acta Geotech. 2019, 14, 795–814. [Google Scholar] [CrossRef]
  22. Qian, J.G.; Zhou, C.; Yin, Z.Y.; Li, W.Y. Investigating the effect of particle angularity on suffusion of gap-graded soil using coupled CFD-DEM. Comput. Geotech. 2021, 139, 104383. [Google Scholar] [CrossRef]
  23. Ma, H.; Li, B. CFD-CGDEM coupling model for scour process simulation of submarine pipelines. Ocean. Eng. 2023, 271, 113789. [Google Scholar] [CrossRef]
  24. El Shamy, U.; Aydin, F. Multiscale modeling of flood-induced piping in river levees. J. Geotech. Geoenviron. Eng. 2008, 134, 1385–1398. [Google Scholar] [CrossRef]
  25. Zhao, J.; Shan, T. Coupled CFD–DEM simulation of fluid–particle interaction in geomechanics. Powder Technol. 2013, 239, 248–258. [Google Scholar] [CrossRef]
  26. Shan, T.; Zhao, J. A coupled CFD-DEM analysis of granular flow impacting on a water reservoir. Acta Mech. 2014, 225, 2449–2470. [Google Scholar] [CrossRef]
  27. Hu, Z.; Li, J.Z.; Zhang, Y.D.; Yang, Z.X.; Liu, J.K. A CFD–DEM study on the suffusion and shear behaviors of gap-graded soils under stress anisotropy. Acta Geotech. 2023, 18, 3091–3110. [Google Scholar] [CrossRef]
  28. Liu, Y.; Wang, L.; Yin, Z.-Y.; Hong, Y. A coupled CFD-DEM investigation into suffusion of gap-graded soil considering anisotropic stress conditions and flow directions. Acta Geotech. 2023, 18, 3111–3132. [Google Scholar] [CrossRef]
  29. Goniva, C.; Kloss, C.; Deen, N.G.; Kuipers, J.A.; Pirker, S. Influence of rolling friction on single spout fluidized bed simulation. Particuology 2012, 10, 582–591. [Google Scholar] [CrossRef]
  30. Kloss, C.; Goniva, C.; Hager, A.; Amberger, S.; Pirker, S. Models, algorithms and validation for opensource DEM and CFD-DEM. Prog. Comput. Fluid Dyn. Int. J. 2012, 12, 140. [Google Scholar] [CrossRef]
  31. Zhou, Y.C.; Wright, B.D.; Yang, R.Y.; Xu, B.H.; Yu, A.B. Rolling friction in the dynamic simulation of sandpile formation. Phys. Part A Stat. Mech. Its Appl. 1999, 269, 536–553. [Google Scholar] [CrossRef]
  32. Yin, W.; Jun, A.I.; Qing, Y. A CFD-DEM coupled method incorporating soil interparticle rolling resistance. Rock Soil Mech. 2017, 38, 1771–1780. [Google Scholar]
  33. Di Felice, R. The voidage function for fluid-particle interaction systems. Int. J. Multiph. Flow 1994, 20, 153–159. [Google Scholar] [CrossRef]
  34. Smuts, E.M.; Deglon, D.A.; Meyer, C.J. Methodology for CFD-DEM modelling of particulate suspension rheology. In Proceedings of the Ninth International Conference on CFD in the Minerals and Process Industries CSIRO, Melbourne, Australia, 10–12 December 2012. [Google Scholar]
  35. Roux, J.-N.; Combe, G.; Goddard, J.; Giovine, P.; Jenkins, J.T. How granular materials deform in quasistatic conditions. AIP Conf. Proc. 2010, 1227, 260–270. [Google Scholar]
  36. Tao, J.; Tao, H. Factors affecting piping erosion resistance: Revisited with a numerical modeling approach. Int. J. Geomech. 2017, 17, 04017097. [Google Scholar] [CrossRef]
  37. Li, X.; Zhao, J. Dam-break of mixtures consisting of non-Newtonian liquids and granular particles. Powder Technol. 2018, 338, 493–505. [Google Scholar] [CrossRef]
  38. Gong, J.; Nie, Z.; Zhu, Y.; Liang, Z.; Wang, X. Exploring the effects of particle shape and content of fines on the shear behavior of sand-fines mixtures via the DEM. Comput. Geotech. 2019, 106, 161–176. [Google Scholar] [CrossRef]
  39. Kézdi, Á. Soil Physics: Selected Topics; Elsevier: Amsterdam, The Netherlands, 2013. [Google Scholar]
  40. Jiang, M.D.; Yang, Z.X.; Barreto, D.; Xie, Y.H. The influence of particle-size distribution on critical state behavior of spherical and nonspherical particle assemblies. Granul. Matter 2018, 20, 80. [Google Scholar] [CrossRef]
  41. Guo, N.; Zhao, J. The signature of shear-induced anisotropy in granular media. Comput. Geotech. 2013, 47, 1–15. [Google Scholar] [CrossRef]
Figure 1. Schematic of the local void fraction inside a fluid cell.
Buildings 14 00122 g001
Figure 2. Grain size distributions.
Buildings 14 00122 g002
Figure 3. Initial stress states of all specimens.
Buildings 14 00122 g003
Figure 4. Imposed hydraulic gradient with elapsed time.
Buildings 14 00122 g004
Figure 5. (a) Force chain networks and (b) rose diagrams of the probability density distribution of normal contact forces for all specimens after the consolidation stage.
Buildings 14 00122 g005
Figure 6. Loss of fines by mass as a function of elapsed time.
Buildings 14 00122 g006
Figure 7. Force chains of all specimens before and after suffusion.
Buildings 14 00122 g007
Figure 8. Evolutions of (a) volumetric strain εv and (b) void ratio e with the elapsed time for all specimens.
Buildings 14 00122 g008
Figure 9. Evolutions of (a) the coordination number Z and (b) mechanical coordination number Zm with the elapsed time for all specimens.
Buildings 14 00122 g009
Figure 10. Evolution of coordination numbers for all specimens during suffusion in terms of (a) ZC-C, (b) ZC-F, and (c) ZF-F.
Buildings 14 00122 g010aBuildings 14 00122 g010b
Figure 11. Evolutions of (a) deviatoric stress q and (b) volumetric strain εv as functions of axial strain before and after suffusion during drained shear tests.
Buildings 14 00122 g011
Figure 12. (a) Definition of the secant stiffness E50 and (b) secant modulus E50 for all non-eroded and eroded specimens under triaxial shear.
Buildings 14 00122 g012
Figure 13. Evolutions of (mechanical) coordination numbers (a) Z and (b) Zm during drained shear tests.
Buildings 14 00122 g013
Figure 14. Evolution of variable an during drained shear tests.
Buildings 14 00122 g014
Table 1. Parameters used in the CFD–DEM simulation.
Computation ModulesParameter TypesValues
Solid phase (DEM)Particle number4 × 104
Fine-particle diameter (mm)0.42–0.5
Coarse-particle diameter (mm)2.08–2.4
Particle density (kg/m3)2650
Young’s modulus (GPa)7
Poisson’s ratio0.3
Friction coefficient0.5
Restitution coefficient0.2
Rolling friction coefficient0.1
Acceleration of gravity (m/s2)9.81
Fluid phase (CFD)Fluid density (kg/m3)1000
Dynamic viscosity (Pa·s)1 × 10⁻³
Size of fluid cells (mm)3.0
Solid–water interaction
(CFD–DEM)
Timestep of DEM (s)2 × 10⁻⁷
Timestep of CFD (s)2 × 10⁻⁵
Coupling interval (s)2 × 10⁻⁵
Simulation duration (s)15
Table 2. Initial parameters for all specimens.
Specimen
IDs
Radical Stress,
σ′r (kPa)
Axial Stress,
σ′a (kPa)
Mean Stress,
p′ (kPa)
Deviatoric Stress,
q (kPa)
Initial Stress Ratio,
η0
Initial Void Ratio,
e0
T186.7126.7100400.40.398
T2113.373.3100−40−0.40.399
T3100100100000.398
Table 3. Percentages of strong and weak force chains in specimens T1, T2, and T3 before and after drained shear tests.
Specimen ID Proportion   of   F n w (%) before Shearing Proportion   of   F n s (%) before Shearing Proportion   of   F n w (%) after Shearing Proportion   of   F n s (%) after Shearing
T1-N96.43.682.717.3
T1-Y96.43.671.528.5
T2-N96.73.384.815.2
T2-Y96.23.880.319.7
T3-N96.33.784.715.3
T3-Y96.63.483.316.7
Disclaimer/Publisher’s Note: The statements, opinions and data contained in all publications are solely those of the individual author(s) and contributor(s) and not of MDPI and/or the editor(s). MDPI and/or the editor(s) disclaim responsibility for any injury to people or property resulting from any ideas, methods, instructions or products referred to in the content.

