1. Introduction
Rock breaking with drilling bits exists in many applications like underground engineering, oil and gas exploration, mining processes, and civil engineering. PDC (polycrystalline diamond compact) is an extremely hard composite material made of diamond powder and cemented carbide substrate under high temperature and ultra-high pressure conditions. It combines the performance benefits of polycrystalline diamond and cemented carbide [
1]. A PDC drill bit has many advantages like no moving parts, high drilling speed, and high cutting efficiency, and it has been broadly applied for rock breaking in numerous industries like oil and gas exploration and production, mining engineering, and geological engineering [
2,
3,
4].
The rock-breaking efficiency is related to many parameters. Take the rock breaking in oil and gas exploration, for instance. The drilling efficiency for deep wells is mainly affected by low drilling rates and high energy consumption due to extreme temperature, high stress, and deep rock intense hardness when oil and gas exploration advances gradually to greater depths. The structure of the PDC drill bit is an essential factor that directly affects deep formation ROP (rate of penetration) [
5,
6], apart from formation characteristics and drilling parameters. In recent years, the shortcomings of conventional PDC bits caused by structures were made up by improving the material properties of PDC cutters [
7,
8]. However, optimizing the bit structure, particularly the cutter layout, is still a meaningful way to improve the integrated performance of the PDC drill bits.
The cutter layout of PDC bits directly affects their integrated performance, including mechanical drilling rate, wear rate, drilling stability, and maneuverability. A scientific and reasonable cutter layout can improve the efficiency of bit design, reduce the MSE (mechanical special energy), and enhance the rock breaking efficiency. To address this problem, in 2018, Halliburton Company introduced a different Stega cutter laying technology, the main feature of which is the staggered layout of front and back cutters, as shown in
Figure 1 cited from [
9]. Stega gear positioning technology makes full use of the bottom hole shape formed by the primary cutting structure so that the cutting track of the back cutter and the front cutter track partially overlap. This design can eliminate the load stress of the main cutting structure and ensure the meshing of the spare cutter, which can maximize the drilling efficiency. However, there are no related reports about the rock-breaking mechanism of this bit. Therefore, it is necessary to study the mechanism of this dual-cutter cutting in order to promote this technology.
As the rock-breaking process of PDC is a highly complex physical process, generally, the rock-breaking mechanism cannot be fully explored by experimental research. Computer simulations were mainly employed to study the mechanisms of rock breaking [
10,
11]. Zeuch. D. H. et al. [
12], D. V. Swenson et al. [
13], and J. T. Finger et al. [
14], respectively, studied the fragmentation of rock through single-cutter cutting experiments. Rojek et al. [
15] used DEM to conduct two-dimensional and three-dimensional modeling of the rock fracture process. The numerical results of the fracture forces and their spectra from the simulation analysis perfectly agree with the experimental results, which shows that the DEM modeling method is reasonable for accurately modeling rock fractures. Loui [
16] used a two-dimensional nonlinear finite element method to simulate progressive rock failure and used local stability factors to classify potential failure units. The model can effectively reproduce the crack propagation path and failure type (shear failure and partial tensile failure). However, the numerical peak crushing force is about
higher than the corresponding experimental results. Jaime [
17] improved a finite element program that uses a plastic damage model to predict rock crushing force and fracture characteristics, considering the influence of complex physical properties of the rock itself on accurate simulation of the cracking process, and confirmed that it is reasonable to use plastic damage model to simulate rock cracking. Menezes [
18] adopted the explicit finite element method to simulate the crushing process by using the damage constitutive model. It was verified that the explicit finite element method could accurately predict the fracture force and reproduce the chip formation process by performing a series of rock fracture simulations at different fracture depths. Different studies also use numerical methods to study rock-breaking to reveal the rock-breaking mechanism and improve the rock-breaking ability of mechanical tools [
19,
20].
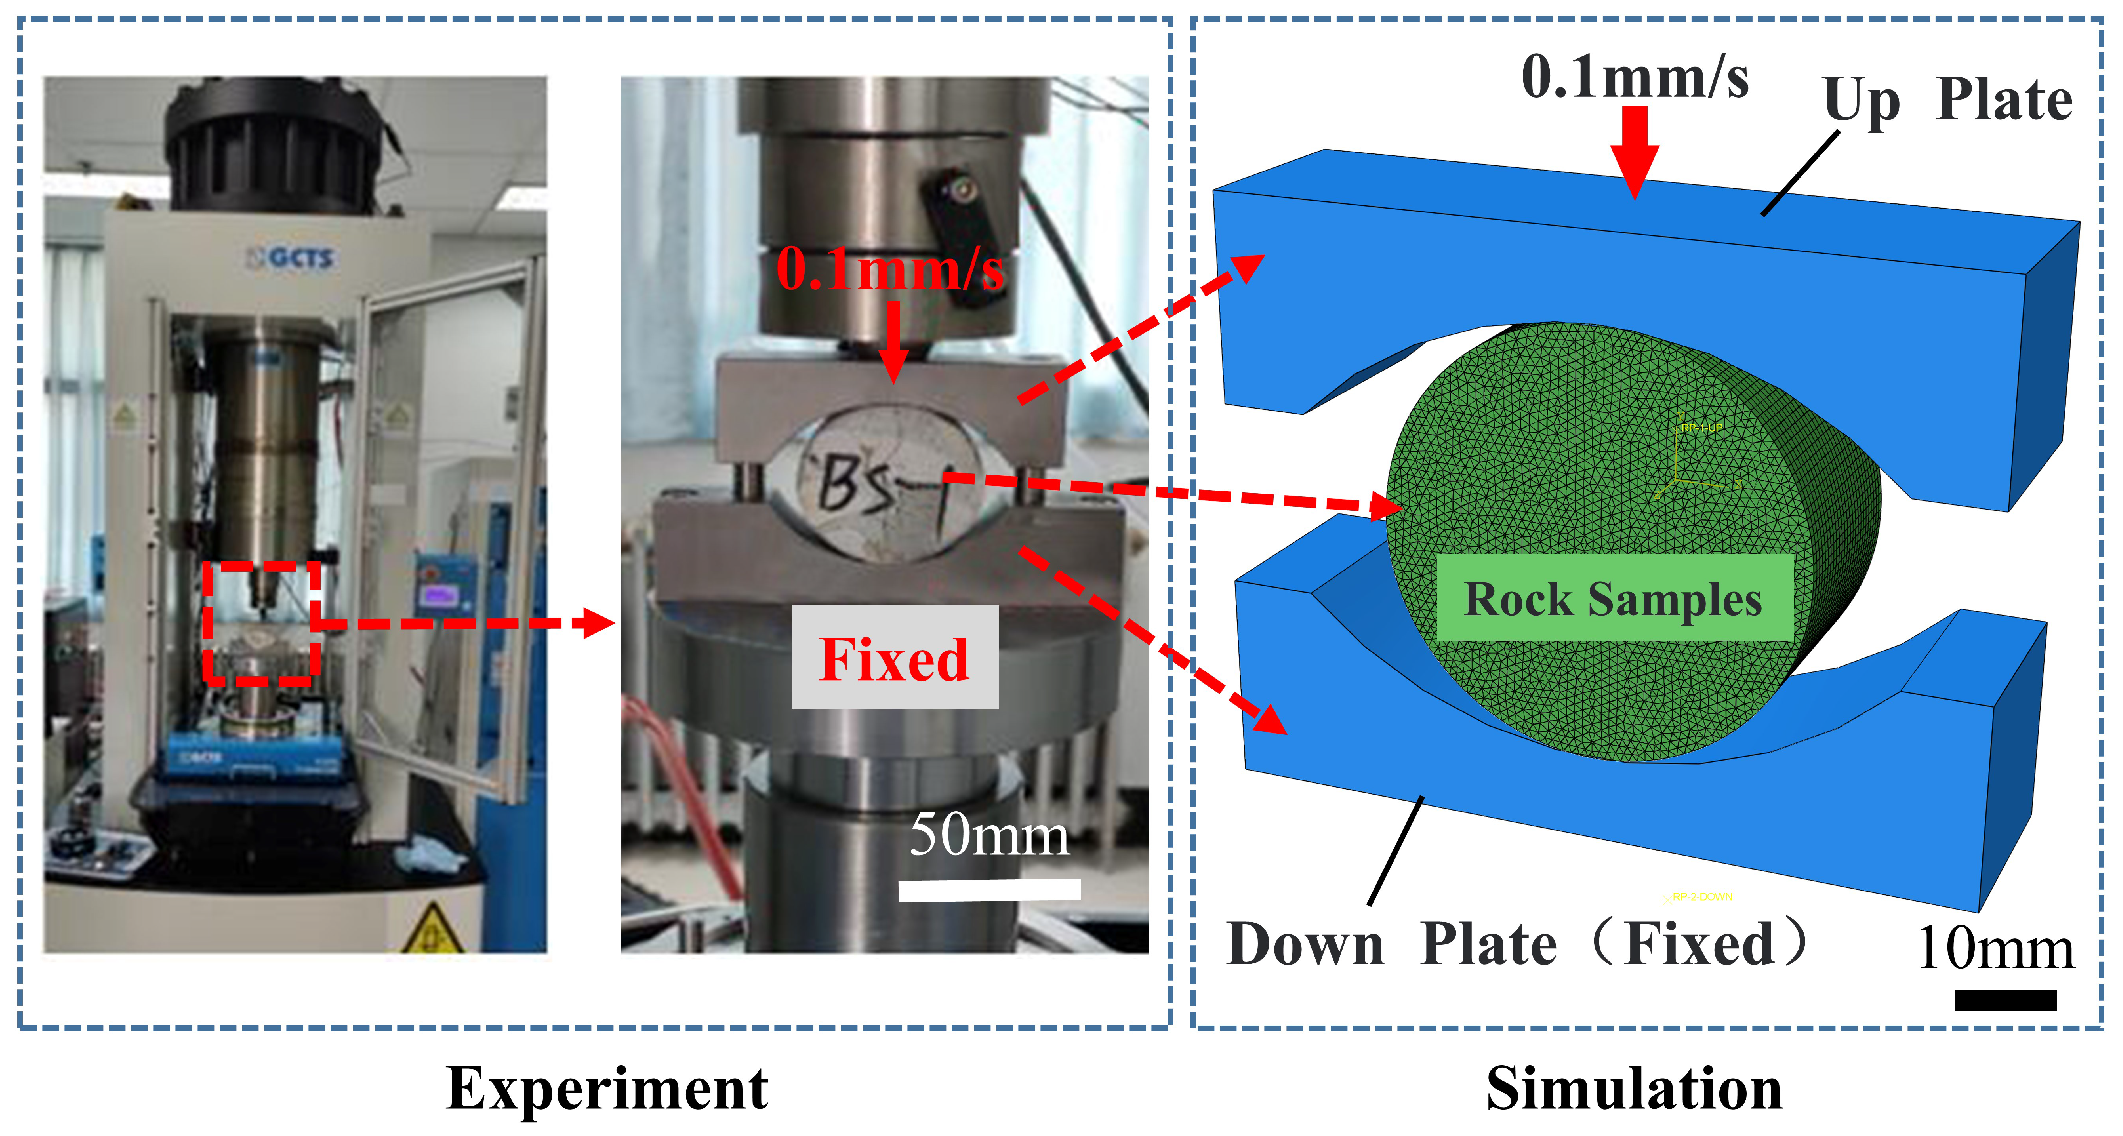
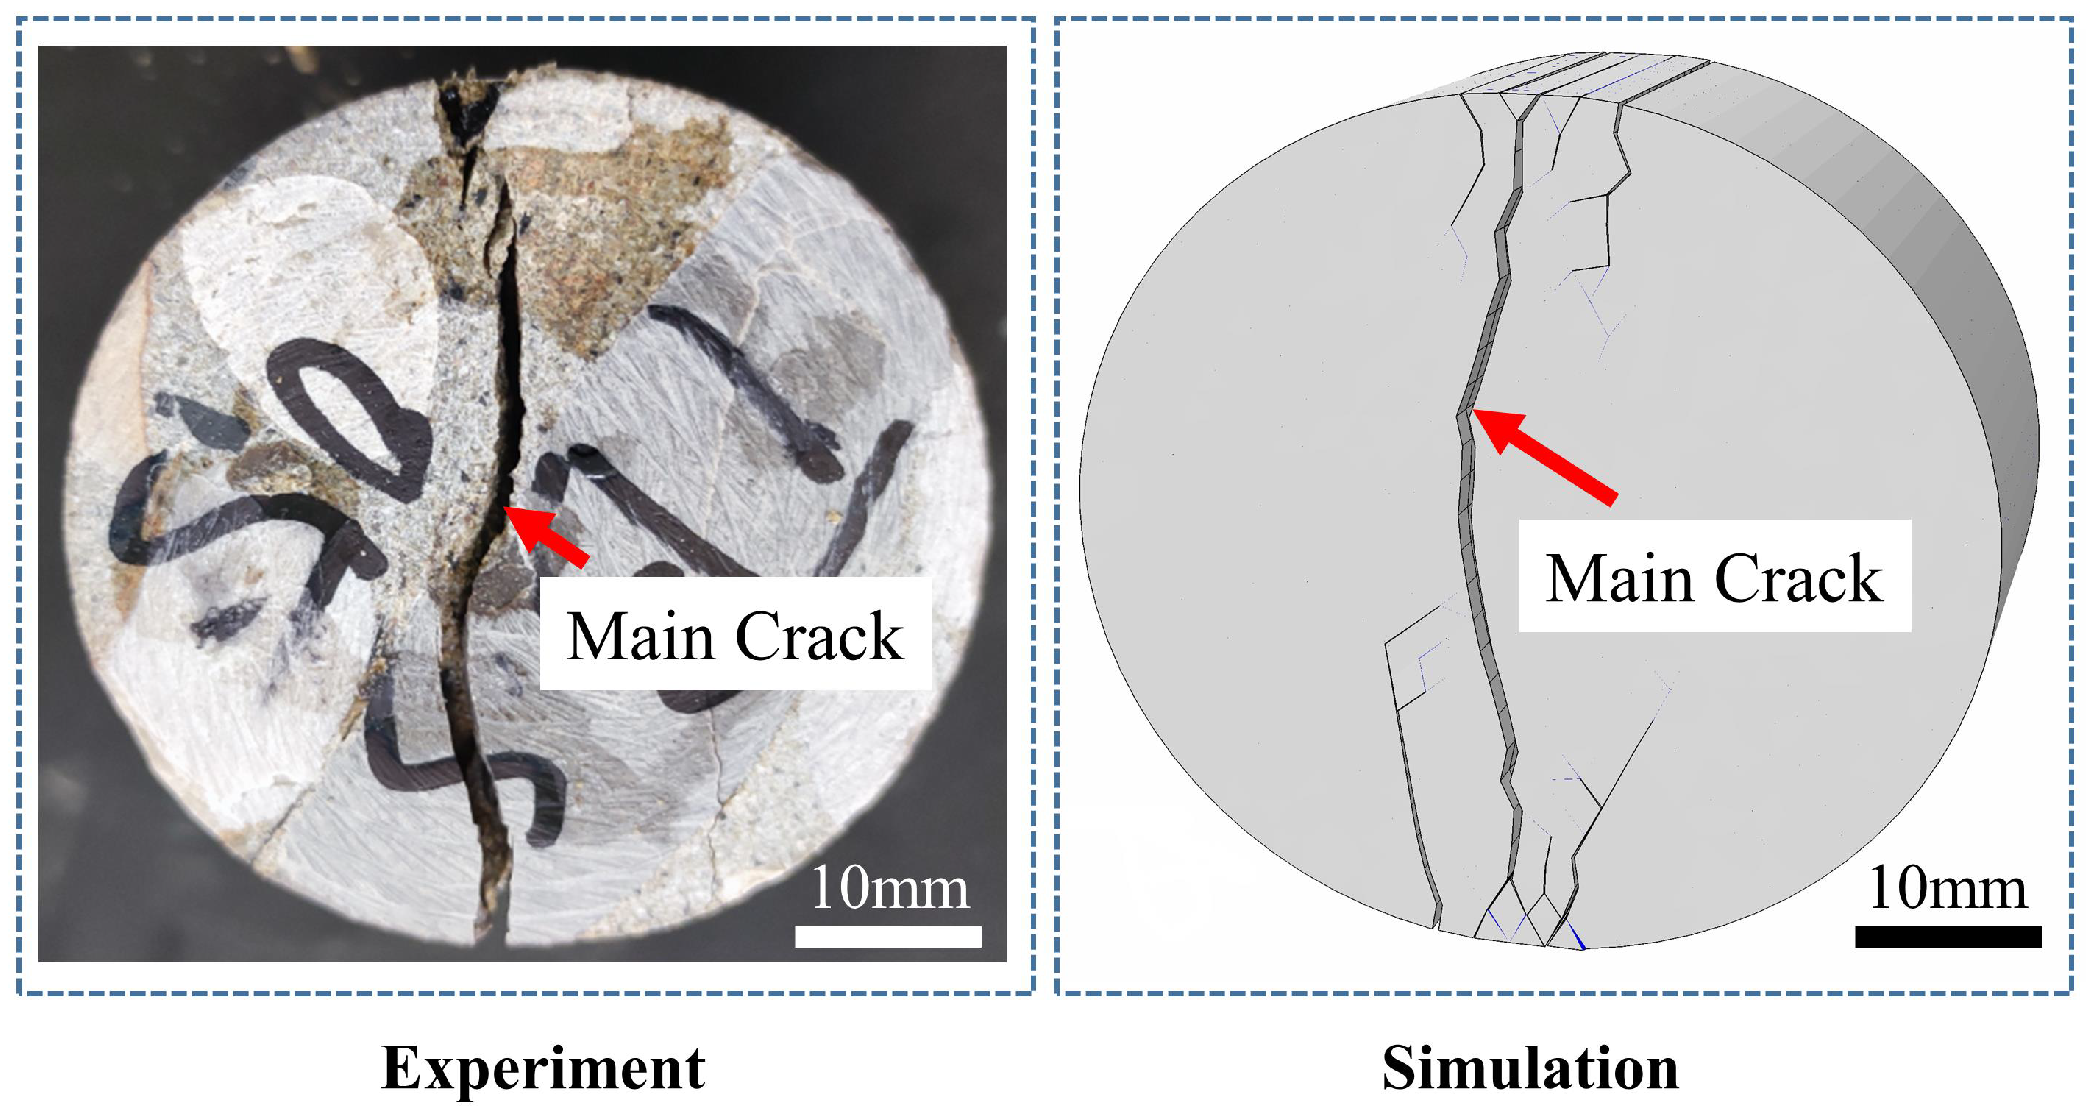
Even though many results have been obtained in previous works, there are few studies for the drill bit with the dual-cutter. Here, in this work, the drilling process of the dual-cutters is focused. A three-dimensional numerical model of rock breaking is created utilizing the hybrid finite and cohesive element method (FCEM) in order to simulate the rock crushing process correctly. The experimental and numerical data from the Brazilian disc test are compared and examined, and the model is improved and tested. The following issues are investigated using the validated numerical model: (a) Analysis rock fracture and cuttings formation in the dual-cutter rock breaking process, including fracture region, crack propagation path and cuttings morphology; (b) The effect of horizontal and vertical offset on rock breaking efficiency was evaluated by MSE; (c) The response surface method and Gray Wolf algorithm are used to optimize the horizontal and vertical offset distance of the dual-cutter and find an optimal or proper offset.
The rest of this article is arranged as follows.
Section 2 describes the employed numerical model, including the controlling equations, geometry model, and simulation conditions.
Section 3 demonstrates the results of cutting mechanisms and the analysis for relative distance between the dual-cutters. Conclusions of this study are drawn in
Section 4.
3. Results and Discussions
3.1. Mechanism Analysis of Rock Breaking by Dual-Cutters
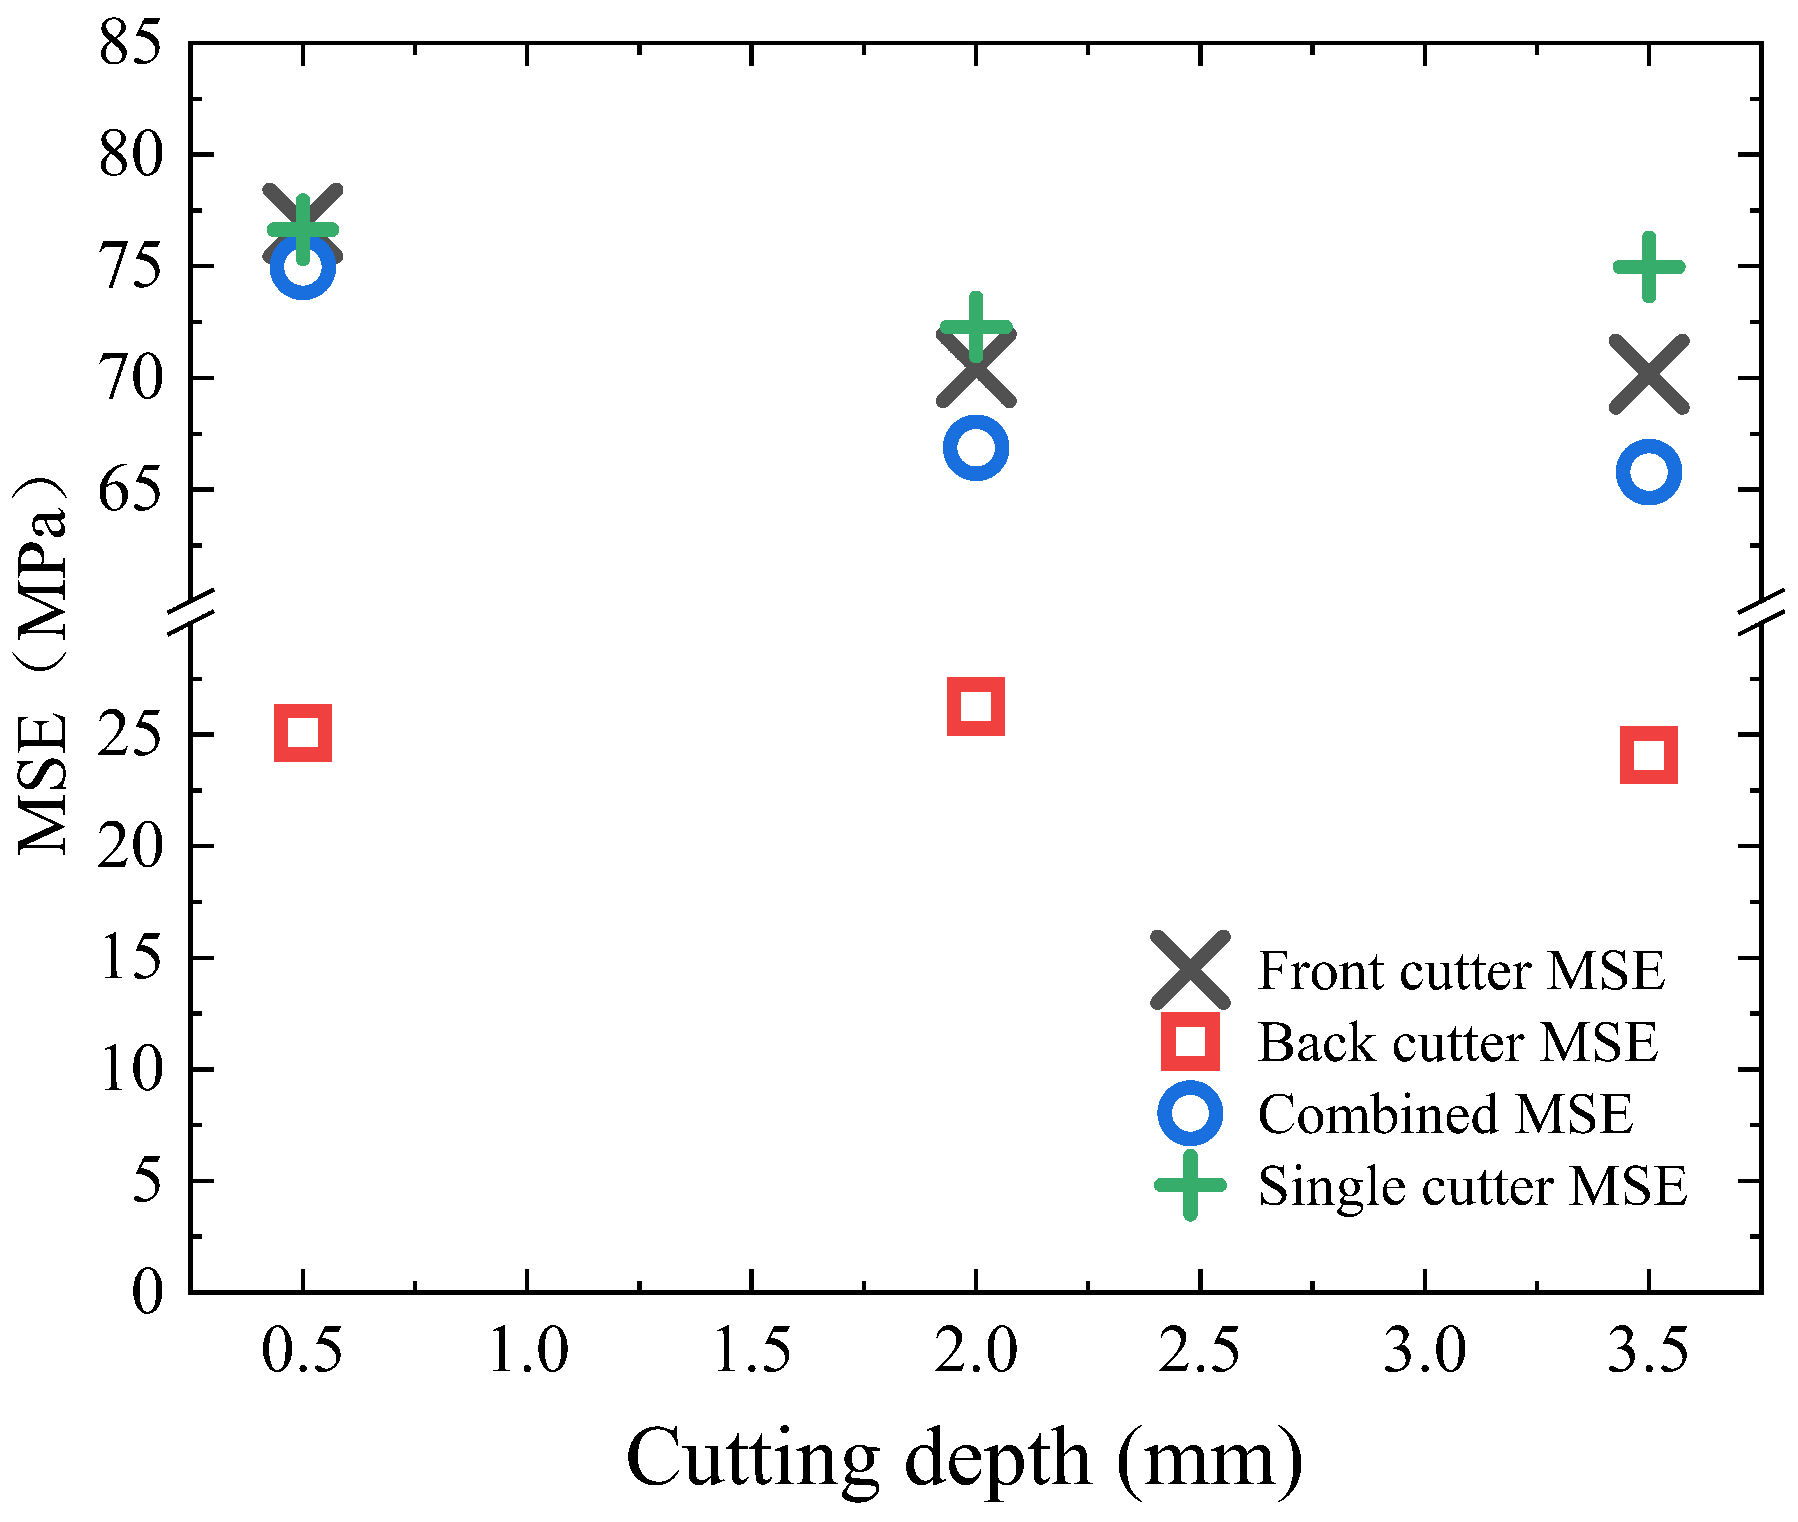
Figure 8 shows the MSE values for different cutting depths. In particular, it should be noted that the depth of cut in
Figure 8 refers to the cutting depth of the front cutter for dual-cutter cutting, and the cutting depth of the back cutter is fixed at
mm.
When the cutting depth is mm, the MSE values of single-cutter cutting and dual-cutter cutting are not much different. When the cutting depth reaches mm, the MSE values of dual-cutter cutting(combined MSE) are lower than those of single-cutter cutting. When the cutting depth reaches mm, the MSE value of single-cutter cutting has a small increase, but the MSE value of dual-cutter cutting is basically unchanged. When cutting with dual-cutter, the MSE of the front cutter changes with the cutting depth in a similar way to that of the single-cutter cutting, which decreases with the increase in the cutting depth, and mostly remains unchanged after decreasing to a certain extent. The MSE of the back cutter is much smaller than that of the front cutter and single-cutter, and mostly does not change with the change of cutting depth. Above analysis confirms that the rock-breaking efficiency of dual-cutter cutting is higher than that of single-cutter cutting.
To further study the mechanism of different MSE values between single-cutter and dual-cutter cutting, it is necessary to analyze the rock-breaking process of the two rock-breaking modes. In particular, it is necessary to simulate the process of macroscopic crack generation and debris shedding.
Figure 9 and
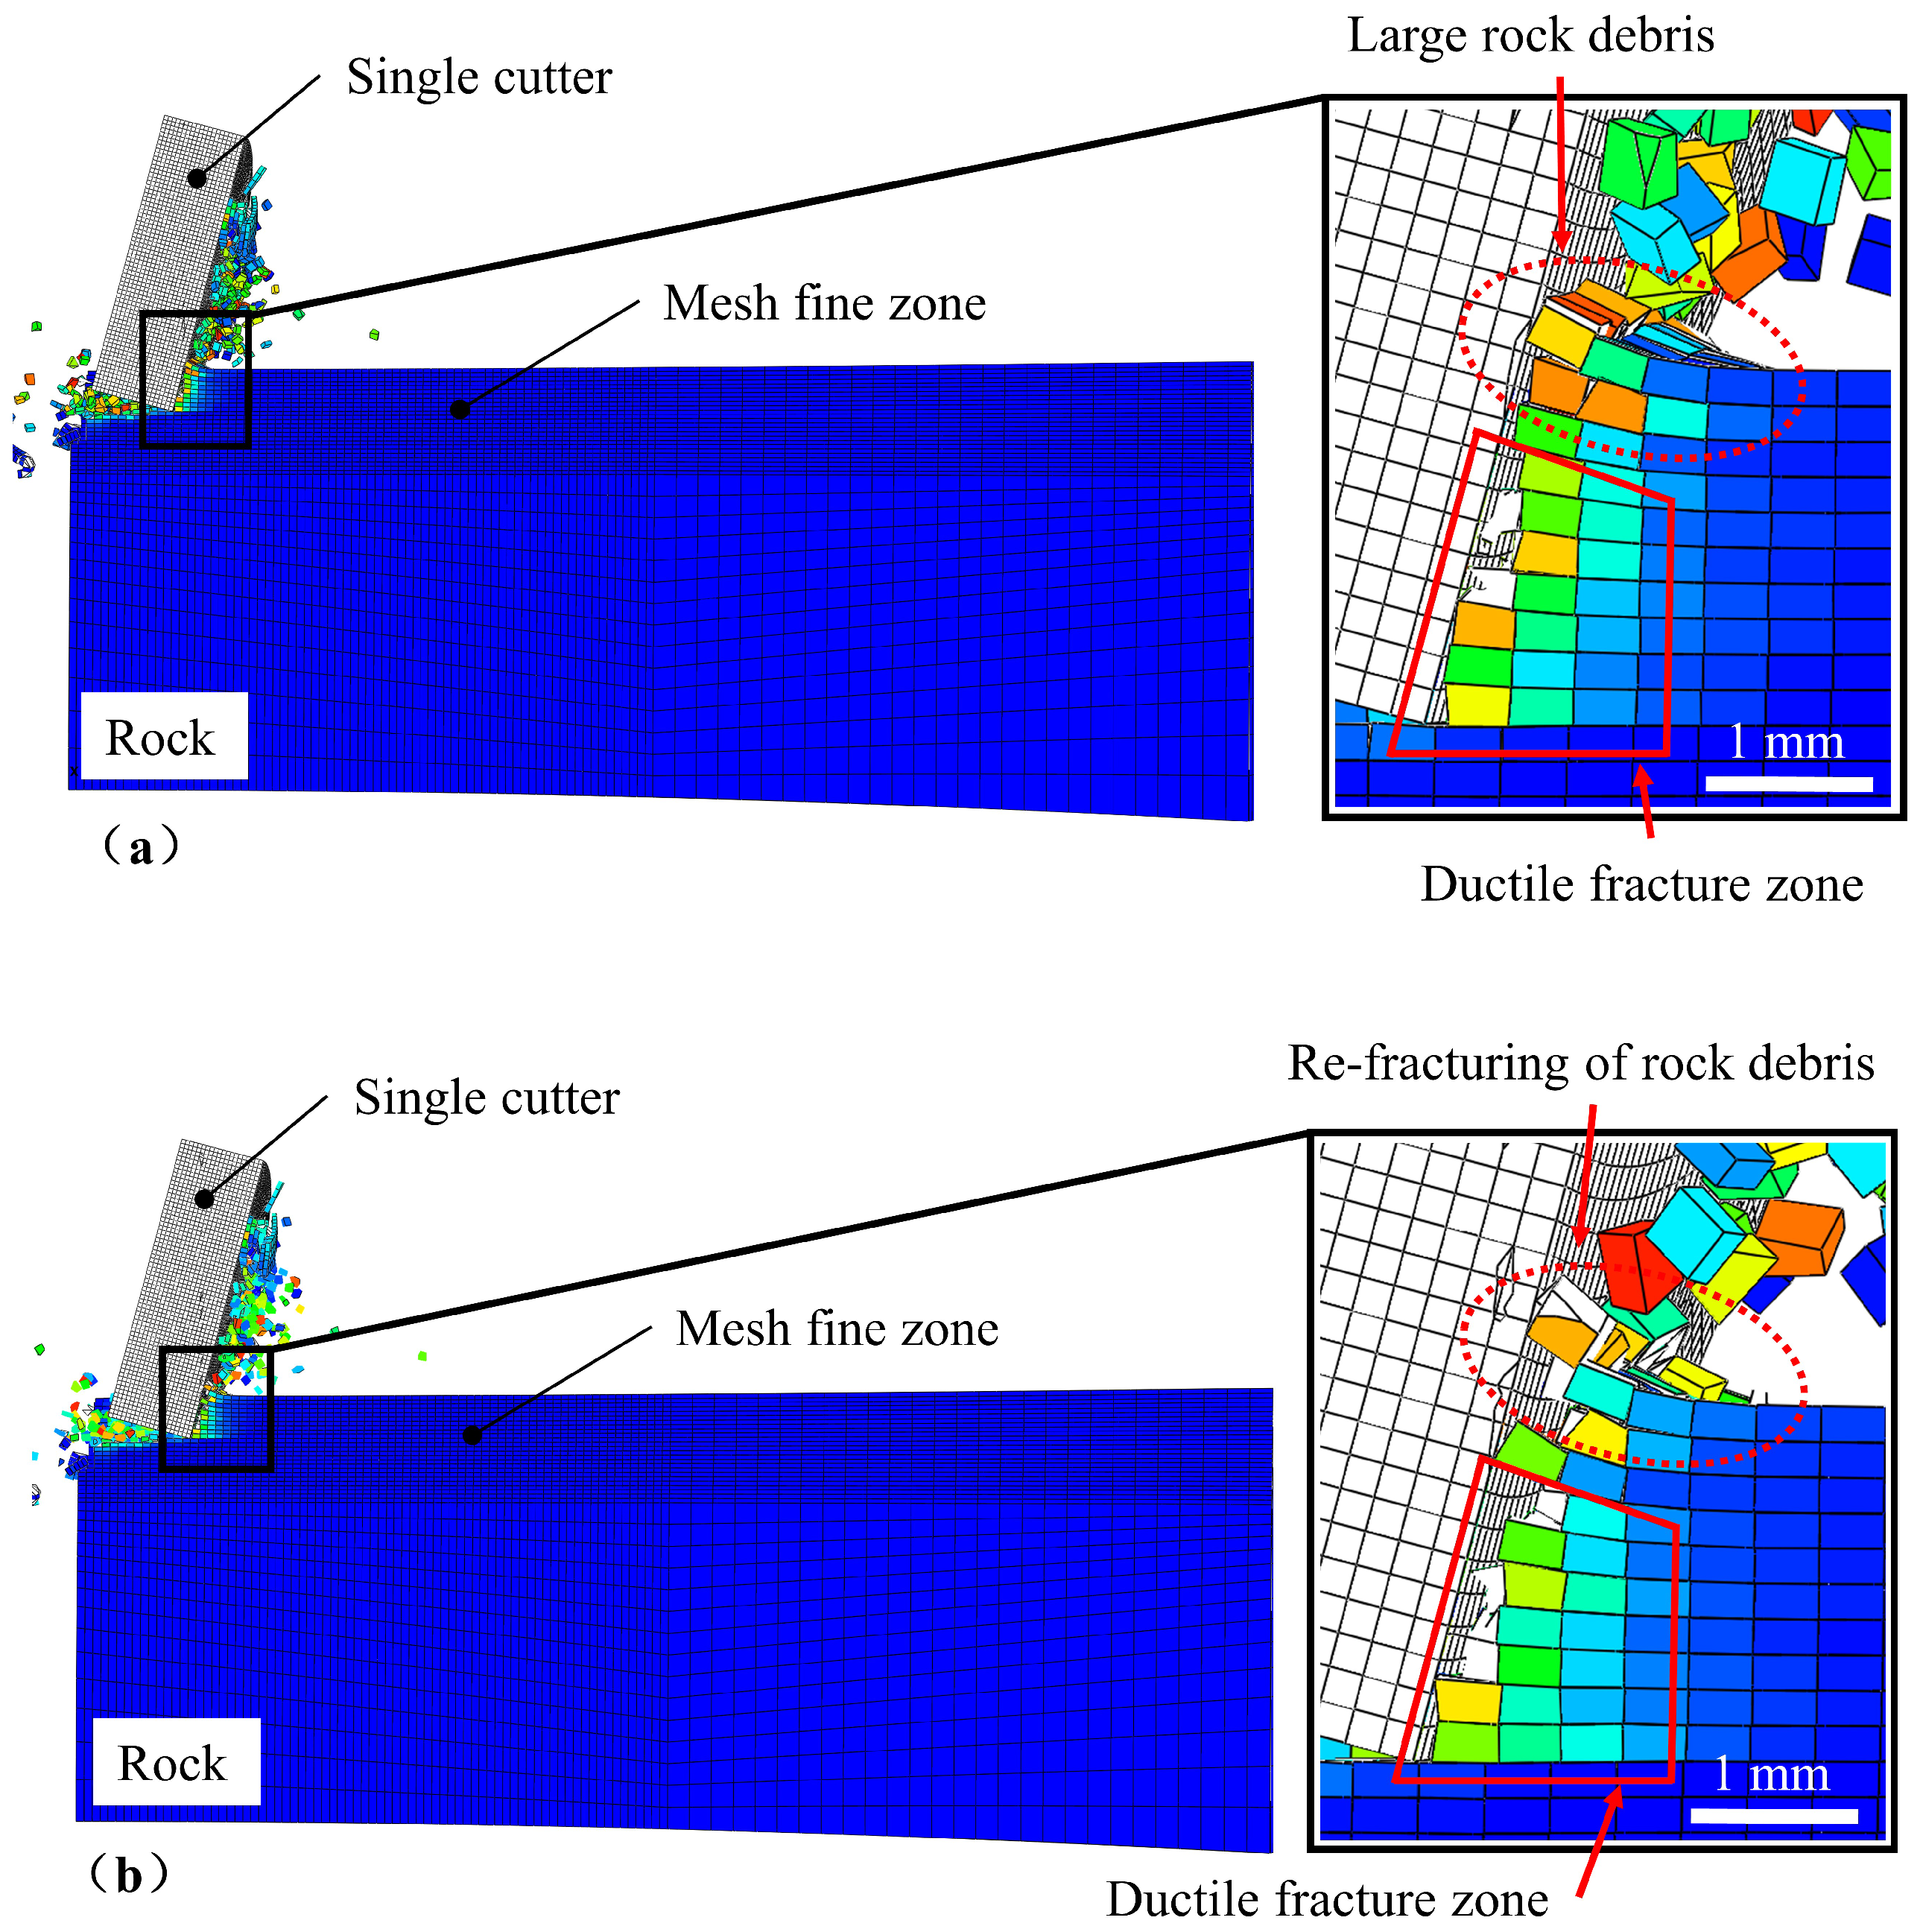
Figure 10 are nephograms of the equivalent plastic strain (PEEQ) of the rock in rock-breaking. The equivalent plastic strain shows the condition and historical cumulative value of the plastic deformation of the rock.
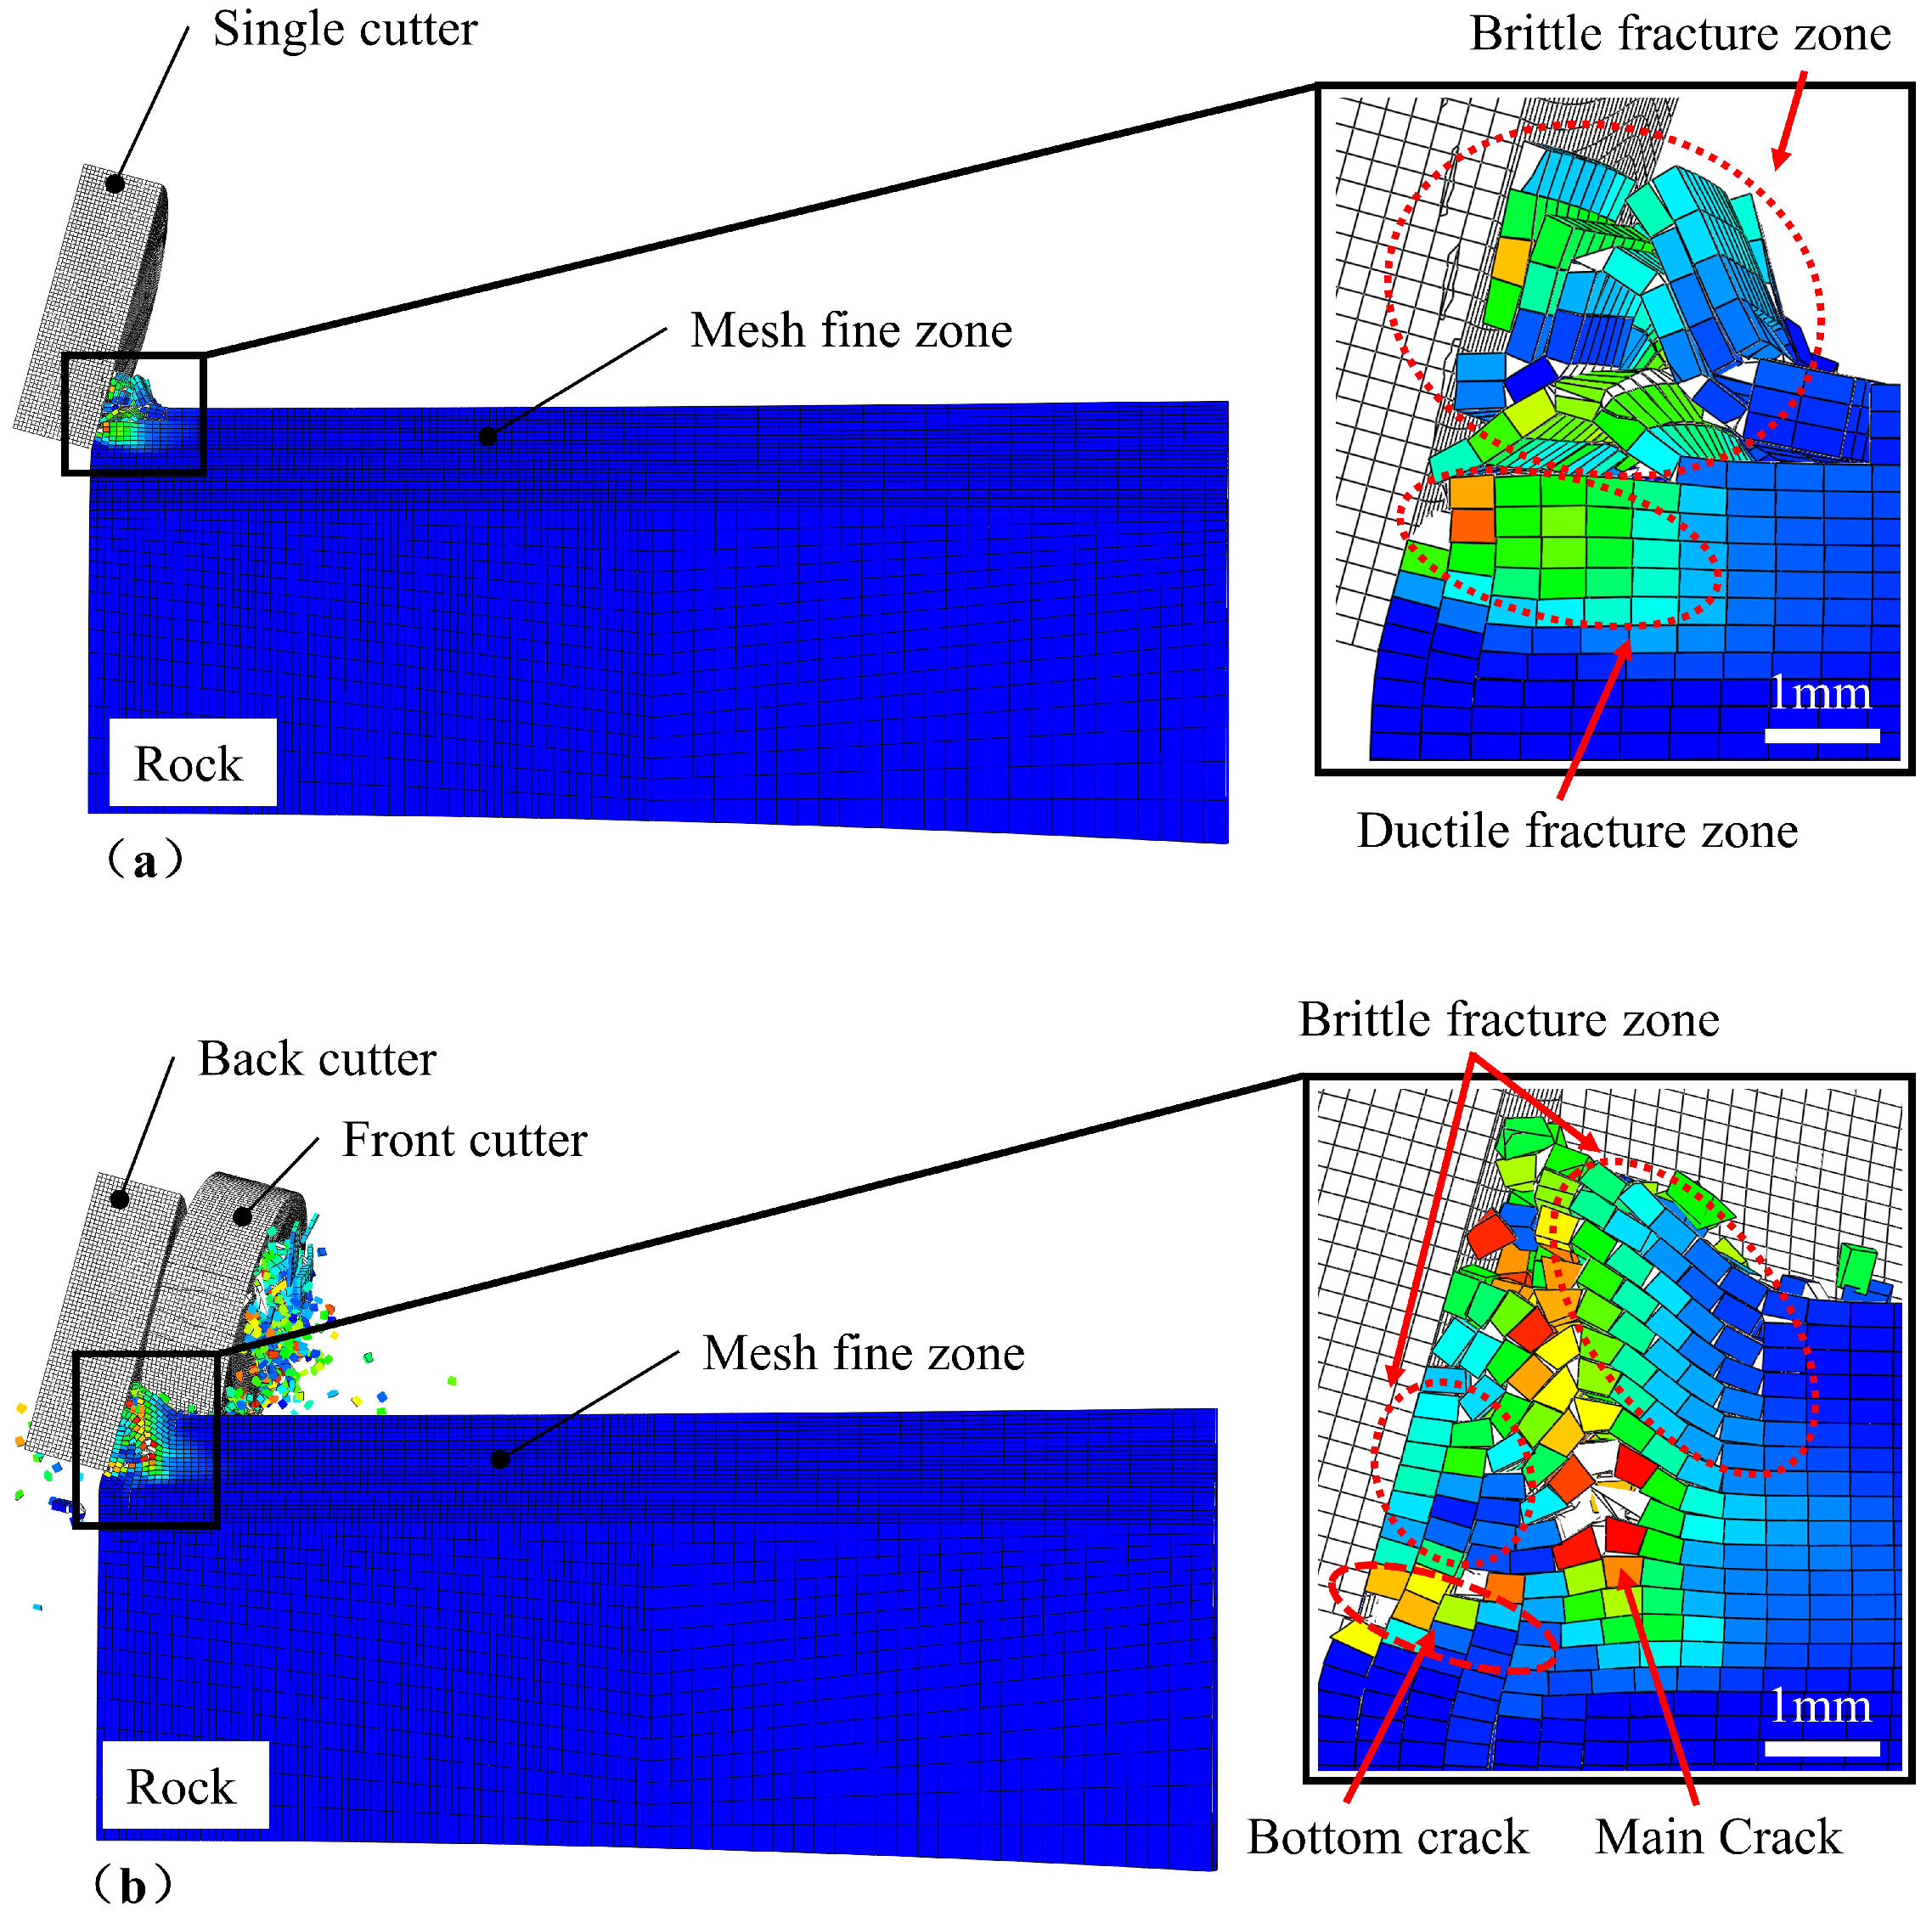
Figure 9 shows the PEEQ distributions of the rock in the process of single-cutter cutting. When the single-cutter enters the stable cutting, the part close to the surface will produce cracks parallel to the cutting direction, forming large pieces of cuttings. The rock near the bottom of the rock layer is crushed, forming a plastic fracture zone.
As the cutting process continues, the drill cutter will crush the large rock cuttings on the surface, which usually consumes energy and reduces the rock-breaking efficiency. Furthermore, the plastic failure of rock over a wide area can result in elevated energy consumption and decreased efficacy during the process of rock crushing.
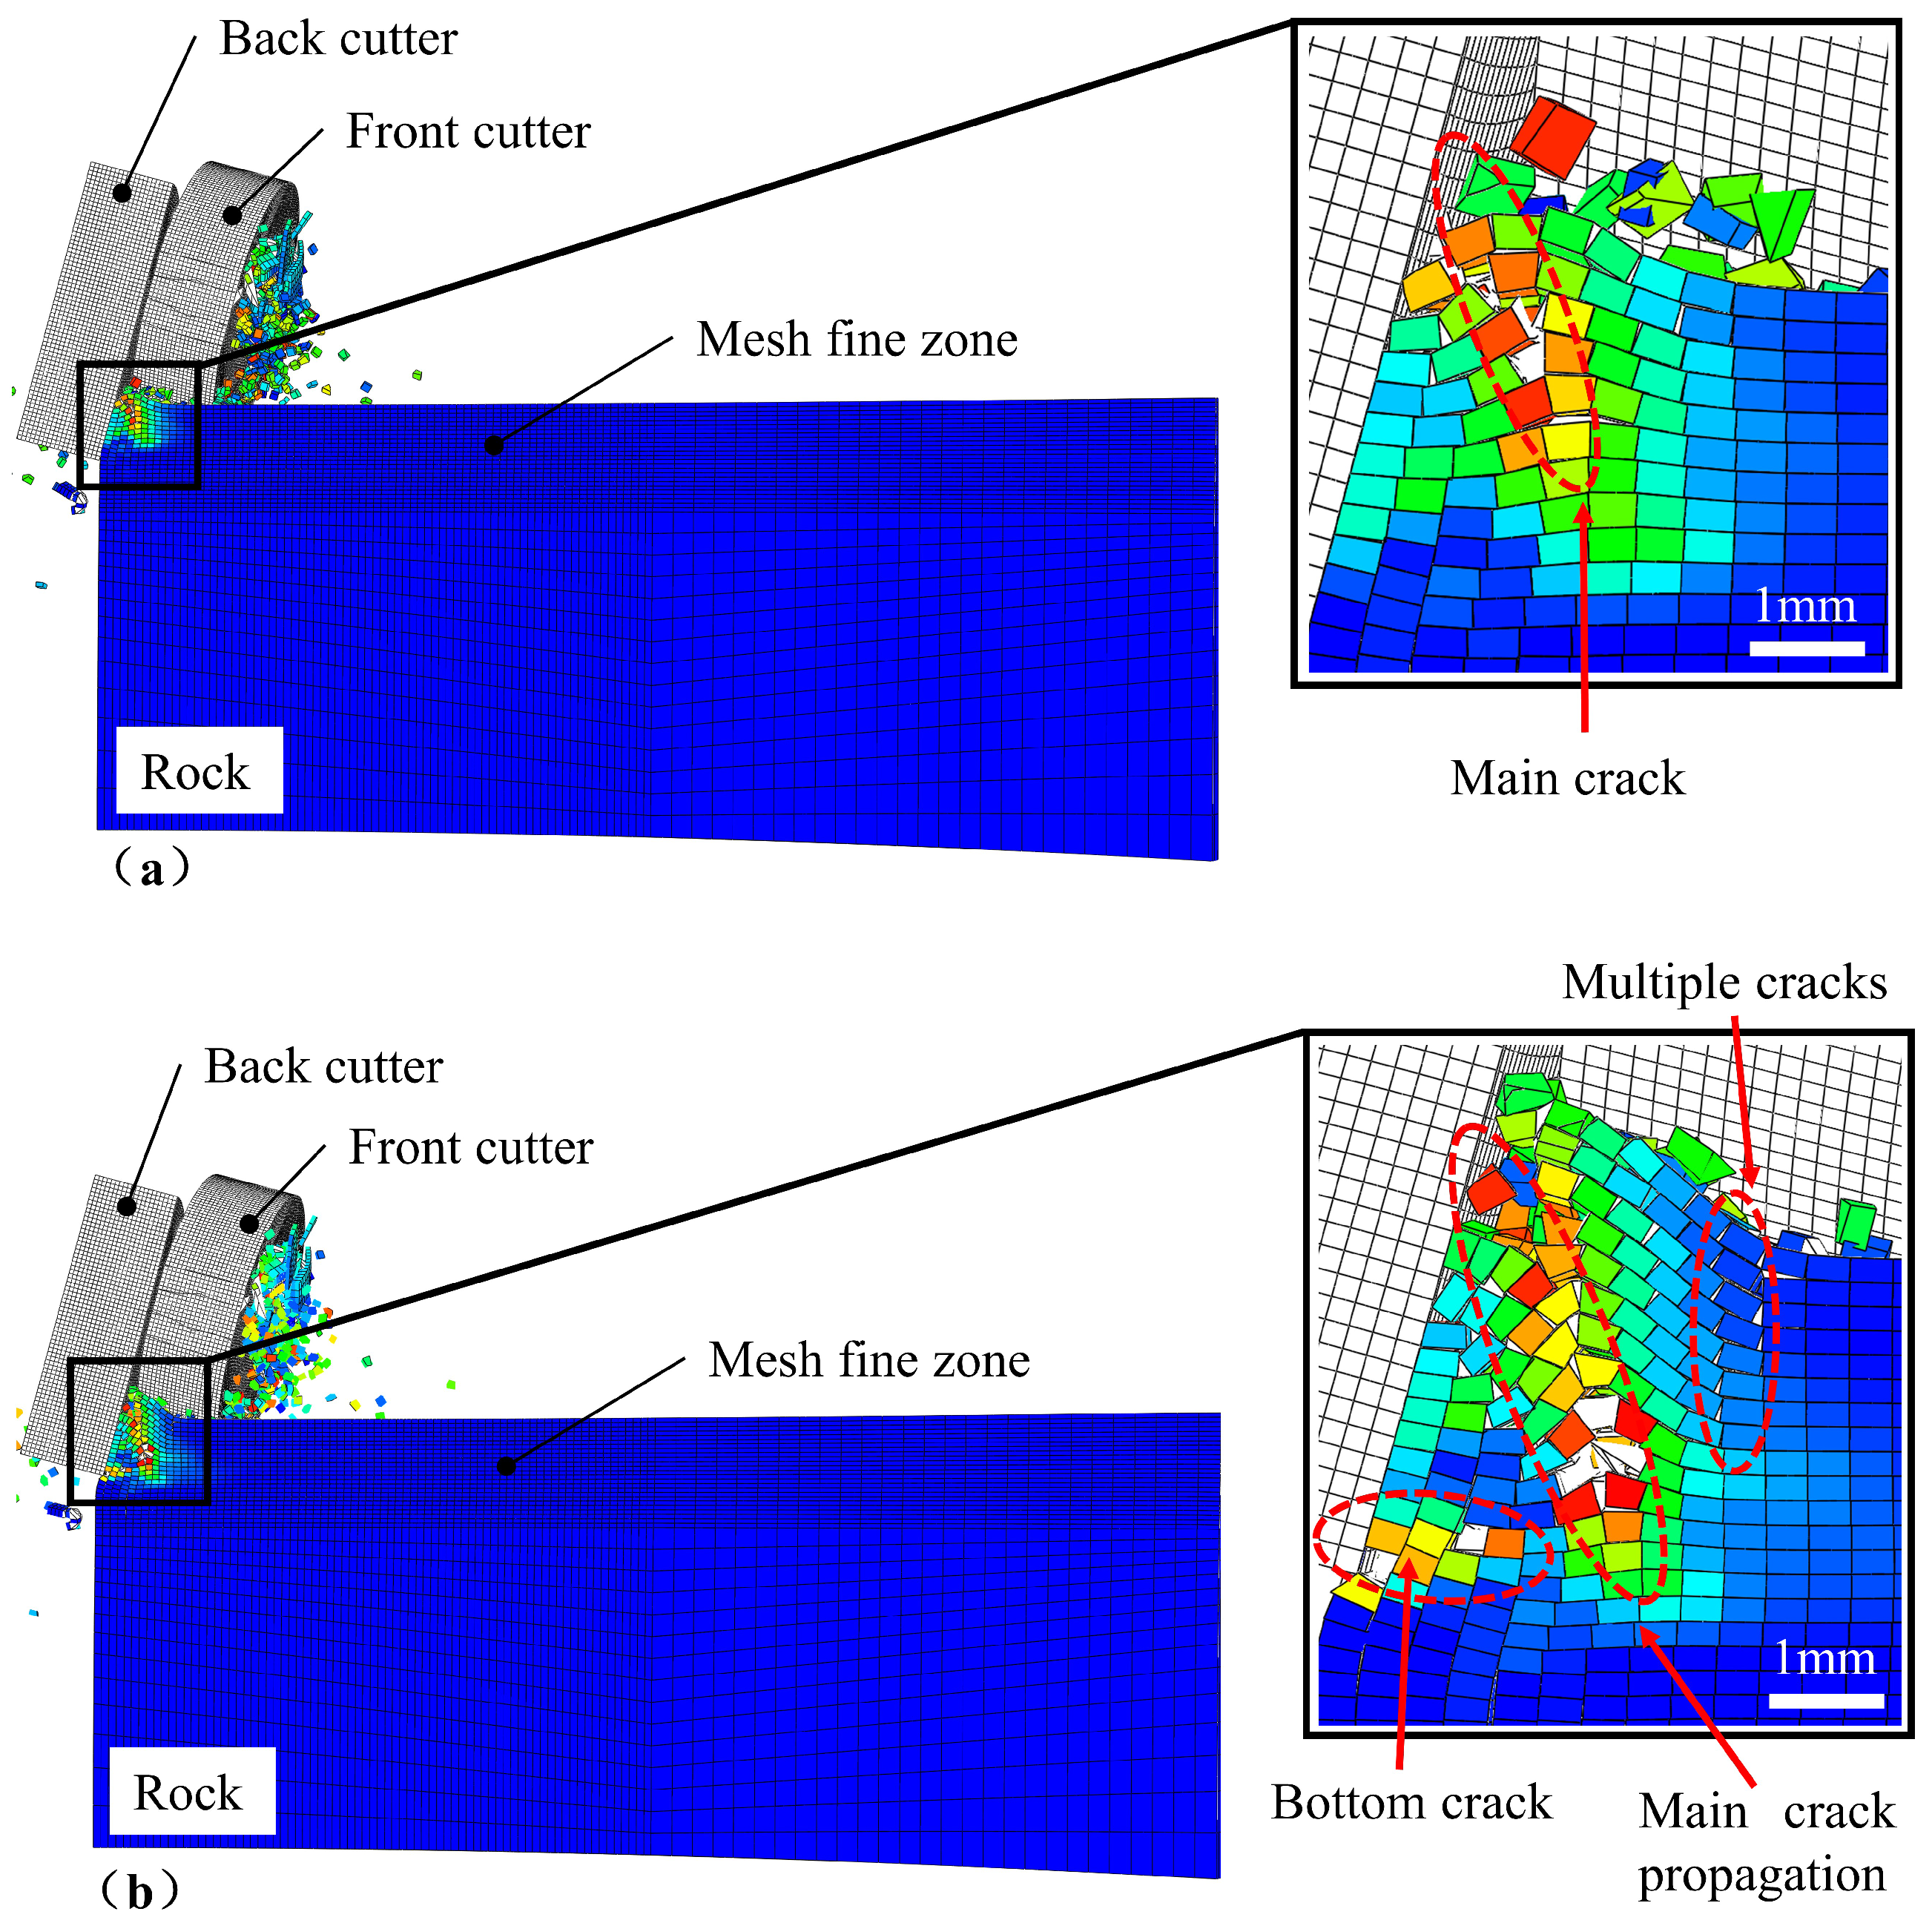
Figure 10 shows the PEEQ nephogram of rock in the rock-breaking process of dual-cutter cutting. The rock-breaking process of the front cutter of dual-cutter cutting is similar to that of single-cutter cutting, and the back cutter is different from that of single-cutter cutting. After analyzing the rock-breaking process of the back cutter, it shows that with the drill cutter squeezing the rock, the rock before the drill cutter forms a main crack extending from the rock surface to the deep. As the main crack expands, the rock in front of the cutter splits into two distinct brittle fracture zones. As the rock-breaking process continues, a bottom crack parallel to the cutting direction is formed at the bottom of the broken area at the back of the main crack, and some cracks perpendicular to the cutting direction are formed in the rock in front of the main crack. These cracks continue to expand and penetrate, forming large pieces of rock. In this way, the rock has continuous cutting.
Figure 11 compares the difference between single-cutter cuts and dual-cutter cuts. In single-cutter cutting, the surface of the rock in front of the cutter is a brittle failure, and the deep rock is a plastic failure. Large fragments of rock formed by the brittle failure of the rock surface will produce repeated failures under the compression of the drill cutter. During the dual-cutter cutting process, the grooves formed by the front-cutters change the stress state of the rock surface, and residual plastic strain is also generated in the rock near the grooves. When the back cutter cuts along the spine in the middle of the two grooves, it can considerably reduce the consumption of cutting force and cutting energy, improve the energy utilization of rock breaking, and increase the efficiency of rock breaking. The shape of the crack produced by the back cutter during the dual-cutter cut also differs from that of the single-cutter cut. The difference that can be clearly observed is that a wide main crack will be formed in the direction of the cutting direction at an angle of about 60°, and there is a brittle failure area before and after the main crack. The brittle failure zone in front of the main fracture will generate multiple fractures perpendicular to the cutting direction as the bit progresses, and these fractures will spread through the rock surface to form large pieces of rock debris. The bottom of the brittle failure zone at the back of the main crack will form a bottom crack with the advance of the drill cutter, and the expansion of the bottom crack will intersect the main crack, thus forming a large piece of rock debris in the rear brittle failure zone. Compared with single-cutter cutting, two-cutter cutting can form a larger brittle failure area, and the probability of repeated breakage of cuttings is also more negligible. Thus, two-cutter cutting can improve drilling efficiency.
3.2. Influence of Horizontal and Vertical Offset Distance between Two Cutters
According to previous studies, changes in the horizontal and vertical offset distances of the back cutter would affect the MSE. To further investigate its effect on the MSE, simulation studies have been performed at different offset distances. The definitions of horizontal and vertical offset distances are shown in
Figure 12. In order to eliminate the influence of the drill cutter diameter and cutting depth of the front cutter on the results, the horizontal offset coefficient is obtained by dividing the horizontal offset distance by the drill cutter diameter, and the vertical offset coefficient is obtained by dividing the vertical offset distance by the cutting depth of the previous cutter.
This section calculates and plots the MSE values for horizontal offset coefficients of −0.5, 0.0, and 0.5; vertical offset coefficients of 0.2, 0.3, and 0.5, respectively. It should be noted that the horizontal offset coefficient −0.5 corresponds to the outward offset distance of the back cutter to 0.5 times the drill cutter diameter, the coefficient 0.0 corresponds to the zero offset distance relative to the front cutter, and the coefficient 0.5 corresponds to the inward offset distance of the back cutter to 0.5 times the drill cutter diameter. It should be pointed out that the inward and outward offset here is relative to the front cutter. The distance between the back cutter and the rotation axis is greater than the front cutter for the outward offset, and the reverse is the inward offset. The vertical offset coefficients of 0.2, 0.3, and 0.5 indicate that the downward offset distance of the back cutter is 0.2 times, 0.3 times, and 0.5 times the depth of the front cutter.
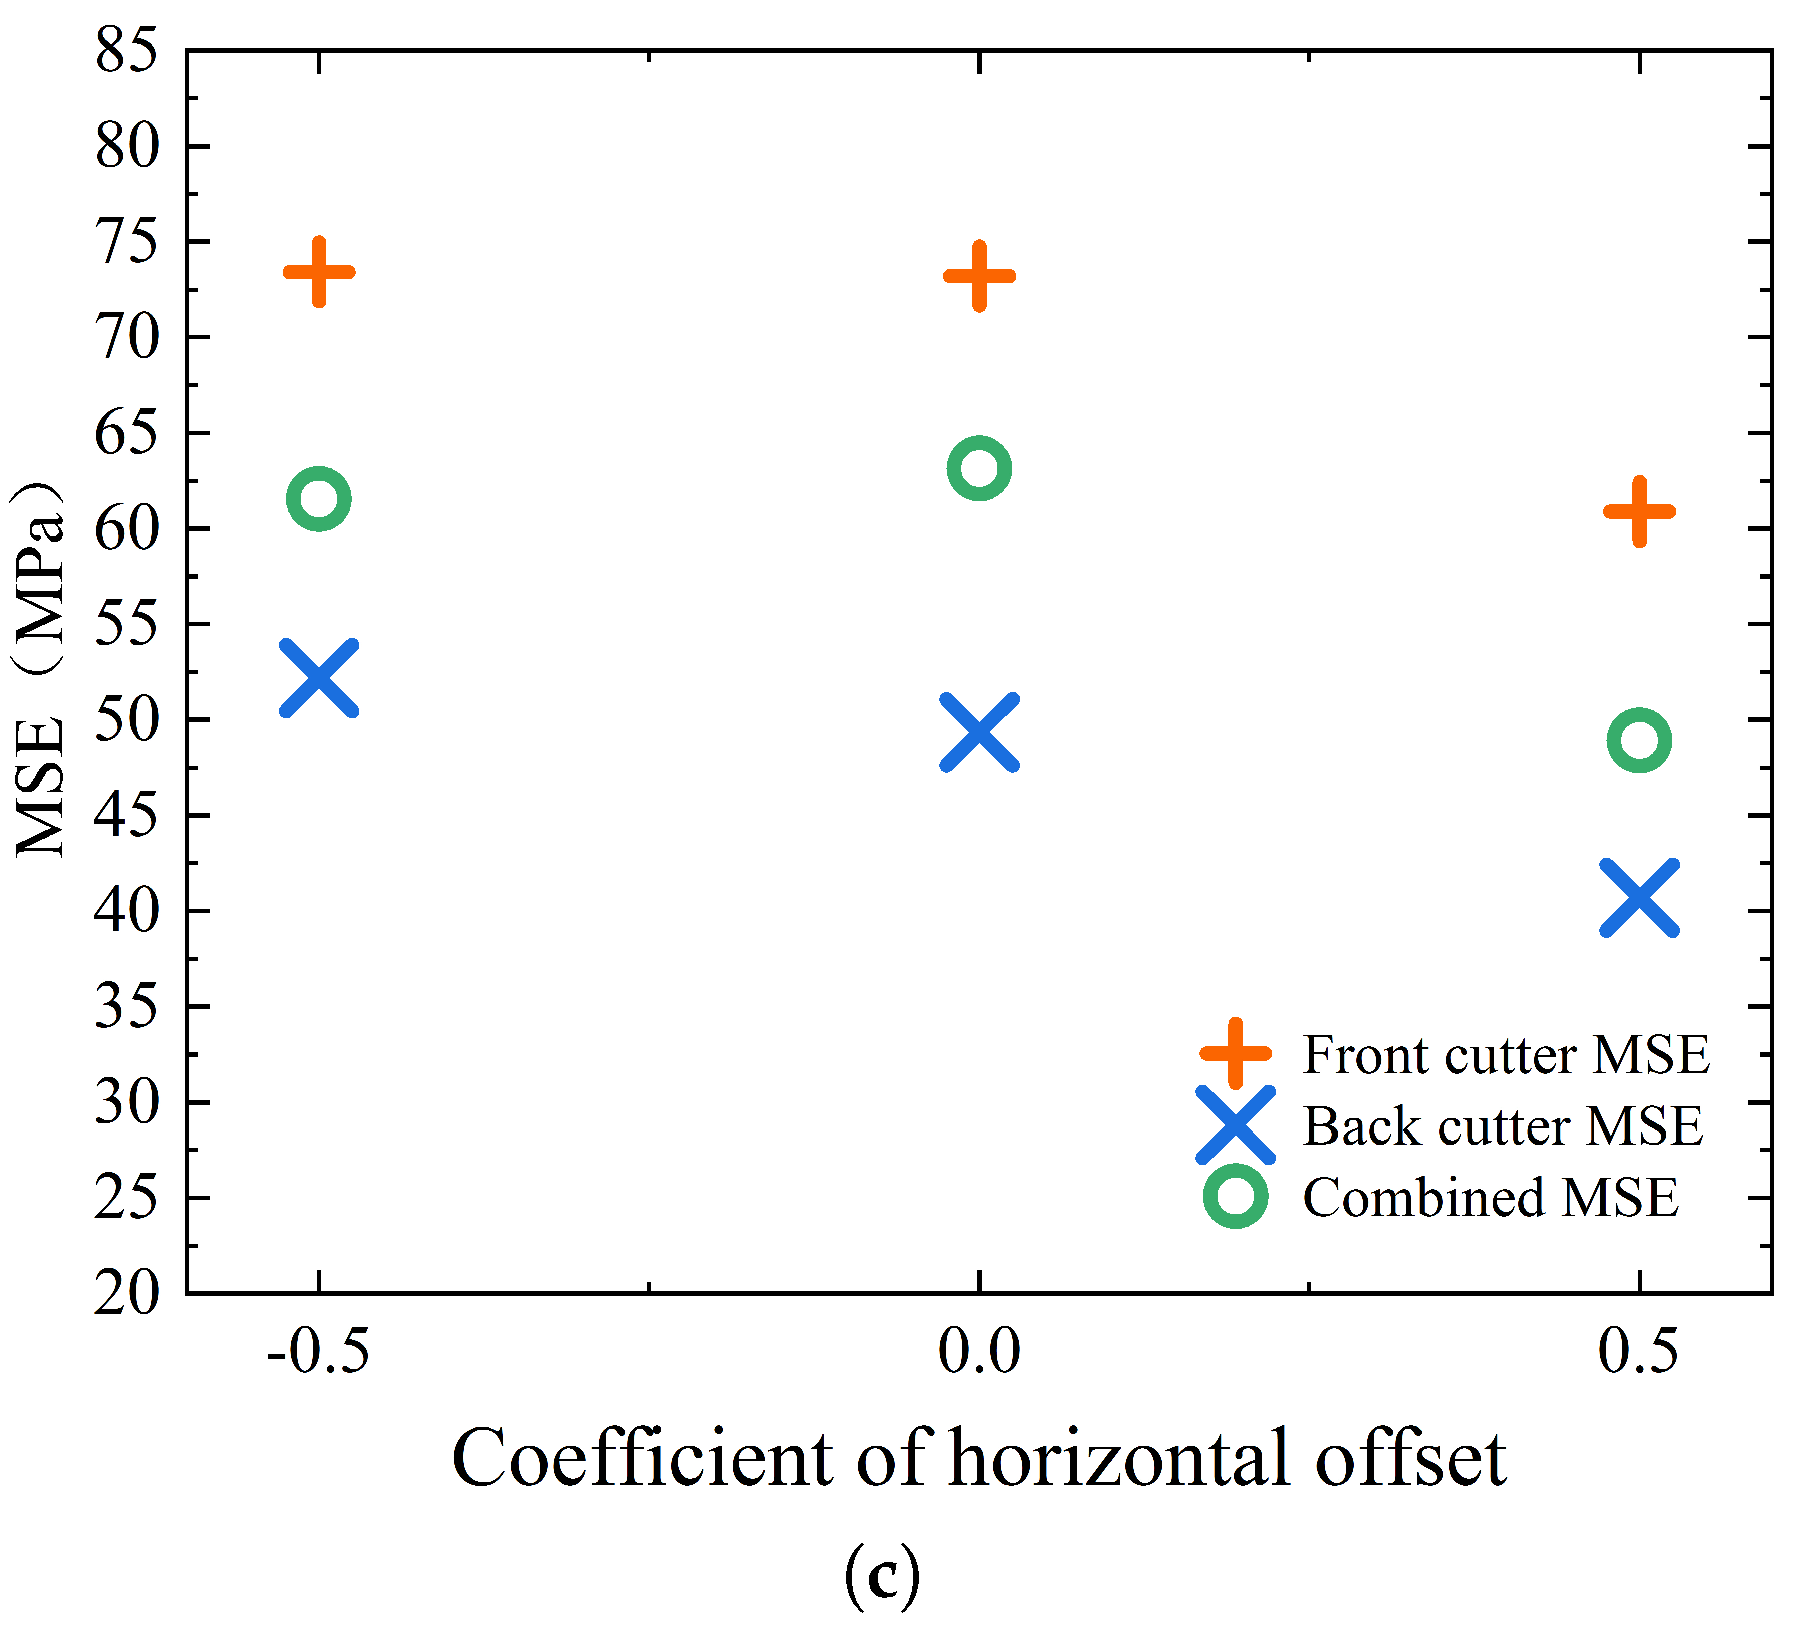
Figure 13a–c, respectively, show the relationship between MSE and horizontal offset coefficient when the vertical offset coefficient is 0.1, 0.3, and 0.5. The analysis shows that under the three vertical offset coefficients, the combined MSE mostly remains unchanged when the horizontal offset coefficient is between −0.5 and 0.0. The combined specific work decreases significantly when the horizontal offset coefficient ranges from 0.0 to 0.5.
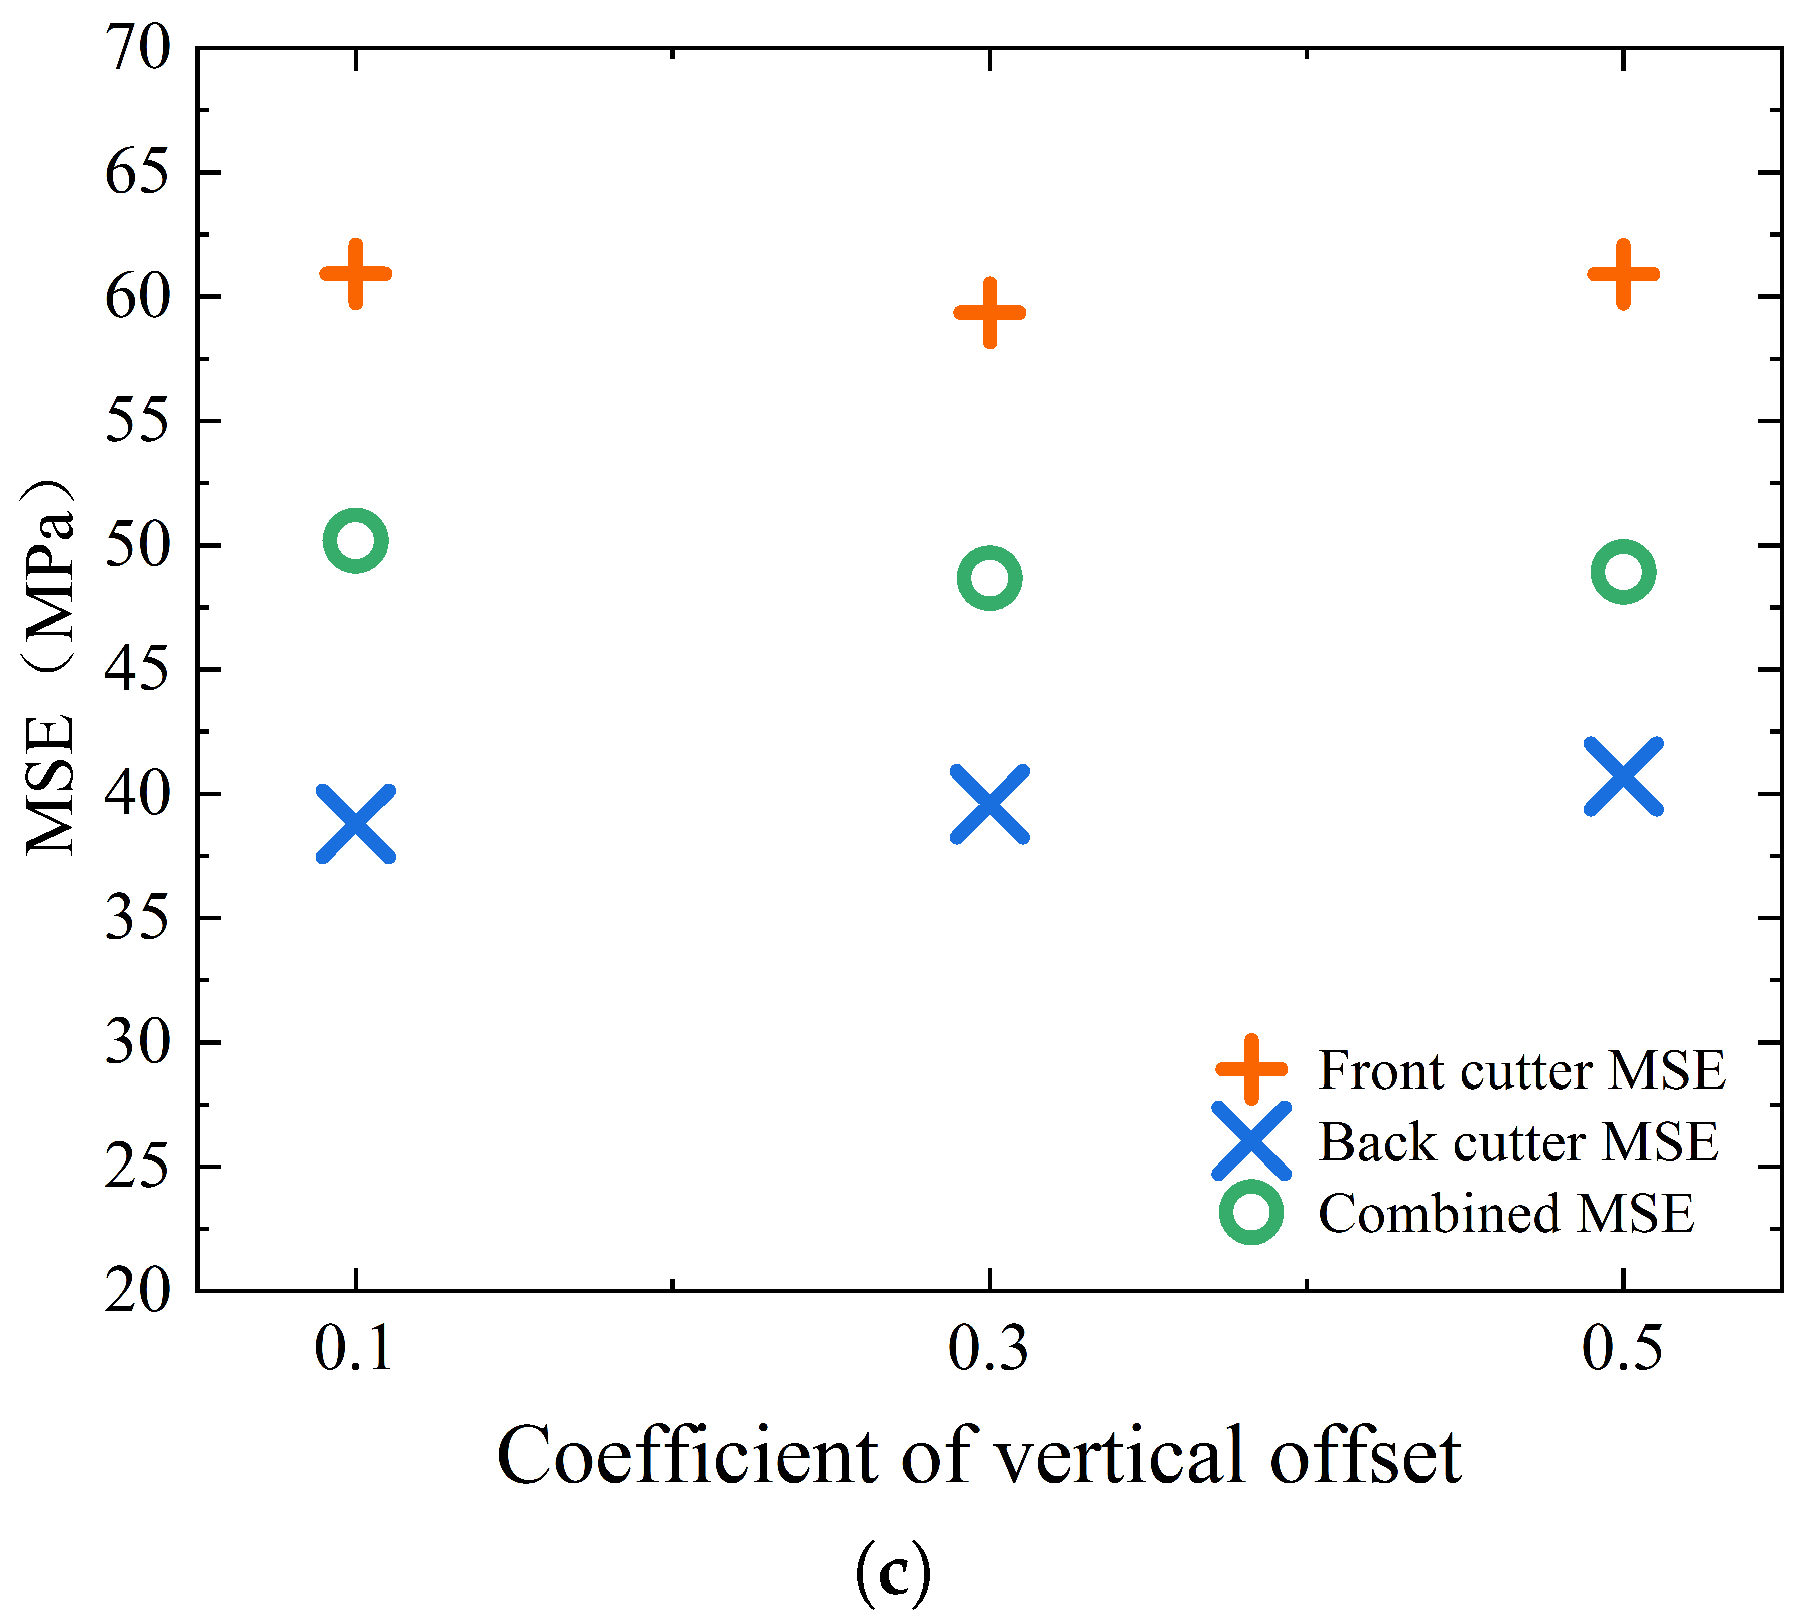
Figure 14a–c, respectively, show the relationship between MSE and vertical offset coefficient when the horizontal offset coefficient is −0.5, 0.0, and 0.5. It can be found that the vertical offset coefficient has a minor effect on the MSE and does not change mainly with the shift of the vertical offset coefficient. Only when the horizontal offset coefficient is −0.5 (
Figure 14a) does the MSE value change significantly with the vertical offset coefficient. The minimum value is obtained when the vertical offset coefficient is 0.3.
3.3. Layout Optimization for the Dual-Cutters
3.3.1. Relationships between the Offset and MSE Based on Response Surface Methodology
The effects of horizontal and vertical offset on the rock-breaking MSE have been summarized phenomenologically in the previous sections. However, the inherent mathematical relation between them has not yet been investigated. The response surface methodology (RSM) here is applied to further explore the mathematical relationship between the MSE and the horizontal as well as vertical offsets.
Response surface methodology (RSM) is a statistical method to create an approximate pattern of complex phenomena using sampling points in the design space based on an improved stochastic process. By constructing a hyperbolic model of continuous variables, the main effects and interaction effects of different factors can be considered to find the quantitative law between the test index and each factor and determine the optimal range of test levels [
38]. Compared with other test methods, the response surface method has the advantage that it can obtain better results through fewer test times and reduce the input of time and material resources [
39]. Response surface methodology is also helpful in dealing with the problem of a multi-variable fitting process [
40]. According to the results analyzed in
Section 3.2, the horizontal and vertical offset coefficients of the drill cutter were selected as the test factors, and the MSE of rock breaking was selected as the response value. A two-factor and three-level (shown in
Table 3) response surface test was designed, and the determined test factors and levels are shown in
Table 4.
Table 5 gives the response surface variance analysis result. As can be observed, the
p-value of the response surface test designed this time is 0.0003 < 0.05, indicating that it has reached a significant level and has statistical significance. The model fit is shown to be acceptable, and the experimental design is reasonable.
Based on the results in
Table 5, the data was analyzed, and the test factors and response values were fitted by quadratic multinomial regression. The regression equation for this test is given in the following equation:
where
is MSE, variable
A is the vertical offset coefficient, and variable
B is the horizontal offset coefficient. The Equation (
25) could be visualized and displayed as in
Figure 15 below.
3.3.2. Cutter Layout Optimization through Gray Wolf Algorithm
The Gray Wolf optimization algorithm, which models the wild predation behavior of the gray wolf population, is a population-wise optimization algorithm. By extracting characteristics of wolf pack activities and behaviors, individual members of the wolf pack can be divided into alpha wolves, beta wolves, and
wolves, which are subordinate to
and
levels, and the hunting of gray wolves is divided into finding, tracking and approaching prey when hunted and surrounded, the prey ceases to move. The algorithm flow is shown in
Figure 16 below.
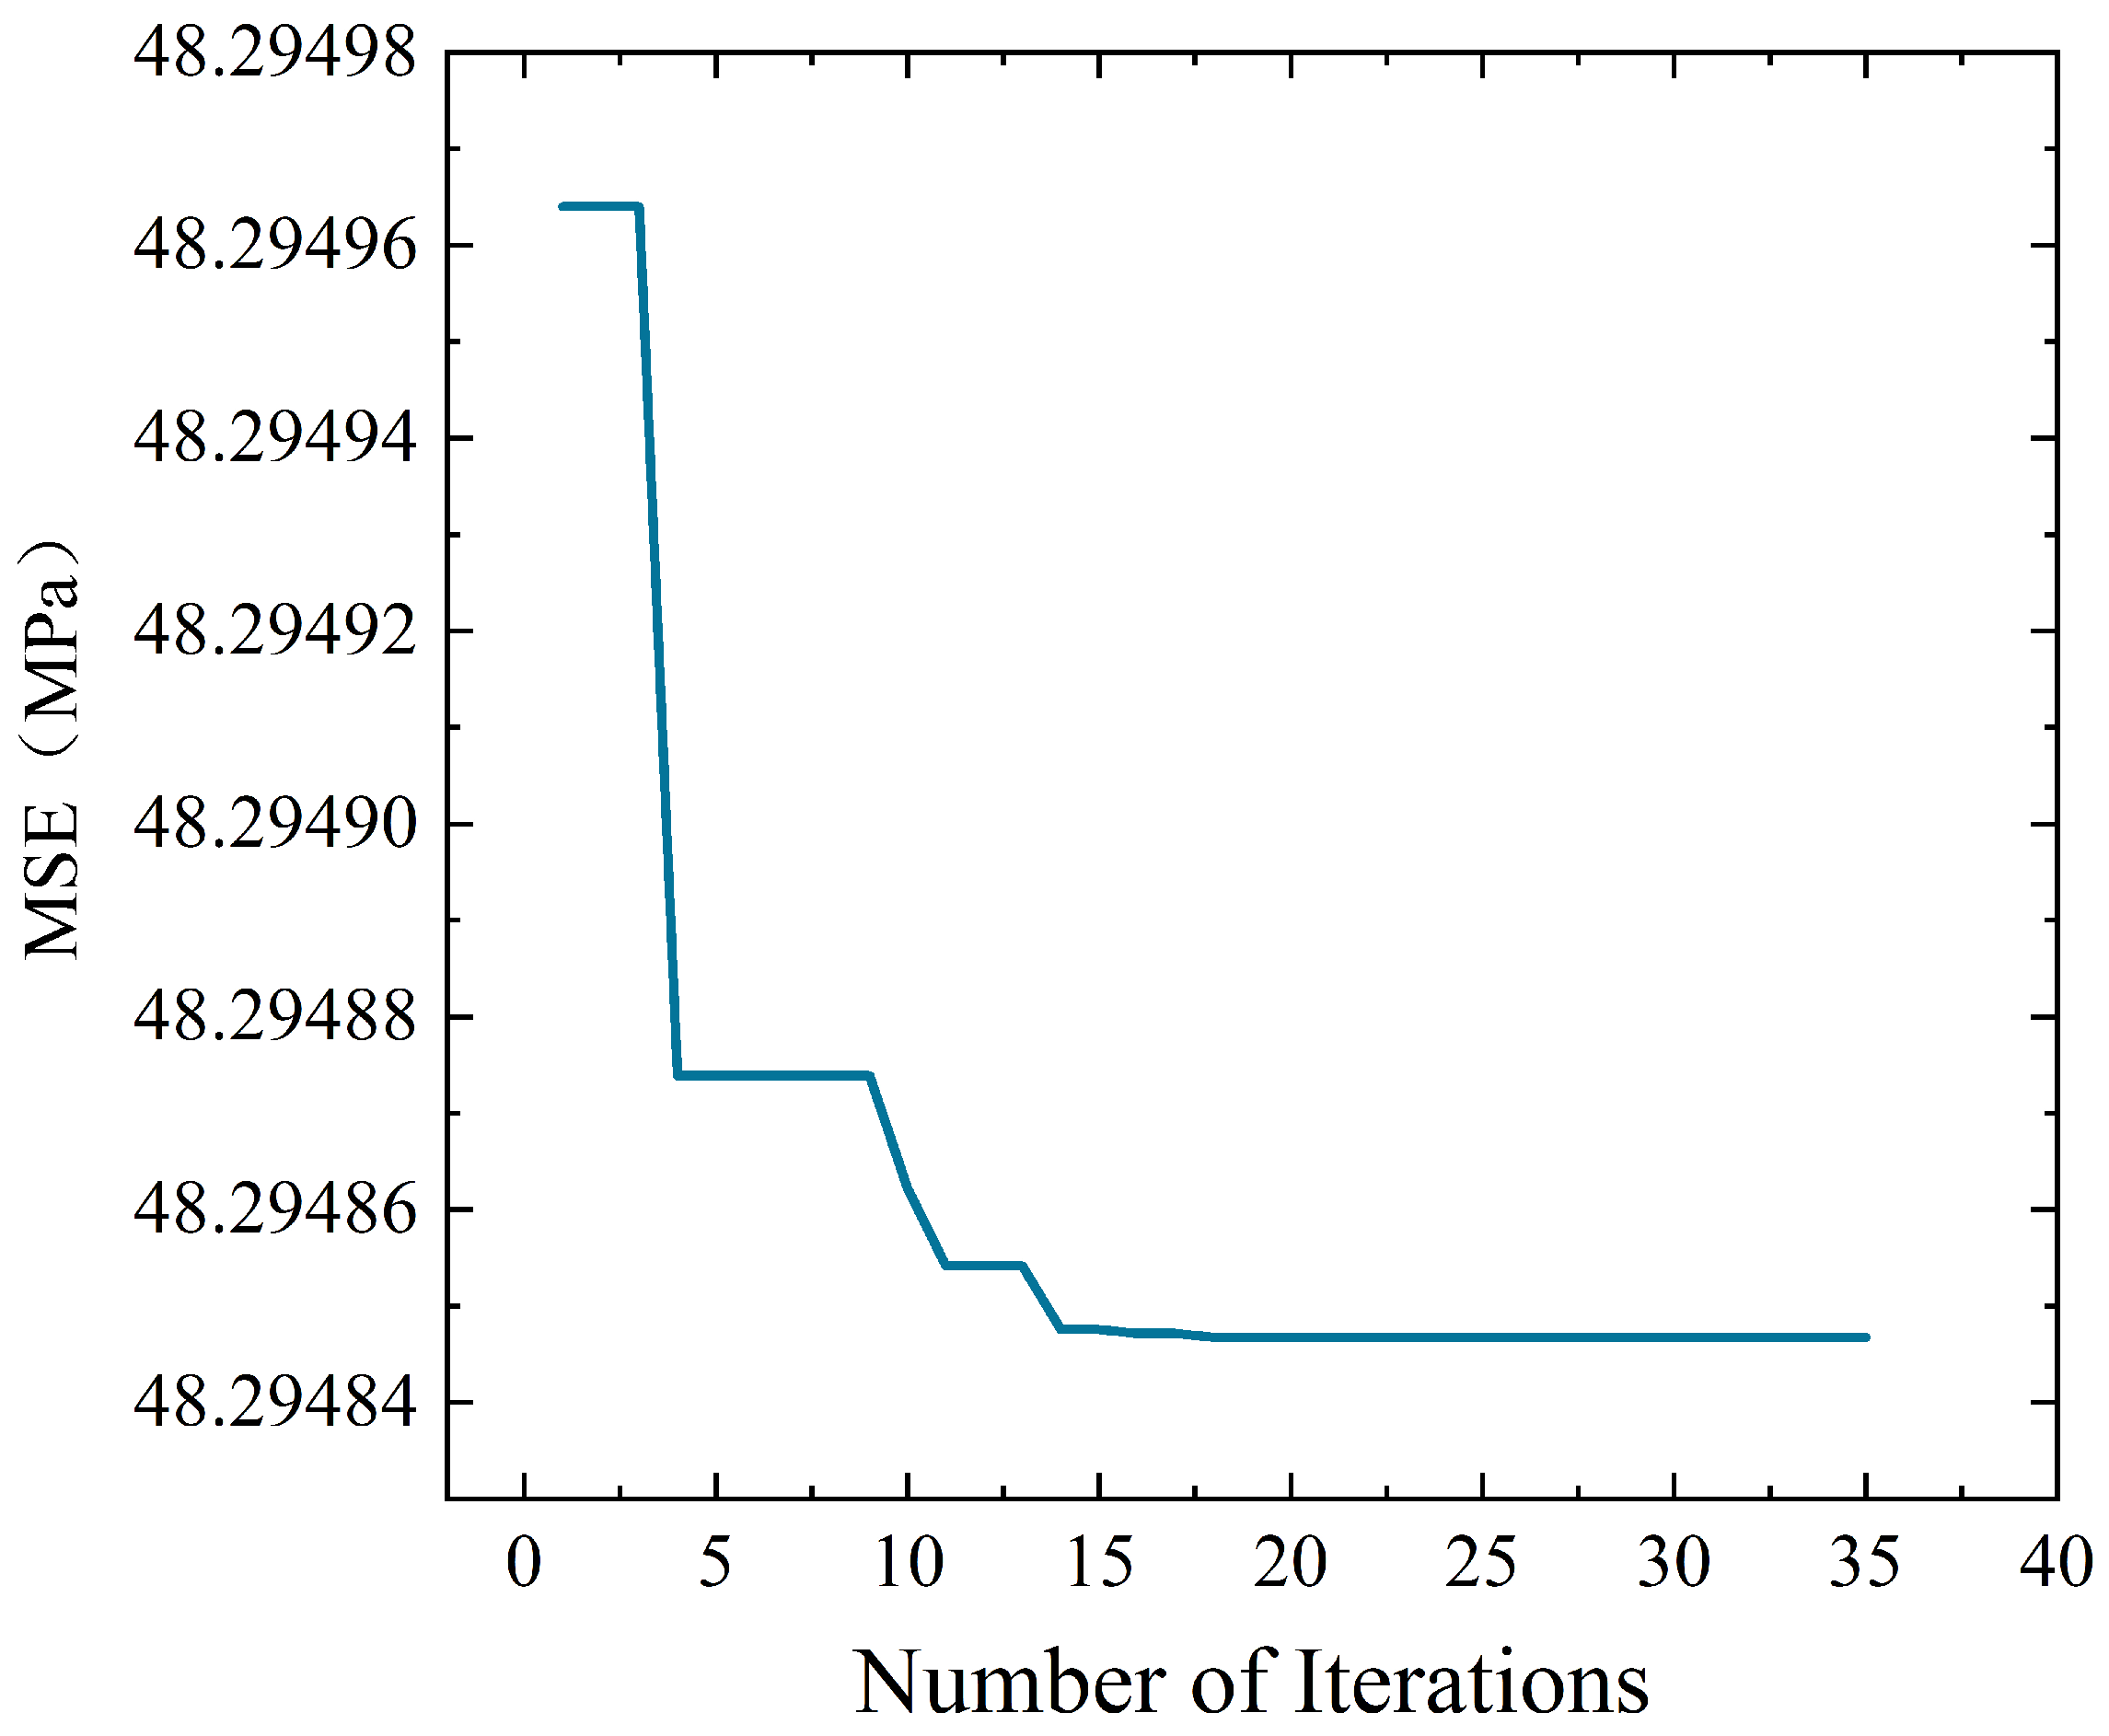
As shown in
Figure 17, the curve of MSE values approaches the level after about 20 iterations, indicating that the optimal value has been reached by this time. The optimal parameters are given in
Table 6. The optimal vertical offset coefficient is 0.641, and the optimal horizontal offset coefficient is 0.497.
3.3.3. Comparison in Field Tests
Based on the above optimized results, a new type of drill bit with a dual-cutter was developed and applied for three adjacent wells, namely Wells A, B, and C. These wells are located on the Shaximiao Formation [
41] and Shaximiao–Liangshan Formation [
42] in Sichuan, China. Field tests were carried out in Well A by our cooperative company by comparing it with its former single-cutter bit. Other conditions are barely the same except for the drill bit. Only a qualitative comparison could be made here based on the data we could obtain. Some other details are not available due to the requirement for confidentiality.
The ROP (Rate of penetration) is used to compare the performance. The drilling tools were lowered into the well and drilled according to conventional drilling methods, and the drilling footage and mechanical drilling speed were recorded during the test. The drilling footage was obtained by measuring the total length of the drilling tools lowered into the well. In addition, the ROP, namely the mechanical drilling speed, could be calculated as the footage per unit of time.
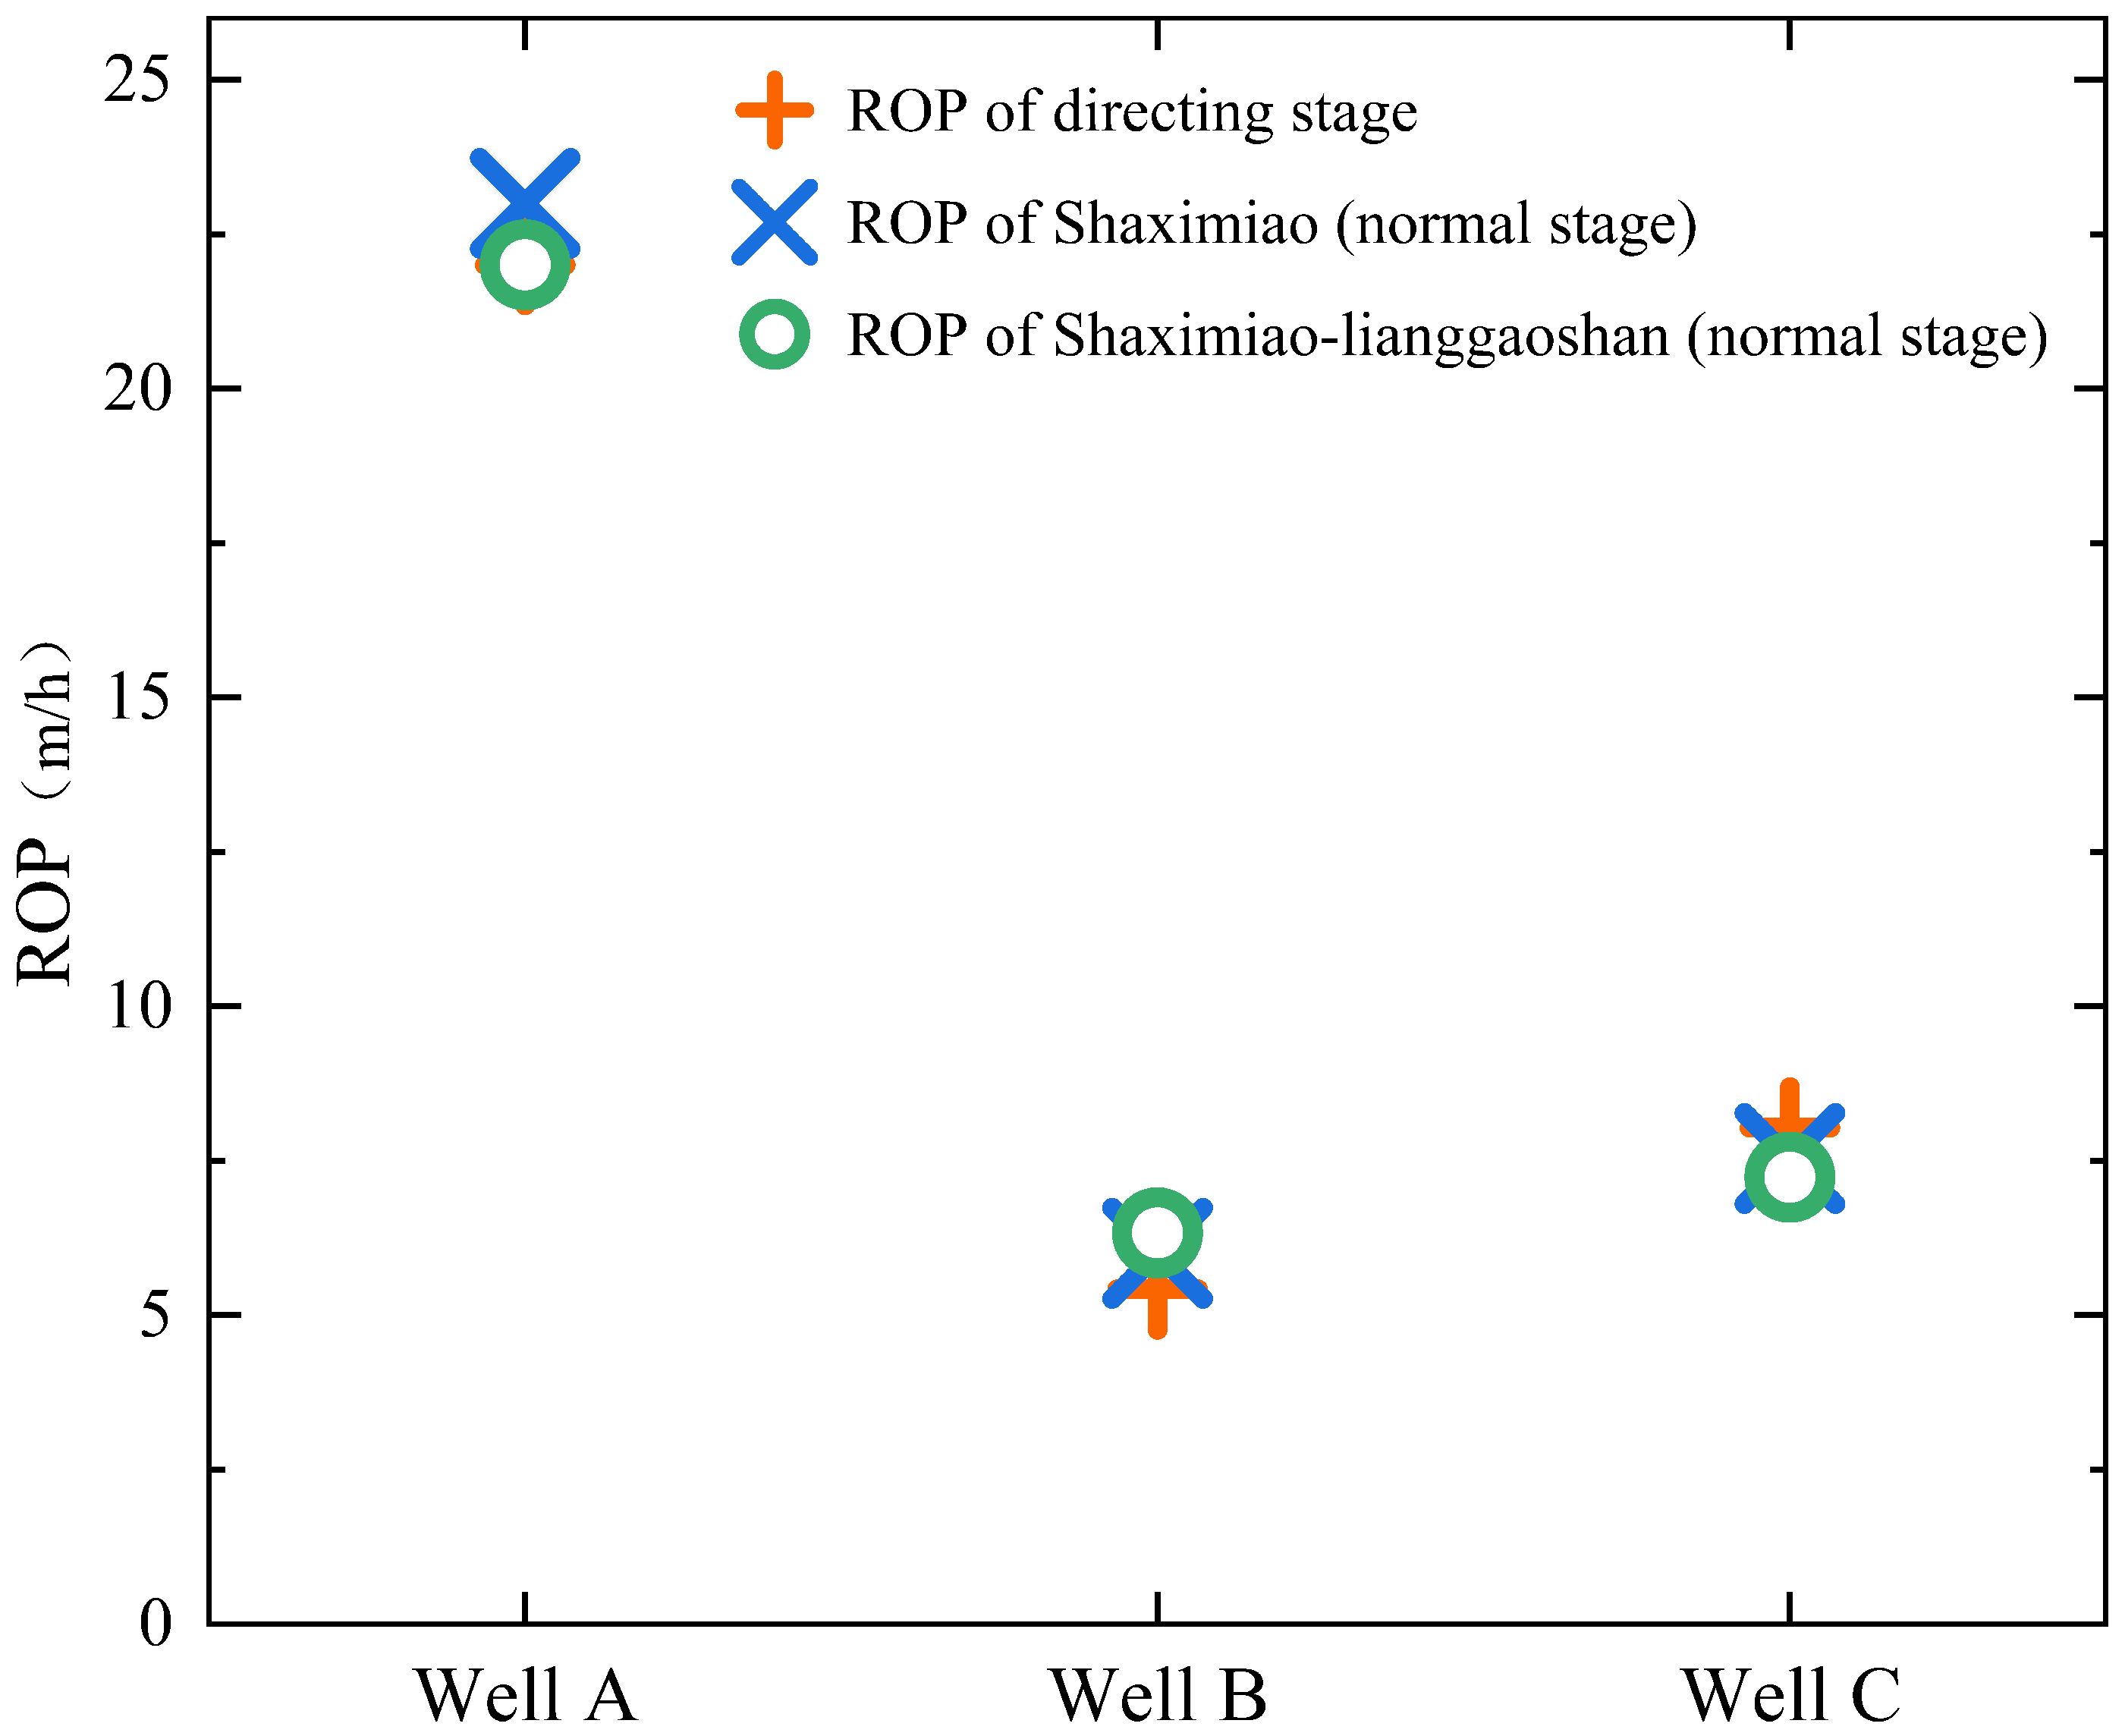
Figure 18 gives the ROPs between wells. The first run of the second drilling in Well B is located in the interval of 1998–2623 m at the Shaximiao Formation. The single trip penetration is 625 m. The average ROP in the directing stage was obtained as 5.42 m/h, and the average ROP in the whole well was 6 m/h. Additionally, the first run of the second drilling of Well C is located in the depth range of 2008–2466 m at the Shaximiao Formation, with a single run penetration of 458 m. The average ROP in the Shaximiao formation is 7.54 m/h, and the average ROP of the whole well interval is 8.04 m/h. Comparatively, the first run of the second drilling in Well A is located in the depth range of 1964 m to 2320 m at the Shaximiao–Lianggaoshan Formation. The single run penetration is 356 m. The average ROP was calculated as 22 m/h, and the averaged ROP in Shaximiao Formation is 23 m/h.
In general, the ROP in the tested Well A increased by 248% compared with the averaged ROP in the adjacent Well B (6.33 m/h) and raised by 204% in comparison to the ROP of the adjacent Well C (7.23 m/h). Therefore, it could be judged that the designed drill bit with a dual-cutter has better rock-breaking efficiency.
3.4. Advantages of the Dual-Cutter Cutting
The dual-cutter has advantages compared to a single-cutter drill bit. The foregoing study shows that after cutting, the front cutter will produce grooves on the rock surface, and a specific range of residual plastic deformation zones will occur surrounding the grooves. The groove will allow the stress of the rock surface to be redistributed under the effect of the liquid pressure and the confining pressure, resulting in the initial stress in this section of the rock being less than that in other areas. This area will shatter more readily due to the combination of the residual plastic deformation zone and the low-stress zone around the groove. When the back cutter cuts, its cutting path will partially overlap with the front cutter, which allows the back cutter to cut to the fragile region generated by the front cutter, increasing rock-breaking efficiency. For the rock crushing mode, the rock is mainly damaged by brittleness when the dual-cutter cuts and the rock debris formed is large; during single-cutter cutting, plastic failure happens mostly for the rock, and the cuttings are mainly small pieces and powder cuts. The energy is mostly used in the deformation of the rock in the case of plastic failure, whereas the energy is primarily wasted in the creation of fractures in the case of brittle failure. The varied energy consumption modalities also influence the length of the cracks created by brittle failure and efficiency. Dual-cutter cutting takes full advantage of the residual plastic deformation area and low-stress area. Brittle failure is dominant for the rock. In this way, the drilling efficiency and speed are improved.
There are still some shortcomings and limitations in the present study. It does not take into account the side angle of the front and back cutter, and the effect of repeated fragmentation of cuttings is not considered. Nevertheless, further research may be carried out on these issues.


