Abstract
The flexural performance of steel and concrete composite beams can be further enhanced by utilizing advanced construction materials such as ultra-high performance fiber-reinforced concrete (UHPFRC) and high-strength steel. In this paper, the concept of critical elastic moment resistance is proposed and the equation for its estimation is derived. It was found that the high yield strength of steel calls for a narrow UHPFRC top layer to reach the critical state, whereas this ideal condition is not realistic for composite beams with normal-strength steel and UHPFRC. Small-scale composite beams composed of both high-strength and low-strength steel materials were tested under four-point bending to verify the critical state and performance of different types of connectors. The headed studs and plate connectors were first tested through small-scale push-out tests and then implemented in the composite beam with different spacing. The connection utilizing headed studs with 150 mm spacing performed the best among the three tested specimens in helping reach the critical elastic moment resistance. Finite element analyses of the composite beam were performed based on the estimated material properties under axial and biaxial stress conditions and the results align with the experiment results.
1. Introduction
Concrete and steel composite beams are widely used in civil engineering applications, such as bridge girder-deck systems and floors for buildings. They are regarded as an economical solution compared to conventional reinforced concrete structures. An enhanced modulus of elasticity of concrete and a higher strength of steel materials usually lead to better performance of a composite system according to NIE Jianguo et al. [1]. High-strength steel with a yielding strength of over 690 MPa has been investigated for its application in beams [2], frames [3], and tabular joints [4]. Recently, ultra-high-performance fiber-reinforced concrete (UHPFRC), especially that with a compressive strength of over 150 MPa, has been investigated and used in practical applications according to Fehling et al. [5], Yoo and Banthia [6], and Saleem et al. [7]. The concrete material is usually composed of cement, silica fume, fine aggregate, and a high-range water reducer to provide the dense cementitious matrix. In UHPFRC, either steel or synthetic micro-fibers are an essential component at the material level to prevent brittle failure under compression and to ensure strain-hardening behavior under flexural loading. Zhu et al. [8] reported that the fibers in normal-strength concrete could contribute to the improvement of the stiffness, durability, and elasticity of composite decks. Fibers have also been shown to contribute to the shear resistance of UHPFRC beams Mészöly and Randl [9]. The authors tested twenty beams, and it was found that the shear resistance increase was not linear to the fiber volume fraction. It was concluded that the design approach specified in the AFGC recommendations [10] is a realistic conservative estimation. The modulus of elasticity of UHPFRC is usually higher than normal concrete and can exceed 40 GPa. Therefore, the benefits of using UHPFRC in composite beams are worth further investigation, especially when high-strength steel material is utilized.
Frames made of high-strength steel with a yielding strength of up to 890 MPa were investigated by Hu et al. [3]. In [4], a 3.0% floor drift was achieved in the cyclic loading test, despite the slender high-strength steel column failing due to severe buckling. The authors conducted static tests on high-strength steel tubular connections, applied in an electric transmission tower, to assess buckling resistances. The yielding strength of the high-strength steel reached 740 MPa in the uniaxial test of the coupon specimens. Finite element analyses were used to perform the parametric study [4]. Jiang et al. [2] investigated the stability of Q690 high-strength steel through numerical analyses. The authors concluded that both Eurocode 3 and Chinese code GB50017-2017 [11] can be used to predict column strength. Li and Young [12] investigated the residual mechanical strength of coupons made from cold-formed high-strength steel material after exposure to high temperatures of up to 1000 degrees Celsius. They proposed a new curve to estimate the strength reduction, which was also applied to hot-rolled high-strength material.
The performance of connectors between concrete and steel is critical to the structural behavior of composite beams. According to Eurocode 4 ([13]), a 50 mm clear cover for the shear stud, and a stud length-to-diameter ratio larger than 4 are required. However, these specifications do not apply to shear studs embedded in UHPFRC material (Kim et al. [14]). Kim et al. [14] investigated the behavior of headed studs through push-out tests with an ultra-high-performance fiber-reinforced concrete (UHPFRC) layer as thin as 75 mm. All specimens failed due to shear, with a peak shear force capacity of around 110 kN for a 16 mm steel stud. Moreover, all specimens failed to reach the ductility requirement of 6 mm slippage outlined in Eurocode 4 [13], which prevents the adoption of plastic design methodology. The slippage demand for plastic design is normally accommodated by the adequate deformation of the shear connectors. However, the slippage is greatly reduced due to the high stiffness and strength of the UHPFRC material. Wang et al. [15] investigated the demountable-headed stud shear connectors used in steel–UHPFRC composite structures that can be removed by unscrewing the bolts that connect the two parts. Although this type of bolt showed better ductility compared to welded studs, the slippage was still lower than the requirement outlined in the standard. The performance of the studs in composite beams was also investigated through finite element analyses. Qi et al. [16] investigated the performance of damaged studs due to corrosion or fatigue and obtained a shear strength reduction concerning the damage condition, whereas Ding et al. [17] simulated stud performance under cyclic loading. According to Xu et al. [18], the existence of fiber can increase the fatigue life of headed shear studs. However, this enhancement varies with the range of the fatigue load. More recently, He et al. [19] investigated a full-scale strip-shear-connection composite beam, which has a shear strength of over 15 MPa. Full composite action was achieved between the C50 concrete precast deck and the steel girder. Fang et al. [20] investigated a UHPC–steel composite beam using short stud connectors. Q460 high-strength steel and a UHPC composite beam bonded by an open-hole steel plate were investigated by He et al. [21]. Push-out tests and flexural bending tests were carried out. The end-bearing effects, which are associated with steel plate connectors, were identified and were found to cause degradation in the cracking resistance and bending stiffness.
Flexural responses of composite beams made of inverted T-shape girders with 50 mm and 100 mm UHPFRC top layers were investigated by Yoo and Choo [22]. The shear studs were welded to the web at a spacing of between 50 mm and 400 mm. The test results proved that the ultimate flexural load capacity is greatly affected by the spacing of the stud. The specimen with a 50 mm UHPFRC layer and 50 mm stud spacing failed due to the crushing of the UHPFRC layer, while longitudinal cracks were also observed on the top concrete surface. Such longitudinal cracks were not identified in the specimen with a larger stud spacing. Besides composite beams, concrete and steel composite slabs using high-strength fiber-reinforced concrete were investigated by Wenguang et al. [23]. The concrete layer was designed to act as an overlay for the orthotropic steel deck. It was found that for the positive moment region, the failure of the composite system was initiated due to debonding at the interfacial layer after the breakage of the chemical bond. Cracks then appeared afterward. Before reaching the ultimate load capacity, the increase in the load was proportional to the increase in the crack width. The specimens finally failed due to the fracture of the shear studs in the shear critical region. Chen and El-Hacha [24] investigated the fatigue responses of composite beams composed of a 53 mm thick UHPFRC top layer and a glass-fiber-reinforced plastic pultruded hollow box section. After 2 million cycles of flexural fatigue loading, no sign of degradation was observed, revealing the good fatigue resistance of the top UHPFRC layer. The behavior of composite beams under negative bending moment action is also of interest to researchers. Liu et al. [25] performed tests on partially filled narrow-width steel box girders combined with UHPC. A thin-layer UHPC plate was overlapped on the C40 concrete layer. Under the negative bending moment, due to the existence of the UHPC layer, the cracks were smaller and more concentrated. The cracking load was also greatly enhanced.
Liu et al. [26] investigated the performance of concrete–steel composite beams through 3D finite element analyses. A material model based on von Mises’ yielding function and isotropic hardening was used. A trilinear stress-versus-strain curve was used, defining the yielding strength, yielding strain, and ultimate strength. A 3D finite element model was also used to simulate the push-out test under normal and low temperatures according to Yan et al. [27,28], in which the isotropic plastic material model was used for concrete with isotropic damage detection. To simulate the shear studs, spring elements are usually used, such as in the model built by Fang et al. [29]. Finite element models have also been utilized to examine the performance of studs, demonstrating that the concrete strength of a precast slab and shear pocket only has a limited impact on the shear strength. Guo et al. [30] conducted parametric finite element analyses to investigate the stud behavior between UHPC and steel girders. The authors concluded that to ensure the effectiveness of shear studs, the horizontal spacing should be greater than 2.8 times the diameter of the studs. A composite beam composed of an inverted-T steel section was investigated by Kabir et al. [31]. FEM analyses using Abaqus software captured the responses of the composite beam. The experiment proved that the inverted-T steel section composite beam has less slippage compared to the normal configuration. The shear studs embedded in UHPC proved to be as effective as the flanges regarding their contribution to preventing global or local buckling.
In this study, the flexural responses of UHPFRC and steel composite beams were investigated experimentally and numerically. Compared to normal-strength steel, high-strength concrete with a yielding strength of 690 MPa allows for reaching critical elastic responses when both materials reach their limit strength at the same curvature level. The equations for the prediction of the critical elastic moment resistance were derived. Specimens were designed and tested to verify the findings. Small-scale push-out tests were performed on the 16 mm shear studs embedded in 200 mm high-strength concrete blocks. The experimental results from the push-out tests were then incorporated into a finite element model to predict the structural behavior of the composite beams. Five composite beams made of UHPFRC and either normal- or high-strength steel beams were tested under four-point bending. The effectiveness of connector types and the spacing of studs were investigated, verifying the critical performance of composite beams with high-strength steel and UHPFRC blocks.
2. Material Characterization
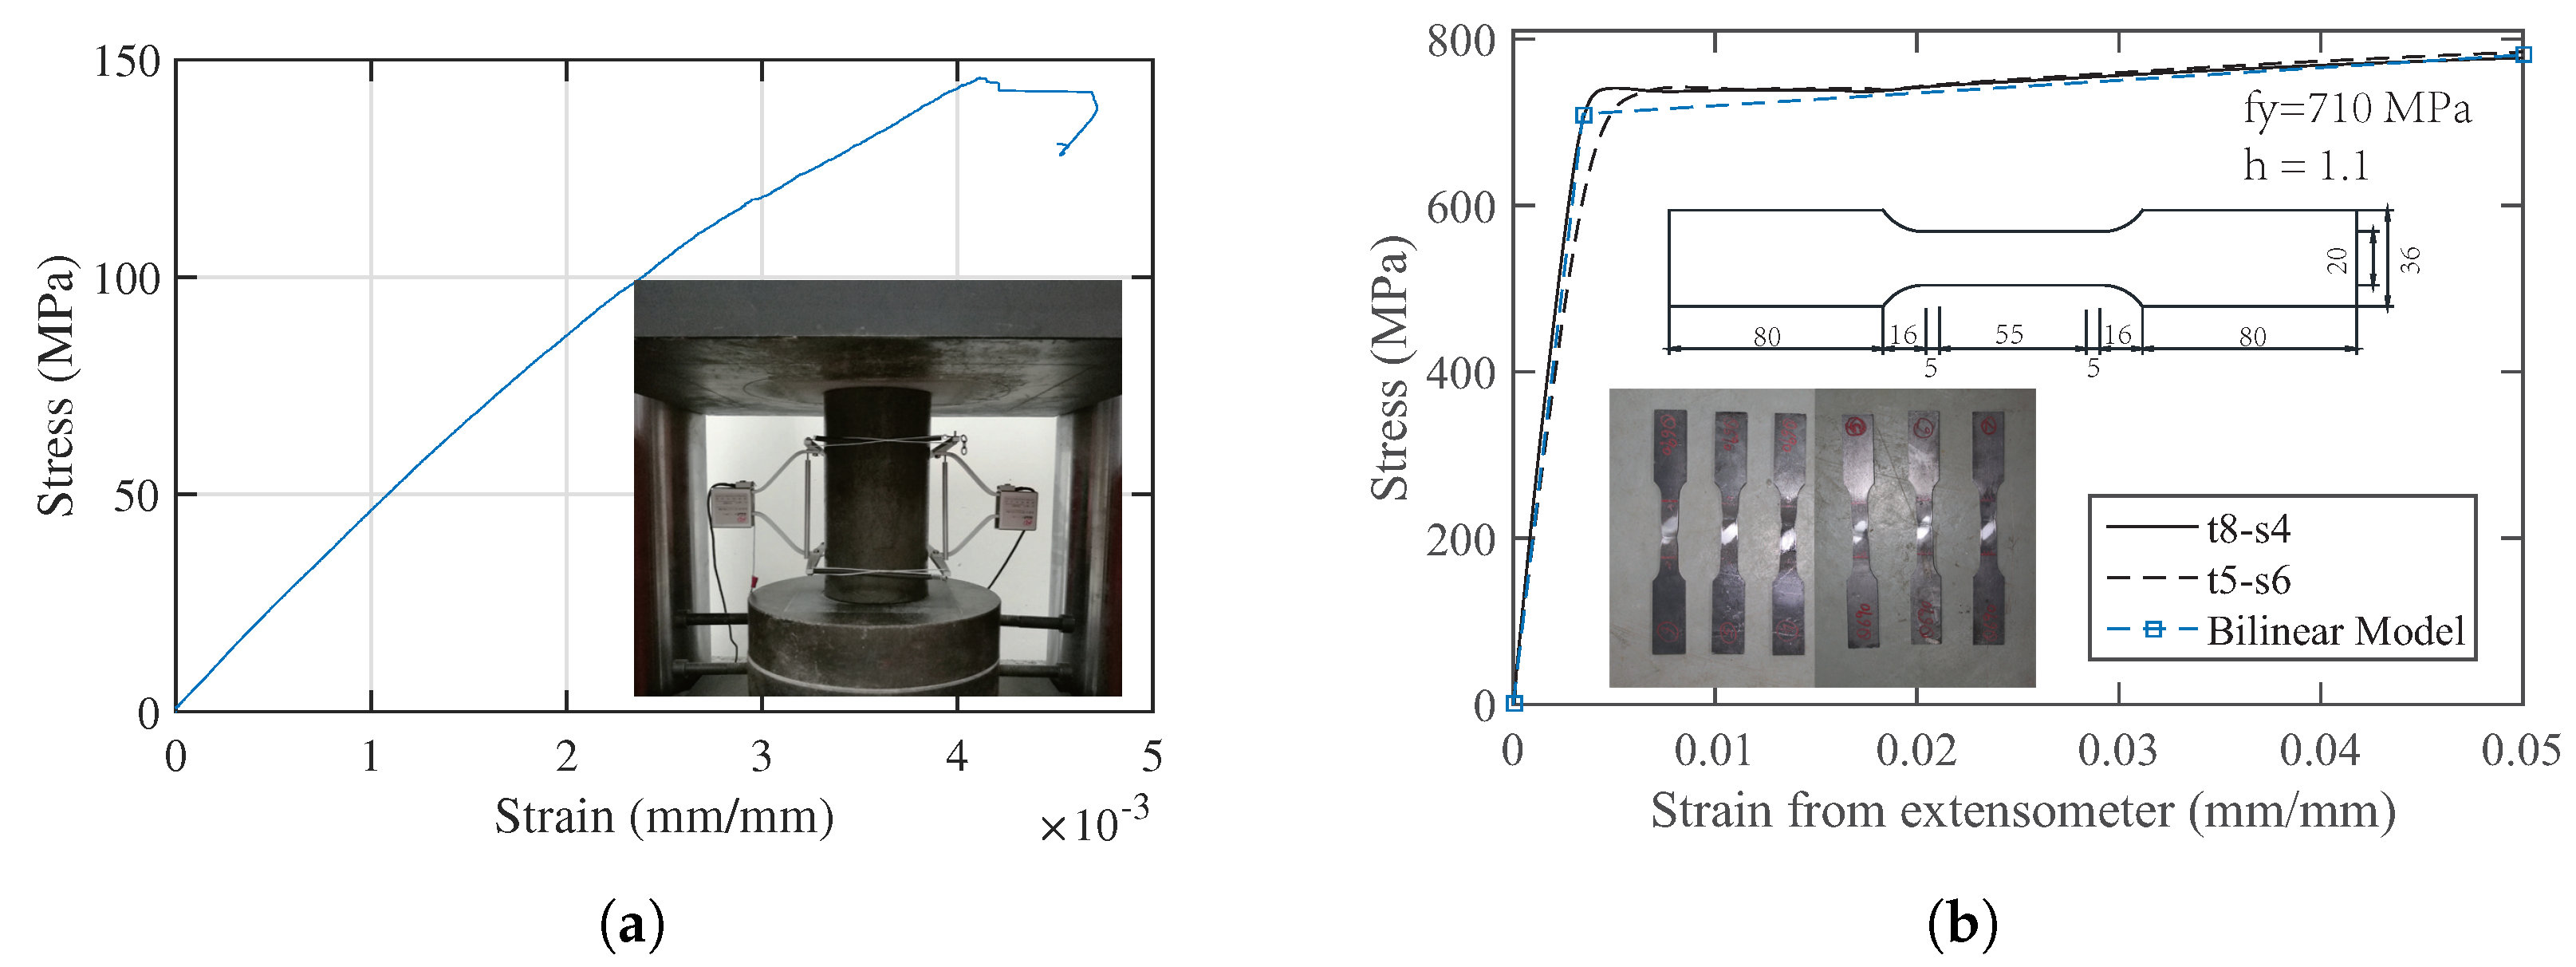
The mix design of ultra-high-performance fiber-reinforced concrete is shown in Table 1. In this investigation, 52.5-type cement was used, and the micro-steel straight fiber had an aspect ratio of 60. The volume fraction of the micro-steel fiber was 2%. Uniaxial compressive strength tests were performed on the cylinder specimens with a 100 mm diameter and a 200 mm height. The test configuration and a typical stress-and-strain curve are shown in Figure 1a. A 300-ton compressive strength test machine was used along with extensometers on both sides of the concrete specimens to obtain the compressive strain and thus the modulus of elasticity according to Eurocode [32]. The uniaxial compressive strength was 140 MPa from the average of five specimens tested 21 days after casting. The standard deviation was 10.2 MPa. The average modulus of elasticity was 41.9 GPa. The results are summarized in Table 2.

Table 1.
Mix design of high-strength fiber-reinforced concrete.
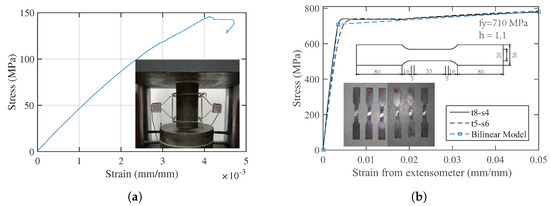
Figure 1.
Material properties: (a) Typical stress-and-strain relation of UHPFRC. (b) Stress versus strain and failure mode of the high-strength steel.
Table 2.
Compressive strength of cylinder specimens.
The uniaxial tensile strength of the high-strength steel was verified using coupon specimens with thicknesses of 5 mm and 8 mm and a gauge width of 20 mm. The tests were conducted using a 30-ton universal testing machine (UTM). Detailed dimensions can be found in Figure 1b. Loading for the uniaxial tensile test was applied using a displacement control rate of 2 mm per minute. The failure patterns of six steel coupon specimens with two different thicknesses are shown in Figure 1b. The average modulus of elasticity was 217 GPa from five specimens with a thickness of 8 mm. The corresponding average yielding strength was 693 MPa (based on the 0.2% offset rule), and the ultimate strength was 780 MPa. For the 5 mm thick coupons, the modulus of elasticity, yielding strength, and ultimate strength were 198 GPa, 721.8 MPa, and 801 MPa, respectively. Figure 1b presents a typical stress-and-strain curve obtained from the coupon tests, along with the simplified bilinear model with a hardening parameter h equal to 1.1.
3. Elastic Flexural Capacity
3.1. Critical Moment Definition and Equation for Estimation
Consider a critical design scenario where both steel and UHPFRC materials reach the limit strength in tension and compression, respectively. The location of the neutral axis is located at the top of the steel section to avoid potential buckling and cracking. The three criteria can be expressed, as shown in Equation (1).
where and are the yield strength and compressive strength of steel and UHPFRC, respectively, and and are the stress at the bottom of the steel section and the stress on the top of the UHPFRC layer. The stress level can be calculated according to Equation (2).
where represents the location of the neutral axis to the bottom of the steel section and is the curvature of the composite section. According to basic mechanics, the neutral axis location of the composite beam can be expressed by Equation (3).
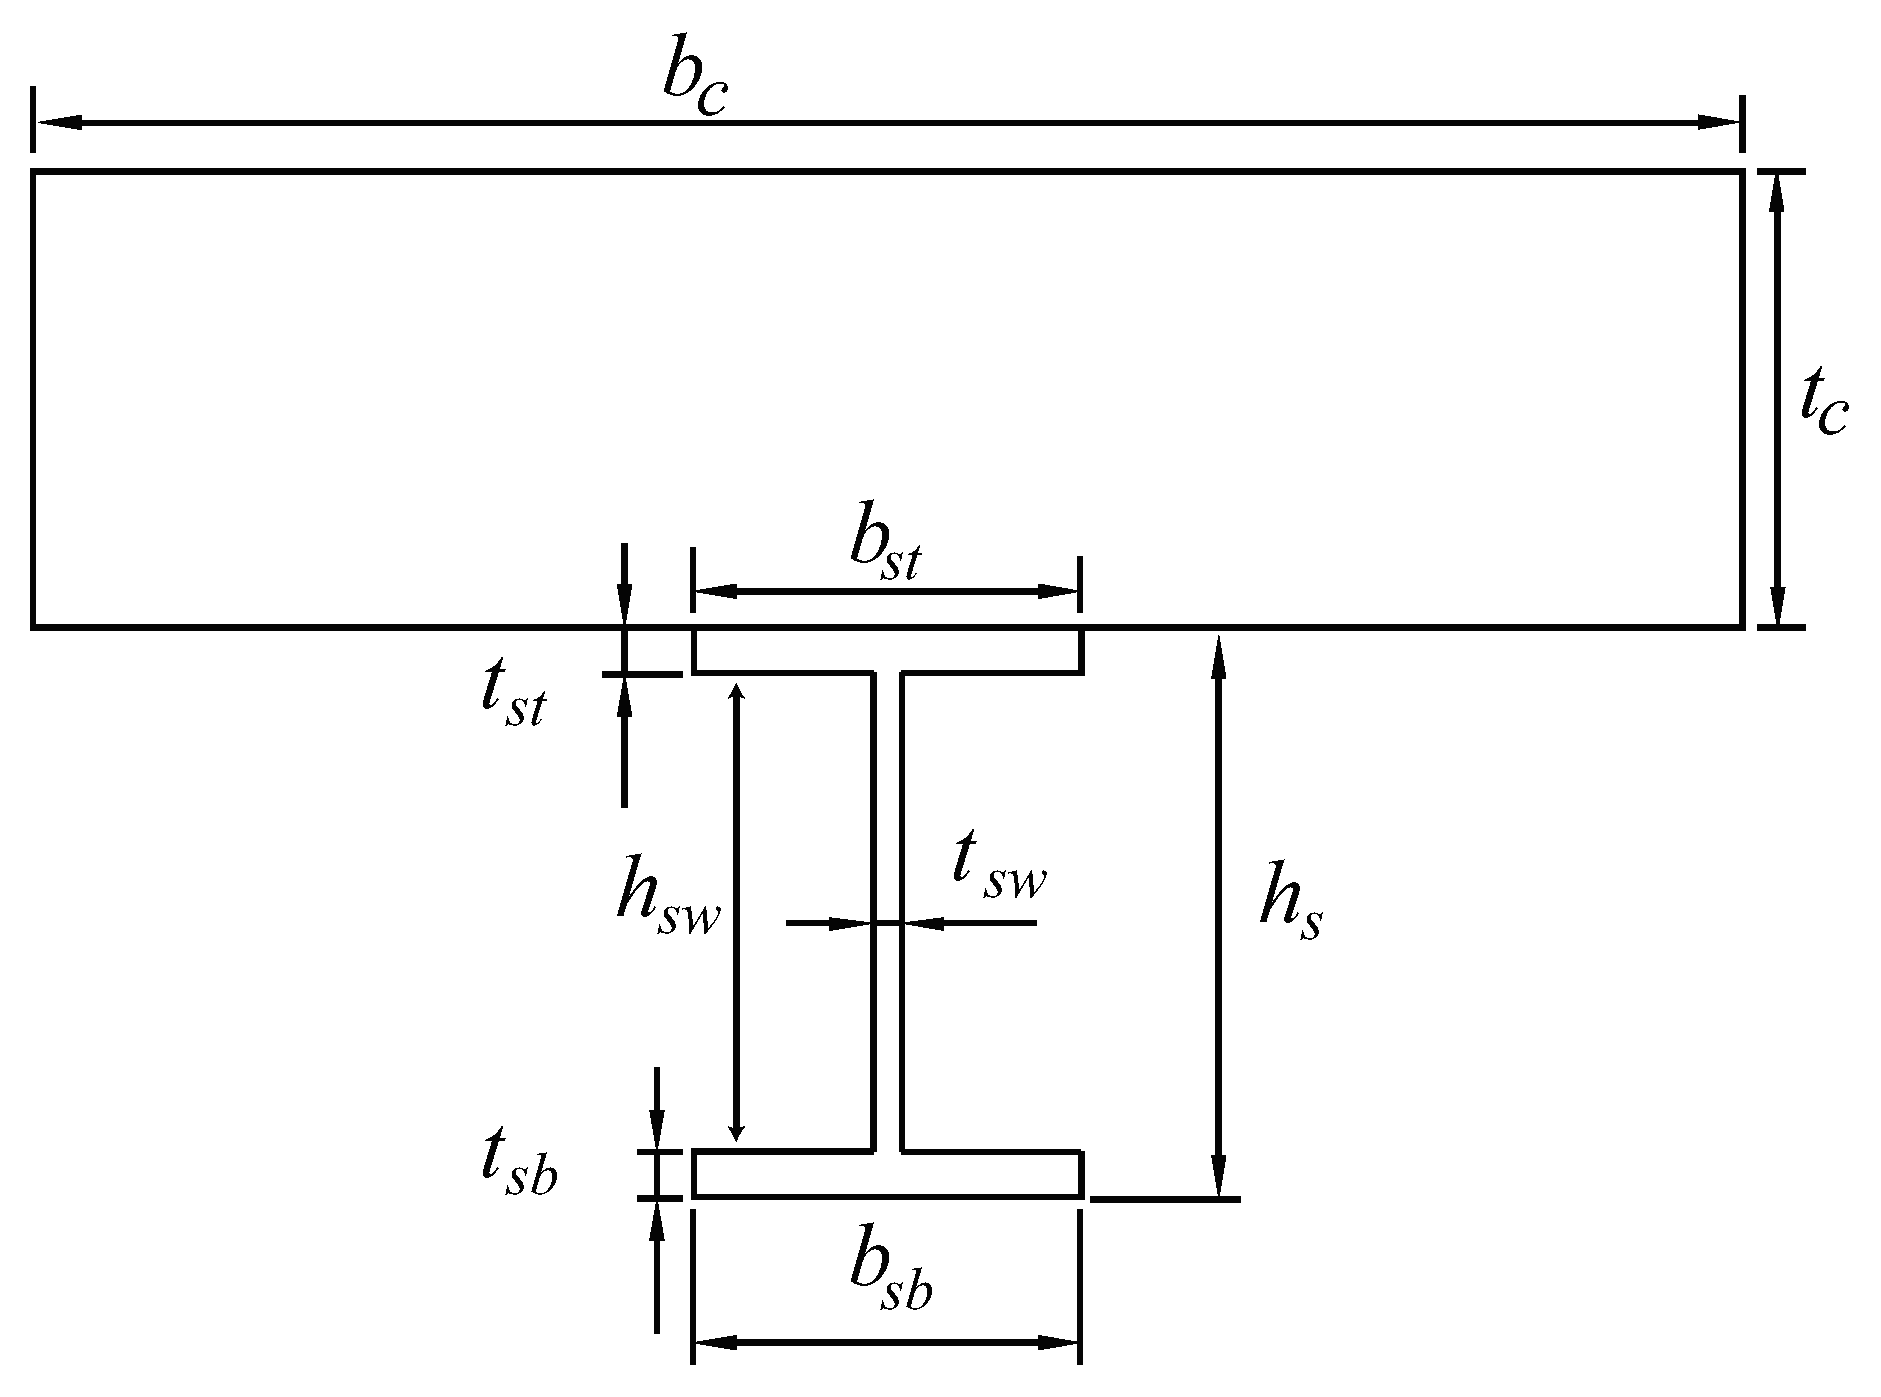
where and are the width and thickness of the top UHPFRC layer; and are the widths of the bottom and top flanges of the steel section; and are the thicknesses of the bottom and top flanges; and and are the height of the web and whole section, respectively. The geometrical parameters of the composite section can be found in Figure 2. and are the modulus of elasticity of steel and concrete, respectively.
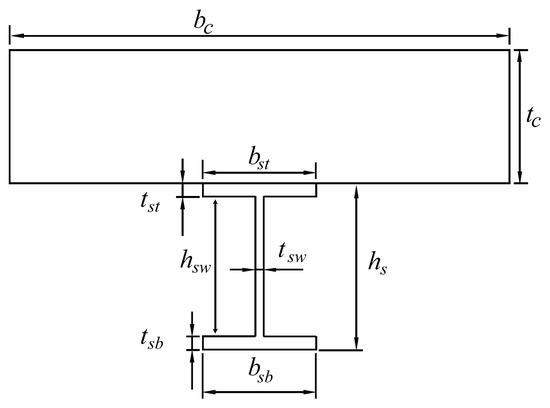
Figure 2.
Design parameters of the composite section.
When the size of the steel beam is known, the expressions for the critical thickness , the critical width of the concrete layer, and the critical curvature can then be obtained by solving Equation (1). The results can be seen in Equation (4).
where parameter can be expressed by Equation (5).
When the steel section is symmetric ( = = and = = ), the expression for parameter can be simplified, as shown in Equation (6).
where and are the thickness and width of the top and bottom flanges of the steel section, respectively. The critical moment can be expressed by Equation (7), where and are the moment resistance contributions from concrete and steel, respectively, with the expressions shown in Equations (8) and (9).
Since the thickness of the flanges and web ( and ) are usually much smaller than the sectional height and width of the flanges ( and ), Equation (9) can be further simplified to Equation (7). The proposed equation is then simple enough to estimate the critical moment when the dimensions of the composite section and material properties are known.
where and is a negative value.
The geometries of six typical I sections are listed in Table 3, with sectional heights ranging from 100 mm to 630 mm. The exact theoretical solution of the elastic critical moment and the capacity obtained through the simplified equation are also listed. Equation (10) slightly differs from the moment capacity, with the largest absolute error percentage being less than 5% among all six sections. The calculations are based on the assumption that MPa, MPa, GPa, and GPa.
Table 3.
Geometries and parameters of typical sections (in mm and N).
It was observed that when adopting high-strength steel with a yielding strength of 690 MPa, the critical thickness of the UHPFRC layer was close to the height of the steel section, whereas the critical width only varied from 68.75 mm to 118.46 mm. This is significantly different from the case of normal-strength steel, where the critical thickness is usually very small and not realistic.
3.2. Critical Moment of the Composite Beam Utilizing High-Strength Steel
For general cases where the width and height of the UHPFRC layer are different from the critical dimensions explained in the previous section, the elastic moment resistance can be estimated using Equation (11), where parameter represents the moment capacity variation.
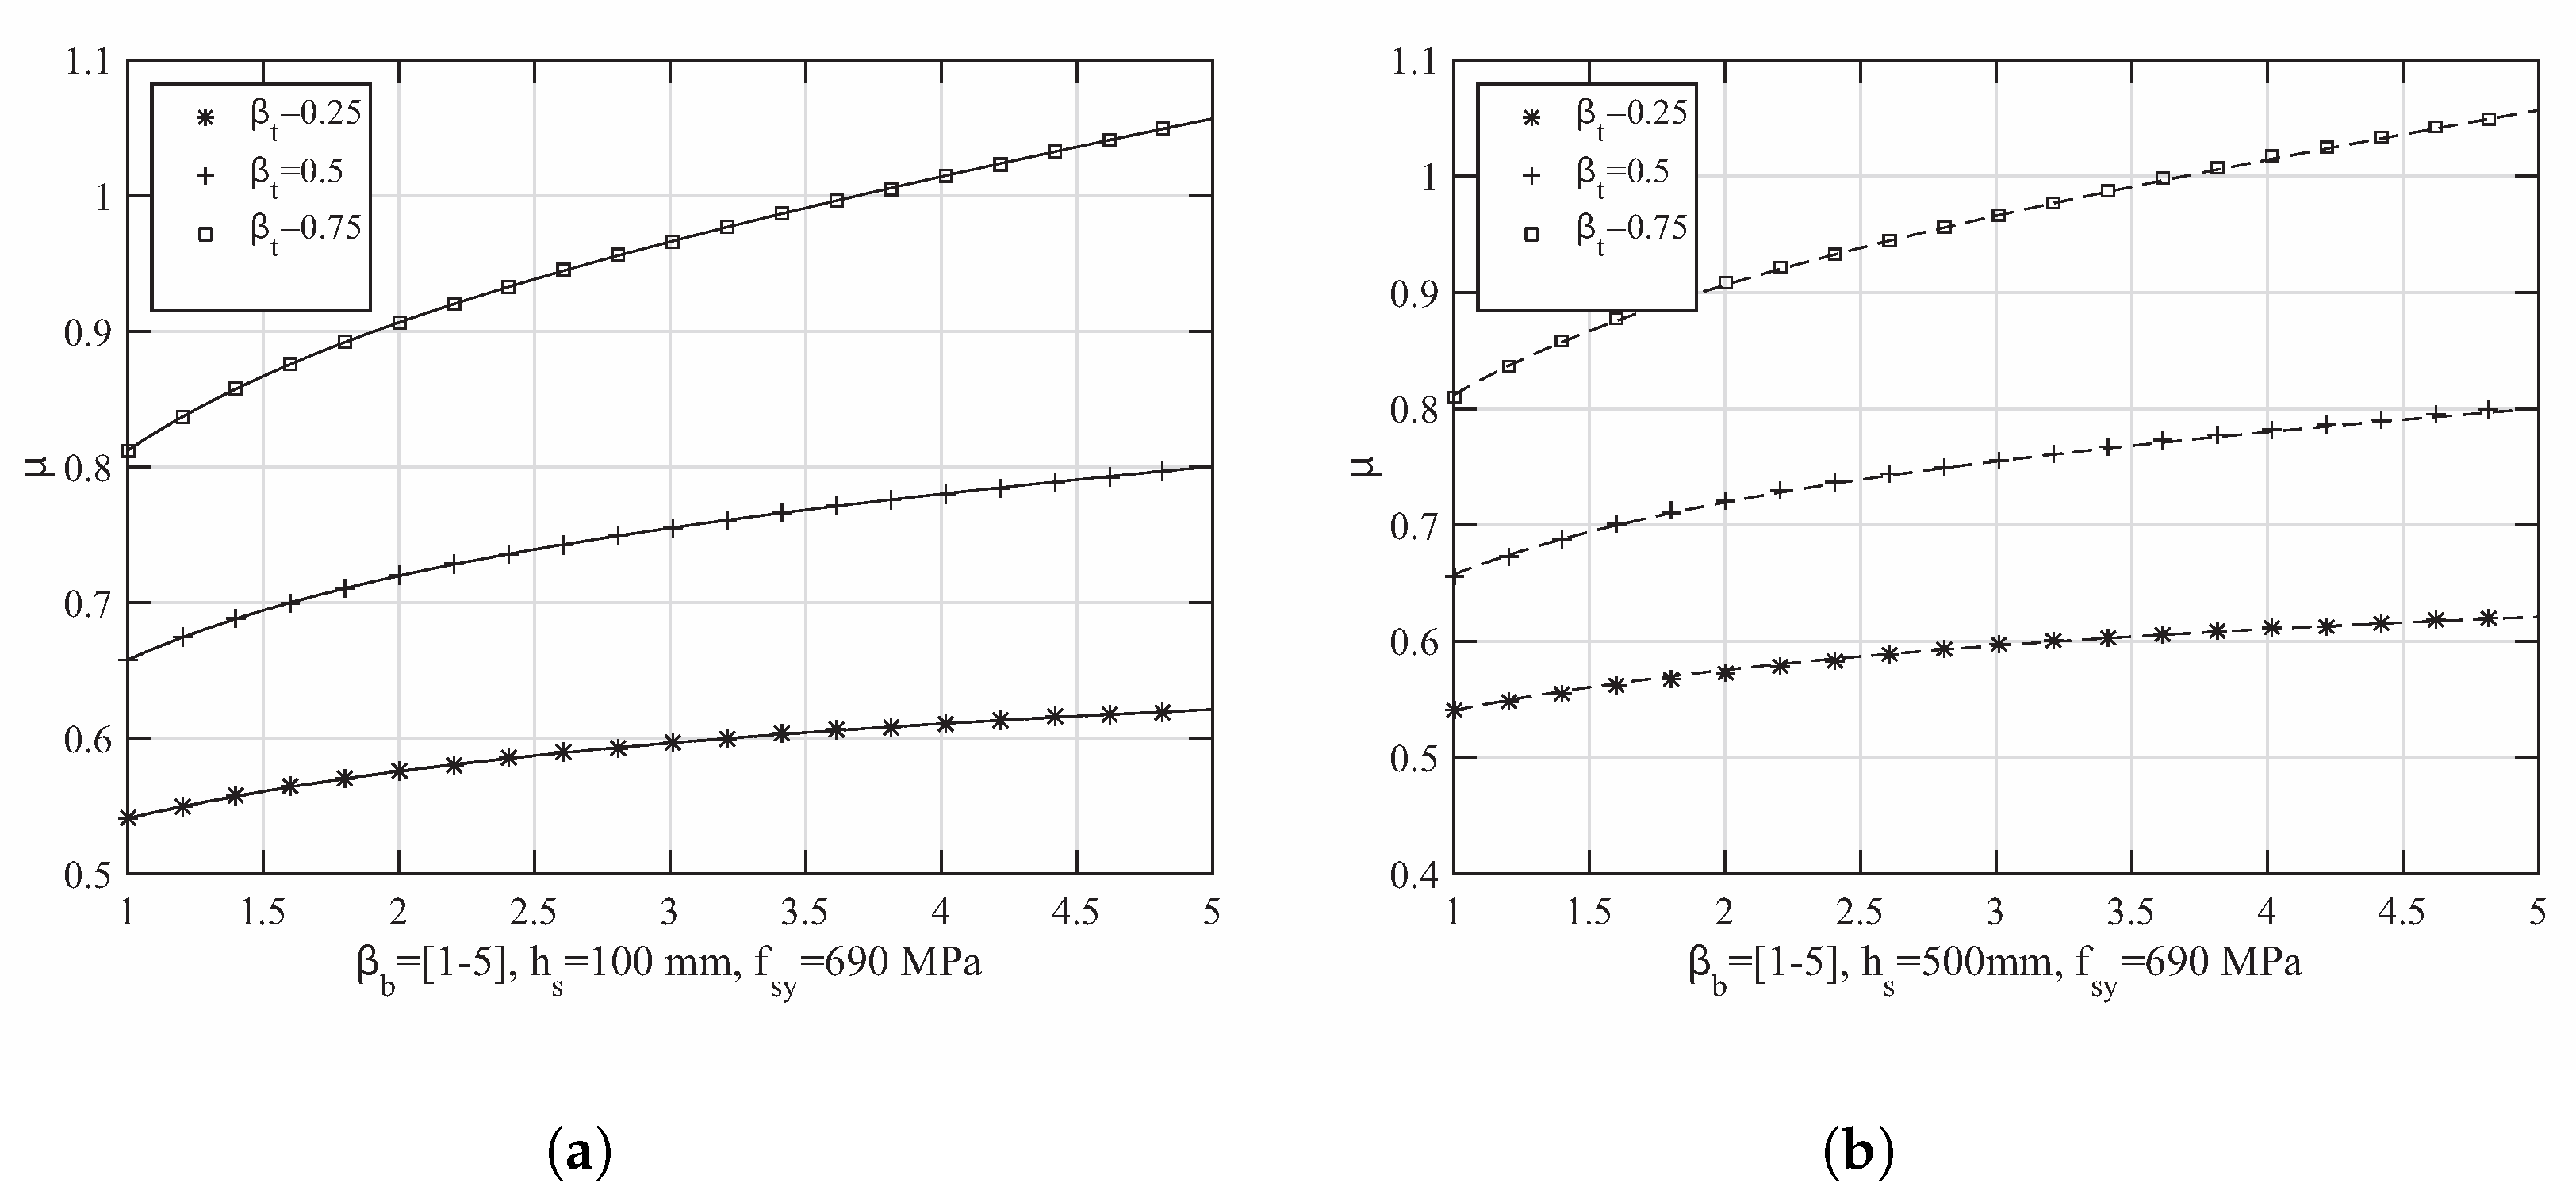
After the steel profile has been confirmed by introducing parameters and , which are the ratios of the concrete’s width and height against the corresponding critical values, parameter can be expressed by variable , , and the limit curvature . The curvature is governed by either the concrete or steel, depending on which part first reaches the limit strength. In the case of the composite beam utilizing high-strength Q690 steel and when , the bottom of the steel flange reaches the yielding strength first. The versus plots for the I10 and I50a sections listed in Table 3 can be depicted as shown in Figure 3 for three levels of at 0.75, 0.5, and 0.25, respectively.

Figure 3.
Design plots for : (a) Section I10 with mm; (b) Section I50a with mm.
It can be seen that if the height of the UHPFRC layer is much smaller than the critical value , increasing the width of the concrete alone cannot recover the elastic moment resistance with the same cross-sectional area, which means that the critical condition reflects the scenario that reaches the most effective use of both materials regarding their contributions to the elastic performance of the composite section.
3.3. Samples for Verification
Two types of steel materials with different yielding strengths were used in this study to verify the proposed equations. For Q235 normal-strength grade steel beams, a standard hot-rolled I10 section profile was used, whereas Q690 high-strength steel beams were constructed by plate welding. The overall height of both types of steel beams was 100 mm. Other parameters, such as the thickness of the web and the width of the top (bottom) flanges, as well as the critical and elastic moment resistances of the sections, can be found in Table 4. It can be seen that with a low yielding strength of 235 MPa, the critical width of the UHPFRC layer is only 7.97 mm, which is impractical for real design purposes. Meanwhile, for high-strength steel with a yielding strength of 690 MPa, the critical width is 73.26 mm, which is close to the width of the flange of the I-section steel beam. The elastic resistance force is calculated based on the beam setup, which has a span length of 1800 mm and a four-point bending configuration, with a distance of 600 mm between the two loading points.
Table 4.
Elastic flexural resistances of two composite beams.
4. Experimental Investigation
4.1. Methods
4.1.1. Push-Out Tests
Two types of shear connectors (shear studs and plate connectors) were investigated in this study through small-scale push-out tests. The test setup is shown in Figure 4. The cross-section of the side concrete blocks is 100 mm by 100 mm, and the height is 200 mm. Three specimens were prepared and tested with identical configurations and shear studs of 16 mm. The relative deformation was measured between the bottom of the steel beam and the top concrete surface using a pre-installed string pot. The same test configurations were applied to two push-out specimens with plate connectors. The plate used in the test was 120 mm long and 40 mm wide, with two holes drilled at the middle height. The diameter of the holes was 10 mm, and two No.6 rebars were placed across the holes. The length of the rebar was 120 mm to ensure that part of the rebar extended out of the side block to observe the potential slippage.
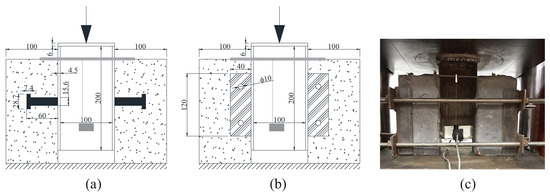
Figure 4.
Small-scale push-out test setup: (a) Stud connector. (b) Plate connector. (c) Test setup.
4.1.2. Flexural Tests
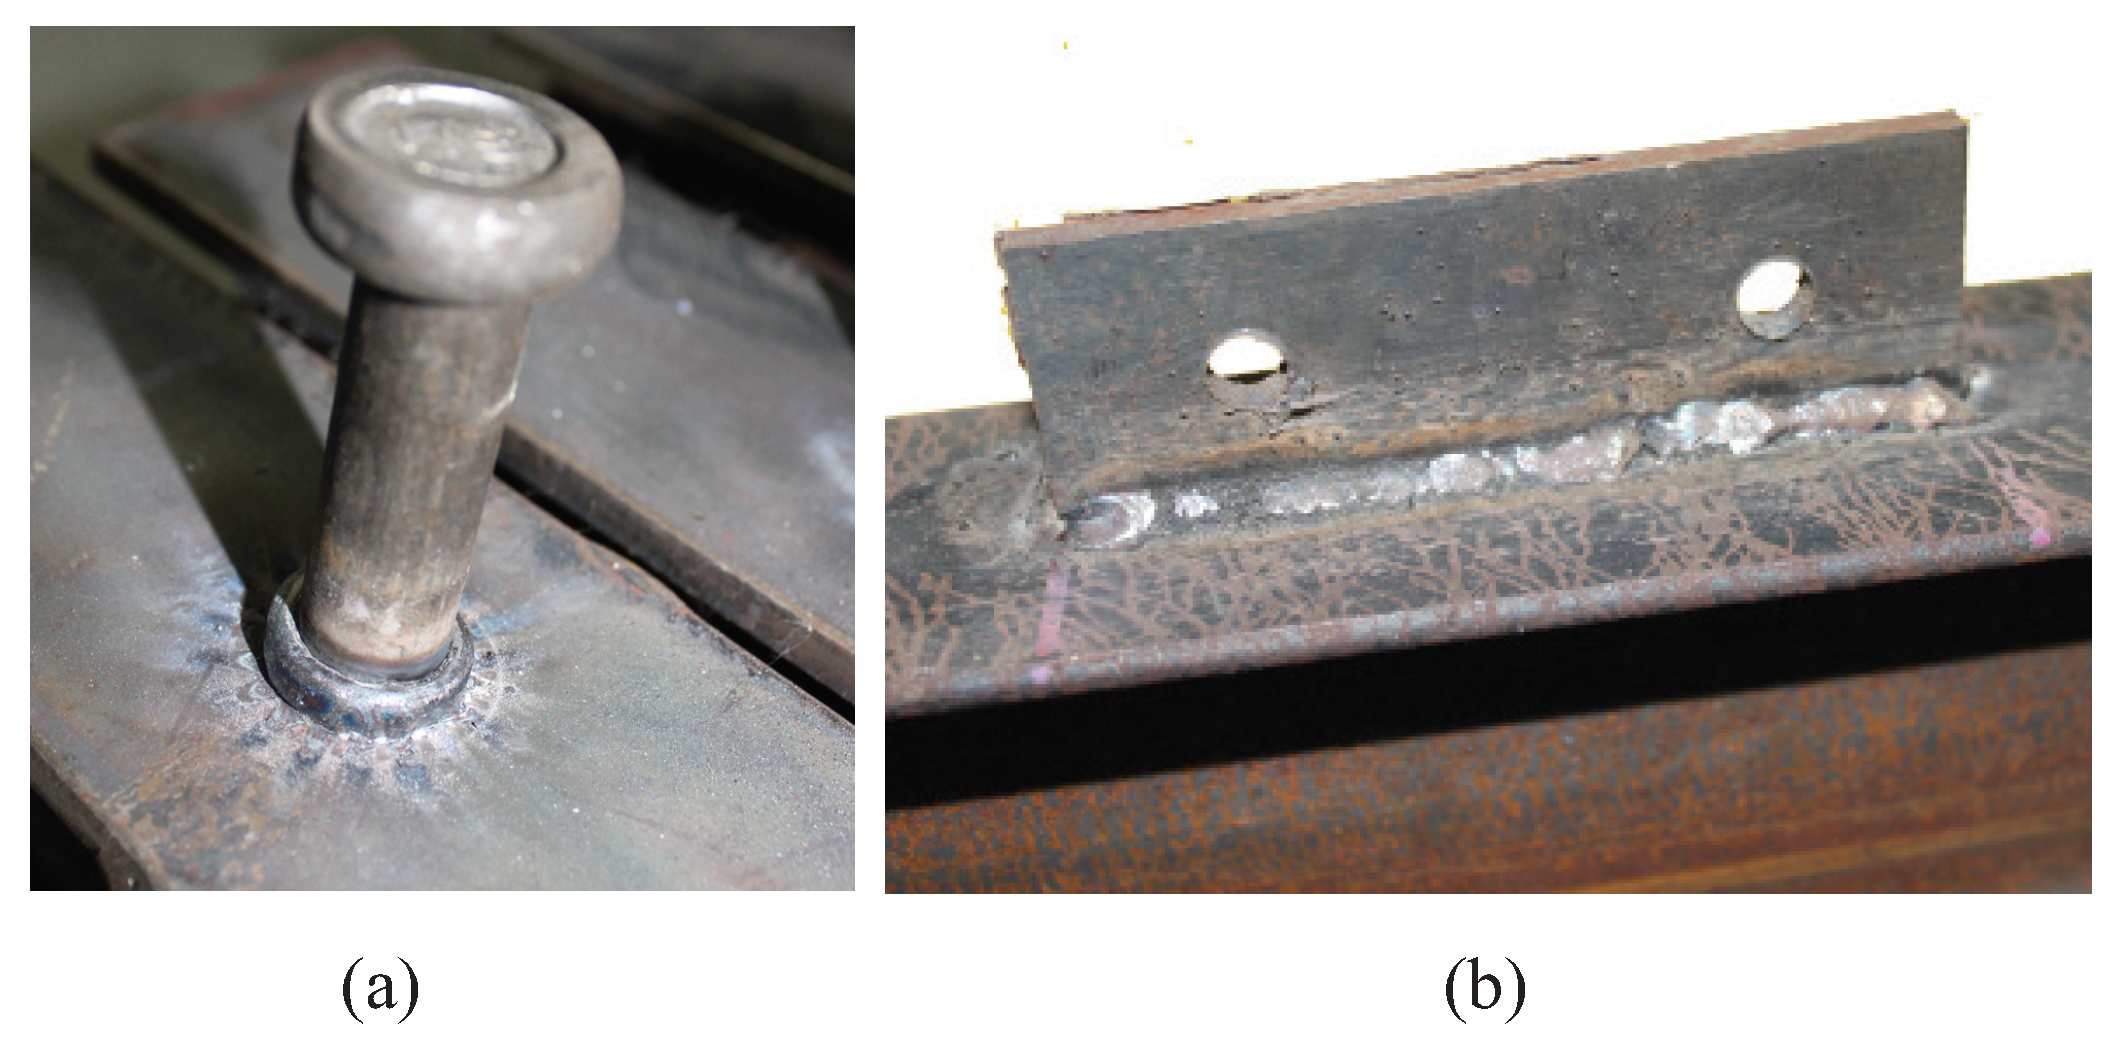
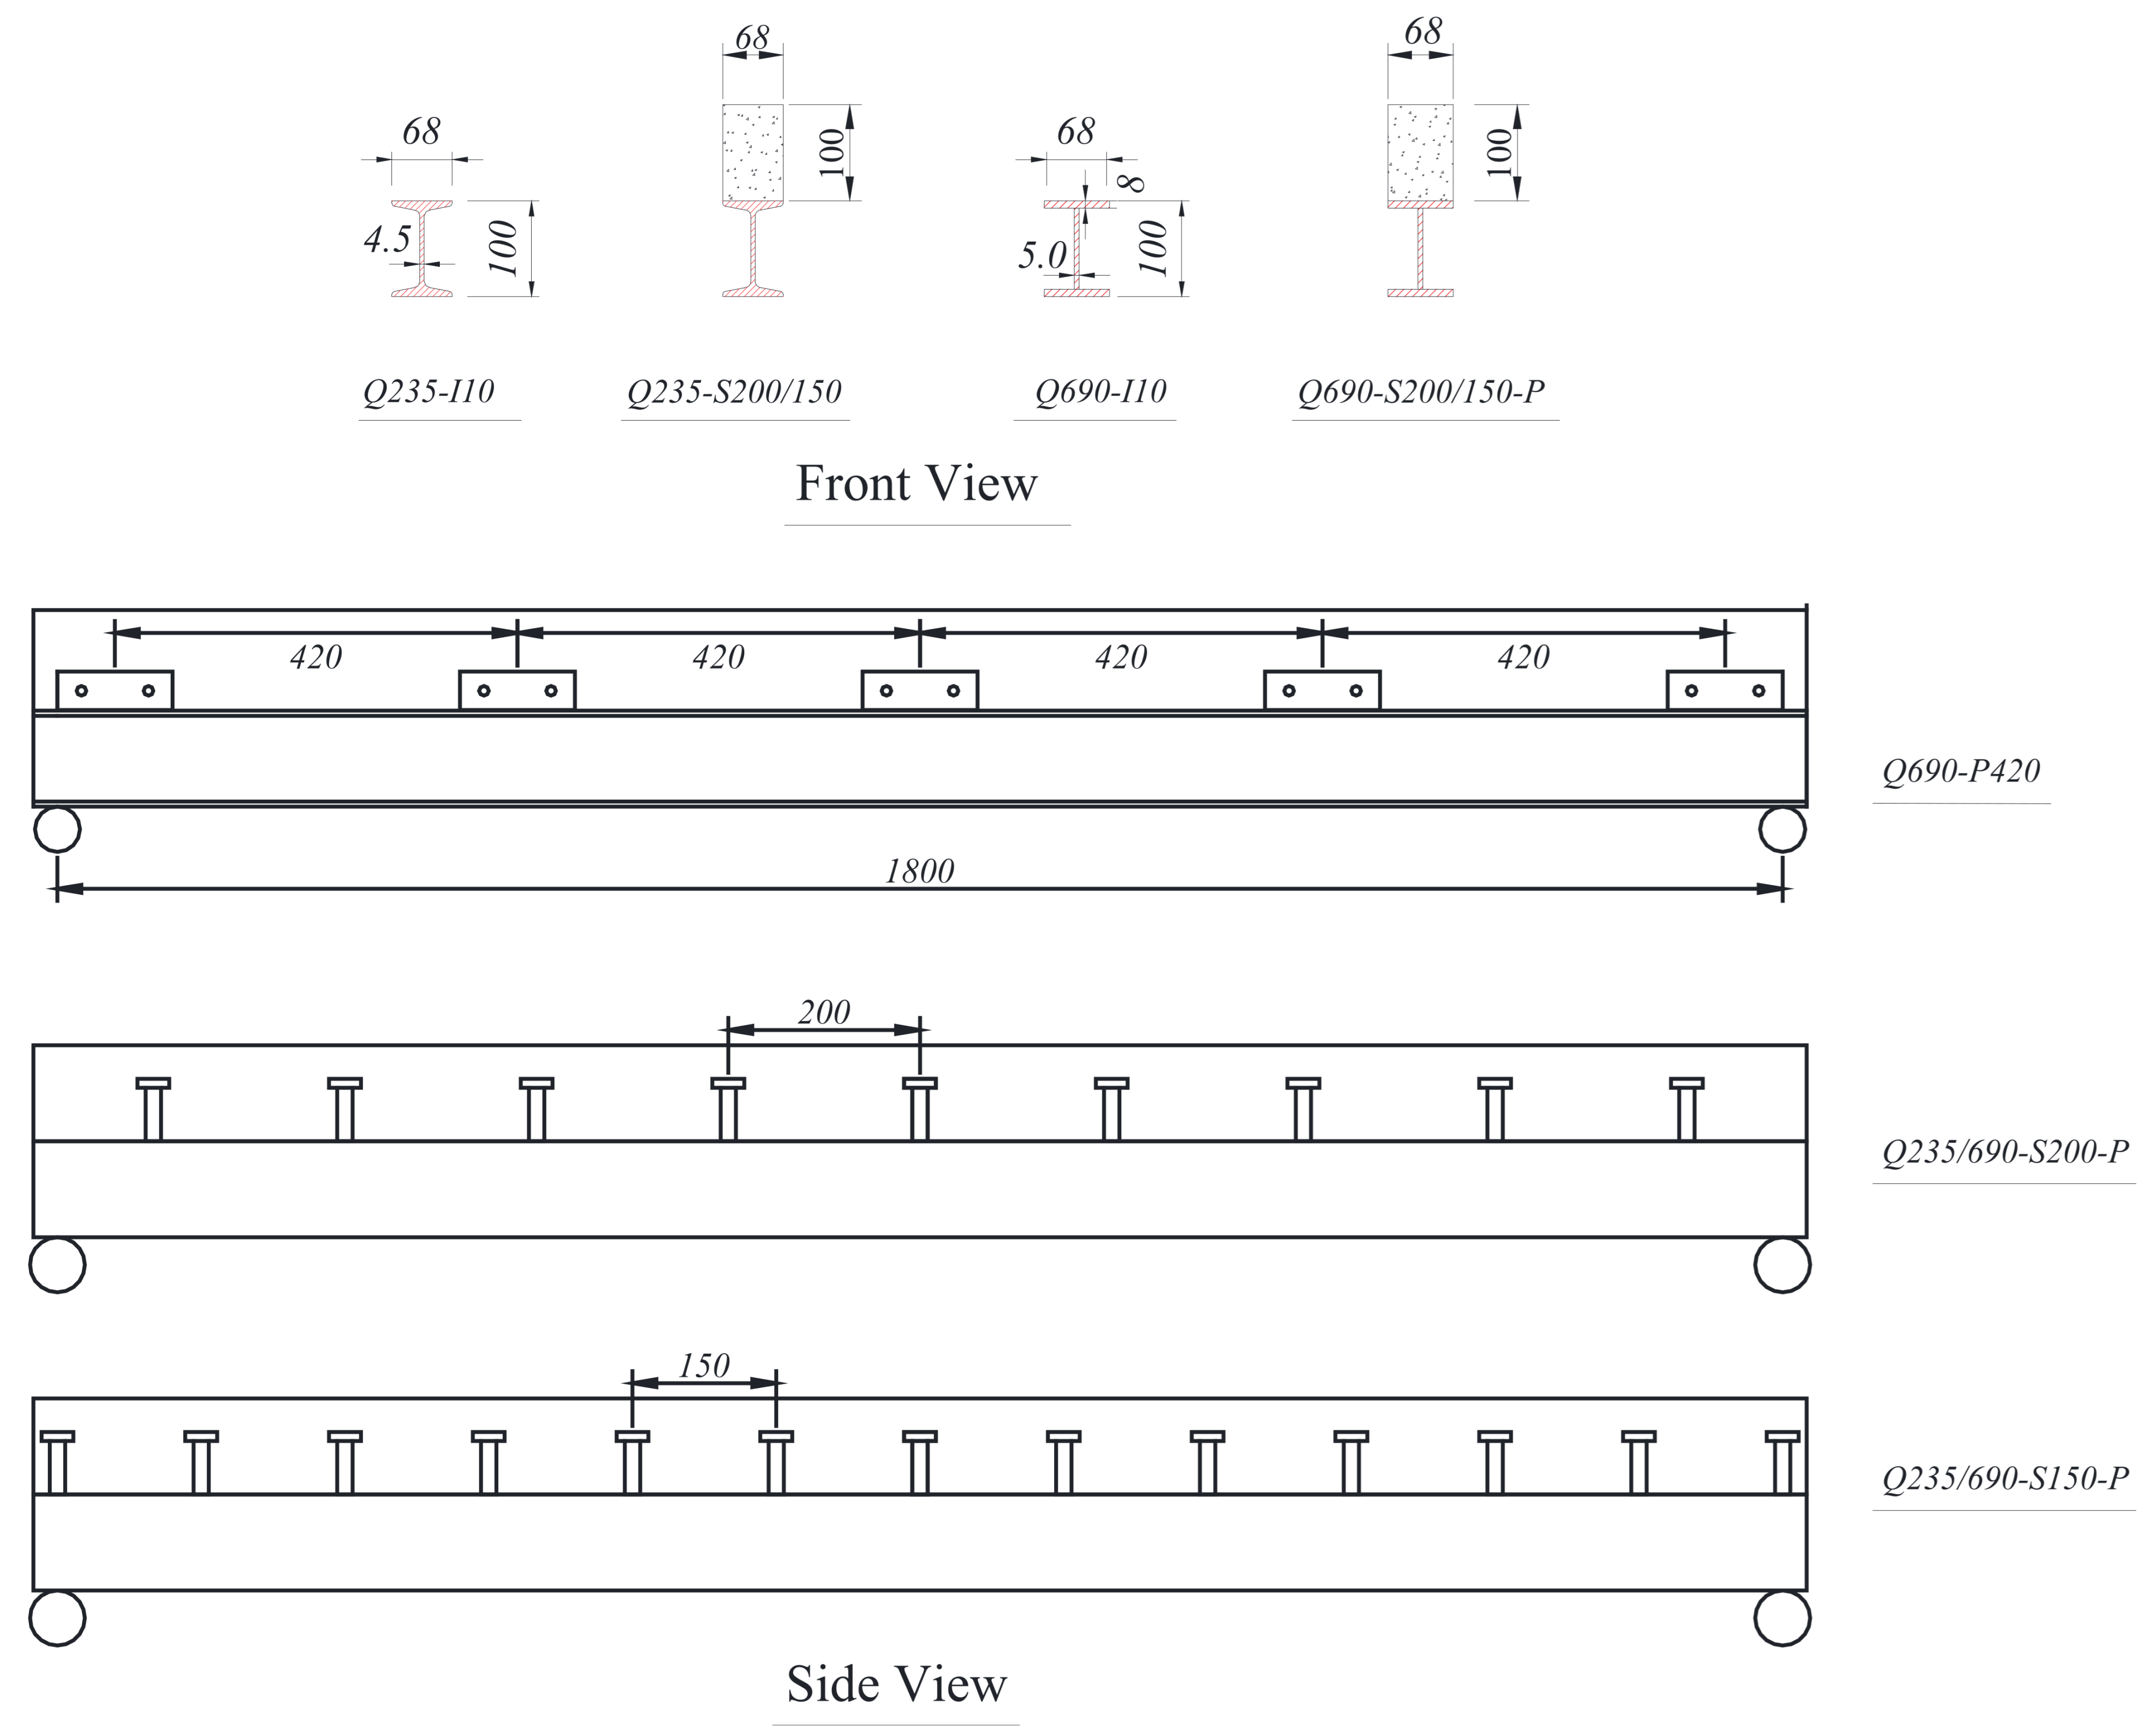
A total of five steel and UHPFRC simply supported composite beams were tested along with two pure steel beams. The details of these beams are summarized in Table 5. Two types of shear connectors were utilized, with specific spacing for each specimen. A designated welding machine was used to ensure the quality of the stud welding, as shown in Figure 5, and steel plates with holes were welded to the steel beam. A schematic drawing of the various specimens can be found in Figure 6.
Table 5.
Flexural test specimens.
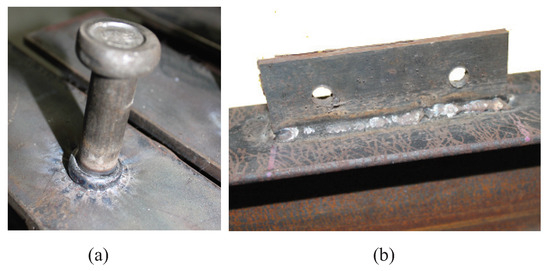
Figure 5.
Shear connectors: (a) Stud connector with well welding around it. (b) Steel plate connector.
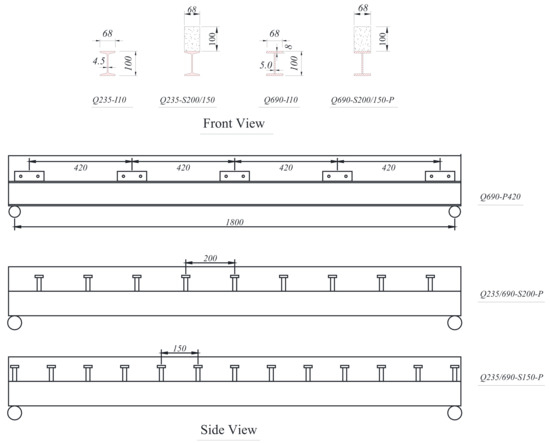
Figure 6.
Specimen design and dimensions.
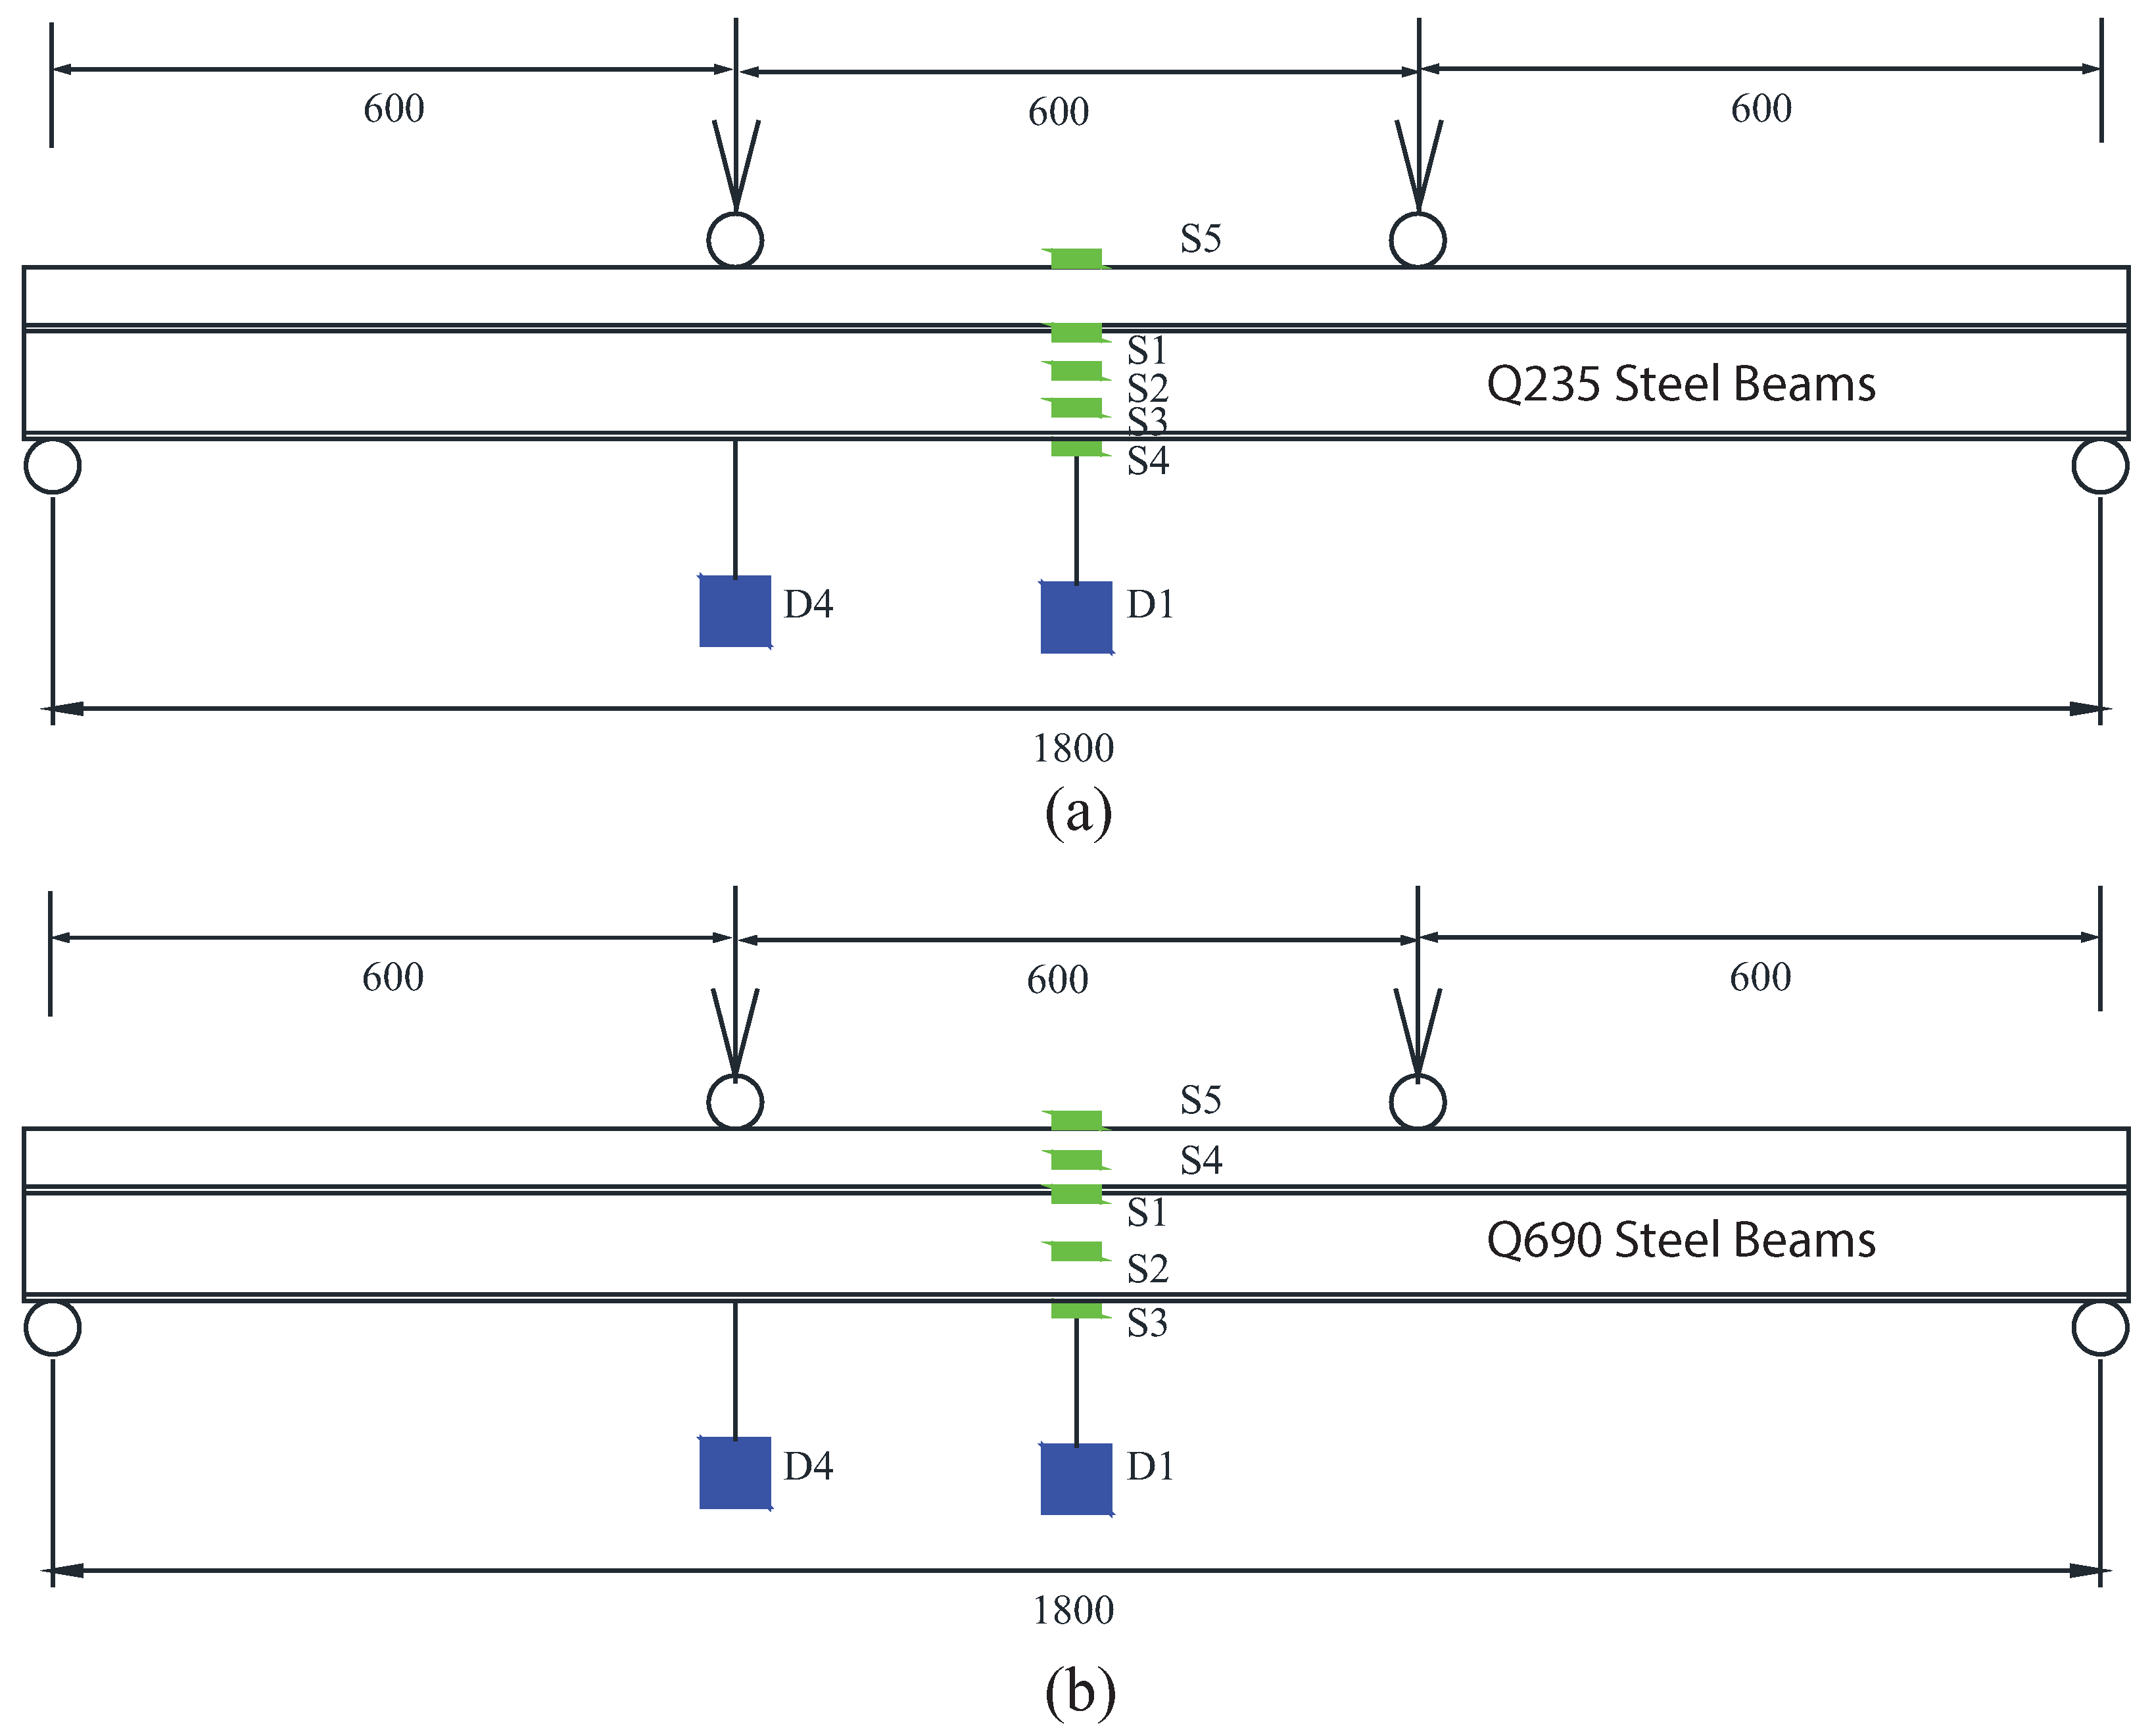
The instrumentation for the specimens under positive bending can be found in Figure 7. For specimens with normal-strength steel, four strain gauges were attached to the steel beam at different section heights in the middle span: one attached to the bottom of the top flange (S1), one at the bottom of the bottom flange (S4), and two at one-third (S2) and two-thirds (S3) of the sectional height. Another strain gauge (S5) was attached to the concrete top surface at the middle span. The distance between each strain and the bottom of the flange was 0, 33 mm, 66 mm, 100 mm, and 200 mm, for S4, S3, S2, S1, and S5, respectively. The middle span deflections (D1) and the deflection under one side of the loading point (D4) were recorded using the string pots attached to the bottom of the steel beam, as shown in Figure 7.
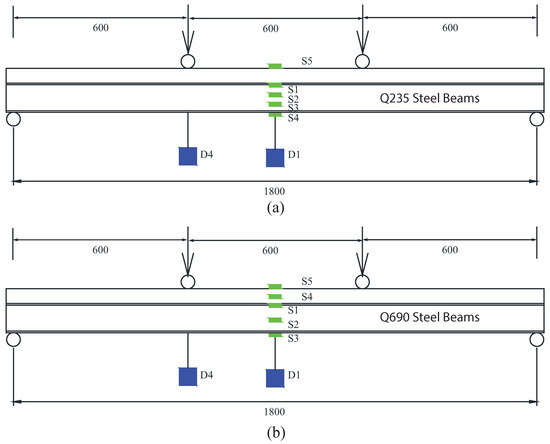
Figure 7.
Instrumentation plan: (a) Q235 beams; (b) Q690 beams.
For the specimens with high-strength steel, three strain gauges were attached to the steel beam: two on the extreme surfaces and one at the middle of the sectional height. Two more strain gauges were attached to the concrete: one on the top surface (S5) and another at the middle of the section, attached on the side surface (S4), as shown in Figure 7. Because the UHPFRC layer for the high-strength steel was cast to be 110 mm, the distance between each strain and the bottom of the flange was 0, 50 mm, 100 mm, 150 mm, and 210 mm, for S3, S2, S1, S4, and S5, respectively.
All tests were performed using the 30-ton universal testing machine at the Structure’s Lab of Xi’an Jiaotong-Liverpool University. Loading was initially controlled by displacement at a rate of 1 mm per minute until the peak load was reached. Then, it was increased to 5 mm per minute after the load dropped from its peak.
4.2. Test Results
4.2.1. Push-Out Tests
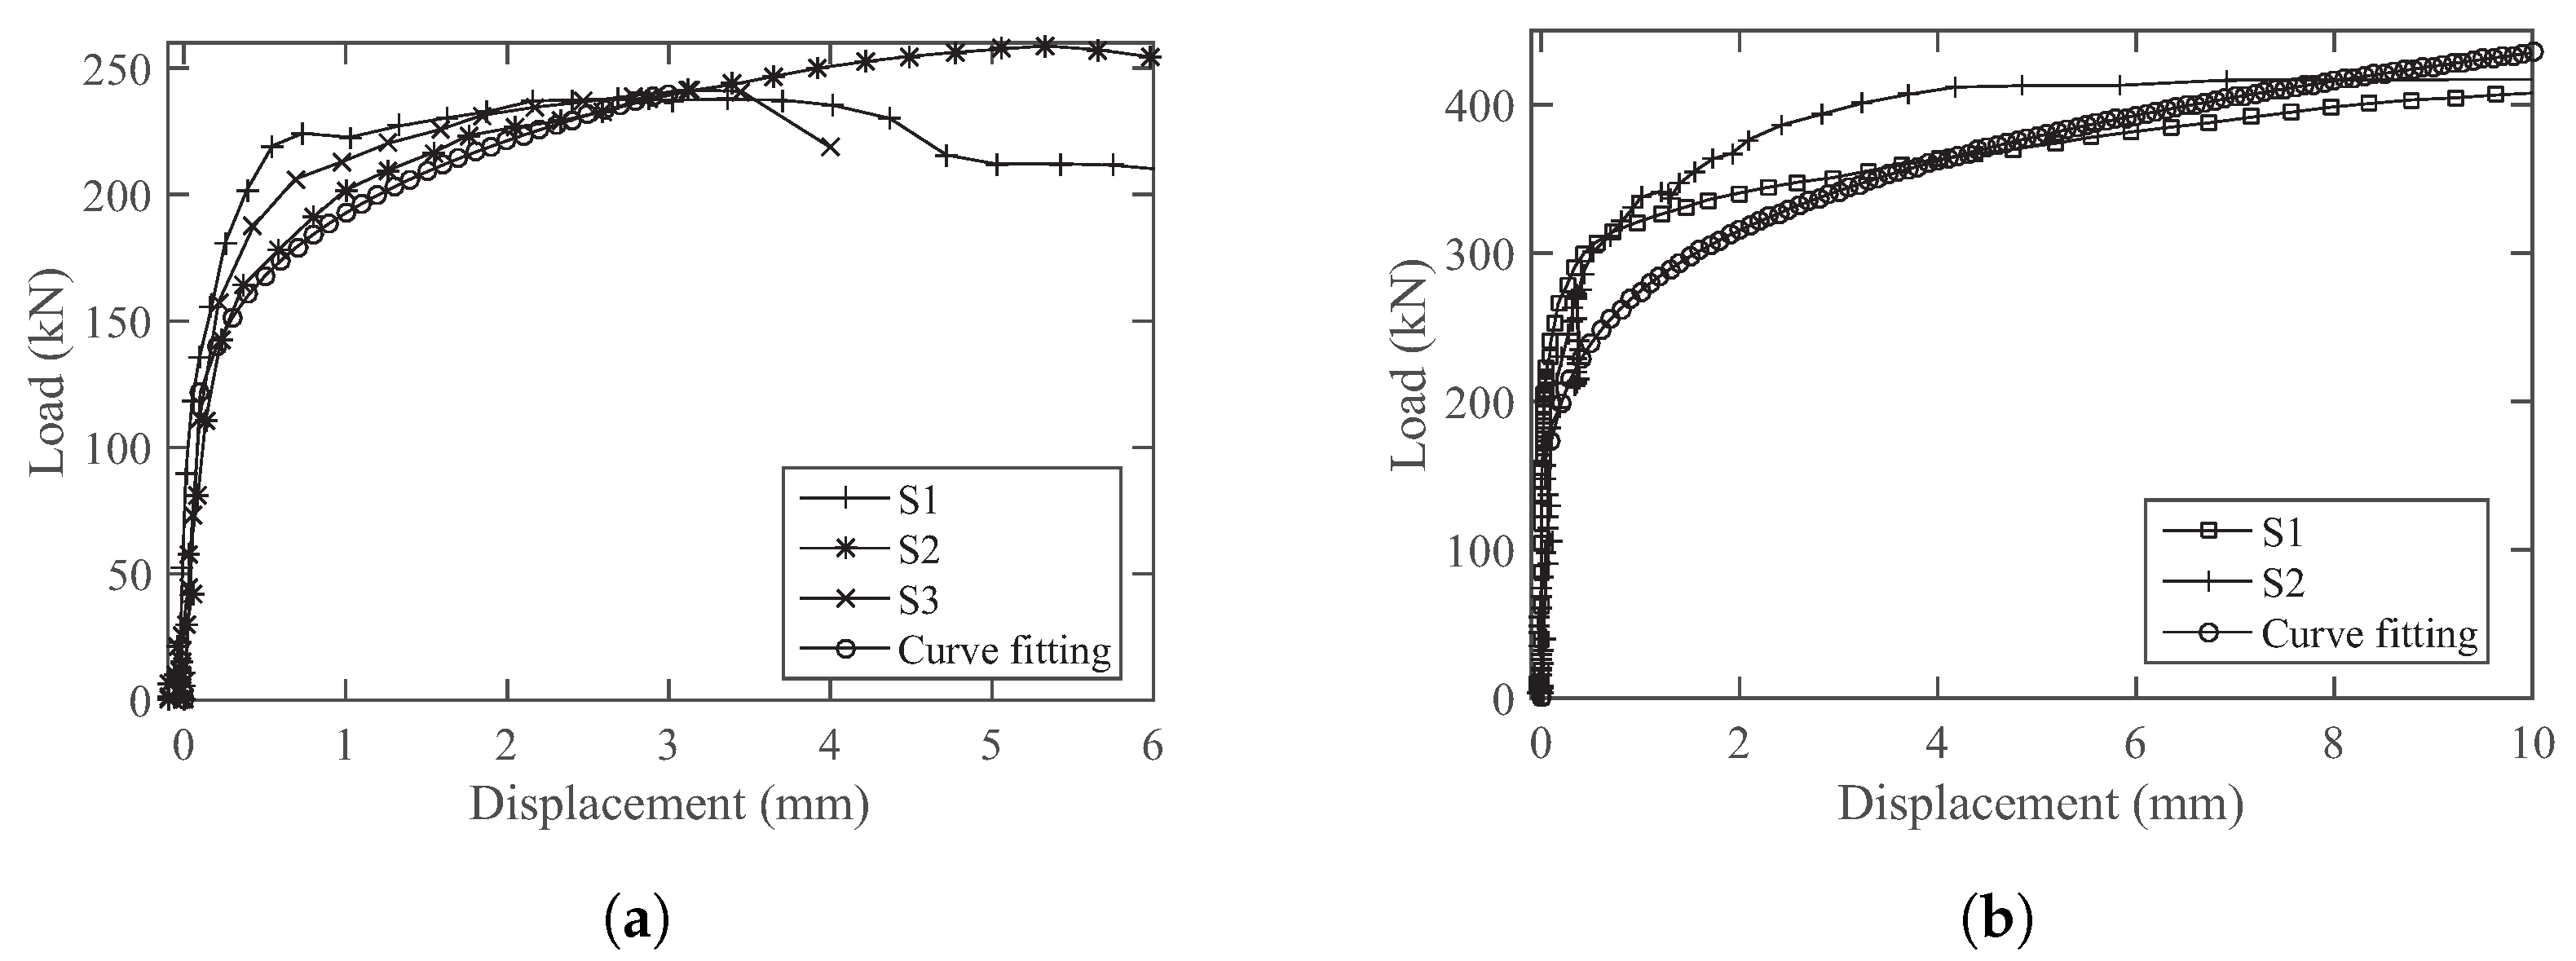
The load-versus-displacement curves of the three push-out specimens with shear studs are shown in Figure 8a. The obtained stud shear capacity and deformation are similar to those obtained by [14]. All three specimens failed due to the shear failure of the welded stud at the region close to the root, as shown in Figure 9. The failure occurred at a location that experienced high temperatures during the welding process. Two out of the three specimens failed suddenly, with loud and sharp noises heard along with a sudden load drop.

Figure 8.
Load-versus-displacement curves of the push-out specimens: (a) Specimens with shear studs; (b) Specimens with plate connectors.
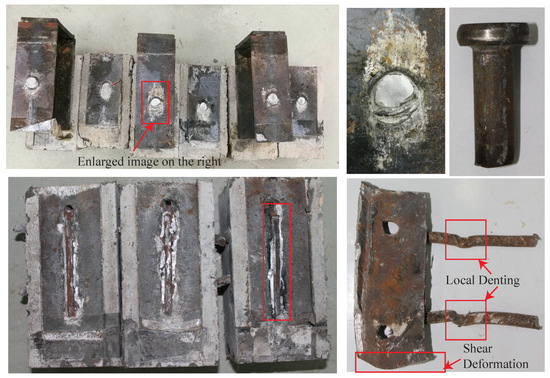
Figure 9.
Failure of push-out specimens and fracture shear surface of studs.
The load-versus-displacement curves of the two specimens with plate connections are shown in Figure 8b. The plate connectors provided higher shear resistance at larger deformations exceeding 10 mm. After testing, the concrete block was crushed sideways in order to observe the deformation of the shear connectors. Plastic shear deformation of the steel plate, as well as the local denting of the crossing rebars, were observed, as shown in Figure 9.
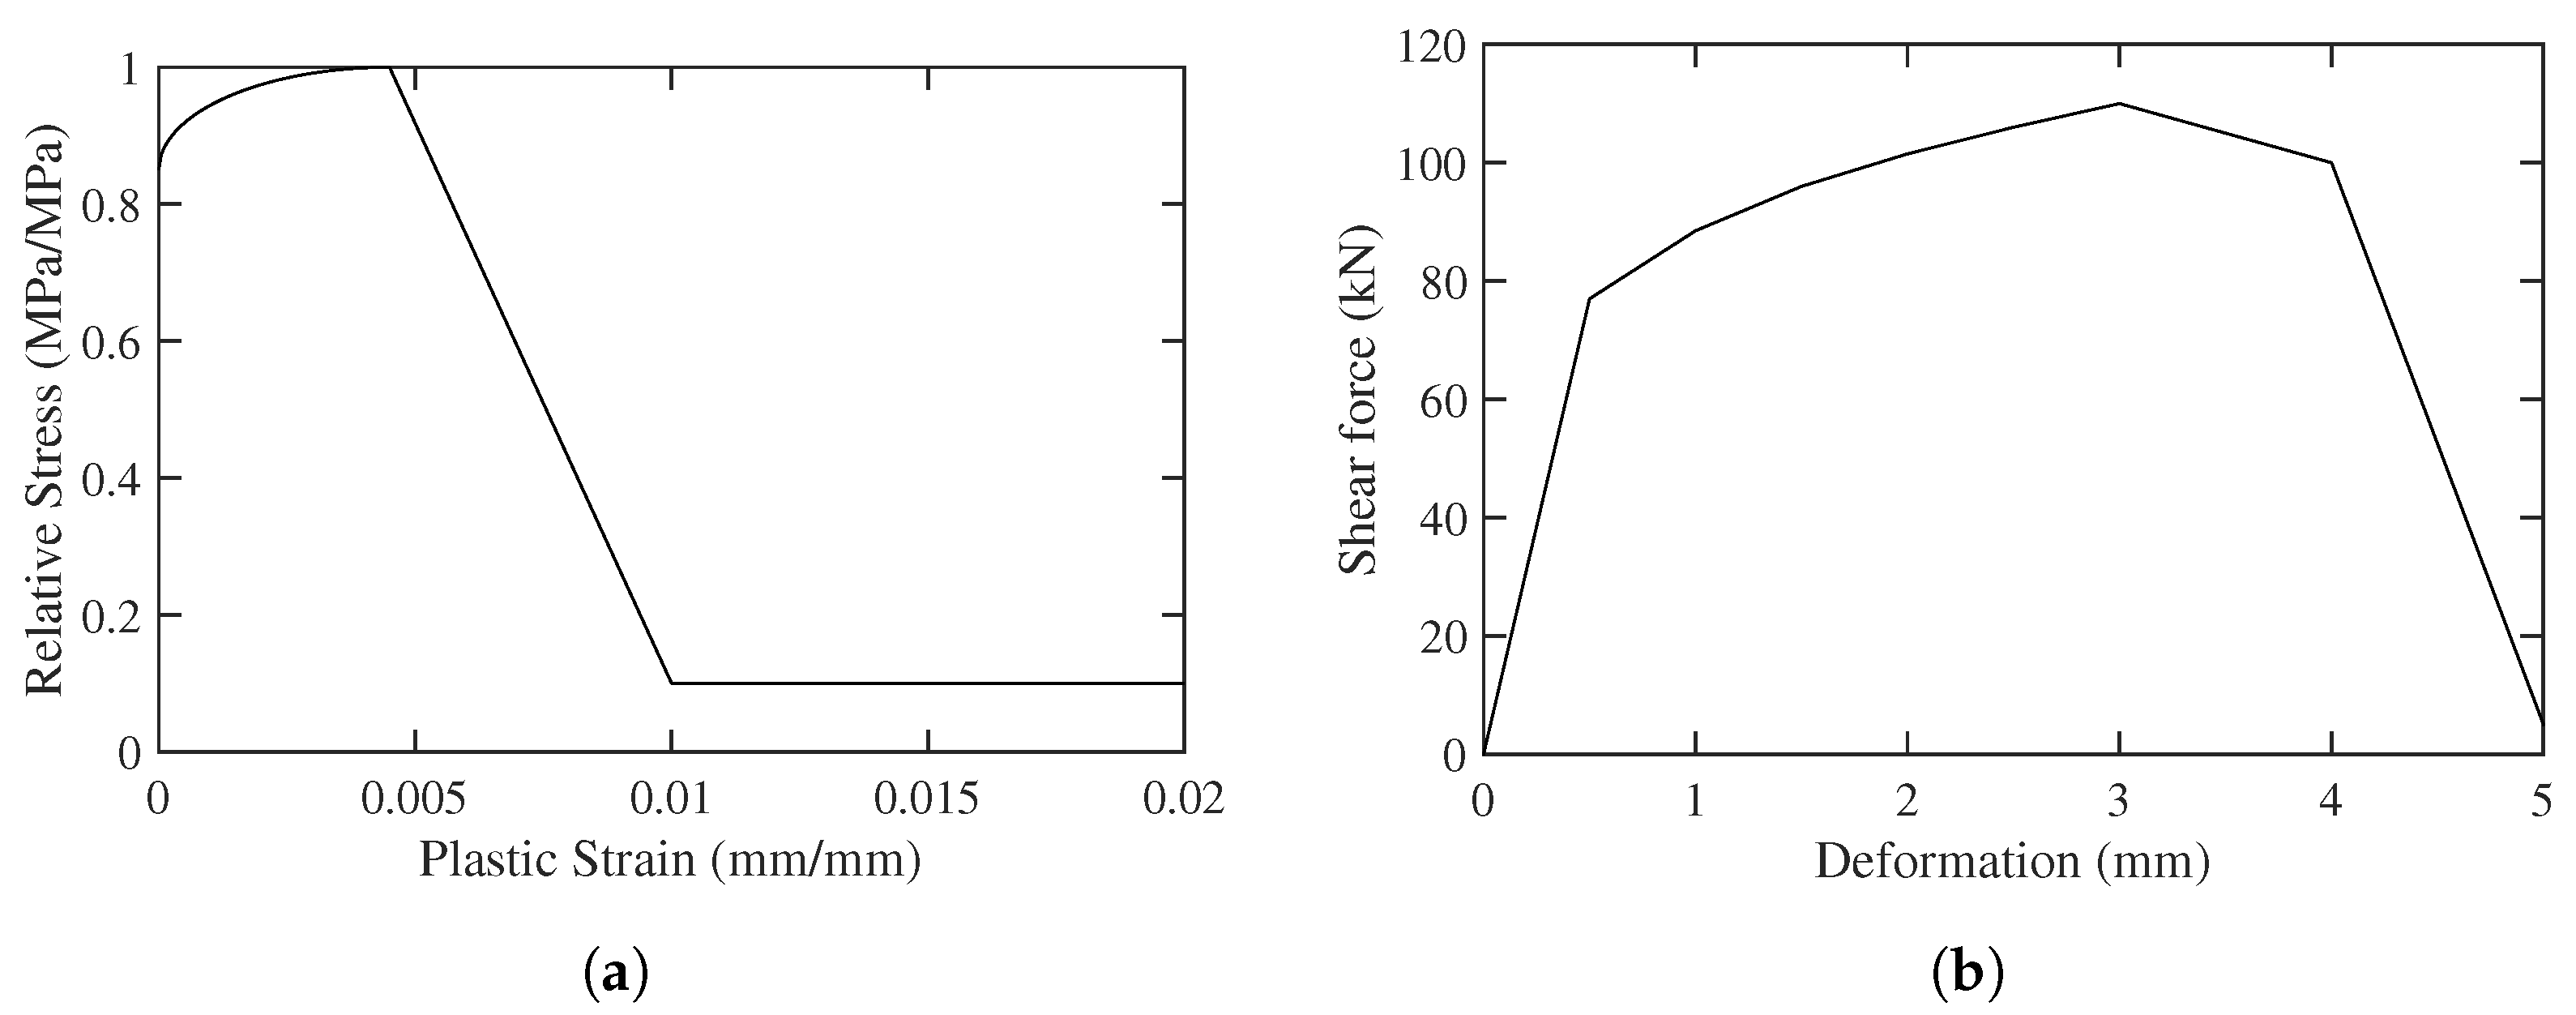
Several numerical models were proposed to quantify the relation between the shear force and slippage, among which the concrete design model code [33] provided the most straightforward equation, as shown in Equation (12). Based on the experimental results, the parameters were calibrated for both types of shear connectors, and the corresponding curves are shown along with the experimental results in Figure 8. 240 kN and 3 mm were adopted for the peak shear force and corresponding deformation, respectively, for stud connections, whereas kN and mm were adopted for the plate connectors.
4.2.2. Composite Beams under Positive Bending
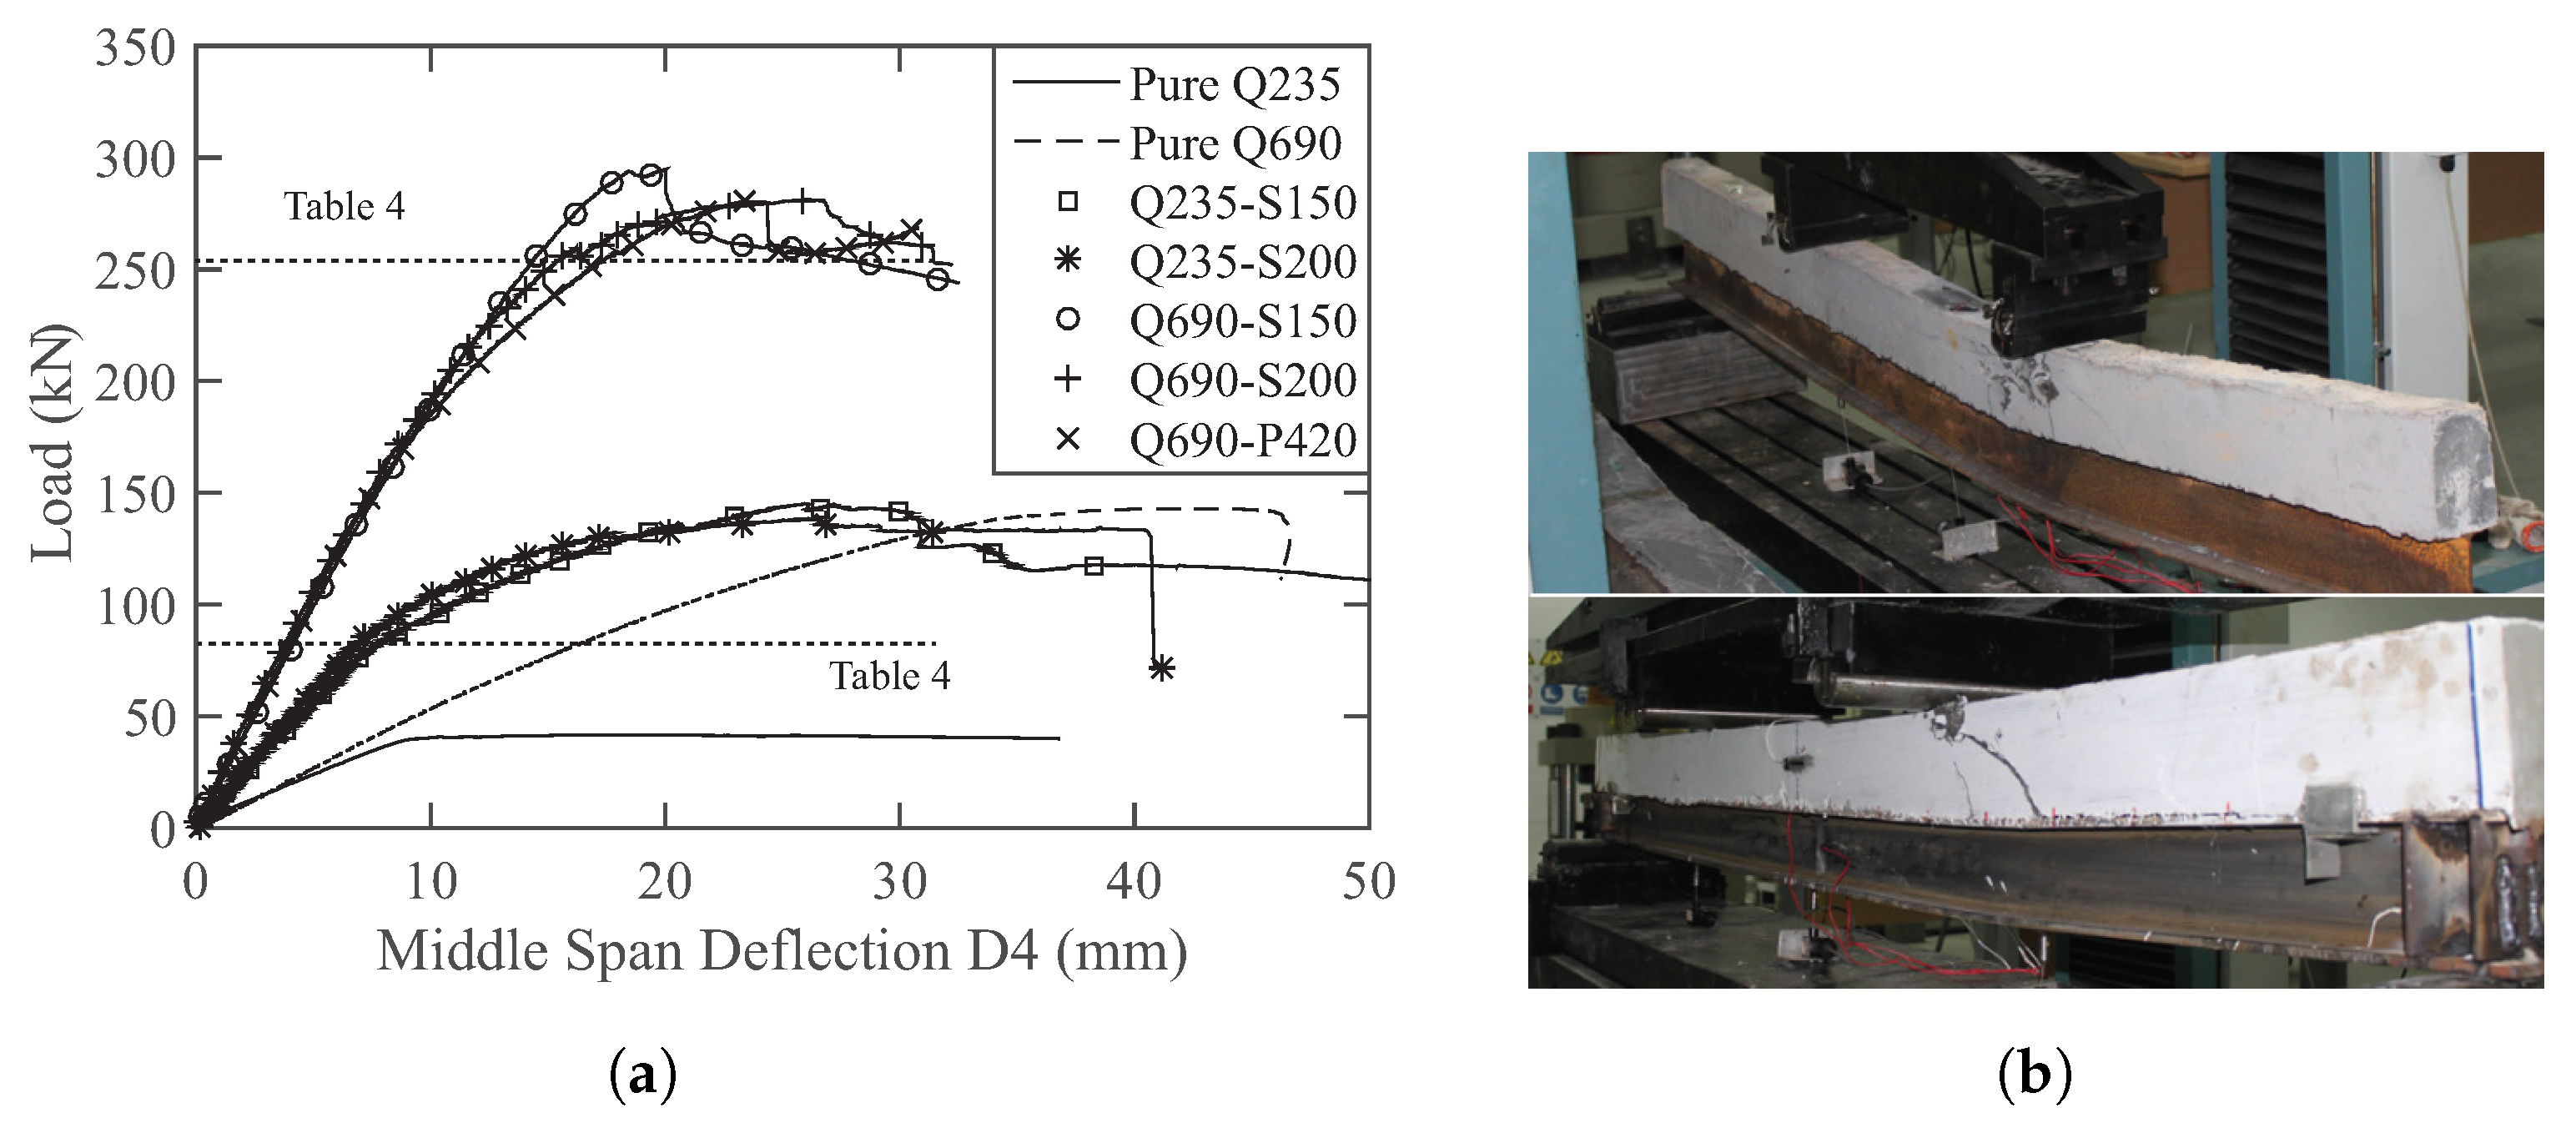
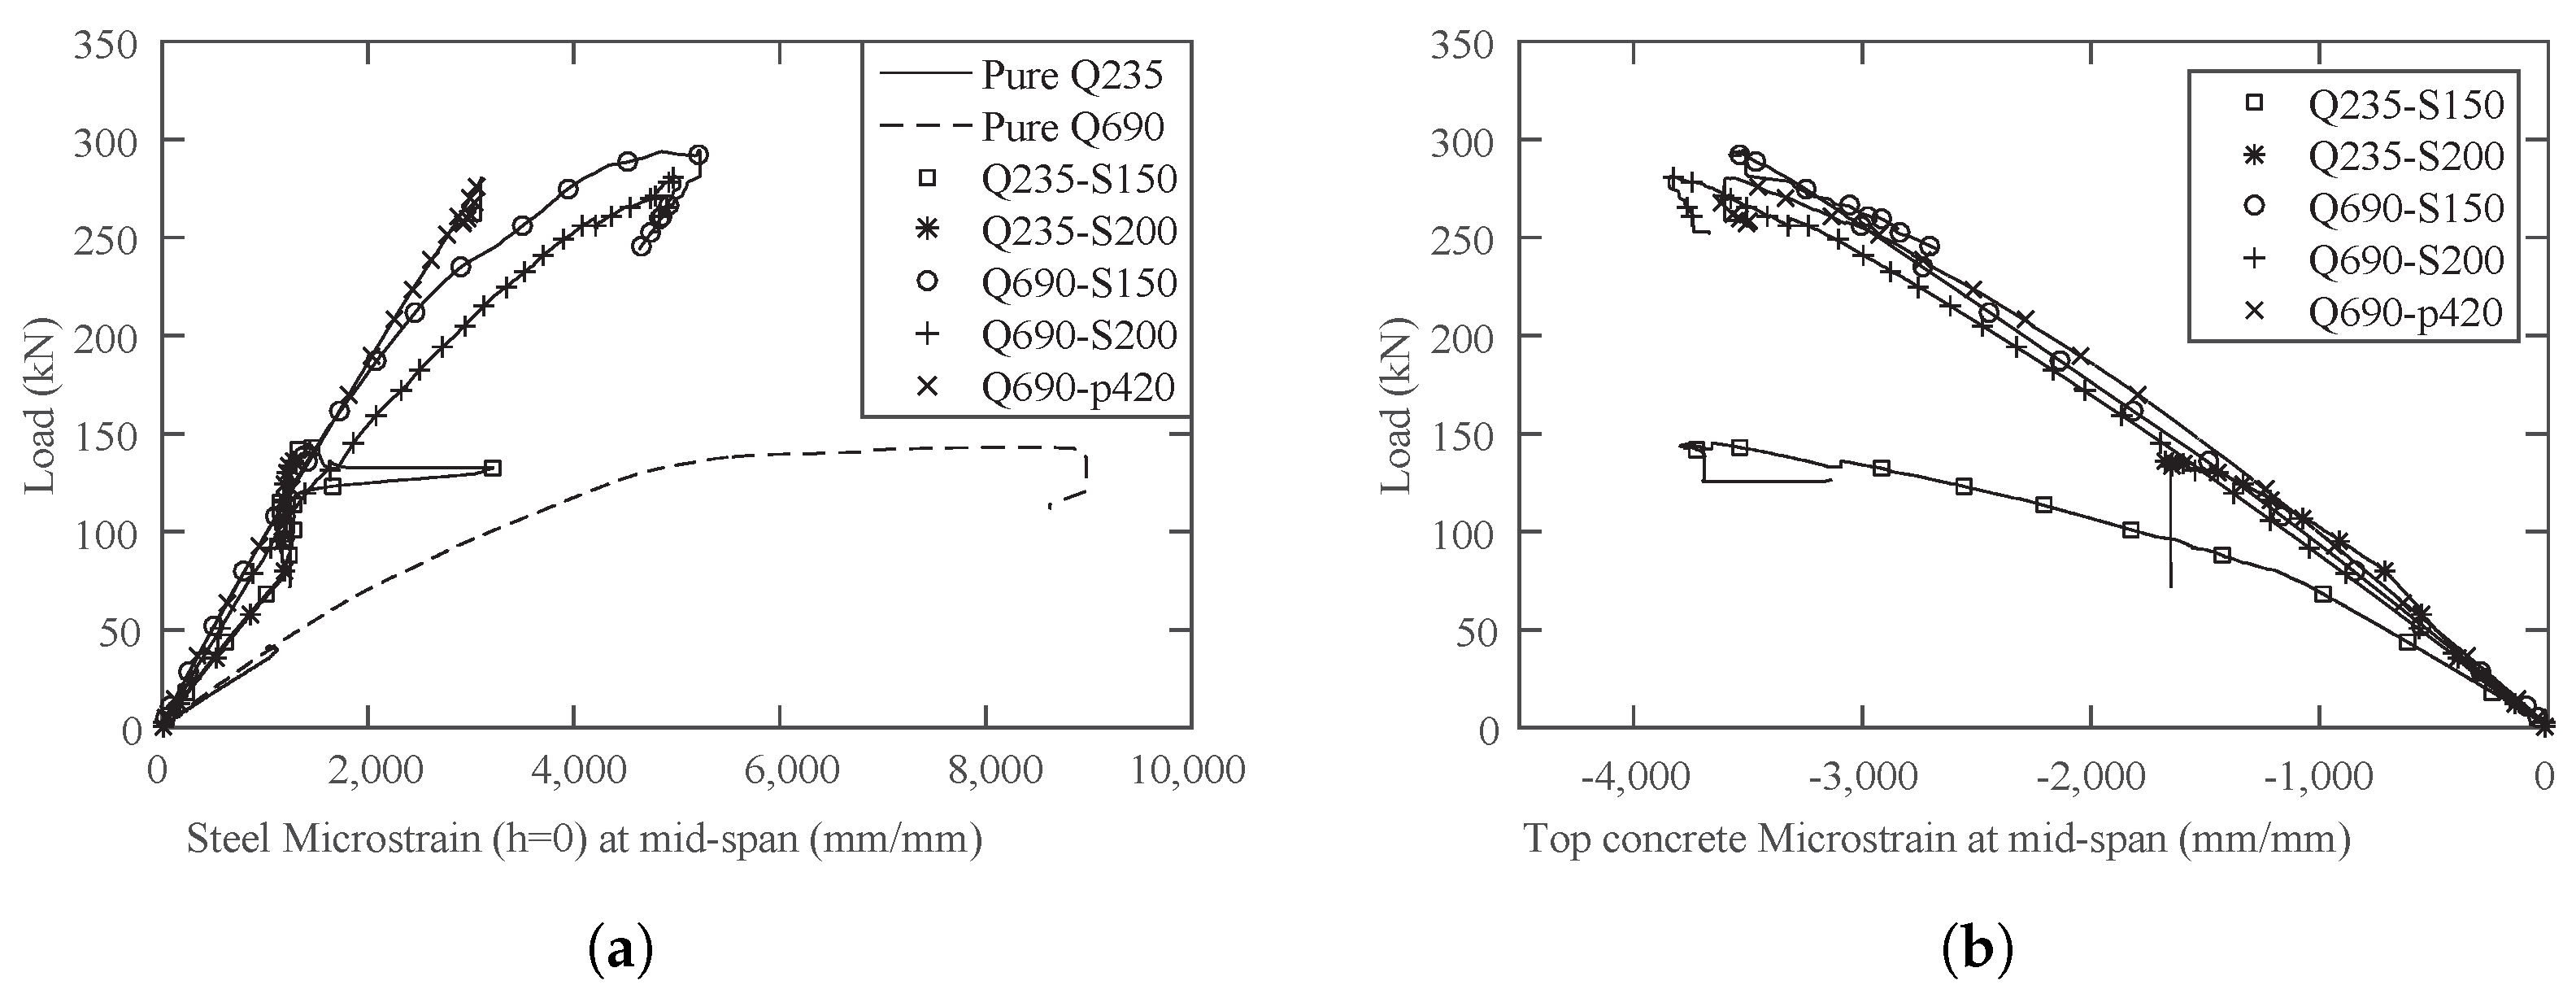
The combined load-versus-displacement curves for all five specimens under positive bending are shown in Figure 10a, and the corresponding load-versus-strain curves for the exterior surface of steel (S4) and concrete material (S5) are shown in Figure 11a and Figure 11b, respectively. Two typical concrete failure modes, the crushing of concrete near the loading point and shear cracking, are shown in Figure 10b.
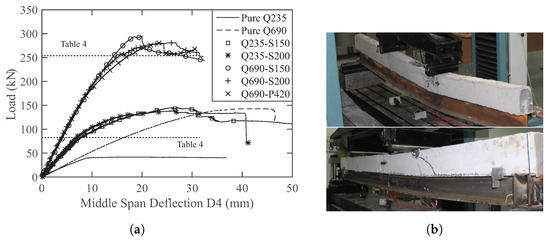
Figure 10.
Load versus deflection and concrete failure modes: (a) Combined load-versus-displacement curves; (b) Typical concrete failure modes.

Figure 11.
Combined load versus strain: (a) Load-versus-strain curves for S4; (b) Load-versus-steel curves for S5.
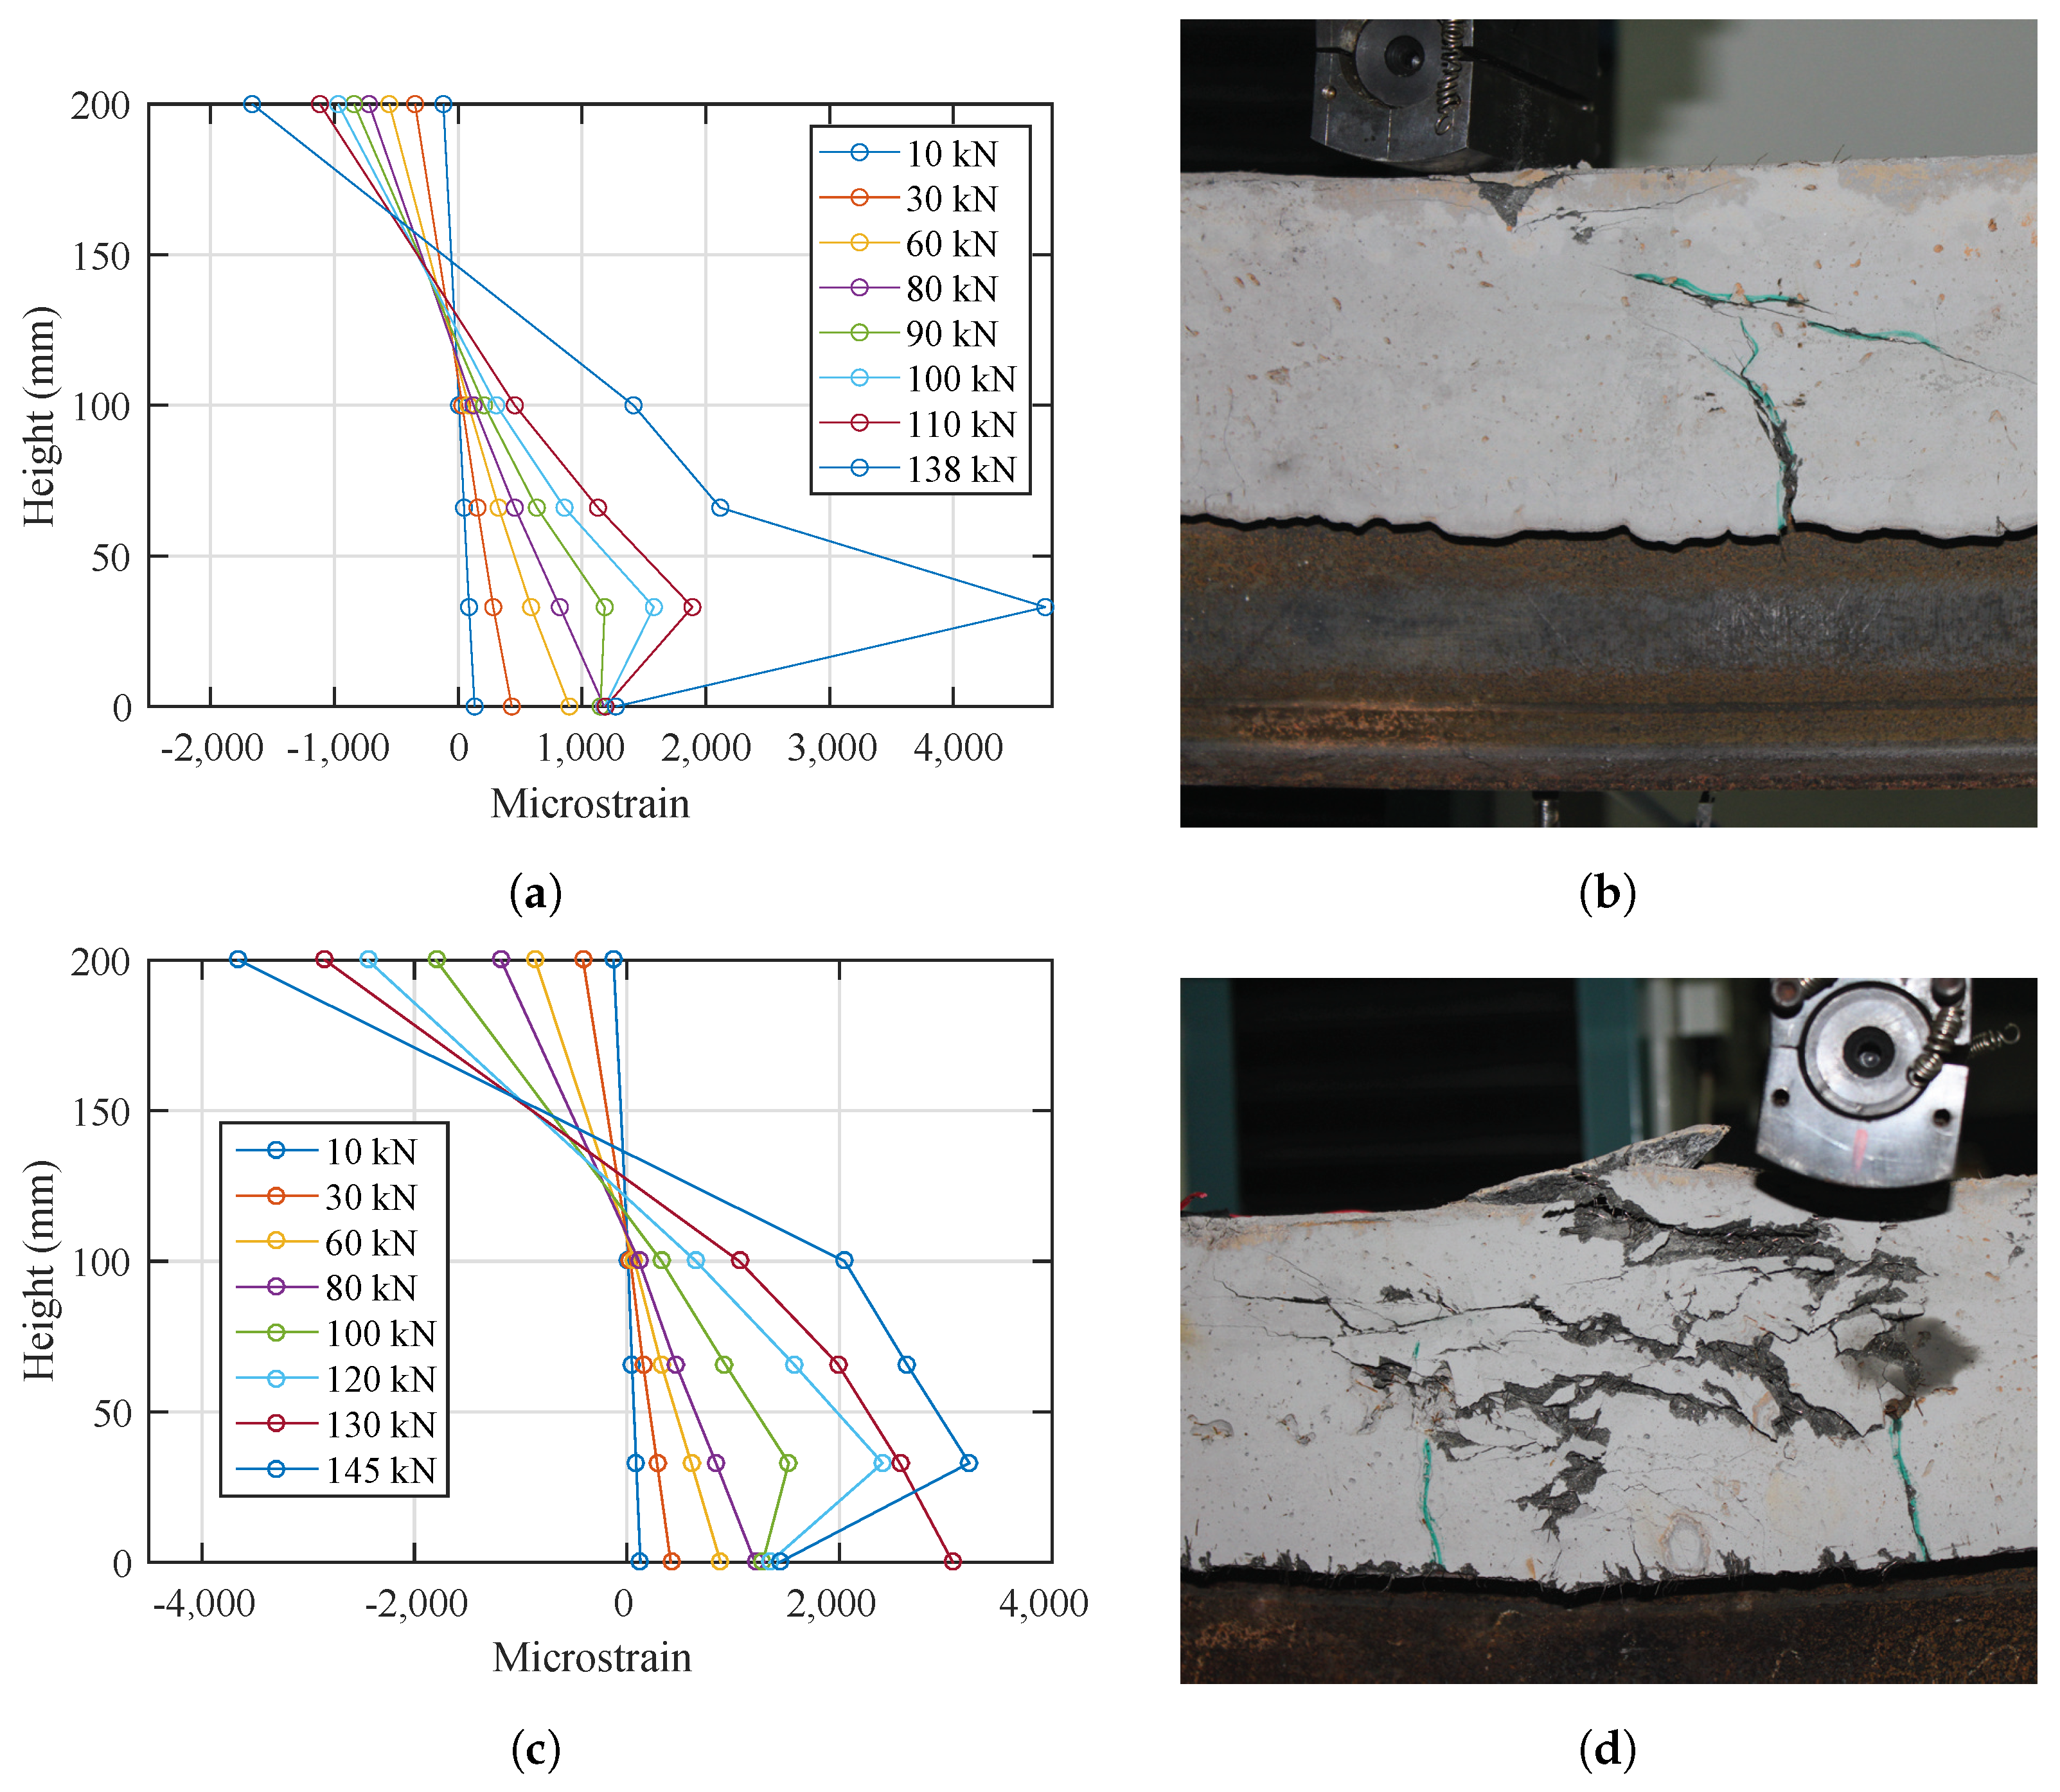
Both specimens with normal-strength steel (Q235-S150 and Q235-S200) reached an elastic load limit of around 75 kN and exhibited similar nonlinear load-versus-deflection responses up to the peak load. However, for specimen Q235-S200, a large noise was heard at load levels of 136 kN and 145 kN, associated with the failure of the shear studs. After that, a shear crack appeared and widened quickly in the top concrete layer near the point of loading, as shown in Figure 12b. The neutral axis moved up quickly and reached the center of the concrete layer, as shown in Figure 12a, at a load level of 138 kN. Lateral torsional buckling was observed a few seconds after the loud noise. Obvious lateral deformation was observed near one of the loading points, where the shear studs were already susceptible to being damaged. An end slippage of about 8 mm was observed at one end of the specimen.
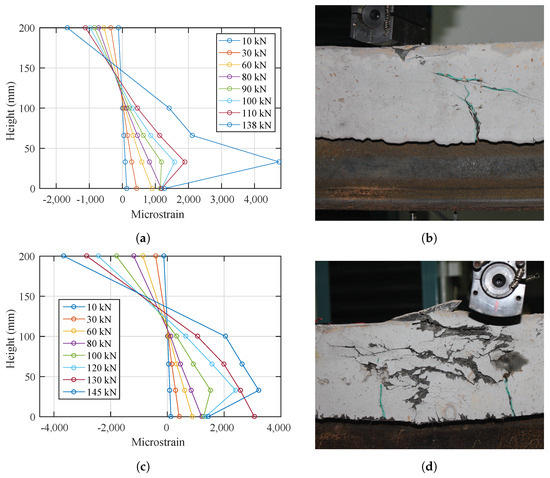
Figure 12.
Strain profiles and failures mode of specimens with Q235 material: (a) Q235-S200 strain profile; (b) Q235-S200 cracking; (c) Q235-S150 strain profile; (d) Q235-S150 cracking.
On the other hand, the specimen with smaller stud spacing at 150 mm failed in a more ductile manner, with over 80 mm middle span deflection and a residual resistance of around 100 kN, dropping from the peak load of 145 kN. The compressive strain at the middle span reached around 3500 microstrains, and the specimen failed due to the crushing of the concrete near the loading points. The region of concrete crushing gradually developed from the top of the concrete layer to the middle height of the concrete section, and the final crushing pattern is shown in Figure 12d. During the loading stage, no loud noise was heard, and no sign of shear stud failure was identified. No obvious slippage was observed after testing.
It should be noted that, probably due to the uneven distribution of the yield strain across the bottom flange, the strain gauge reading of a particular point on the bottom flange of steel may shift away from the average strain of the flange after yielding. Therefore, a strain reading of S4 will no longer be representative after exceeding the yield load.
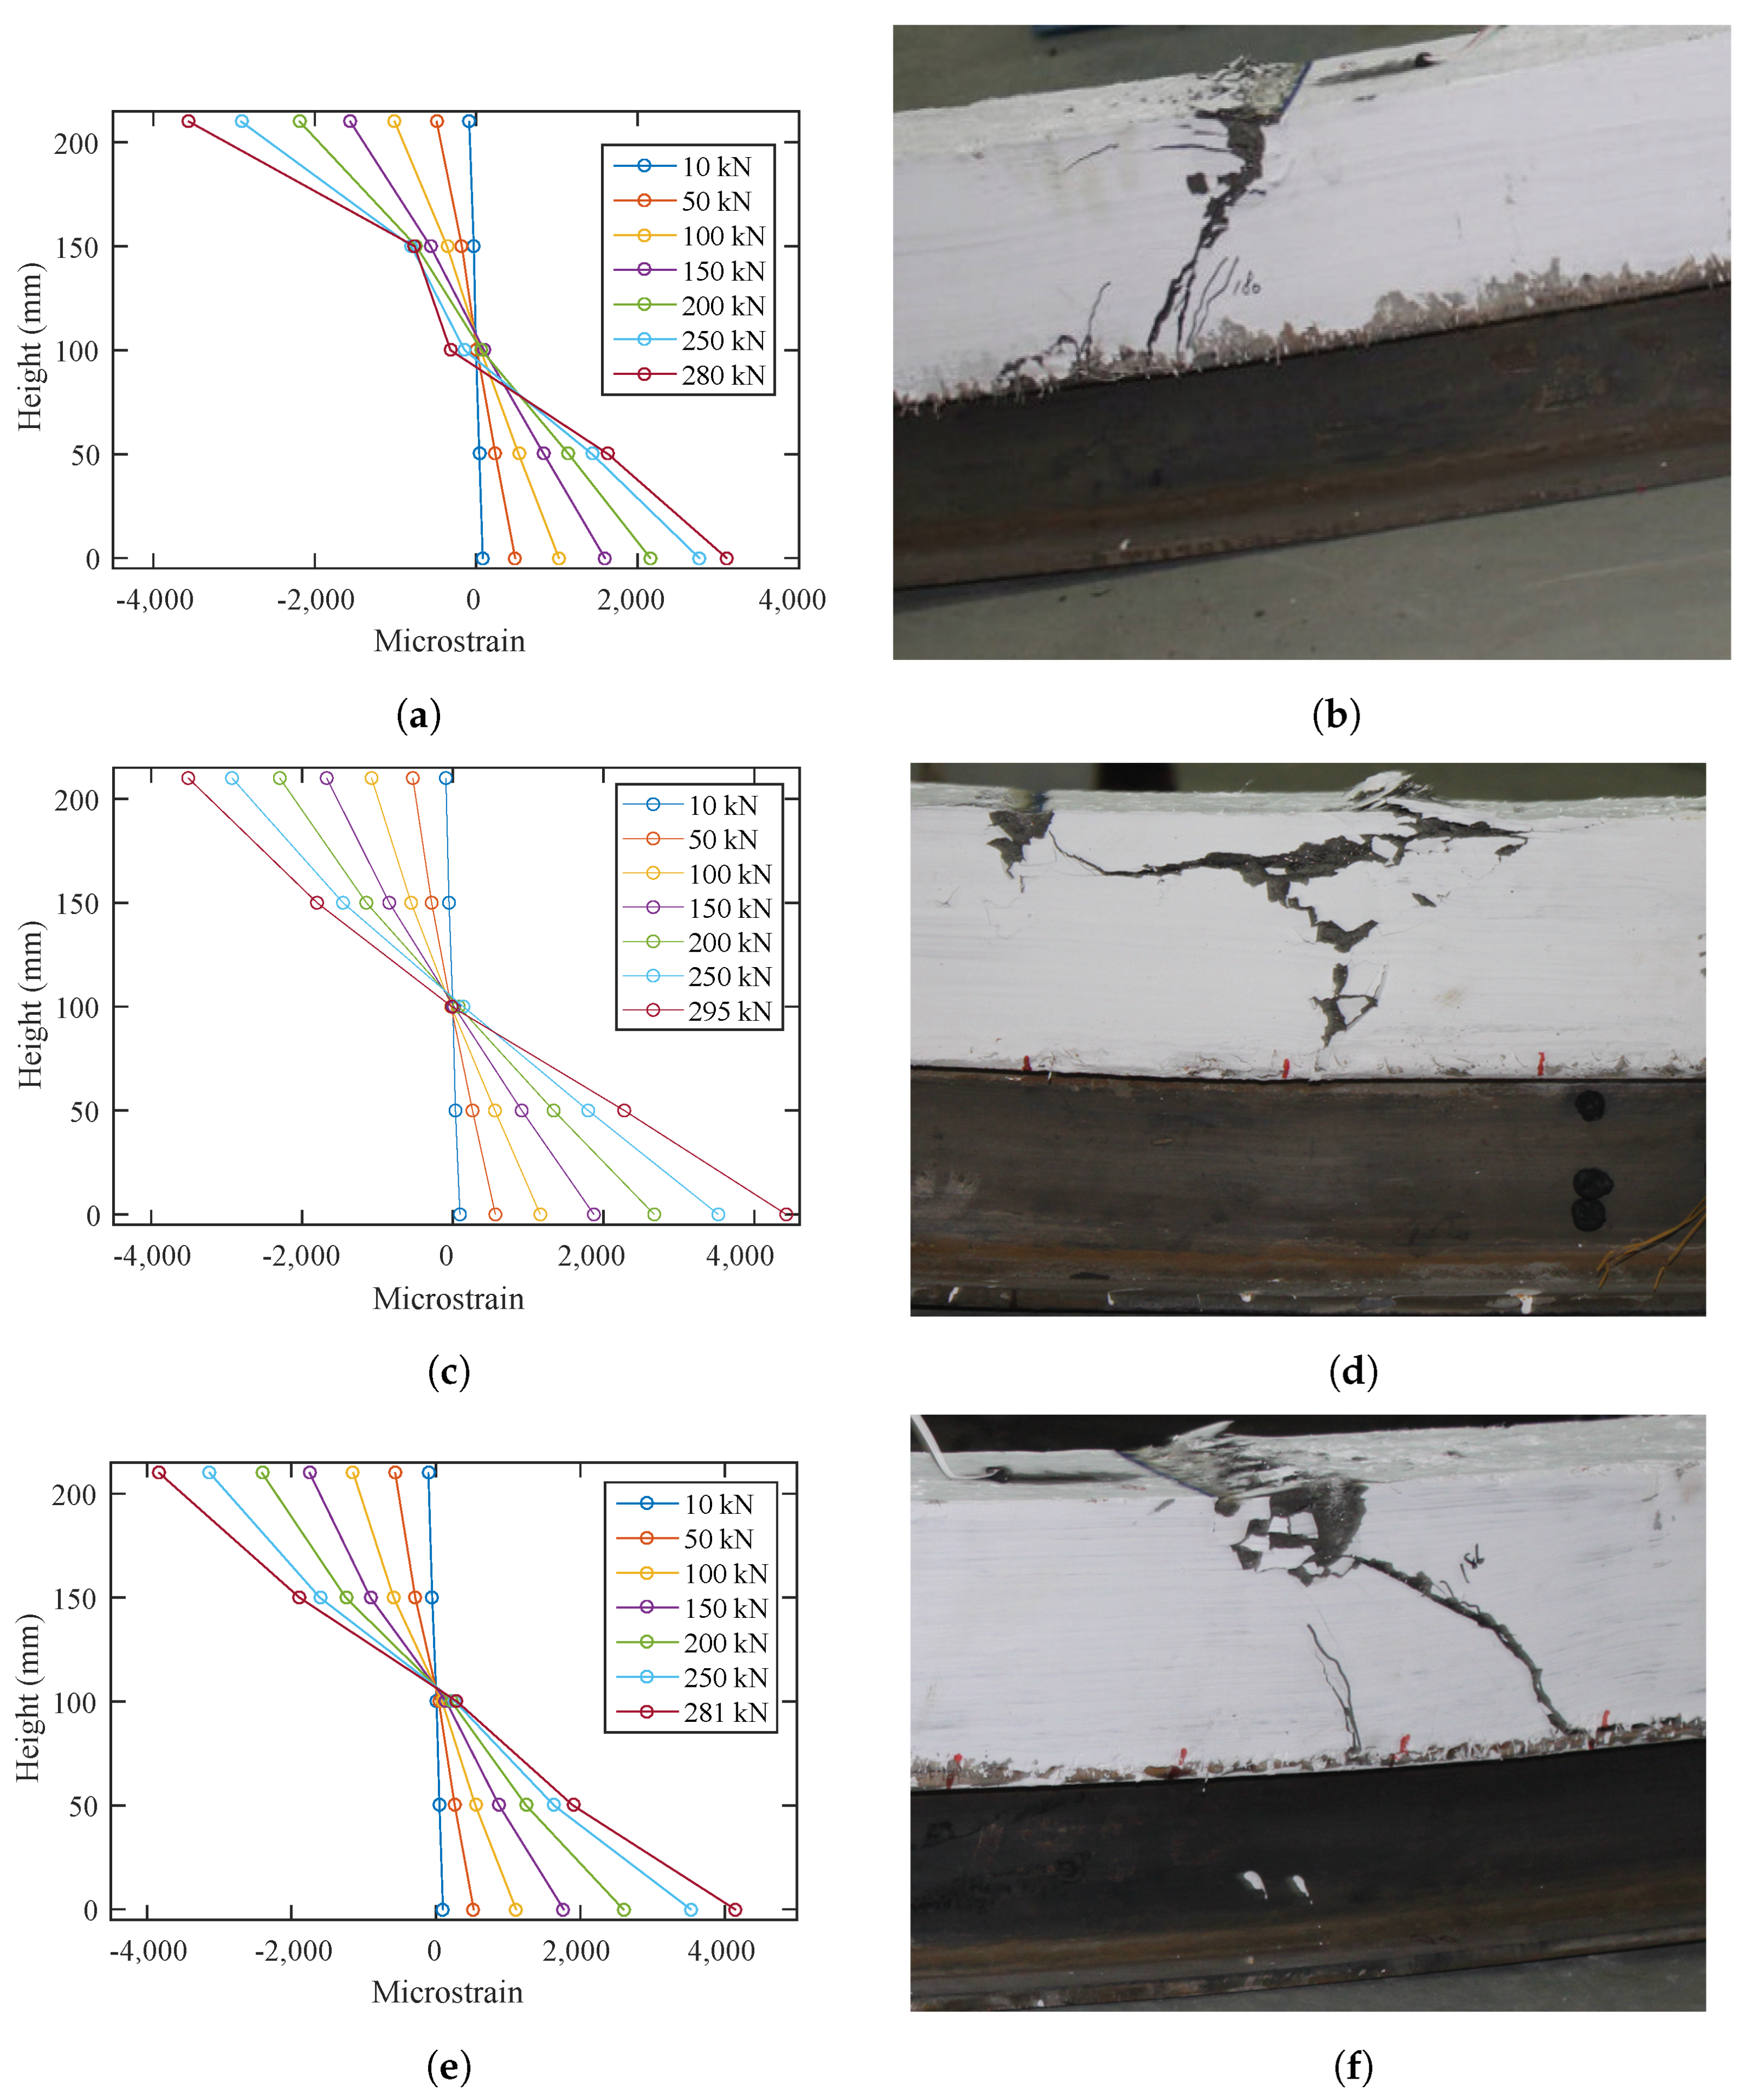
The three specimens with high-strength steel beams exhibited much higher ultimate flexural load capacities, as shown in Figure 10a. All three types of connections initially provided sufficient bonds and led to similar elastic stiffnesses, whereas the final failure modes were slightly different. The specimen with stud connectors at a spacing of 150 mm reached the highest ultimate load at 295 kN and failed due to the crushing of UHPFRC, as shown in Figure 13d. The crushing of concrete material was initiated at the exterior surface and extended into the lower layers. The steel section was all in tension during the whole loading history, as shown in Figure 13c. The specimen with larger stud spacing, at 200 mm, failed slightly differently, as shown in Figure 13f. Diagonal shear cracks appeared and widened before the concrete was crushed on the top. Generally speaking, the specimens with stud connectors exhibited less severe softening during nonlinear loading compared to the specimens with plate connectors, as shown in Figure 10a. Specimen Q690-P420 failed due to shear cracks and concrete crushing, as shown in Figure 13b. Relative slippage can be seen in the strain profile plot in Figure 13a, which led to the degradation of stiffness and softening, as shown in Figure 10a.
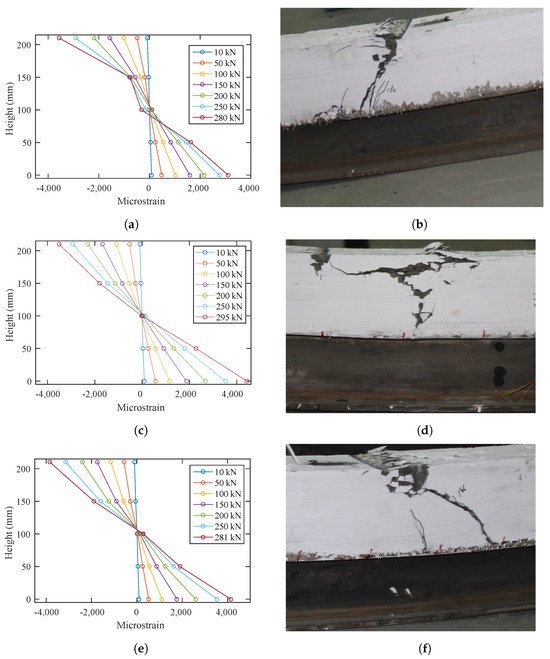
Figure 13.
Strain profiles and failure modes of specimens with Q690 material: (a) Strain profile: Q690-P; (b) Local failure: Q690-P; (c) Strain profile: Q690-S150; (d) Local failure: Q690-S150; (e) Strain profile: Q690-S200; (f) Local failure: Q690-S200.
5. Finite Element Analysis
5.1. Methods
Finite element analyses were performed using Ansys® software. The geometries, meshes, and boundary conditions are shown in Figure 14 for the two composite beam models under positive and negative bending scenarios. Eight-node solid elements were used for modeling the concrete part, whereas four-node shell elements were used for the steel beam. Combin39 elements were used, as shown in Figure 15b, to simulate the shear connection between concrete and steel, which can incorporate the load-versus-deformation relation obtained from the push-out tests. The different spacings of the shear connectors were taken into account, as shown in Figure 14, with a spacing of 150 mm for the model on the top and 200 mm for the model on the bottom.
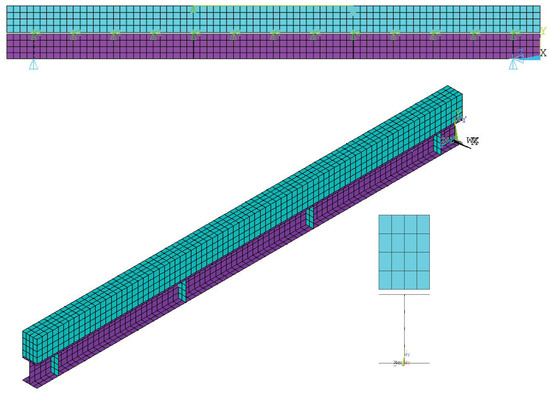
Figure 14.
Finite element models.

Figure 15.
FEM parameter plots: (a) Plasticity responses in compression; (b) Load versus deformation for the stud connector.
A bilinear elastic-isotropic hardening constitutive model was adopted for steel. Different yielding stresses of 235 MPa and 710 MPa were used for normal- and high-strength steel, respectively. Drucker–Prager concrete material was used for the UHPFRC with the input parameters shown in Table 6. The input parameters included the uniaxial tensile strength (), compressive strength (), and modulus of elasticity (), as well as the biaxial compressive strength (). After the yielding of the material, a linear hardening and softening model was used for compression, as shown in Figure 15a, with the shape of the curve governed by the parameters , , , and . On the other hand, a linear softening model was used in the tensile responses, determined by the parameters and .
Table 6.
Parameters for Drucker–Prager concrete material.
5.2. Results
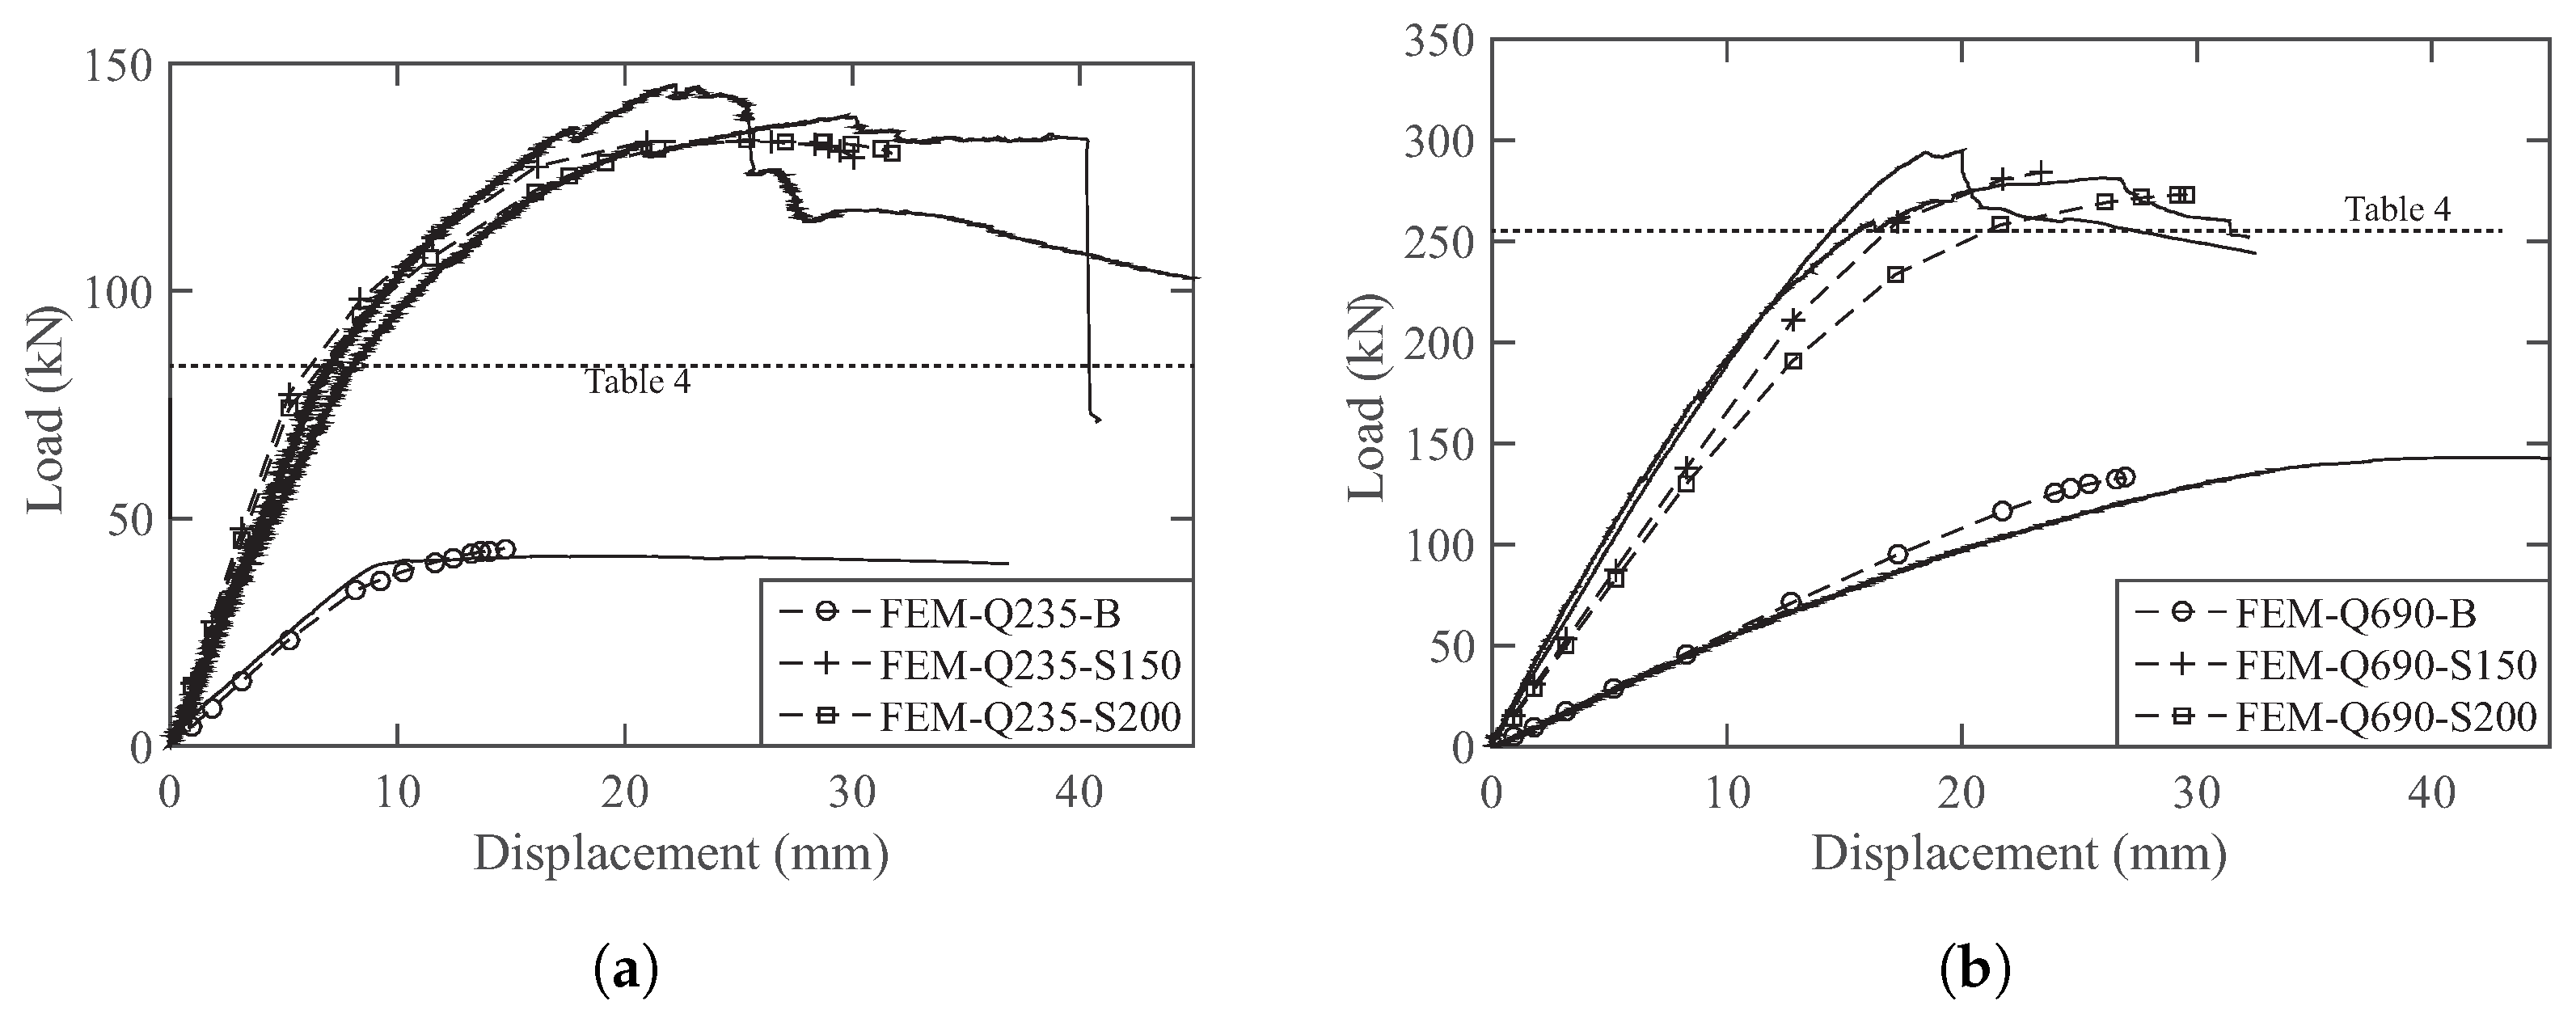
The load-versus-displacement curves from the experiment and finite element analyses are shown in Figure 16a,b for normal- and high-strength steel beams, respectively. The structural responses of pure steel beams were also obtained experimentally and numerically. These two responses aligned well with the FEM results in slightly overestimating the stiffness of the high-strength steel beam. Regarding the predictions of the flexural behavior of the composite beam, the load–deflection curves from the FEM captured the stiffness and ultimate strength for specimens Q235-S150/200. Although the difference between the two specimens was not as obvious in the FEM results as it was in the experimental results, the finite element model underestimated the initial stiffness of specimens Q690-S150/200, whereas the peak flexural loading was close to the experimental results. The difference in the initial stiffness can be attributed to the small friction that existed in the supports.
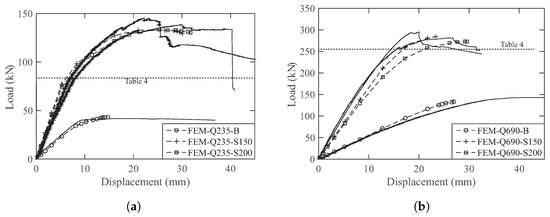
Figure 16.
Comparison of load-versus-displacement responses: (a) Beams with normal-strength steel; (b) Beams with high-strength steel.
6. Conclusions
Analytical and experimental investigations were performed on composite beams with UHPFRC material. An equation for estimating the critical elastic moment capacity of the composite section assuming full composite action was proposed. This equation was verified using a four-point bending test of a simply supported beam with a symmetric steel beam made of materials with low- and high-yielding strength. The following conclusions can be made based on the investigation in this study.
- An exact and approximate equation for calculating the critical elastic moment resistance was derived. It was found that by using UHPFRC and high-strength steel with a yielding strength of 690 MPa, this critical state can be reached by adopting a UHPFRC top layer with a similar width to the steel flange and a similar height to the steel section.
- When using a UHPFRC top layer for a composite beam, the design reaches critical state performance when fully utilizing the material, whereas any deviation from this status usually leads to a reduction in the elastic moment resistance with the same volume of UHPFRC material.
- Composite beams made of UHPFRC and high-strength steel have significant shear force transfer demand on the shear connectors. Steel plate connectors exhibit higher shear resistance compared to stud connectors and show a more ductile failure pattern before the brittle fracture of welding. However, the spacing of this type of high-shear-resist connection should be well controlled to avoid shear cracks that can develop between the connectors.
- The proposed finite element model, with the estimated material properties under axial and biaxial stress conditions, provides an acceptable estimation of a composite beam’s performance when its failure is due to steel yielding or concrete crushing.
- Although composite beams with UHPFRC and high-strength steel have a much higher resistance compared to those with normal concrete and normal steel, their ductility is limited. This is because of the failure due to the local crushing of UHPFRC material or the brittle failure of shear connectors.
The author would like to also mention the following limitations and aspects of the presented work:
- The small-scale push-out tests were carried out as preliminary investigations, and the results might be different from those of the full-scale test due to the size effects.
- The finite element results are based on the estimated material performance under biaxial compression and uniaxial tension. The actual properties of the material under these conditions might be different from the values adopted in this study, thus affecting the results of the FEM model.
- The width and height of the critical top concrete layer might be unrealistic for slab applications. However, a composite beam with a narrow UHPFRC layer could be a potential solution to the standalone moment-resistant structural component when high elastic stiffness is desired with strictly controlled dimensions. UHPFRC joints that connect the precast concrete panels and the high-strength steel beam may also utilize the proposed equation to estimate the elastic moment resistance.
Funding
This research was funded by the Jiangsu Key Laboratory of Structural Engineering Programme, Grant No. ZD1801.
Data Availability Statement
The data that support the findings of this study are available from the corresponding author upon reasonable request. The data are not publicly available due to privacy restrictions.
Acknowledgments
The support received by technicians in the Structural Laboratory of Xi’an Jiaotong-Liverpool University is appreciated.
Conflicts of Interest
The author declares no conflict of interest. The funders had no role in the design of the study; in the collection, analyses, or interpretation of data; in the writing of the manuscript; or in the decision to publish the results.
References
- Nie, J.; Li, H.; Liang, T. Experimental study on HSS-concrete composite beams. J. Build. Struct. 2009, 30, 64–69. [Google Scholar]
- Jiang, J.; Ye, Z.J.; Bao, W.; Wang, X.; Wang, Y.B.; Dai, X.H. Flexural buckling behaviour of 690 MPa high strength steel H-section columns. Eng. Struct. 2019, 200, 109718. [Google Scholar] [CrossRef]
- Hu, F.; Shi, G.; Shi, Y. Experimental study on seismic behavior of high strength steel frames: Global response. Eng. Struct. 2017, 131, 163–179. [Google Scholar] [CrossRef]
- Qu, S.Z.; Wu, X.H.; Sun, Q. Experimental and numerical study on ultimate behaviour of high-strength steel tubular K-joints with external annular steel plates on chord circumference. Eng. Struct. 2018, 165, 457–470. [Google Scholar] [CrossRef]
- Fehling, E.; Schmidt, M.; Walraven, J.; Leutbecher, T.; Fröhlich, S. Ultra-High Performance Concrete UHPC; Wilhelm Ernst & Sohn: Hoboken, NJ, USA, 2014. [Google Scholar]
- Yoo, D.Y.; Banthia, N. Mechanical properties of ultra-high-performance fiber-reinforced concrete: A review. Cem. Concr. Compos. 2016, 73, 267–280. [Google Scholar] [CrossRef]
- Saleem, M.A.; Mirmiran, A.; Xia, J.; Mackie, K. Ultra High Performance Concrete Bridge Deck Reinforced with High-Strength Steel. ACI J. 2011, 108, 601–609. [Google Scholar]
- Zhu, L.; Nie, J.G.; Li, F.X.; Ji, W.Y. Simplified analysis method accounting for shear-lag effect of steel—Concrete composite decks. J. Constr. Steel Res. 2015, 115, 62–80. [Google Scholar] [CrossRef]
- Mészöly, T.; Randl, N. Shear behavior of fiber-reinforced ultra-high performance concrete beams. Eng. Struct. 2018, 168, 119–127. [Google Scholar] [CrossRef]
- Association Française de Génie Civil. Ultra High Performance Fibre-Reinforced Concretes; Association Française de Génie Civil: Paris, France, 2002. [Google Scholar]
- GB 50017-2017; Standard for Design of Steel Structures. Chinese National Standards: Beijing, China, 2017.
- Li, H.T.; Young, B. Residual mechanical properties of high strength steels after exposure to fire. J. Constr. Steel Res. 2018, 148, 562–571. [Google Scholar] [CrossRef]
- EN 1994-1-1; Eurocode 4: Design of Composite Steel and Concrete Structures-Part 1-1: General Rules and Rules for Buildings. British Standards Institution: London, UK, 1994; Volume 3.
- Kim, J.S.; Kwark, J.; Joh, C.; Yoo, S.W.; Lee, K.C. Headed stud shear connector for thin ultrahigh-performance concrete bridge deck. J. Constr. Steel Res. 2015, 108, 23–30. [Google Scholar] [CrossRef]
- Wang, J.Y.; Guo, J.Y.; Jia, L.J.; Chen, S.M.; Dong, Y. Push-out tests of demountable headed stud shear connectors in steel-UHPC composite structures. Compos. Struct. 2017, 170, 69–79. [Google Scholar] [CrossRef]
- Qi, J.; Wang, J.; Li, M.; Chen, L. Shear capacity of stud shear connectors with initial damage: Experiment, FEM model and theoretical formulation. Steel Compos. Struct. 2017, 25, 79–92. [Google Scholar]
- Ding, F.X.; Yin, G.A.; Wang, H.B.; Wang, L.; Guo, Q. Behavior of headed shear stud connectors subjected to cyclic loading. Steel Compos. Struct. 2017, 25, 705–716. [Google Scholar]
- Xu, C.; Su, Q.; Masuya, H. Static and fatigue performance of stud shear connector in steel fiber reinforced concrete. Steel Compos. Struct. 2017, 24, 467–479. [Google Scholar]
- He, Z.Q.; Ou, C.; Tian, F.; Liu, Z. Experimental Behavior of Steel-Concrete Composite Girders with UHPC-Grout Strip Shear Connection. Buildings 2021, 11, 182. [Google Scholar] [CrossRef]
- Fang, Z.; Fang, S.; Liu, F. Experimental and Numerical Study on the Shear Performance of Short Stud Shear Connectors in Steel and UHPC Composite Beams. Buildings 2022, 12, 418. [Google Scholar] [CrossRef]
- He, S.; Xu, Y.; Zhong, H.; Mosallam, A.S.; Chen, Z. Investigation on interfacial anti-sliding behavior of high strength steel-UHPC composite beams. Compos. Struct. 2023, 316, 117036. [Google Scholar] [CrossRef]
- Yoo, S.W.; Choo, J.F. Evaluation of the flexural behavior of composite beam with inverted-T steel girder and steel fiber reinforced ultra high performance concrete slab. Eng. Struct. 2016, 118, 1–15. [Google Scholar] [CrossRef]
- Li, W.; Shao, X.; Fang, H.; Zhang, Z. Experimental study on flexural behavior of steel-UHPC composite slabs. China Civ. Eng. J. 2015, 48, 93–102. [Google Scholar]
- Chen, D.; El-Hacha, R. Behaviour of hybrid FRP-UHPC beams in flexure under fatigue loading. Compos. Struct. 2011, 94, 253–266. [Google Scholar] [CrossRef]
- Liu, S.; Wang, B.; Zheng, Y.; Mo, S.; Zhang, Q.; Zhou, P. Experimental and Computational Research on the Shear Performance of Partially Filled Narrow-Width Steel Box-UHPC-Combined Girders under Negative Moment Action. Buildings 2023, 13, 2749. [Google Scholar] [CrossRef]
- Liu, X.; Bradford, M.A.; Chen, Q.j.; Ban, H. Finite element modelling of steel—Concrete composite beams with high-strength friction-grip bolt shear connectors. Finite Elem. Anal. Des. 2016, 108, 54–65. [Google Scholar] [CrossRef]
- Yan, J.B.; Li, Z.X.; Xie, J. Numerical and parametric studies on steel-elastic concrete composite structures. J. Constr. Steel Res. 2017, 133, 84–96. [Google Scholar] [CrossRef]
- Yan, J.B.; Zhang, W.; Liew, J.Y.R.; Li, Z.X. Numerical studies on shear resistance of headed stud connectors in different concretes under Arctic low temperature. Mater. Des. 2016, 112, 184–196. [Google Scholar] [CrossRef]
- Fang, G.; Wang, J.; Li, S.; Zhang, S. Dynamic characteristics analysis of partial-interaction composite continuous beams. Steel Compos. Struct. 2016, 21, 195–216. [Google Scholar] [CrossRef]
- Guo, J.; Zhou, Z.; Zou, Y.; Zhang, Z.; Jiang, J. Finite Element Analysis of Precast Concrete Deck-Steel Beam-Connection Concrete (PCSC) Connectors Using Ultra-High Performance Concrete (UHPC) for the Composite Beam. Buildings 2022, 12, 1402. [Google Scholar] [CrossRef]
- Kabir, M.I.; Mia, M.M.; Islam, K. Numerical and analytical investigations on the flexural behaviours of composite beams of inverted-T steel section and ultra-high-performance concrete (UHPC) slab. Structures 2023, 57, 105087. [Google Scholar] [CrossRef]
- BS EN 12390; Testing Hardened Concrete-Part3: Compressive Strength of Test Specimens. British Standards Institution: London, UK, 2011.
- International Federation for Structural Concrete. Fib Model Code for Concrete Structures; International Federation for Structural Concrete: Cambridge, UK, 2010. [Google Scholar]


Disclaimer/Publisher’s Note: The statements, opinions and data contained in all publications are solely those of the individual author(s) and contributor(s) and not of MDPI and/or the editor(s). MDPI and/or the editor(s) disclaim responsibility for any injury to people or property resulting from any ideas, methods, instructions or products referred to in the content. |
© 2024 by the author. Licensee MDPI, Basel, Switzerland. This article is an open access article distributed under the terms and conditions of the Creative Commons Attribution (CC BY) license (https://creativecommons.org/licenses/by/4.0/).