Article

Study on Thermodynamic Properties of Spiral Tube-Encapsulated Phase-Change Material Energy Pile

1
School of Civil Engineering, Qingdao University of Technology, Qingdao 266520, China
2
Committee for the Promotion of Building Energy Conservation Technology, China Association of Building Energy Efficiency, Beijing 100835, China
*
Author to whom correspondence should be addressed.
Buildings 2024, 14(1), 188; https://doi.org/10.3390/buildings14010188
Submission received: 6 December 2023 / Revised: 8 January 2024 / Accepted: 9 January 2024 / Published: 11 January 2024

Abstract

:
Based on the research status of phase-change material (PCM) energy piles, this paper proposes a new type of PCM energy pile-spiral tube-encapsulated PCM energy pile. In order to study the related properties of the energy pile, this study designed and processed the relevant test equipment and built an indoor scale model experimental system. The thermodynamic performance of the spiral tube-encapsulated phase-change energy pile under summer conditions was studied by the test system. Through the indoor scale model test, it is found that compared with the traditional energy pile, the spiral tube-encapsulated PCM energy pile improves the heat exchange capacity of the unit pile body in the early and middle stages of operation, and reduces the surface temperature of the pile body and the heating rate of the surface temperature of the pile body. The upward displacement of the energy pile top is reduced. The heat exchange capacity of the unit pile depth is increased by 6.52 W/m, the maximum pile surface temperature difference is 0.62 °C, and the maximum pile top displacement difference is 0.005 mm. In addition, the total heat transfer of the spiral tube-encapsulated PCM energy pile during the whole operation period is 3.38% higher than that of the traditional energy pile. However, during the whole operation period, the surface stress value of the spiral tube encapsulated PCM energy pile is higher than that of the traditional energy pile. The maximum difference between the two is 9.84 kPa and the maximum difference is 10.8%. The difference between the two is finally stabilized at 1.4 kPa with an increase in time, and the final difference is only 8.8%.

1. Introduction

Energy pile is a kind of building emission-reduction technology using geothermal energy. It provides energy to meet most of the heating and cooling needs of buildings and has a smaller environmental impact [1]. Phase-change material (PCM) refers to the material that changes the state of the material and can provide latent heat when the temperature is constant. The process of material state transition is called the phase transition process, in which the PCM will absorb or release a large amount of latent heat. Improving the working performance of energy piles by combining PCM with energy piles is a new direction in the research field of energy piles.
There have been many research results in the field of energy piles at home and abroad. Zakharov et al. [2] found that the thermal conductivity of soil has the greatest influence on the heat exchange efficiency between soil and energy pile. Elzeiny Rehab et al. [3] found that the temperature distribution of the energy pile was relatively uniform along the pile length in the cooling experiment. Zhi Chen et al. [4] found that the strain distribution was uniform during the heat transfer process when the heat exchangers in the energy piles were symmetrically arranged through an in situ test of the energy piles. Qi He et al. [5] found that the heat transfer coefficient of the pile–soil interface between the cooling mode and the heating mode of the energy pile may be different through the case study of the existing energy pile. Thaise da Silva Oliveira Morais et al. [6] found that the seasonal variation of soil saturation along the pile and the change in groundwater level will affect the thermal conductivity of the soil around the pile by studying the influence of climate on the energy pile. Based on the indoor model test, Chang et al. [7] found that the thermal stress of the pile body first increases and then decreases with the increase in depth. When the working load is applied, the settlement displacement of the pile top accumulates with the increase in the number of cycles. Mohammed Faizal et al. [8] found that the cold and hot cyclic loading of energy piles can improve the utilization rate of geothermal energy and reduce the thermal impact of long-term operation of ground-source heat pumps on the ground. Wenke Zhang et al. [9] found that groundwater seepage is conducive to improving the performance of energy piles through three-dimensional simulation studies. Di Wu et al. [10] found that when the energy pile is subjected to a heating cycle, the temperature of the energy pile, the soil temperature, and the pore water pressure caused by the temperature will change irreversibly. Mohammed Faizal et al. [11] found that frequent cyclic temperature changes combined with the load of the building structure will not lead to the thermally induced plastic deformation of the energy pile. Some scholars have compared and analyzed the influence of water flow and velocity in soil on the heat transfer efficiency and heat exchange efficiency of energy piles from the aspects of soil seepage and groundwater flow through laboratory tests and numerical simulation studies. It is found that the existence of water in soil has a great role in promoting the efficiency of energy piles [9,12,13,14]. It is also concluded that the pile diameter ratio, pile spacing, the diameter of the heat exchange tube in the pile, the water flow velocity in the pipe, the inlet water temperature, and the properties of the strata around the energy pile will affect the working efficiency of the energy pile [15,16,17,18,19,20]. In terms of the long-term working performance of the energy pile, the thermal cycle of the energy pile will lead to a decrease in the soil moisture content around the pile, resulting in a decrease in the thermal conductivity of the soil around the pile, which will increase the temperature around the energy pile and reduce the heat exchange efficiency of the energy pile [21,22]. In addition, a large number of studies have revealed that the deformation and stress distribution of the energy pile during the temperature cycle are affected by the end constraints of the energy pile [23,24,25,26]. From the research status of traditional energy piles, the research on traditional energy piles has entered a more in-depth stage. Among them, there are many research results on the heat transfer performance and thermodynamic effects of heat conduction pipes, energy pile bodies, and the soil around energy piles on energy piles. On the whole, it can be found that traditional energy piles have the defects of low heat transfer efficiency, large stress, and side friction resistance of energy piles. Therefore, many scholars use the method of combining phase-change materials with energy piles to improve traditional energy piles, trying to overcome the defects of traditional energy piles and improve their working performance.
There are also many achievements in the study of PCM energy piles. Yang Binbin [27] and Jin Lihan [28] used expanded perlite and a hollow steel ball, respectively, to seal PCM to make phase-change concrete energy piles. Through research, it is found that compared with traditional energy piles, phase-change concrete energy piles can improve heat transfer capacity, reduce the range of heat impact, and reduce the displacement variation of the pile body, the axial force of the pile body, and the side friction of the pile. Cui Hongzhi et al. [29] used a hollow steel ball (HSB) to encapsulate PCM to obtain PCM-HSB aggregate and then combined it with steel fiber to prepare a PCM-HSB energy pile. Through research, it was found that PCM-HSB concrete effectively improves the heat capacity and bearing capacity of energy piles. Mousa M.M. [30] made a PCM pile by steel pipe-sealing PCM and found that the addition of PCM can improve the energy storage capacity and energy extraction efficiency of the pile body through a combination of an indoor test and numerical simulation. Han Chanjuan et al. [31] prepared C50 phase-change concrete containing microencapsulated phase-change material (MicroPCM) and studied the working performance of the MicroPCM C50 energy pile in cooling mode by means of numerical simulation. It was found that the addition of PCM to C50 phase-change concrete specimens significantly reduced the compressive strength of concrete, and the thermal conductivity and heat capacity of the specimens decreased with the increase in the mass fraction of the phase-change material. Cao Ziming et al. [32] established a three-dimensional heat transfer model of prefabricated high-strength concrete (PHC) energy piles with PCM backfill (PCMB) and studied the thermal response of PCMB-PHC energy piles in building heating and cooling modes. The improvement of the thermal conductivity of PCMB is beneficial to the enhancement of the heat transfer capacity of PCMB-PHC energy piles, and the presence of phase-change materials reduces the temperature fluctuation of the soil around the pile.
From the existing research, most of the existing PCM energy piles use porous materials or hollow steel balls to encapsulate the PCM. Porous materials encapsulating PCM are used to replace part of the coarse aggregate or fine aggregate in the concrete. The phase-change concrete is first prepared, and then the phase-change concrete is poured into the energy pile. The phase-change energy pile prepared by this method has a relatively uniform distribution of PCM in the energy pile, but it will lead to a decrease in the thermal conductivity of the energy pile, a decrease in the concrete strength of the pile, and a single season of the phase-change material. Therefore, this study proposes a new type of PCM energy pile-spiral tube-encapsulated PCM energy pile; that is, the PCM is encapsulated by a spiral encapsulation tube that can be connected to the outside world, and its thermodynamic performance is studied through indoor model tests.

2. Experimental Investigation

2.1. Preparation of Test Materials

2.1.1. Concrete Material

The concrete materials for preparing indoor model specimens included coarse aggregate, fine aggregate, cement, a water-reducing agent, mixing water, admixture, and so on. The coarse aggregate was gravel with a particle size of 3–6 mm, and the manufacturer was Duoduo Horticultural Stone Company (Guangzhou City, China). The sand selected for fine aggregate was natural river sand, which was washed and dried, and the manufacturer was 97 building materials company; the cement selected was P.O 42.5 ordinary Portland cement, from the manufacturer Zhucheng Yangchun Cement Co., Ltd. (Zhucheng City, China); the water reducing-agent was HLX type polycarboxylate high-performance water-reducing agent, with a solid content of 39% and from the manufacturer Shanxi Feike New Material Co., Ltd. (Yuncheng City, China).; mixing water used was laboratory indoor tap water; first-grade fly ash was selected as the external admixture, and the manufacturer was Henan Hengyuan New Material Co., Ltd. (Zhengzhou City, China).

2.1.2. Selection of Experimental Equipment

The main equipment selected in this study is shown in Figure 1, among which is the pump (the manufacturing year was 2016, the equipment origin is China, and the equipment manufacturer is the United Zhongwei Technology Company (Huizhou City, China)), the HH-2 constant-temperature water bath pot (the manufacturing year was 2021, the equipment origin is China, and the equipment manufacturer is Anhui Haixin Technology Co., Ltd. (Wuhu City, China)), the digital display dial gauge (the manufacturing year was 2022, the equipment origin is China, and the equipment manufacturer is Ai Ce Instrument Co., Ltd. (Taizhou City, China)), and the YBY4010 data acquisition system (the year of manufacture was 2016, the origin of the equipment is China, and the equipment manufacturer is Liyang Weihan Instrument Factory (Liyang City, China)).

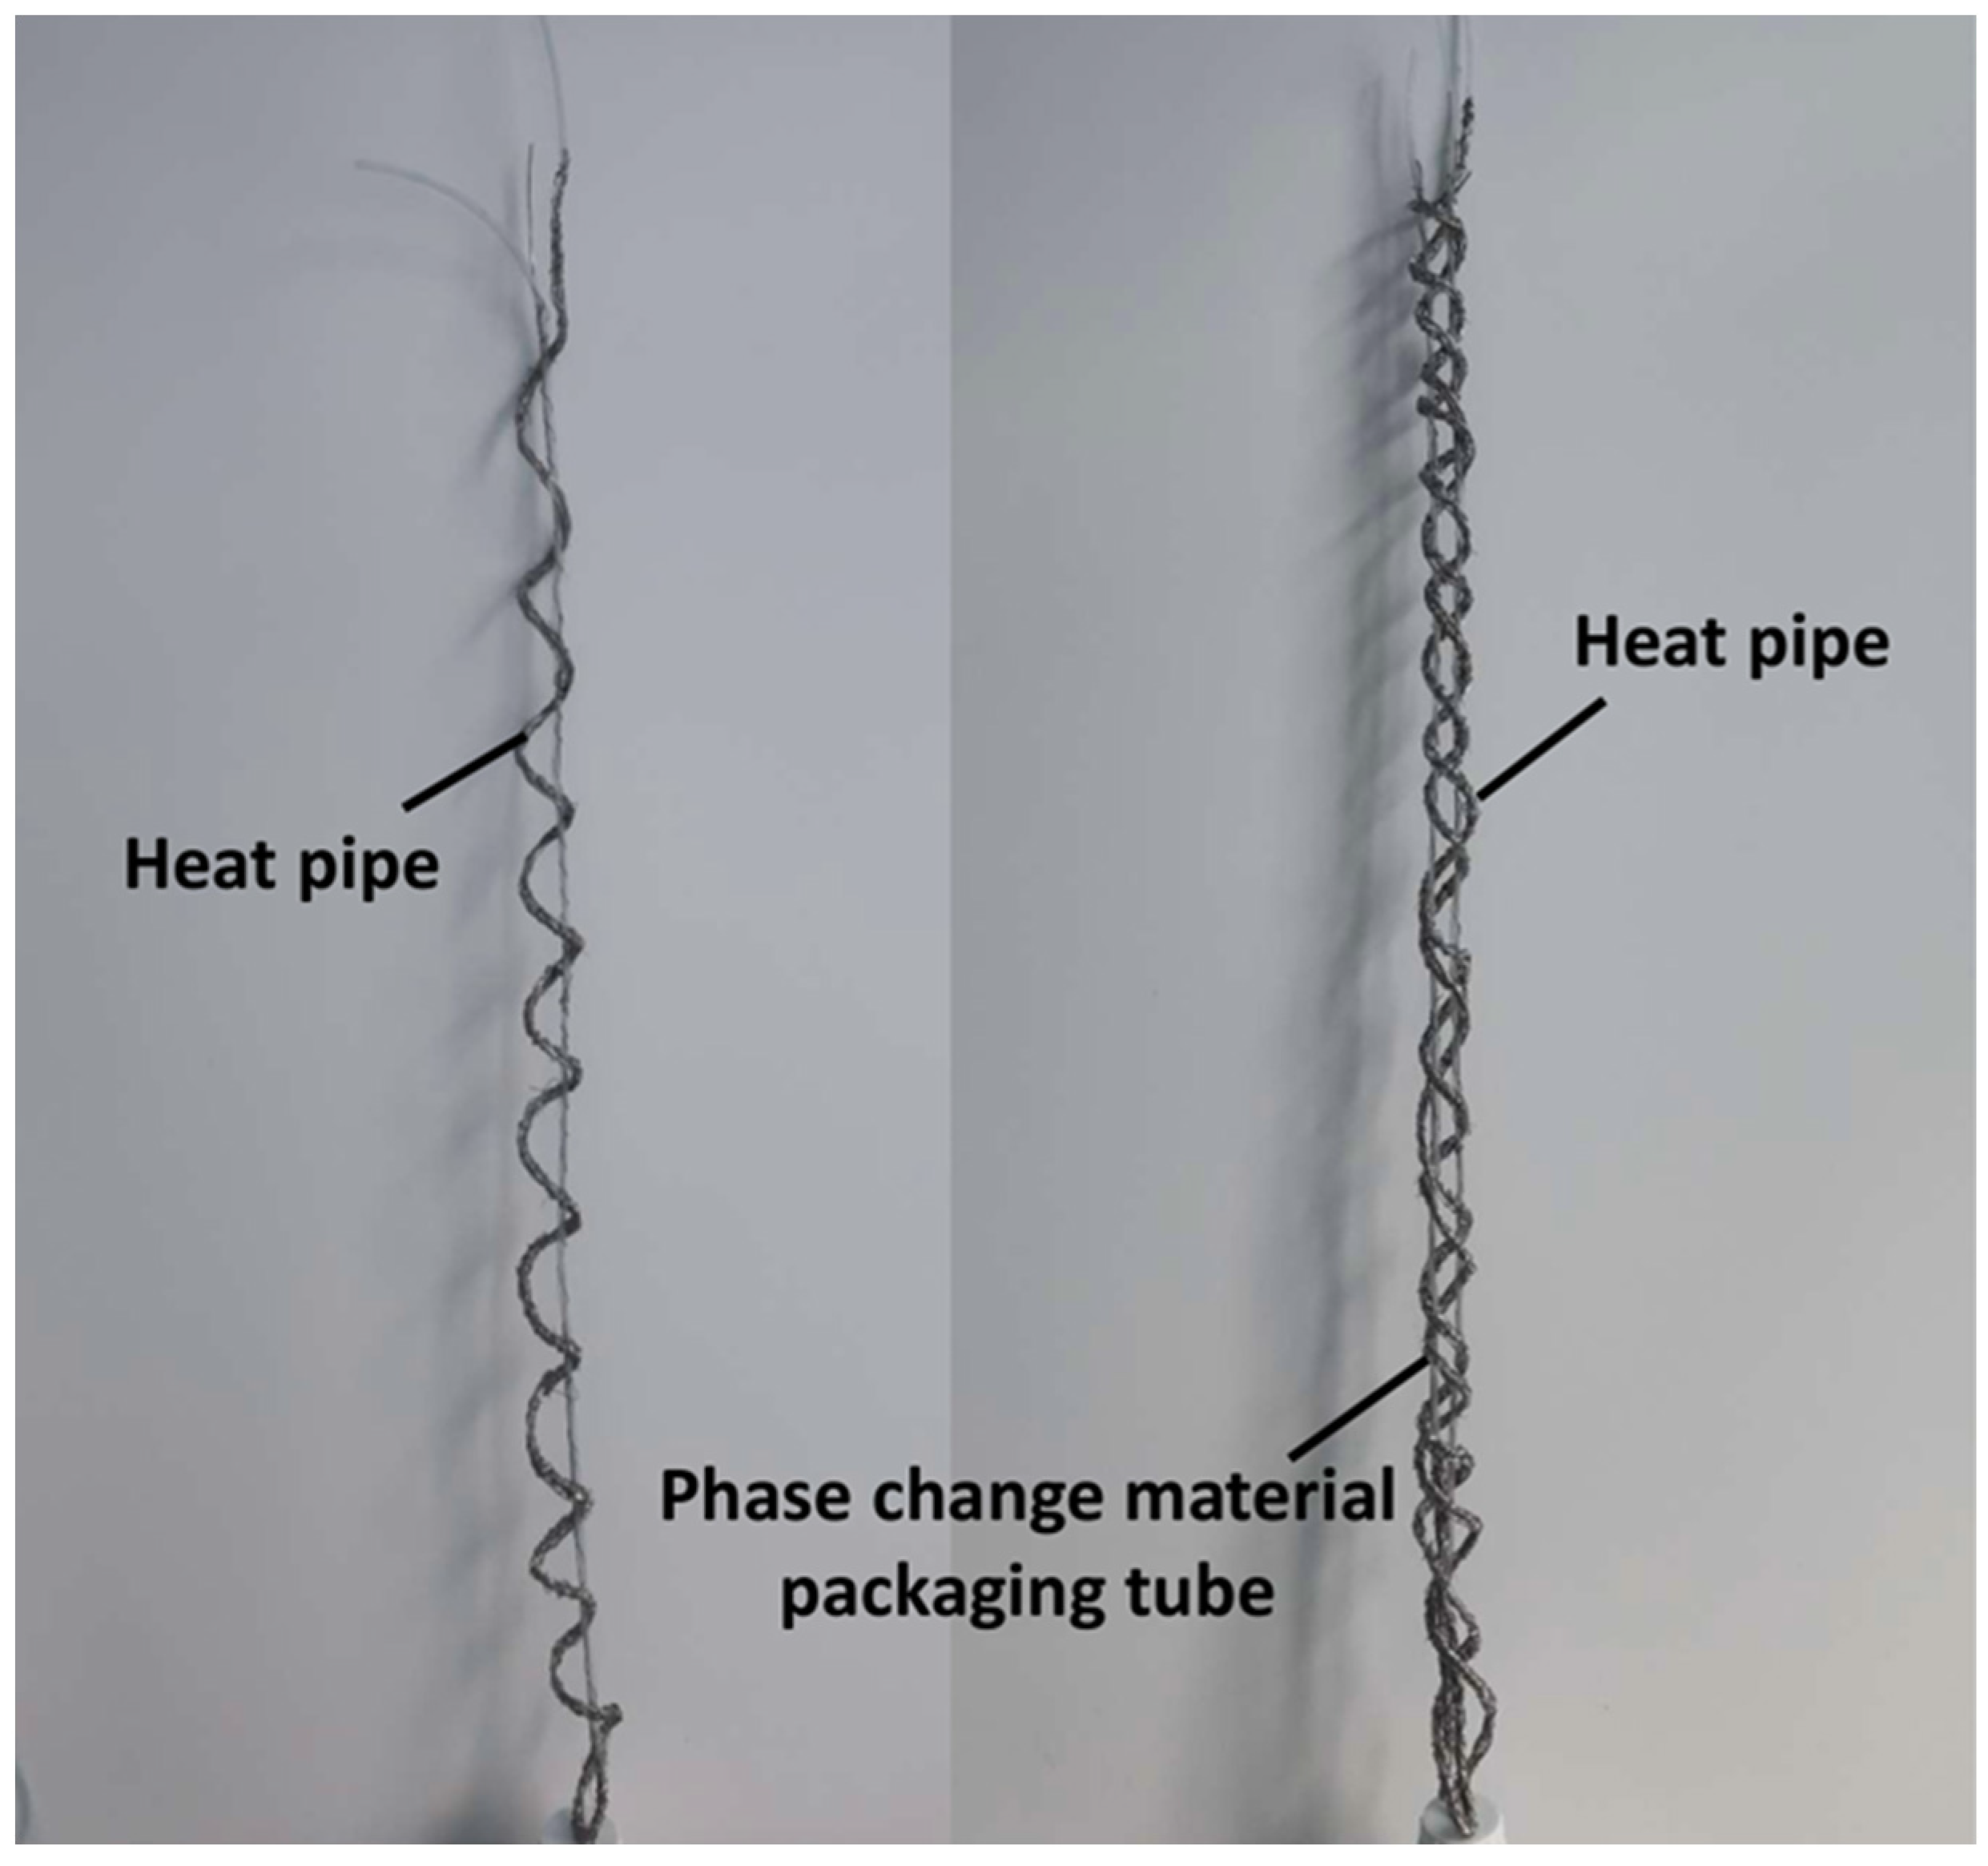
2.1.3. Preparation of Heat Conduction Tube and Phase-Change Material Packaging Tube

The heat conduction tube and the PCM encapsulation tube in the energy pile specimen prepared by the experiment are self-prepared pre-embedded tubes in the pile. Among them, the traditional energy pile specimen is a single spiral heat conduction tube in the pile body, and the spiral tube-encapsulated PCM energy pile specimen is a double spiral heat conduction tube and PCM encapsulation tube. Among them, the heat conduction tube and the PCM packaging tube are made of PVC hose, and the outer part of the tube is wrapped with iron wire with a diameter of 3 mm. Finally, the hose is tied to a 2 cm iron wire to finalize the design. The final effect is shown in Figure 2.

2.1.4. Phase-Change Material

The phase change material used in this study is 25 phase-change paraffin produced by Shengbang New Material Company (Dongguan City, China). 25-phase change paraffin refers to the phase-change paraffin with a phase-change temperature of 25 °C under exothermic conditions. Considering that the phase-change temperature and latent heat of phase-change paraffin are different under exothermic and endothermic conditions, a professional organization was entrusted to perform DSC detection on phase-change paraffin under endothermic conditions. The DSC detection diagram is shown in Figure 3.
It can be seen from Figure 3 that the initial phase transition temperature of 25 phase-change paraffin is 11.9 °C, the peak phase transition temperature is 19.3 °C, and the termination phase transition temperature is 44.2 °C. It has a second peak phase transition temperature at 33.8 °C, and the overall phase transition latent heat is 99.7 kJ·kg−1, represented in gray in the figure. Specific material information can be found in Table 1.

2.2. Experiment Development

2.2.1. Design of Phase Change Material Energy Pile Model

According to the research needs, the pile mold of the indoor scale model is designed and processed, and the traditional energy pile scale model and the spiral tube-encapsulated PCM energy pile scale model are completed through the pile mold. The model pile length of the two scale models is 107 cm, the diameter is 6 cm, and the length–diameter ratio of the pile is 17.8. The details of the model pile specimen are shown in Figure 4. The outer diameter of the heat conduction pipe in the pile is 5 mm, the inner diameter is 4 mm, and the total length is 2.8 m. The length of the spiral pipe is 1.8 m and the length of the straight pipe is 1 m. The outer diameter of the phase change material packaging pipe in the pile is 7 mm and the inner diameter is 6 mm. The length of the spiral pipe is 1.8 m, and the length of the straight pipe is 1 m.

2.2.2. Design of Indoor Physical Model Experimental System for Energy Pile

In order to test the thermodynamic performance of the spiral tube-encapsulated phase-change material energy pile, this study designed an indoor scale model experimental system of the energy pile based on the similarity principle. Through the experimental system, the working performance of the traditional concrete material energy pile (referred to as the TCM pile) and the spiral tube-encapsulated phase-change material energy pile (referred to as the PCM pile) under the heating load was tested, and the relevant experimental data were collected to compare and analyze the spiral tube-encapsulated phase-change material energy pile and the traditional energy pile.
The design of the experimental system includes three parts: a temperature control experimental box, water circulation, and data acquisition. The size of the temperature control experimental box is 1 m × 1 m × 1.25 m (length × width × height). The side wall and bottom of the temperature control experimental box have water storage interlayers that can regulate the internal temperature of the experimental box. The water circulation part includes a constant-temperature water bath pot, a water pump, a water conveyance pipe, a buried pipe in the pile, and so on. The data acquisition part includes strain gauges, temperature sensors, dial gauges, probe thermometers, data acquisition equipment, computers, etc.

2.2.3. Experimental Measuring Point Arrangement

As shown in Figure 5, the following measuring points are set according to the data acquisition requirements. Three strain gauges and temperature sensors are evenly arranged along the pile circumference direction at the center of the pile, 385 mm above the center of the pile and 385 mm below the center of the pile. There are a total of 9 strain gauges and temperature sensors. The dial gauge is arranged at the pile top position; the probe thermometer is arranged in the middle of the model pile specimen and the experimental box, and the PT100 temperature sensor is arranged at the outlet position.

2.2.4. Implementation of Experimental Scheme

The main experimental operations of this study are as follows:
  • Connect the pump, the water pipe, and the heat conduction pipe in the pile and check the water in advance to ensure that the pump can operate normally and the water pipe and the heat conduction pipe in the pile are not blocked.
  • Connect each temperature sensor and strain gauge to the corresponding data acquisition equipment, and check whether the data can be collected normally; check whether the dial gauge can be used normally and place it at the top of the pile while reading to zero.
  • Add an appropriate amount of water to the constant-temperature water bath and start the constant-temperature water bath to heat the water to 40 °C and keep the water temperature unchanged.
  • Start the pump to start the water circulation and start to collect the experimental data. The main data acquisition is as follows: strain gauge to collect pile strain data; the temperature sensor collects the pile temperature data; the pile top dial gauge collects the pile top displacement data; the pT1000 temperature sensor collects the water temperature at the outlet.
  • The experimental process lasts for 300 min. During the experimental process, it is necessary to continuously check whether the test equipment and data acquisition equipment are operating normally and problems are solved in time to avoid experimental results caused by experimental operation problems.

3. Experimental Results and Discussion

There are two aspects of the performance of the energy pile in the working process, which is the focus of scholars’ research. The first is heat transfer performance. The second thermodynamic performance; in terms of heat transfer, the heat transfer per unit pile is an important index to measure the utilization efficiency of geothermal energy when the energy pile is working. The surface temperature of the pile is an important factor in measuring the heat transfer performance of the energy pile and the soil around the pile, and also an important factor in measuring the heat storage capacity of the energy pile itself, which is related to the various thermodynamic properties of the energy pile. In terms of thermodynamics, the pile top displacement of the energy pile is an important parameter to measure the influence of the energy pile on the safety of the upper foundation and structure. The magnitude of the surface stress of the pile body reflects the size of the additional load requirements generated by the energy pile body during the work of the energy pile, which is one of the important factors for the selection of materials in the design of the energy pile. Therefore, in this study, four indexes of unit pile heat transfer, pile surface temperature, pile top displacement, and pile surface temperature were selected to study the thermodynamic performance of PCM piles.
The experiment was repeated three times, and the average value was taken as the final experimental data for analysis. The experimental measurement error was displayed in the form of an error bar in the experimental data graph.

3.1. Heat Transfer Performance Analysis

3.1.1. Unit Pile Heat Exchange

Heat transfer calculation formula of energy pile:
q = ρ l V l C l T i n T o u t
In the formula: q : heat transfer rate, W; ρ l : the density of heat transfer fluid; V l : volume of heat transfer fluid: C l : the specific heat capacity of heat transfer fluid; T i n : inlet temperature; T o u t : outlet temperature.
Calculation formula of the total heat transfer of the energy pile:
Q = t 0 t i q   d t
In the formula: Q : total heat transfer, J; q : heat transfer rate, W; t 0 : initial time; t i : the i moment of operation.
According to Formula (1), the heat transfer per unit of the pile body of the TCM pile and the PCM pile is calculated and plotted, as shown in Figure 6.
It can be seen in Figure 6 that the heat transfer per unit of pile of the TCM pile and the PCM pile decreases rapidly and finally tends to be stable with an increase in time, and finally stabilizes at approximately 21.4 W/m. The heat transfer of the PCM pile during the operation of 30 min to 105 min is higher than that of the TCM pile. The difference between the two first increases and then decreases with the increase in time. The maximum difference appears at 45 min, and the maximum difference is 6.52 W/m. Before 30 min and after 105 min, the heat transfer per unit pile of the PCM pile and the TCM pile is not very different. During the whole operation period, the total heat transfer of the TCM pile was 538.5 kJ, and the total heat transfer of the PCM pile was 556.7 kJ, which is 3.38% higher than that of the TCM pile.
It can be seen from the above analysis that the heat exchange efficiency of the PCM pile in the early stage of operation and the total heat exchange during the whole operation period are higher than that of the TCM pile, which indicates that the PCM pile can better meet the cooling demand of buildings under summer conditions and can effectively reduce the energy consumption of buildings in temperature control.

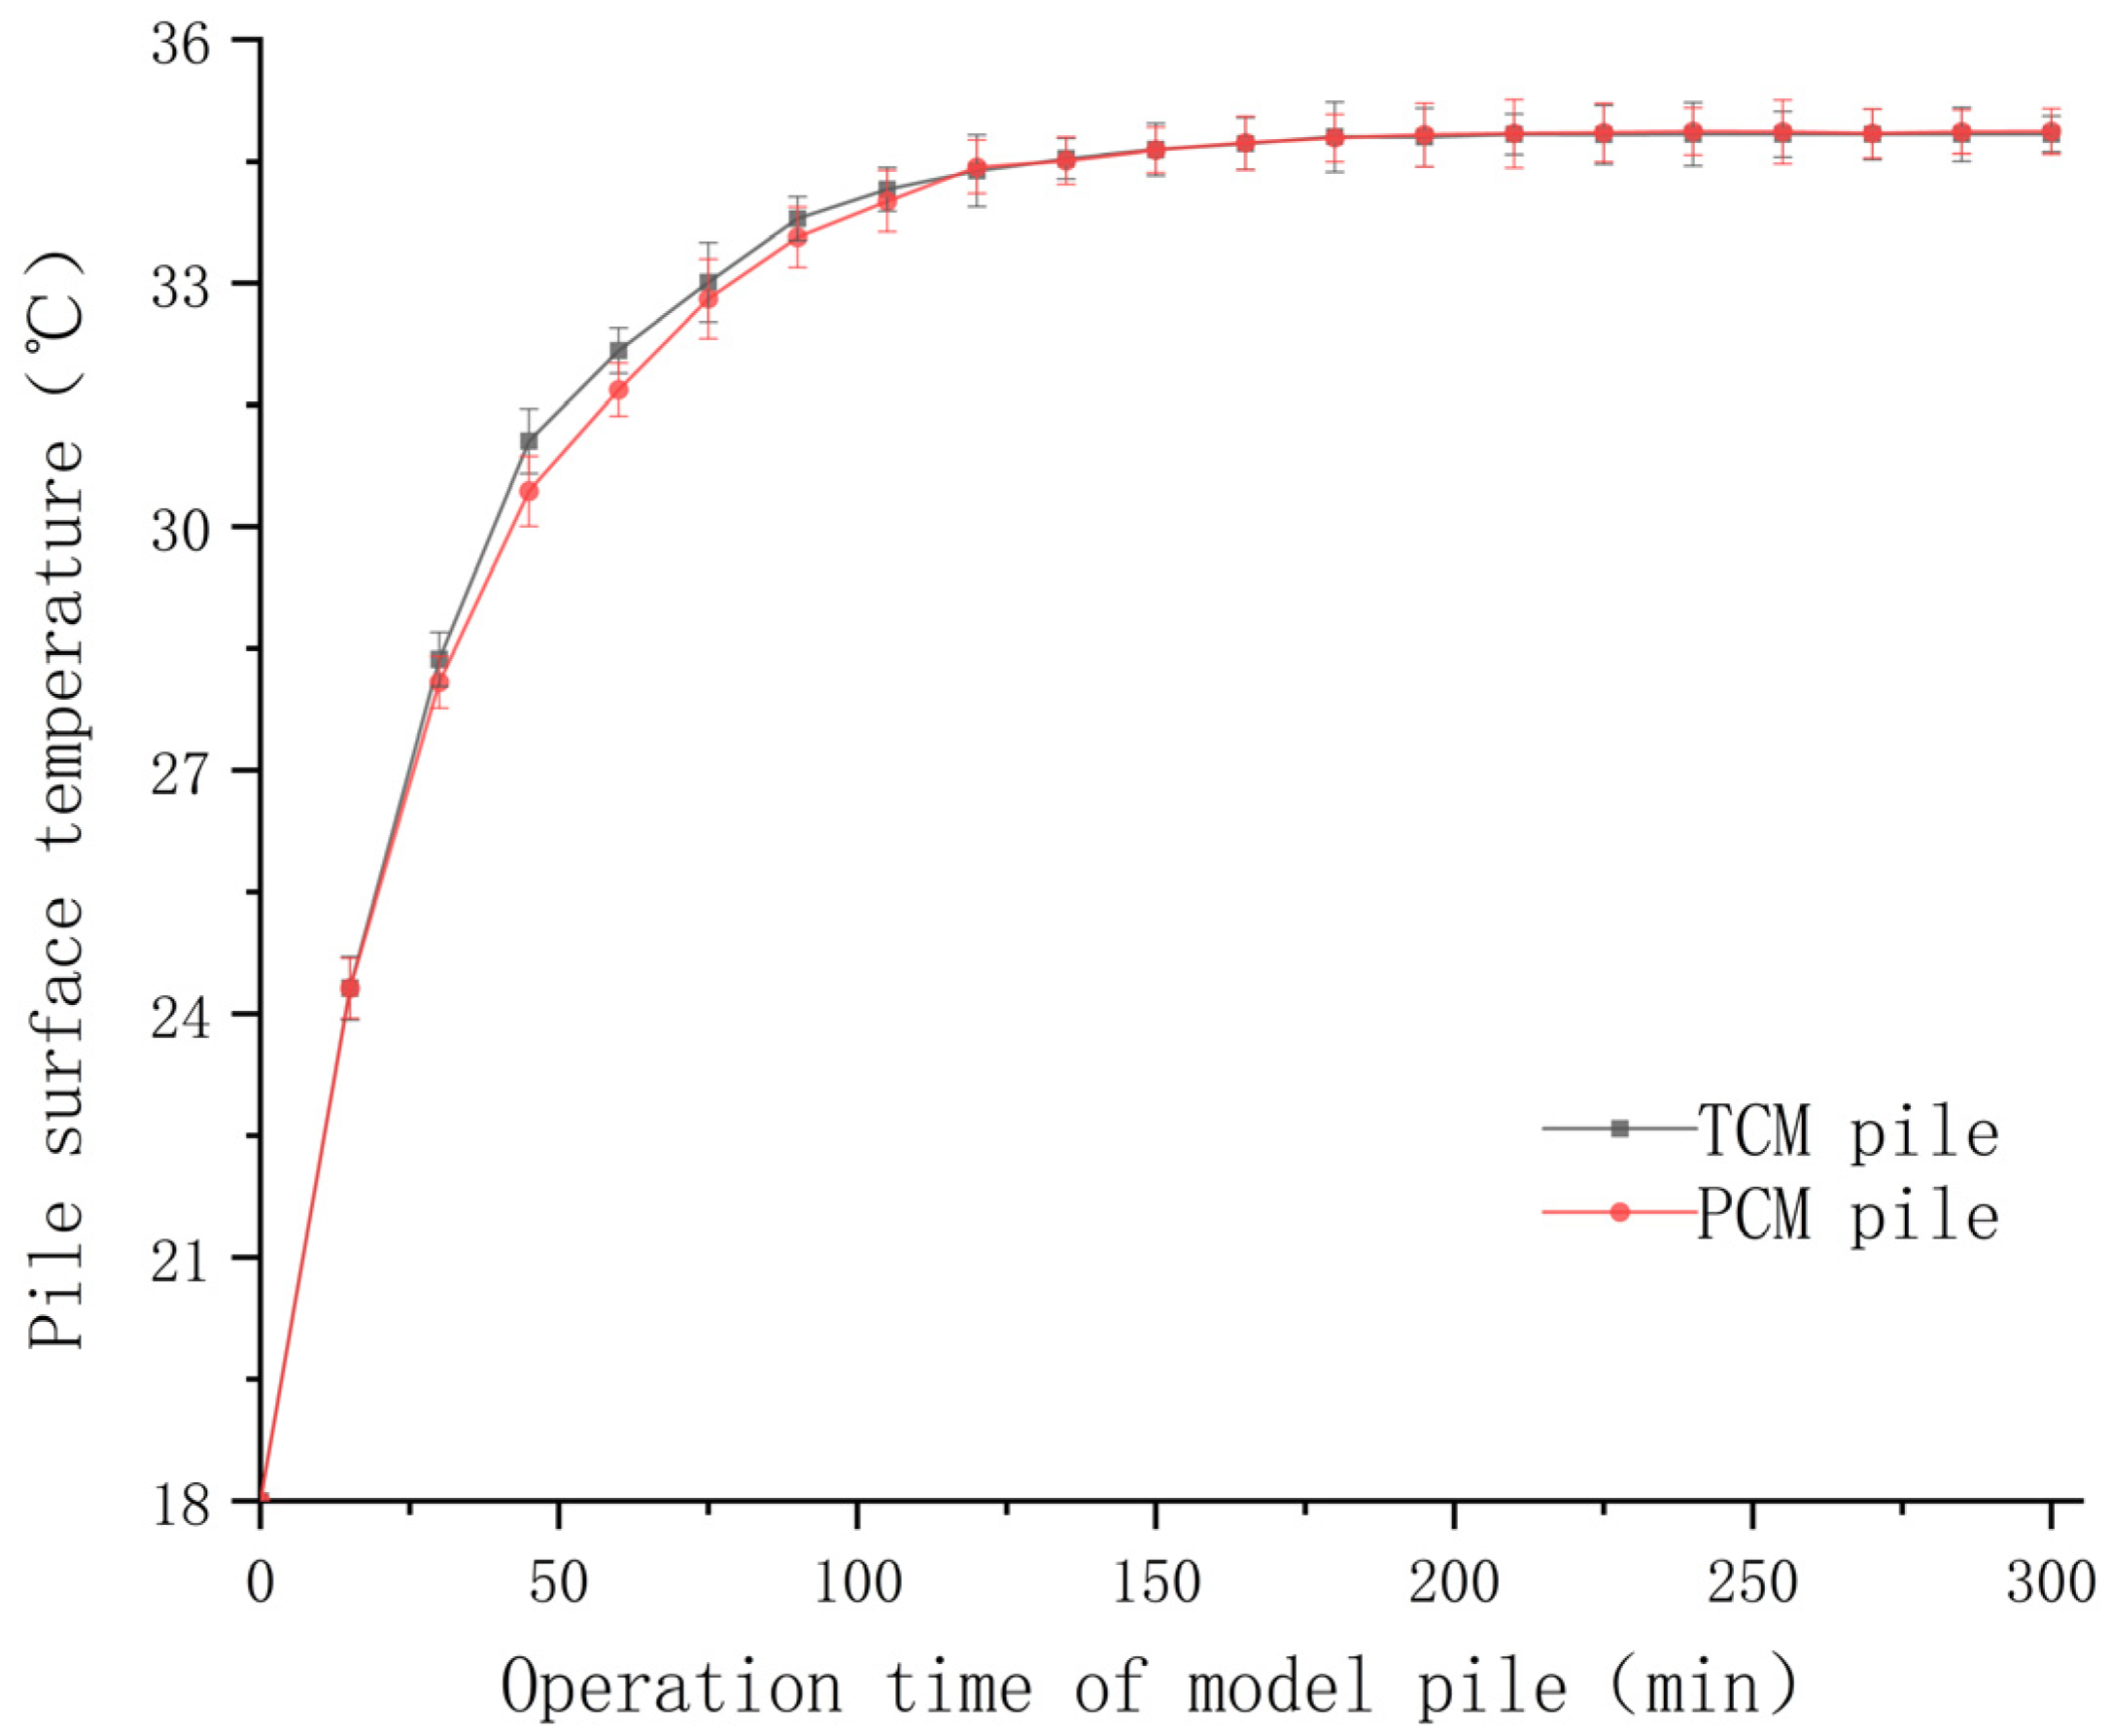
3.1.2. Pile Surface Temperature Analysis

The temperature data of multiple measuring points on the surface of the TCM pile and the PCM pile collected in the experiment are averaged and plotted, as shown in Figure 7.
As shown in Figure 7, the surface temperature of the TCM pile and the PCM pile gradually increases with time during the whole operation process, and finally, the surface temperature of the two piles is stable at approximately 34.8 °C. During the period from 30 min to 120 min, the surface temperature of the TCM pile is obviously higher than that of the PCM pile. The difference between the two first increases and then decreases with the increase in time. The maximum difference between the two appears at 45 min, and the maximum difference is 0.62 °C. In this operation stage, the heating rate of the TCM pile is obviously faster than that of the phase-change pile.
It can be seen from the above analysis that the surface temperature of the PCM pile in the early stages of operation is lower than that of the TCM pile, so it can be further inferred that the PCM pile has little effect on the temperature of the soil around the energy pile in the early stages of operation, which can effectively reduce the thermal interference between multiple energy piles during pile group operation.

3.2. Thermodynamic Effect Analysis

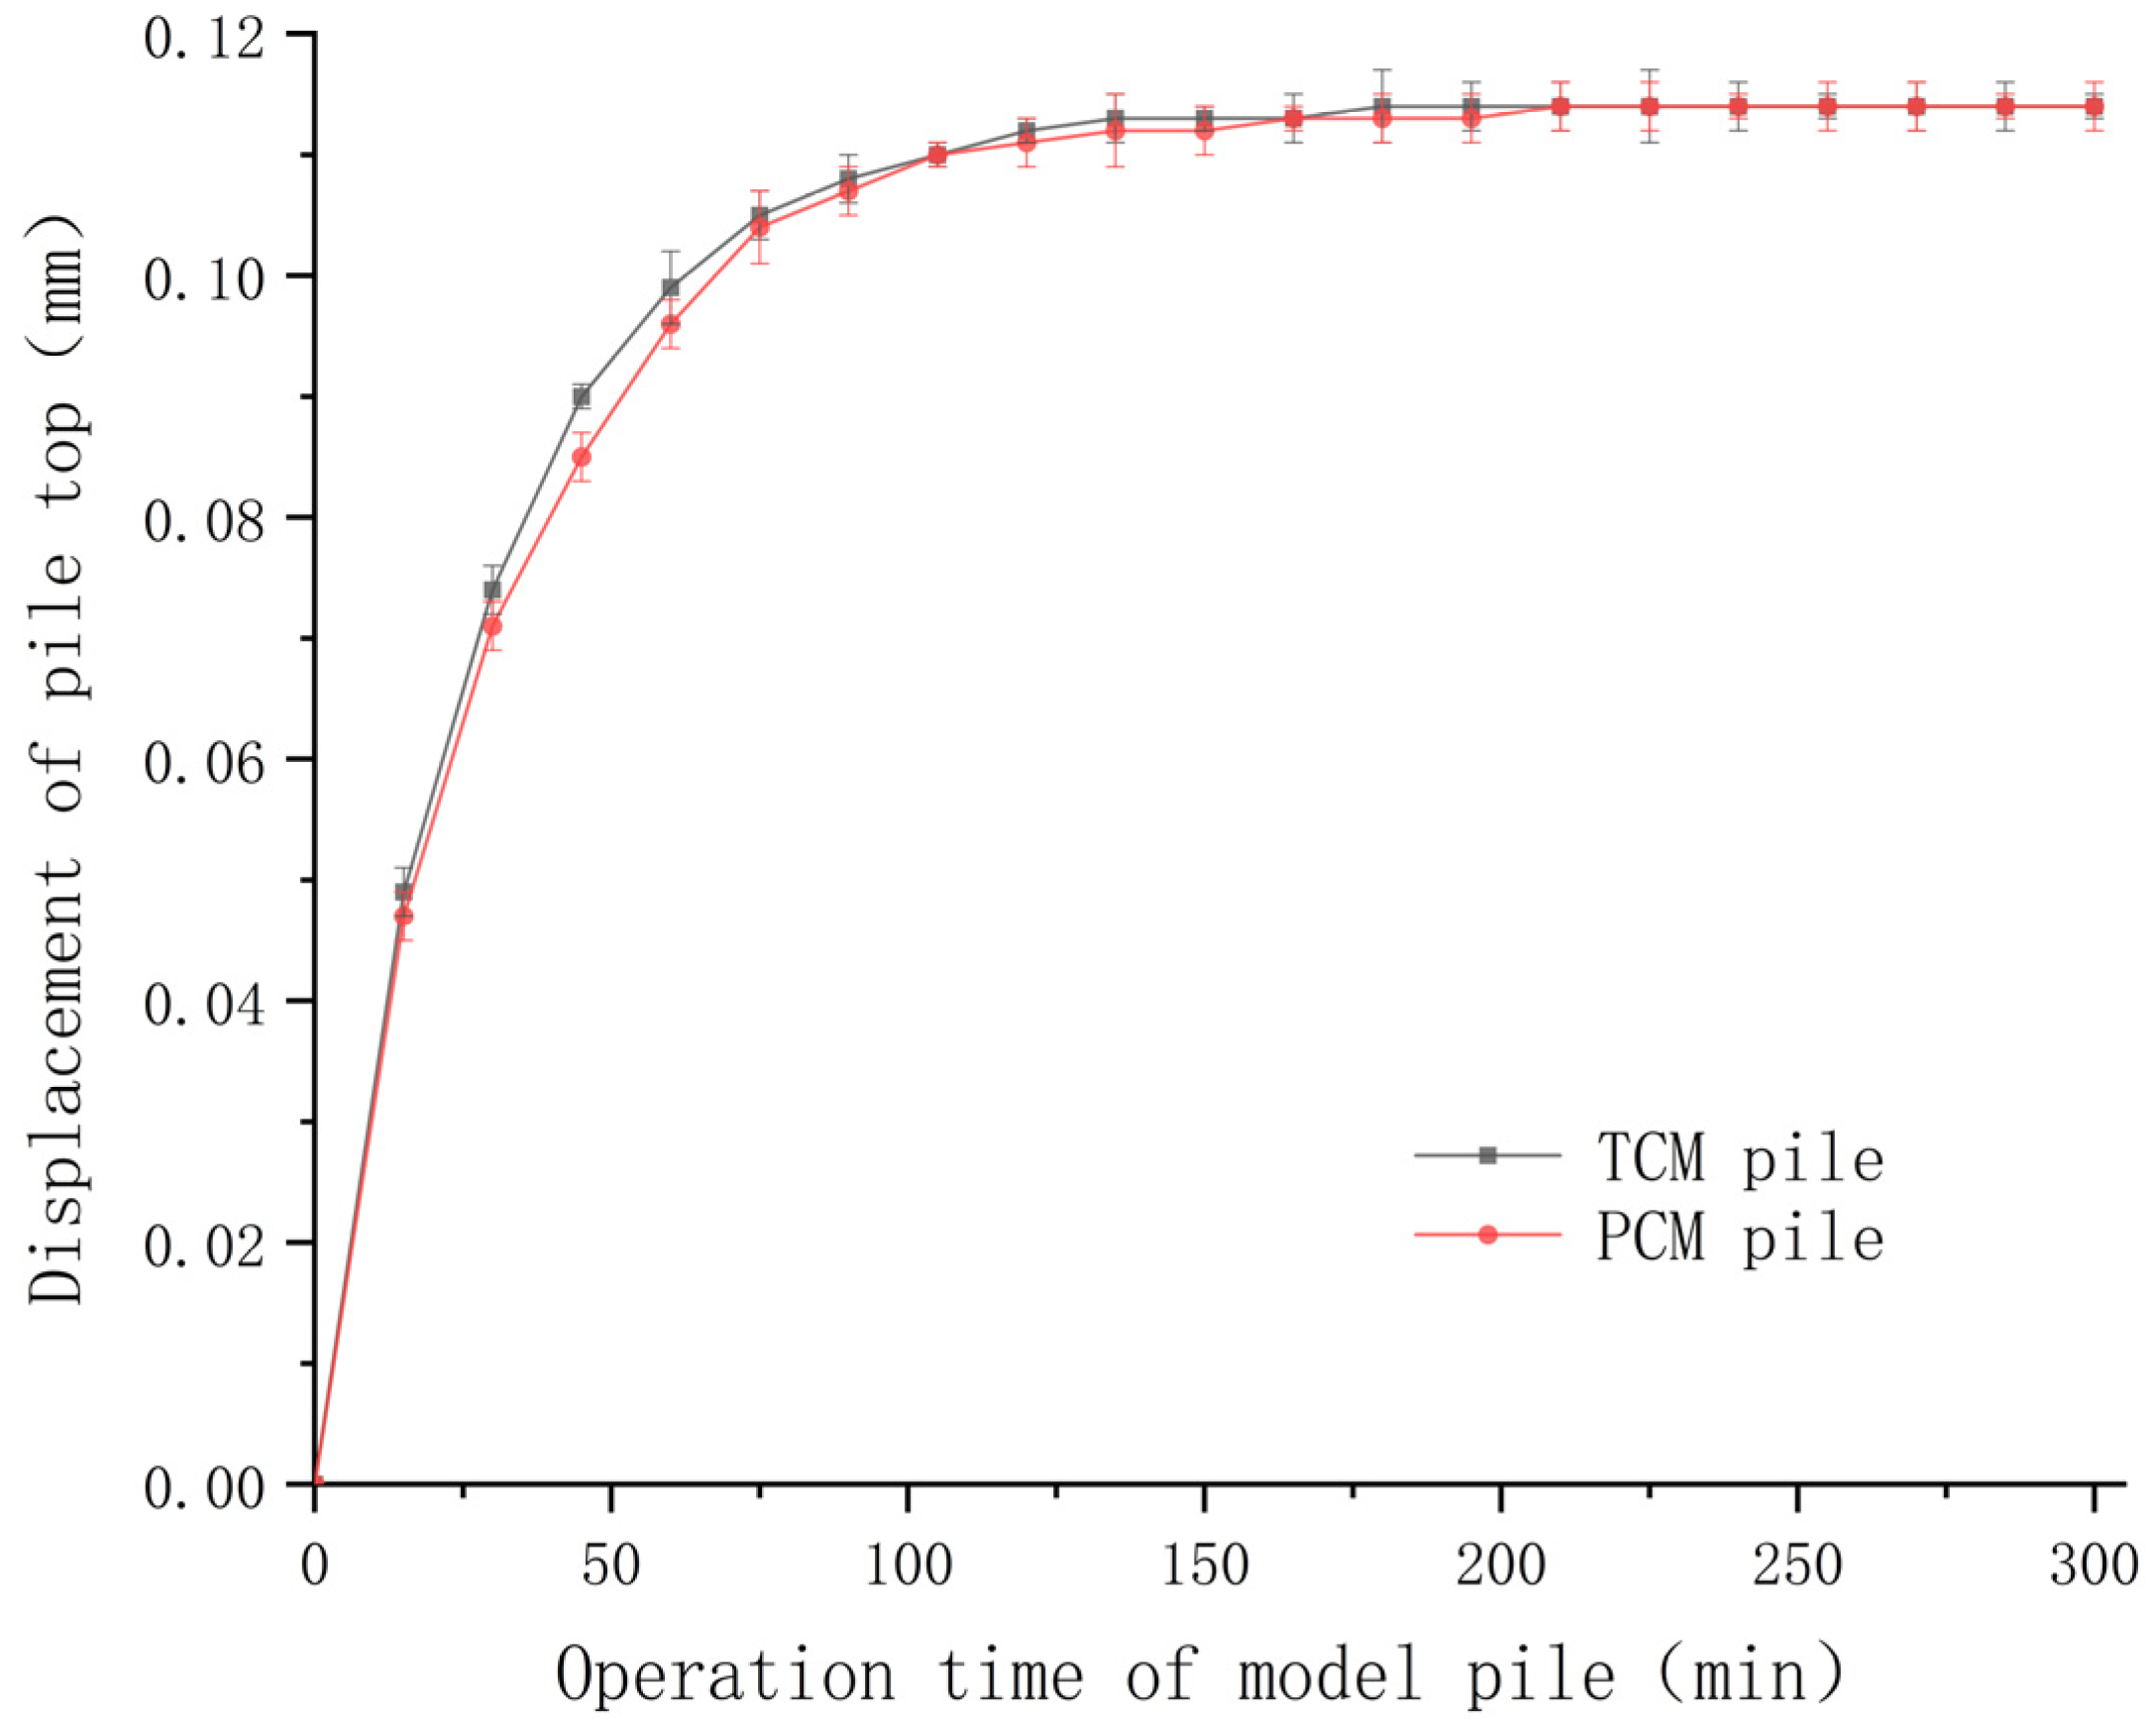
3.2.1. Pile Top Displacement Analysis

The pile top displacement changes in the TCM pile and PCM pile collected during the experiment are shown in Figure 8, and based on this, the pile top displacement is further analyzed.
It can be seen from Figure 8 that the pile top displacement values of TCM piles and PCM piles gradually increase with time, while the growth rate is faster in the early stage and gradually tends to stabilize in the later stage. Finally, the pile top displacement values of both piles are stable at 0.114 mm. During the first 0–15 min of operation, the displacement values of the pile top of the TCM pile and the PCM pile are basically the same; during minutes 15–105 of operation, the displacement value of the pile top of the TCM pile is significantly higher than the displacement value of the pile top of the PCM pile. The difference between the two first increases and then decreases. The maximum difference occurs at 45 min, and the maximum difference is 0.005 mm; during minutes 105–300 of operation, the displacement value of the pile top of the TCM pile is not much different from that of the PCM pile, but the change in the displacement value of the pile top of the PCM pile lags behind the displacement value of the pile top of the TCM pile between 105 min and 195 min.
From the above analysis, it can be seen that the displacement value of the pile top of the PCM pile is less than or equal to the displacement value of the pile top of the TCM pile during the whole operation period, which indicates that the additional stress change caused by the PCM pile foundation and the upper building is smaller in actual work, and the safety hazard caused by the foundation and the upper building is smaller.

3.2.2. Pile Surface Stress Analysis

The energy pile will produce corresponding temperature expansion due to the increase in temperature. However, due to the constraint effect of the soil around the pile on the energy pile body, the energy pile cannot deform freely, so the temperature stress will be generated in the energy pile body. The calculation method is shown in Formula (3):
σ T = E α T ε
In the formula: σ T : temperature stress, kPa; E : elastic modulus, MPa; α : thermal expansion coefficient;   T : temperature difference, °C; ε : measured strain value. According to Formula (3), the temperature stress on the surface of the TCM pile and the PCM pile is calculated, and the average value of each measuring point of the pile body is drawn as follows.
As shown in Figure 9, the surface stress of the TCM pile and the PCM pile increases rapidly with time, then decreases rapidly, and finally, tends to be gentle. Finally, the surface stress of the TCM pile is stable at 15.8 kPa, and the surface stress of the PCM pile is stable at 17.2 kPa. The peak points of surface stress of the PCM pile and the TCM pile appear at 15 min. The peak value of the surface stress of the PCM pile is 100.85 kPa, and the peak value of the surface stress of the TCM pile is 91.01 kPa.
During the whole operation process, the surface stress value of the PCM pile is higher than that of the TCM pile. The maximum difference between the two appears at 15 min, the maximum difference is 9.84 kPa, and the maximum difference is 10.8%. The difference between the two gradually decreases with time, and finally stabilizes at 1.4 kPa. The final difference is only 8.8%, and the negative impact on the pile material is minimal.
It can be seen from the above analysis that the PCM pile has a larger surface stress than the TCM pile, but it can be known from Formula (3) that the PCM pile has a smaller change in the pile body due to temperature changes, and the disturbance to the soil around the energy pile is smaller.

4. Conclusions

In this study, the working performance of energy piles was studied from two aspects: heat transfer performance and the thermodynamic effect. The following conclusions were obtained by comparing them with TCM piles:
  • The PCM pile increases the heat transfer per unit pile body in the early and middle stages of the whole operation and the total heat transfer during the whole operation. The heat transfer per unit pile depth increased by 6.52 W/m, and the overall heat transfer increased by 3.38%.
  • The PCM pile reduces the surface temperature of the pile body and the heating rate of the surface temperature of the pile body in the early and middle stages of operation, and the maximum temperature difference is 0.62 °C.
  • The PCM pile can effectively reduce the upward displacement of the pile top in the early and middle stages of operation. The maximum difference between the two is 0.005 mm, which is reduced by 5.56%.
  • The surface stress value of the PCM pile is higher than that of the TCM pile during the whole operation process. The maximum difference between the two is 9.84 kPa, and the maximum difference is 10.8%. Subsequently, the difference between the two gradually decreases with time, and finally stabilizes at 1.4 kPa, with a final difference of only 8.8%.
In this study, the research on PCM piles is mainly focused on the field of single energy piles, but energy piles often work in the form of pile groups. Therefore, if we want to understand the thermodynamic properties of PCM piles more deeply and guide actual engineering practice, we still need to carry out corresponding pile group experiments. In this study, the traditional energy pile is used as the research reference. Compared with other types of PCM piles, the advantages and disadvantages of thermodynamic performance still need to be further studied.

Author Contributions

Conceptualization, M.L.; methodology, M.L. and P.Z.; software, M.L. and Z.Z.; validation, Z.Y., X.L. and C.M.; formal analysis, M.L.; investigation, P.Z.; resources, Z.Y.; data curation, Z.Y. and X.L.; writing original draft preparation, M.L.; writing—review and editing, P.Z. and Z.Z.; visualization, Z.Y., X.L. and C.M.; project administration, P.Z.; funding acquisition, P.Z. All authors have read and agreed to the published version of the manuscript.

Funding

This research was funded by the National Natural Science Foundation of China (42177167) and the Natural Science Foundation of Shandong Province (ZR2019QEE008).

Data Availability Statement

Data will be made available upon request. The data are not publicly available due to privacy.

Acknowledgments

The authors thank P.Z., Z.Y. and Z.Z. who provided valuable comments that greatly improved the manuscript.

Conflicts of Interest

The authors declare no conflicts of interest.

References

  1. Sutman, M.; Speranza, G.; Ferrari, A.; Larrey-Lassalle, P.; Laloui, L. Long-term performance and life cycle assessment of energy piles in three different climatic conditions. Renew. Energy 2020, 146, 1177–1191. [Google Scholar] [CrossRef]
  2. Zakharov, A.V.; Ovchinnikov, N.M. Influence of soil thermophysical properties on the flow of thermal energy taken by the energy pile. J. Phys. Conf. Ser. 2021, 1928, 012036. [Google Scholar] [CrossRef]
  3. Elzeiny, R.; Suleiman, M.T. Pull-Out Response of a Laboratory-Scale Energy Pile Subjected to Cooling Cycles. J. Geotech. Geoenviron. Eng. 2021, 147, 04021044. [Google Scholar] [CrossRef]
  4. Chen, Z.; Sun, Y.; Xiao, H.; Ma, Q.; Zhang, L. In-Situ Thermomechanical Response Test of an Energy Pile Under Temperature Loading. Arab. J. Sci. Eng. 2021, 46, 10355–10364. [Google Scholar] [CrossRef]
  5. Qi, H.; Zhou, Y.; Zhang, Z.; Wang, B.; Zhang, Y.; Cui, H.; Wang, X. Heat Transfer Performance in Energy Piles in Urban Areas: Case Studies for Lambeth College and Shell Centre UK. Appl. Sci. 2020, 10, 5974. [Google Scholar] [CrossRef]
  6. Da Silva Oliveira Morais, T.; de Hollanda Cavalcanti Tsuha, C.; Bandeira Neto, L.A.; Singh, R.M. Effects of seasonal variations on the thermal response of energy piles in an unsaturated Brazilian tropical soil. Energy Build. 2020, 216, 109971. [Google Scholar]
  7. Chang, H.; Shen, F.Q.; Wang, Y.; Wang, H.; Zhao, S.Y. Test on bearing capacity of new energy pile under thermal-mechanical coupling. Sci. Technol. Eng. 2022, 22, 11609–11615. [Google Scholar]
  8. Faizal, M.; Moradshahi, A.; Bouazza, A.; McCartney, J.S. Soil thermal responses around a field-scale energy pile. E3S Web Conf. 2020, 205, 05027. [Google Scholar] [CrossRef]
  9. Zhang, W.; Zhang, L.; Cui, P.; Gao, Y.; Liu, J.; Yu, M. The influence of groundwater seepage on the performance of ground source heat pump system with energy pile. Appl. Therm. Eng. 2019, 162, 114217. [Google Scholar] [CrossRef]
  10. Wu, D.; Liu, H.; Kong, G.; Li, C. Thermo-mechanical behavior of energy pile under different climatic conditions. Acta Geotech. 2019, 14, 1495–1508. [Google Scholar] [CrossRef]
  11. Faizal, M.; Bouazza, A.; McCartney, J.S.; Haberfield, C. Effects of Cyclic Temperature Variations on Thermal Response of an Energy Pile under a Residential Building. J. Geotech. Geoenviron. Eng. 2019, 145, 04019066. [Google Scholar] [CrossRef]
  12. Weibo, Y.; Lei, J.; Laijun, Z.; Feng, W. Experimental investigations of the thermo-mechanical behaviour of an energy pile with groundwater seepage. Sustain. Cities Soc. 2022, 77, 103588. [Google Scholar]
  13. Lou, J.; Fang, P.-F.; Xie, X.-Y.; Chong, C.S.A.; Li, F.-Y.; Liu, C.-Y.; Wang, Z.-J.; Zhu, D.-J. Numerical research on thermal response for geothermal energy pile groups under groundwater flow. Geomech. Energy Environ. 2021, 28, 100257. [Google Scholar] [CrossRef]
  14. You, T.; Yang, H. Influences of different factors on the three-dimensional heat transfer of spiral-coil energy pile group with seepage. Int. J. Low-Carbon Technol. 2020, 15, 458–470. [Google Scholar] [CrossRef]
  15. Zhong, Y.; Narsilio, G.A.; Makasis, N.; Scott, C. Experimental and numerical studies on an energy piled wall: The effect of thermally activated pile spacing. Geomech. Energy Environ. 2022, 29, 100276. [Google Scholar] [CrossRef]
  16. Cecinato, F.; Salciarini, D. Energy performance assessment of thermo-active micro-piles via numerical modeling and statistical analysis. Geomech. Energy Environ. 2021, 29, 100268. [Google Scholar] [CrossRef]
  17. Zhang, G.; Cao, Z.; Liu, Y.; Chen, J. Field Test and Numerical Simulation on the Long-Term Thermal Response of PHC Energy Pile in Layered Foundation. Sensors 2021, 21, 3873. [Google Scholar] [CrossRef] [PubMed]
  18. Chen, Z.; Wang, B.; Zheng, L.; Xiao, H.; Wang, J. Research on Heat Exchange Law and Structural Design Optimization of Deep Buried Pipe Energy Piles. Energies 2021, 14, 6449. [Google Scholar] [CrossRef]
  19. Yin, Y.; Li, Q.; Qiao, L. Response of energy pile-soil structure and pile group effect: An indoor similarity simulation study. J. Build. Eng. 2022, 51, 104247. [Google Scholar] [CrossRef]
  20. Wu, D.; Kong, G.; Liu, H.; Jiang, Q.; Yang, Q.; Kong, L. Performance of a full-scale energy pile for underground solar energy storage. Case Stud. Therm. Eng. 2021, 27, 101313. [Google Scholar] [CrossRef]
  21. Sani, A.K.; Singh, R.M. Response of unsaturated soils to heating of geothermal energy pile. Renew. Energy 2020, 147 Pt 2, 2618–2632. [Google Scholar] [CrossRef]
  22. Bao, X.; Qi, X.; Cui, H.; Tang, W.; Chen, X. Experimental study on thermal response of a PCM energy pile in unsaturated clay. Renew. Energy 2022, 185, 790–803. [Google Scholar] [CrossRef]
  23. Sutman, M.; Brettmann, T.; Olgun, C.G. Full-scale in-situ tests on energy piles: Head and base-restraining effects on the structural behaviour of three energy piles. Geomech. Energy Environ. 2018, 18, 56–68. [Google Scholar] [CrossRef]
  24. Najma, A.; Sharma, J. Incremental load transfer analysis of an energy pile under arbitrary mechanical and thermal loads. Geomech. Energy Environ. 2021, 28, 100243. [Google Scholar] [CrossRef]
  25. Wang, Z.-j. Analysis of an Energy Pile Enduring Cyclic Temperature Loads. Geotech. Res. 2019, 6, 227–233. [Google Scholar] [CrossRef]
  26. Shuang, Y.; Zhang, C.H.; Jiang, P. Heat transfer performance and structure response of energy piles. Therm. Sci. 2019, 23, 1647. [Google Scholar]
  27. Yang, B. Theoretical and Experimental Study on Heat Transfer Performance and Thermal-Mechanical Coupling Characteristics of Phase Change Concrete Energy Pile. Master’s Thesis, Yangzhou University, Yangzhou, China, 1 June 2020. [Google Scholar]
  28. Jin, L. Study on Thermo-Mechanical Properties of Phase Change Steel Ball Energy Pile in Saturated Sand Foundation. Master’s Thesis, Jilin Jianzhu University, Changchun, China, 1 June 2021. [Google Scholar]
  29. Cui, H.; Zou, J.; Gong, Z.; Zheng, D.; Bao, X.; Chen, X. Study on the thermal and mechanical properties of steel fibre reinforced PCM-HSB concrete for high performance in energy piles. Constr. Build. Mater. 2022, 350, 128822. [Google Scholar] [CrossRef]
  30. Mousa, M.M.; Bayomy, A.M.; Saghir, M.Z. Phase Change Materials Effect on The Thermal Radius and Energy Storage Capacity of Energy Piles: Experimental and Numerical study. Int. J. Thermofluids 2021, 10, 100094. [Google Scholar] [CrossRef]
  31. Han, C.; Shen, Y.; Chen, K.; Gong, C.; Liu, T.; Qu, B. Characteristics and energy performance of novel MicroPCM C50 energy pile in cooling mode. Energy Build. 2022, 274, 112442. [Google Scholar] [CrossRef]
  32. Cao, Z.; Zhang, G.; Liu, Y.; Zhao, X. Thermal performance analysis and assessment of PCM backfilled precast high-strength concrete energy pile under heating and cooling modes of building. Appl. Therm. Eng. 2022, 216, 119144. [Google Scholar] [CrossRef]
Figure 1. Experimental equipment diagram: (a) Pump; (b) HH-2 constant-temperature water bath pot; (c) digital display dial gauge; (d) YBY4010 data acquisition system.
Buildings 14 00188 g001
Figure 2. Pile body heat pipe and phase-change material package pipe diagram.
Buildings 14 00188 g002
Figure 3. 25 phase-change paraffin DSC detection chart.
Buildings 14 00188 g003
Figure 4. Schematic diagram of model pile specimen.
Buildings 14 00188 g004
Figure 5. Distribution of experimental measuring points: (a) Diagram of measuring point distribution; (b) temperature and strain test points of pile body.
Buildings 14 00188 g005
Figure 6. Unit pile body heat transfer comparison chart.
Buildings 14 00188 g006
Figure 7. Pile surface temperature diagram.
Buildings 14 00188 g007
Figure 8. Pile top displacement diagram.
Buildings 14 00188 g008
Figure 9. Pile surface stress diagram.
Buildings 14 00188 g009
Table 1. Parameter table of phase-change paraffin.
Material ParameterSolid PhaseLiquid Phase
Density (g/cm3)0.880.77
Thermal conductivity (W·m−1·K−1)0.210.20
Heat capacity (kJ·kg−1·K−1)3.402.60
Transformation temperature * (°C)11.9019.3044.20
Latent heat of phase change (kJ·kg−1)99.70
Transformation temperature *: The phase transition temperature includes the initial phase transition temperature, the peak phase transition temperature, and the termination phase transition temperature listed in the table.
Disclaimer/Publisher’s Note: The statements, opinions and data contained in all publications are solely those of the individual author(s) and contributor(s) and not of MDPI and/or the editor(s). MDPI and/or the editor(s) disclaim responsibility for any injury to people or property resulting from any ideas, methods, instructions or products referred to in the content.

