Abstract
To examine the effects of different peak accelerations on the stability of the accumulation slope and the effectiveness of anti-slide piles under seismic loads, this paper used the Fanlingqian landslide as the main research object and combined it with digital image correlation (DIC) technology in order to carry out a shaking table test. Then, the acceleration response, displacement field, strain field, the bending moment distribution of the 0.05–0.3 g ground motion accumulation slope, and the anti-slide pile reinforcement were studied. The results of the test show the following: the amplification coefficient of the measuring points A1–A6 of the accumulation slope reaches the maximum at a peak acceleration of 0.2 g, and its values are between 1.25 and 1.3, respectively. Finally, it shows a decreasing trend at a peak acceleration of 0.3 g, and its corresponding values are, respectively, between 1.1 and 1.2. In the anti-slip pile reinforcement test, due to the obstruction of the anti-slip pile, the damping of the soil around the pile increases. As the peak value of the seismic wave input increases, the amplification factor shows an overall decreasing trend. A1–A6 correspond to a peak acceleration of 0.3 g. The amplification factors are all close to 1. During different peak accelerations, the accumulation slope mainly experienced the earthquake-induced stage, tensile failure stage, creeping deformation stage, and overall instability stage. In the anti-slide pile reinforcement test, under the same conditions, the slope mainly experienced the earthquake-induced stage, tensile failure stage, lower sliding surface formation stage, and soil shedding stage in front of the pile. At the same time, the displacement and strain fields of each stage of the two groups of tests are compared, and it is found that the displacement and strain values of the accumulation slope test are greater than those of the anti-slide pile reinforcement test, and the horizontal displacement difference at the top of the slope is the most significant, reaching 2.3 times at the maximum. The bending moment of the anti-slide pile first increases and then decreases with the increase in acceleration, the reverse bending point of the pile appears at 5 times the pile diameter below the soil surface, and the maximum bending moment of the middle pile, corresponding to a peak acceleration of 0.05–0.3 g, is between 7.5 N·m and 47 N·m, respectively, while the maximum bending moment of the outer pile is between 6.5 N·m and 52 N·m, respectively. It is important to apply DIC image processing technology to the monitoring of landslide structure and the evaluation of slope stability in practical engineering.
1. Introduction
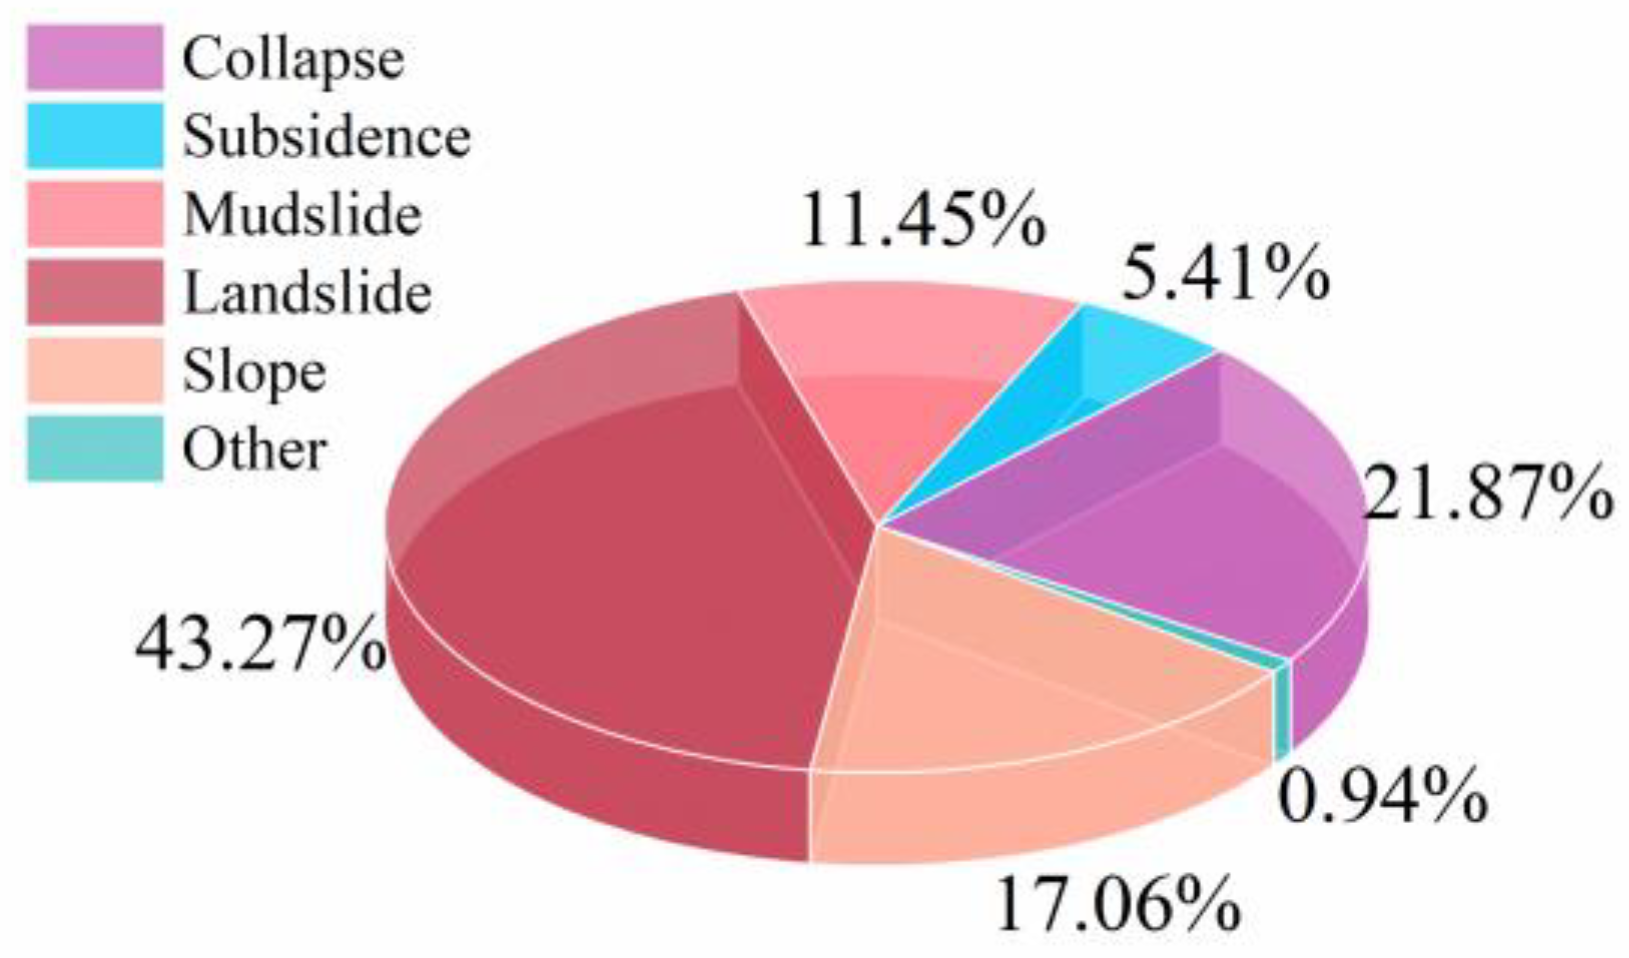
A landslide is a kind of sudden and hazardous geologic disaster, and the proportion of landslides to all other kinds of geologic disasters in the country has reached 43.27%, as shown in Figure 1. Among these landslides, accumulation landslides are widely distributed in Southwest China, which has a kind of “binary structure” between rock and Quaternary accumulation. At the same time, China lies at the intersection of the Pacific Rim and Eurasian seismic zones, which causes loose slopes, large pores, and strong permeability. In seismic conditions, these features lead to poor stability and are prone to deformation and failure.

Figure 1.
Percentage of the number of various types of geologic hazards in the country in 2023.
The shaking table test can simulate the seismic action realistically and effectively, and it is a common method used to study the response characteristics of slope ground motion [1]. Keefer [2] and Shimizu et al. [3] were the first to refine the stability criteria for slopes under dynamic action by means of shaking table tests. Chinese scholars have paid more attention to shaking table tests since 2008’s Wenchuan earthquake: Xu [4] used shaking table tests to explore the influence of factors such as slope structure and earthquake action direction on slope deformation and damage. Research shows that an earthquake’s horizontal inertia force impacts the horizontal displacement of slope surfaces more than their vertical displacement, and different slope structures affect the slope instability failure mode. Liu et al. [5], Yang et al. [6], and Liu et al. [7] conducted in-depth analyses of the destabilization mechanisms of anticlinal laminar rocky slopes, obliquely laminar rocky slopes, and homogeneous rocky slopes, relying on shaking table tests. In terms of research on accumulation landslides, Liu et al. [8] found, through shaking table tests, that soil on the accumulation slopes will be thrown out during the simultaneous action of an appropriate crack angle and a large enough vertical seismic acceleration. Kong et al. [9] analyzed the instability characteristics and failure modes of the accumulation slopes through the permanent displacement of the slope surface. Yang et al. [10] discussed the influence of different types of seismic loads on the instability characteristics and acceleration amplification coefficient of the accumulation slopes.
Due to the positive effects of good management and the high safety performance of anti-slide piles, they have become the primary reinforcement measures used for the management of slope engineering. Several studies have been conducted to investigate the dynamic response, deformation, and failure characteristics of rock slopes reinforced using single-row and double-row anti-slide pile support structures during earthquake action. Xu and Zheng [11], Lai Jie et al. [12], Liu et al. [13,14], Feng et al. [15], and Fan et al. [16] conducted shaking table tests to assess these aspects.
In the model test, the displacement before and after the failure of the landslide is usually used to judge the failure behavior of the slope [17]. In terms of slope displacement response, Abdoun et al. [18] used an array displacement meter to test the displacement of the abutment slope in the shaking table test at the National Institute of Disaster Prevention Technology in Japan and obtained good displacement data. However, there are only a few measuring points that measure displacement with a sensor, so accuracy cannot be guaranteed. Liu et al. [19] applied PIV technology to the shaking table model test and used a camera to observe the displacement of the side of the slope and depict its sliding surface. Fang et al. [20] used the displacement, strain, velocity field, and other information obtained by the multi-field monitoring method to study the deformation, failure, and post-failure behavior of the slope. The GoPro camera used in this experiment has an anti-shaking function, which can take better images during the test, so as to better analyze the behavior characteristics of the slope before and after failure in combination with DIC non-contact measurement technology.
In this paper, the physical model test of the slope is established based on the shaking table in order to study the stability of the slope of the accumulation layer and the supporting effect of the anti-slide pile under a seismic load. The deformation process and slope failure phenomenon of the slope accumulation layer before and after the reinforcement of the anti-slide pile are observed by using the images captured by the GoPro camera and DIC technology; additionally, the acceleration response in the soil, the displacement strain response of the slope, and the bending moment distribution of the anti-slide pile are analyzed.
2. Engineering Background
2.1. Physical Geography
The Fanlingqian landslide is located in Fanlingqian Village, Laoshan District, Qingdao City, Shandong Province. The overall terrain is a gentle slope at the front edge and steeper in the middle and rear. The central longitude and latitude are 120°40′49.31″ east longitude and 36°50′50.11″ north latitude, with an area of about 0.25 km2. The Fanlingqian landslide is a typical accumulation layer landslide, and the front edge of the landslide is 3–5 m away from the Yellow Sea surface. As shown in Figure 2, the Fanlingqian landslide includes the existing landslide, landslide 1, landslide 2, and landslide 3. A gully developed in the landslide on the east side of the landslide. The gully is 1–3 m deep and the gully trend is 140°. Due to the cutting effect of the gully, a large amount of debris was deposited in the gully, and bedrock was exposed in some places. The landslide area was initially a whole, but after years of water flow impact, the landslide is divided into two independent entities. When the slope slides, the two independent entities may slide separately, and the characteristic parameters of the sliding may be completely different. Landslide 3 is located on the southwest side of the existing landslide, and obvious creeping deformation has occurred on the side of the road near the trailing edge.
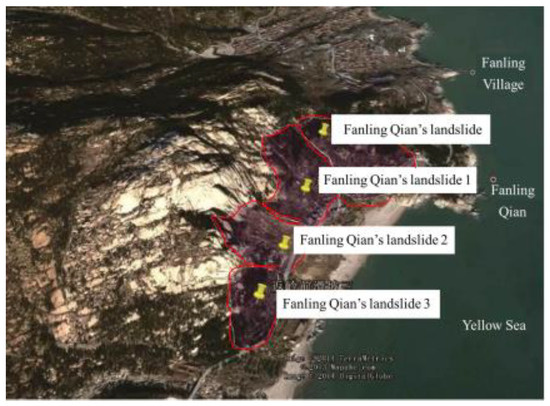
Figure 2.
Location map of the Fanlingqian landslide.
2.2. Overview of Geology and Seismology
The outcrops of the slopes in the landslide area from old to new are the Mesozoic Cretaceous Lower Laiyang Group Zhifengzhuang Formation (KlZ) and the Cenozoic Quaternary Holocene Piedmont Formation (QS). Bedrock outcrops can be seen everywhere above the landslide area, and the lithology of the rock is Yanshan late granite (γ35). The field investigation shows that the landslide area is covered with 3–6 m of slope residue, the vegetation is well developed, some areas are terraced fields, and the upper bedrock is exposed.
According to the survey statistics, the Yellow Sea has experienced a total of 105 earthquakes, including 49 earthquakes of magnitude 4.0 or more, 39 earthquakes of magnitude 5.0 or above, 17 earthquakes of magnitude 6.0 or more, and the largest earthquake magnitude reached 7. Therefore, this shaking table test is aimed at the geological conditions of the slope before returning to the mountain in Laoshan District, Qingdao, and its stability under seismic load is studied.
3. Materials and Methods
3.1. Test Equipments
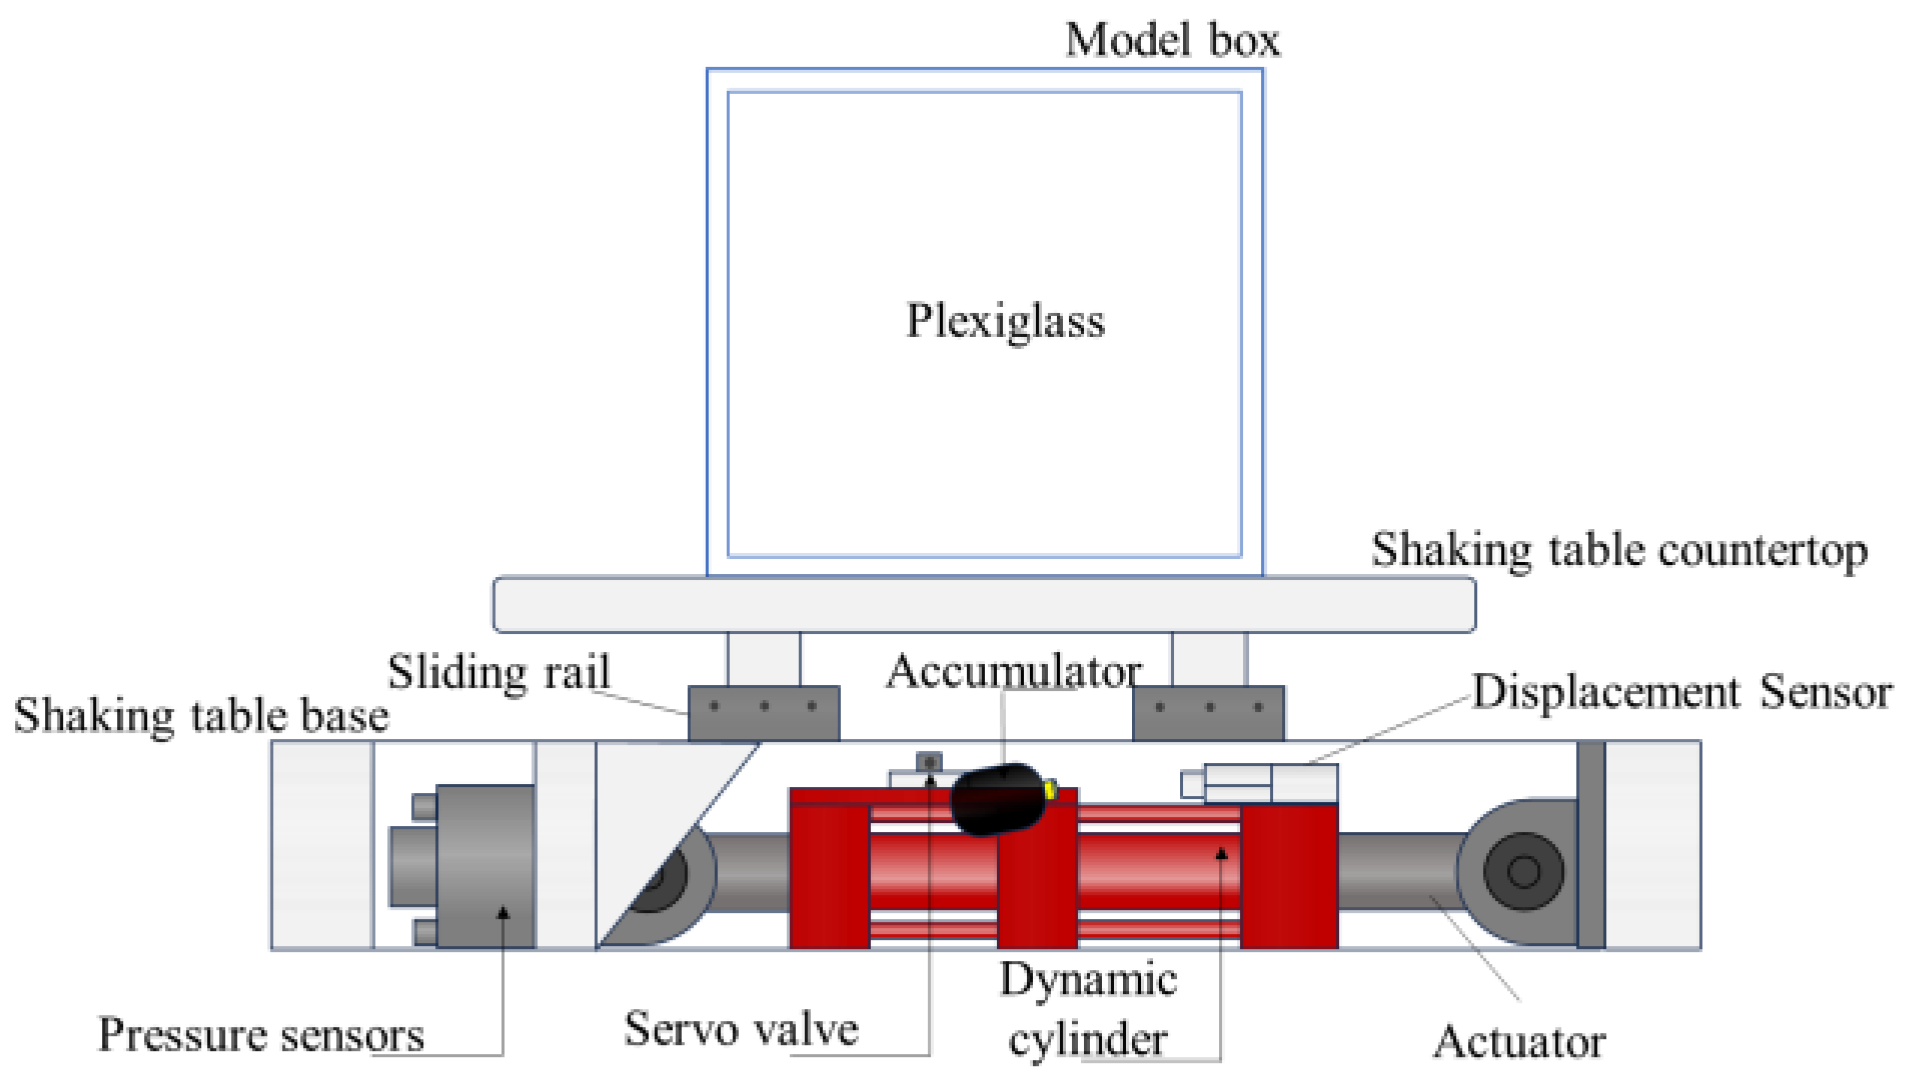
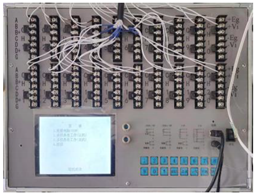
The test was carried out using a shaking table from the Geotechnical Railway Transportation Comprehensive Laboratory of Qingdao University of Science and Technology, which consists of a shaking table and a model box with mechanical, electrical, and hydraulic integration, as shown in Figure 3. The table size of the shaker is 2.04 m (length) × 1.04 m (width), and the working principle is shown in Figure 3. The equipment included a dynamic load cylinder, with a servo valve for precise control of the oil pressure going in and out; when the accumulator stores a small amount of oil, it can be supplemented in a timely manner to the dynamic load cylinder oil pressure in order to improve the efficiency of the equipment. The actuator receives the transmission signal to pull the pressure from the dynamic load cylinder as a way to apply force. At the same time, the bottom of the vibration table is installed with a pressure sensor which can determine, using the actuator’s pressure and pull, the size of the displacement sensor on the upper part of the dynamic load cylinder. The displacement sensor on the upper part of the dynamic load cylinder is used to limit the size of the force applied by the actuator, which can make the slide rails on both sides of the base run in the normal range of tension or compression, thus providing horizontal vibration, with a maximum load of 6 t, an operating frequency of 0.1–50 Hz, a maximum horizontal displacement of ±100, and a maximum horizontal acceleration of 0.5 g under full load, which can realize the loading of all kinds of seismic waves and regular waves.

Figure 3.
Shaking table equipment.
The 1.2 m (L) × 1.2 m (W) × 1.2 m (H) model box that accompanied the test is shown in Figure 3. The model box is surrounded by steel, and a 20 mm thick tempered piece of plexiglass is installed along the side of the vibration direction, which facilitates the direct observation of the slope deformation process. It is necessary to place a 5 cm thick rubber pad on the inner wall of the model box in the vertical vibration direction to reduce the boundary effect of the model box.
3.2. Derivation of Similarity Constants
Based on Buckingham’s theorem and the magnitude analysis method, used to restore slope dynamic response characteristics under real seismic action, the geometrical similarity constant Cl = 100, the material density similarity constant Cρ = 1, and the acceleration similarity constant Ca = 1 are selected as the controlling quantities, and the similarity relationships of other parameters can be derived from them, as shown in Table 1 [21,22].

Table 1.
Model slope similarity relationships.
3.3. Similar Materials and Ratios for Slope Modeling
This test model is mainly composed of bedrock and accumulation layer. The accumulation layer uses standard sand, barite powder, gypsum, bentonite, and water as similar mixed materials, as shown in Figure 4. Except for the replacement of cement with bentonite, the other materials similar to the bedrock are also similar to the accumulation layer. Through direct shear tests and uniaxial compression tests, the internal friction angle, cohesion, and elastic modulus of the accumulation layer and bedrock were determined, and the proportion of similar materials in the model slope was finally determined, as shown in Table 2. The basic physical and mechanical parameters are shown in Table 3.
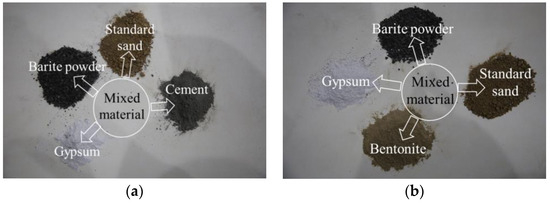
Figure 4.
Model of similar materials: (a) bedrock constituent materials; (b) component materials of the accumulation.
Table 2.
(per dosage) Similar material ratios (%).
Table 3.
Physical and mechanical parameters of model materials.
3.4. Construction of Modeled Slopes
When making the slope model, the materials are mixed according to the ratio in Table 2 in order to obtain the lower bedrock and the upper accumulation layer, respectively, and the specific operations are as follows:
- (1)
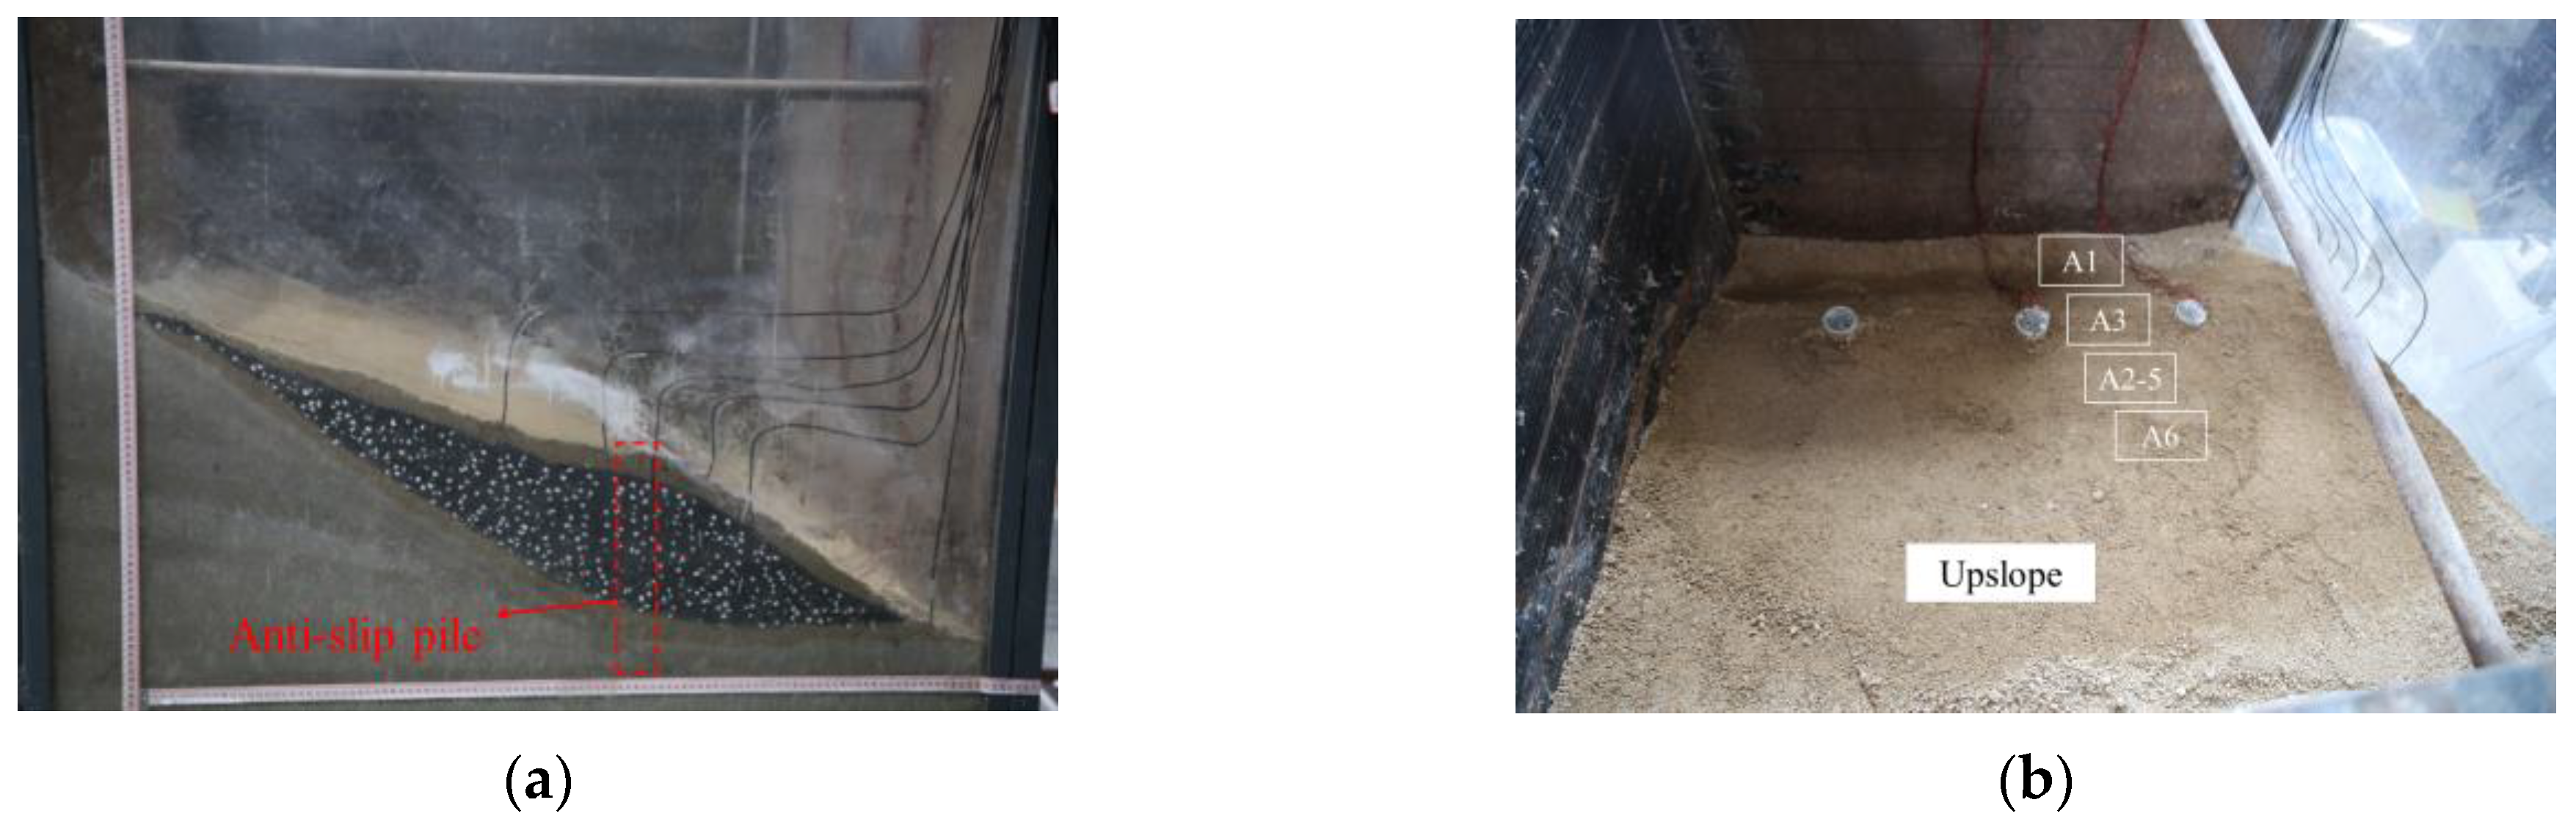
- Filling of lower bedrock. Put the simulated material into the mixer, add water and mix well, then fill into the model box, tamping every 5 cm, for a total of 40 cm, at a bedrock inclination angle of 34°. In order to analyze the displacement change of the accumulation layer and to ensure the quality of the acquired images, the accumulation layer was stained with ink, stirred well, and then dried, while a white gypsum block was used as a scattering marking point, as shown in Figure 5.
- (2)
- Accumulation layer slopes and scattered marker fill. After drawing the shape and geometry of the side slopes on the sidewalls with a marker pen, the accumulation layer simulation material was poured into the model box with modeled slope footings of 19° and 36°. The acceleration sensors were buried when the fill was compacted at 5 cm intervals to the appropriate sensor elevation. When the accumulation layer was filled up to 0.6 cm from the bottom, the stained accumulation layer was uniformly spread on one side of the plexiglass surface, while gypsum was randomly spread on its surface in order to analyze the displacement field of the modeled slopes by the DIC processing technique.
- (3)
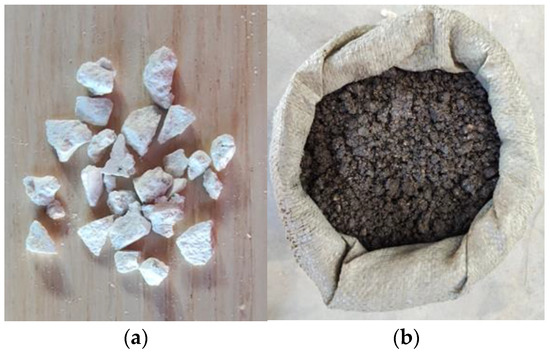
Figure 5.
Scatter marking point production: (a) gypsum blocks; (b) accumulation ink staining.
Figure 5.
Scatter marking point production: (a) gypsum blocks; (b) accumulation ink staining.
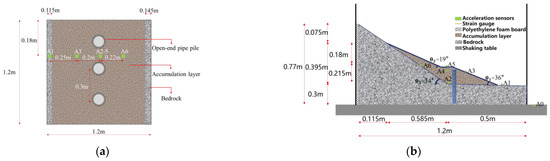
Figure 6.
Layout of measurement points: (a) top view; (b) main view.
Figure 6.
Layout of measurement points: (a) top view; (b) main view.
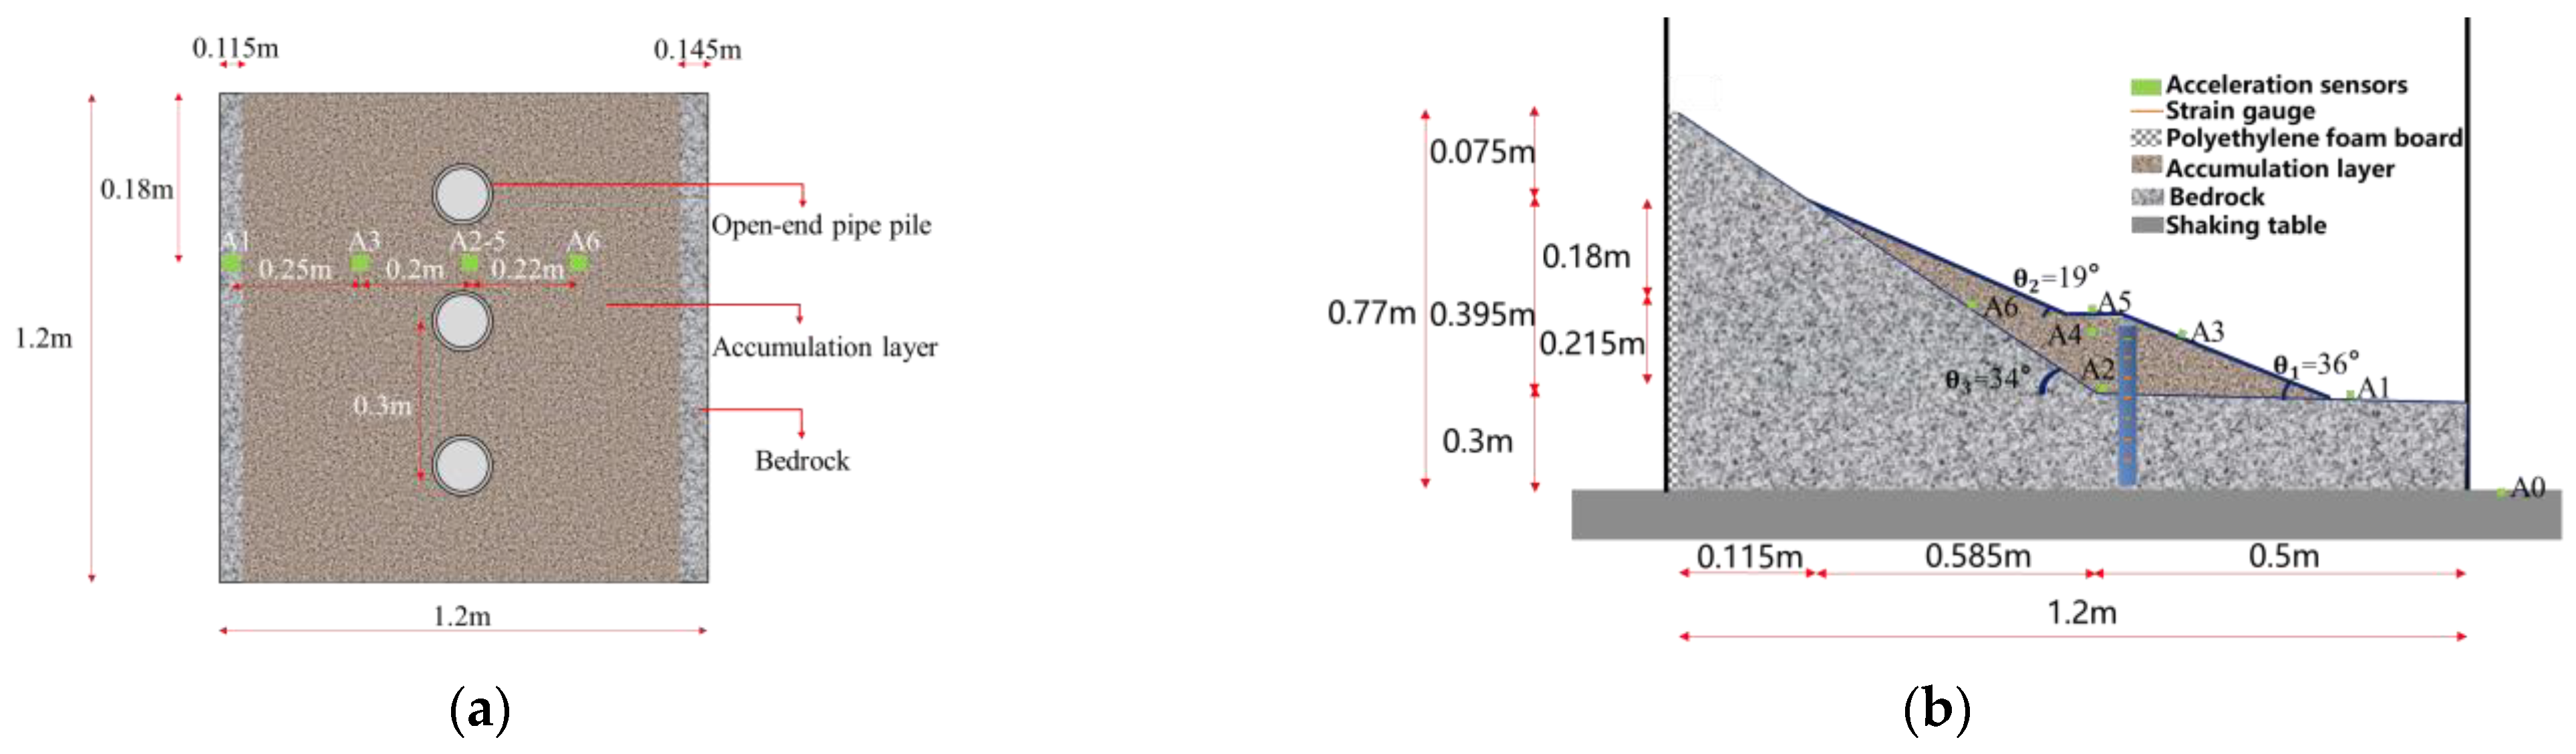
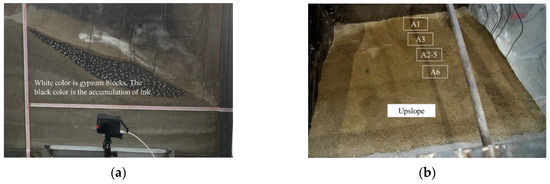
Figure 7.
Accumulation slope test model diagram: (a) top view of slope model; (b) front view of slope model.
Figure 7.
Accumulation slope test model diagram: (a) top view of slope model; (b) front view of slope model.


Figure 8.
Model diagram of anti-slide pile reinforcement test: (a) top view of slope model; (b) front view of slope model.
Figure 8.
Model diagram of anti-slide pile reinforcement test: (a) top view of slope model; (b) front view of slope model.
3.5. Arrangement of Measurement Points
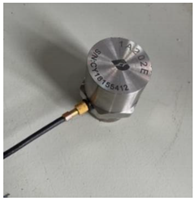
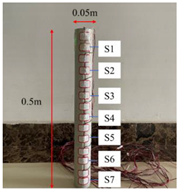
Three open-ended tubular piles of 50 mm diameter and 0.5 m length were buried in the bedrock and the accumulation layer at intervals of 0.3 m. In order to study the rule of the bending moment response of the piles, strain gauges at intervals of 70 mm were affixed on the surface of the piles, and a total of seven strain gauges were arranged for the test, as shown in Table 4. In order to study the acceleration response of the slope under seismic action, a total of six IEPE unidirectional acceleration sensors were placed in the vertical and horizontal directions at the top, middle, and bottom of the accumulation in the experiment, respectively; the acceleration sensors are shown in Table 4, and the sensor arrangement is shown in Table 4.
Table 4.
Introduction to monitoring equipment.
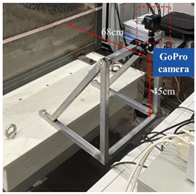
The displacement observation used the DIC image processing technique to measure the deformation of the slope model after each vibration, that is, a leather ruler was set at the plexiglass surface of the model box as a reference for the deformation rupture displacement measurement, and the slope model displacement was measured according to the displacement and deformation occurring in the scattered marking points within the accumulation layer. At the same time, the GoPro camera was fixed on an aluminum alloy bracket that moved rigidly with the shaking table, as shown in Table 4.The camera image quality is selected as 2 K resolution, 120 FPS acquisition frame rate, and the anti-shake function is set to ensure that the camera records each vibration process of the side slope under stable and clear conditions. The recorded video was exported frame-by-frame as high-resolution images through a VLC multimedia player, and finally the ncorr software program was used to calculate and analyze the fine structure of the deformation and rupture of the slope. The specific information from the monitoring equipment is shown in Table 4.
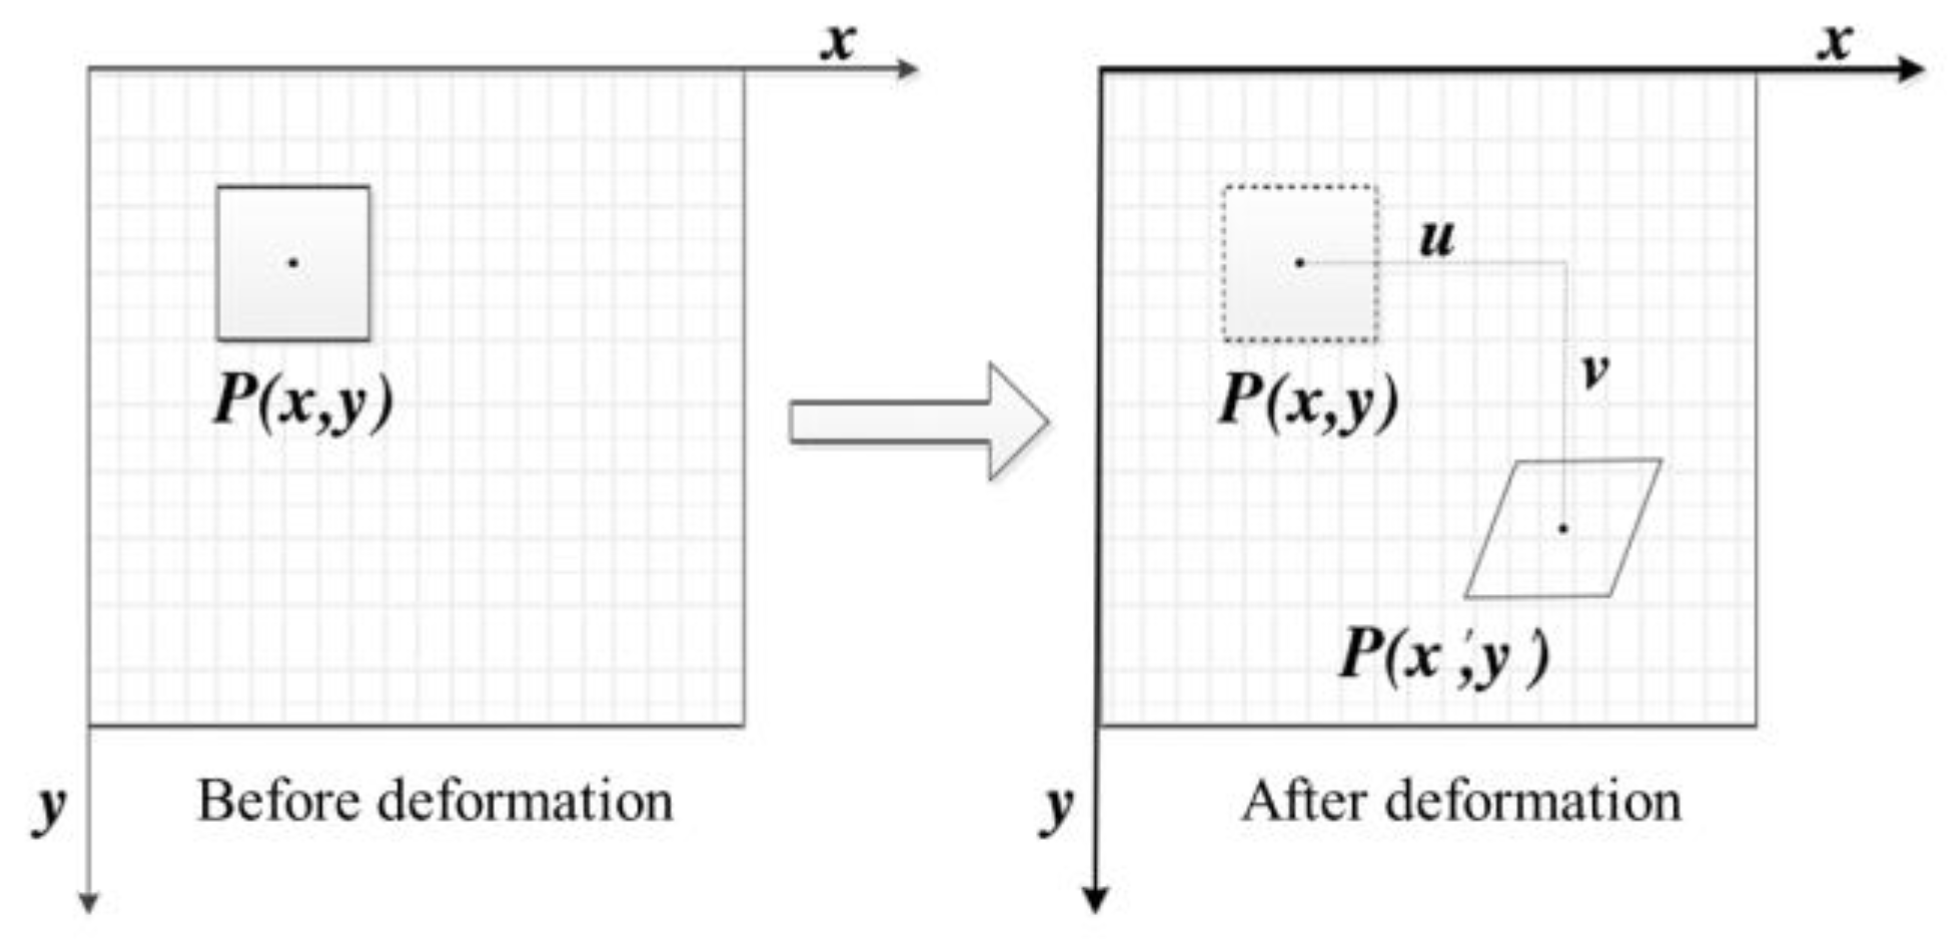
3.6. Principles of Digital Image Speckle Technology
Digital image speckle technology is used to collect images of specimens before and after deformation through industrial cameras, locate the sub-regions of the same gray values recorded before and after deformation according to the difference in gray values between speckles, and calculate the displacement difference between the two through a certain algorithm, that is, the deformation at that place.
Suppose that the gray value of the set center of a rectangular sub-region of a (2M + 1) × (2M + 1) reference image is , the corresponding gray value of the set center after deformation is , and the schematic diagram of the sub-region before and after deformation is shown in Figure 9. If the deformed subregion is only planar relative to the reference image, then the transverse displacement between the two is , and the longitudinal displacement is , i.e., Equation (1):

Figure 9.
Schematic diagram of the sub-area before and after deformation.
Taking into account the rotational, shear, or telescopic deformation of the rigid body in the sub-region, the correspondence before and after the deformation is expressed as Equation (2):
According to Lu et al., with the increase in the size and displacement gradient of the image subregion, the displacement field in the image subregion may not change linearly [23]; therefore, the non-uniform deformation of the template window must be considered, and the influence of the second-order displacement gradient on the correlation coefficient is introduced so that this method can more accurately measure the displacement and strain of the specimen under different complex deformation conditions, that is, Equation (3):
In Equation (3), is the displacement of in the direction; is the distance from any point in the subset to the center point of the subset; are the first-order displacement gradients of the image subregion. are the second-order displacement gradients of the image subregion. For more details on DIC technology, see Blaber [24].
3.7. Seismic Wave Loading Program for the Test Process
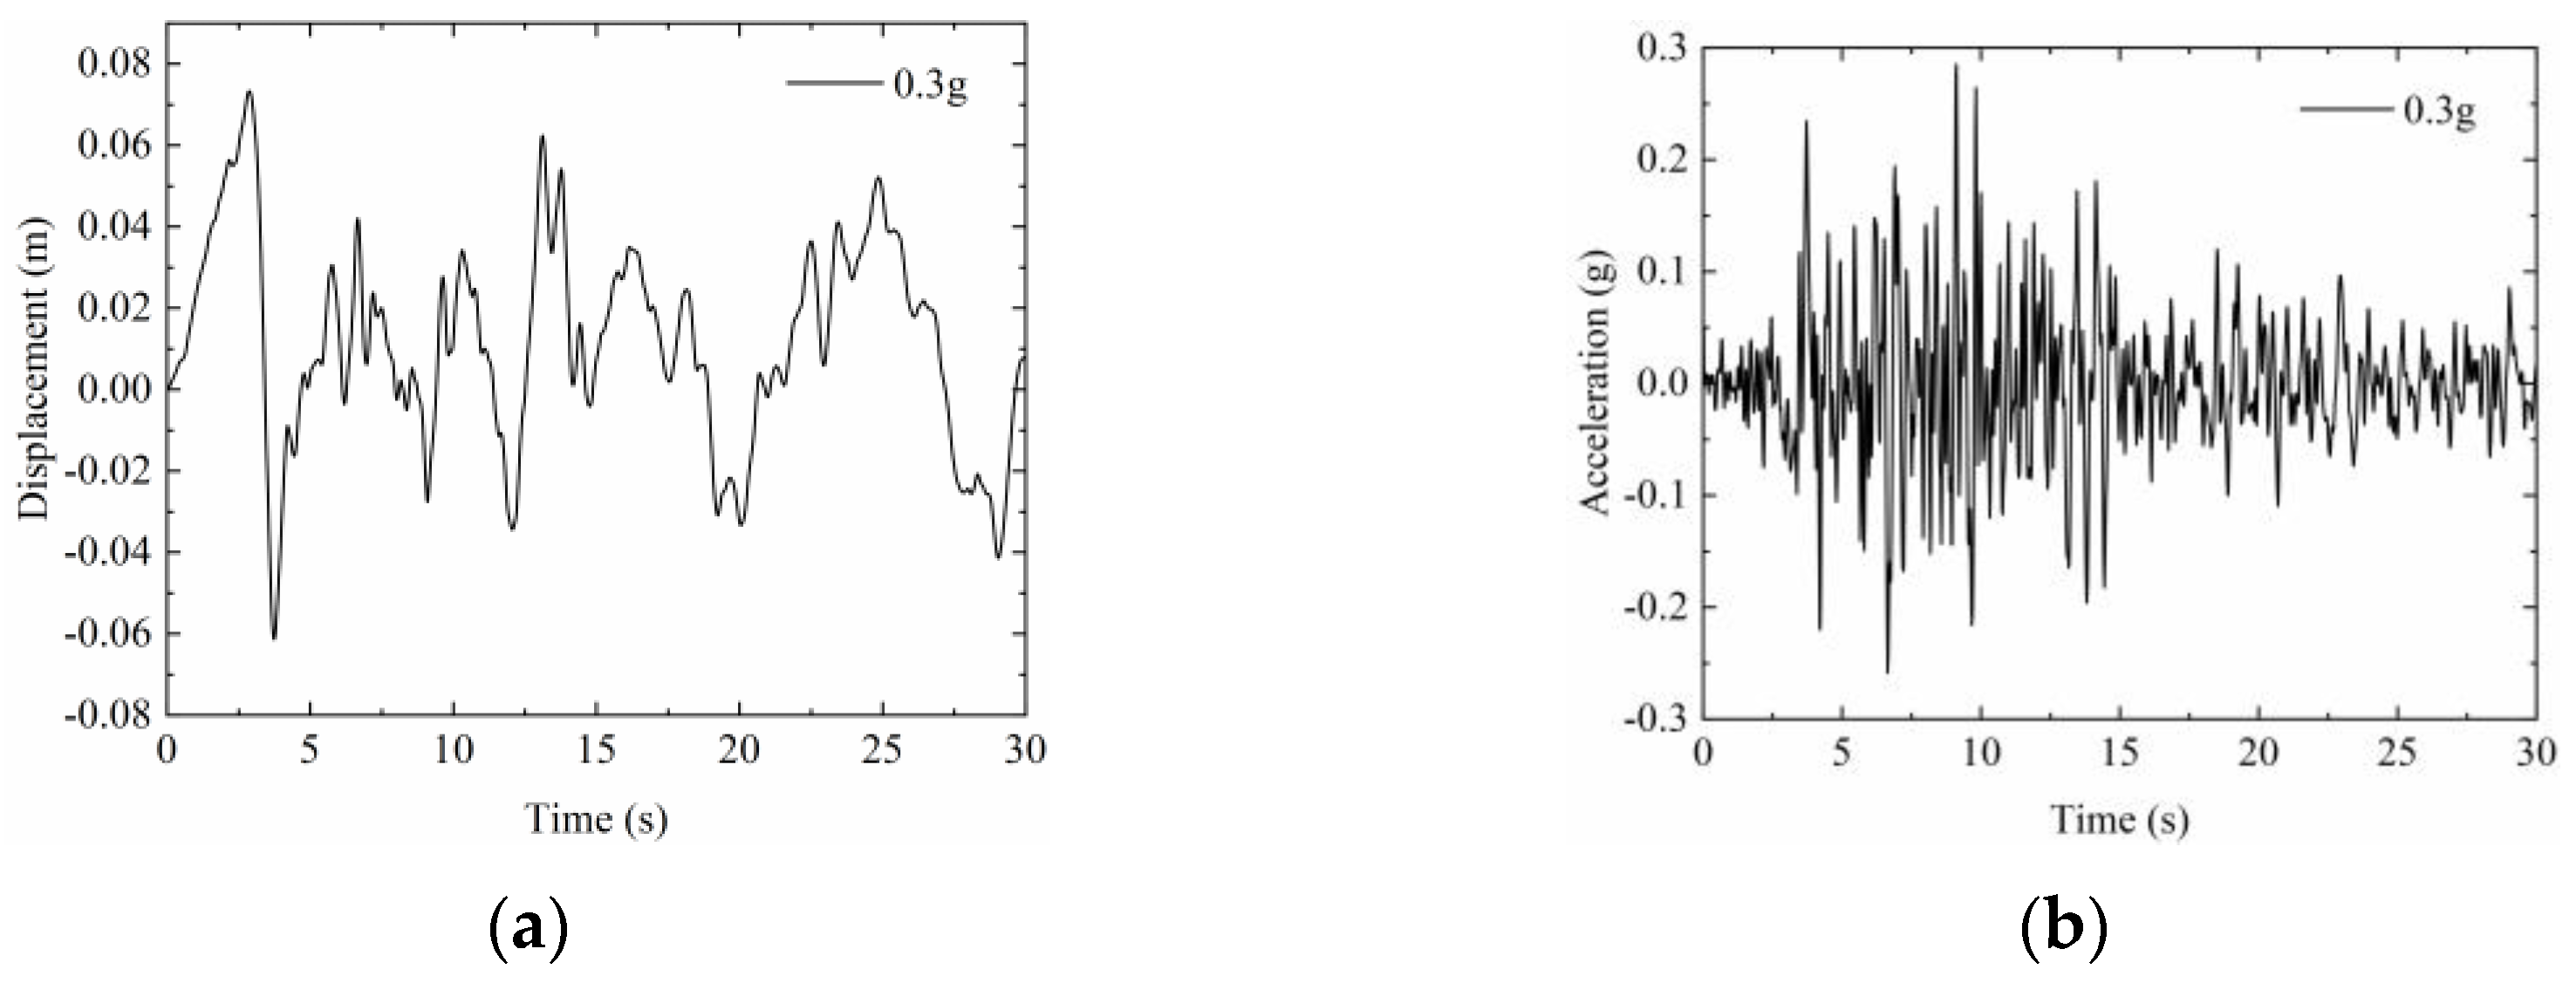
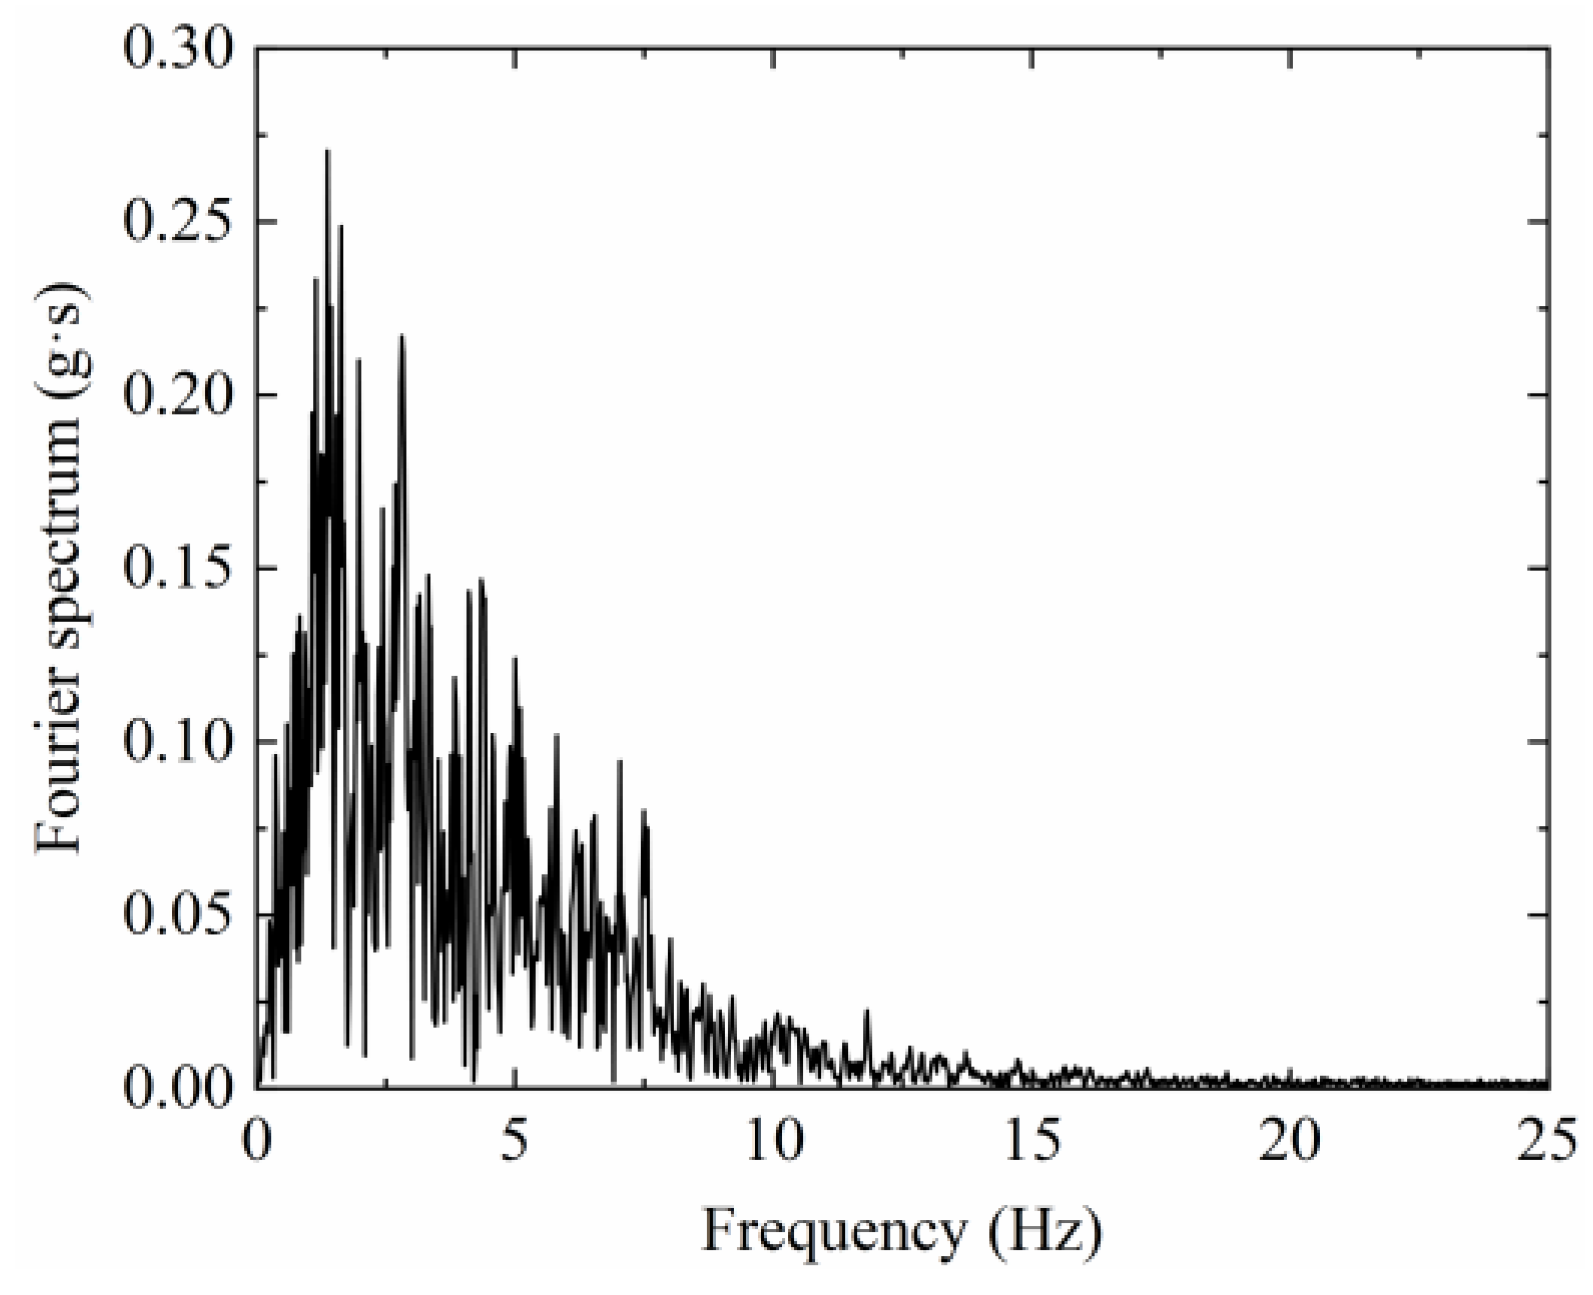
The main seismic wave inputs in the tests are Taft waves, which are loaded horizontally in these tests because horizontal seismicity is an important factor leading to seismic damage in soil structures [25]. The tests were loaded according to a peak acceleration of 0.05 g (30 s), 0.1 g (30 s), 0.2 g (30 s), 0.25 g (30 s), and 0.3 g (30 s) of seismic wave cycles, respectively, as shown in Table 5. The displacement time history curve and Fourier spectrum of the 0.3 g Taft seismic wave input in the experiment are obtained by Matlab double integration and Fourier transform, respectively, as shown in Figure 10 and Figure 11. The sampling frequency in all the tests was 100 Hz and the main frequency was 2.5 Hz.
Table 5.
Seismic wave loading sequence for shaker model test.
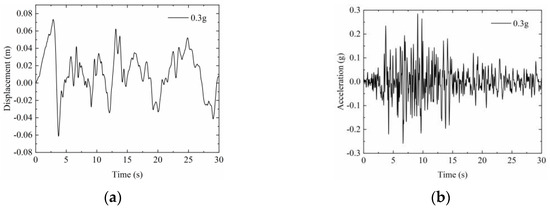
Figure 10.
Seismic wave input: (a) displacement time history curve; (b) acceleration time history curve.
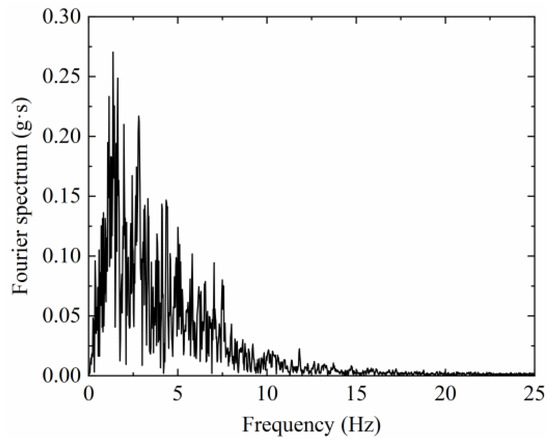
Figure 11.
Fourier spectrum of seismic waves.
4. Results
4.1. Slope Test of the Accumulation
4.1.1. Acceleration Response Rules
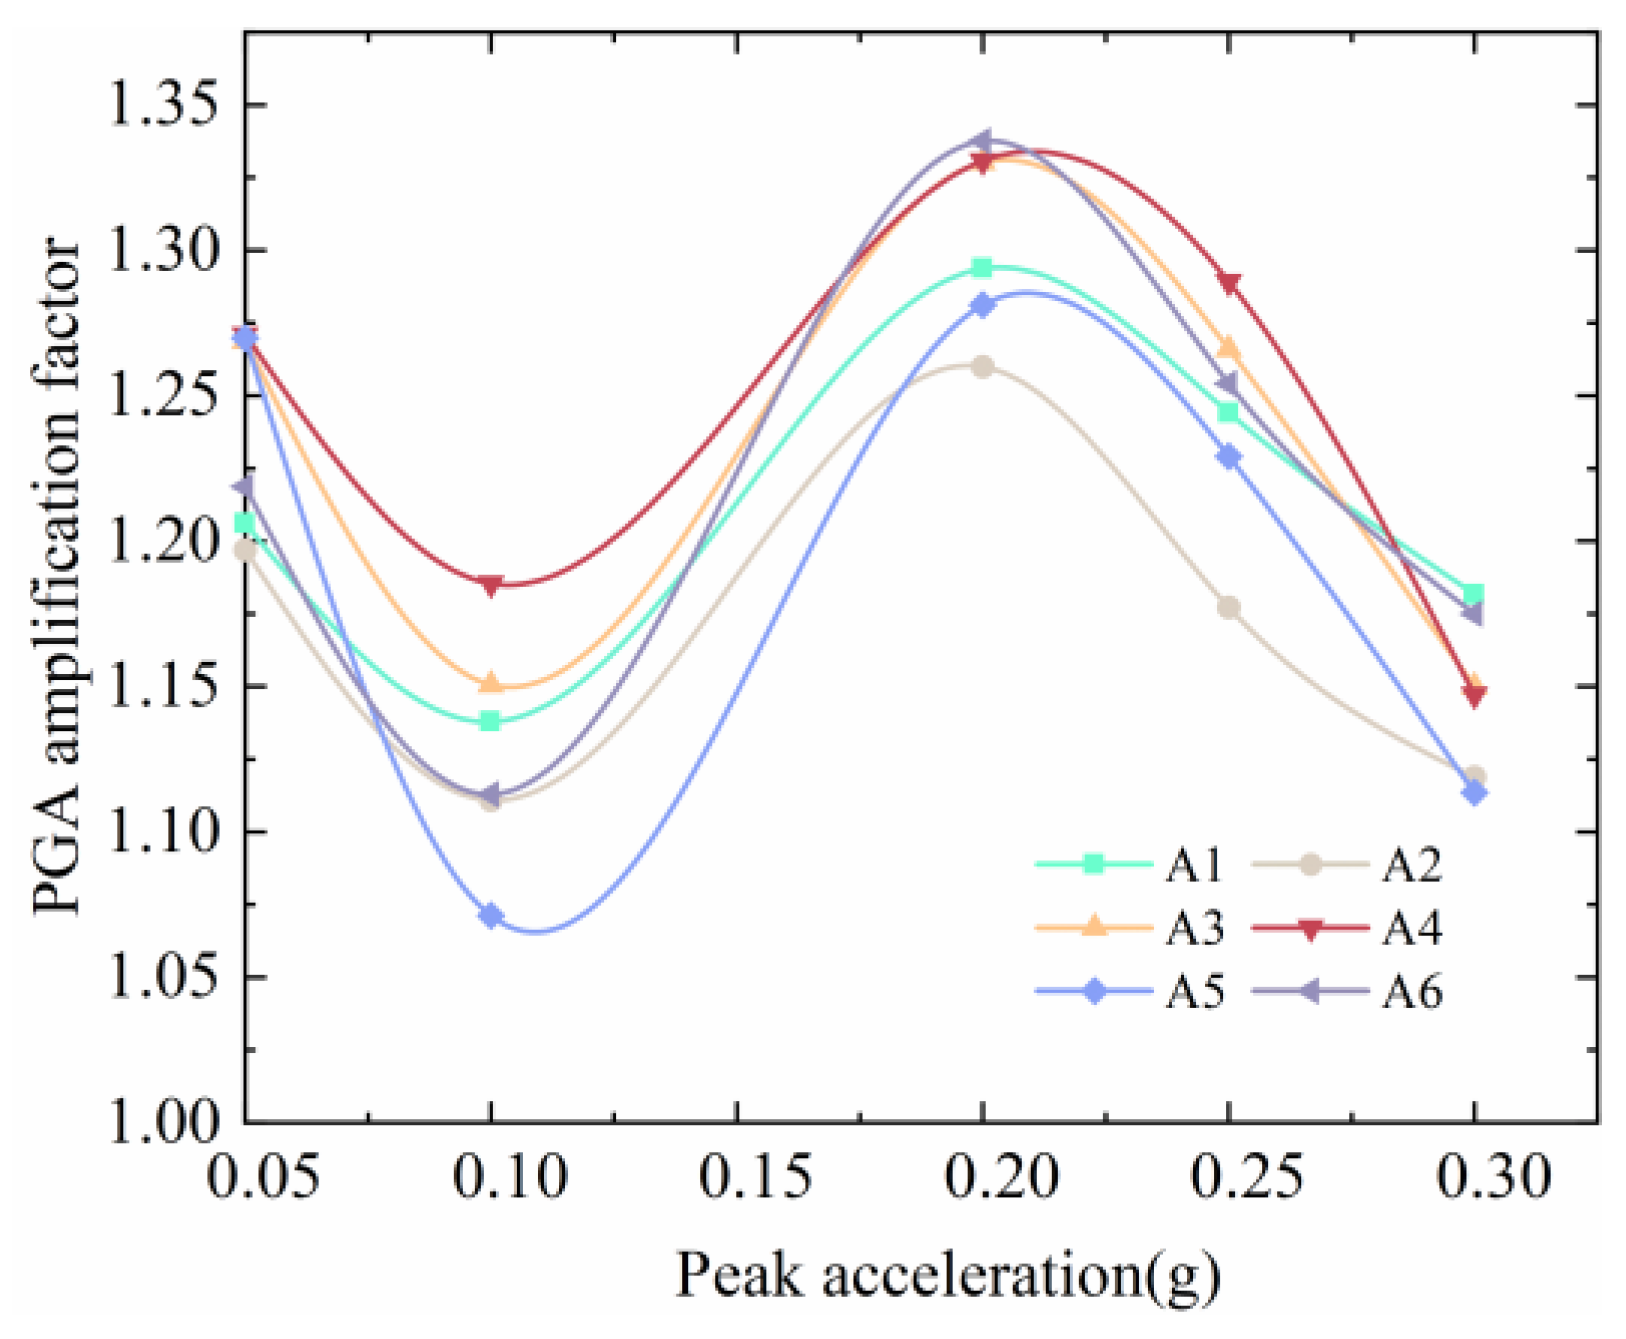
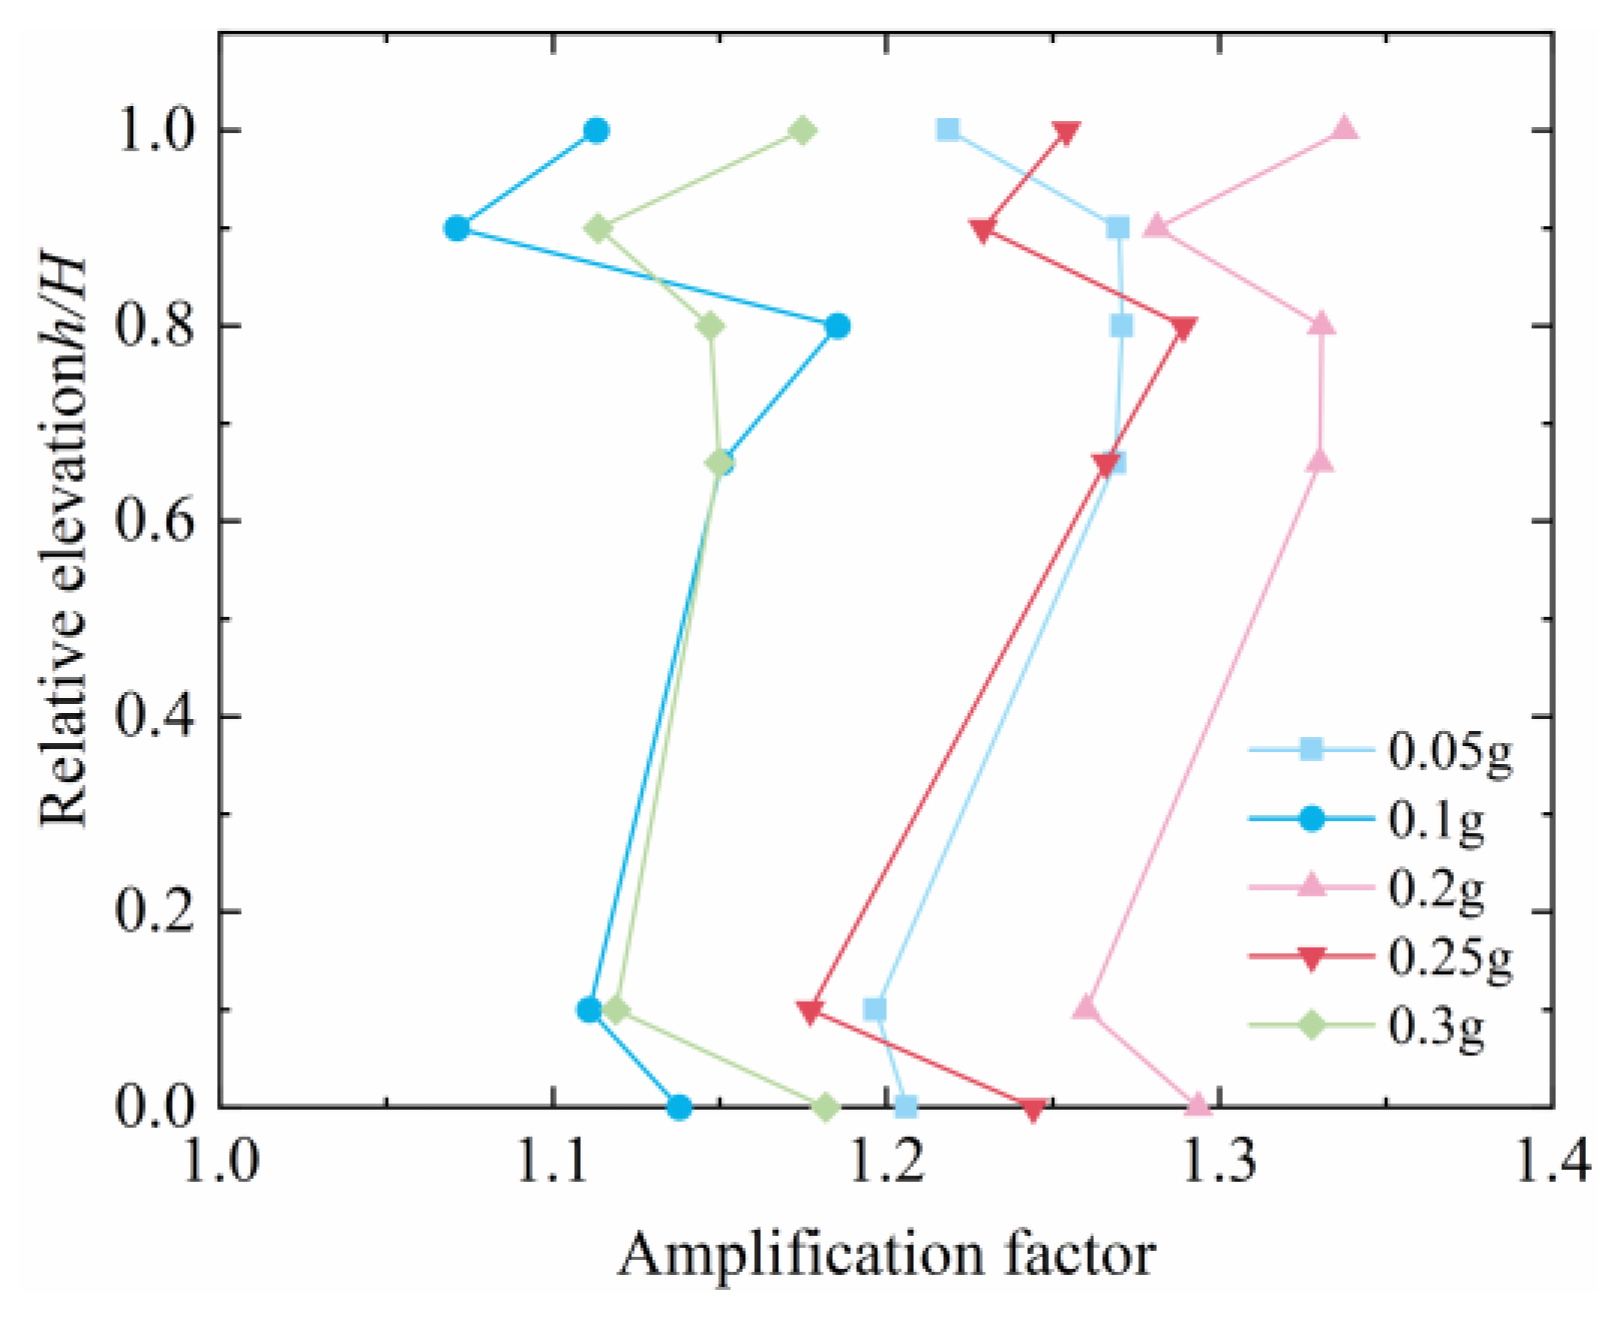
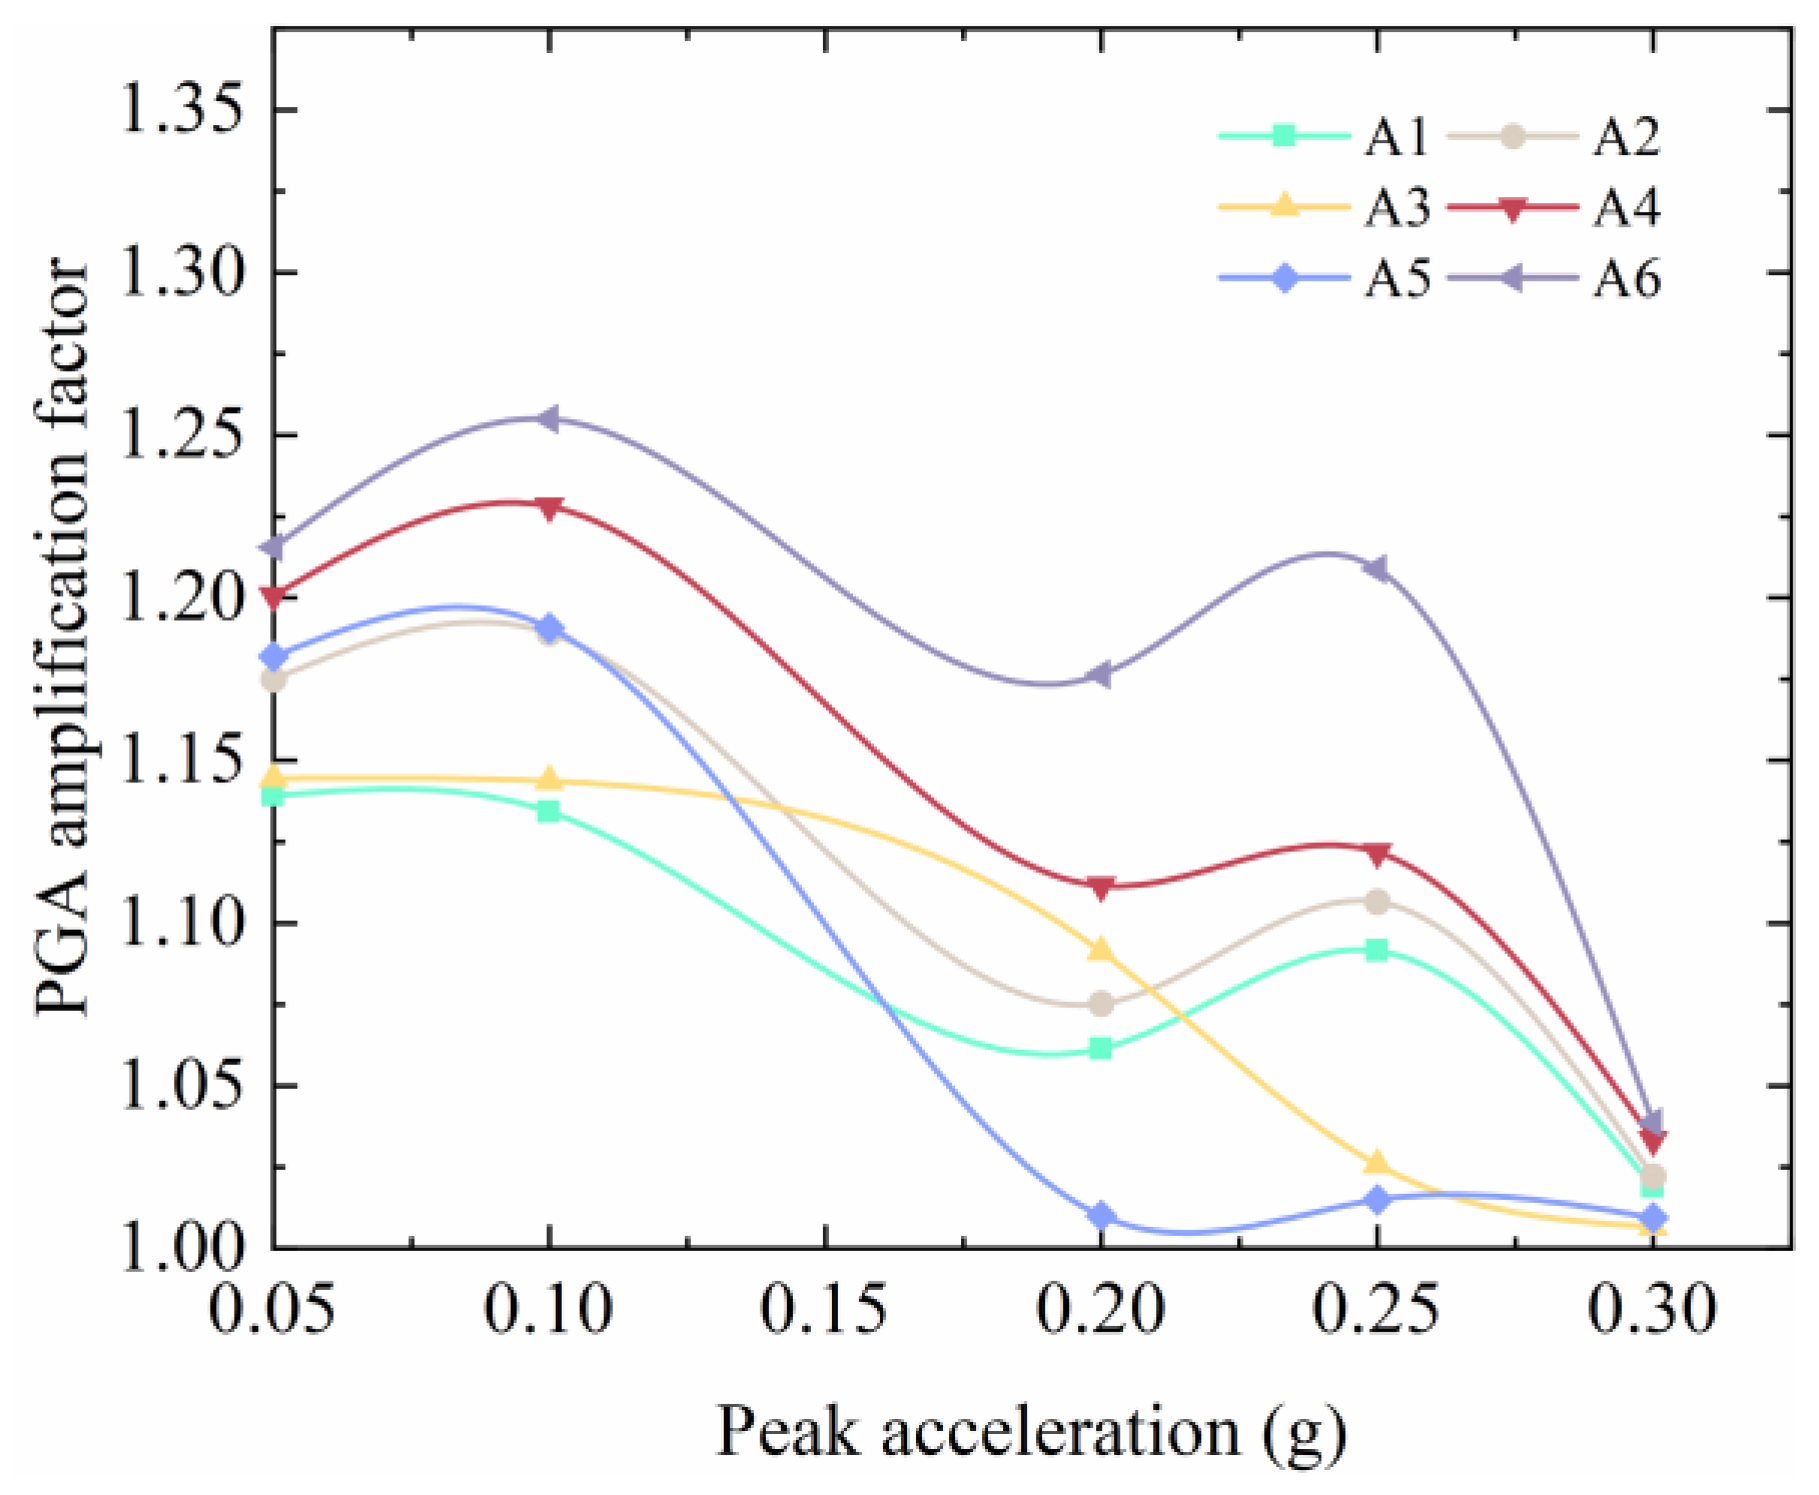
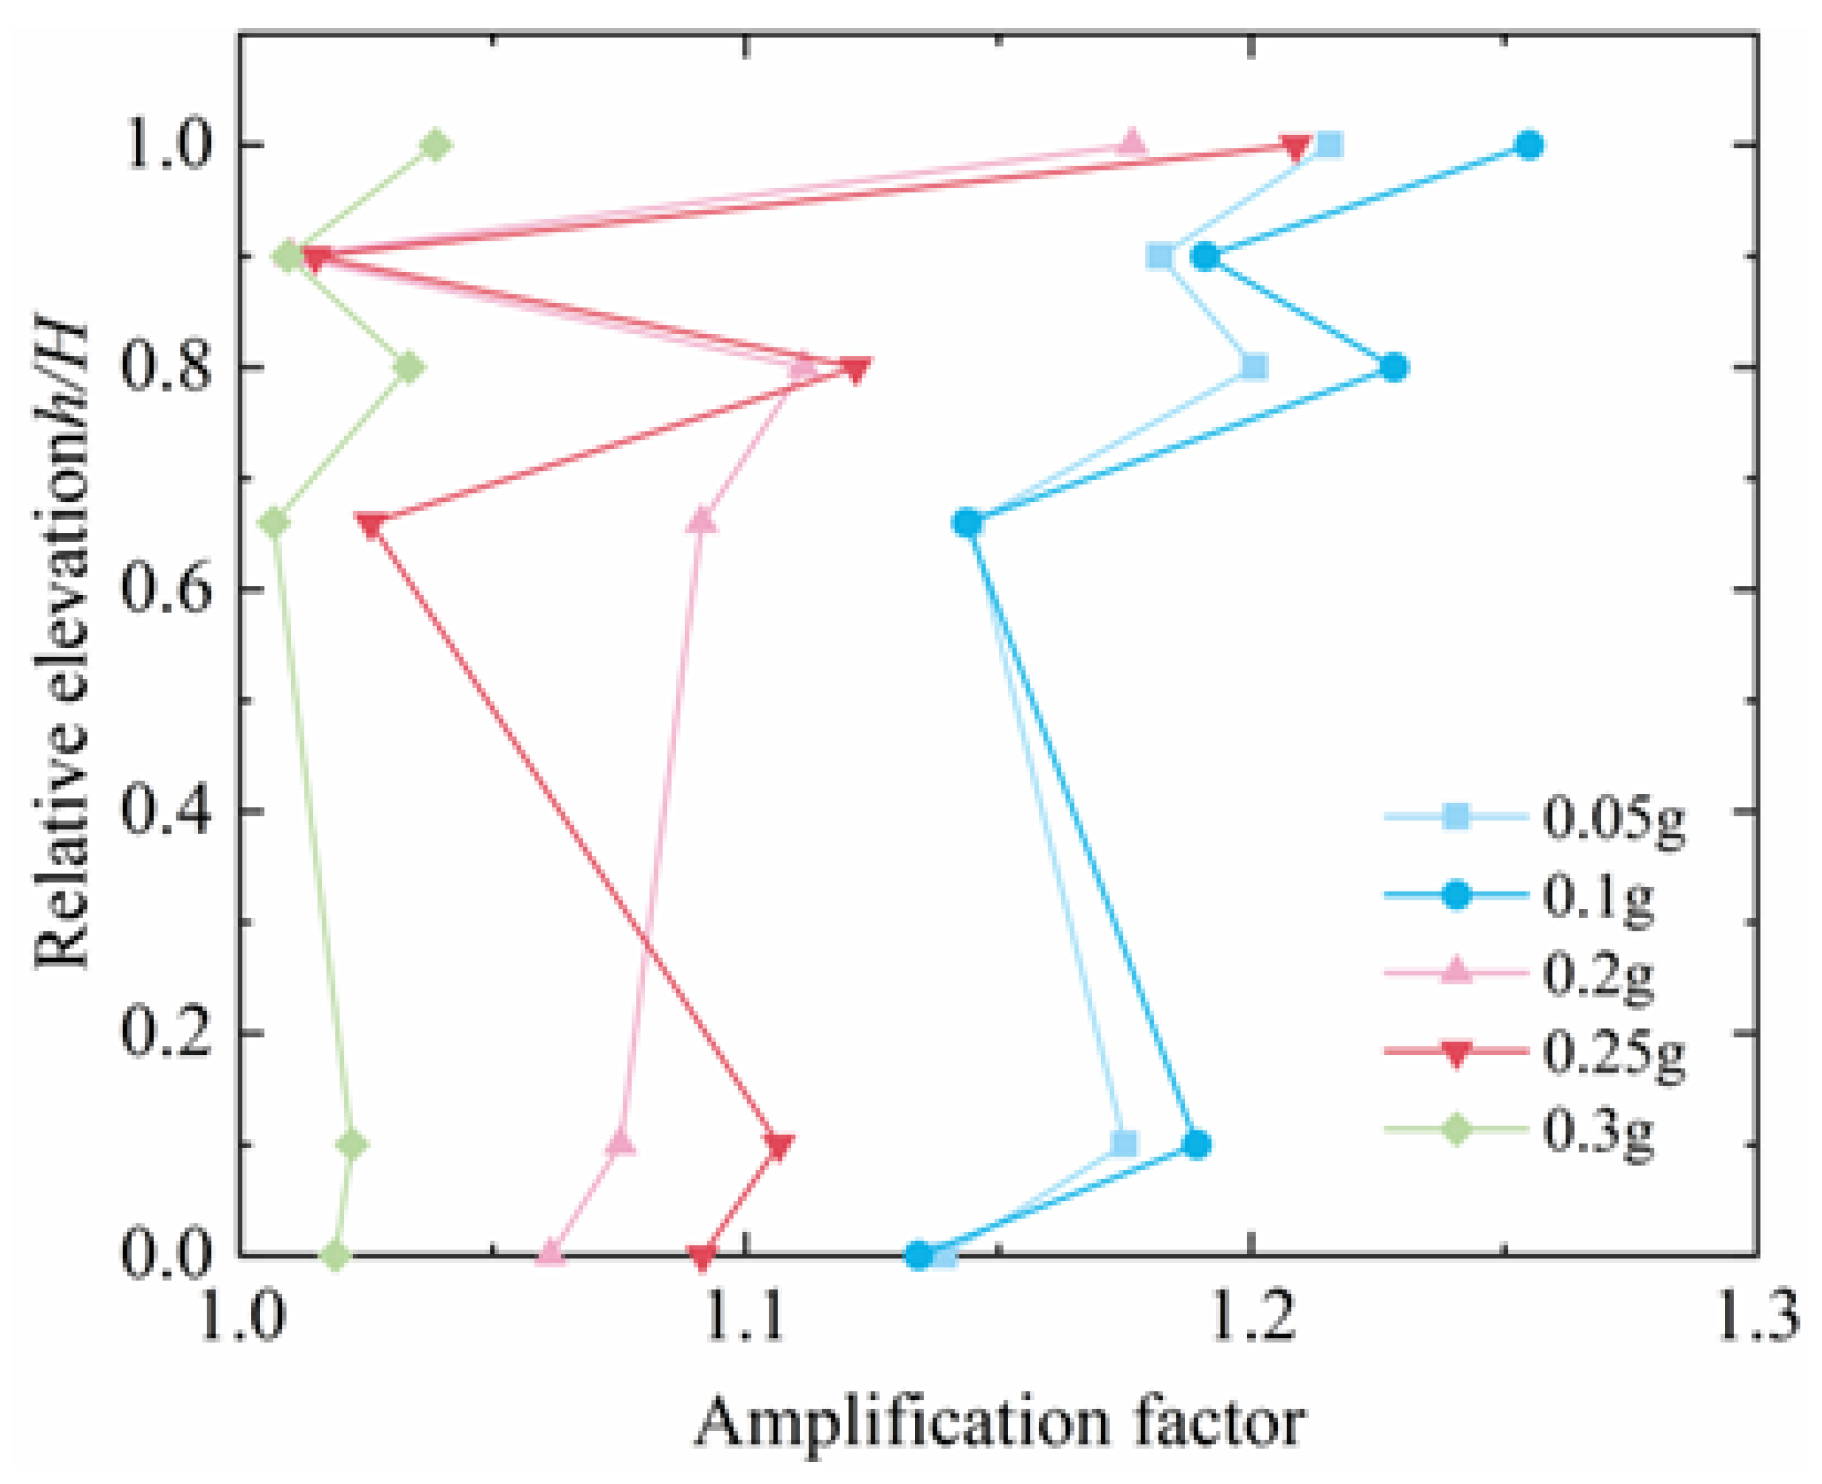
In order to quantitatively express the changing rules of acceleration in slopes under the action of seismic waves of different amplitudes, the acceleration amplification coefficient (defined as the ratio of the measured peak acceleration at each measurement point to the peak acceleration at the A0 measurement point on the shaking table surface [26]) is introduced to characterize the amplification effect of the measurement points A1, A2, A3, A4, A5, and A6 in the range of 0.05 g to 0.3 g. Relative elevation is the ratio h/H of the vertical elevation h from the acceleration burial position to the foot of the downslope of the accumulation layer and the total height H of the downslope of the accumulation layer. Figure 12 shows the Peak Ground Acceleration (PGA) amplification factor of each measuring point accelerometer under different peak accelerations. It can be seen from the figure that the amplification factor of each measuring point increases with the increase in the peak acceleration, and finally shows a decreasing trend. This is because, as the input amplitude increases, the number of vibrations increases, deformation occurs inside the slope and cracks increase, which affects the propagation of seismic waves inside the slope. At the same time, the dynamic characteristics of the slope itself change, and the shear strain of the slope changes. With the increase, the damping ratio increases, and the slope filtering effect becomes stronger and stronger. The combined effect of these factors causes the PGA acceleration amplification coefficient to gradually decrease. As shown in Figure 13, the relative elevations of A1–A6 are 0, 0.1, 0.66, 0.8, 0.9, and 1, respectively. It can be seen from the figure that under the same acceleration peak, as the height increases, the acceleration amplification effect first increases. After increasing, the acceleration decreases, and the acceleration is amplified at A6. At the same time, combined with A6 in Figure 12, it is found that the amplification effect is obvious as the acceleration peak changes. Because A6 has a large inclination angle on the bedrock of the upper slope of the accumulation layer, the soil inside the soil is able to withstand the inertial effect of the earthquake, and the top of the slope of the accumulation layer is damaged first.
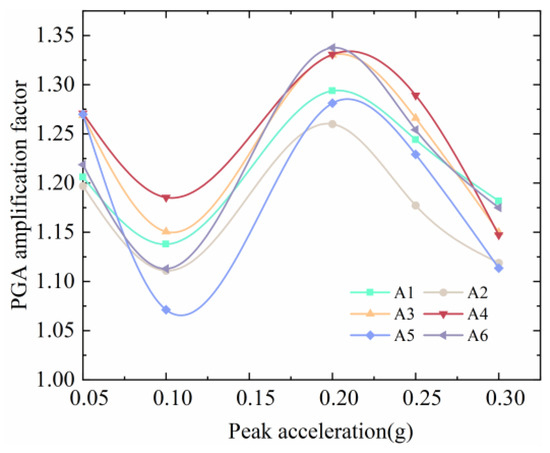
Figure 12.
Variation curve of PGA amplification coefficient with peak acceleration in accumulation slope test.
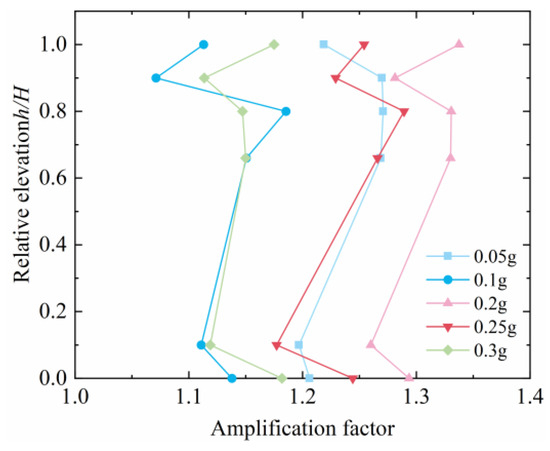
Figure 13.
Characteristics of PGA amplification coefficient with elevation in accumulation slope test.
4.1.2. Model Slope Displacement Field and Strain Field Response
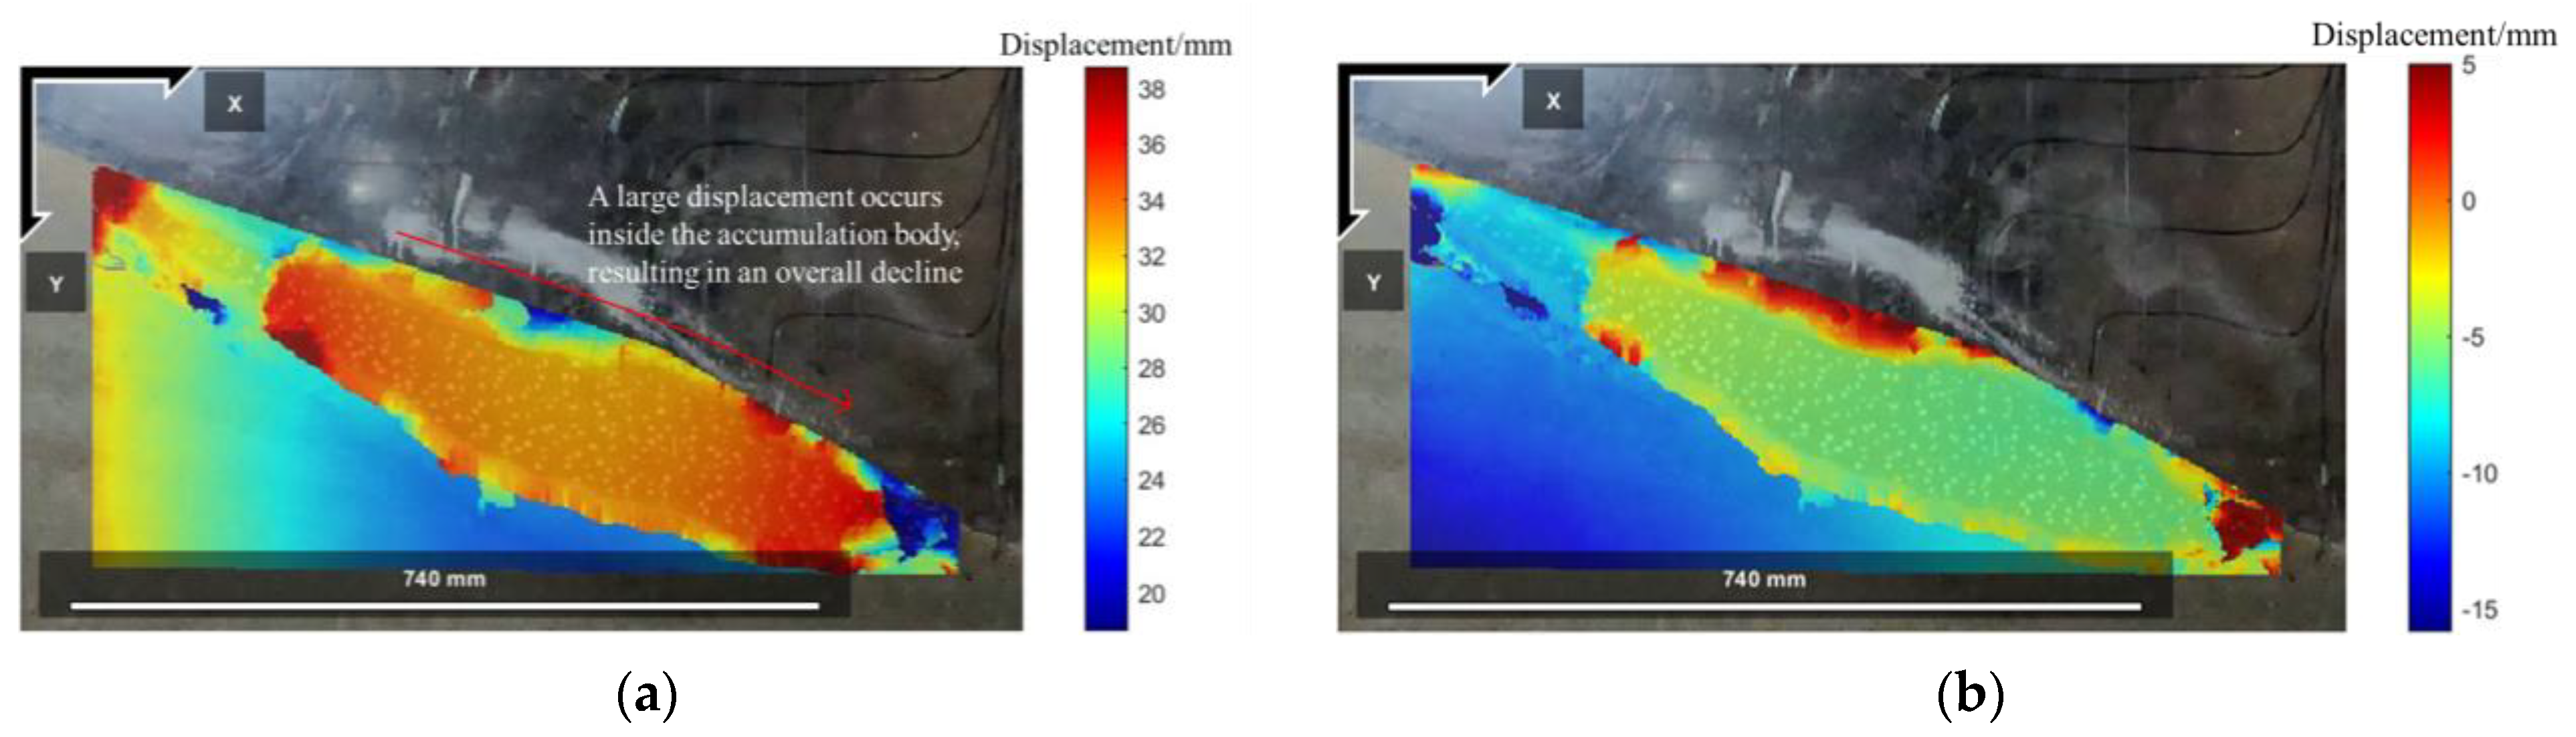
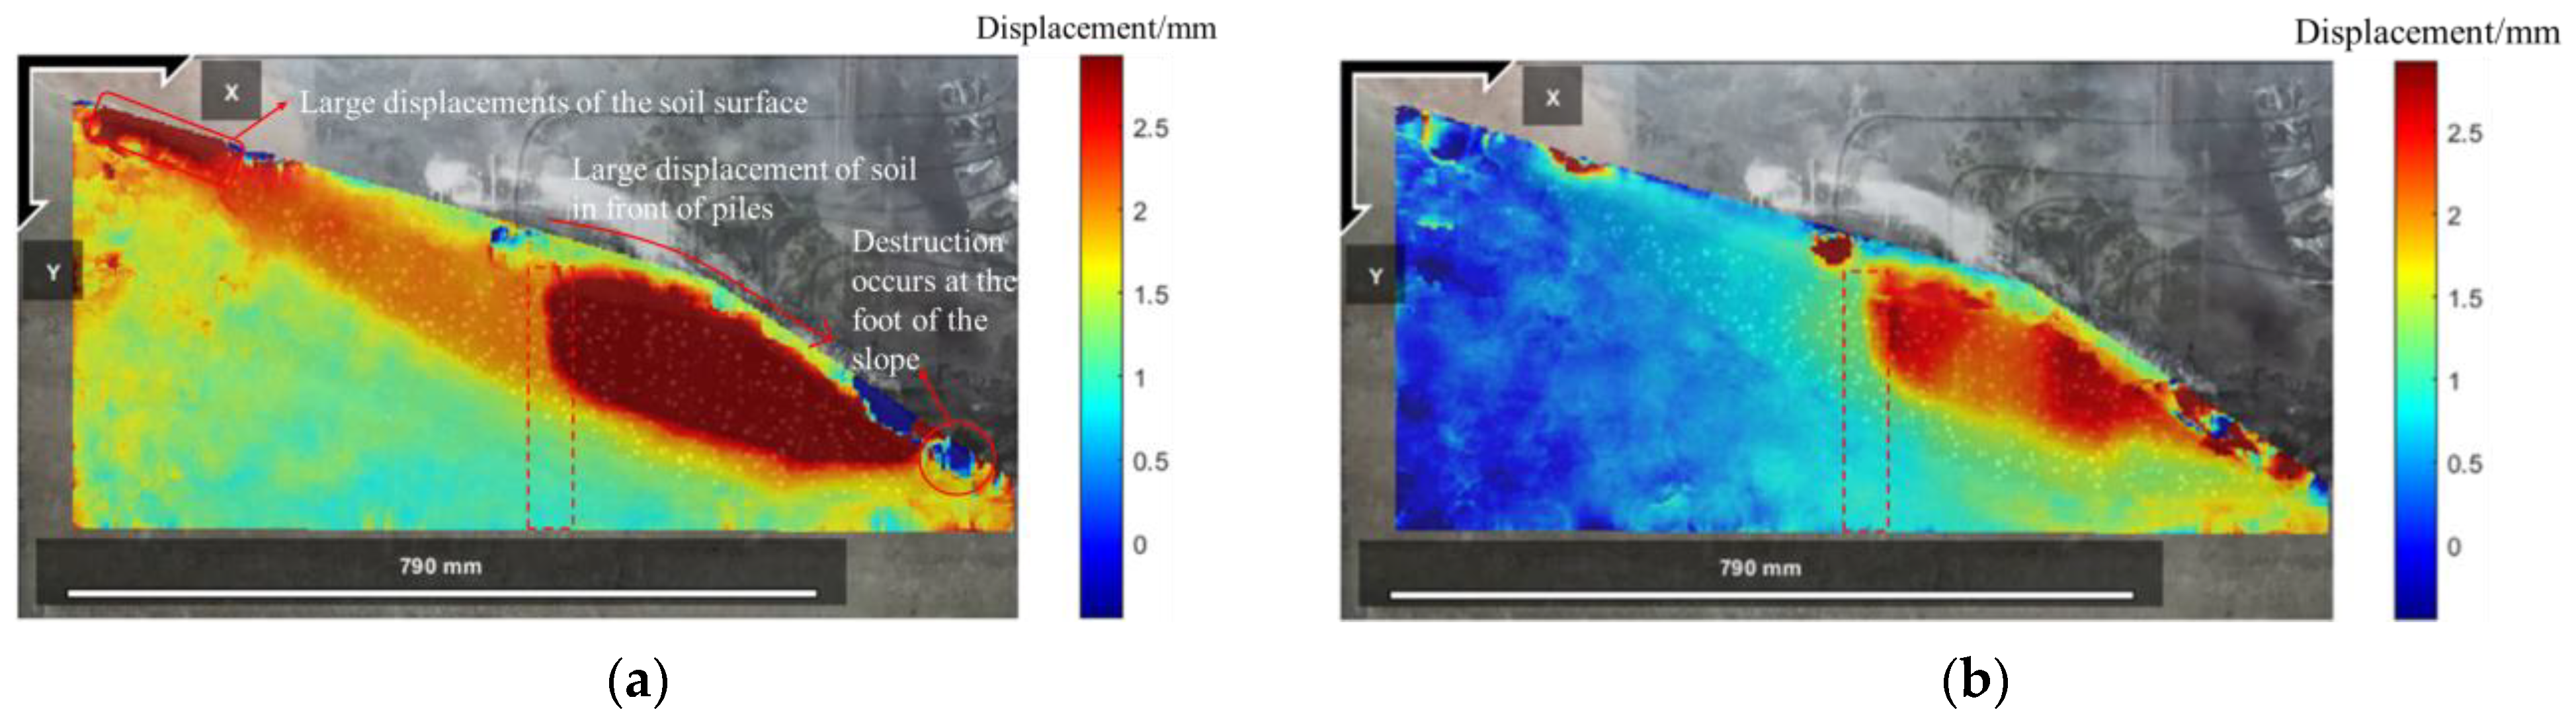
In practical engineering, the combination of displacement monitoring and slope failure can accurately judge the failure stage of the slope and evaluate and predict the stability of the slope during the construction and use of the slope [27]. During the earthquake-induced stage, there are particles scattered on the surface of the upper slope of the accumulation layer and the internal soil become compact due to vibration; no cracks are found, as shown in Figure 14, the lateral and vertical displacement values inside the accumulation layer are small, and there is almost no change. In the tension failure stage, failure begin to occur at the top of the upslope of the accumulation layer. As time goes by, a 5 mm vertical crack occurs at the trailing edge of the upslope of the accumulation layer. This is due to the fact that the sliding front of the push-type landslide is slow and steep, and the trailing edge of the landslide will produce a large sliding thrust and exceed the anti-sliding capacity of the corresponding section of the landslide; thus, the deformation and failure of the push-type landslide occurs first at the trailing edge, resulting in the formation of tensile cracks parallel to the slopes in the horizontal direction of the trailing edge of the landslide body, as shown in Figure 15. At the same time, Figure 15 shows that the interior of the slope has a slip in the horizontal direction of 0–5 mm due to the movement of the trailing edge’s soil. During the creeping deformation stage, collapse failure occurs at the foot of the downslope of the accumulation layer, and the accumulation layer at the top of the trailing edge slope dislocates from the bedrock, resulting in a slip surface. With the continuous accumulation of deformation, the slip surface was gradually formed at the foot of the leading edge slope, and finally a complete through joint is formed with the slip surface at the top of the slope, which leads to the instability and failure of the accumulation layer slope along the slip surface as a whole, as shown in Figure 16 and Figure 17.

Figure 14.
Horizontal and vertical displacement fields during the earthquake-induced phase: (a) lateral displacement field; (b) vertical displacement field.
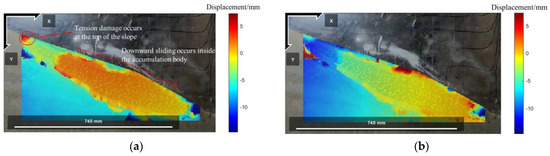
Figure 15.
Horizontal and vertical displacement field during tension damage stage: (a) lateral displacement field; (b) vertical displacement field.
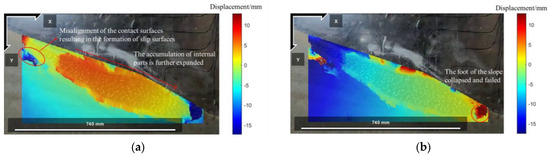
Figure 16.
Horizontal and vertical displacement fields during creep deformation stage: (a) lateral displacement field; (b) vertical displacement field.
Figure 17.
Horizontal and vertical displacement fields during the overall instability stage: (a) lateral displacement field; (b) vertical displacement field.
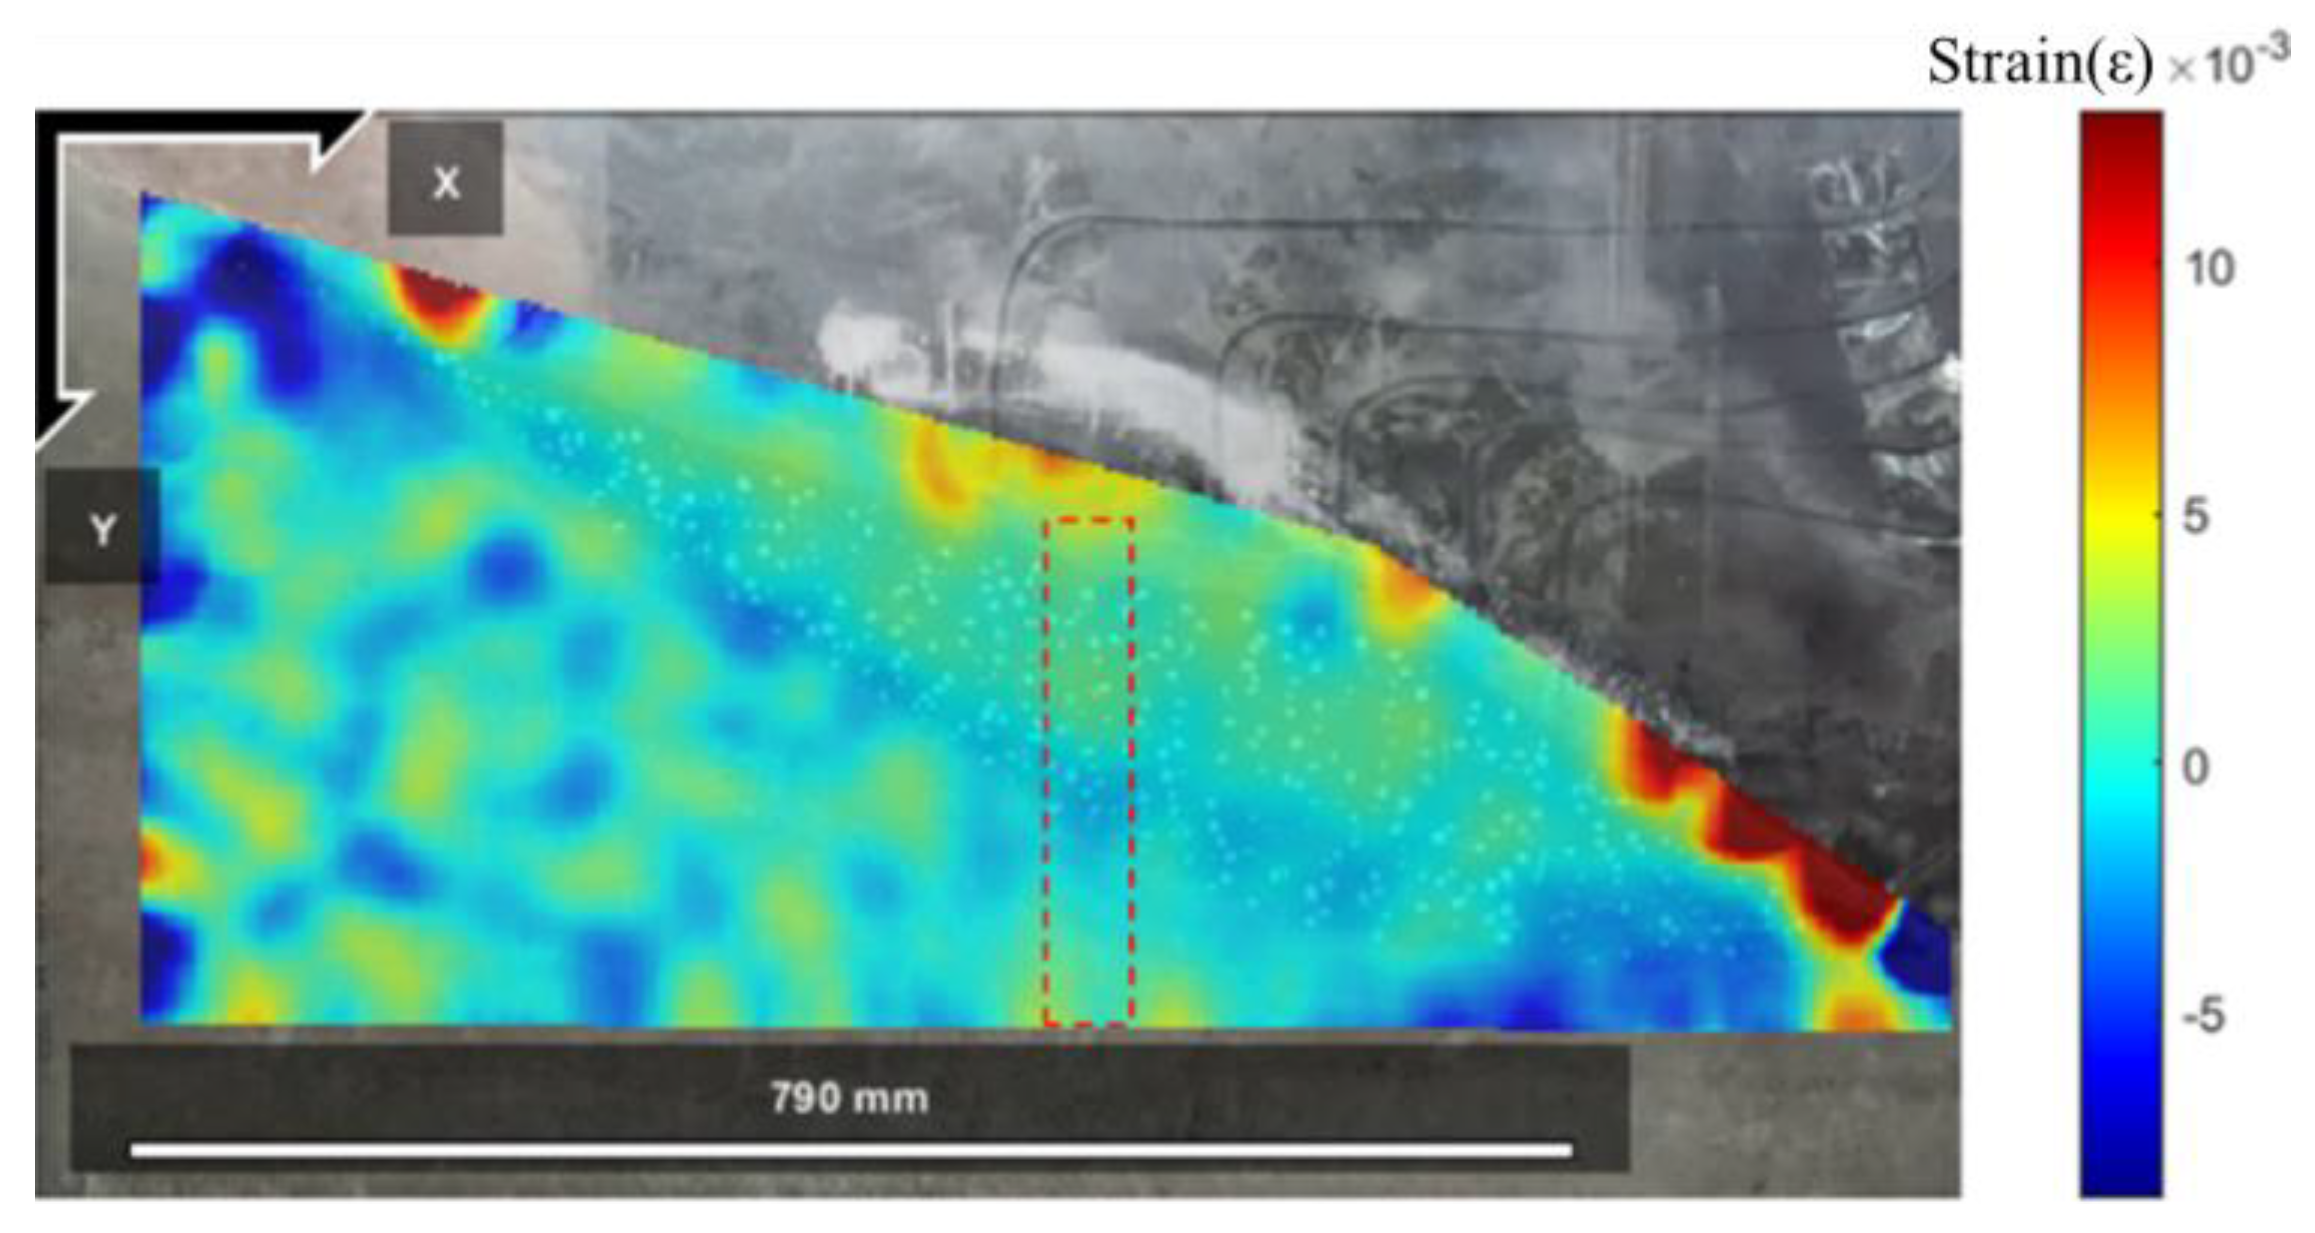
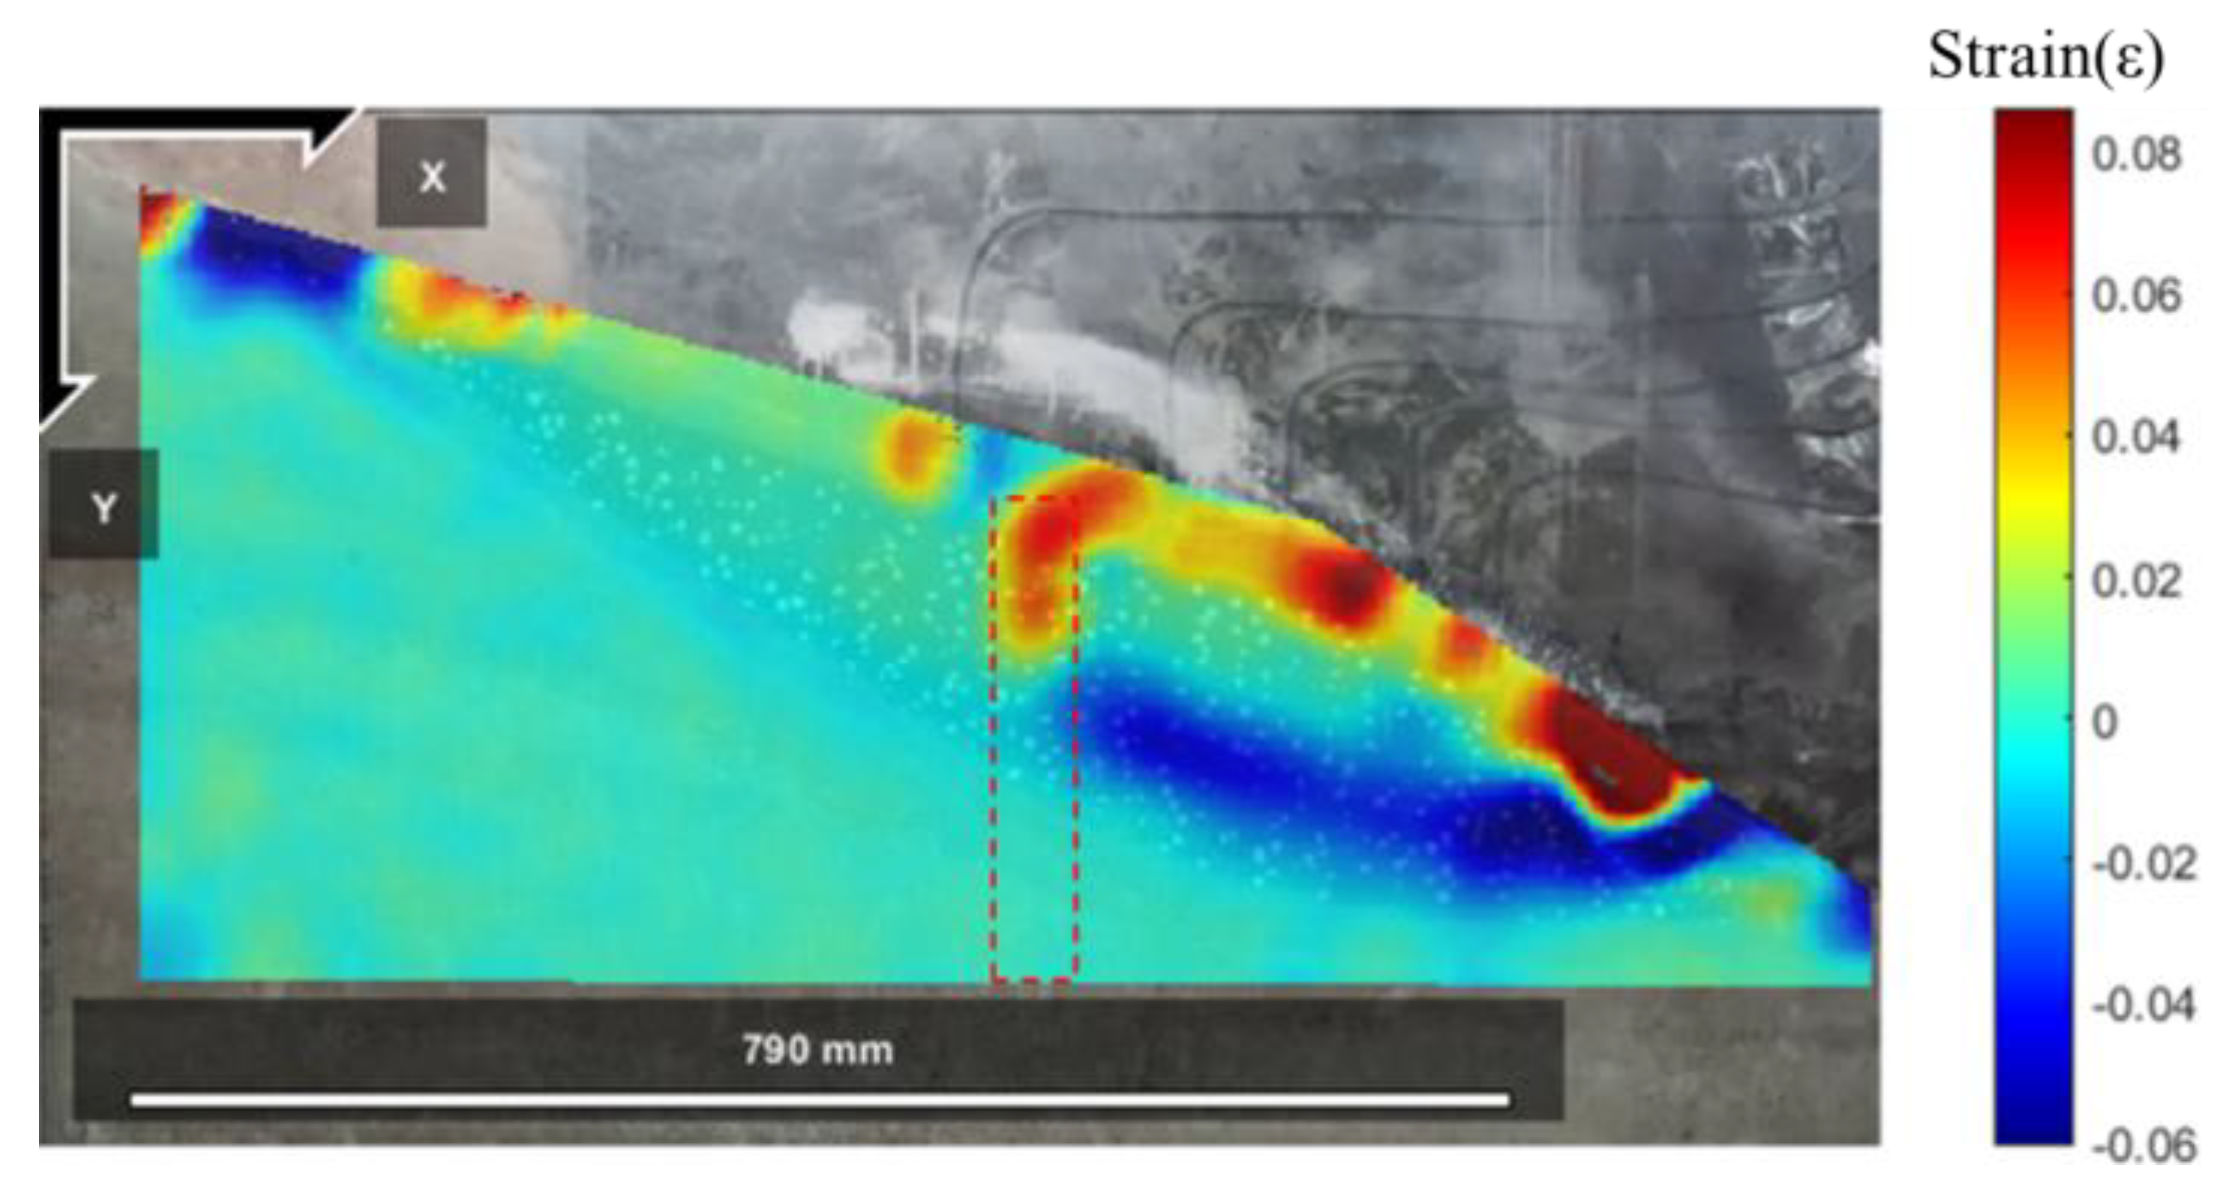
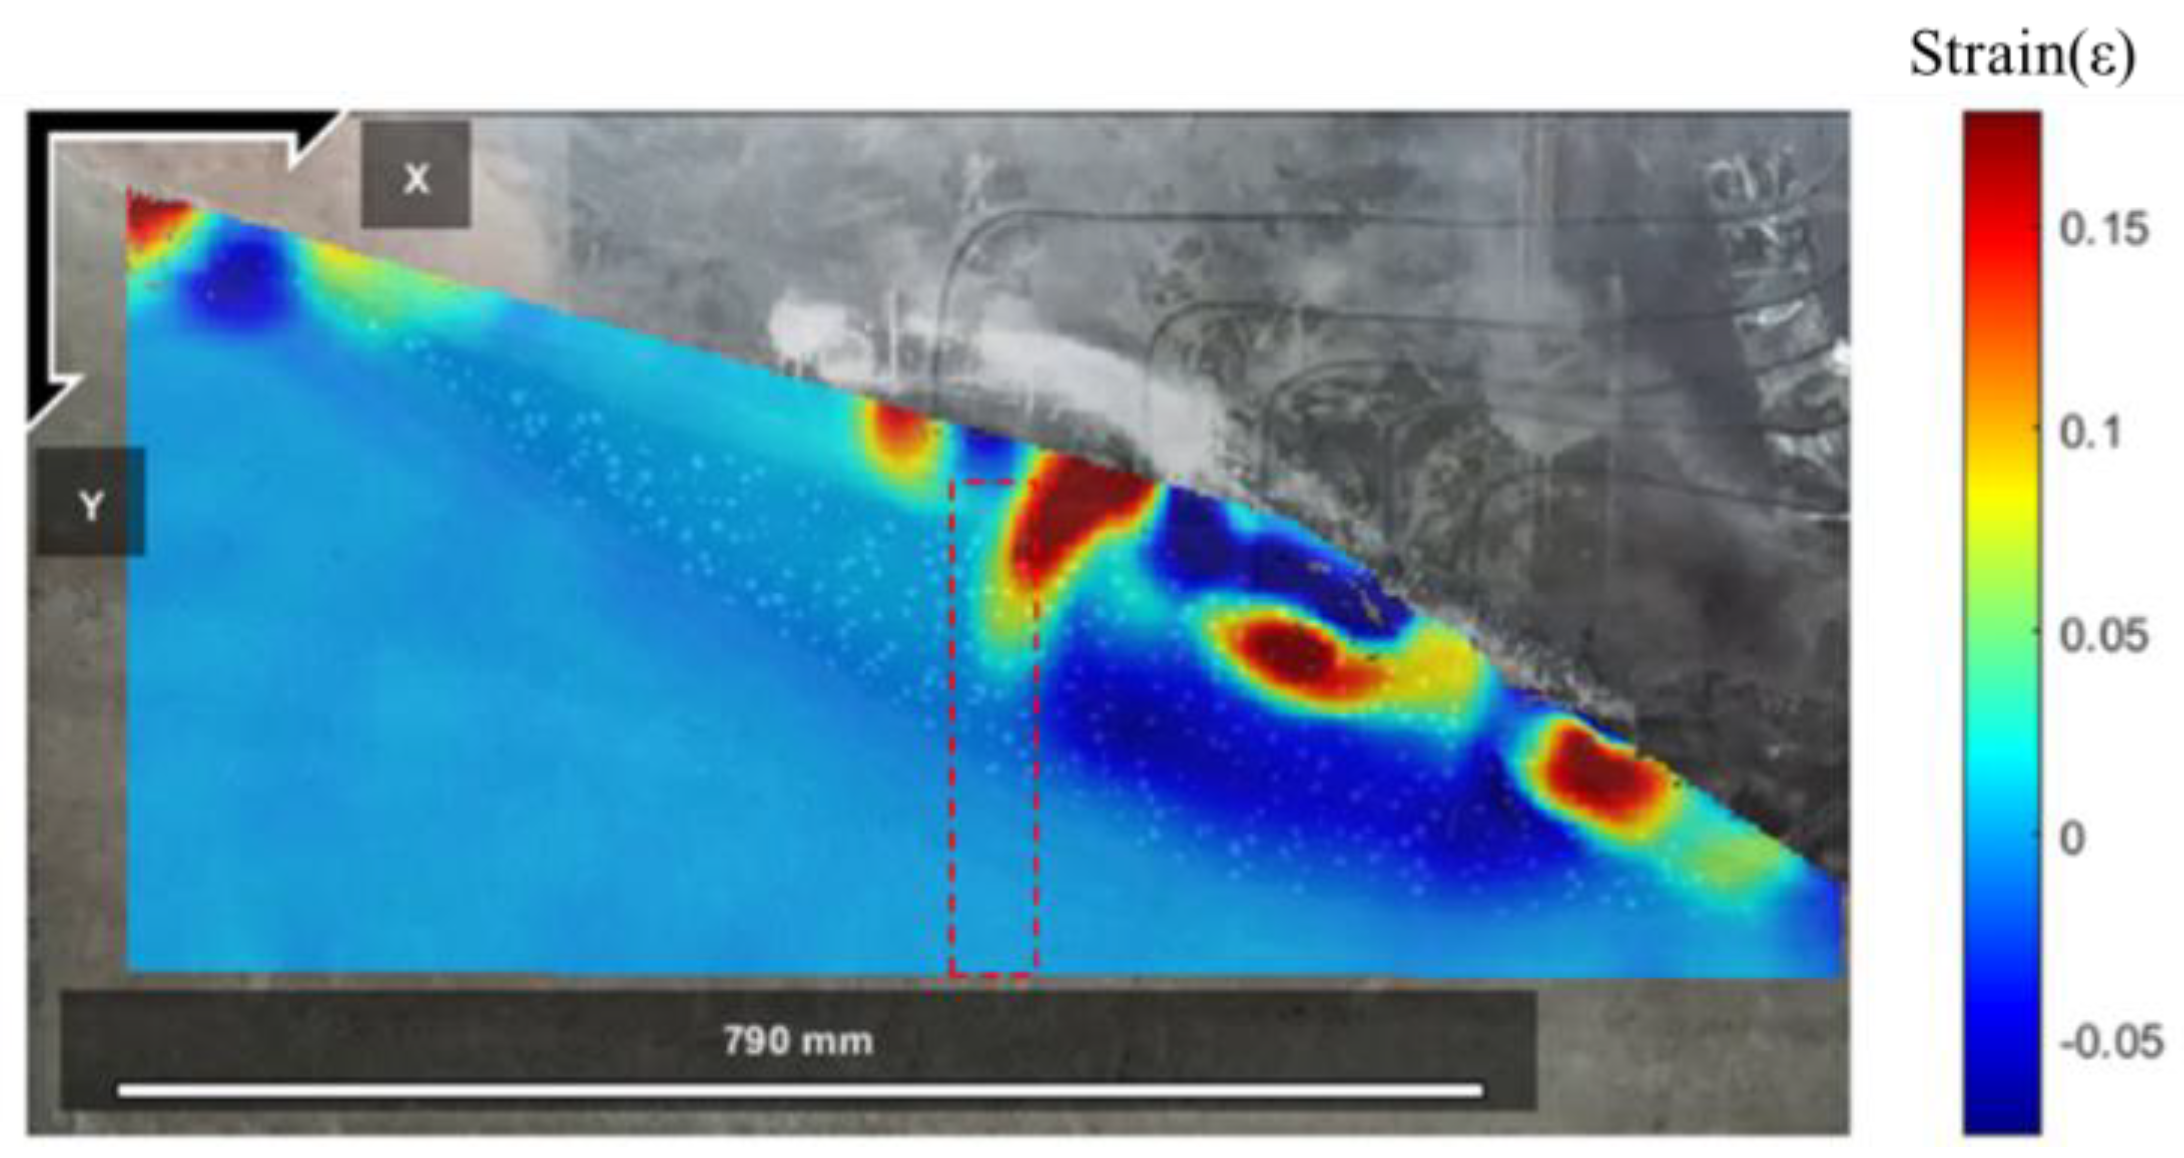
The second is the strain field, which can be used to analyze the changes in the internal forces exerted on slopes under seismic action. As can be seen from Figure 18, in the accumulation layer, except for the surface, which has produced large strains, the internal strain values are small and almost no significant change occurs. As shown in Figure 18, the tensile failure stage of the accumulation layer has negative strain at the top of the slope and the foot of the slope, while the surface has positive strain, and the strain difference between the two causes the strain at the top of the slope to accumulate under the reciprocating actions of earthquakes, and due to the large bedrock dip angle of the upper slope, the top of the slope is ahead of the lameness to develop tensile failure. At the same time, Figure 19 shows that there is a small negative strain on the contact surface between the accumulation layer and the bedrock, due to the loose structure of the accumulation, which will move downward under the action of the earthquake’s inertia, and the surface of the bedrock is affected by the accumulation to produce a force in the opposite direction, resulting in negative strain. In the creep deformation stage, as shown in Figure 20, with the increase in the peak acceleration value, the strain in the accumulation layer accumulates, and the foot of the slope is obviously damaged due to the stress concentration; the vertical crack at the top of the slope continues to increase, and the upper contact surface develops a slip surface.
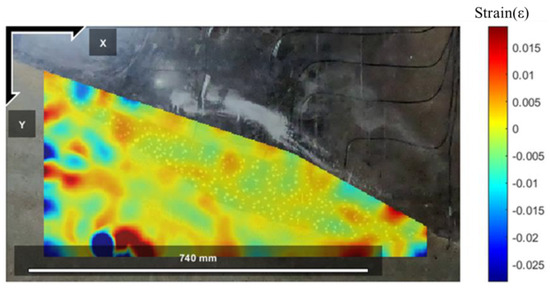
Figure 18.
Shear strain field during the earthquake-induced stage.
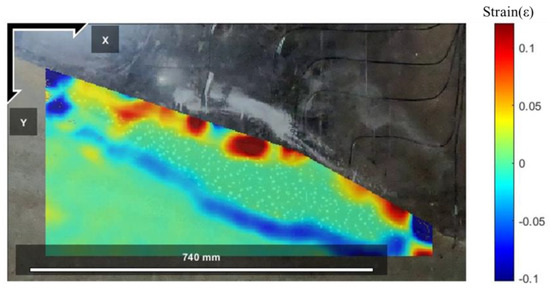
Figure 19.
Shear strain field during the tension damage stage.
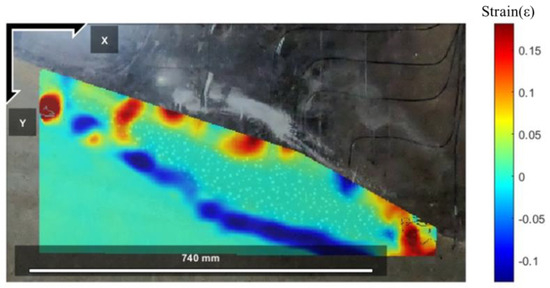
Figure 20.
Shear strain field during the creep deformation stage.
Combined with Figure 20 and Figure 21, it can be seen that with the continuous extension of the duration of deformation, the slip surfaces at the top and foot of the slope continue to develop, and the strain accumulation of the contact surface between the accumulation layer and the bedrock makes the cracks in this area continue to expand to form a through joint, which ultimately leads to the overall sliding instability and failure of the slope of the accumulation layer.
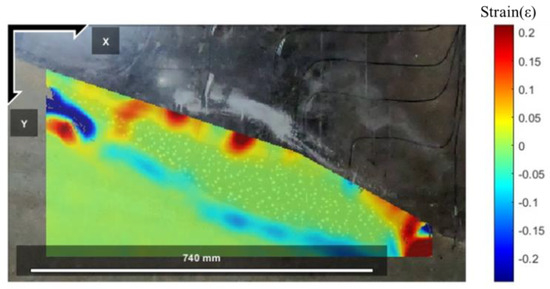
Figure 21.
Shear strain field during the overall instability stage.
4.2. Anti-Slide Pile Reinforcement Test
The purpose of the slope of the anti-slide pile reinforcement accumulation is mainly to resist the thrust of the landslide by using the interaction between the pile in the stable soil layer and the soil around the pile; the common arrangement modes of the anti-slide piles are cantilever-type and fully buried-type, and their stress characteristics are shown in Figure 22.
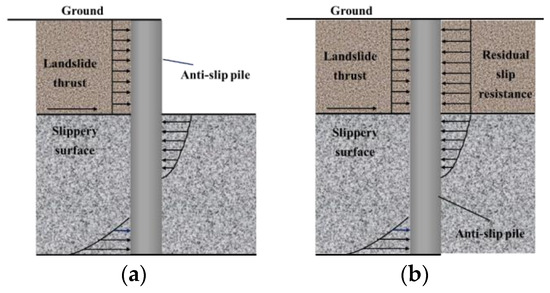
Figure 22.
Force characteristics of anti-slide pile: (a) cantilever pile; (b) fully embedded piles.
4.2.1. Acceleration Response Rules
As can be seen from Figure 23, the acceleration amplification coefficient of measurement points A1–A6 decreases with the increase in the peak value of the seismic wave input. This is due to the effective support of the anti-slide pile, which makes the damping of the soil around the pile larger and the slope filtering effect stronger. In the vertical direction, as the height of the accelerometer increases, the acceleration response increases, and the overall appearance is that of nonlinear amplification, as shown in Figure 24.
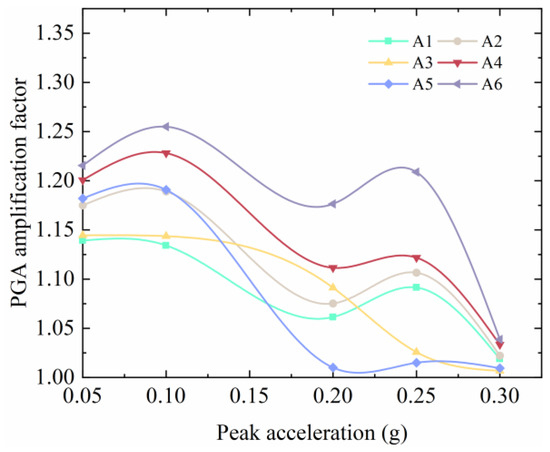
Figure 23.
Variation curve of PGA amplification coefficient with peak acceleration in anti-slide pile test.
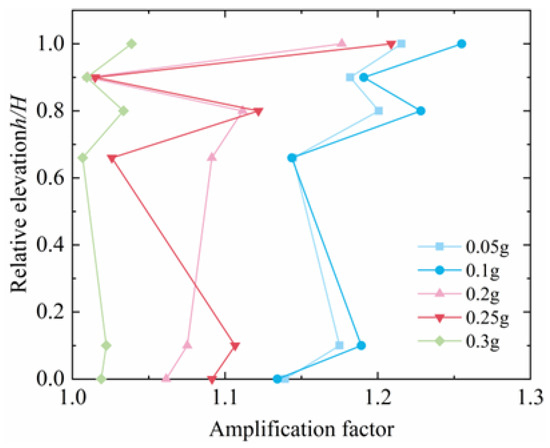
Figure 24.
Variation characteristics of PGA amplification coefficient with elevation in anti-slide pile test.
4.2.2. Pile Bending Moment Response Rules
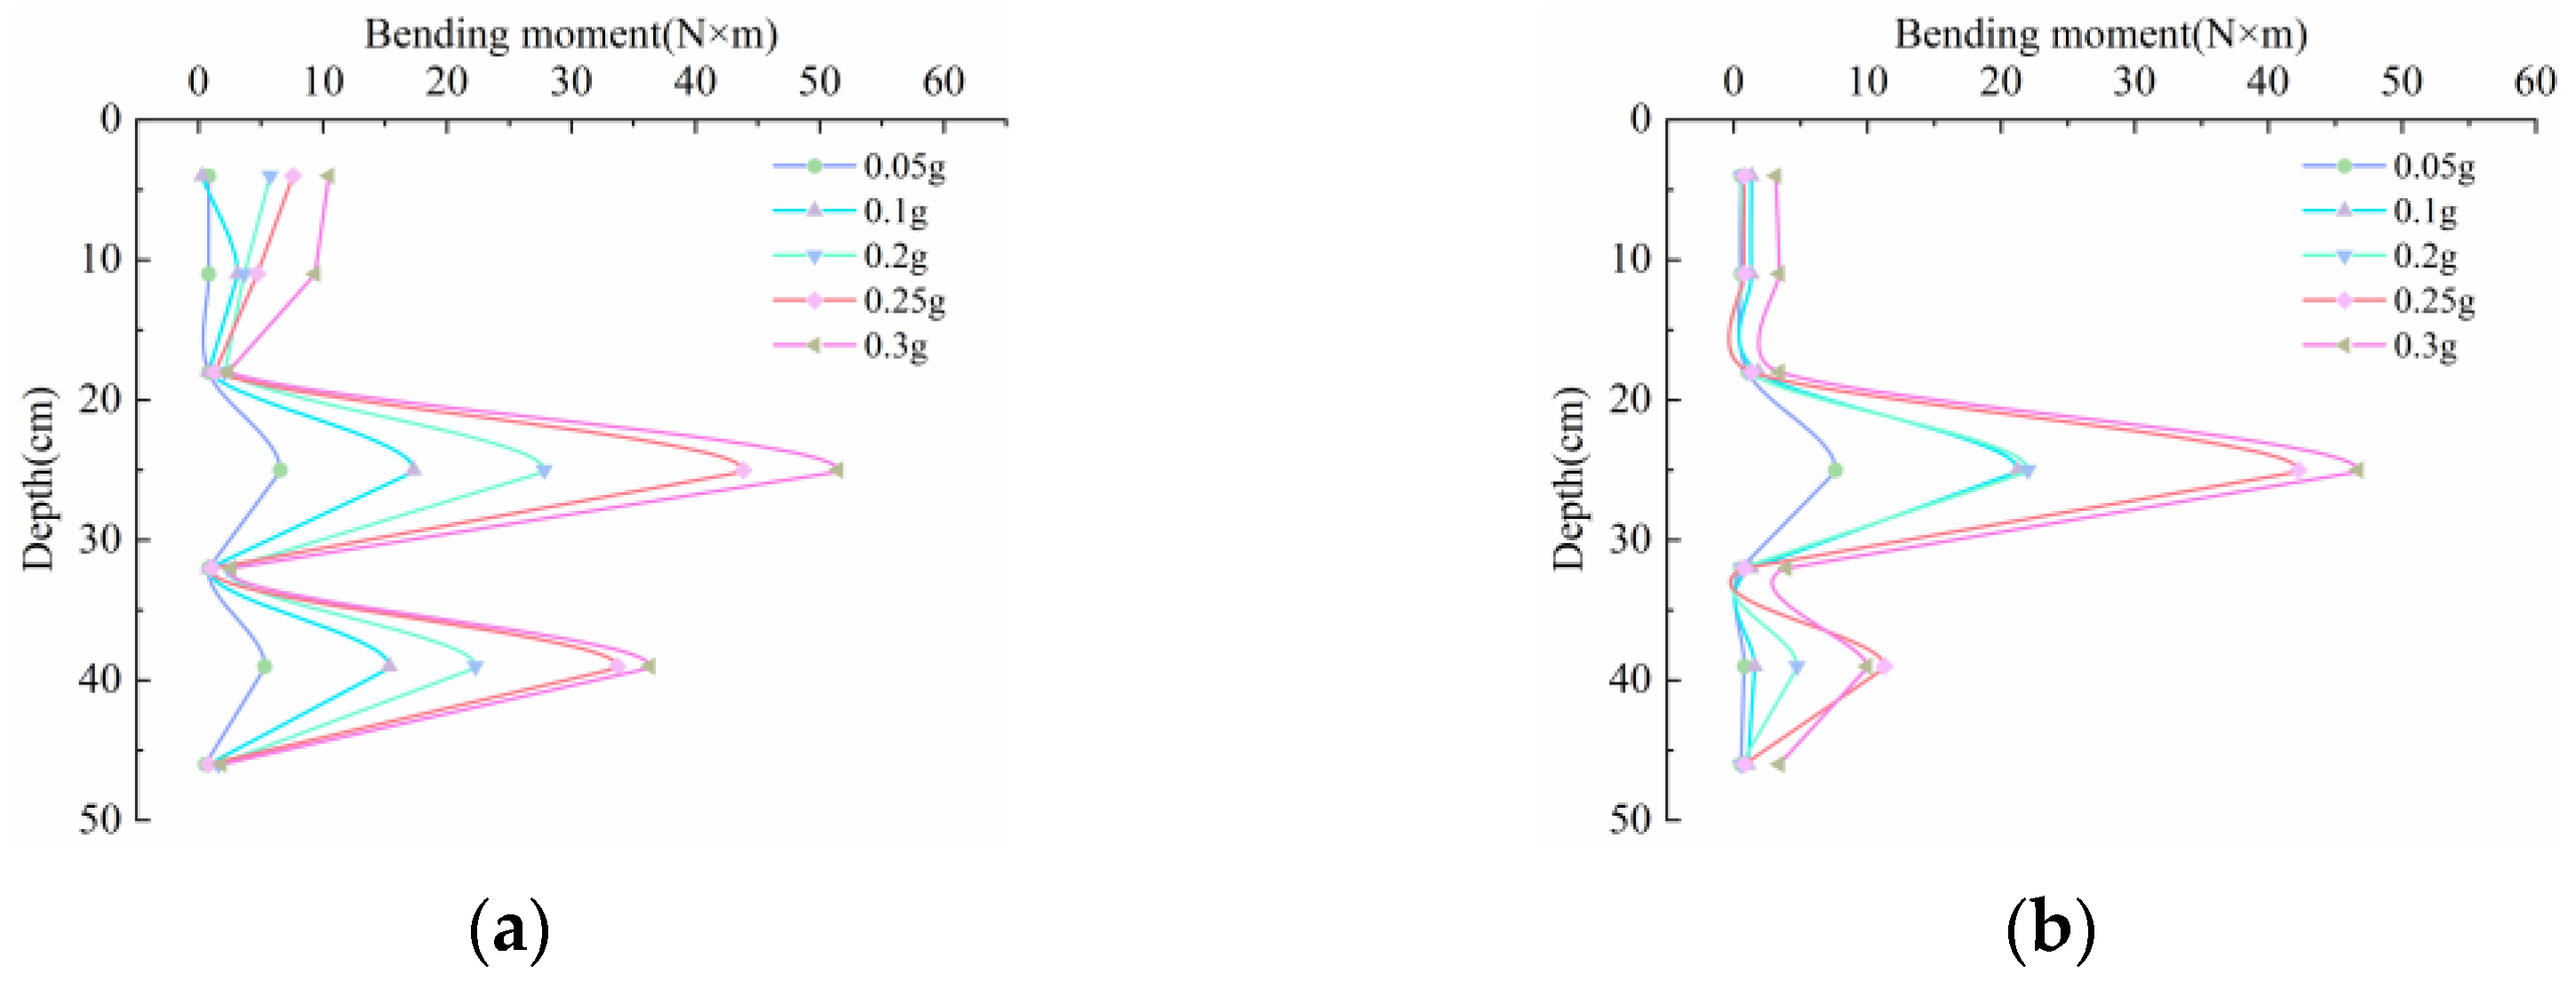
Figure 25 shows the curve of the bending moment of the pile with the buried depth under different acceleration amplitudes. As the acceleration increases, the bending moment distribution of the middle pile first increases with the increase in burial depth, and then gradually decreases, while the bending moment distribution of the outer pile shows a trend of first increasing and then decreasing in the middle and lower parts. The maximum bending moment position of the two piles is maintained at five times the pile diameter below the soil surface.
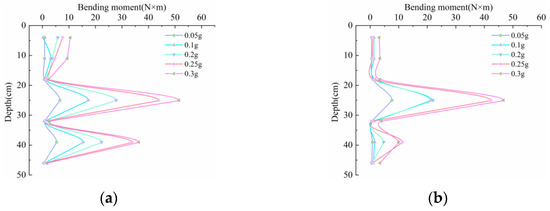
Figure 25.
Bending moment diagram of pile under different loads: (a) outside pile bending moment; (b) central pile bending moment.
4.2.3. Model Slope Displacement Field and Strain Field Response
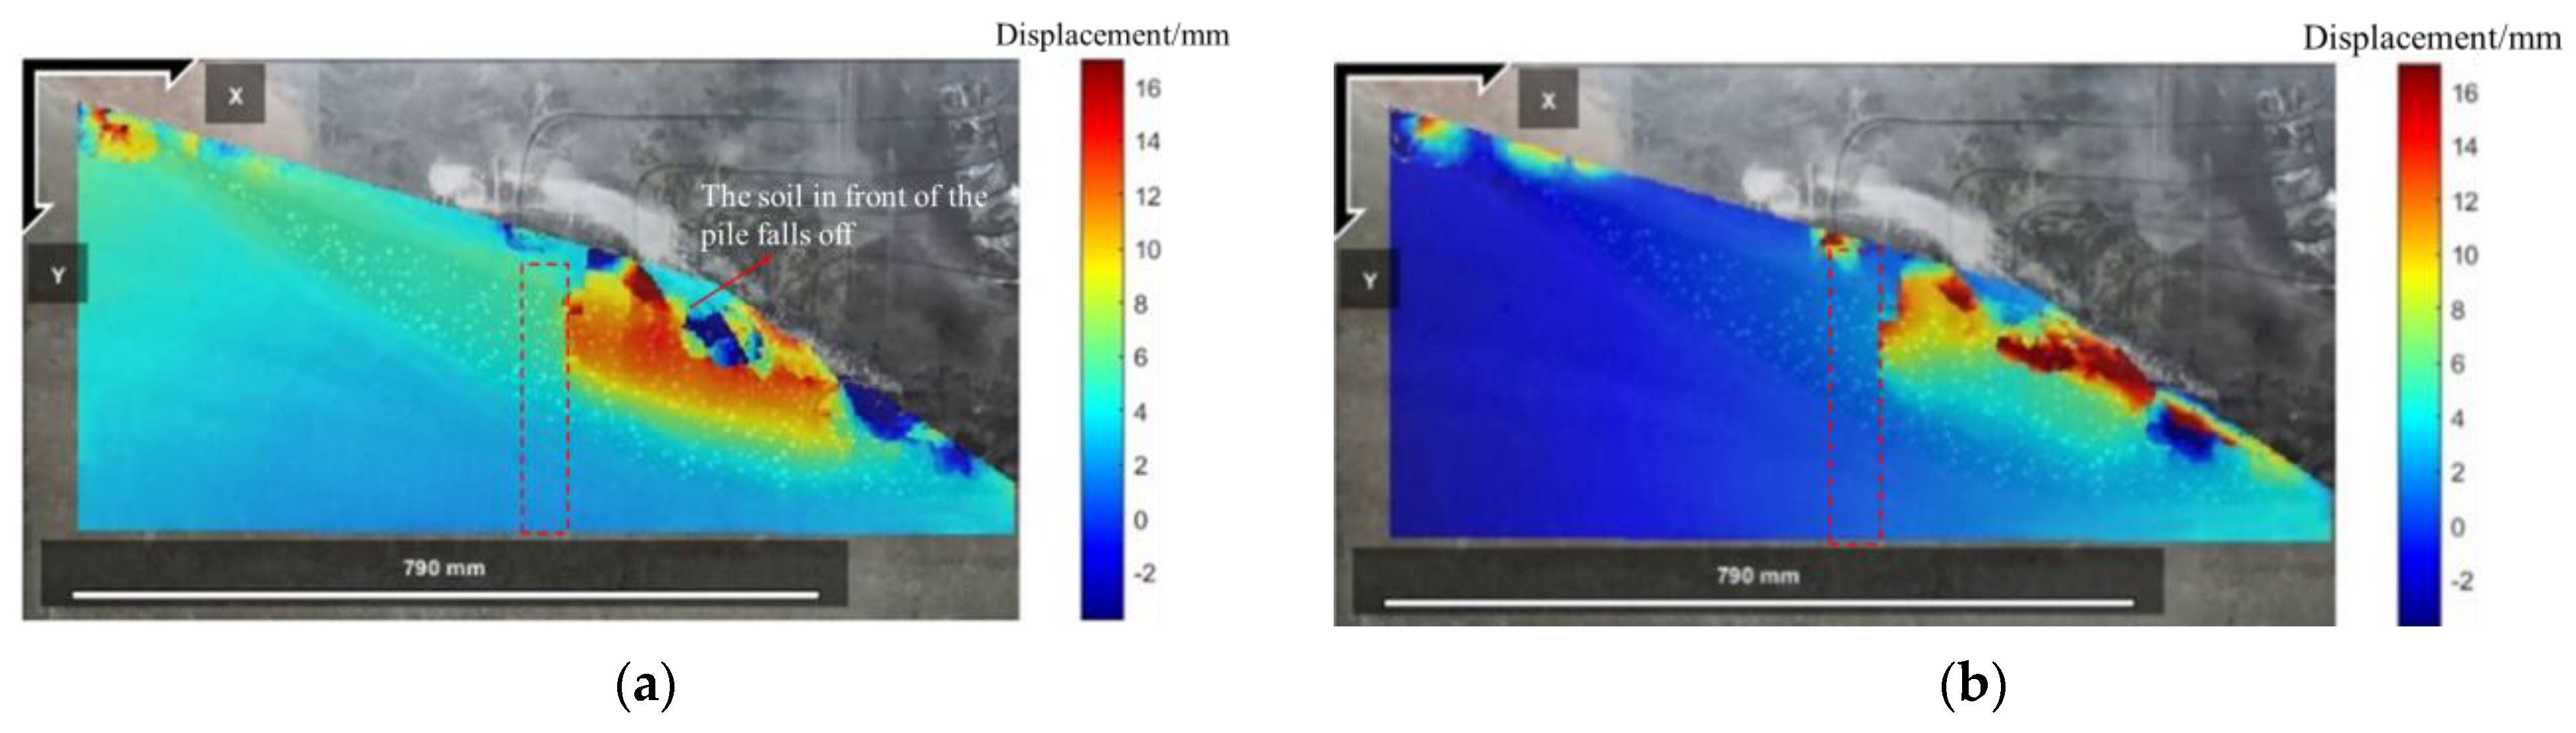
In the earthquake-induced stage of the anti-slide pile reinforcement test, the displacement of the slope surface is large, and the particles are scattered, but there are no cracks, and the displacement of the soil inside the accumulation layer due to vibration is small, as shown in Figure 26. In the tensile failure stage, the soil in front of the pile has an obvious displacement, the displacement value reaches 2.5–3 mm, and the foot of the slope is damaged; the overall displacement of the uphill layer is relatively small except for the large slip on the surface near the top of the slope, as shown in Figure 27. This is due to the fact that the soil behind the pile is effectively supported by the anti-slide pile, and its displacement gradually decreases, while the displacement of the soil in front of the pile gradually increases because the force of the anti-slide pile on the soil around the pile is greater than the remaining anti-sliding force of the soil itself. In the formation stage of the lower sliding surface, with the continuous increase in the peak acceleration and the increase in the number of cycles, the soil damage in front of the pile continues to accumulate; the failure at the foot of the slope gradually increases, and the contact surface between the downslope of the accumulation layer and the bedrock forms a sliding surface, which eventually leads to the deformation of the soil in front of the pile and the anti-slide pile, as shown in Figure 28 and Figure 29.
Figure 26.
Horizontal and vertical displacement fields during the earthquake-induced stage: (a) lateral displacement field; (b) vertical displacement field.
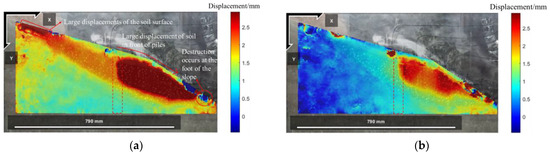
Figure 27.
Horizontal and vertical displacement fields during the tensile failure stage: (a) lateral displacement field; (b) vertical displacement field.
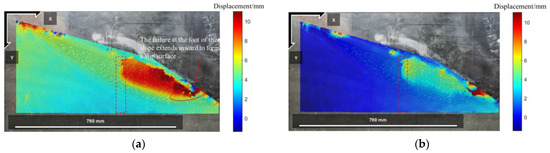
Figure 28.
Horizontal and vertical displacement fields during the formation stage of the lower slip surface: (a) lateral displacement field; (b) vertical displacement field.

Figure 29.
Horizontal and vertical displacement fields of soil during the shedding stage before the pile: (a) lateral displacement field; (b) vertical displacement field.
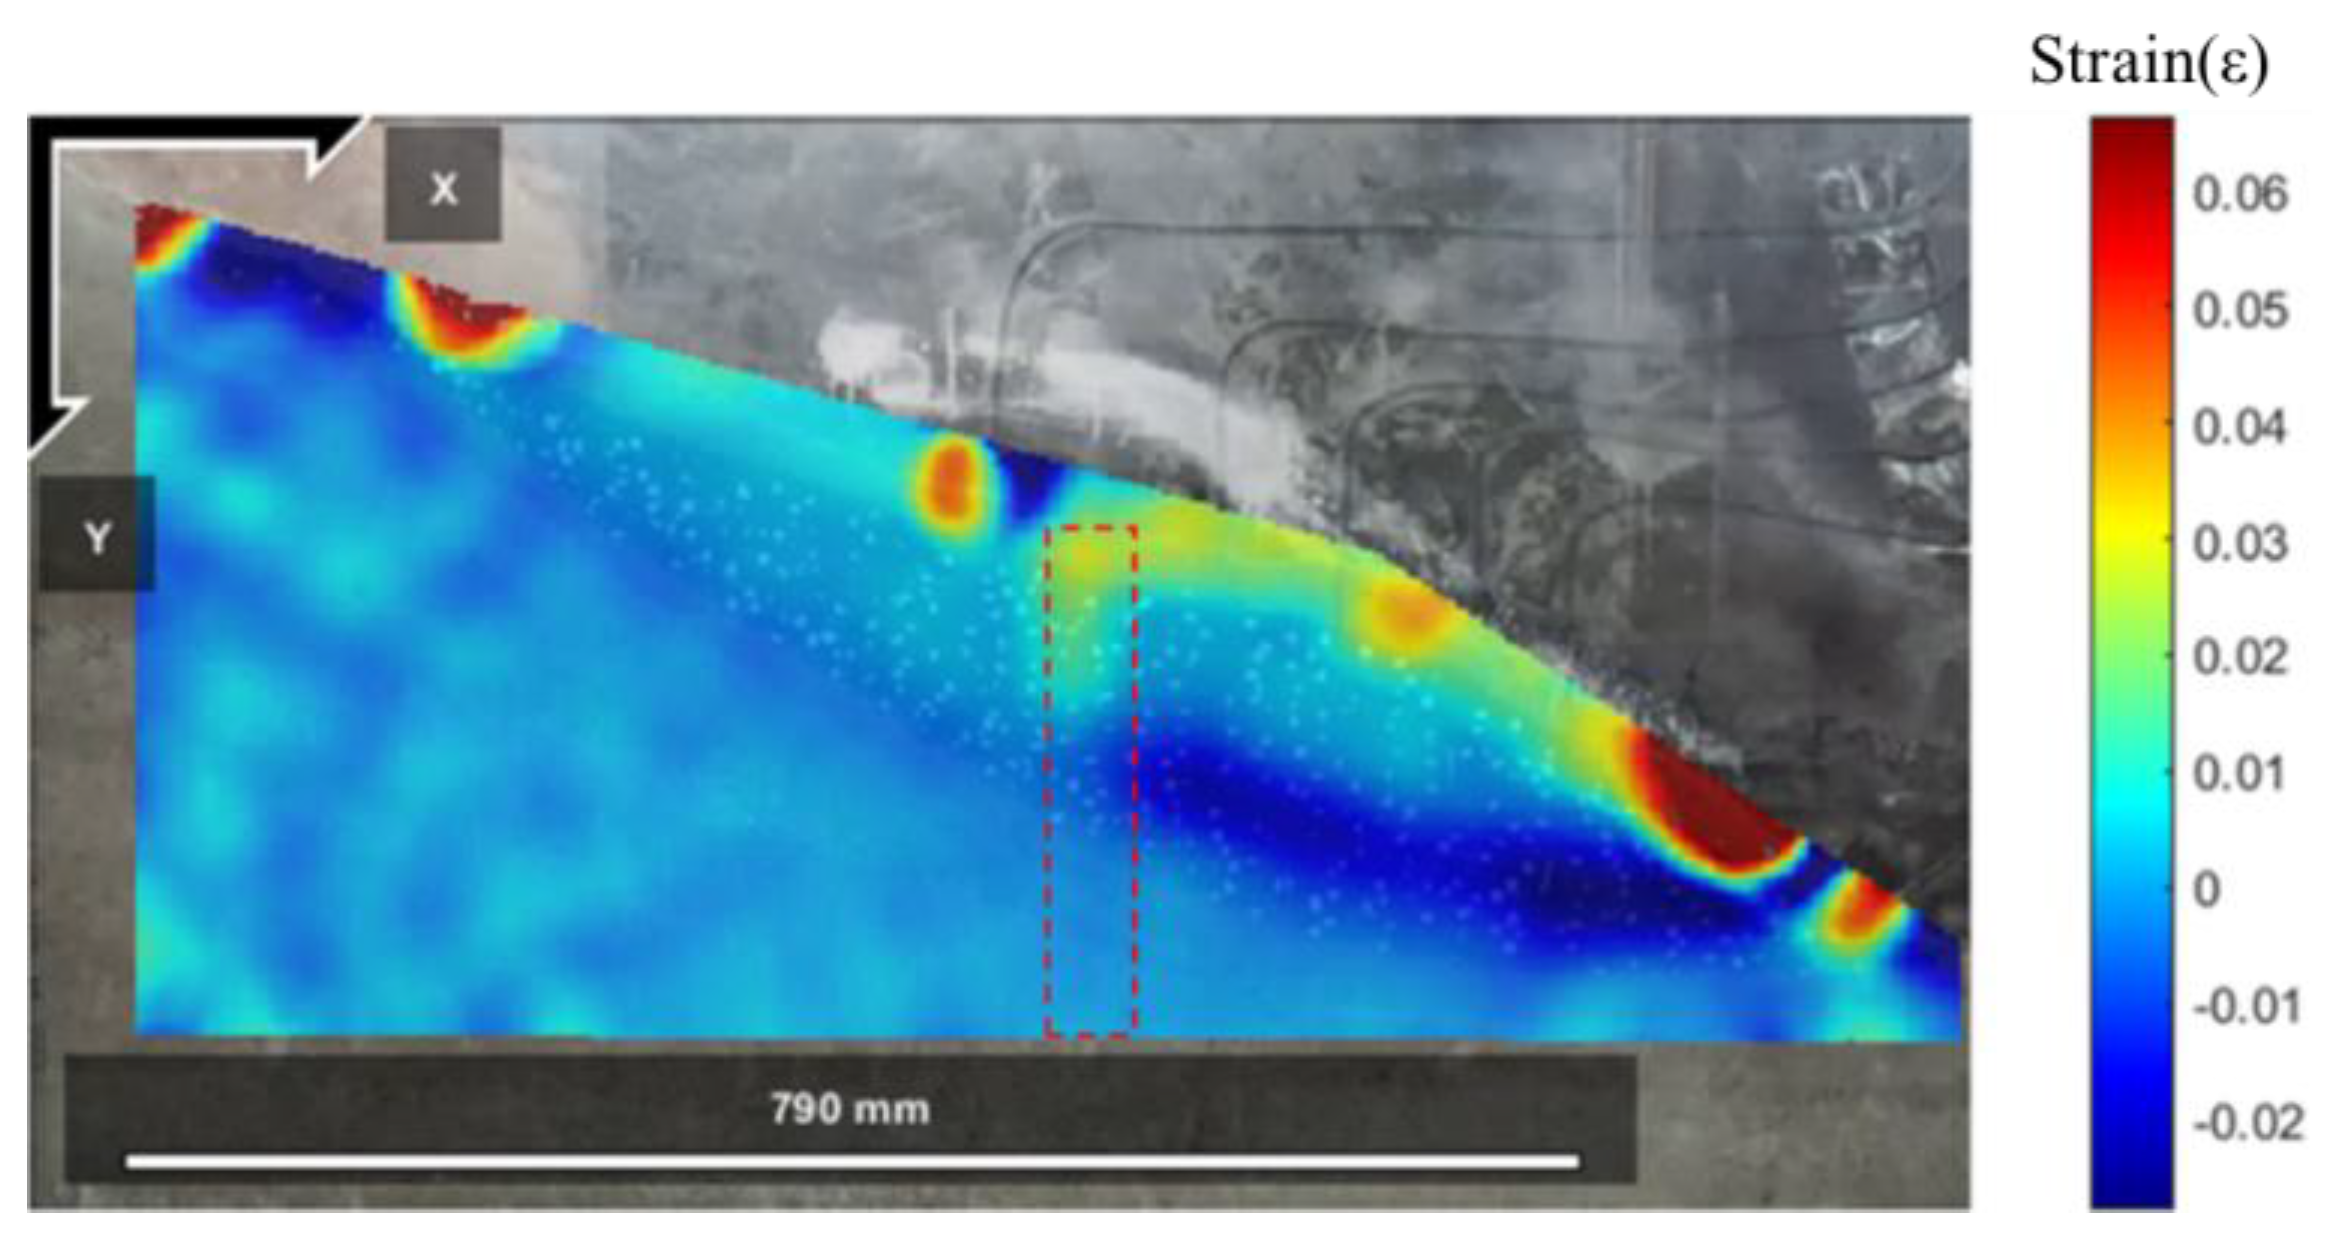
The second is the strain field, as shown in Figure 30. In the earthquake-induced stage, the overall strain of the slope is small, and some parts of the slope are relatively loose and easily affected by vibration, resulting in a large strain. The test observation found that there are some particles scattered, and no cracks are produced. It can be seen from Figure 31 that, in the tensile failure stage, there is a large strain on the top of the slope, the surface of the upslope, and the area near the foot of the slope on the downslope of the accumulation layer; but, according to the test observation, except for the obvious failure at the foot of the slope, the upper part of the accumulation layer does not produce tensile failure. This is due to the fact that the support of the anti-slide pile hinders the tendency of the soil behind the pile to slide, reduces the possibility of damage to the soil behind the pile. The soil in front of the pile is not only affected by the inertia of the earthquake but also by the action of the pile on the surrounding soil, which leads to the decline of the soil in front of the pile and causes the damage of the slope foot due to stress concentration. At the same time, Figure 31 shows that the contact area between the soil in front of the pile and the bedrock produces a small negative strain, but no obvious slip surface is found according to the test phenomenon at this time. With the continuation of deformation, the strain at the foot of the slope gradually accumulates and the failure expands, resulting in a large strain at the contact area between the soil in front of the pile and the bedrock to form a slip surface; finally, the downslope soil of the accumulation layer slides down along the sliding surface, so that the soil in front of the pile falls off and fails, as shown in Figure 32 and Figure 33.

Figure 30.
Shear strain field during the earthquake-induced stage.

Figure 31.
Shear strain field during the tensile failure stage.

Figure 32.
Shear strain field at the formation stage of the lower slip surface.

Figure 33.
Shear strain field during the stage of soil shedding in front of pile.
5. Comparison of Test Results of Accumulation Slope and Anti-Slide Pile Reinforcement
5.1. Acceleration Response
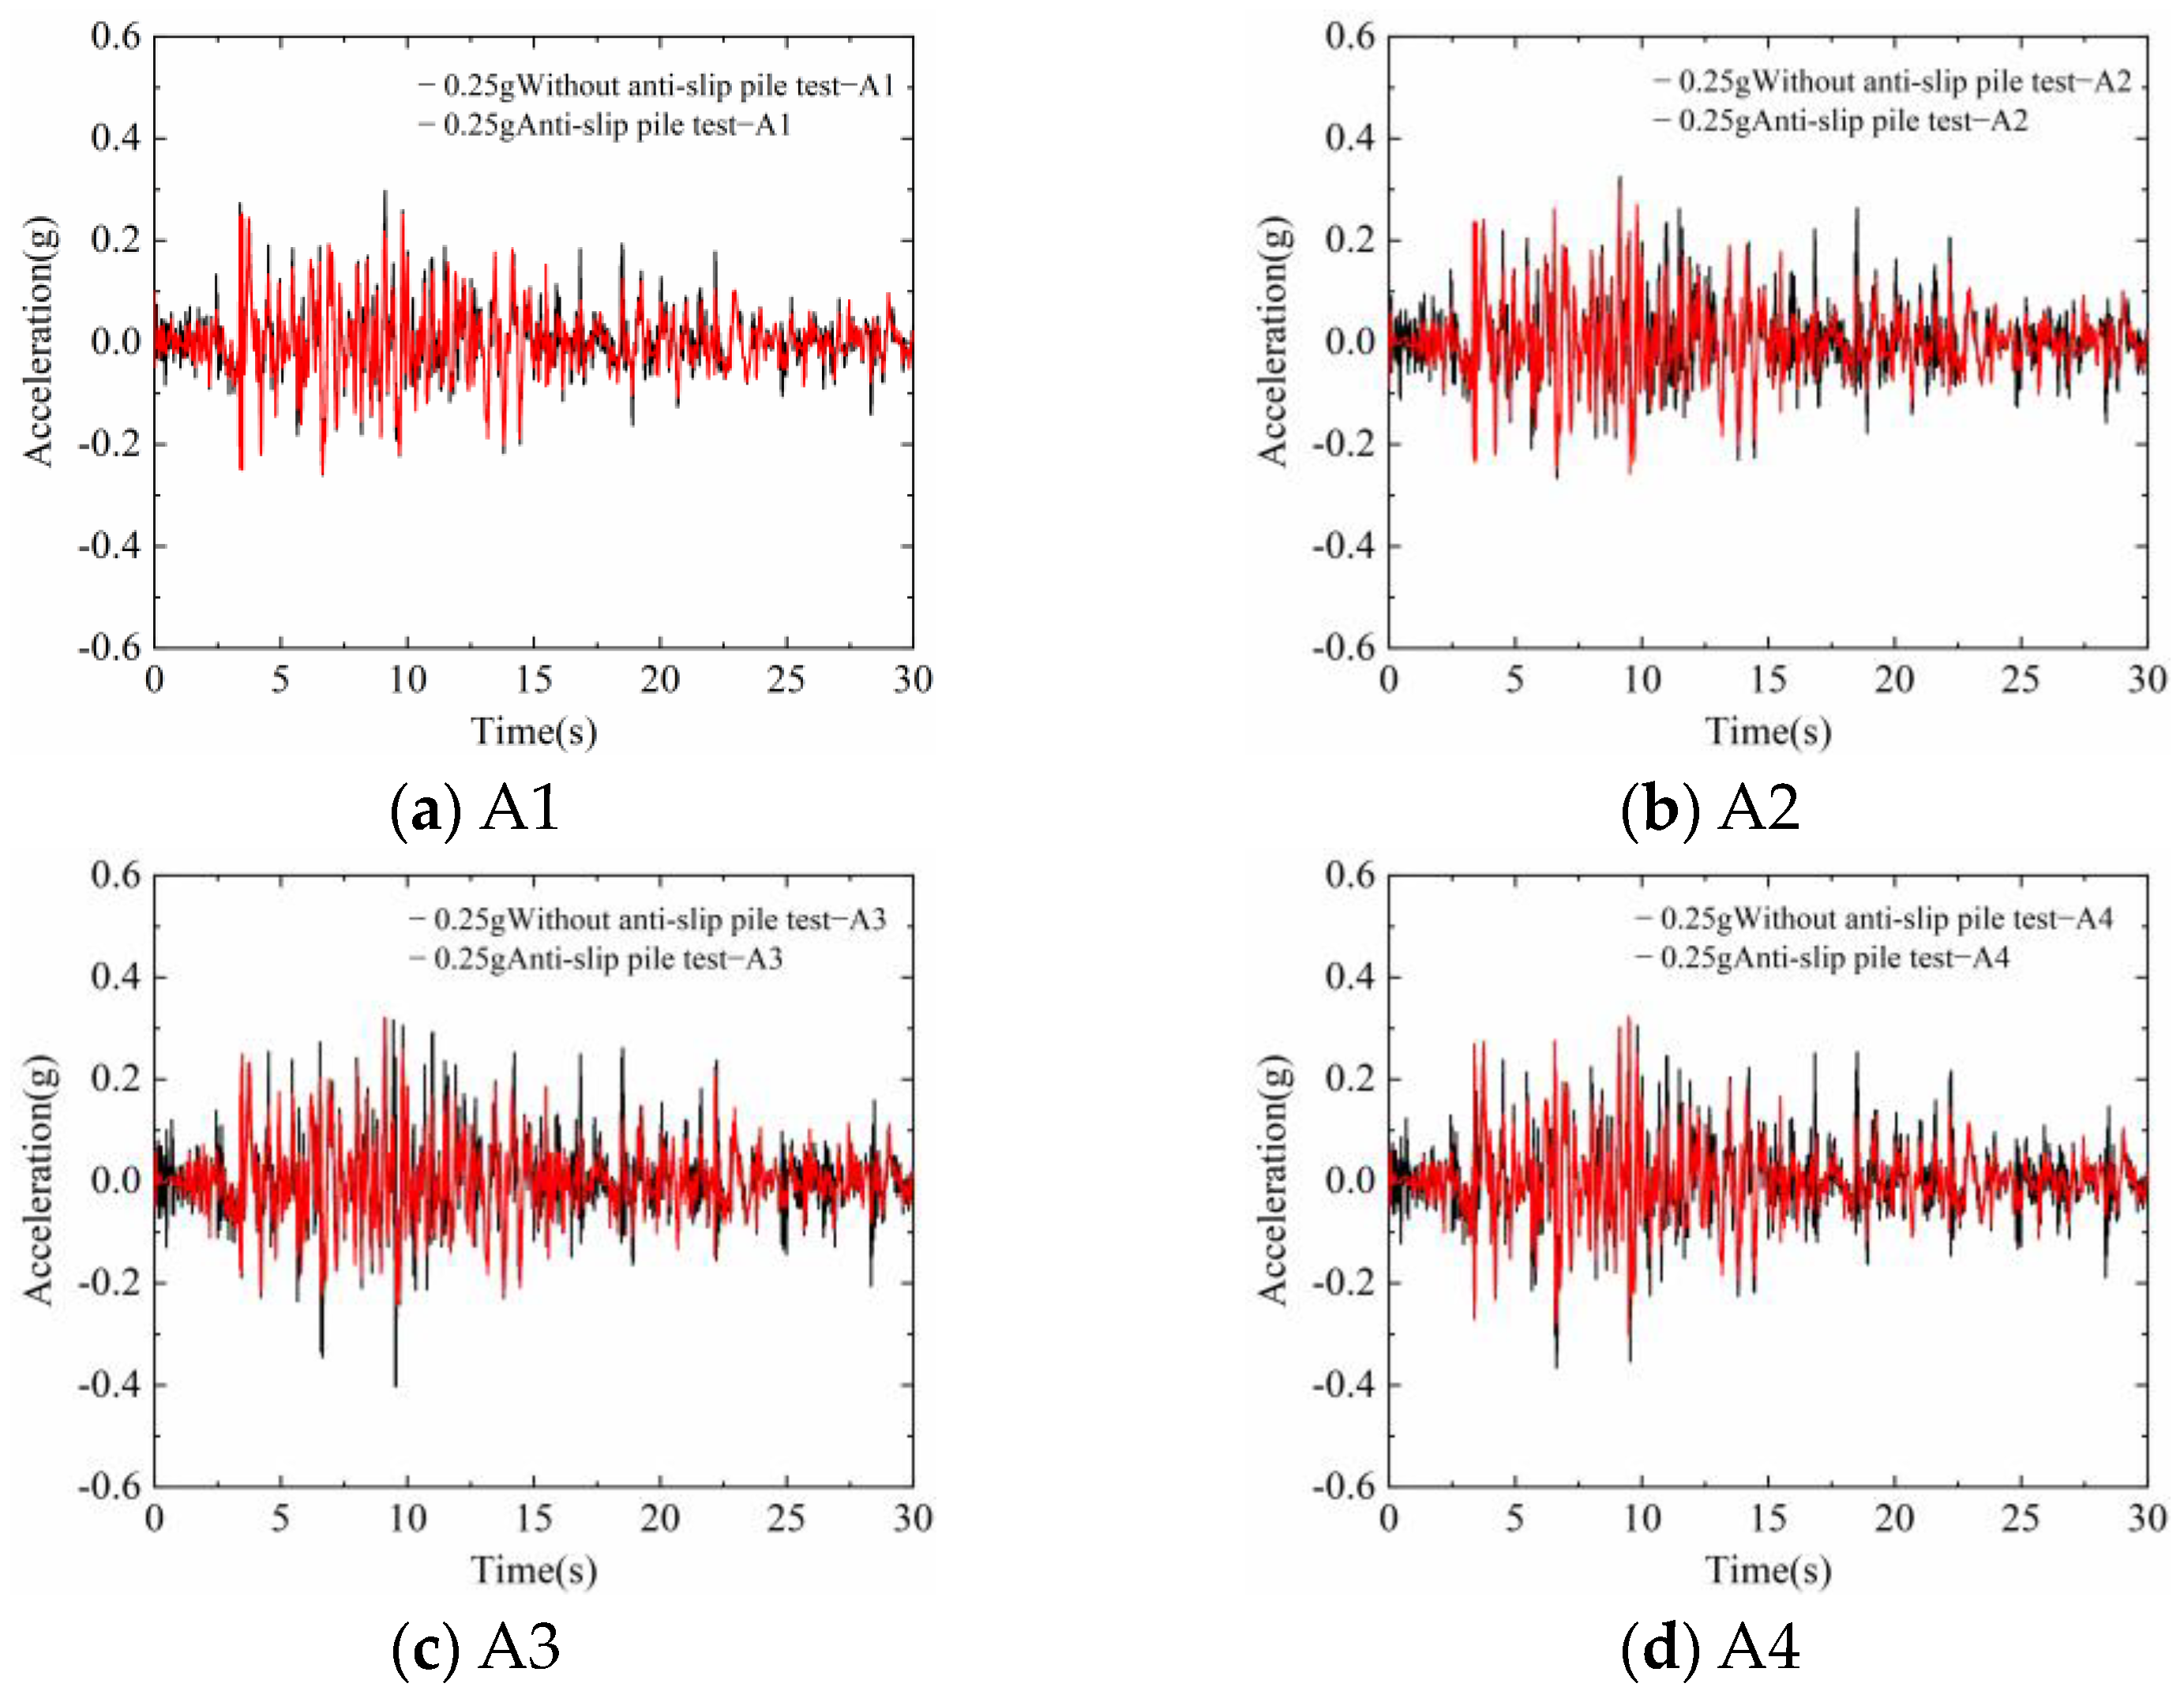
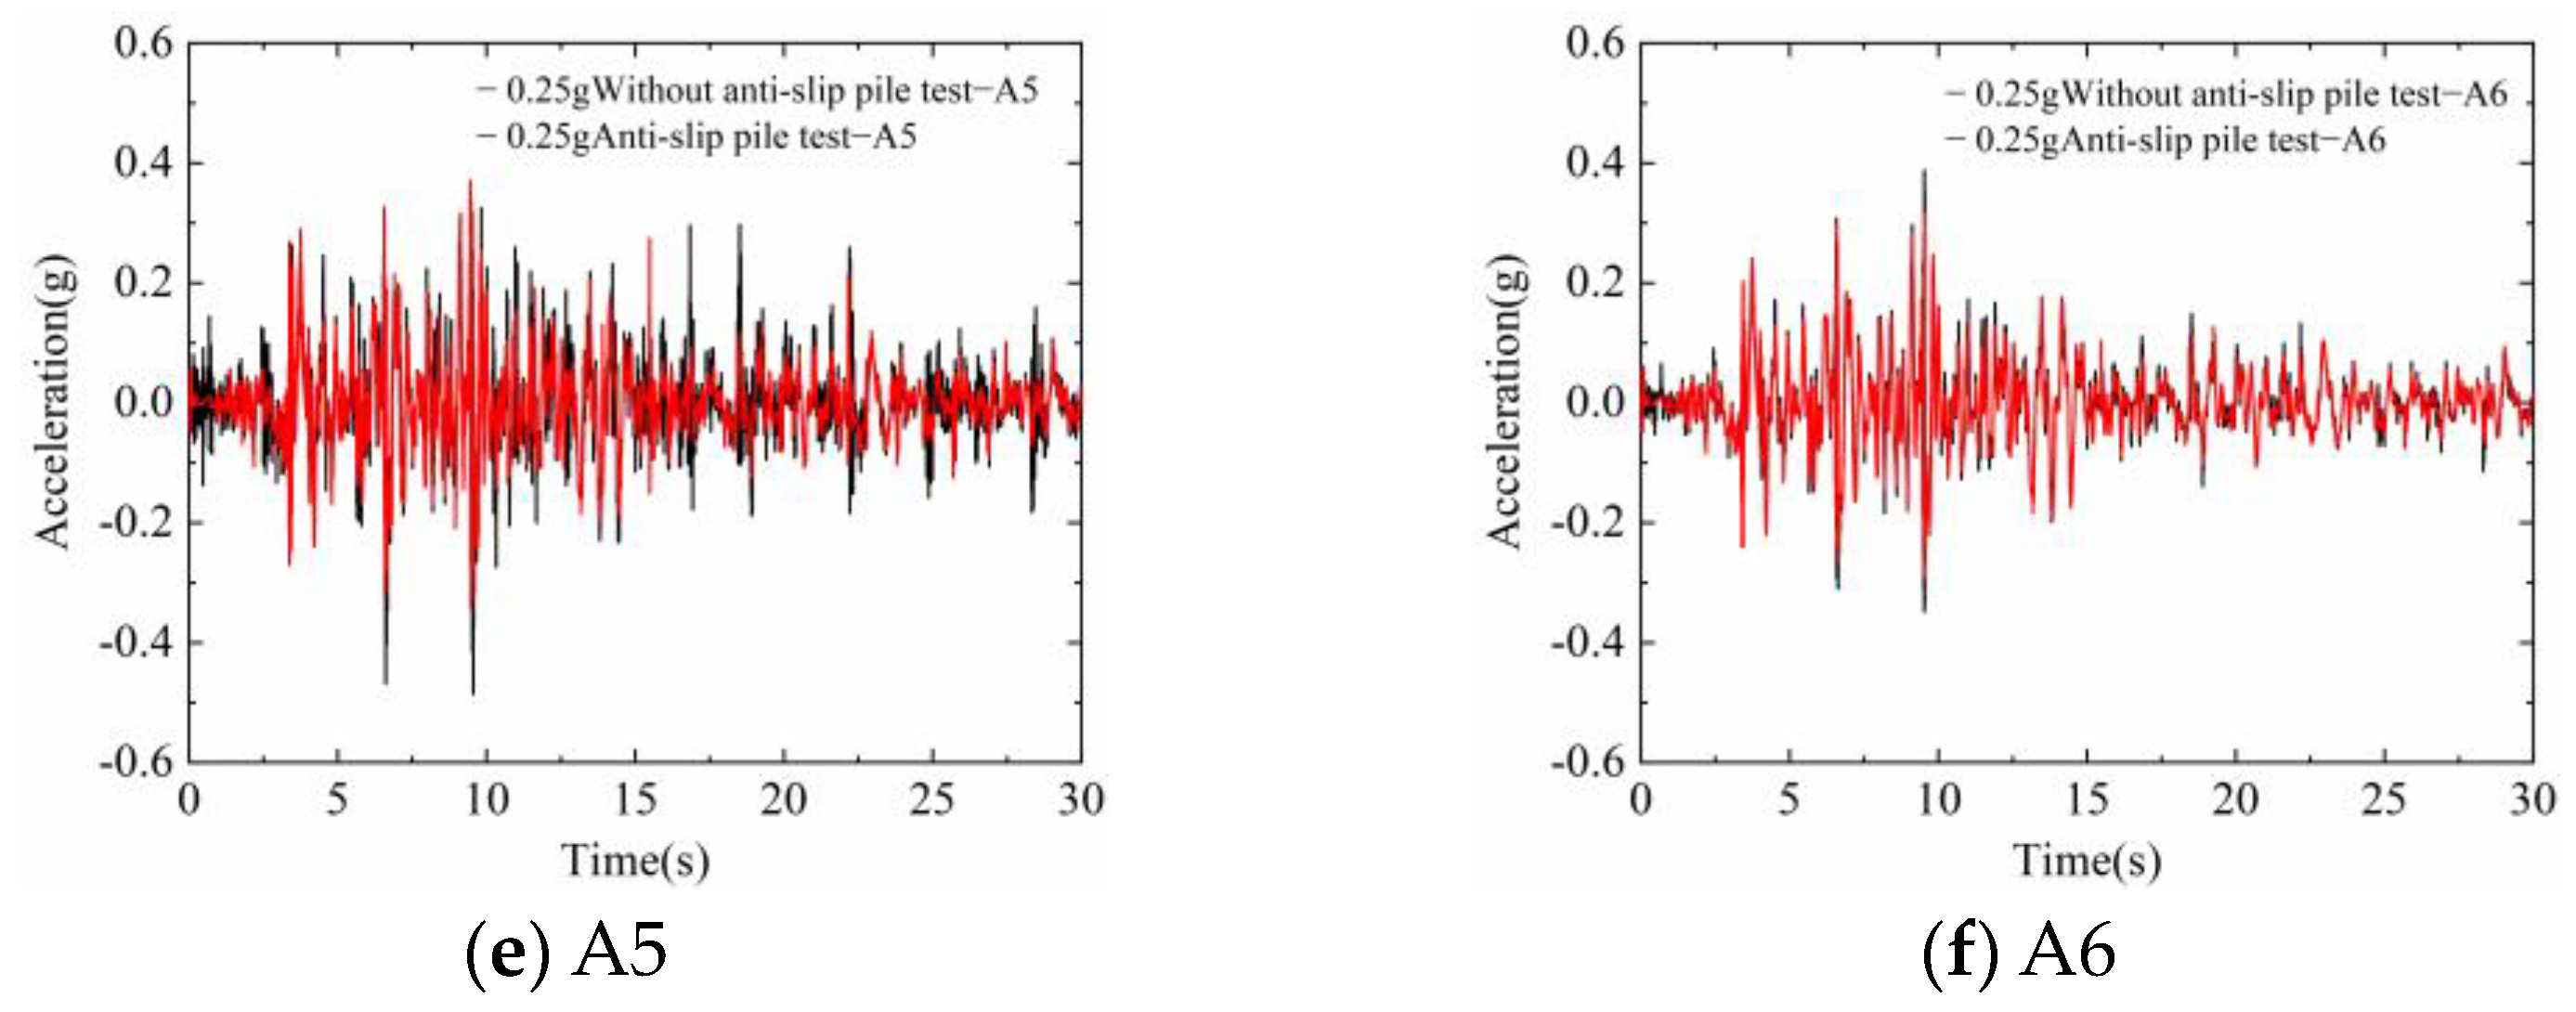
Due to the length of this paper, the 0.25 g peak acceleration was selected for comparative analysis, as shown in Figure 34. By comparing the acceleration time history curves of the accumulation slope test and the anti-slide pile reinforcement test, it can be seen that the peak acceleration of the accumulation slope measurement point is slightly greater than the peak acceleration of the anti-slide pile measurement point. The main reason for this phenomenon is that the anti-slide pile effectively suppresses the amplification effect during the propagation of seismic waves. At the same time, it can be seen from Figure 12 and Figure 23 that the amplification factor of the anti-sliding pile reinforcement test is smaller than that of the accumulation slope test, which further illustrates that the anti-sliding piles have a better inhibitory effect on the propagation of seismic waves.
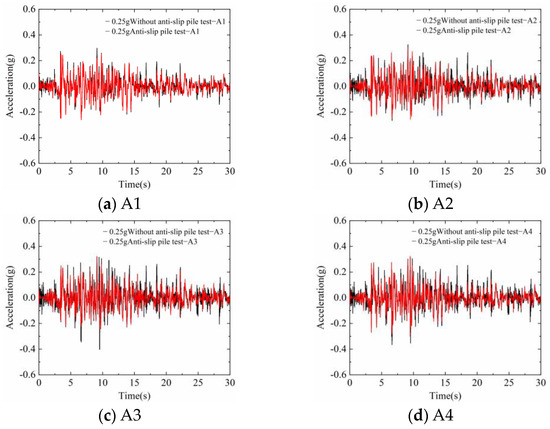
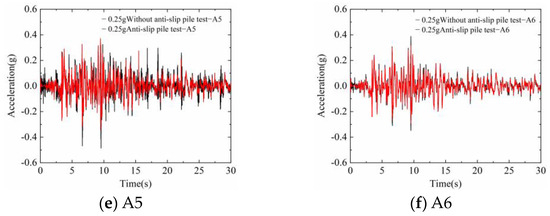
Figure 34.
Comparison of the acceleration time history curves of each measurement point in the soil, with or without anti-slide piles, when the acceleration is 0.25 g.
5.2. Model Slope Displacement Field and Strain Field Response
By comparing the displacement fields and strain fields of the two sets of tests, it was found that, at most times during earthquake excitation, the horizontal displacements in the X direction at the top and foot of the accumulation slope were greater than those at the top and foot of the slope reinforced with anti-slide piles. Among the horizontal displacements, the displacement difference at the top of the slope is the most significant, reaching a maximum of 2.3 times.
Meanwhile, in the process of an earthquake, the shallow displacement of the soil behind the pile, and the soil in front of the pile, produces a large displacement. This is mainly because the anti-slide pile can bear and share the sliding force of the slope accumulation layer so that the overall horizontal displacement of the slope is reduced, the slippage of the accumulation above the slope is effectively limited, and the remaining anti-slide force of the soil in front of the pile produces a downward instability and sliding deformation. This is due to an inability to resist the force of the pile on the surrounding soil, resulting in the separation of this part of the soil and the pile.
6. Conclusions
The effects of different peak accelerations under seismic loads on the stability of slopes in the pile layer and the effects of anti-slide pile support were investigated through shaking table model tests, and, in combination with with the DIC technique, the mechanism of slope destabilization was analyzed. The following conclusions were obtained:
- (1)
- By analyzing the amplification coefficient of the accelerometer in the soil under different peak accelerations and relative elevations, we found that the amplification coefficient of the measuring points A1–A6 of the accumulation slope reaches the maximum at a peak acceleration of 0.2 g, and its values are between 1.25 and 1.3, respectively. Furthermore, it shows a decreasing trend at a peak acceleration of 0.3 g, and its corresponding values are, respectively, between 1.1 and 1.2. In the anti-slip pile reinforcement test, due to the obstruction of the anti-slip pile, the damping of the soil around the pile increases. As the peak value of the seismic wave input increases, the amplification factor shows an overall decreasing trend. A1–A6 correspond to a peak acceleration of 0.3 g. The amplification factors are all close to 1.
- (2)
- According to the analysis of the displacement field and strain field, it is concluded that the accumulation slope mainly undergoes the earthquake-induced stage, tensile failure stage, creeping deformation stage, and overall instability stage under different peak accelerations. In the anti-slide pile reinforcement test, the slope showed different dynamic response characteristics under the same conditions, and mainly experienced the earthquake-induced stage, tensile failure stage, lower sliding surface formation stage, and soil shedding stage in front of the pile.
- (3)
- According to the distribution law of the bending moment of the pile along the buried depth, the bending moment of the anti-slide pile first increases and then decreases with the increase in acceleration, and the reverse bending point of the pile appears at five times the pile diameter below the soil surface; the maximum bending moment of the middle pile corresponding to a peak acceleration of 0.05–0.3 g is between 7.5 N·m and 47 N·m, respectively, and the maximum bending moment of the outer pile is between 6.5 N·m and 52 N·m, respectively. The outer pile is susceptible to the action of inertial force due to its proximity to the plexiglass, and the bending moment generated by the middle and lower part of the outer pile is large due to the geological conditions of soft at the top and hard at the bottom.
- (4)
- Comparing and analyzing the acceleration time history curves of the accumulation slope and the anti-slide pile under the acceleration peak of 0.25 g, it can be seen that the acceleration peak value of each measurement point of the accumulation slope is greater than that of the anti-slide pile, and the difference between their peaks is about two times. At the same time, the displacement and strain fields of each stage of the two groups of tests were compared, and it was found that the displacement and strain values of the accumulation slope test were greater than those of the anti-slide pile reinforcement test, and the horizontal displacement difference at the top of the slope was the most significant, reaching 2.3 times at the maximum.
7. Limitations
The images taken with the GoPro action camera in this experiment are limited to the analysis of the plane displacement field of the slope, and further research is needed on the monitoring of the three-dimensional space of the slope.
Author Contributions
J.X.: Data curation, Methodology, Validation, Writing—original draft preparation; Writing—review and editing. Y.J.: Conceptualization, Supervision. J.L.: Conceptualization, Supervision. M.S.A.: Investigation, Validation. Y.W.: Data curation; Investigation. All authors have read and agreed to the published version of the manuscript.
Funding
The authors gratefully acknowledge the support from Special Fund for Taishan Scholar Project: tsqn202211176, the Outstanding Youth Foundation of Shandong Province: ZR2021YQ31, the National Natural Science Foundation of China: 42277135, the National Natural Science Foundation of China-Shandong Joint Fund: U2006225.
Data Availability Statement
Data are contained within the article.
Conflicts of Interest
The authors declare no conflict of interest.
References
- Zhao, F.; Yu, S.; Li, B.; Shi, Z. Research Advances on Large-Scale Shaking Table Test for Rock Slopes under Earthquake. Earth Sci. 2022, 47, 4498–4512. [Google Scholar]
- Keefer, D.K. Landslides caused by earthquakes. Geol. Soc. Am. Bull. 1984, 95, 406–421. [Google Scholar] [CrossRef]
- Shimizu, Y.; Aydan, Ö.; Ichikawa, Y.; Kawamoto, T. A model study on dynamic failure modes of discontinuous rock slopes. In Proceedings of the International Symposium on Engineering in Complex Rock Formations, New Delhi, India, 14–17 April 1988; pp. 183–189. [Google Scholar]
- Xu, Q.; Feng, W.; Xiao, R.; Zuo, Y. Study of the Seismic Reponse of Slopes by Physical Modeling. Adv. Eng. Sci. 2009, 41, 266–272. [Google Scholar]
- Liu, Y.; Deng, H. Study on physical simulation vibration test of the anti-inclined slab-rent structure rock slope. J. Chengdu Univ. Technol. 2011, 38, 413–421. [Google Scholar]
- Yang, G.; Wu, F.; Qi, S.; Dong, J. Shaking Table Model Test on Dynamic Response Characteristics and Failure Mechanism of Antidip Layered Rock Slope. Chin. J. Rock Mech. Eng. 2012, 31, 2214–2221. [Google Scholar]
- Liu, H.; Wang, L.; Hou, H. Effect of Frequency of Seismic Wave on Acceleration Response of Rock Slopes. Chin. J. Rock Mech. Eng. 2014, 33, 125–133. [Google Scholar]
- Liu, J.; Deng, H.; Ling, D.; Guo, X.; Meibeng, G. Shaking table tests and throwing phenomenon of deposit slopes under earthquakes. Chin. J. Geotech. Eng. 2014, 36, 307–311. [Google Scholar]
- Sun, Z.; Guo, A.; Tian, H. Surface deformations and failure mechanisms of deposit slope under seismic excitation. Rock Soil Mech. 2015, 36, 3465–3472. [Google Scholar]
- Yang, B.; Zou, H.; Liang, J.; Zheng, D. Dynamic response and failure characteristic of accumulation slope under action of different kinds of seismic load. China Civ. Eng. J. 2019, 52, 202–210. [Google Scholar]
- Xu, J. Shaking table model tests on embedded Anti-slidee piles. Chin. J. Geotech. Eng. 2012, 34, 1896–1902. [Google Scholar]
- Lai, J.; Liu, Y.; Fang, Y.; Wang, Y. Shaking Table Test for Antiseismic Behavoir of Embedded Anti-Slidee Pile and Numerical Simulation. Chin. J. Rock Mech. Eng. 2013, 32, 4165–4173. [Google Scholar]
- Liu, C.; Liang, Y.; Li, X. Study of Shaking Table test for High Slope Retaining Structure on Highly Seismic Region. Chin. J. Rock Mech. Eng. 2014, 33, 3798–3802. [Google Scholar]
- Liu, C.; Zhang, Y. Shaking table test and analysis of double row pile retaining structure. China Civ. Eng. J. 2013, 46, 190–195. [Google Scholar]
- Feng, S.; Ai, H.; Feng, W. Seismic Optimum Design and Experimental Research on Anti Slide Pile with Pre-stressed Anchor Cable. Sci. Technol. Eng. 2018, 18, 248–255. [Google Scholar]
- Fan, G.; Zhang, J.-J.; Qi, S.-C.; Wu, J.-B. Dynamic response of a slope reinforced by double-row anti-slideing piles and pre-stressed anchor cables. J. Mt. Sci. 2019, 16, 226–241. [Google Scholar] [CrossRef]
- Fang, K.; Tang, H.; Li, C.; Su, X.; An, P.; Sun, S. Centrifuge modelling of landslides and landslide hazard mitigation: A review. Geosci. Front. 2022, 14, 101493. [Google Scholar] [CrossRef]
- Abdoun, T.; Abe, A.; Bennett, V.; Danisch, L.; Sato, M.; Tokimatsu, K.; Ubilla, J. Wireless real time monitoring of soil and soil-structure systems, Embankments, Dams, and Slopes. In Lessons from the New Orleans Levee Failures and Other Current Issues; ASCE Library: Lawrence, KS, USA, 2007; pp. 1–10. [Google Scholar]
- Liu, J.; Liu, F.; Kong, X.; Yongsheng, L. Application of PIV in large-scale shaking table model tests. Chin. J. Geotech. Eng. 2010, 32, 368–374. [Google Scholar]
- Fang, K.; Miao, M.; Tang, H.; Jia, S.; Dong, A.; An, P.; Zhang, B. Insights into the deformation and failure characteristic of a slope due to excavation through multi-field monitoring: A model test. Acta Geotech. 2023, 18, 1001–1024. [Google Scholar] [CrossRef]
- Lu, H.; Cary, P.D. Deformation measurements by digital image correlation: Implementation of a second-order displacement gradient. Exp. Mech. 2000, 40, 393–400. [Google Scholar] [CrossRef]
- Blaber, J.; Adair, B.; Antoniou, A. Ncorr: Open-source 2D digital image correlation matlab software. Exp. Mech. 2015, 55, 1105–1122. [Google Scholar] [CrossRef]
- Yang, C.; Fu, X.; Han, Y. Shaking Table Model Tests on the Seismic Response of a High and Steep Rock Slope. China Earthq. Eng. J. 2016, 38, 775–782+807. [Google Scholar]
- Yang, Z.; Liu, S.; Tian, X.; Hu, Y.; Ren, S. Dynamic stability and failure mode of slopes with overlying weak rock mass under frequent micro-seismic actions. Chin. J. Geotech. Eng. 2019, 41, 2297–2306. [Google Scholar]
- Men, Y.; Li, N.; Gao, O.; Li, J.; Liu, X. Seismic behavior of the landslide supported by micropiles. Chin. J. Rock Mech. Eng. 2018, 37, 2144–2151. [Google Scholar]
- Yao, L.; Xu, G.; Gao, Z.; Li, Z. Large-Scale Shaking Table Model Test Study on Dynamic Characteristics and Dynamic Responses of Slope. Chin. J. Rock Mech. Eng. 2008, 27, 624–632. [Google Scholar]
- Fan, G.; Fu, X.; Wang, Z.; Tian, H. Energy identification method for dynamic failure mode of bedding rock slope with soft strata. Chin. J. Geotech. Eng. 2016, 38, 959–966. [Google Scholar]


Disclaimer/Publisher’s Note: The statements, opinions and data contained in all publications are solely those of the individual author(s) and contributor(s) and not of MDPI and/or the editor(s). MDPI and/or the editor(s) disclaim responsibility for any injury to people or property resulting from any ideas, methods, instructions or products referred to in the content. |
© 2023 by the authors. Licensee MDPI, Basel, Switzerland. This article is an open access article distributed under the terms and conditions of the Creative Commons Attribution (CC BY) license (https://creativecommons.org/licenses/by/4.0/).