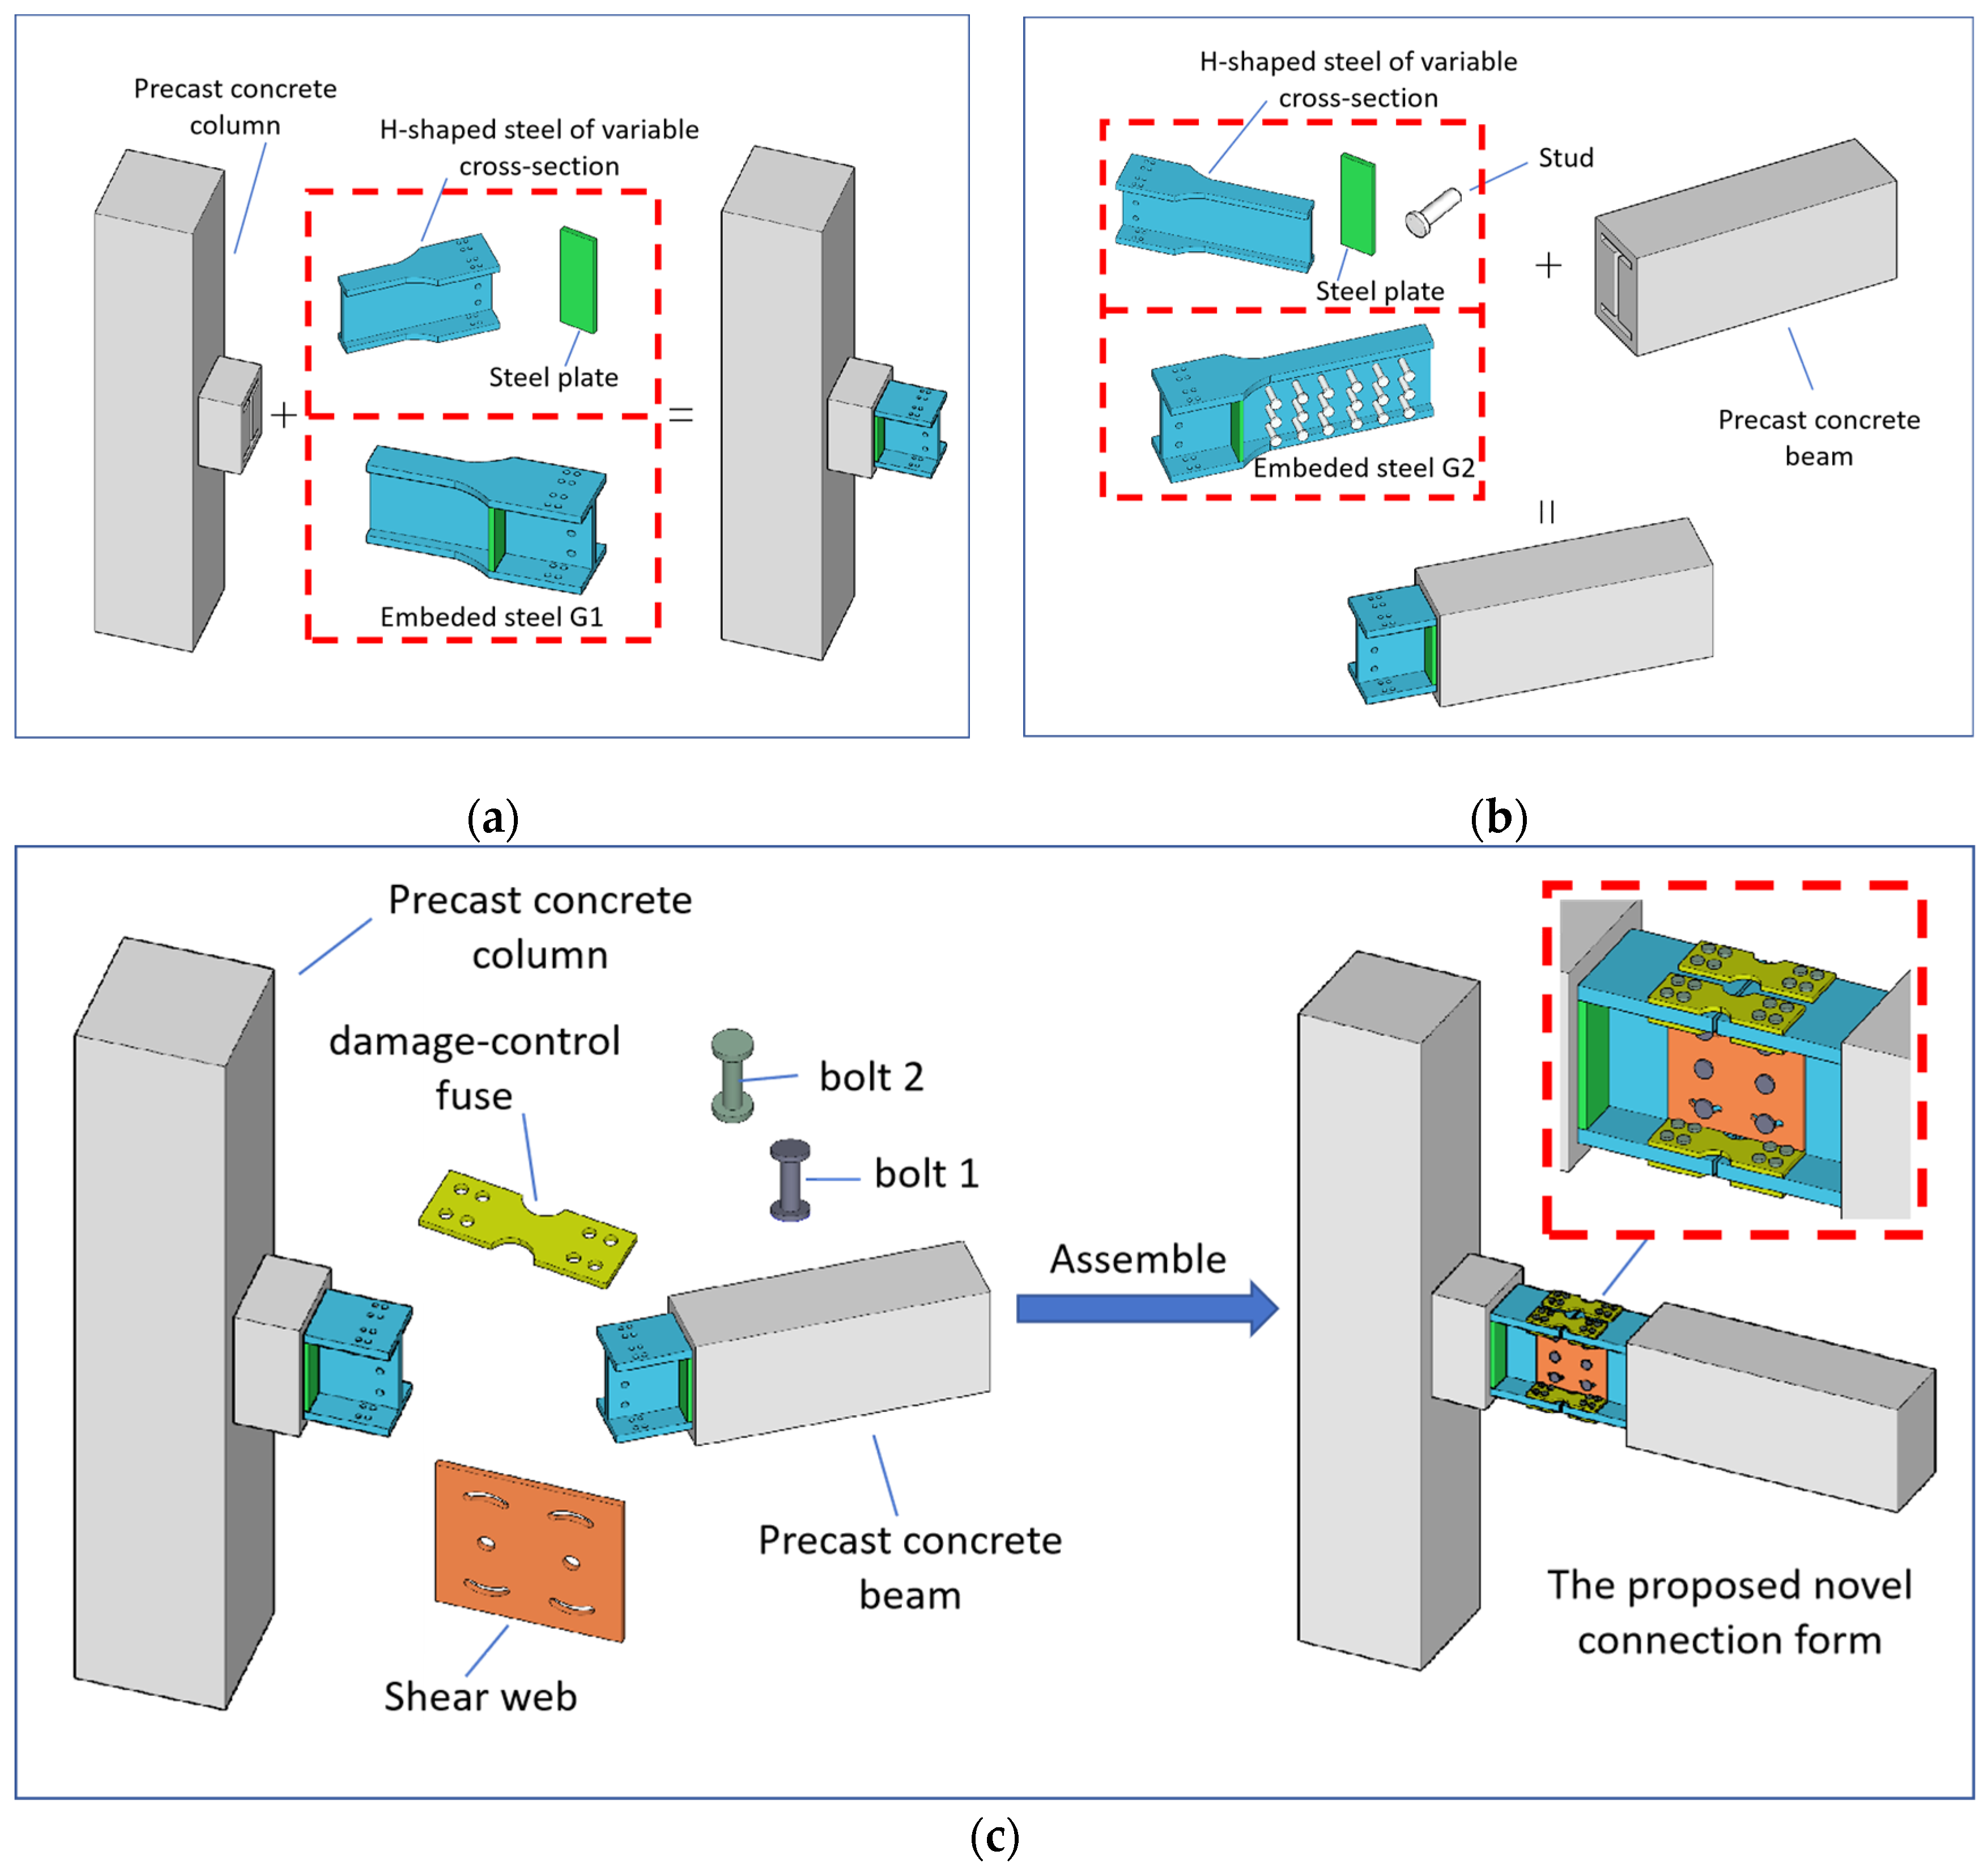
Article

Seismic Behavior of Demountable Reinforced Concrete (RC) Beam-to-Column Joints with Damage-Control Fuses

1
College of Civil Engineering and Architecture, Wenzhou University, Wenzhou 325035, China
2
Key Laboratory of Engineering and Technology for Soft Soil Foundation and Tideland Reclamation of Zhejiang Province, Wenzhou 325035, China
3
Wenzhou Engineering Technical Research Center on Building Energy Conservation and Emission Reduction & Diaster Prevention and Mitigation, Wenzhou 325035, China
4
Zhejiang Collaborative Innovation Center of Tideland Reclamation and Ecological Protection, Wenzhou 325035, China
*
Author to whom correspondence should be addressed.
Buildings 2024, 14(1), 20; https://doi.org/10.3390/buildings14010020 (registering DOI)
Submission received: 24 November 2023 / Revised: 12 December 2023 / Accepted: 19 December 2023 / Published: 20 December 2023
(This article belongs to the Section Building Structures)

Abstract

:
In this paper, a new type of assembled RC beam–column joint with a beam-end steel cover-plate connection is proposed to achieve seismic toughness and damage control of the joint. Energy-dissipation plates with different structural forms are proposed, and a series of seismic performance indexes of the joints are calculated and analyzed by using the finite element method. The energy-dissipation plate with an arc notch can reach the yield condition faster, and the ultimate bearing capacity of the joint reaches the maximum. The bending design of energy-dissipation plates is carried out by calculating the demand bending moment, and energy-dissipation plates of different structural forms are simulated and verified. The results show that the proposed design formula can ensure that the bending moment at the beam end still maintains elastic deformation when the energy-dissipation plate yields. The important parameters affecting the bending moment of the weakened part in the middle of the energy-dissipation plate are analyzed. Finally, this paper also analyzes the important parameters affecting the seismic performance of the joints. The results show that the seismic performance of the newly assembled RC beam–column joints proposed in this paper is better than that of cast-in-place joints. Increasing the longitudinal reinforcement ratio appropriately can greatly improve the ultimate bearing capacity and ductility of the joints. Increasing the thickness of the energy-dissipation plate, increasing the strength of the energy-dissipation plate, increasing the axial compression ratio of the column, increasing the strength of the concrete, and increasing the strength of the shear web can improve the ultimate bearing capacity of the joints but also reduce their ductility. Under different axial compression ratios, the strain in the core area of the joints is low, and the compressive damage of the concrete is zero, which verifies the effectiveness of the damage-control design of the proposed model.

1. Introduction

A prefabricated structure consists of prefabricated components as its primary force-bearing elements, which are connected at the column end using a specific method. However, it is important to note that the joints in this structure are typically the weak points. In practical engineering, various forms of connections are utilized to assemble prefabricated components into a complete structure. This construction method is cost-effective and widely employed in countries with high seismic activity, such as Singapore, Japan, and Chile [1,2,3]. Observations of earthquake damage have indicated that failures of joints that serve a critical connecting function are the primary causes of prefabricated structural collapses. The joints of a prefabricated structure experience complex forces and endure multiple loads during horizontal earthquakes, leading to stress concentration in these areas. Moreover, these joints are subjected to significant shear forces during horizontal earthquakes, which are often several times greater than the shear force of the reinforcement. To ensure joint quality, high-quality reinforcement is commonly used, resulting in challenges during joint construction and issues related to quality control [4,5].
Advancements in beam–column joint technology have greatly impacted seismic development. Researchers have studied joint designs and connection modes, focusing on damage control and energy consumption. Banisheikholeslami et al. [6] proposed joints that utilized viscoelastic shear and elastic–plastic steel bolts for energy dissipation. Their tests showed more stable hysteretic behavior compared to traditional joints. Lin et al. [7] developed a high-strength steel moment-resisting frame structure with replaceable fuses, effectively controlling damage during seismic events. Yan et al. [8] investigated the seismic behavior of HS steel beam–column joints with and without fuses via testing and finite element analysis. Li et al. [9] studied demountable joints and demonstrated their superior performance in bearing capacity and energy dissipation. Parastesh et al. [10] introduced a ductile moment-resisting connection method for precast concrete frames, which showed significantly higher energy dissipation. Calado et al. [11] proposed a repairable joint with dampers, which successfully dissipated energy through fuse plastic deformation. Latour et al. [12] conducted experimental and numerical research on beam–column joints with demountable friction dampers, reporting a satisfactory hysteretic performance for both connection methods. Li et al. [13] explored the impact of steel-beam stiffness on the ductility and collapse resistance of reinforced concrete steel frames, revealing its significance. Liu et al. [14] proposed a buckling-restrained joint that transferred shear forces to components outside the web but cautioned about potential adverse effects on energy dissipation if tearing occurred at the joint. Yan et al. [15] developed a recoverable prefabricated steel joint that could be easily repaired after earthquake damage, demonstrating its practical application in seismic-resistant structures. Ma et al. [16] introduced an artificial energy-dissipation plastic hinge-assembled concrete frame joint and studied the yield bending moment reduction coefficient γ as a key parameter. Their simulation experiments indicated effective plastic damage control and energy dissipation when γ ranged from approximately 0.75 to 0.85.
The aforementioned studies have primarily focused on the postearthquake performance and damage control of beam–column joints, wherein different connection methods and levels of complexity are employed [17,18,19,20,21,22,23,24]. Traditional prefabricated beam–column joints often suffer a severe plastic deformation of their main structure due to strong seismic effects during earthquakes. To address these issues, this study proposes a new joint, called J1, consisting of precast concrete beams and columns, embedded steel members, damage-control fuses, and shear webs (Figure 1). The steel members are embedded at the column end, while welded studs enhance the connection strength at the beam end (Figure 1a,b). The beam is prefabricated within the joint area of the concrete column to ensure sufficient anchorage length. Bolt holes enable the installation of damage-control fuses and shear webs (Figure 1c). The G1 steel member is welded by a variable cross-section H-shaped steel and a steel rib plate. The H-shaped steel in the variable cross-section area and the steel in the smaller cross-section area are embedded in the joint area of the concrete column, which is convenient for the mechanical connection between the joint member and the prefabricated concrete member. Compared to G1, the steel member G2 is welded with studs on both sides of the web of the H-shaped steel to increase the connection strength. In addition, in the precast concrete column, the corbel beam should be prefabricated in the joint area to provide sufficient anchorage length for the steel member G1. Several bolt holes are drilled at the flange and web of steel members G1 and G2, respectively. The transverse energy-dissipation plate and the longitudinal energy-dissipation plate are installed on the steel members, and the joint members are assembled by means of a bolt connection. The transverse energy-dissipation plate is a weakened flange plate, which can control the formation of plastic hinges at the specified weakened position so that the energy-dissipation plate can reach the yield faster and achieve the purpose of energy dissipation. The joint utilizes the plastic hinge outward displacement design method to enhance seismic resilience. Energy dissipation occurs through friction and metal deformation, preventing brittle failure and improving safety. These joints address the poor seismic performance of traditional prefabricated joints. Damaged fuses can be easily replaced to restore seismic functionality following damage-control design principles.
To investigate the seismic behavior of the new demountable RC beam–column joints, it is essential to establish a finite element model that accurately replicates their behavior and validates this model through experiments. By analyzing the seismic performance of various parameters of the joints, as well as formulating a design theory and calculation methodology for damage-control fuses, valuable insights can be gained to enhance the joints’ ability to withstand earthquakes. Moreover, a comprehensive study of the key factors influencing the seismic performance of these joints can facilitate the identification of optimal design parameters, ultimately leading to the development of beam–column joints that are more efficient and effective in ensuring the stability of earthquake-resistant structures.

2. Experimental Investigation

2.1. Specimen Design Details

To solve the limitations of existing precast beam-to-column connections, Lu et al. [17] proposed a new type of precast beam-to-column connection using double-grouting sleeves. Through a series of tests, the seismic performance of precast beam-to-column joints connected with double-grouting sleeves was studied. The influence of the type of grouting sleeve, the assembly length of the connector, and the diameter of the transition bar on the seismic performance of the joints were analyzed and discussed. In addition, the theoretical assumption underlying the calculation of the bending performance of the test joints according to the beam-to-column joint method was compared with the experimental data of the prefabricated joints to compare whether the original method of casting the beam-to-column joints was sufficient to predict the bending capacity of the column connection between the prefabricated beam and the double-grouting sleeve. In this study, we used the finite element software Abaqus v2020 to verify the cast-in-place beam–column joints proposed by Lu et al., and we compared the hysteresis curves and failure phenomena of the simulation and the experimental test.
The monolithic beam–column joint BCJ-C [17] serves as the reference joint in this model, which is depicted in Figure 2. The dimensions of the newly designed connection can be observed in Figure 2. (A-A and B-B represent the cross-sectional view of the corresponding section of the beam). The column’s cross-section measures 350 mm × 350 mm, with a total height of 2000 mm, while the beam boasts a cross-section of 200 mm × 350 mm and an overall length of 1500 mm. As for the column’s longitudinal reinforcement, it consists of 8Φ16 mm bars, arranged along the midpoints of its four corners and four sides. Meanwhile, the longitudinal reinforcement in all the beams consists of two sections, each comprising 2Φ16 mm bars, and the transverse reinforcement is Φ8 mm@100 mm. The stirrups of this model are welded to the web to enhance the connection’s strength.

2.2. Test Setup and Loading Protocol

A cyclic loading test was carried out to investigate the hysteretic performance of the joint specimen. The experiment involved applying a cyclic load to the free end of the beam and a vertical axial compressive load to the top of the column. The axial force was kept constant at 700 kN, as depicted in Figure 3. A load–displacement hybrid loading system, illustrated in Figure 4, was utilized. Initially, before the yield of the joint specimen, the force-controlled loading scheme was adopted. A loading circle represented a loading step. After the yield of the joint specimen, the displacement loading-control scheme was adopted. Each loading step consisted of a single loading cycle, with displacement loading continuing until the specimen yielded. Following the specifications in reference [17], the first three steps were repeated thrice, while the third loading step was repeated twice [25].

2.3. FE Model

The finite element model was established using 2020 ABAQUS software [26], as shown in Figure 5. The material models and element types for the concrete and steel components are explained in this section, along with the stress–strain relationship of the concrete model. The boundary conditions and load state of the beam–column joints are also described.

2.4. Concrete Material Model

Concrete is affected by strain gradients, stirrup confinement, and bar deformation. Concrete experiences tensile and crushing failure. This study used a concrete-damage plasticity model to represent hysteresis, stiffness degradation, and strength degradation. The reference joint was simulated based on C40 concrete (Ec: 32,460 MPa, ν: 0.2, fc: 39.8 MPa).
The compressive constitutive model and the tensile constitutive model of concrete adopted the ‘Code for Design of Concrete Structures’ GB50010-2010 [27], which are shown in Figure 6, and the tensile curves were determined according to Equations (1)–(4):
σ = ( 1 d t ) E c ε
d t = 1 ρ t [ 1.2 0.2 x 5 ]           x 1 1 ρ t α t ( x 1 ) 1.7 + x       x > 1
x = ε ε t , r
ρ t = f t , r E c ε t , r
where α t is the parameter value of the descending section of the uniaxial tensile stress–strain curve of concrete, and   ε t , r is the peak tensile strain of concrete corresponding to the uniaxial tensile strength representative value f t , r . These two values are presented in Table 1. f t , r   is the representative value of the uniaxial tensile strength of concrete, and d t is the evolution parameter of the uniaxial tensile damage of concrete.
The stress–strain curve of concrete under uniaxial compression is determined according to Equations (5)–(10):
σ = ( 1 d c ) E c ε
d c = 1 ρ c n n 1 + x n           x 1 1 ρ c α c ( x 1 ) 2 + x       x > 1
ρ c = f c , r E c ε c , r
n = E c ε c , r E c ε c , r f c , r
x = ε ε t , r
where α c is the parameter value of the descending section of the uniaxial tensile stress–strain curve of concrete and ε c , r is the peak tensile strain of concrete corresponding to the representative value f c , r of uniaxial tensile strength. These two values are presented in Table 2. f c , r is the representative value of the uniaxial tensile strength of concrete, and d c   is the uniaxial tensile damage evolution parameter of concrete.

2.5. Reinforcement and Steel Material Model

The mechanical properties of the steel bars and section steels are outlined in Table 3, including the elastic modulus, tensile strength, and yield strength. The steel members in the model include section steels, energy-dissipation plates, and studs. The longitudinal reinforcement is 16 mm in diameter, while the stirrup is 8 mm. The constitutive models for steel bars adopt a double-broken-line model, as described by Equation (10) and shown in Figure 7 (The red dashed line represents the yield strain value and yield stress value, while the purple line represents the slope of the two diagonal lines). The steel bars are represented as T3D2 trusses with two joints, while steel is represented as C3D8R solid elements with eight joints. Steel is embedded into the concrete to simulate their interaction, as shown in Figure 2.
σ s = ε s E s                                                                   0 ε s ε y f y + 0.01 ( ε s ε y ) E s               ε y ε s        
where ε s   is the strain of steel, σ s   is the stress of steel, ε y is the yield strain of steel, f y   is the yield stress of steel, and E s is the elastic modulus of steel.

2.6. Load, Boundary Conditions, and Meshing

The boundary conditions of the finite element model are shown in Figure 8. The nodes at the top of the concrete column are constrained in the X and Z axes; the joints at the top and bottom of the concrete column are constrained in the X, Y, and Z axes; and the rotation is limited in the Y and Z axes. The loading process was divided into two stages: first, a suitable preload was applied to the bolt, and, then, a cyclic load was applied to the free end of the beam. The top of the concrete column was subjected to vertical axial load, and axial pressure was applied at 10% of its maximum bearing capacity. The axial force of 700 kN remained constant during the three loading stages. Relevant studies [28] have shown that rough meshing will greatly reduce the accuracy of the results, and fine meshing will make the results more accurate. In this paper, the energy-dissipation plate, shear web, and column-end H-shaped steel members are important research objects, so their grids are finely divided. The specific meshing details of the finite element model are shown in Table 4 and Figure 9.

2.7. Verification of the FE Model

The displacement loading system was utilized in both the numerical simulation and the experimental test to validate the established model. A comparison between the numerical calculations and test results [17] verifies the model’s validity. In the failure stage, Figure 10a (The red circle represents the comparison between the experimental failure mode and the simulated failure mode) demonstrates that plastic strain magnitude (PEMAG) mainly concentrates at the beam end near the node, indicating node failure without column failure. Figure 10b shows that, in the hysteresis curves obtained from the simulation and the test exhibit, there were consistent peak loads in each cyclic loading stage. The actual ultimate bearing capacity of the BCJ-C specimen is 46.2 kN, and the simulated ultimate bearing capacity is 45.9 kN. The loading and unloading curves of the numerical simulation in each stage of cyclic loading are in good agreement with the experimental results. However, after the load reaches its peak, the unloading stiffness between the two curves gradually shows a slight deviation. In addition, the maximum error of the peak load between the finite element model simulation and the experimental results is small. In general, the finite element model can reproduce the mechanical behavior of concrete beam–column joints with reasonable accuracy. It is worth noting that the hysteresis curve in the finite element model is smooth and full because the finite element model avoids the initial defects of the material and the errors in the test loading process. In general, the numerical simulation results are in good agreement with the experimental results, which confirms the effectiveness of the finite element method.

3. Results and Discussion

3.1. Damage-Control Fuses of Different Structural Forms

This study evaluated different cutting methods for weakened damage-control fuses and their impact on yield and energy-dissipation capacity. Five cutting modes (arc notch, noncutting, triangular notch, circular notch, and inner circular notch) were proposed and are shown in Figure 11. The plates have a uniform steel yield strength and section size. A comparative analysis of the finite element parameters reveals that the structural form of the damage-control fuse significantly affects the overall joint performance. The curved-notch damage-control fuse exhibits stress concentration, leading to the faster attainment of yield conditions. The triangular-notch damage-control fuse shows a slight stress concentration phenomenon, while the stress-concentration phenomenon of the circular-notch damage-control fuse and the inner-circular-notch damage-control fuse is not obvious. The influence of different structural forms of damage-control fuses on the load–displacement performance of prefabricated beam–column joints is shown in Figure 12. The ultimate bearing capacity of the curved-notch energy-dissipation plate is the largest. In contrast, the ultimate bearing capacity of the arc-shaped notched energy-dissipation plate’s demountable joint J1 is 80.1 KN, and the ultimate bearing capacity of the cast-in-place joint is 45.9 KN, which is increased by about 74.5%. The ultimate bearing capacities of the remaining four joints, J2, J3, J4, and J5, are 78.7, 75.7, 71.1, and 68.9 kN, respectively. The ratios of ultimate bearing capacity of J1, J2, J3, J4, and J5 to that of cast-in-place joints are 1.75, 1.72, 1.65, 1.55, and 1.50, respectively. Therefore, while ensuring the bearing capacity and ductility of the joints, the circular-notch energy-dissipation plate can maximize energy consumption so that the deformation of the main structure is within the elastic range.

3.2. Ductility Analysis

The yield load and peak load of each specimen were calculated using the Park method [29], and the results are shown in Figure 13 (Point A: Peak point of the specimen; Point B: Peak load; Point C: yield point of the specimen; D: The peak load achievable at the yield state of the specimen). The ductility coefficient is defined as the ultimate displacement of the structure divided by the yield displacement of the structure.
Figure 14 shows the effect of different damage-control fuses on the ductility of the beam [30]. The structural design of the fuses greatly impacts the joints. The ductility coefficients for the demountable joints (J1, J2, J3, J4, and J5) are 6.68, 6.32, 6.52, 9.01, and 9.39, respectively. The monolithic joint BCJ-C has the lowest coefficient at 5.26 [17], while the J5 fuse shows the highest. A possible reason is that, for a demountable joint under low positive action, the energy-dissipation plate deforms and forms a plastic hinge at the joint, while the cast-in-place joint forms a plastic hinge at the joint.

3.3. Stiffness Degradation

The secant stiffness can show the stiffness degradation of joint components, which can be calculated according to Equation (11):
K i = ( F i + F i ) ( i + i )
where K i is the secant stiffness under the ith loading; F i   a n d   F i   are the positive and reverse peak-load values under the ith loading, respectively; and i   a n d i   are the displacements corresponding to the positive and reverse peak values under the ith loading, respectively.
Figure 15 compares the secant stiffness of the cast-in-place and demountable joints. It can be seen from the diagram that the stiffness of the demountable joints with energy-dissipation plates is greater than that of the cast-in-place joint during the whole process of loading. At the initial stage of loading, the stiffness degradation of the cast-in-place joint decreases linearly, while the stiffness degradation of the demountable joints has a gentle period. It may be due to the energy-dissipation plate in the demountable joints, which limits the development of the initial crack of concrete in the core area of the joints, resulting in a gentle initial stiffness. With continued loading, the stiffness-degradation curve of the demountable joints decreases slowly and then rapidly, while the stiffness-degradation curve of the cast-in-place joint decreases slowly. The reason may be that the existence of the energy-dissipation plate plays a role in damage control, which effectively limits the development of some cracks.

3.4. Energy Dissipation

Figure 16 shows the energy-dissipation curves of the five demountable joints and the one cast-in-place joint. It can be seen from the diagram that the energy-dissipation capacity of all demountable joints is better than that of the cast-in-place joint, and the joint with an arc-notch energy-dissipation plate has the best energy-dissipation capacity. The possible reason is that the existence of the energy-dissipation plate can limit the development of concrete cracks in the core area of the joint to a certain extent, which effectively enhances the energy-dissipation capacity of the joint, and, thus, the joint with arc-notch energy-dissipation plate is more likely to absorb seismic energy.

4. Design Theory of Damage-Control Fuses

4.1. Seismic Design Requirements

The following are the requirements for joint design:
(1)
A joint must meet normal use requirements, and the high-strength bolt in the joint must not slip;
(2)
A joint must withstand strong earthquakes without collapsing; thus, stable bearing capacity is required.

4.2. Required Bending Moment Calculation of the Joint End

Figure 17 illustrates the critical sections of a joint. The steel member experiences elastic and plastic deformation during beam loading. To ensure the damage-control fuse reaches yield condition first, the plastic bending moment at section b-b must be lower than the yield bending moment at section a-a. Thus, a demand bending moment is established within the plastic bending moment at section b-b and the yield bending moment at section a-a. The required bending moment serves as damage control and is calculated based on Equations (12)–(15) as follows:
M P = f y W p n
M y = f y W e n
W p n = γ · W e n
M P M i b y M y
where M p is the plastic bending moment of the beam end at section b-b; f y is the yield strength of steel; W p n is the plastic section modulus of the beam end at section b-b; M y is the yield bending moment of the beam end at section a-a; W e n is the elastic section modulus of the beam end at section a-a; γ is the plastic development coefficient of the section, taking the value of 1.2; and M i b y is the demand bending moment of the beam end at section a-a.

4.3. Design of Damage-Control Fuse for Flexure

Taking the J1 size of the arc-notch damage-control fuse as an example, the yield bending moment of section b-b in the middle-weakened section of the damage-control fuse was calculated. For the convenience of joint design and formula derivation, it is stipulated that the thickness and width of the four damage-control fuses are the same. The thickness of the damage-control fuse is named t cov , f , the width of the outer damage-control fuse is named b p , the width of the dog bone inside the damage-control fuse is b cov , f , and the gap between the beam rotation space at the joint connection part is d. Figure 18 shows the relevant parameters of the J1 bonding section and the middle-weakened section b-b of the damage-control fuse [31]. The bending moment provided by the energy-dissipation plate is calculated based on Equations (16)–(20) as follows:
h c o v , 0 = h b + t c o v , f
h c o v , 1 = h b 2 t f , c b t c o v , f
I c o v , x = 2 3 b c o v , f t c o v , f 3 + b c o v , f t c o v , f h c o v , 0 2 + b c o v , f t c o v , f h c o v , 1 2
M c f , n = F c o v , y · ξ I c o v , x ( h b 2 + t c o v , f )
W p , n = γ · M c f , n
where h b is the height of the cantilever section; b cov , f is the width of the weakened part of the damage-control fuse; h cov , 0 is the distance from the center of the upper outermost damage-control fuse to the center of the lower outermost damage-control fuse; t f , c b is the thickness of the cantilever flange; h cov , 1 is the distance from the center of the upper inner damage-control fuse to the center of the lower inner damage-control fuse; and I cov , x is the moment of inertia of the middle-weakened section b-b with respect to the neutral x axis. Considering the stiffness of the web connecting plate and the high-strength bolt, the stiffness-correction coefficient ξ of the binding section of the damage-control fuse is 1.3, which is obtained by fitting the finite element numerical results. F cov , y is the yield strength of the damage-control fuse, M p , n is the plastic bending moment provided by the b-b section of the damage-control fuse and the theoretical plastic bending moment of the damage-control fuse; and M c f , n is the yield bending moment provided by the b-b section of the damage-control fuse and the theoretical yield bending moment of the damage-control fuse.
When M p , n M y is satisfied, the plastic bending moment of the b-b section of the damage-control fuse is less than the yield bending moment of the a-a section of the beam end, indicating that the beam end is in an elastic stage when the damage-control fuse yields or even plastically deforms, which meets the requirements of controllable damage of the joint. In addition, the parameters of the nonweakening damage-control fuse J2 and the circular-notch damage-control fuse J4 were calculated according to the above formulas. Figure 19 and Figure 20 show the relevant parameters of the damage-control fuse J2 and the damage-control fuse J4 combined with the cross section and the middle-weakened section. The joints were compared with reference to Figure 18c. The results show that these damage-control fuses can meet the requirements and M c f , 2 M c f , 1 M c f , 4 , which is related to the effective cross-sectional moment of inertia of the damage-control fuse weakening section. The greater the cross-sectional moment of inertia of the damage-control fuse weakening section, the greater the bending moment. Therefore, the energy-dissipation plate with an arc notch can fully absorb the energy of an earthquake and deform. However, when the energy-dissipation plate itself reaches the plastic strain to form a plastic hinge, the deformation at the beam end is still within the elastic range or slight plastic deformation occurs. At this time, the energy-dissipation plate can be replaced to achieve the effect of quickly restoring its original function after an earthquake.

5. Finite Element Simulations

5.1. Numerical Verification of the Design Theory

The bending moment and shear force at the b-b section of the weakened part of the damage-control fuses were simulated using the v2020 ABAQUS software. Figure 21 shows the simulated bending moment (blue arrow) and shear force (red arrow). Table 4 compares the bending moment and required bending moment of three damage-control fuses.
Table 5 lists the bending moments and demand bending moments for three types of damage-control fuses. J2 has the highest theoretical yield bending moment, while J4 has the lowest. J2 also has a 17.4% greater theoretical plastic bending moment compared to J4. The ABAQUS software simulation shows that J2, the noncutting damage-control fuse, has the largest simulated bending moment of 543.3, while J4, the circular-notch damage-control fuse, has the smallest simulated bending moment of 499.6. The simulated bending moment of J2 is 8.7% greater than that of J4. However, the simulated plastic bending moments for all fuses exceed their theoretical values, with J2 showing a minimum difference of 25.6%. The yield bending moment and the ultimate bending moment of the beam end section are 549.6 and 612.2, respectively. The plastic bending moment for all fuses is lower than the yield bending moment of the beam-end section, thereby ensuring controlled damage within the joint’s elastic stage.

5.2. Analysis of Parameters Affecting Damage-Control Fuses

The joint model considers the influence of multiple parameters on the bending moment of the weakened part in the middle of a damage-control fuse. These parameters are the damage-control fuse strength, shear web strength, concrete strength, and axial compression ratio.
Table 6 illustrates the effect of varying steel strengths on the bending moment in the middle of the damage-control fuse. With an increase in the strength of the fuse steel, the simulated bending moment increases compared to the theoretical values of the yield and ultimate bending moments. At a steel strength of 460 MPa, the theoretical and simulated bending moments differ by only 19.6%. These results highlight the importance of selecting the right steel strength to achieve the desired bending moment response.
Table 7 shows the influence of different web steel strengths on the bending moment in the middle of the damage-control fuse. It is found that different web steel strengths have no effect on the bending moment in the middle of the damage-control fuse. This is because the bending moment is mainly borne by the damage-control fuse, while the web plays a more significant role in shear resistance.
Table 8 demonstrates the impact of varying concrete strengths on the bending moment in the middle of the damage-control fuse. Different concrete strengths greatly influence the bending moment in this location. The simulated bending moment obtained using ABAQUS varies with a change in concrete strength, while the theoretical bending moment remains constant and falls within the yield and ultimate bending moment limits. At a concrete strength of C40, the difference between the theoretical and simulated bending moments reaches a minimum of 26.6%.
Table 9 illustrates the impact of varying axial compression ratios on the bending moment in the middle of the damage-control fuse. Different axial compression ratios significantly influence the bending moment in this location. As the axial compression ratio increases, the simulated bending moment decreases, while the theoretical bending moment remains constant and falls within the yield and ultimate bending moment limits. At an axial compression ratio of 0.5, the theoretical and simulated bending moments are closest.

6. Parameter Analysis

This model considers the influence of multiple parameters on the ultimate bearing capacity of joints. These parameters include concrete strength, longitudinal reinforcement ratio, damage-control fuse thickness, damage-control fuse strength, shear web strength, and axial compressive ratio.

6.1. Effect of Concrete Strength

As shown in Figure 22, concrete strength is categorized into four levels: C25, C40, C55, and C70. Figure 19 demonstrates the impact of concrete strength on the load–displacement performance of the beam–column joints. The lateral bearing capacity of the joints improves with increasing concrete strength. In Figure 23a, the peak load increases as the concrete strength rises from 25 MPa to 70 MPa, with a corresponding increase from 71.18 kN to 91.61 kN, representing a 28.7% increase in capacity. Figure 23b illustrates a decrease in ductility as the concrete strength rises. At 25 MPa, the maximum ductility coefficient is 7.01, while at 70 MPa, the minimum ductility coefficient drops to 6.42, indicating an 8.4% reduction.

6.2. Effect of Longitudinal Reinforcement Ratio

As shown in Figure 24, this study examined the impact of longitudinal reinforcement ratio on beam–column joint performance. Four reinforcement situations (812, 816, 820, and 825) corresponding to reinforcement ratios of 0.74%, 1.32%, 2.04%, and 3.21% were investigated. The simulation results (Figure 24) show that an increasing reinforcement ratio enhances the joints’ ultimate capacity. Figure 25a highlights the smallest capacity at 0.74% (67.2 kN) and the largest capacity at 3.21% (111.14 kN), indicating a 65.4% increase. Figure 25b indicates a 26.8% increase in ductility at the 0.74% ratio, with a maximum factor of 7.89 compared to the minimum of 6.22. These findings demonstrate that a higher longitudinal reinforcement ratio significantly boosts joint capacity and ductility.

6.3. Effect of Damage-Control Fuse Thickness

Figure 26 illustrates the impact of damage-control fuse thickness (5 mm, 10 mm, 15 mm, and 20 mm) on the load–displacement performance of the demountable beam–column joints. In the elastic range, a greater thickness enhances initial stiffness and improves the load-bearing capacity of the joints (Figure 27a). At 5 mm thickness, the bearing capacity is 77.88 kN, whereas at 20 mm thickness, the maximum capacity is 83.18 kN, indicating a 6.9% increase. The ductility coefficients are shown in Figure 27b, where a 5 mm thickness yields a maximum of 6.86, while a 20 mm thickness results in 6.26, indicating a 9.1% reduction. Thus, seismic performance is minimally influenced by damage-control fuse thickness.

6.4. Effect of Damage-Control Fuse Strength

The strength of the damage-control fuses (Q235, Q345, Q390, and Q460) impacts the load–displacement behavior of the demountable beam–column joints, as depicted in Figure 28. A higher steel strength results in an increased initial stiffness and bearing capacity of the joints. In Figure 29a, using Q235 for the fuse steel yields with the smallest ultimate capacity of 72.4 kN, while Q460 provides the largest ultimate capacity of 84.17 kN, indicating a 16.3% increase. Figure 29b shows a maximum ductility factor of 7.42 for Q235, while Q460 exhibits a minimum factor of 6.32, which is 14.8% lower than the former. Therefore, a greater damage-control fuse strength improves joint capacity and reduces its ductility when using higher-strength steels.

6.5. Effect of Shear Web Strength

The shear strength of the web (Q235, Q345, Q390, and Q460) has a significant effect on the load–displacement performance of the demountable beam, as shown in Figure 30. An increase in shear web strength leads to higher initial stiffness and bearing capacity. In Figure 31a, the ultimate bearing capacity of the web shear steel is the smallest when Q235 is used, which is 75.4 kN, while the ultimate bearing capacity is the largest when Q460 is used, which is 82.17 kN, showing an increase of 9%. Figure 31b shows that Q235 has the largest ductility coefficient of 7.18, while Q460 has the smallest ductility coefficient of 6.47, which is 9.9% lower than that of Q235. Therefore, increasing the shear strength of the web can improve the bearing capacity of the beam, but, to a certain extent, it will reduce the deformation capacity of the beam. It is worth noting that, compared to the strength of the damage-control fuse, the shear web strength has a relatively small effect on the beam.

6.6. Effect of Axial Compression Ratio of Columns

The results of the numerical simulation shown in Figure 32 reveal that the axial compression ratio significantly affects the load–displacement behavior of the demountable beam–column joints. In the elastic stage, larger axial compression ratios correspond to greater initial stiffness. In the elastic–plastic stage, an increase in the axial compression ratio reduces the column stiffness degradation and improves the ultimate bearing capacity. This is due to the axial load’s inhibitory effect on the surface and internal crack development of the column, which strengthens crack suppression with higher axial loads. Figure 33a shows that as the axial compression ratio increases from 0 to 0.5, and the ultimate bearing capacity gradually rises from 61.23 kN to 91.36 kN, indicating a 49.2% increase. Figure 33b illustrates that the ductility coefficient decreases with the increasing axial compression ratio, declining by 16.3% from 7.55 to 6.32 at an axial compression ratio of 0 and 0.5, respectively.
Figure 34 illustrates the stress distribution in concrete columns subjected to various axial compression ratios. The core area of concrete exhibits lower stress levels, likely due to the increased overall stiffness resulting from the embedded steel members at the column ends. The stress within the columns rises as the axial compression ratio increases, with shear cracks predominantly propagating across the core area rather than vertically or in a single direction. Within the elastic range, no plastic strain is observed. Figure 35 shows the compression damage of the concrete columns under different axial compression ratios, revealing a compressive damage value of 0, and thus indicating an undamaged elastic state. This outcome validates the success of the damage-control design employed in this model.

7. Conclusions

In this work, a new type of RC beam–column joint with a damage-control fuse is proposed. First, the effectiveness of the finite element method is verified by comparing the failure modes and hysteretic curves to those of a cast-in-place joint. The ultimate bearing capacity and ductility coefficient of five different structural forms of energy-dissipation plates are analyzed. The theoretical design method of the bending distance of the energy-dissipation plates is proposed and verified using the finite element method. Finally, the effects of concrete strength, longitudinal reinforcement ratio, energy-dissipation plate thickness and strength, shear web strength, and axial compression ratio on the ultimate bearing capacity and ductility of demountable joints are analyzed. The following conclusions can be drawn:
(1) A finite element model of the demountable and cast-in-place joints is proposed. The simulation results are compared with the experimental results. The hysteresis curves of the two sets of results are in good agreement and show the same failure mode;
(2) The joints of five different structural forms of damage-control fuses (arc notch, noncutting, triangular notch, circular notch, and inner circular notch) have good seismic performance. The finite element analysis results show that the arc notch accelerates the yield of the fuse and has a good ability to protect the main structure. The ductility coefficient of the cast-in-place joints is the lowest, while the ductility coefficient of the joint with the inner-circular structure is the highest. Compared to the cast-in-place joint, the demountable joints show a higher stiffness-degradation rate due to the existence of the energy-dissipation plate, which limits the development of concrete cracks in the core area of the joints to a certain extent;
(3) The proposed damage-control fuse meets the bending moment requirement at the weakened section. This study simulated and validated various structural forms of the fuse. Under identical conditions, J2 has the highest simulated bending moment, while J4 has the lowest. The axial compression ratio is the most influential parameter, while web steel strength has the least impact on bending moment;
(4) Among the key factors analyzed for seismic performance, the longitudinal reinforcement ratio influences the bearing capacity the most. Ductility is affected by damage-control fuse yield strength and reinforcement ratio. Increasing the fuse thickness, strength, and shear web strength improves capacity but reduces ductility. A higher reinforcement ratio enhances both capacity and ductility;
(5) Increasing the concrete strength and axial compression ratio increases the bearing capacity of the joints and reduces their ductility;
(6) The concrete in the core area of the demountable joints shows a low stress level, and the concrete column is not damaged under different axial compression ratios, indicating that the joints with an energy-dissipation plate achieve the purpose of damage control of concrete columns.

Author Contributions

Methodology, W.L.; Conceptualization, Y.C.; software, H.-T.F. and H.-M.J.; investigation, Y.C.; resources, W.L.; data curation, H.-T.F.; writing—review and editing, H.-M.J.; visualization, W.L. and Y.C.; project administration, W.L. All authors have read and agreed to the published version of the manuscript.

Funding

National Natural Science Foundation of China (NSFC) [Grant No. 52208030 and 51308419], Zhejiang Province Public Welfare Technology Application Research Project (No. LGF22E080004), and Wenzhou Association for Science and Technology (No. kjfw34).

Data Availability Statement

Data are contained within the article.

Conflicts of Interest

The authors declare no conflict of interest.

References

  1. Technical Specification for Precast Concrete Structures: JGJ1-2014; China Architecture & Building Press: Beijing, China, 2014. (In Chinese)
  2. Li, Y.; Xie, D.N.; Chen, S.C.; Zhou, H.Y.; Wang, P. Present research and analysis on the seismic performance of precast concrete structures. Archit. Technol. 2015, 46, 261–265. (In Chinese) [Google Scholar]
  3. Zhai, C.H.; Liu, W.; Xie, L.L. Progress of research on city seismic resilience evaluation. J. Build. Struct. 2018, 39, 1–9. (In Chinese) [Google Scholar]
  4. Kurama, Y.C.; Sritharan, S.; Fleischman, R.B.; Restrepo, J.I.; Henry, R.S.; Cleland, N.M.; Ghosh, S.K.; Bonelli, P. Seismic-Resistant precast concrete structures: State of the Art. J. Struct. Eng. 2018, 144, 03118001. [Google Scholar] [CrossRef]
  5. Choi, H.K.; Bae, B.; Choi, Y.C. Behaviour of Precast Concrete Beam-Column Connections Using Steel Plate and ECC. Adv. Sci. Lett. 2012, 14, 262–268. [Google Scholar] [CrossRef]
  6. Banisheikholeslami, A.; Behnamfar, F.; Ghandil, M. A beam-to-column connection with visco-elastic and hysteretic dampers for seismic damage control. J. Constr. Steel Res. 2016, 117, 185–195. [Google Scholar] [CrossRef]
  7. Lin, X.C.; Chen, Y.A.; Yan, J.B.; Hu, Y.Y. Seismic Behavior of Welded Beam-to-Column Joints of High-Strength Steel-Moment Frame with Replaceable Damage-Control Fuses. J. Struct. Eng. 2020, 146, 04020143. [Google Scholar] [CrossRef]
  8. Yan, J.B.; Chen, Y.A.; Lin, X.C. Finite element analysis and parametric studies on hysteretic behaviours of high strength steel T-joints with damage-control fuses. Thin-Walled Struct. 2019, 148, 106574. [Google Scholar] [CrossRef]
  9. Li, W.; Ye, H.; Wang, Q.; Liu, H.J.; Ding, T.; Liu, B. Experimental study on the seismic performance of demountable RCS joints. J. Build. Eng. 2022, 49, 104082. [Google Scholar] [CrossRef]
  10. Parastesh, H.; Hajirasouliha, I.; Ramezani, R. A new ductile moment-resisting connection for precast concrete frames in seismic regions: An experimental investigation. Eng. Struct. 2014, 70, 144–157. [Google Scholar] [CrossRef]
  11. Calado, L.; Proenca, J.M.; Espinha, M.; Castiglioni, C.A. Hysteretic behaviour of dissipative bolted fuse for earthquake resistant steel frames. J. Constr. Steel Res. 2013, 85, 1151–1162. [Google Scholar] [CrossRef]
  12. Latour, M.; D’Aniello, M.; Zimbru, M.; Rizzano, G.; Piluso, V.; Landolfo, R. Removable friction dampers for low-damage steel beam-to-column joints. Soil Dyn. Earthq. Eng. 2018, 115, 66–81. [Google Scholar] [CrossRef]
  13. Li, W.; Xiong, J.G.; Wu, L.J.; Yang, K.J. Experimental study and numerical analysis on seismic behavior of composite RCS frames. Struct. Concr. 2020, 21, 2044–2065. [Google Scholar] [CrossRef]
  14. Liu, Y.B. Experimental Study on Seismic Behavior of Steel Frame Beam-Column Joints with Replaceable Buckling Restraint Dissipators; Hefei University of Technology: Hefei, China, 2020. [Google Scholar]
  15. Yan, G.Y.; Yu, Y.S.; Wu, Y.X.; Zheng, L.Q.; Xue, P.R. Experimental study on seismic performance of recoverable prefabricated damage-controllable steel joints. China Civ. Eng. J. 2021, 54, 87–100. (In Chinese) [Google Scholar]
  16. Ma, Z.H.; Zhang, J.G.; Liang, H.Z.; Li, L.Y. Numerical simulation of Low cycle reciprocating test for assembled artificial energy dissipation Plastic Hinge points. China Civ. Eng. J. 2020, 53, 162–168. (In Chinese) [Google Scholar]
  17. Lu, Z.; Huang, J.; Dai, S.; Liu, J.; Zhang, M. Experimental study on a precast beam-column joint with double grouted splice sleeves. Eng. Struct. 2019, 199, 109589. [Google Scholar] [CrossRef]
  18. Lin, X.; Zhang, H.; Chen, H.; Lin, J. Field investigation on severely damaged aseismic buildings in 2014Ludian earthquake, Earthq. Eng. Eng. Vib. 2015, 14, 169–176. [Google Scholar] [CrossRef]
  19. Takanashi, K.; Miyazaki, K.; Yamazaki, K.; Shimura, Y. A new structural system using innovative high-strength steel aiming at zero earthquake damage. Struct. Eng. Int. 2010, 20, 66–71. [Google Scholar] [CrossRef]
  20. Lin, X.; Wu, K.; Skalomenos, A.K.; Lu, L.; Zhao, S. Development of a bucklingrestrained shear damper with demountable steel-concrete composite restrainers. Soil Dyn. Earthq. Eng. 2019, 118, 221–230. [Google Scholar] [CrossRef]
  21. Ricles, J.; Fisher, J.; Lu, L.-W.; Kaufmann, E. Developments of improved welded moment connections for earthquake-resistant design. J. Constr. Steel Res. 2002, 58, 565–604. [Google Scholar] [CrossRef]
  22. Chan, R.W.K.; Albermani, F.; Williams, M.S. Evaluation of yielding shear panel device for passive energy dissipation. J. Constr. Steel Res. 2009, 65, 260–268. [Google Scholar] [CrossRef]
  23. Valente, M.; Castiglioni, C.A.; Kanyilmaz, A. Welded fuses for dissipative beam-tocolumn connections of composite steel frames: Numerical analyses. J. Constr. Steel Res. 2017, 128, 498–511. [Google Scholar] [CrossRef]
  24. Koetaka, Y.; Chusilp, P.; Zhang, Z.; Ando, M.; Suita, K.; Inoue, K.; Uno, N. Mechanical property of beam-to-column moment connection with hysteretic dampers for columns weak axis. Eng. Struct. 2005, 27, 109–117. [Google Scholar] [CrossRef]
  25. JGJ/T101-2015; Specification for Seismic Test of Buildings. China Architecture & Building Press: Beijing, China, 2015. (In Chinese)
  26. ABAQUS User’s Manual; Version 6.10; Hibbit, Karlsson & Sorensen, Inc.: Pawtucket, RI, USA, 2014.
  27. GB50010-2010; Code for Design of Concrete Structures. China Architecture and Building Press: Beijing, China, 2010.
  28. Ma, Y.; Zhang, B.; Peng, A.; Wang, L. Experimental and analytical investigation on shear mechanism of steel-UHPC composite T-Perfobond shear connectors. Eng. Struct. 2023, 286, 116061. [Google Scholar] [CrossRef]
  29. Park, R. Ductility evaluation from laboratory and analytical testing. In Proceedings of the 9th World Conference on Earthquake Engineering, Tokyo, Japan, 2–9 August 1988; Volume 8, pp. 605–616. [Google Scholar]
  30. Karabini, M.; Rousakis, T.; Golias, E.; Karayannis, C. Seismic Tests of Full Scale Reinforced Concrete T Joints with Light External Continuous Composite Rope Strengthening—Joint Deterioration and Failure Assessment. Materials 2023, 16, 2718. [Google Scholar] [CrossRef]
  31. Chen, S.M.; Jiang, J.M.; Jia, L.J. Numerical study on the performance of beam-to-concrete-filled steel tube column joint with adapter-bracket. Adv. Struct. Eng. 2017, 21, 1542–1552. [Google Scholar] [CrossRef]
Figure 1. New demountable RC beam–column joints: (a) precast concrete column; (b) precast concrete beam; and (c) demountable beam–column joints with seismic resilience.
Buildings 14 00020 g001
Figure 2. Geometric dimensions and construction of joints (in mm): (a) details of BCJ-C [17], and (b) details of J1.
Buildings 14 00020 g002
Figure 3. Test setup.
Buildings 14 00020 g003
Figure 4. Loading protocol.
Buildings 14 00020 g004
Figure 5. Developed FE models of joints: (a) demountable joint and (b) monolithic joint.
Buildings 14 00020 g005
Figure 6. Uniaxial stress–strain curve of concrete.
Buildings 14 00020 g006
Figure 7. Stress–strain relationship of steel.
Buildings 14 00020 g007
Figure 8. Boundary conditions of the model.
Buildings 14 00020 g008
Figure 9. Overall meshing of the joint specimens.
Buildings 14 00020 g009
Figure 10. Verification of the finite element model: (a) the failure mode of the overall joint BCJ-C [17] and (b) comparison of the hysteresis curves between the experimental test and finite element simulation.
Buildings 14 00020 g010aBuildings 14 00020 g010b
Figure 11. Stress cloud diagram of different structural forms of damage-control fuses: (a) arc-notch damage-control fuse J1; (b) noncutting damage-control fuse J2; (c) triangular-notch damage-control fuse J3; (d) circular-notch damage-control fuse J4; and (e) inner-circular-notch damage-control fuse J5.
Buildings 14 00020 g011aBuildings 14 00020 g011b
Figure 12. Influence of different structural forms of damage-control fuses on the load–displacement performance of demountable beam–column joints.
Buildings 14 00020 g012
Figure 13. Load displacement and yield displacement of specimens: (a) definition of load displacement and (b) definition of yield displacement.
Buildings 14 00020 g013
Figure 14. Effect of damage-control fuses with different structural forms on ductility.
Buildings 14 00020 g014
Figure 15. Stiffness-degradation curve.
Buildings 14 00020 g015
Figure 16. Energy-dissipation curves of joints.
Buildings 14 00020 g016
Figure 17. Critical sections of a joint.
Buildings 14 00020 g017
Figure 18. The middle-weakened part of arc-notch damage-control fuse J1: (a) effective cross-sectional slope map; (b) top view of the joint; and (c) perspective of the joint.
Buildings 14 00020 g018
Figure 19. The middle-weakened part of noncutting damage-control fuse J2: (a) effective cross-sectional slope map and (b) top view of the joint.
Buildings 14 00020 g019
Figure 20. The middle-weakened part of circular-notch damage-control fuse J4: (a) effective cross-sectional slope map and (b) top view of the joint.
Buildings 14 00020 g020
Figure 21. Bending moment at the b-b section of the middle-weakened part of three different damage-control fuses: (a) intermediate bending moment of J1; (b) intermediate bending moment of J2; and (c) intermediate bending moment of J4.
Buildings 14 00020 g021
Figure 22. Effect of concrete strength on load–displacement performance of demountable beam–column joints.
Buildings 14 00020 g022
Figure 23. Effect of concrete strength: (a) effect of concrete strength on bearing capacity and (b) effect of concrete strength on ductility.
Buildings 14 00020 g023
Figure 24. Effect of longitudinal reinforcement ratio on load–displacement performance of demountable beam–column joints.
Buildings 14 00020 g024
Figure 25. Effect of longitudinal reinforcement ratio: (a) effect of longitudinal reinforcement ratio on bearing capacity and (b) effect of longitudinal reinforcement ratio on ductility.
Buildings 14 00020 g025aBuildings 14 00020 g025b
Figure 26. Effect of damage-control fuse thickness on load–displacement performance of demountable beam–column joints.
Buildings 14 00020 g026
Figure 27. Effect of damage-control fuse thickness: (a) effect of damage-control fuse thickness on bearing capacity and (b) effect of damage-control fuse thickness on ductility.
Buildings 14 00020 g027
Figure 28. Effect of damage-control fuse strength on load–displacement performance of demountable beam–column joints.
Buildings 14 00020 g028
Figure 29. Effect of damage-control fuse strength: (a) effect of damage-control fuse strength on bearing capacity and (b) effect of damage-control fuse strength on ductility.
Buildings 14 00020 g029aBuildings 14 00020 g029b
Figure 30. Effect of shear web strength on load–displacement performance of demountable beam–column joints.
Buildings 14 00020 g030
Figure 31. Effect of shear web strength: (a) effect of shear web strength on bearing capacity and (b) effect of shear web strength on ductility.
Buildings 14 00020 g031aBuildings 14 00020 g031b
Figure 32. Effect of axial compression ratio on load–displacement performance of demountable beam–column joints.
Buildings 14 00020 g032
Figure 33. Effect of axial compression ratio: (a) effect of axial compression ratio on bearing capacity and (b) effect of axial compression ratio on ductility.
Buildings 14 00020 g033
Figure 34. Stress state of concrete columns under different axial compression ratios.
Buildings 14 00020 g034
Figure 35. Compression damage of concrete columns under different axial compression ratios.
Buildings 14 00020 g035
Table 1. Parameter values of uniaxial tensile stress–strain curve of concrete.
f t , r N / m m 2 1.01.522.533.54
ε t , r 10 6 658195107118128137
α t 0.310.701.251.952.813.825.00
Table 2. Parameter values of stress–strain curve of concrete under uniaxial compression.
Parameter Strength   of   Concrete   N / m m 2
f c , r 20253035404550556065707580
ε c , r 10 6 1470156016401720179018501920198020302080213021902240
α c 0.741.061.361.651.942.212.482.743.003.253.503.753.99
ε c u ε c , r 3.02.62.32.12.01.91.91.81.81.71.71.71.6
Table 3. Steel parameters.
Component NameName of Material f y (MPa) f u (MPa) E s (GPa)
Longitudinal barHRB400428569198
StirrupHRB400431580200
Other steel membersQ390390490200
Note: fy denotes the yield stress of steel, fu denotes the tensile strength of steel, and Es denotes the elastic modulus of steel.
Table 4. The meshing of each component for the joint models.
Part NameElement TypeDelineation TechniqueElement NumberMesh Size
ColumnC3D8RStructured, sweep49280
BeamC3D8RStructured, sweep12080
H-shaped steel at the column endC3D8RStructured180520
H-shaped steel at the beam endC3D8RStructured11,96020
Energy dissipation plateC3D8RStructured109210
Bolt 1C3D8RStructured1765
Bolt 2C3D8RStructured5845
Shear webC3D8RStructured114410
Table 5. Comparison of bending moment and required bending moment of three kinds of damage-control fuses (bending moment unit: kN·m).
NameMT-y MT-PMS-PDifferenceMyMuYes or No
J1305.9367.1500.426.6%549.6612.2Yes
J2336.9404.3543.325.6%Yes
J4287.1344.5499.631.0%Yes
Note: Name denotes the name of the damage-control fuses; MT-y denotes the theoretical yield bending moment; MT-P denotes the theoretical plastic bending moment; MS-P denotes the simulated plastic bending moment; difference denotes the difference between the theoretical and simulated plastic bending moments; My denotes the yield bending moment of the beam-end section; Mu denotes the ultimate bending moment of the beam-end section; and yes denotes that the theoretical plastic bending moment is less than the theoretical yield bending moment at the beam end.
Table 6. The influence of different steel strengths on the bending moment in the middle of a damage-control fuse (bending moment unit: kN·m).
d-c-f-s (MPa)MT-yMT-PMS-PDifferenceMy MuYes or No
345270.6324.7486.933.3%374.6449.5Yes
390305.9367.1500.426.6%423.5508.2Yes
460360.8433.0538.319.6%499.7599.6Yes
Note: d-c-f-s denotes the damage-control fuse strength; MT-y denotes the theoretical yield bending moment; MT-P denotes the theoretical plastic bending moment; MS-P denotes the simulated plastic bending moment; difference denotes the difference between the theoretical and simulated plastic bending moments; My denotes the yield bending moment of the beam-end section; Mu denotes the ultimate bending moment of the beam-end section; and yes denotes that the theoretical plastic bending moment is less than theoretical yield bending moment at the beam end.
Table 7. The influence of different web steel strengths on the bending moment in the middle of a damage-control fuse (bending moment unit: kN·m).
s-w-s (MPa)MT-y MT-P MS-PDifference MyMuYes or No
345305.9367.1500.426.6%549.6612.2Yes
390500.426.6%Yes
460500.426.6%Yes
Note: s-w-s denotes the shear web strength; MT-y denotes the theoretical yield bending moment; MT-P denotes the theoretical plastic bending moment; MS-P denotes the simulated plastic bending moment; difference denotes the difference between the theoretical and simulated plastic bending moments; My denotes the yield bending moment of the beam-end section; Mu denotes the ultimate bending moment of the beam-end section; and yes denotes that the theoretical plastic bending moment is less than theoretical yield bending moment at the beam end.
Table 8. Influence of different concrete strengths on the bending moment in the middle of a damage-control fuse (bending moment unit: kN·m).
c-s (MPa)MT-yMT-PMS-PDifferenceMyMuYes or No
C25305.9367.1507.227.6%549.6612.2Yes
C40500.426.6%Yes
C55564.034.9%Yes
Note: c-s denotes the concrete strength; MT-y denotes the theoretical yield bending moment; MT-P denotes the theoretical plastic bending moment; MS-P denotes the simulated plastic bending moment; difference denotes the difference between the theoretical and simulated plastic bending moments; My denotes the yield bending moment of the beam-end section; Mu denotes the ultimate bending moment of the beam-end section; and yes denotes that the theoretical plastic bending moment is less than theoretical yield bending moment at the beam end.
Table 9. Effect of different axial compression ratios on the bending moment in the middle of the damage-control fuse (bending moment unit: kN·m).
a-c-rMT-yMT-PMS-PDifferenceMyMuYes or No
0.1305.9367.1607.339.6%549.6612.2Yes
0.3500.426.6%Yes
0.5435.215.6%Yes
Note: a-c-r denotes the axial compression ratio; MT-y denotes the theoretical yield bending moment; MT-P denotes the theoretical plastic bending moment; MS-P denotes the simulated plastic bending moment; difference denotes the difference between the theoretical and simulated plastic bending moments; My denotes the yield bending moment of the beam-end section; Mu denotes the ultimate bending moment of the beam-end section; and yes denotes that the theoretical plastic bending moment is less than the theoretical yield bending moment at the beam end.
Disclaimer/Publisher’s Note: The statements, opinions and data contained in all publications are solely those of the individual author(s) and contributor(s) and not of MDPI and/or the editor(s). MDPI and/or the editor(s) disclaim responsibility for any injury to people or property resulting from any ideas, methods, instructions or products referred to in the content.

