Article

Investigating the Mechanical Deterioration Effect of Hard Sandstone Induced by Layer Structure under Uniaxial Compression

1
School of Civil Engineering, Yancheng Institute of Technology, Yancheng 224051, China
2
School of Civil Engineering, Xi’an University of Architecture and Technology, Xi’an 710055, China
3
Shaanxi Key Laboratory of Geotechnical and Underground Space Engineering, Xi’an 710055, China
4
Yancheng Institute of Architectural Design Co., Ltd., Yancheng 224051, China
5
School of Civil Engineering, Southeast University, Nanjing 211189, China
*
Authors to whom correspondence should be addressed.
Buildings 2024, 14(1), 51; https://doi.org/10.3390/buildings14010051
Submission received: 22 November 2023 / Revised: 18 December 2023 / Accepted: 22 December 2023 / Published: 24 December 2023
(This article belongs to the Section Building Structures)

Abstract

:
The deterioration of the surrounding rock at the tunnel bottom is a damage mechanics issue that occurs under disturbance load. To investigate the anisotropic characteristics of mechanical behavior and the AE response mechanism of layered sandstone, uniaxial compression tests and acoustic emission (AE) monitoring were conducted. The results show that the layer structure causes remarkable anisotropic characteristics in the wave velocities. The strain characteristics and mechanical parameters of layered sandstone exhibit obvious deterioration effects. The local strain and overall strain show a synergistic feature, with the local strain path being more complex and the deformation response being extremely sensitive. The peak stress and elastic modulus both exhibit V-type distribution rules, slowly decreasing first, then rapidly decreasing, and finally increasing rapidly, with the boundary points of the layer angle being 45° and 67.50°. The peak stress and elastic modulus show a nonlinear exponential correlation with the layer angle, and the sandstone belongs to the intermediate anisotropy level. The rupture pattern shows significant anisotropic characteristics, with the failure modes including tension failure, including tension failure I and tension failure Ⅱ, shear failure, and tension–shear composite failure. The fractal dimension shows a negative correlation with the layer deterioration effect. The AE activity exhibits a phased response characteristic to the aging deformation of layer structure. The more obvious the layer deterioration effect is, the longer the AE delay is. The AE intensity of tensile failure sandstone is generally greater than that of oblique shear failure.

1. Introduction

The Western Development Strategy in China has led to the construction of numerous engineering projects in sedimentary rock formations. As a result, numerous tunnels have been constructed in sedimentary rock [1,2,3,4,5,6]. Sedimentary rocks are characterized by their layered structure resulting from geological diagenesis, which induces anisotropic physical and mechanical properties due to weak interlayer bonding [7,8,9,10,11]. The tunnel deformation and surrounding rock cracking caused by the uncoordinated deformation of sedimentary rock occur frequently, particularly instability caused by the layer structure, which significantly impacts the durability of tunnel structures [12,13,14,15,16,17]. To improve the construction efficiency, it is necessary to understand the deformation characteristics and deterioration mechanisms of sedimentary rock. Geotechnical engineering and investigating the stability of engineering rock masses have become a research hot spot in the past few years [18,19,20].
Various experiments have been conducted to understand the micromechanical characteristics of sedimentary rocks in special environments such as tunnels [21,22,23,24]. For instance, Liu et al. [25] and Zuo et al. [26] investigated the mechanical properties of rock–coal–rock and coal–rock composite bodies, highlighting the directional evolution of deformation cracks and the overall strength dependence on the soft rock. Cho et al. [13] explored the deformation mechanism and macroscopic destruction criteria of composite rocks made up of limestone, sandstone, and mudstone and analyzed the anisotropic deformation and strength. Li et al. [27] revealed the anomalous strain behavior originating from the deformation of combined rock samples. Wang et al. [28] explored the correlation between post-peak stress and rock inclination of composite rock. Tien et al. [10] analyzed the impact of rock inclination on the deformation characteristics and failure mode of layered rock. Zeng et al. [29] found that the destructive forms of the layer may vary significantly, and the dislocation between soft and hard layers reflects the uncoordinated deformation of the layered rock. Zhang et al. [30,31] explored the mechanical parameters and rupture response characteristics of samples using the acoustic emission characteristics and obtained warning information.
Studies show that the deformation of sedimentary rock is influenced by both the bearing effect and the layer deterioration effect. Attewell et al. [32] studied the anisotropy of key mechanical indicators of shale. Furthermore, Wasantha et al. [33] analyzed the rupture pattern and structural tendency effect of layered sandstone. The analyses revealed that compared to single-layered rocks, the stratigraphic structure plays a crucial role in the stability of the sedimentary rock. This is especially more pronounced in the deterioration of mechanical properties. Changes in rock structure and internal stress redistribution can easily trigger the dislocation behavior of rock strata, leading to the shear slipping, tensile splitting, or pressure rod instability of sedimentary rocks [22,23]. It is worth noting that sedimentary rock strata, which cover 75% of the land area, are closely linked to engineering activities. It is of significant importance to fully understand the layer deterioration effect of sedimentary rocks in complex stress environments. With the rapid development of underground engineering, surrounding rock cracking frequently occurs due to the uncoordinated deformation of sedimentary rocks [34,35,36,37,38]. Chen et al. [39] studied the expansion and rheological mechanism of carbon slate in large deformations in Yuanbaoshan Tunnel.
These studies highlight the significant influence of lithology and structure caused by geological deposition on the deformation of tunnel surrounding rock and the expansion effect of the tunnel inverted arch and lining structure [40]. With the rapid development of underground engineering, tunnel deformation and surrounding rock cracking frequently occur due to the uncoordinated deformation of sedimentary rocks. For example, this problem occurred in the Guangzhao and Gangwu tunnels of the Shanghai–Kunming railway and the Maotianshan tunnel of the Baohe railway, resulting in bottom structure deformation and lining crack damage. The stress environment of the sedimentary rock at the tunnel bottom is more complicated compared with the tunnel crown or walls [3,4,37]. Despite having a saturation bearing strength greater than 30 MPa, sedimentary hard rock often experiences deformation disasters with the development of underground engineering. Therefore, this paper mainly focuses on the mechanical deterioration characteristics of the natural sedimentary hard rock mass at the tunnel bottom to reveal the expansion deformation characteristics of the sedimentary hard rock. Therefore, the mechanical deterioration effect of sedimentary hard rocks should be further investigated. The acoustic test, fracture instability test, and acoustic emission test under uniaxial load were performed. Then, the influence of layer structure on mechanical parameters and acoustic response characteristics was analyzed. The main objective of the present study was to reveal the mechanical deterioration mechanism of sedimentary rock.

2. Materials and Methods

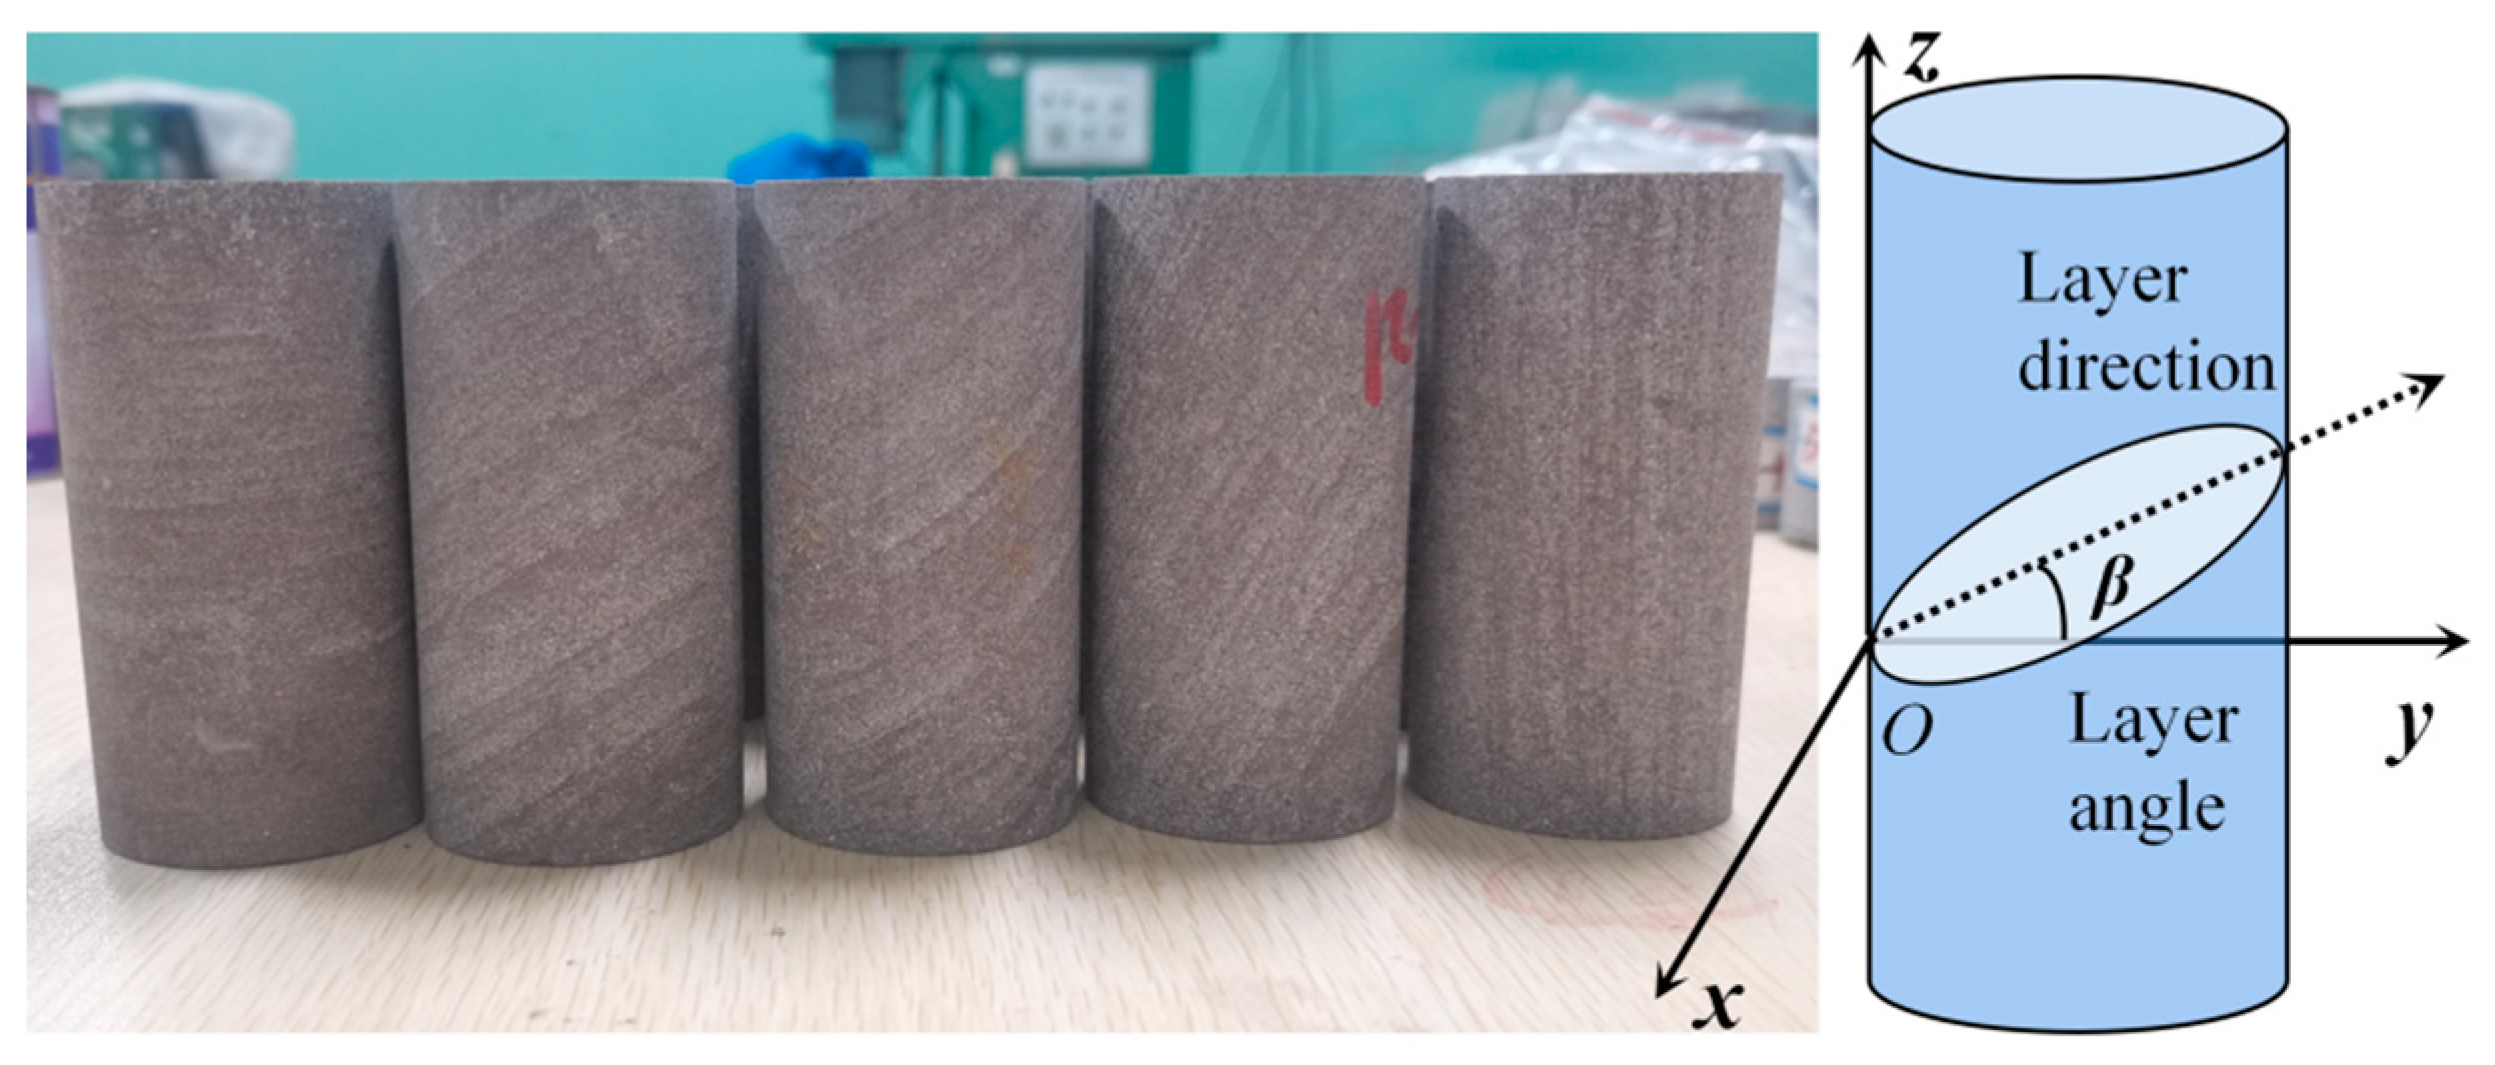
2.1. Sample Preparation

The hard-layered sandstone was obtained from a tunnel project in the Chengdu area, China. The rock mass was cut into 300 mm × 300 mm × 300 mm cubic blocks on the engineering site, and 50 mm × 100 mm standard samples were made using a water knife. The samples were prepared according to the requirements of the ISRM Test Procedure of the International Society of Rock Mechanics. To reduce testing errors caused by stress concentration, the non-parallelism degree of the coring diameter and end surface was maintained at less than 0.20 mm and 0.05 mm, respectively. Figure 1 shows the standard sandstone samples and a schematic layer structure. To study different sedimentary samples, numerous layer angles (β) (0°, 22.50°, 45°, 67.50°, and 90°) with a layer angle error of ±0.50° were studied. An acoustic meter was used to measure the longitudinal and transversal waves, and the average velocities of the longitudinal and secondary waves were in the range of 3.63–4.09 km/s and 2.18–2.43 km/s, respectively.
An X-ray diffraction (XRD) test was performed on 200 orders of original rock powder to determine the mineral composition of the sandstone material. The diffraction pattern revealed that the mineral composition of the layered sandstone mainly comprised plagioclase (71%), quartz (10%), potassium feldspar (3%), calcite (4%), hematite (2%), vermiculite (4%), and serpentine (2%). The purplish color of the sandstone primarily originates from the presence of hematite. Furthermore, a Scanning Electron Microscope (SEM) test was conducted on the sample fracture. The SEM-EDS energy spectrum in Figure 2 indicates that the sandstone minerals are primarily plagioclase (Na[AlSi3O8]), quartz (SiO2), and potassium feldspar (K2O·Al2O3·6SiO2), with little variation in mineral content. The SEM images show square, cluster, or circular mineral crystals mixed with microscopic pores, and mineral particles of different sizes are coupled by the cementing material. It should be indicated that the tightness of the mineral crystal arrangement and bonding force affected the physical and mechanical characteristics of the layered sandstone.

2.2. Experimental Equipment

Figure 3 shows that the experimental system consists of a stress loading system, a strain acquisition system, and an acoustic emission acquisition system, which monitors mechanical and acoustic emission parameters during the uniaxial compression failure process. The uniaxial compression test was conducted at the Key Laboratory of Geotechnical and Underground Space Engineering in Shaanxi Province, using an electro-hydraulic servo mechanics testing machine (Xi’an Lichuang Equipment Co., Xi’an, China). The machine had a maximum loading strength of 600 kN, load accuracy of ±5‰, and stress resolution of 0.10 kN. The tested strain accuracy was 0.0001, and the deformation measurement range was ±10 mm.
To obtain the characteristics of mineral energy spectrum distribution of siltstone, the SEM test of layered sandstone was performed at the Testing Center of Northwestern University, utilizing a field-emission SEM (ZEISS-Sigma 300, Berlin, Germany) with a resolution of 1 nm@30 kV, magnification ranging from 10 to 1,000,000, and a storage resolution of 32 k × 24 k pixels. The X-ray diffraction (XRD) test equipment was an UltimanIV combined multi-function high-resolution X-ray diffraction instrument that featured a maximum output of 2 kW, a scan range of 0.50–159, a minimum step of 0.0001°, and an angle reproducibility of 0.0001°. Moreover, a multi-channel acoustic emission monitor (SAEU2S-1016-4, Beijing Shenghua Industrial Technology Co., LTD, Beijing, China) was used as an acoustic emission system capable of acquiring data at a frequency of up to 10 MHz and an acquisition accuracy of 16 bits. During the experiments, acoustic emission (AE) counts, AE energy, and AE amplitude were measured to analyze rupture in rock samples.

2.3. Experimental Procedure

The standard for rock mechanics testing has not been unified yet [41,42]. The loading control methods in the United States and Japan are mainly based on loading time, with rupture typically occurring within 60–450 s. Other countries generally follow the “International Society of Rock Mechanics’ loading control” method. Referring to the Hydropower Engineering Rock [30,31], the stress control method is used in this article, and the loading rate was set to 0.25 kN/s. The test procedure includes the following steps: The layered sandstone was air-dried at 25 °C for 48 h. The longitudinal and secondary wave velocities were measured, and then the samples were labeled and grouped. The sandstone residues were ground into 200 orders, and XRD was performed to obtain the mineral composition of the layered sandstone. Furthermore, the SEM test was performed to obtain the SEM-EDS energy spectrum of the layered sandstone. Then, the difference in mineral composition was analyzed.
The sandstone surface was polished with sandpaper to reach a smooth end surface. Strain gauges were glued to the sandstone surface. The AE probe was fixed on the sandstone surface, and then the sample was assembled with the test machine. The AE acquisition threshold was set to 40 dB, and the sampling interval and frequency were 400 μs and 1000 kHz, respectively. The axial stress of 0.25 kN was preloaded on the sandstone sample to ensure close contact between the sandstone sample and the pressure head. The uniaxial compression test was conducted at a loading rate of 0.25 kN/s until the sandstone sample was destroyed.

3. Results and Discussion

3.1. Effects of Acoustic Characteristics

Figure 4 depicts the distribution of the longitudinal wave and transversal wave velocities of layered sandstone. It is observed that the layered structure induces significant wave velocities. Longitudinal wave velocities ranging from 3.63 to 4.09 km/s are positively correlated with the layer angle, which is consistent with previous findings [43]. Figure 4 also indicates that the transversal wave velocities are lower than the velocities of longitudinal waves, which range from 2.18 km/s to 2.42 km/s. Acoustic wave theory in rock mass suggests that the increase in wave velocity is closely related to the layer structure. The propagation direction of elastic waves is almost perpendicular to the bedrock structure and weak surface of the layer when the layer angle is between 0° and 22.50°. Meanwhile, the transparent reflection phenomenon between rock strata is significant. As a result, the attenuation degree of wave energy is large, leading to small wave velocities of both the longitudinal and transversal waves. However, it should be noted that the wave velocity of the 22.50° sample is abnormal, which may be attributed to the discrete characteristics of the layer structure. Xu et al. [43] reached a similar conclusion.
Furthermore, as the angle between the propagation direction of the elastic wave and the bedrock structure decreases, the layer angle increases to 45–67.50°, and the number of transverse reflections between rock strata reduces. The reduction in dissipation energy of the elastic wave increases the wave velocity. The elastic wave propagates parallel to the bedrock structure and the energy dissipation of the weak layer surface decreases when the layer angle is 90°. Consequently, the elastic wave is primarily transmitted through the bedrock, and both the longitudinal and secondary wave velocities of the layered sandstone reach their maximum value. To simplify the calculations, it is assumed that the elastic wave propagates while it is not affected by the boundary surface. The dynamic elastic modulus (Ed) and Poisson’s ratio (μd) can be expressed as follows:
μ d = V p 2 2 V s 2 2 ( V p 2 V s 2 ) ,
E d = ρ V p 2 ( 1 2 μ d ) ( 1 + μ d ) 1 μ d ,
where Vp and Vs are the longitudinal and transversal wave velocities, respectively.
Equations (1) and (2) indicate that as the layer angle increases from 0° to 22.50°, the dynamic elastic modulus decreases due to the significant layer structure effect. However, as the layer angle increases further to 67.50°, the dynamic elastic modulus reaches a minimum value of 6.79 Gpa due to the enhanced layer deterioration effect, which may lead to oblique shear deformation during loading. For sandstone with a layer angle of 90°, the compressive bar effect [5,35] is enhanced, resulting in a higher dynamic elastic modulus of 10.02 Gpa. The dynamic Poisson’s ratio also varies with the layer angle. Sandstone with a layer angle of 0° to 22.50° exhibits a smaller dynamic Poisson’s ratio due to the greater compression deformation compared to the expansion deformation. However, as the layer angle increases to 67.50°, the dynamic Poisson’s ratio increases due to the enhanced layer deterioration effect, leading to greater expansion deformation during loading. Sandstone with a layer angle of 90° exhibits the maximum dynamic Poisson’s ratio of 0.2384 due to the compressive bar effect.

3.2. Stress–Strain Response Characteristic

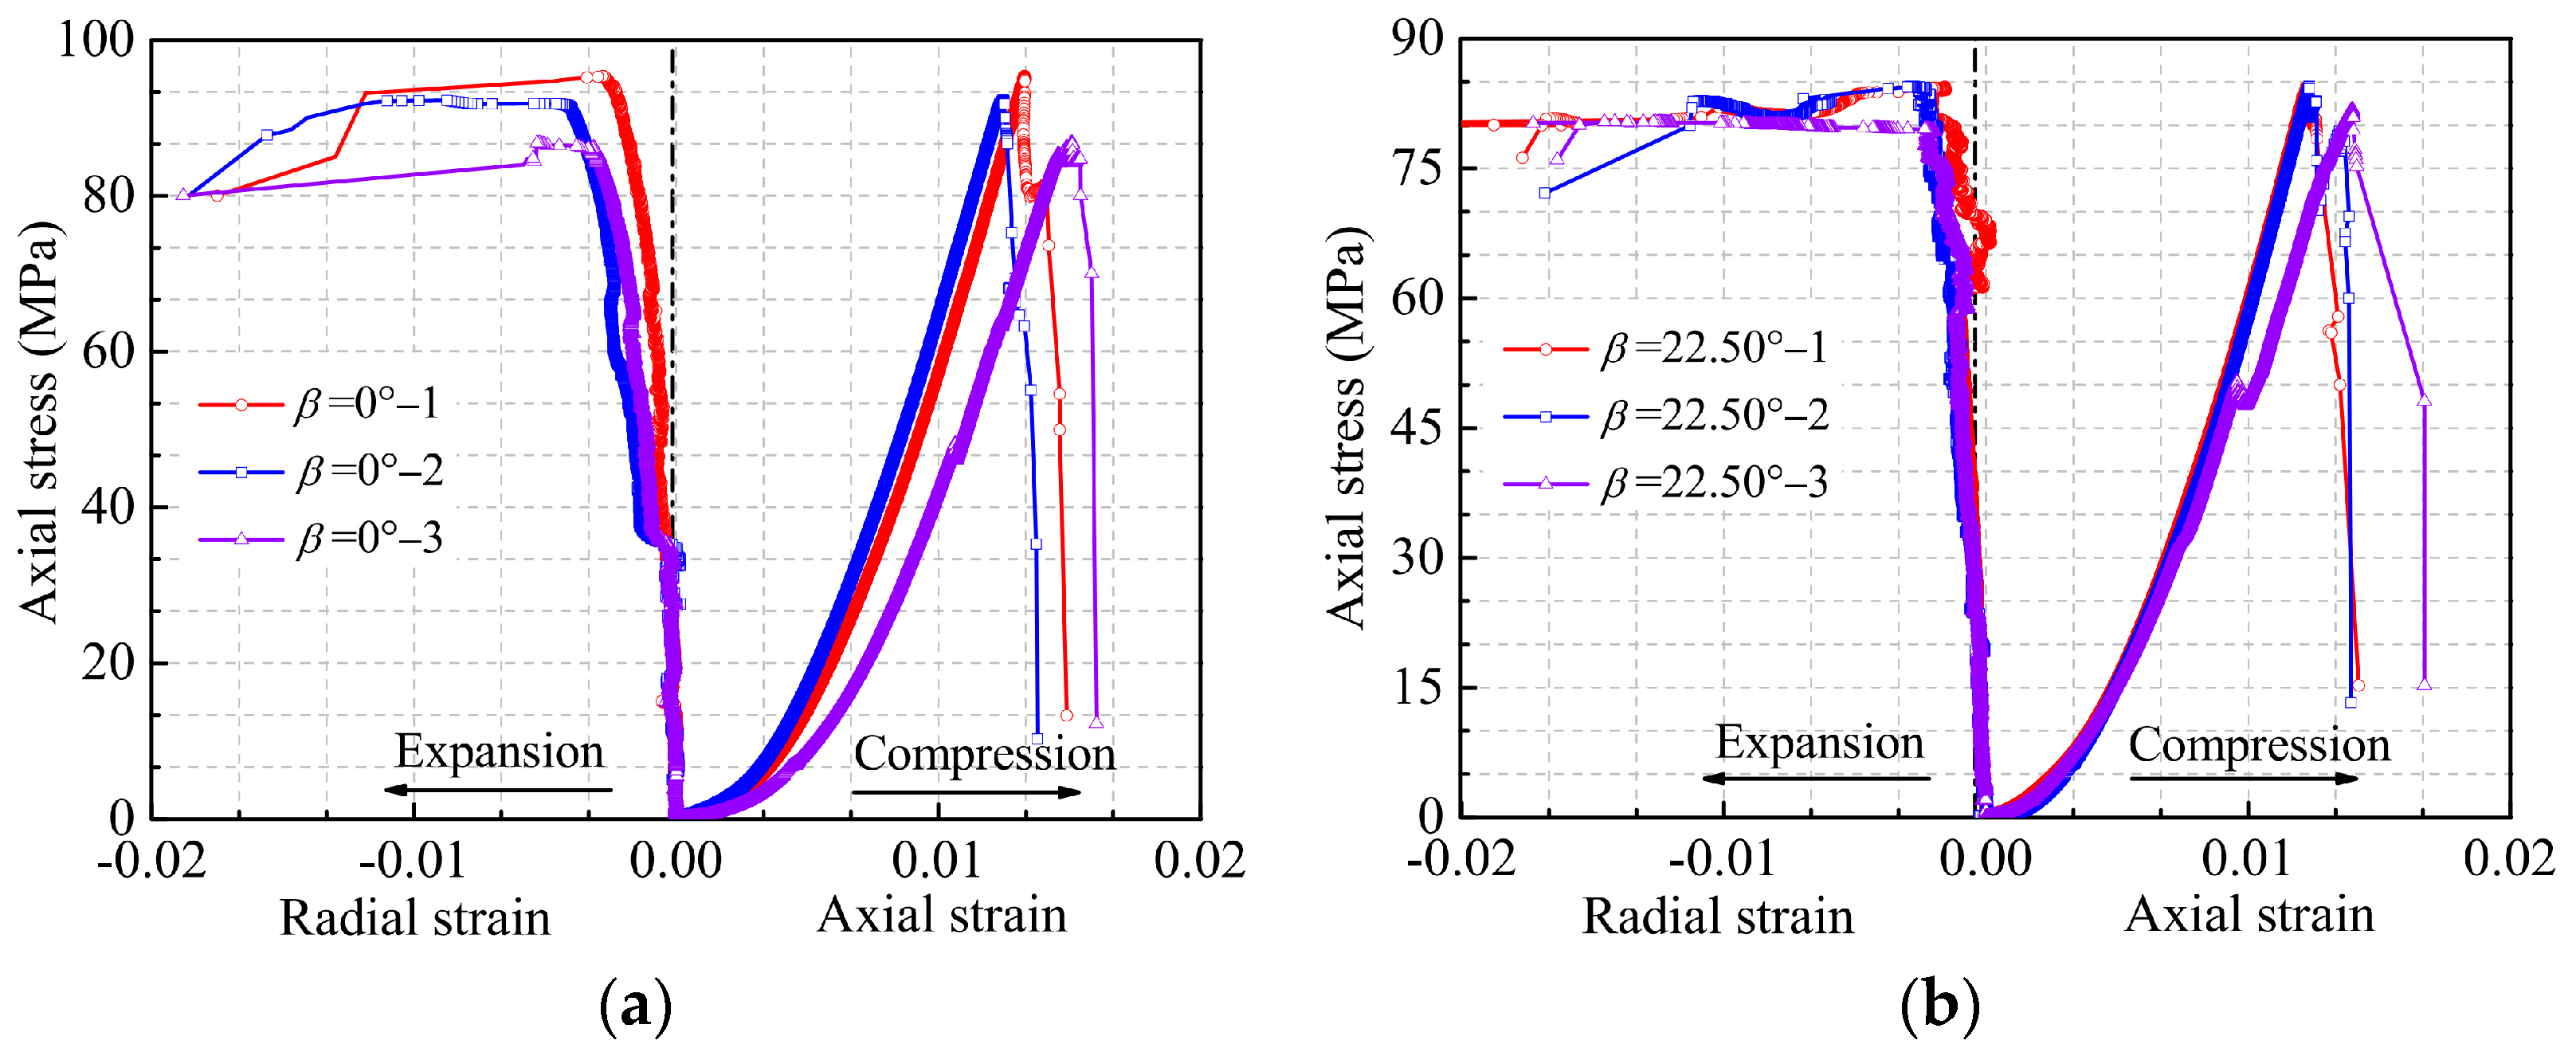
3.2.1. Stress–Strain Curves

Figure 5 presents the stress–strain curves for different layer angle sandstones; the mechanical parameters are summarized in Table 1. It is observed that the stress–strain curves of sandstones with similar layer structures have similar evolution paths, and the mechanical parameters are less discrete. However, the mechanical parameters of sandstones with different layer structures vary significantly, reflecting the anisotropic characteristics of the sedimentary structure. The stress–strain curves exhibit distinct stages of evolution, including the compaction stage (stage I), elastic deformation stage (stage II), plastic deformation stage (stage III), and post-peak failure stage (stage IV), as shown in Figure 5f.
Figure 5f illustrates that the initial stress loading results in the closure of internal native pores. The increasing slope of the stress–strain curve indicates that the sandstone enters the compaction stage (I stage). When the layer angle is between 0° and 22.50°, the radial deformation is constrained because the stress loading is approximately perpendicular to the layer structure. The radial stress–strain curves increase almost linearly, and there is no evident negative deflection. The concave degree of the stress–strain curve reflects the compaction degree of the layer structure [5,26], and the compaction deformation of 45–67.50° sandstones is significantly greater than that of 0–22.50° and 90° sandstones. The weak layer surface is compressed until the crack closure stress σcc is reached, and the sandstone is dominated by elastic deformation (stage Ⅱ). However, the existence of layer structures adjusts the rock structure, resulting in the uncoordinated deformation of the bedrock structure. Figure 5a–e shows that the 0°, 22.50°, 67.50°, and 90° sandstones have multiple stress drops at 55%σc, 61.48%σc, 47.86%σc, and 61.88%σc, respectively. The weak surface expands until it reaches the cracking stress σs, leading to cumulative damage and stiffness attenuation. The plastic deformation (stage III) becomes the dominant deformation, so the radial stress–strain curve deflects rapidly in a negative direction. This phenomenon reflects significant expansion deformation.
The cracking stress σs is negatively correlated with the layer deterioration effect. The cracking stresses of 0–90° are 66.60%σc, 66.34%σc, 62.77%σc, 47.56%σc, and 66.34%σc. This demonstrates that the layer structure leads to earlier damage evolution of 45–67.50° compared to 0–22.50° and 90°. When compared to the plastic deformation of soft rock [33,44,45,46], the stress–strain curve of hard sandstone lacks yield deformation. The layered sandstone exhibits progressive fracture, with significantly increasing stress drops. It also has significant brittle fracture characteristics, with the stress–strain curve (stage Ⅳ) yielding to the peak without obtaining residual strength after the peak.

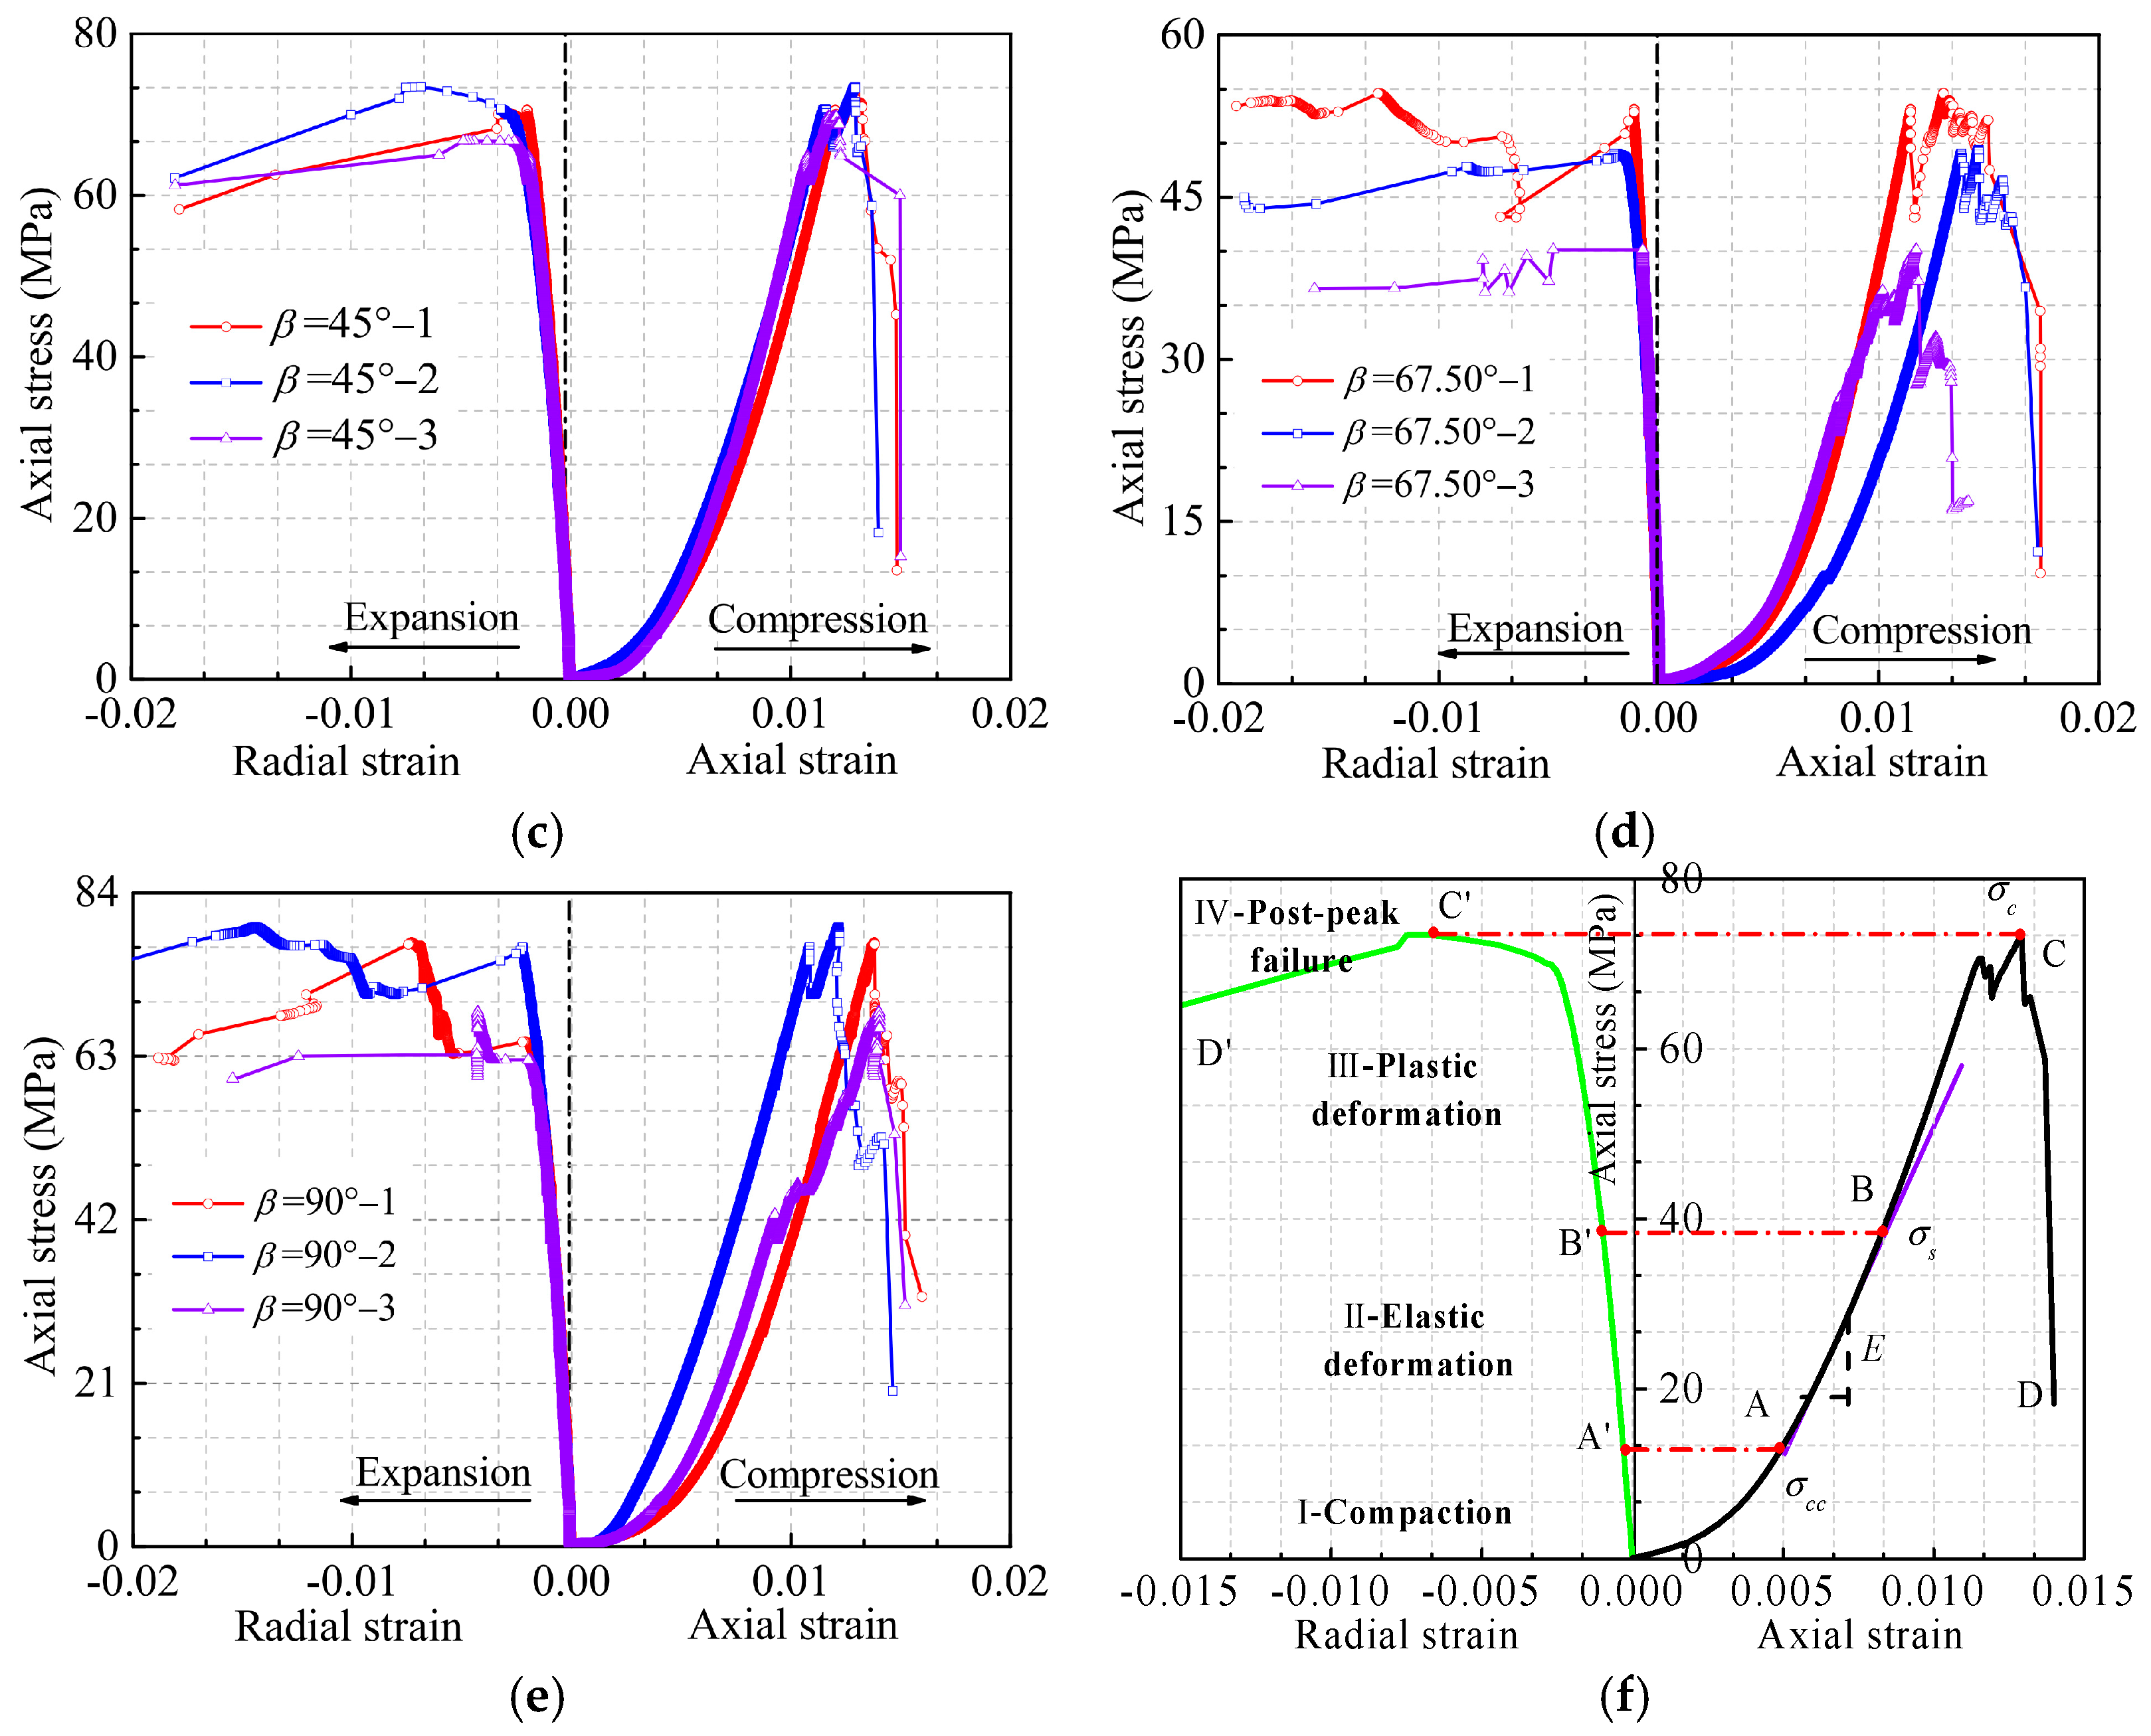
3.2.2. Local Strain–Time Curves

Figure 6 shows the strain–time curve of the layered sandstone, the green shadow in the figures represent the sudden change region in local strain. It is observed that the local and overall strains of layered sandstone are consistent. The strain–time curve consists of the compaction stage (oa and oe stages), elastic deformation stage (ab and ef stages), plastic deformation stage (bc and fg stages), and failure instability stage (cd and gh stage). The strain–time curve demonstrates nonlinear growth with fewer instances of local mutation of strain during the initial loading. The original fissures are progressively compressed, and the elastic deformation grows linearly. The strain rate and layer angle are negatively correlated, and the growth rate of the strain–time curve decreases. The results show that the most significant layer deterioration occurs in 67.50° sandstone, and its strain–time curve changes early from 161.24 s to 166.46 s. The plastic deformation stage sees a significant increase in strain mutation frequency. Wang et al. [28] and Li et al. [18] demonstrated that rock structure adjustment, crack propagation, and crack penetration occur in the internal structure during unstable plastic deformation. In the failure stage, the secondary pores continue to intersect, and the sliding of the weak layer leads to rapid expansion. The strain–time curve suddenly changes when the bearing capacity exceeds the peak strength.
The radial and axial strain–time curves exhibit cooperative evolution characteristics. During the compaction stage, the radial strain–time curve grows slowly, indicating weak expansion deformation of the sandstone sample due to initial loading. As the compaction stage changes to the elastic deformation stage, the sandstone enters a steady expansion deformation state. However, the slipping deformation of the local layer structure results in a sudden change in the radial strain during the plastic deformation stage. Figure 6 shows that the radial strain of 0–22.50° sandstones decreases, whereas that of 45–90° sandstones increases significantly. The sandstone with smaller layer angles mainly undergoes axial deformation, and the radial deformation is not noticeable. An increase in layer angle makes the sandstone more susceptible to inclined shear failure, thereby increasing the radial expansion deformation. It should be indicated that these results are consistent with the experimental data [27,28]. The layer structure of 90° sandstone and loading stress are parallel, resulting in the pressure rod effect that leads to the cracking of the weak surface.

3.3. Mechanical Parameter Characteristics

Table 1 shows that the peak stress and peak strain exhibit a significant layer deterioration effect. It is observed that as the layer angle increases, the corresponding peak stress decreases slowly, rapidly decreases, and finally increases abruptly, with demarcation points at 45° and 67.50°. The layer deterioration effect is not significant for 0° and 22.50° sandstones, with average peak stresses of 91.48 Mpa and 83.55 Mpa, respectively. However, the layer deterioration effect is enhanced for 45–67.50° sandstones, with average peak stresses decreased by 13.78% and 42.48% compared to that of 22.50° sandstone. The layer deterioration effect is significantly weakened for 90° sandstone, with the average peak stress 56.76% higher than that of 67.50° sandstone. As the layer angle increases, the average peak strain gradually decreases first and then increases, exhibiting a V-shaped distribution, which is consistent with empirical data [39,47]. Regression analysis indicates a good nonlinear exponential relationship between average peak stress, average peak strain, and layer angle.
The average elastic moduli of 0–45° sandstones are 9.72 Gpa, 9.67 Gpa, and 9.47 Gpa, and that of the 67.50° sandstone is reduced by 27.37%, 26.99%, and 25.45% compared to 0–45° sandstones, respectively. The average elastic modulus of 90° sandstone is increased by 32.01% compared to 67.50° sandstone. The deformation modulus and elastic modulus have similar evolutionary trends, but the deformation modulus (3.68–6.78 Gpa) of 0–90° sandstones is generally smaller than the elastic modulus (7.06–9.72 Gpa) with the same layer angle. It is concluded that the layer deterioration effect of sandstone results in the anisotropic characteristics of the elastic modulus and deformation modulus. The average elastic modulus and deformation modulus are associated with the layer angle. The anisotropy coefficient is a useful index for assessing the anisotropic properties of rocks [47,48]. The anisotropy coefficient is defined as the ratio of the maximum mechanical parameter to the minimum mechanical parameter. According to the peak stress and elastic modulus in Table 1, the anisotropy coefficients are 1.96 and 1.38, respectively, indicating an intermediate level of anisotropy.

3.4. Macroscopic Failure Mechanism

3.4.1. Evolution Mechanism of Macroscopic Cracks

Figure 7 illustrates the distribution of failure patterns and cracks. It is observed that the failure patterns of sandstone with different layer angles include tension failure type I (0° and 22.50°) and tension failure II (90°), shear failure (67.50°), and tension–shear failure (45°). The number of apparent cracks, penetration degree, and failure types of sandstone samples are closely related to the layer structure, indicating significant anisotropy characteristics of failure modes and fracture forms.
Figure 7a,b show that when the layer angle ranges from 0 to 22.50°, the propagation path of major tension failure I (ab and cd) is approximately perpendicular to the layered structure, with secondary cracks (ef) mostly induced on the upper face. The bedrock structures are superimposed and distributed in series, and the loading principal stress is perpendicular to the layered weak surface. The uncoordinated deformation of the layer structure and the end constraint effect induce the top compression core [14,17], and the formation of wedge rock blocks intensifies the splitting destruction of the layered sandstone. The crack evolution path shows that the 22.50° sandstone has shear cracks along the layer (dc and jl) and tensile cracks through the bedrock (hi and dj). The end constraint effect leads to the formation of a tensile crack (ab) and an oblique shear crack (df) in the upper part of the sandstone. The oblique shear crack (df) expands to the left and intersects with a tensile crack (ab), then extends downward to form the oblique shear crack (bc). The propagation of the oblique shear crack (bc) is caused by the initiation of the layered weak surface, leading to the oblique shear fracture. The tension cracks (hi and jk) cause the sandstone to rupture through the bedrock, and the tension crack (jk) gradually expands into the parallel oblique shear crack (kl), which is similar to the evolutionary characteristics of the oblique shear crack (bc).
Figure 7e shows that the fracture propagation of tension failure II (90°) is fundamentally different from that of tension failure I. In 90° sandstone, the layer structure is parallel to the loading stress, and the compressive rod effect [14,35] resulting from the compression of the bedrock structure leads to the formation of tensile cracks along the layer (ab, cd, ef, gh, and ij). The bearing capacity of 90° is dominated by the bedrock structure, and the fracture zone is formed after the intersection of cracks ab and cd. After the fracture, strip rock blocks are the dominant pattern. The fracture mainly occurs in strip rock blocks, which is known as the instability failure effect of a pressure rod [49]. This phenomenon mainly originates from the expansion of tensioned microcracks induced in the layer’s weak surface, which form a longitudinal penetrating macroscopic crack along the principal stress.
Figure 7c shows that the deterioration effect of the layer causes a more significant expansion deformation and shear deformation when the layer angle is 45°, which deteriorates the stability and bearing strength of the sandstone sample. The fracture mode shifts from tensile failure to oblique shear failure, and the combined compressive shear–tensile stress induces the formation of tensile and oblique shear cracks on the sandstone surface. The crack evolution path shows that the end constraint effect of 45° causes the formation of an end compression core (hij), and the shear cracks against layer (ji) and along layer (hi) expand into tensile cracks through the bedrock (ik), eventually forming macroscopic shear surfaces (ac and hk). Moreover, the primary cracks of 45° sandstone do not evolve along the layer’s weak surface since the cohesion of natural layered sandstone is evidently greater than that of shale [31] and artificial layered rock [27,50], leading to the formation of shear cracks against and along the layer.
The layer deterioration effect of 67.50° is more significant. The cracks evolve in a path where the main stress leads to the formation of two sequential oblique shear cracks (ab and cd) parallel to the layer structure, and the penetration of the main cracks induces local sequential oblique shear cracks. The failure mode of 67.50° sandstone is predominantly oblique shear with almost no tensile failure. The intersection of macrofractures forms an inverted V-shaped fracture zone. The stability and failure mode of 67.50° are completely controlled by the layer deterioration effect, and there is no rock block ejection or burst phenomena.

3.4.2. Macroscopic Fractal Features

The mass distribution of fragments can be obtained using the screening method focus method. The distribution function is as follows:
Y = M ( r ) M = r 3 - D r ,
where r is the characteristic size; M® is the fragment weight of equivalent particle size smaller than the characteristic size. M is the total fragment weight. Therefore, M®/M is the cumulative percentage of fragment weight with equivalent particle size less than characteristic size. Dr is the fractal dimension.
Take the logarithm of Equation (3):
Ln [ M ( r ) M ] = ( 3 D r ) L n r ,
To investigate the statistical relationship between fragment size ® and fragment weight and to quantify the empirical relationship between the macroscopic fracture fractal dimension (Dr) and layer angle, the fragments were screened and weighed according to the method [43]. Figure 8 illustrates the distribution of the fragment weight against the characteristic size. The calculated fractal dimensions of 0–90° sandstones are 1.4929, 1.5619, 1.3547, 1.2462, and 1.4243. The fractal dimension is significantly and negatively associated with the layer deterioration effect. The test data suggest that 0–22.50° sandstones exhibit similar layer structures, and their fractal dimension is approximately equal with an average fractal dimension of 1.5274. The layer deterioration effect of 67.50° sandstone is significantly enhanced, and the fracture degree is reduced, resulting in a minimum fractal dimension of 1.2462. The fracture degree of 45° is at a medium level, and its fractal dimension (1.3547) is slightly larger than that of shear failure but smaller than that of tension failure.

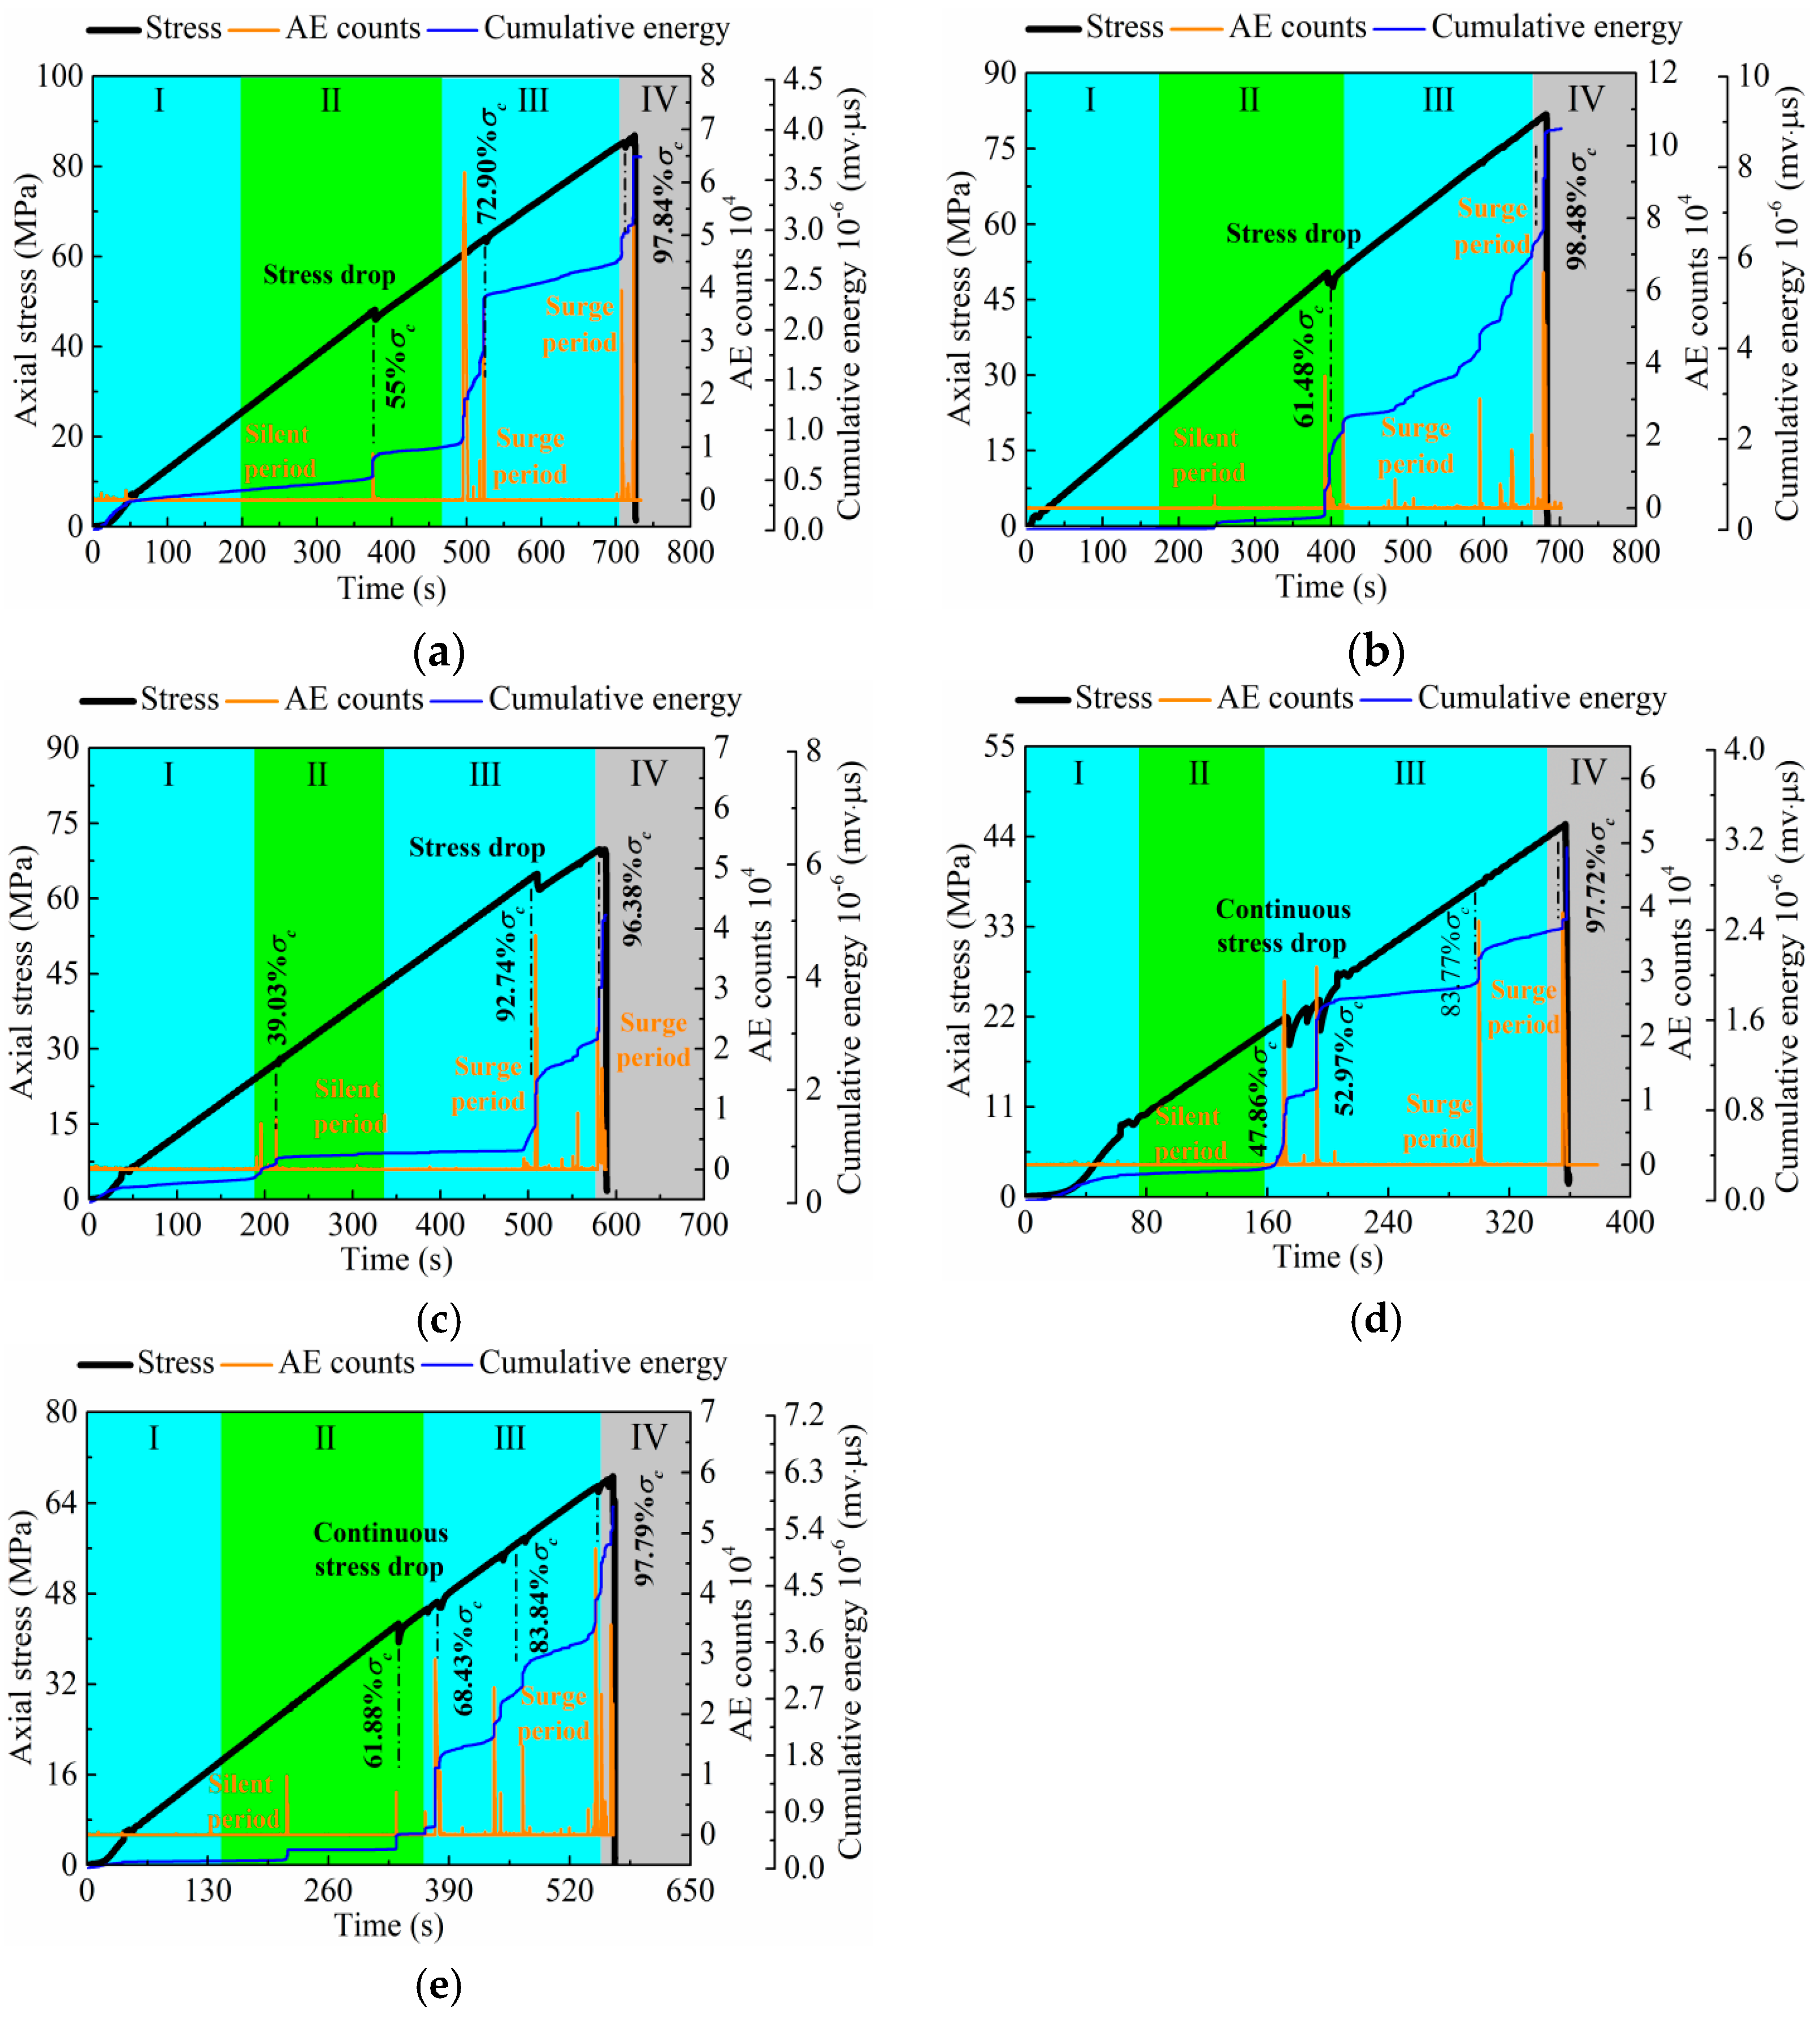
3.5. Response Mechanism of Acoustic Emission

Figure 9 shows that AE activity and aging deformation exhibit stage response characteristics where the AE counts and AE cumulative energy gradually evolve through a silent period, surge period, silent period, and surge period. This corresponds to the compaction stage (stage I), elastic deformation stage (stage Ⅱ), plastic deformation stage (stage Ⅲ), and post-peak failure stage (stage Ⅳ) of the stress–strain curve.
Studies [50,51,52] demonstrate that during the compaction stage, the rock fissure is compressed and closed, resulting in the minimal generation of new cracks and AE activities. The AE counts and AE cumulative energy time remain in an almost silent period. However, the initial loading causes a local micro-rupture phenomenon, induced by the existence of the sandstone layer structure. This phenomenon triggers an enhanced AE activity and a transient increase in the time curve of AE cumulative energy. Figure 9 shows that small amplitude AE activities occur around 50 s, 40 s, 70 s, and 30 s in 0°, 45°, 67.50°, and 90° sandstones.
The original cracks and weak surfaces in the layer undergo continuous compaction as stress is applied during the elastic deformation stage, leading to local adjustments in the rock structure and stress concentration, which induces small-scale fractures and slipping. The number of stress drops increases noticeably, resulting in a local surge of AE events and AE cumulative energy time curves. Figure 9 suggests that the 0° and 22.50° sandstones experience local fractures at 55%σc and 61.48%σc, respectively, and the AE cumulative energy increases by 1.4355 and 2.4035 times, respectively. The 67.50° and 90° sandstones fracture at the stresses of 47.86%σc and 61.88%σc, respectively, and the AE cumulative energy increases by 2.6577 and 2.055 times, respectively. Therefore, the more prominent the sandstone bedding effect, the longer the rupture delay, and the more obvious the number of AE events and the cumulative energy burst of AE. This suggests that the more pronounced the layer deterioration effect, the longer the fracture delay and the more noticeable the AE events and AE cumulative energy spike.
The sandstone undergoes mainly plastic deformation as stress continues to load, with violent and uncoordinated deformation leading to a redistribution of rock layer stress. New fissures and micro-rupture surfaces gradually appear, accompanied by frequent brittle burst sounds. In this stage, the AE activity is significantly enhanced, and the time curve of AE events and AE cumulative energy increases sharply again, reaching about 2–3 times that of the elastic deformation stage. Figure 9 shows that at around 500 s, 500 s, 460 s, 300 s, and 480 s, the 0–90° sandstones experience secondary fractures with varying degrees, and the microcracks rapidly coalesce into macroscopic cracks, which gradually become the dominant failure mode of the sandstone, causing its stability to decrease sharply. The analysis indicates that the AE parameters exhibit different response patterns to layer structure. Stress mutations in the 0° and 45° sandstones occur at 72.90%σc and 92.74%σc, respectively, resulting in acoustic emission entering the active period [39,41], and the AE cumulative energy increases by 33.44% and 126.88%, respectively. The layer deterioration effect in the 67.50° sandstone leads to an early acoustic emission active period compared to the 0–45° sandstones. The AE event rate increases significantly, and the AE cumulative energy exhibits a continuous surge phenomenon within 173.72–214.54 s, with the AE cumulative energy increases by 74.72% when the bearing capacity is 52.97%σc. Additionally, the layer deterioration effect in the 90° sandstone is significantly degraded, and bedrock deformation causes a slow step increase in AE cumulative energy, with almost no surge phenomenon like the 67.50° sandstone. The AE cumulative energy of the 90° sandstone increases by 11.15% at 83.84%σc.
The dilatation phenomenon and rock ejection with popping sound observed in layered sandstone when stress is loaded to the peak strength are due to the rapid release of strain energy, which is indicated by the abrupt increase in the AE cumulative energy [53]. Figure 9 shows that the intensity of the AE cumulative energy release is negatively correlated with the layer deterioration effect, as the strain energy is released early when the layer deterioration effect is not significant. Therefore, the AE activity caused by later strain deformation is relatively weak. This finding is consistent with the study conducted by Cyril et al. [52], which found that the phenomenon is closely related to the potential sedimentary damage of sedimentary rock structure. The AE cumulative counts and corresponding AE cumulative energies of 0–90° sandstones are 6.43 × 10⁴, 11.05 × 10⁴, 5.72 × 10⁴, 4.91 × 10⁴, and 5.46 × 10⁴ and 3.73 × 10⁻⁶ mv·μs, 8.79 × 10⁻⁶ mv·μs, 4.97 × 10⁻⁶ mv·μs, 3.11 × 10⁻⁶ mv·μs, and 5.73 × 10⁻⁶ mv·μs, respectively. It can be observed that the AE intensity induced by tensile fracture is generally greater than that caused by oblique shear fracture, which agrees with the existing conclusion [53,54].

4. Conclusions

To investigate the anisotropic characteristics of mechanical behavior and the AE response mechanism of layered sandstone, uniaxial compression tests and acoustic emission (AE) monitoring were conducted. The main conclusions are as follows:
(1)
The layer structure of sandstone causes remarkable anisotropic characteristics of wave velocities. The increased layer angle reduces the transmission and reflection times between the layer’s weak surfaces, reducing the dissipation degree of the wave energy. This results in a roughly positive correlation between wave velocity and layer angle.
(2)
The strain characteristics and mechanical parameters of sandstone have an obvious layer deterioration effect. The local strain and overall strain have a synergistic feature, and the local strain path is more complex with an extremely sensitive deformation response. The mechanical properties gradually deteriorate. The peak stress and elastic modulus have a nonlinear exponential correlation with layer angle, and the sandstone belongs to the intermediate anisotropy level.
(3)
The layer structure has a significant fracture effect on the sandstone, and the rupture pattern shows significant anisotropic characteristics. The failure modes include tension failure types tension failure type I and tension failure type Ⅱ, shear failure type, and tension–shear composite failure type. The fractal dimension is negatively correlated with the layer deterioration effect.
(4)
The AE activity has a phased response characteristic to the aging deformation of layer structure. The more obvious the layer deterioration effect is, the longer the AE delay is. The layer structure induces strain energy to release early, resulting in a negative correlation between AE accumulative events and AE accumulative energy and layer deterioration effect.

Author Contributions

Conceptualization, methodology, and resources: Y.C. and Z.S.; methodology and data curation: F.W., X.Z. and W.Y.; writing—review and editing: Y.C. and X.Z. All authors have read and agreed to the published version of the manuscript.

Funding

This work was supported by the 2023 High-level Talent Research Project from Yancheng Institute of Technology (No. xjr2023019), Open Fund Project of Shaanxi Key Laboratory of Geotechnical and Underground Space Engineering, Xi’an University of Architecture and Technology (No. YT202302), Science and Technology Innovation Team of Shaanxi Innovation Capability Support Plan (No. 2020TD005), and Science and Technology Innovation Project of China Railway Construction Bridge Engineering Bureau Group Co., Ltd. (No. DQJ-2020-B07).

Data Availability Statement

All data that support the findings of this study are available from the corresponding author upon reasonable request. The data are not publicly available due to privacy.

Conflicts of Interest

Author Xiaoping Zhu was employed by the company Yancheng Institute of Architectural Design Co., Ltd. The remaining authors declare that the research was conducted in the absence of any commercial or financial relationships that could be construed as a potential conflict of interest.

References

  1. Du, D.C.; Lei, D.; Liu, K.Q.; Dias, D. Design of quasi-rectangular tunnel built in the rock masses following Hoek-Brown failure criterion. Buildings 2022, 12, 1578. [Google Scholar] [CrossRef]
  2. Lawongkerd, J.; Shiau, J.; Keawsawasvong, S.; Seehavong, S.; Jamsawang, P. Design equations for predicting stability of unlined horseshoe tunnels in rock masses. Buildings 2022, 12, 1800. [Google Scholar] [CrossRef]
  3. Si, X.F.; Luo, Y.; Luo, S. Influence of lithology and bedding orientation on failure behavior of “D” shaped tunnel. Theor. Appl. Fract. Mec. 2024, 129, 104219. [Google Scholar] [CrossRef]
  4. Zhao, D.P.; Fan, H.B.; Jia, L.L. Characteristics and mitigation measures of floor heave in operational high-speed railway tunnels. KSCE J. Civ. Eng. 2021, 25, 1479–1490. [Google Scholar] [CrossRef]
  5. Liu, N.F.; Li, N.; Wang, S.J.; Li, G.F.; Song, Z.P. A fully coupled thermo-hydro-mechanical model for fractured rock masses in cold regions. Cold. Reg. Sci. Technol. 2023, 205, 103707. [Google Scholar] [CrossRef]
  6. Liu, N.F.; Li, N.; Li, G.F.; Song, Z.P.; Wang, S.J. Method for evaluating the equivalent thermal conductivity of a freezing rock mass containing systematic fractures. Rock Mech. Rock Eng. 2022, 55, 7333–7355. [Google Scholar] [CrossRef]
  7. Tian, X.X.; Song, Z.P.; Zhang, Y.W. Monitoring and reinforcement of landslide induced by tunnel excavation: A case study from Xiamaixi tunnel. Tunn. Undergr. Space Technol. 2020, 110, 103796. [Google Scholar] [CrossRef]
  8. Tian, X.X.; Song, Z.P.; Wang, H.Z.; Zhang, Y.W.; Wang, J.B. Evolution characteristics of the surrounding rock pressure and construction techniques: A case study from Taoshuping tunnel. Tunn. Undergr. Space Technol. 2022, 125, 104522. [Google Scholar] [CrossRef]
  9. Zhu, C.; He, M.C.; Jiang, B.; Qin, X.Z.; Yin, Q.; Zhou, Y. Numerical investigation on the fatigue failure characteristics of water-bearing sandstone under cyclic loading. J. Mt. Sci. 2021, 18, 3348–3365. [Google Scholar] [CrossRef]
  10. Zhao, J.S.; Jiang, Q.; Pei, S.F. Microseismicity and focal mechanism of blasting-induced block falling of intersecting chamber of large underground cavern under high geostress. J. Cent. South Univ. 2023, 30, 542–554. [Google Scholar] [CrossRef]
  11. Zhang, J.; Liang, Y.; Feng, T.G. Investigation of the cause of shield-driven tunnel instability in soil with a soft upper layer and hard lower layer. Eng. Fail. Anal. 2020, 118, 104832. [Google Scholar] [CrossRef]
  12. Zhao, J.S.; Jiang, Q.; Lu, J.F.; Chen, B.R.; Pei, S.F.; Wang, Z.L. Rock fracturing observation based on microseismic monitoring and borehole imaging: In situ investigation in a large underground cavern under high geostress. Tunn. Undergr. Space Technol. 2022, 126, 104549. [Google Scholar] [CrossRef]
  13. Cho, J.W.; Hanna, K.; Seokwon, J.; Min, K.B. Deformation and strength anisotropy of Asangneiss, Boryeong shale, and Yeoncheon schist. Int. J. Rock Mech. Min. 2012, 50, 158–169. [Google Scholar] [CrossRef]
  14. Cheng, Y.; Song, Z.P.; Yang, T.T.; Han, J.J.; Wang, B.W.; Zhang, Z.K. Investigating the aging damage evolution characteristics of layered hard sandstone using digital image correlation. Constr. Build. Mater. 2022, 353, 128838–128856. [Google Scholar] [CrossRef]
  15. Song, Z.P.; Cheng, Y.; Zhang, Z.K.; Yang, T.T. Tunnelling performance prediction of cantilever boring machine in sedimentary hard-rock tunnel using deep belief network. J. Mt. Sci. 2023, 20, 2029–2040. [Google Scholar] [CrossRef]
  16. Wu, K.; Song, J.A.; Zhao, N.N.; Shao, Z. Study on the time—Dependent interaction between surrounding rock and yielding supports in deep soft rock tunnels. Int. J. Numer. Anal. Met. 2023, 47, 1–20. [Google Scholar] [CrossRef]
  17. Wu, K.; Zheng, X.M.; Zhao, N.N.; Shao, Z. Effect of compressible layer on time-dependent behaviour of soft-rock large deformation tunnels revealed by mathematical analytical method. Appl. Math. Model. 2024, 126, 457–481. [Google Scholar] [CrossRef]
  18. Wu, K.; Sharifzadeh, M.; Shao, Z.S.; Zheng, X.; Zhao, N.; Yang, Y. Analytical model for soft rock tunnel with large deformation using stiff and yielding lining solutions. Int. J. Geomech. 2023, 23, 04023207. [Google Scholar] [CrossRef]
  19. Tien, Y.M.; Kuo, M.C.; Juang, C.H. An experimental investigation of the failure mechanism of simulated transversely isotropic rocks. Int. J. Rock Mech. Min. 2006, 43, 1163–1181. [Google Scholar] [CrossRef]
  20. Li, D.X.; Wang, E.Y.; Feng, X.J.; Wang, D.; Zhang, X.; Ju, Y. Weak current induced by coal deformation and fracture and its response to mine seismicity in a deep underground coal mine. Eng. Geol. 2023, 315, 107018. [Google Scholar] [CrossRef]
  21. Li, D.X.; Wang, E.Y.; Yue, J.H.; Li, M.; Li, L.; Wang, D.; Liang, W. Characteristics of pressure stimulated current and damage evolution of granite under progressive uniaxial loading. Sustainability 2023, 15, 14526. [Google Scholar] [CrossRef]
  22. Wu, K.; Shao, Z.S.; Jiang, Y.L.; Zhao, N.N.; Qin, S.; Chu, Z.F. Determination of stiffness of circumferential yielding lining considering the shotcrete hardening property. Rock Mech. Rock Eng. 2023, 56, 3023–3036. [Google Scholar] [CrossRef]
  23. Wu, K.; Shao, Z.S. Visco-elastic analysis on the effect of flexible layer on mechanical behavior of tunnels. Int. J. Appl. Mech. 2019, 11, 1950027. [Google Scholar] [CrossRef]
  24. Wu, K.; Shao, Z.S.; Sharifzadeh, M.; Hong, S.Y.; Qin, S. Analytical computation of support characteristic curve for circumferential yielding lining in tunnel design. J. Rock Mech. Geotech. Eng. 2022, 14, 144–152. [Google Scholar] [CrossRef]
  25. Liu, J.; Wang, E.Y.; Song, D.Z.; Yang, S.L.; Niu, Y. Effects of rock strength on mechanical behavior and acoustic emission characteristics of samples composed of coal and rock. J. China Coal Soc. 2014, 39, 685–691. [Google Scholar]
  26. Zuo, J.P.; Xie, H.P.; Meng, B.B.; Liu, J.F. Experimental research on loading-unloading behavior of coal-rock combination bodies at different stress levels. Rock Soil Mech. 2011, 32, 1287–1296. [Google Scholar]
  27. Li, C.J.; Xu, Y.; Feng, M.M.; Pan, B. Deformation law and failure mechanism of coal-rock-like combined body under uniaxial loading. J. China Coal Soc. 2020, 45, 1773–1782. [Google Scholar]
  28. Wang, B.W.; Li, Y.P.; Yang, C.H.; Liu, W.; Zhang, G.M. Influences of interface inclination on mechanical properties of composite bedded physical model material. Rock Soil Mech. 2015, 36, 139–147. [Google Scholar]
  29. Zeng, J.Q.; Yang, Z.C. Dip effect of structural plane on shearing strength parameters of rock mass. China J. Rock Mech. Eng. 2004, 23, 3418–3425. [Google Scholar]
  30. Zhang, Z.K.; Song, Z.P.; Cheng, Y.; Huo, R.K.; Song, W.X.; Wang, K.S.; Wang, T.; Yang, T.T.; Liu, W. Acoustic emission characteristics and fracture response behavior of hard rock-like material under influence of loading rate. Coal Geol. Explor. 2022, 50, 115–124. [Google Scholar]
  31. Zhang, Z.X.; Cheng, Y.; Song, Z.P.; Ye, X.W. Anisotropy and directivity effects on uniaxial compression of carbonaceous slate form Jinman mine. Appl. Sci. 2022, 12, 9811. [Google Scholar] [CrossRef]
  32. Attewell, P.B. Sandford MR (1974) Intrinsic shear strength of a brittle, anisotropic rock-III. Int. J. Rock Mech. Min. Sci. 1974, 11, 439–451. [Google Scholar] [CrossRef]
  33. Wasantha, P.L.P.; Ranjith, P.G.; Shao, S.S. Energy monitoring and analysis during deformation of bedded-sandstone: Use of acoustic emission. Ultrasonics 2014, 54, 217–226. [Google Scholar] [CrossRef]
  34. Amann, F.E.; Button, A.; Evans, K.F. Experimental study of the brittle behavior of clay shale in rapid unconfined compression. Rock Mech. Rock Eng. 2011, 44, 415–430. [Google Scholar] [CrossRef]
  35. You, M.Q. Instable failure of rock specimen in uniaxial compression and the loading behavior of testing machine. Rock Soil Mech. 1998, 19, 43–49. [Google Scholar]
  36. Damjanac, B.; Fairhurst, C. Evidence for a long-term strength threshold in crystalline rock. Rock Mech. Rock Eng. 2010, 43, 513–531. [Google Scholar] [CrossRef]
  37. Du, M.Q.; Su, J.; Wang, X.C.; Zhang, S.L.; Zhang, Y.J. Dynamic response and crack propagation law of tunnel invert with initial damage. Eng. Fail. Anal. 2021, 119, 104939. [Google Scholar]
  38. Lee, C.H.; Wang, T.T. Invert anomalies in operational rock tunnels: Appearance, causes, and countermeasures. J. Perform Constr. Fac. 2016, 30, 04015048. [Google Scholar] [CrossRef]
  39. Chen, Y.L.; Wei, Z.A.; Zhang, Q.G. Experimental study on Felicity effect of acoustic emission in rock under cyclic loading and tiered cyclic loading. J. China Coal Soc. 2012, 37, 226–230. [Google Scholar]
  40. Chu, C.Q.; Wu, S.C.; Zhang, S.H.; Guo, P.; Zhang, M. Mechanical behavior anisotropy and fracture characteristics of bedded sandstone. J. Cent. South Univ. 2020, 51, 2232–2246. [Google Scholar]
  41. Chen, Q.N.; Zeng, A.; Luo, P.; An, Y.L.; Hu, W.; Luo, X.G. Study on mechanical characteristics of initial supporting structure of large deformation section of carbonaceous slate in Yuanbaoshan tunnel. China, J. Appl. Mech. 2020, 30, 810–817. [Google Scholar]
  42. Cheng, Y.; Song, Z.P.; Song, W.X.; Li, S.; Yang, T.; Zhang, Z.; Wang, T.; Wang, K. Strain performance and fracture response characteristics of hard rock under cyclic loading. Geomech. Eng. 2021, 26, 551–563. [Google Scholar]
  43. Xu, P.; Yang, S.Q. Numerical analysis of creep mechanical property for bedded composite rock. J. Min. Saf. Eng. 2018, 35, 179–187. [Google Scholar]
  44. Pan, Y.S.; Tang, Z.; Li, Z.H. Study on charge induced rule of uniaxial compression of coal and rock under different loading rates. Acta. Phys. Sin. 2013, 56, 1043–1048. [Google Scholar]
  45. Zhao, P.X.; Li, S.G.; Ho, C.H.; Lin, H.F.; Zhuo, R.S. Crack propagation and material characteristics of rocklike specimens subject to different loading rates. J. Mater. Civ. Eng. 2016, 31, 04019113. [Google Scholar] [CrossRef]
  46. Deng, H.F.; Li, T.; Li, J.L.; Xiong, Y.; Qi, Y.; Wan, L.P. Study on calculation method of anisotropic acoustic and mechanical parameters of layered rock. J. Rock Mech. Eng. 2020, 39, 2725–2732. [Google Scholar]
  47. Saeidi, O.; Rasouli, V.; Vaneghi, R.G.; Gholami, R.; Seyed, R.T. A modified failure criterion for transversely isotropicrocks. Geosci. Front. 2014, 5, 215–225. [Google Scholar] [CrossRef]
  48. Hou, Z.K.; Yang, C.H.; Guo, Y.T.; Zhang, B.P.; Wei, Y.L.; Heng, S.; Wang, L. Experimental study on anisotropic properties of Longmaxi formation shale under uniaxial compression. Rock Soil Mech. 2015, 36, 2541–2550. [Google Scholar]
  49. Yin, P.F.; Yang, S.Q.; Gao, F.; Tian, W.L. Application of different joint models in stratified composite rock DEM simulation. J. Min. Saf. Eng. 2023, 40, 164–173+183. [Google Scholar]
  50. Novikov, E.A.; Shkuratnik, V.L.; Zaitsev, M.G.; Klementyev, E.A.; Blokhin, D.I. Acoustic emission of frozen soils under quasi-static mechanical and cyclic thermal loading. Soil Mech. Found Eng. 2020, 57, 97–104. [Google Scholar] [CrossRef]
  51. Shkuratnik, V.L.; Filimonov, Y.L.; Kuchurin, S.V. Regularities of acoustic emission in coal samples under triaxial compression. J. Min. Sci. 2005, 41, 44–52. [Google Scholar] [CrossRef]
  52. Cyril, G.; Yveshenri, F.; Remi, B.; Rémi, B.; Chia-Chun, H. Contact erosion at the interface between granular coarse soil and various base soils under tangential flow condition. J. Geotech. Geoenviron. Eng. 2010, 136, 741–750. [Google Scholar] [CrossRef]
  53. Zhang, Z.K.; Song, Z.P.; Lai, J.X. Critical slowing down precursor information for the acoustic emission response characteristics of defective tuffs. Theor. Appl. Fract. Mech. in press. 2023. [Google Scholar] [CrossRef]
  54. Carpinteri, A.; Lacidogna, G.; Puzzi, S. From criticality to final collapse: Evolution of the “b-value” from 1.5 to 1.0. Chaos Solitons Fractals 2009, 41, 843–853. [Google Scholar] [CrossRef]
Figure 1. Standard sandstone and layer structure.
Buildings 14 00051 g001
Figure 2. SEM-EDS energy spectrum of layered sandstone: (a) SEM image and (b) SEM-EDS energy spectrum.
Buildings 14 00051 g002
Figure 3. Uniaxial compression test system: (a) mechanical test, (b) acoustic monitoring, (c) SEM-EDS monitoring, (d) AE acquisition system, (e) sandstone, and (f) strain collection system.
Buildings 14 00051 g003
Figure 4. Distribution of longitudinal wave and transversal wave velocities: (a) longitudinal wave and (b) transversal wave.
Buildings 14 00051 g004
Figure 5. Uniaxial stress–strain curve of layered sandstone: (a) 0°, (b) 22.50°, (c) 45°, (d) 67.50°, (e) 90°, and (f) typical evolution stages of stress–strain curve.
Buildings 14 00051 g005aBuildings 14 00051 g005b
Figure 6. Local strain–time curve of layered sandstone: (a) 0°, (b) 22.50°, (c) 45°, (d) 67.50°, and (e) 90°.
Buildings 14 00051 g006
Figure 7. Failure patterns and cracks distribution characteristics: (a) 0°, (b) 22.50°, (c) 45°, (d) 67.50°, and (e) 90°.
Buildings 14 00051 g007
Figure 8. Distribution of the fragment weight against the characteristic size: (a) 0°, (b) 22.50°, (c) 45°, (d) 67.50°, and (e) 90°.
Buildings 14 00051 g008
Figure 9. Time curves of AE counts and AE cumulative energy: (a) 0°, (b) 22.50°, (c) 45°, (d) 67.50°, and (e) 90°.
Buildings 14 00051 g009
Table 1. Uniaxial mechanical parameters of layered sandstone.
Layer Angle (°)Peak
Stress (MPa)
Elastic
Modulus (GPa)
Deformation
Modulus (GPa)
Peak Strain
(%)
Poisson’s RatioFailure Modes
00-195.3510.117.171.3280.1082Tension failure
0-292.2410.117.401.2460.1876
0-386.858.955.761.5090.1529
Average91.489.726.781.3610.1496
22.5022.50-184.409.446.901.2240.1597Tension failure
22.50-284.469.946.841.2340.1313
22.50-381.809.635.861.3970.1673
Average83.559.676.531.2850.1528
4545-172.898.715.681.2840.2200Tension–shear composite failure
45-273.439.285.681.2920.1681
45-369.8010.415.961.1710.1542
Average72.049.475.771.2490.1808
67.5067.50-154.628.304.221.2950.2028Shear failure
67.50-249.396.323.401.2510.1441
67.50-340.176.553.431.1700.3076
Average48.067.063.681.2380.2182
9090-177.559.255.621.3810.2370Tension failure
90-279.599.486.541.2170.2151
90-368.879.244.911.4020.2136
Average75.349.325.691.3330.2219
Disclaimer/Publisher’s Note: The statements, opinions and data contained in all publications are solely those of the individual author(s) and contributor(s) and not of MDPI and/or the editor(s). MDPI and/or the editor(s) disclaim responsibility for any injury to people or property resulting from any ideas, methods, instructions or products referred to in the content.

