Abstract
This conceptual study aims to produce rough analysis methods and visualizations for production data (formatted in time, location, and work) that can be collected from construction sites that utilize takt production. The scope is on creating methods for evaluating the soundness of the takt plan and its execution. Relevant production literature regarding takt production management and data collection are utilized in the production of the methods and visualizations. However, only imaginary production data are utilized in this study to keep the indicators as simplified and clear as possible. A total of seven indicators with varying levels of novelty are provided in the study. The proposed indicators emphasize punctual adherence to the takt schedule, homogenous production pace, avoiding trade overlapping in locations, steady work in process, and coherent short and long-term production targets. Both as-planned and as-built perspectives are considered. The proposed indicators are argued to be valuable for production management and research and development processes since they provide status information and document the progression of the production for later indicators purposes. This study also acts as a foundation for further empirical studies regarding takt production data utilization.
1. Introduction
Takt production has been mostly described in Lean Construction conference papers and generic Lean literature. It emphasizes steady and efficient production flow and smoothness of production [1,2]. In construction, takt production has been used to achieve shorter throughput times [3], improved productivity [4], a steady production flow [4,5], and more efficient production steering [6,7].
Takt is a way to level the production rate to match customer demand [1]. Originating from shop floor manufacturing, takt time is considered a design parameter for production, whether it is manufacturing, construction, or something else [8]. If production is not able to follow a steady takt time, work accumulates in certain work areas while other work areas are idle, which is why adhering to a steady takt is considered important [9]. Production variance hinders leveling [9]. In construction, takt defines the maximum time each trade can occupy each location [9]. Longer than required takt generates either waiting or a capacity buffer that protects production from deviation [9,10]. Adequately planned waiting times can help production stay on schedule, while unnecessary waiting is a waste. Waiting can be reduced via workable backlogs and adjusting worker resources [9].
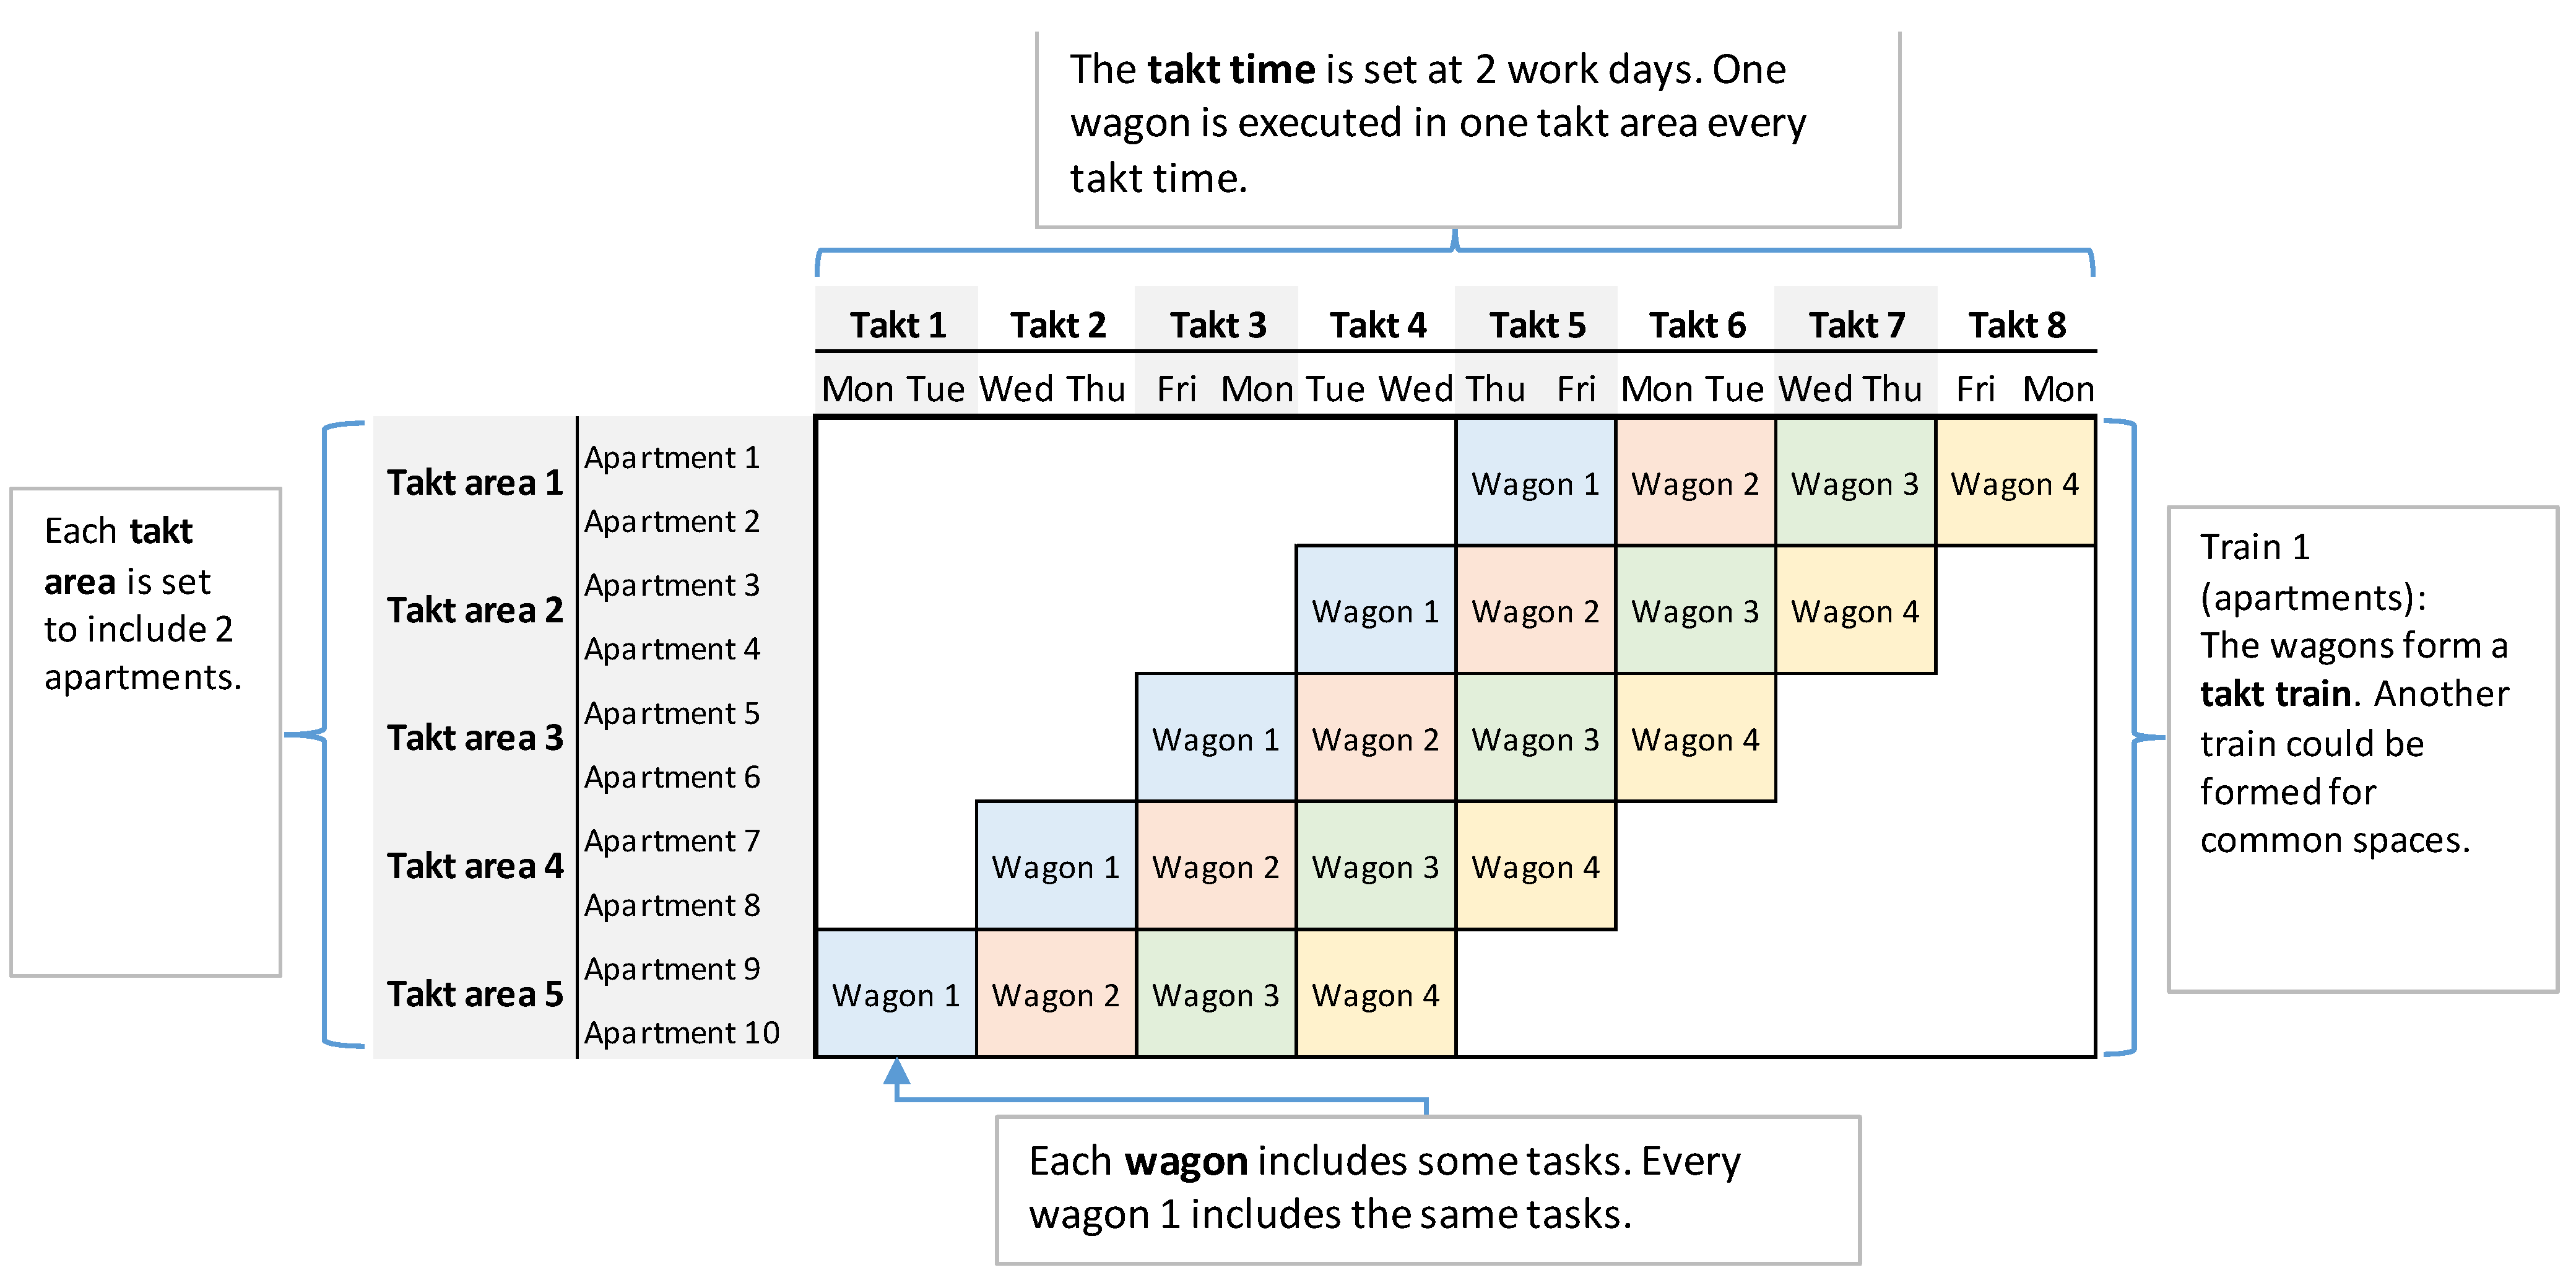
In takt production, steadiness is achieved by reliably handing over each location to the next trade at intervals of equal duration [9]. The objective is to produce a schedule with activities, locations, and durations that will be met with certainty [9]. The homogenous production rate can be expressed via locations and time. For example, three apartments are waterproofed every three workdays. Such batches of three apartments are called takt areas, and the time period is the takt time [11,12]. To achieve repetition, the work content of the takt areas must be as consistent as possible [11]. For this reason, takt production is often applied to repetitive locations, although not always [11,13]. Work is bundled into work packages, aiming to allocate each trade with a constant and adequate amount of work. During a takt, one or more work packages are executed [6]. This takt and takt area-specific batch of work packages is called a wagon [6]. A chain of steadily progressing wagons is called a takt train [14]. Figure 1 depicts a typical takt schedule.

Figure 1.
A takt schedule.
Current Views on Data-Driven Takt Production Management, Challenges, and Potential Solutions
Relevant to this study, takt production emphasizes the role of data. Takt production is managed with daily takt meetings, in which the documented and visualized site status is reviewed with subcontractors [6]. Takt production steering is claimed to be managed by continuously gathered information [15] where maintaining and sharing a constant visual status is critical [16]. Workers themselves want to remain updated, and visual information helps them follow the takt plans [17]. It is said that takt production should be developed via key performance indicators, systematic data collection, and data-driven decision making so that it is based on measured facts [7,16]. Yet, very few practical methods have been introduced in the literature so far.
Executing the right tasks at the right time is essential for takt production, and data are important. Yet, time-related as-built data of takt production have rarely been considered or shown in research. In fact, the authors of this paper know from academic experience that despite the hype surrounding takt production, many takt projects struggle to adhere to a homogenous takt. This is logical because construction is a complex web of trade-specific planning, procurement, logistics, production, and changing conditions, which introduces much contingency and potential risks against rigorous schedule execution.
Some exceptions do describe the materialization of some takt projects. Alhava et al. [3] presented an “as-built schedule” of a case, which was composed of digitally collected site data. They mentioned that the takt production phase did not follow the takt schedule, the task durations varied, and work was performed scattered. Frandson [9] presented some cases with the as-planned and as-built start dates and Percent Plan Complete (PPC) values of planned “activities” in graphs.
Sahlberg et al. [18] described a case takt production construction project, writing that “the implementation was found to be mostly successful”, with schedule-related challenges with building services systems. Lehtovaara et al. [16] mentioned that “Despite the significant planning effort, during the control phase it was realized in every case that it was not possible (or even a goal) to precisely follow the initial plan” and that “the amount of making-do was perceived to be large in almost all cases, which also caused production to slide towards traditional [non-takt production] ways of working”. Based on this, how takt production schedules materialize in practice and how this could be best demonstrated are still ambiguous topics.
Digital tools have already been developed for takt production data collection and processing, which could be used to study production performance and to allow data-based production steering [3]. However, the presentation of such data has barely been addressed in research, which is a clear research gap based on the literature review. Indicators for temporal compliance with the takt schedule are not addressed in the literature, even though location–time targets are set, and adherence is important [14]. Furthermore, a takt schedule might not even adhere to the theoretical definitions of takt production in the first place (homogenous time, areas, and wagons). This paper argues that this could also be evaluated from digitally drafted takt plans.
Examining the schedule and execution with takt indicators has a dual purpose. First, it can serve researchers by revealing to what extent a punctual takt schedule has been drafted (homogeneity/standardization). Second, it can serve the field by providing prompt information on which tasks require current attention from management, which tasks are causing issues with takt production, and if recent management actions have been effective from a time management perspective (is the production status trending toward the planned execution). The indicators can supplement production meetings by providing an instant overview and highlighting problem areas.
The need for this study arises from three viewpoints. (1) The use of takt production has increased. However, research reports barely consider how diligently takt plans conform to the theoretical concepts and how punctually the takt plans are followed. What is barely addressed is (a) has it been the intention to punctually adhere to the takt plan, and (b) has the execution been successful. (2) There have been challenges related to takt planning and control [16,18]. Therefore, methods should be developed to analyze and visualize production data for production steering. Some relevant digital data collection and analysis methods have been tested [3,19]. (3) Existing takt planning and control methods can be developed. Current planning and control methods may not be perfectly optimized for practice. Gathering data from takt projects can reveal causes for issues and targets for development.
This paper demonstrates how production data can reveal takt plan correspondence with theoretical takt production and how well takt plans are executed. This should indicate production challenges (e.g., falling behind the takt schedule or having high production variance), justifiable targets for development (root cause analysis for identified challenges), and their impact (e.g., indicator trend). This study affects contractors, managers, process developers, software developers, and researchers. With the help of production management-related digital tools, the indicators could be used to evaluate in real time whether a drafted schedule is based on takt planning principles, if the takt in the plan is being followed, and also to provide evidence and information for process development afterward. This paper contributes to existing knowledge by theoretically merging takt production objectives, digital monitoring, and existing ideas for takt production indicators.
A production system that is planned and monitored in detail is arguably most fruitful for indicators since there can be plenty of as-planned and as-built data for the indicators. Logically, production steering can be helped with indicators, and indicators need sufficient data. Yet, such indicators barely seem to exist currently. The aim of this study is to produce time-related indicators that serve to visualize and evaluate the planning and status of takt production. The research question is “what kind of time-related and production data-based indicators could be used to improve takt planning and control methods?”.
The paper is structured around a literature review on existing takt production indicators, as well as logically relevant “general” production indicators that could be modified to fit the aim of the paper. After finding potential indicators from the literature, they are innovatively modified into takt production indicators by the authors. This adaptation is the contribution of this paper. Table 1 summarizes the contents of this paper for clarity.

Table 1.
The contents of this paper.
2. Materials and Methods
This study is non-empirical. To develop the indicators, this study leans on a literature review to seek information about presented production indicators and recommended ways to visualize date, location, and work content-based production data. The literature is sought from the points of view of both takt production and “general” construction. The objective is to find existing takt indicators and general production indicators that can be logically modified into takt production indicators by considering the format of the documented as-built data (what, where, and when, with the accuracy of the takt schedule units of analysis). The general literature is reviewed to supplement the review. The logic behind each modification is explained individually for each indicator. The authors innovate new time-related indicators since proper indicators for takt production do not exist.
The research methodology is conceptual, as the procedures developed in this study are not yet empirically tested in a construction project. Conceptual papers are valuable as they integrate and suggest new connections between existing concepts [20] while creating the basis for new studies and a new kind of thinking [21]. This study is valuable because it generates new ways of evaluating and visualizing the performance of takt production sites from the viewpoints of lean-based objectives, such as flow, constancy of workload, reliability, and standardization. The aim is to illustrate the indicators with such clarity that there is no ambiguity to the reader as to their interpretation and meaning, which will help the reader assess the suitability of the suggested indicators.
3. Research on Existing Indicators
The literature research was conducted on IGLC.net and Google Scholar. For IGLC, the keywords “indicator” and “takt” were used, yielding 108 and 84 results, respectively. For Google Scholar, the keywords “takt production indicator” were used for a total of 11,400 results. All the results for IGLC and the first hundred results for Google Scholar were investigated. To supplement the list, the literature regarding the Location-Based Management System, Earned Value Management, and Construction Flow Index were investigated as well since these were discussed in the literature found during the searches. A total of 22 indicators were discovered, and another 21 indicators were added to the list via supplementation. From these, 20 indicators were accepted for further analysis. The full list is presented in Table 2. The table includes selecting some indicators for further development, which are described in more detail in the next section. The rightmost column briefly describes the justification for the acceptance or rejection of each found indicator.
Table 2.
The findings of the literature review.
Overall, little has been written takt production indicators. The first subsection addresses existing takt production indicators mentioned in the literature. To further fill the research gap, the following subsections address some generic indicators that may be relevant to takt production with some logical but novel modifications.
3.1. Existing Production Indicators
Indicators must be based on easily collectible data and be reasonably simple and easy to understand to benefit production steering [5,38]. However, a too imprecise schedule (floor/task) cannot be followed on the subtask level. Information must be precise for plan adherence [39]. Additionally, a precise schedule must be monitored at least on the same level of precision so that execution can be evaluated in detail [39]. Logically, as-planned and as-executed data must be collected at an adequate level of precision, even if the indicators produced from them would be simplified for visualization.
3.1.1. Existing Takt-Related Indicators
Haugen et al. [5] studied takt production execution challenges and related performance indicators. The study pursued independently working trades, undisturbed working conditions, stable staffing and workflow, timely handovers, and overall steadiness to achieve a high production rate. Their study presented seven indicators:
- Percent Plan Completed (ratio of executed above planned wagons);
- Perfect handovers (clean zone and tasks 100% completed in time);
- Overtime (extra hours);
- Returns (trade returning to a location for missing work);
- Additional choices (apartment buyers’ supplemental choices to the standard apartments);
- Man-hours (estimated work hours per square meter);
- Staffing (estimated work hours divided by 7.5 h).
Items 3 (overtime), 6 (man-hours), and 7 (staffing) consider steady resourcing, which is beyond the scope of this study. Item 5 (additional choices) is also outside the scope. Item 4 (returns) could be a potential indicator, but relevant data may be difficult to gather. Items 1 (PPC) and 2 (perfect, timely handovers) measure the temporal adherence to the takt schedule and are therefore relevant.
Other potential takt production indicators include material consumption, production throughput time, number of defects, and location utilization rate [16]. Alhava et al. [3] added “roadblocks” that workers report to managers via a mobile application, which prevent the continuation of work. Kenley and Seppänen [34] previously recommended similar indicators for location-based production management of construction in general.
The authors could not find further information about takt production indicators in the literature. The following subsections consider the topic from a generic non-takt perspective to supplement the review. The following existing non-takt indicators are discussed because they have inspired the authors of this paper with the development of takt indicators. The inspiration is explained in each subsection.
3.1.2. Existing Non-Takt Indicator 1—Location-Based Management System Indicators
In the non-takt production literature, Seppänen [40] recommends that production data should be collected regarding the start and finish of scheduled tasks, and the degree of completion of unfinished tasks to be able to assess schedule adherence numerically and visually. As-planned and as-built data can be collected regarding quantities, task- and location-specific start and finish dates, production rate, resource utilization rate, and disturbances [40]. According to Seppänen and Kankainen [41] and Kenley and Seppänen [34], the following indicators can be examined in this context:
- Quantity deviation: actual vs. planned quantity;
- Resource deviation: actual vs. planned workers;
- Start-up delay: actual vs. planned start date in the first location;
- Production rate deviation: actual vs. planned production rate;
- Interruptions: the shifts of interrupted days (days on which no work happened in any location);
- Final delay: actual vs. planned finish date in the last location;
- Planned continuity: start date of the succeeding location vs. finish date of the previous location;
- Actual continuity: if the number of interrupted days if >0, then 1. Otherwise, 0;
- Minimum buffer size: the number of days between two consequent tasks;
- Location sequence: 1 if locations started in a planned sequence, 0 otherwise;
- Actual shift duration and days off.
Some of the units above could be logically utilized in examining adherence to takt production. If work packages have been planned based on quantities and actual quantities are documented for each location, it is logical to examine quantities. Task start and finish dates could be examined only in the first and last location (as proposed above), but arguably, it is more appropriate to examine the start and finish of each takt area for each wagon, as separate intermediate targets are set for each wagon [6]. The production rate should be constant for all tasks: one wagon per takt area during one takt [14]. Thus, the production rate could be examined by reviewing the start and finish times of wagons. The continuity of tasks can be identified with date documentation, as wagons follow each other at one-takt intervals [6]. Time buffers are either hidden within wagons or scheduled as empty wagons [10]. The number of empty wagons is easy to calculate from the schedule. Hidden buffers could be identified by comparing planned takt time with the scheduled workload within wagons, defined during takt planning, for example, via theoretical production rates, resources, and quantities [14]. Figure 1 provided previously illustrates these takt production-related terms.
Lucko et al. [35] proposed some further “variables that are readily available from the graphical representation of linear, repetitive and location-based scheduling”:
- Work-in-progress: Active work packages at a given time;
- Concurrency: Activities occurring at the same time in different locations;
- Finished work: All work packages to the left of the current date should have been completed.
Work-in-progress or work-in-process is a logical indicator for takt production and will be discussed in more detail in the next subsection. Concurrency indicates how many locations have the same task (or logically the same resources) active at the same time [35]. Minimizing concurrency helps to avoid a hiring overload every time a task is started and to better pace activities [35]. Lucko et al. [35] indicated that reducing concurrency leads to smaller batches of work. Batch sizes are discussed later in the Construction Flow Index indicator. Takt production is scheduled as “trains” (or conveyor belts), where typically there is not concurrency between takt areas [6]. Therefore, concurrency is a rational indicator, as the objective is to avoid it. Finished work is addressed in the Earned Duration indicator section.
3.1.3. Existing Non-Takt Indicator 2—Work-In-Process
In Lean, work-in-process (WIP) refers to the amount of unfinished work [1]. In factory manufacturing, WIP manifests as an inventory of unfinished goods that take up space, tie up capital, and may include recurring defects that have not yet been detected [1]. Processes should minimize WIP to pursue constant processing of unfinished products and value addition [1].
In construction, WIP manifests as delays between construction phases, in the supply chain, and tasks [31]. This study concentrates on task-specific WIP. According to Faloughi et al. [31], task-specific WIP appears as a larger batch size of tasks and a delay in task handovers. Batch size refers to the number of locations allocated to a trade at once. Smaller batch size enables efficient location handovers between trades, making production faster. Once a batch is finished, it is handed over to the following task either immediately or delayed, which causes WIP [31].
Arguably, WIP could be a key indicator because the objective of takt production is to achieve a steady workflow so that a homogenous number of locations is constantly worked on, tasks progress continuously, and the amount of WIP is low [11,16,31]. Work progressing too rapidly or too slowly does not increase value but rather creates bottlenecks in otherwise steady production [31]. Such unsteady production causes longer throughput times and increased disturbances [38]. Reducing batch size should improve production flow, but the positive effects are lost if the reduction causes significant production variance [7].
In takt production, WIP is perceived via the workload of takt areas or the batch size, and thus square meters or work hours measure WIP [31]. Logically, for a more simplified WIP indicator, takt areas could be used since they are composed of standard space units [6] that are, logically, units of unfinished work. For example, in studies by Lehtovaara et al. [42] and Keskiniva et al. [19], repetitive apartments were used as the space units, and so the number of apartments allocated to trades would represent the amount of WIP.
Schedules should be presented in such a format that enables WIP to be detected and numerically calculated, which allows WIP reduction during scheduling [31]. Takt planning is suitable for this purpose, as location-specific progress can be evaluated from the takt plan [31]. All these make WIP a potential indicator.
3.1.4. Existing Non-Takt Indicator 3—Percent Plan Complete
The PPC value (Percent Plan Complete) of the Last Planner System (LPS) can be used to examine takt schedule adherence [9,15]. In the LPS, PPC evaluates the percentage of planned weekly work plan tasks completed during the week [43]. Only tasks that have their prerequisites met are planned for the following week [43]. Takt production targets should ideally remain identical for each takt to achieve a high level of standardization. However, PPC does not consider target homogeneity. If weekly targets vary, takt production lacks repetition and predictability, and the conveyor belt analog may be lost. Arguably, PPC may be a suitable indicator for takt production when LPS is used, but logically, the constancy of schedule targets should be evaluated.
One issue with PPC is “gaming”, i.e., artificially improving it [34,38]. PPC can be artificially improved by marking unfinished tasks as completed [38] or by weighing small tasks excessively [34]. However, the risk of gaming is always present if the documenter has a motive to make the numbers better. It is advisable that the data is documented and utilized by the same person or organization, usually the manager or the main contractor [19]. Then, if the indicators aid production management, falsifying them has a negative impact, which reduces the risk of falsification.
3.1.5. Existing Non-Takt Indicator 4—Earned Value and Duration Performance Index
Earned Value Management (EVM) is a method for measuring production performance in which value produced via monetary investment is compared with the corresponding targets [36]. Such value is quantified with task completion percentages and cost accumulation [36,44]. Current production performance is measured against the plan, and the overall costs and overall temporal performance of the project are forecasted. For this, data is needed on tasks and costs scheduled up to the point of examination, as well as tasks carried out and actual costs. Usually, a work breakdown structure is used, in which project tasks are divided into clearly defined packages that can be examined independently [36].
Using cost accumulation for construction production steering is difficult because processing cost data may be laborious, delayed, and ambiguous, and the data may be in an unusable format for EVM [34]. Perhaps for this reason, Fleming and Koppelman [36] recommend using predefined control points, in which time is dedicated to EVM and collecting the required data. Kenley and Seppänen [34] also criticize EVM for being well-suited for company level but inappropriate for daily management, in which information and projections regarding production must be readily available. According to them, information regarding production is not available often enough for daily production steering because data collection is too irregular and rare. On the other hand, digital data collection has been recommended for takt production, potentially making data-driven daily production steering more viable [19].
Methods for evaluating the time-related performance of production, such as Earned Duration Management (EDM, [37]), have been developed based on EVM. EDM presents the Duration Performance Index (DPI) that represents temporal project performance in comparison to scheduled targets at the time of examination [37]. If the DPI is under 1, the project is behind schedule, and if the DPI is over 1, it is ahead [37]. The DPI can be calculated separately for individual tasks and for the entire project [37]. This study focuses on the time-related performance of takt production, so the DPI is later modified for an indicator.
3.1.6. Existing Non-Takt Indicator 5—Construction Flow Index (CFI)
Sacks [45] defined a list of the qualities of efficient production flow in construction. Based on these qualities, Sacks et al. [38] developed a list of indicators suitable for computational analysis of production flow. In the above-mentioned studies, the following indicators are logical in terms of takt schedule performance:
- Batch size—one location occupied at a time by each trade;
- Variation of duration per location—target variation is 0;
- Continuity of work between locations—minimizing trades waiting between areas;
- Proportion of locations completed out of order—the target is 0;
- Proportion of tasks completed out of order—the target is 0;
- No re-entrant flow and rework—complete work in one go;
- Only start work packages with prerequisites met, no “making-do”.
From the items above, item 1 (batch size) and item 3 (continuity) seem to be associated with steady work in process. When the WIP is steady and “low”, there is exactly one location at a time occupied by a trade. If making do (item 7) is considered as starting a task without previous tasks being finished then it also ties into uneven WIP. If making do is considered a lack of plans or resources then it is beyond the scope of this study. The proportion of out-of-order locations and tasks (items 4 and 5) could be calculated from temporal production data (time, location, task) and are fitting suggestions as such. Item 6 (rework) might be difficult to monitor and document comprehensively since rework may happen independently of the manager’s knowledge. Item 2 (variation of duration) clearly implies a homogenous takt time, which fits well in the scope of this study.
Regarding the list above, according to Sacks et al. [38], each trade should occupy one location at a time. The issue is defining the size of a location. A building is always occupied by trade; a floor is constantly occupied, and an individual room—rarely. Sacks et al. [38] mentioned that the indicator uses “well-defined locations, i.e., zones or spaces in a building”. In his response, Kenley [39] criticized Sacks et al. [38] for contradictorily using floors as their location division, which, according to Kenley [39], is not detailed enough for production steering. Kenley [39] also criticized the task level as being too imprecise because it is a “summary task”, which does not represent true trade progression in locations. According to Kenley [39], tasks and floors should be divided on a more detailed level, for example, into functional areas or rooms. The task and floor level division presumes, incorrectly, that trades complete all subtasks on a floor before moving on to the next one [39]. Trades often must work on subtasks in an area larger than scheduled [39], and in the worst-case scenario, resources zigzag between locations, which hinders management [34,39]. For this reason, tasks should be planned in detail, and their continuity should be observed. Otherwise, the schedule is not adherable, which prevents work continuity, completing locations in the right order, and the implementation of the production-line flow metaphor [39].
In takt production, work scattering into several locations is prevented with detailed scheduling and daily steering [6]. Regulating the handover of locations to trades steers the trades to comply with the takt schedule. In addition, subcontracts steer tasks to be completed according to the takt schedule [46]. Keskiniva et al. [47] highlighted that a takt schedule should, explicitly and in detail, visualize the order of completion of work packages and individual work steps. Precisely planned work packages allow clear and adequately detailed monitoring and data collection [19].
Concluding the literature review, dozens of production indicators were found. Some of them were rejected as they were outside the scope of the research (e.g., not time-related), too vaguely described, or difficult to track. Some of the other rejected indicators could be considered in this study, for example, “the proportion of tasks completed out of order” suggested by Sacks et al. [38]. However, some potentially viable indicators were filtered from further development to allow the researchers to focus on a few that were deemed most appropriate after discussing the alternatives. After the literature review, it was concluded that further indicator development would still be needed, as the takt production-related emphasis on the wagon- and location-level repetitiveness and punctuality was not properly considered in the existing, more generic indicators.
4. Development of Novel Takt Schedule Compliance Indicators
The following indicators were developed by the authors. The development was done based roughly on the indicators found in the literature. The literature gave some rough outlines for the development, but since many of the indicators were only mentioned and not detailed in the literature, much of the indicator development relied on the authors’ creativity.
It seems logical that planned and execution perspectives should be distinguished for the indicators. Firstly, it is essential to evaluate if the schedule targets have been compliant with takt production principles, i.e., whether “theoretically correct” takt production has even been pursued on paper. This is significant, as, based on the literature, takt schedule targets are not always consistent, even in terms of steady production rates [42,48], and the takt may vary from wagon to wagon. Logically, adjustments might make reality deviate significantly from takt production principles, which is why the modified schedule targets should also be analyzed. If theoretical adherence is ignored, there may be “takt production” cases, where beneficial things are achieved in the name of takt production, but takt production was never attempted or reached. The compliance of the execution (planned vs. materialization) should also be evaluated. Takt production aims to minimize the time variation of takts and wagons [7]. The execution should meet wagon-specific time and location targets to achieve truly takted production.
The following subchapters present the IndicatorsIIed in this study and their rationalization. In total, four indicators and 3 “additional indicators” are presented. The additional indicators are described more briefly. This division was made purely to abide by the word count limit of this journal. Heavy emphasis is placed on indicating the punctual adherence to the takt schedule.
4.1. Developed Indicator 1—Punctuality of Executed Wagon Start and Finish Times
The difference between planned and actual wagon start (and finish) dates. Calculated by subtracting the planned start day number (for example, day 50) from the actual start day number for each wagon. A negative number indicates a delay. Charts can be used to display proportions (20% of wagon starts delayed by 10 days). Averages and deviations can also be calculated. Takts can be used as an alternative for days (5 takts behind schedule).
For short-term control, the difference can be investigated for current wagons to see, for example, which tasks or locations are currently the most delayed and require control. Trend graphs can also be used to indicate the impact of recent production control, much like with the PPC of the Last Planner System.
The wagon start and finish times are defined in the takt schedule for each takt area [6]. Trades are committed and reserve the resources needed to proceed on schedule, so wagons must progress on schedule and hand over takt areas at the right time. Additionally, the original takt schedule is planned rigorously with the goals of the client in mind [6], making adherence important. Successful wagon starts and finishes, thus, also logically indicate successful management of wagon prerequisites. Therefore, a simple comparison of the as-planned and as-built start and finish times for each wagon is suggested as an indicator. This could be presented as an average deviation or a graph for each location and wagon. A logical goal for management would be to try to minimize this deviation for each wagon. This is similar to one indicator proposed by Kenley and Seppänen [34], However, within the context of takt production, and considering the dates of each wagon individually.
4.2. Developed Indicator 2—Wagon Start and Finish Intervals—Following the Takt Time
The difference between planned and actual start (and finish) intervals. Calculation is done in two parts. First, by subtracting the actual start day number of wagon X in takt area N from the actual start day number of wagon X in takt area N-1 (previous takt area). This is the actual start interval between two consecutive areas, for example 4 days. Then, the calculated actual interval is subtracted from the set takt time (planned interval). A negative number indicates that the actual interval is longer than planned. Takts can be used as an alternative for days. Charts, averages, and deviations can be used similarly to indicator 1.
The same advice is given for short-term production control as for indicator 1.
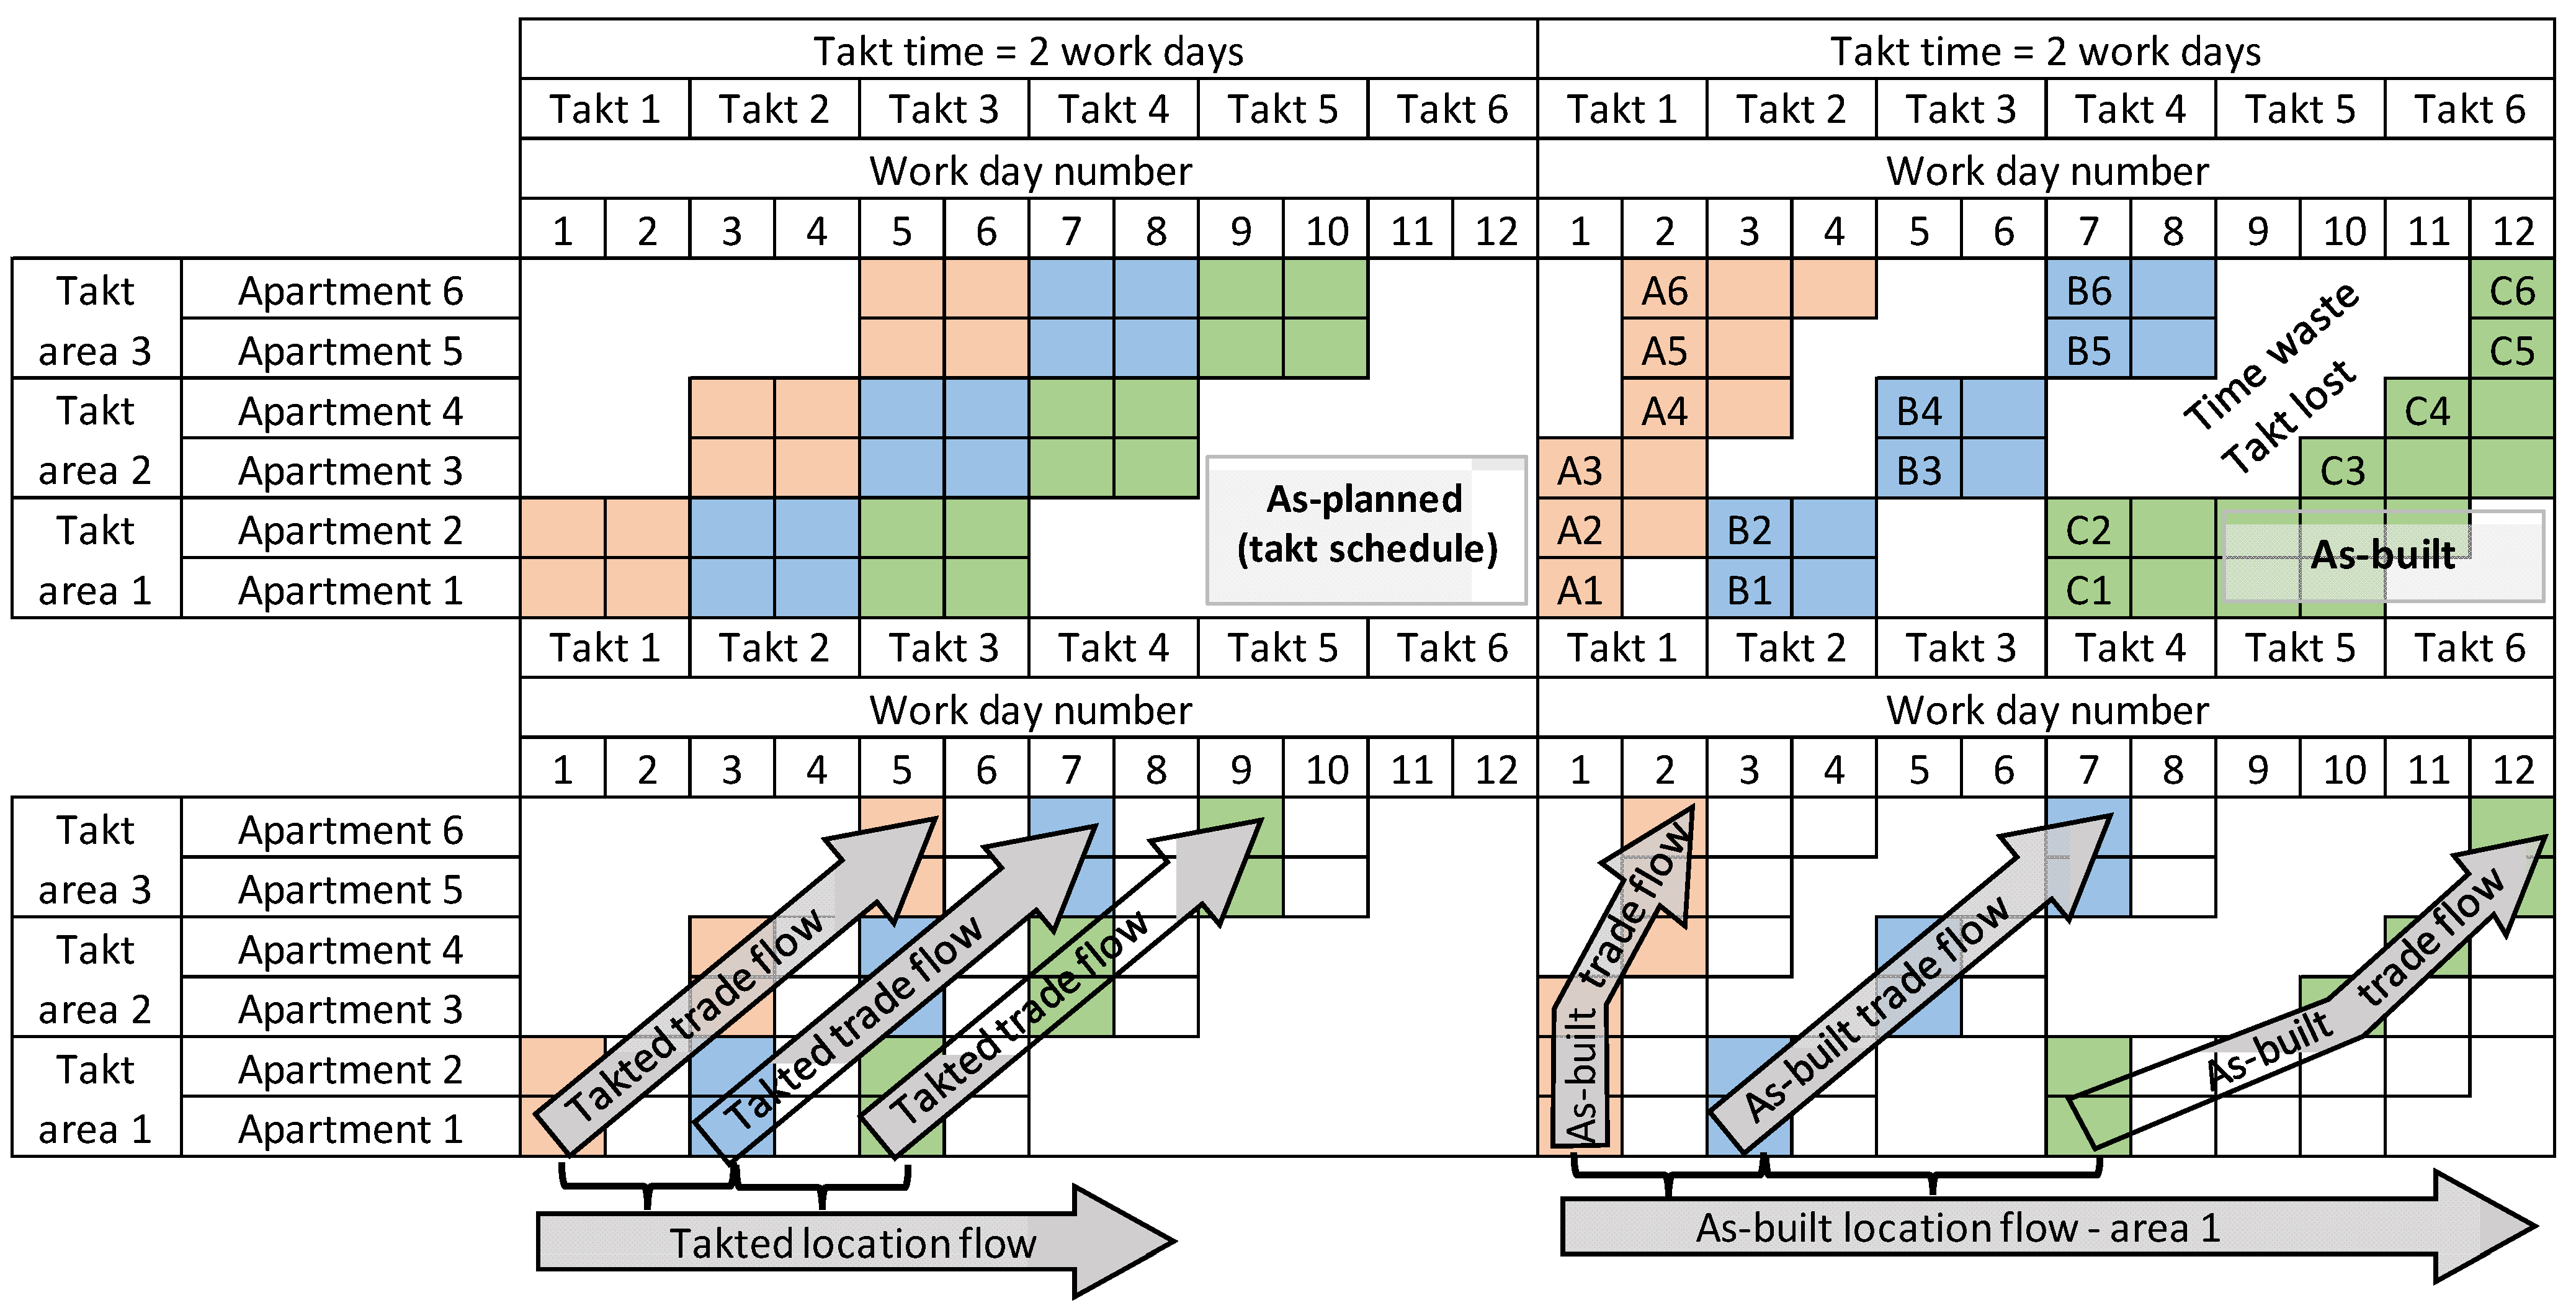
The steadiness of production rates can be evaluated by comparing as-planned and as-built production rates [34]. The production rate of takt production can be examined via the start and finish frequency of locations [38]. The finish must be the perfect handover mentioned by Haugen et al. [5], in which the zone (takt area) is clean, and tasks are fully completed. Ideal production flow has no variation [38]. Logically, a start interval longer than the takt time reveals that there have been problems with starting or finishing wagons. A shorter interval reveals that the wagon has been rushed in relation to the schedule. Production rate steadiness can be examined separately from the viewpoint of the processing of one location (location flow) and from the viewpoint of the progression of one trade (trade flow) [7,45].
Figure 2 represents the imaginary execution of three consequent wagons (red, blue, and green) in three takt areas. The target takt time is two workdays. The red wagon is executed too quickly, the blue on schedule, and the green too slowly. The green wagon started a takt late. The blue wagon started on target takt in each takt area. The red wagon started at a busier frequency than the target takt (all areas during one takt, A1–A6). The green wagon started in each takt area within consecutive takts 4, 5, and 6. However, half of takt area 2 (C4) started in the wrong takt. This apartment-level error would not be shown if the visualization was restricted to the takt area and takt time level.
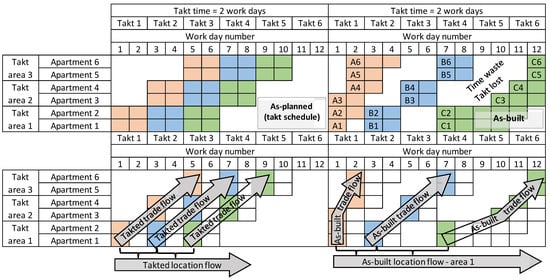
Figure 2.
Comparison of the time-specific targets and as-built execution of wagon starts.
Such takt areas started “at the last allowed time” would lead to hurry. Takt areas started at the last moment are not finished on time, which affects the indicator for finishing on time. The compliance with takt time can also be examined between wagons 1–3 in one location (location flow). In takt area 1, the target start takt is 2 workdays per wagon, but the executed start takt is approximately 3 workdays per wagon because C1 started 4 workdays from B1.
The described indicator underlines the steadiness of trade progression and locations receiving work, which is the objective in takt production. The indicator answers the following questions: “How steadily and continuously have trades moved in different locations” and “How steadily and continuously has work been done in the locations?”. More specifically: “How steadily have individual wagons been started and finished in different locations?” and “How steadily have different wagons been started and finished in individual locations?”. It is also recommended that returning to finished locations (returns/re-entrant flow), mentioned by Haugen et al. [5] and Lehtovaara et al. [7], is examined as a separate indicator.
4.3. Developed Indicator 3—Wagon Durations and WIP—Targets and Realization—Takt Time Compliance
This indicator is technically two indicators, but the first one is very simple.
(1) Actual wagon duration is simply calculated as the difference between the finish and start date of a wagon. Takt time is the planned wagon duration. Subtracting the actual duration from the target indicates if the wagons are taking longer than planned. Charts, averages, and deviations can be used.
(2) Work-in-progress is calculated as the number of concurrent takt areas reserved for a wagon. A reservation is defined as a wagon that has started but not finished in an area. For example, a painting job might be concurrently in progress in 3 takt areas on week 42. Typically, the target WIP is one takt area at a time for any wagon. Therefore, the target WIP can be subtracted from the actual WIP on any week/takt to evaluate the adherence to the takt plan. Charts, averages, and deviations can be used similarly to indicator 1.
The same advice is given for short-term production control as for indicator 1.
In individual takt areas, realized wagon durations may differ from the takt schedule. Shorter than planned durations are problematic for trades since they may cause discontinuity of work. Wagons that last longer are an obstruction to starting following wagons on time because work is partially executed in locations reserved for others. This requires reactive coordination of multiple trades in one location, which should logically be avoided.
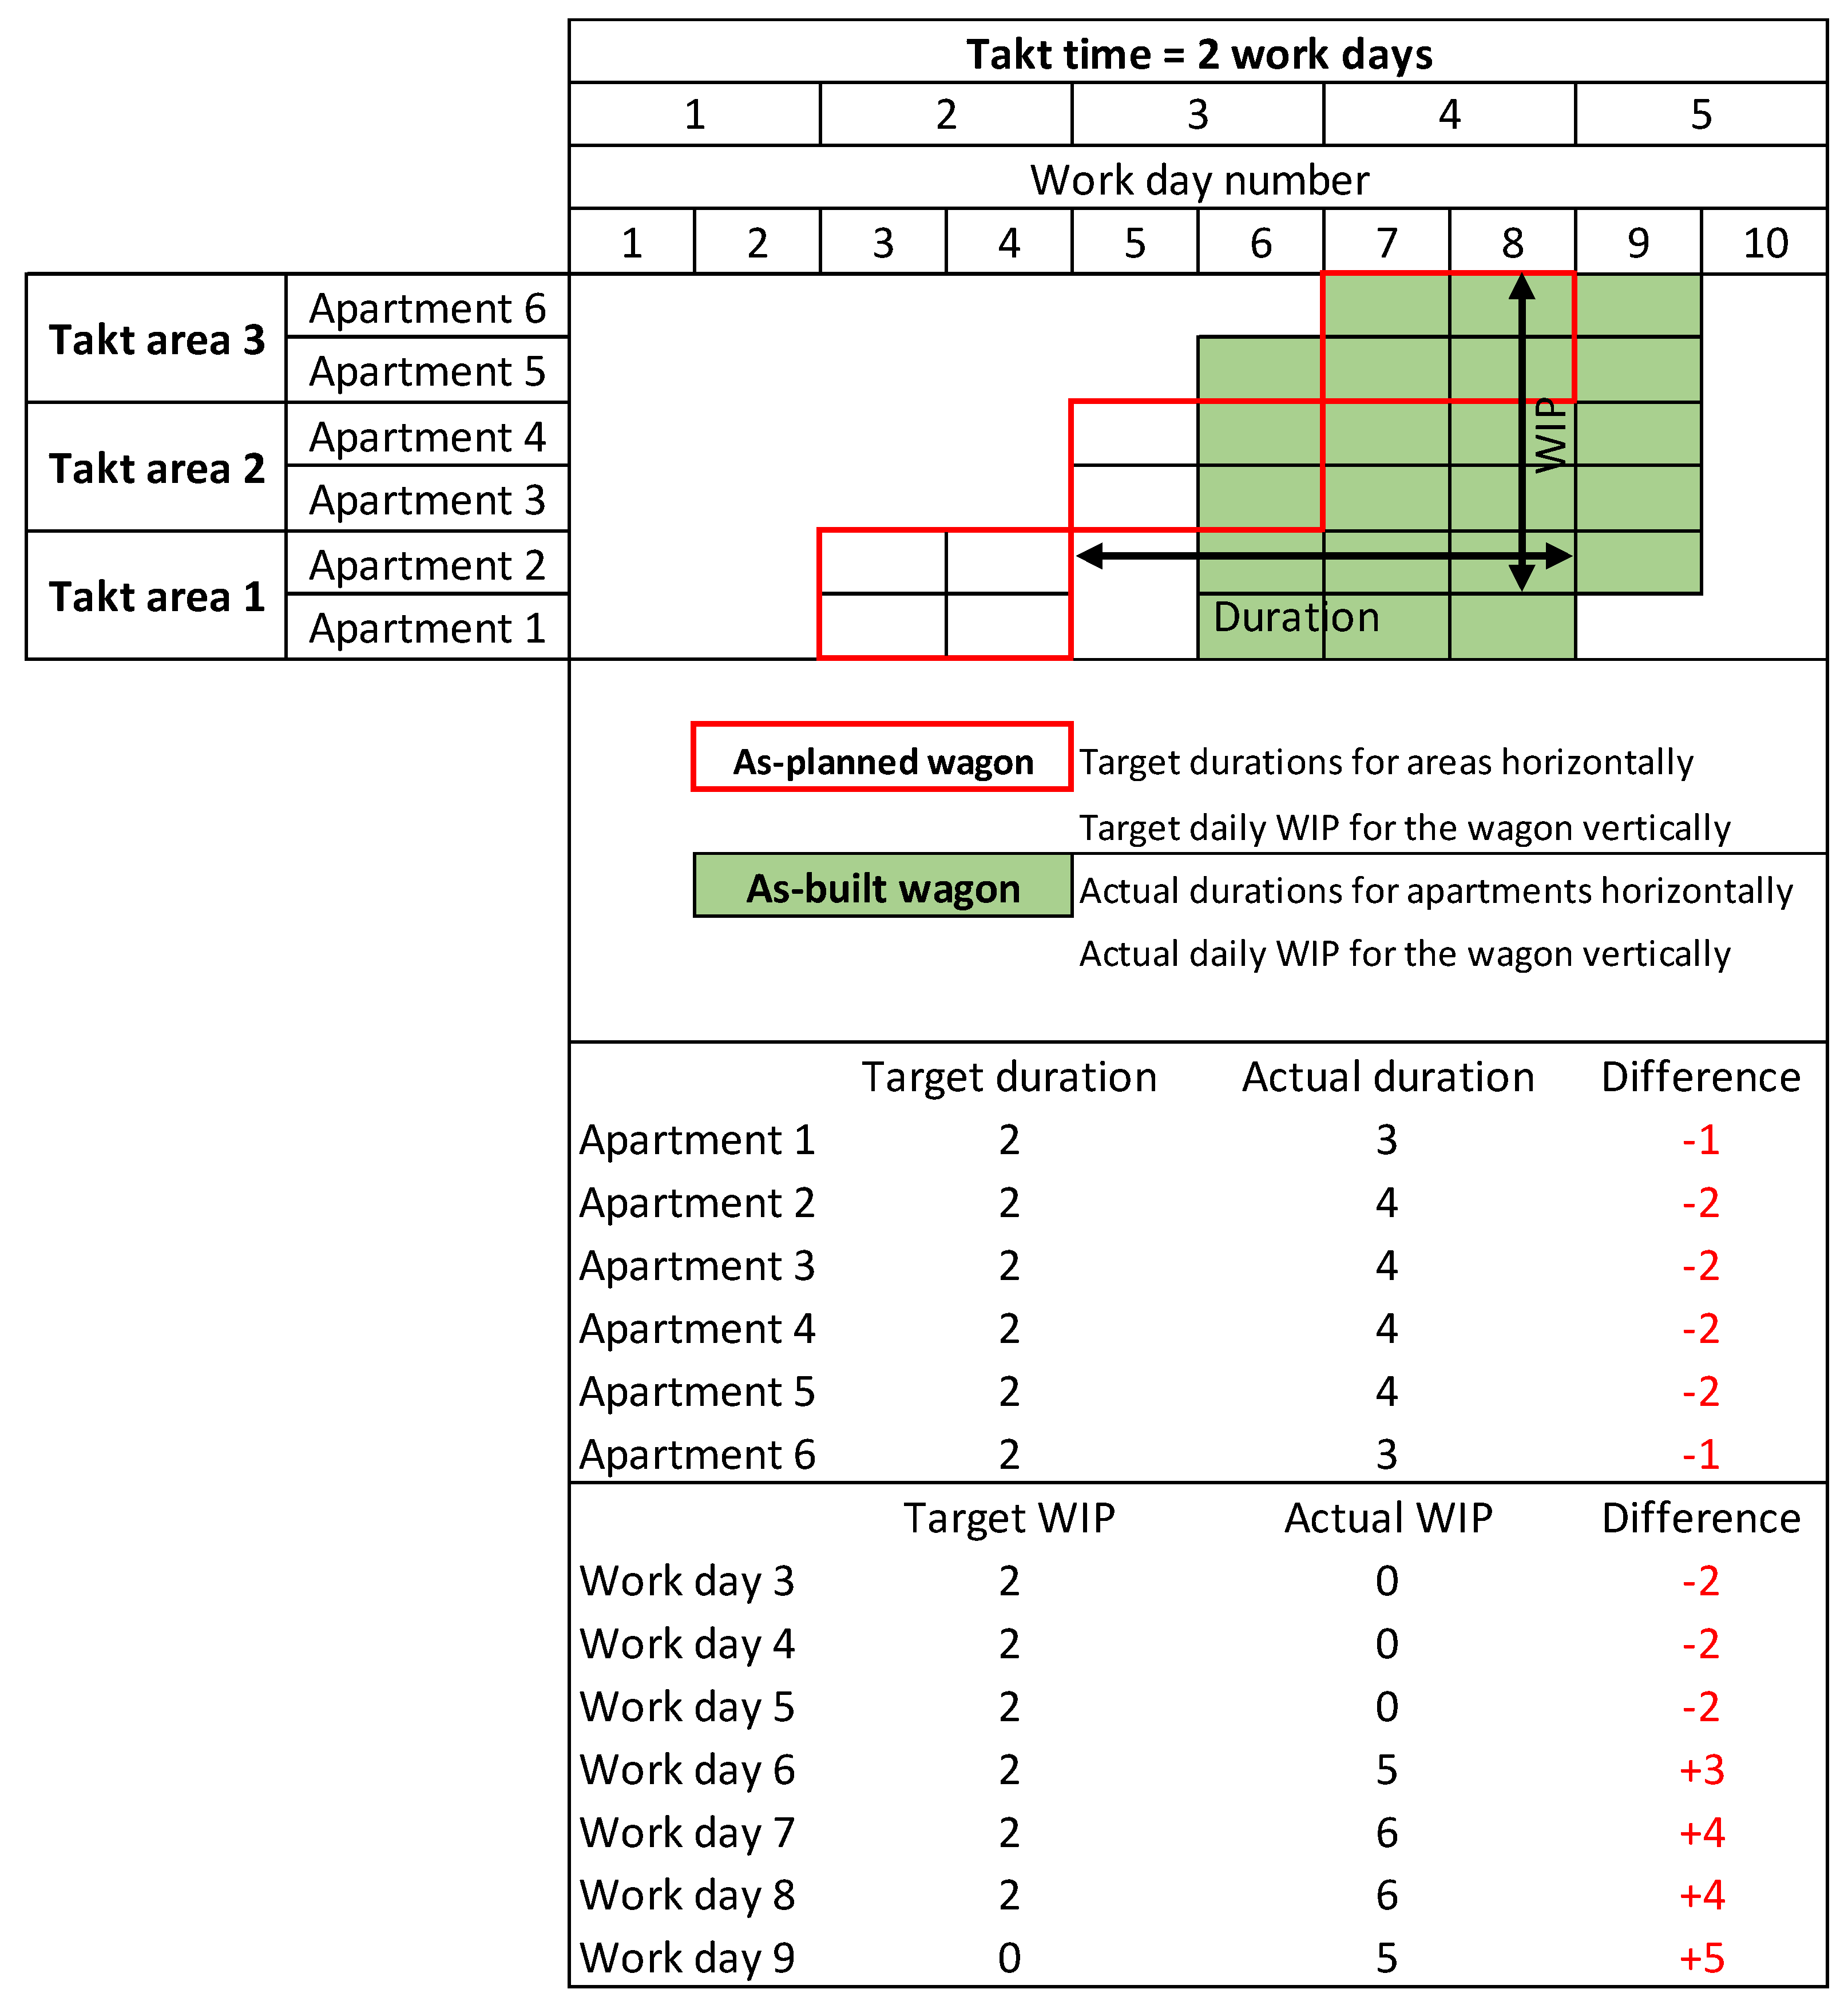
Figure 3 presents the as-planned and as-built data of a hypothetical wagon, for example, waterproofing, by locations and time, as well as a comparison of the datasets from the points of view of duration and WIP. Sections with a red border are scheduled wagons. Green sections indicate the days on which the wagon has been executed in each area. The figure is a visual representation of how the as-built duration of a wagon and the amount of WIP can be numerically compared with as-planned targets location by location.
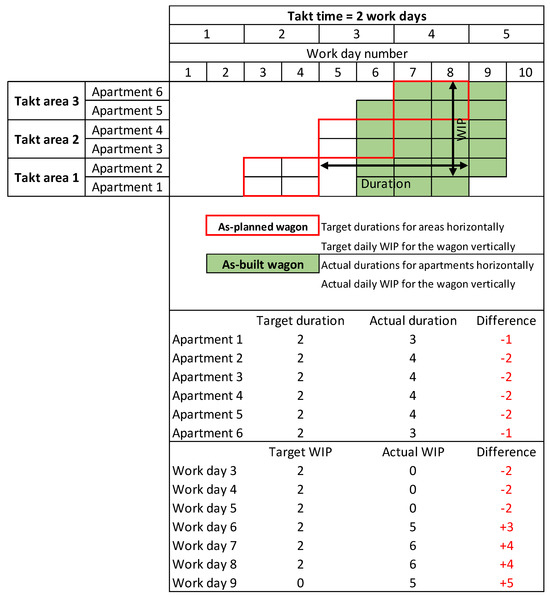
Figure 3.
Indicator examining takt areas reserved by one wagon.
This indicator also evaluates the steadiness of production rates, this time from the perspective of the number of locations underway at the same time. This indicator answers the question “Has the wagon occupied takt areas steadily?”. More specifically, “How many takt areas has the wagon occupied at a time on each day?”.
Sacks et al. [38] mentioned WIP as one of the indicators for production flow. Faloughi et al. [31] previously only discussed the target WIP of the planned takt schedule, not the as-built WIP. With standardized planned WIP, traders know how much time they should have to complete a batch of work before handing it over to the next trade [31]. However, since the realized WIP may also vary, examining the actualized amount of WIP is a key indicator for takt production steadiness. This study emphasizes, as a new element, calculating WIP for as-built takt production. Another novel proposal is considering batch size as standard space units (like apartments) instead of takt areas.
Logically, WIP variation may be a sign of failed production steering, lack of trade discipline, failed area handovers from one trade to another, or unfinished tasks. The failure may be related to either target-setting or plan execution. WIP increase may be caused, for example, by unfinished tasks, reserving too many locations for one trade, production disturbances, trades zigzagging between locations, or trades progressing faster or slower than planned.
4.4. Developed Indicator 4—Wagon Execution Overlap with Targets of Other Wagons—Making-Do and Undisturbed Working Conditions
Calculated as the proportion an actualized wagon overlaps with the as-planned targets of other wagons. This is visualized in Figure 3. For calculation purposes, the overall overlapping can be quantified by dividing the schedule into small parts (or “schedule units”) separated by workdays and locations (for example, apartments). The proportion of overlap between two wagons, A and B, is calculated as a division:
(Count of scheduled units that are scheduled for wagon A but are also documented as having wagon B in progress) divided by (count of all scheduled units scheduled for wagon A).
The division results in a number between 0 and 1; 1 means that wagon B was in progress on any date and area reserved for wagon A in the schedule. The target is that there is zero overlap.
Charts, averages, and deviations can be used. The same advice is given for short-term production control as for indicator 1. Control measures should try to make sure that overlap is minimized so that wagons can proceed uninterrupted.
Making-do refers to starting a task without all of its prerequisites being met, which include materials, tools, staff, external circumstances, and instructions [49]. Sacks et al. [38] suggest that making do is a key indicator of construction production flow. The Last Planner System, in particular, emphasizes reducing making-do to develop process flow and reduce process duration variability [50]. According to Lehtovaara et al. [16], the amount of making do was large in nearly all takt production sites of their study, which resulted in production slipping away from takt production and toward more traditional production.
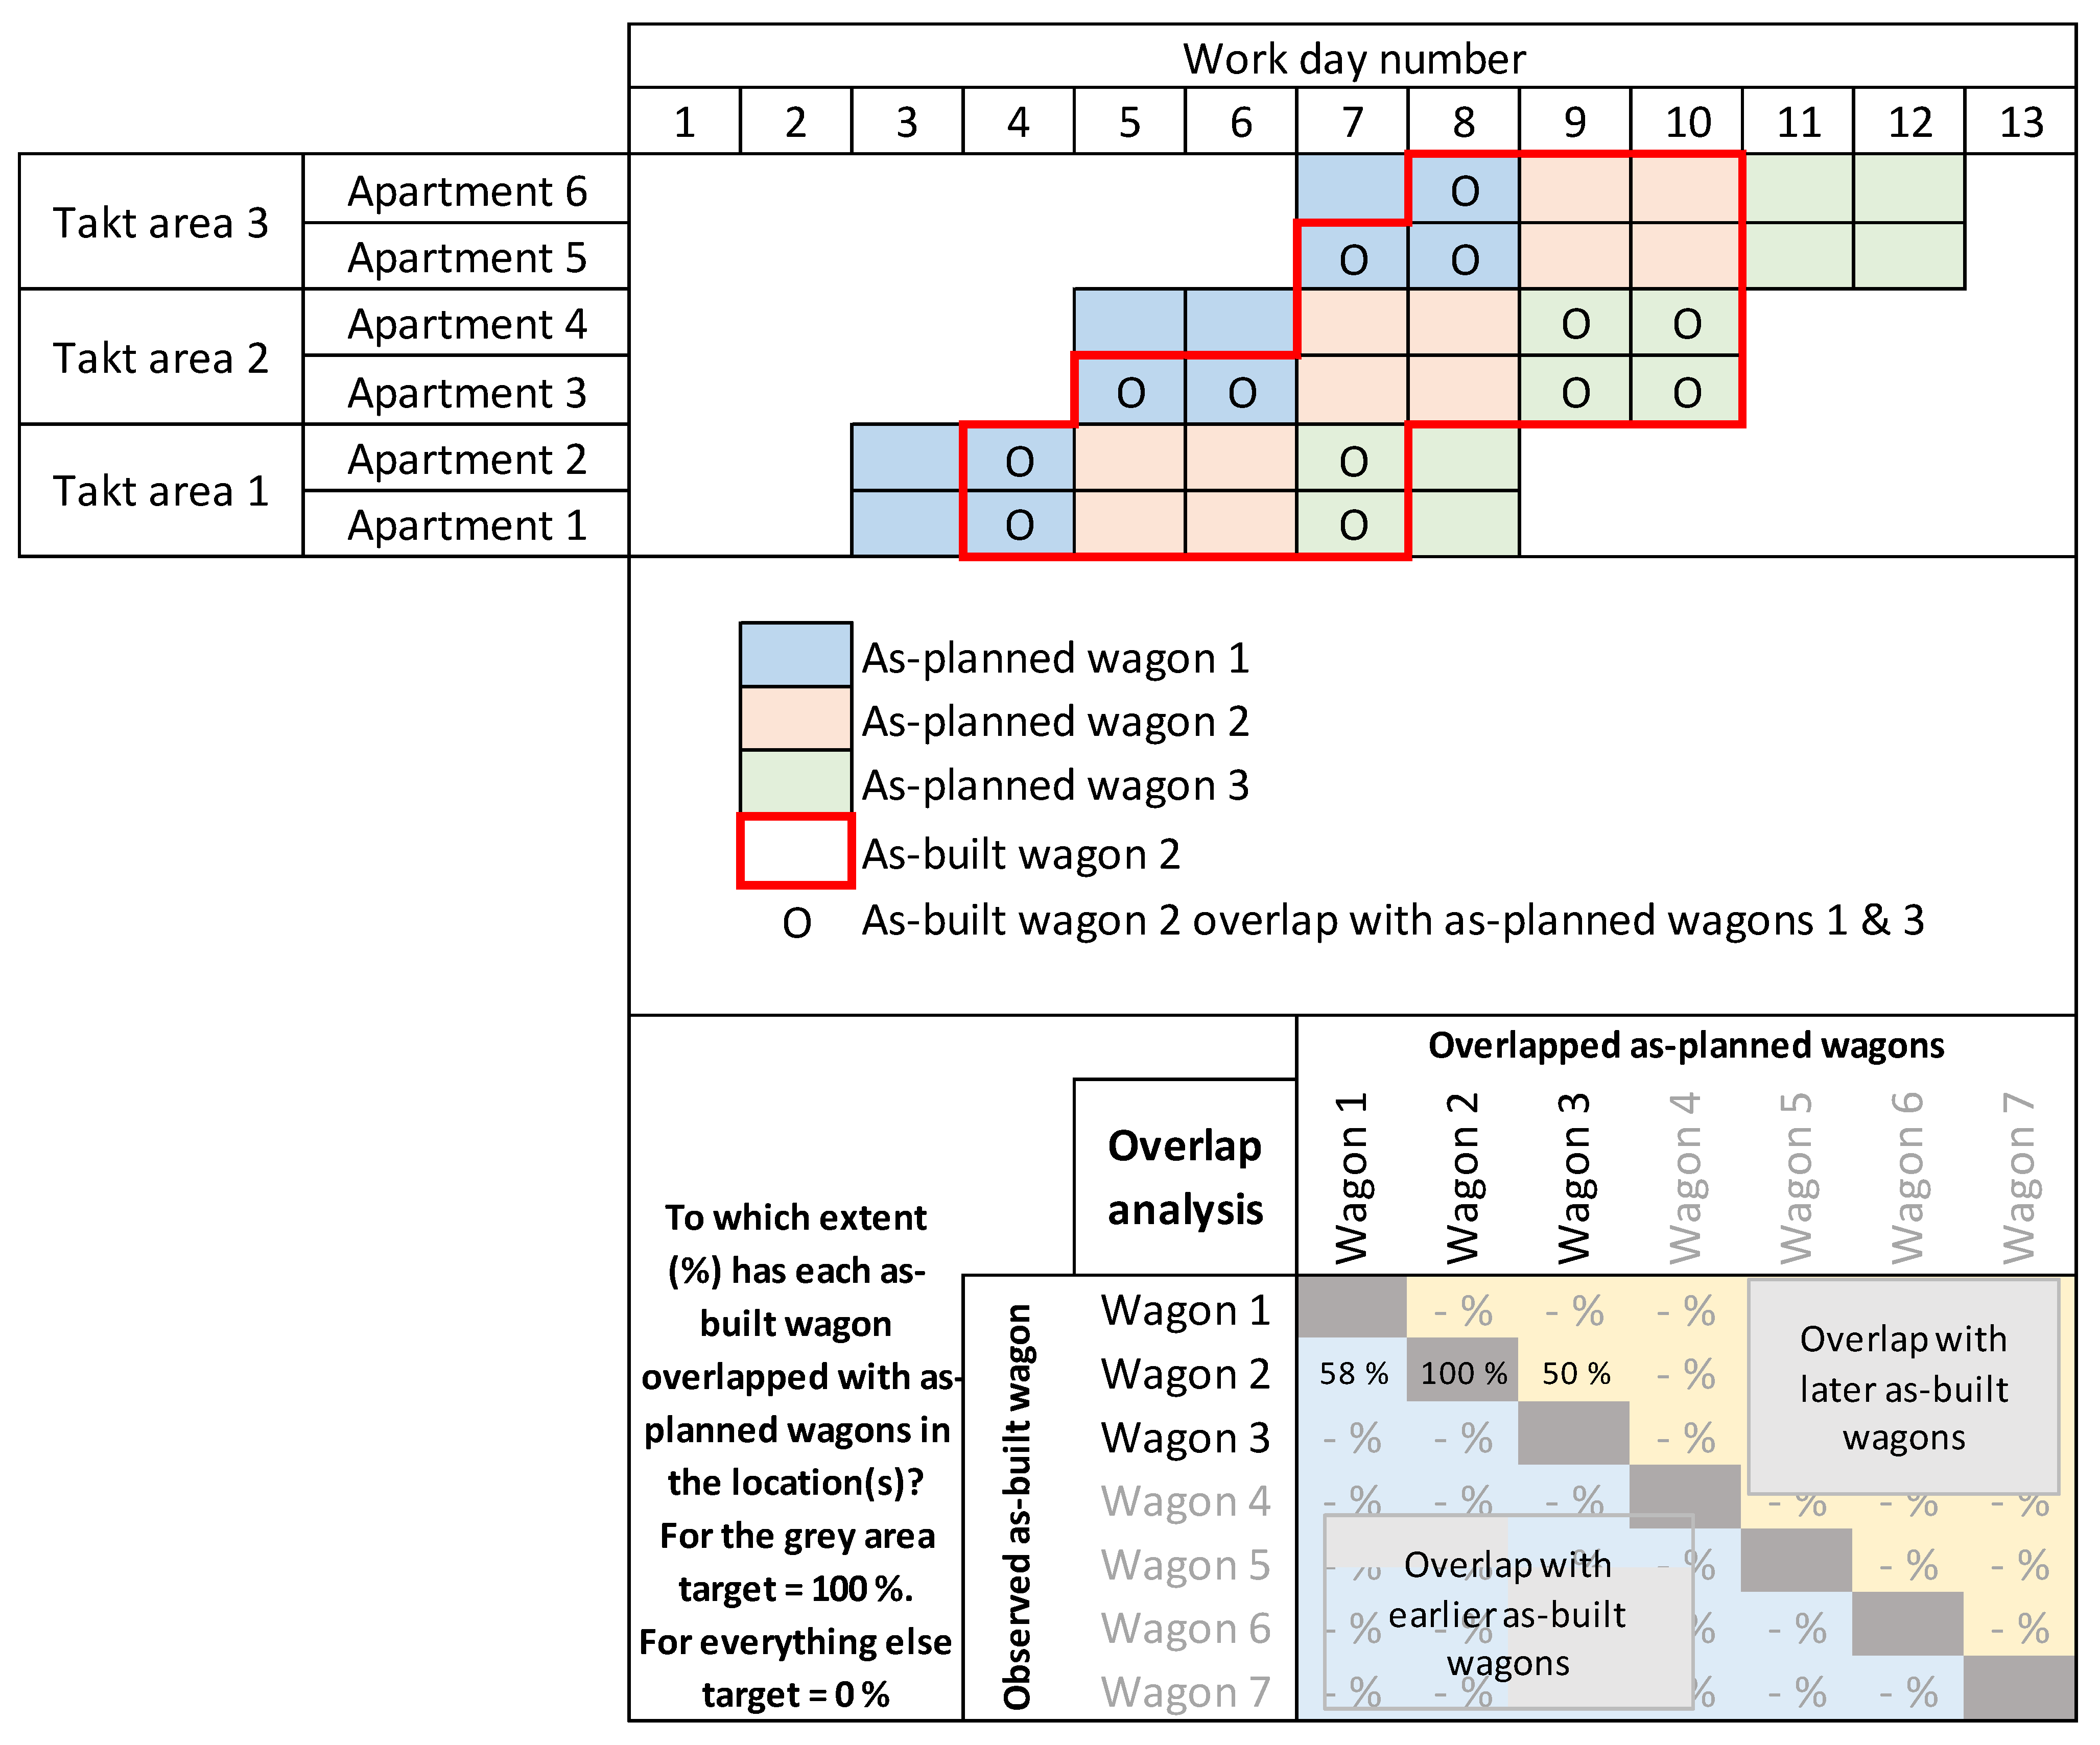
Often, the work contents of wagons are linked together in a critical path, and thus, the wagons must be executed on schedule to avoid disturbances. However, the wagons may overlap partly in practice, as not every task prevents the following wagon from being started, and plans are not necessarily followed rigorously. Wagons may spread over to more concurrent locations than planned and hinder the scheduled execution of other wagons. On the takt area level, some tasks may be partially executed concurrently, but on a more detailed level, as with apartments, there should not be several trades in a location. Concurrency can lead to unfinished tasks waiting for a worker or several tasks being executed side-by-side. Wagon overlap can be numerically assessed by dividing the takt schedule vertically into daily blocks and horizontally into apartment-level blocks. This divides the schedule into daily and apartment-level units, which are defined as “scheduling units” in this study. The overlap of wagons can be calculated by comparing the as-planned and as-built units of different wagons. In Figure 4, the as-built Wagon 2, with red borders, has spread over a period longer than planned, and 58 percent of it has been executed, overlapping with the scheduled targets of Wagon 1 (solid blue) and 50 percent with the targets of Wagon 3 (solid green). The proportion of overlap is represented in the matrix in the lower part of the figure. From the perspective of making do, this reveals that Wagon 2 had been unfinished in many locations at the time when Wagon 3 was supposed to start. All prerequisites for starting Wagon 3 on time undisturbedly have not been there.
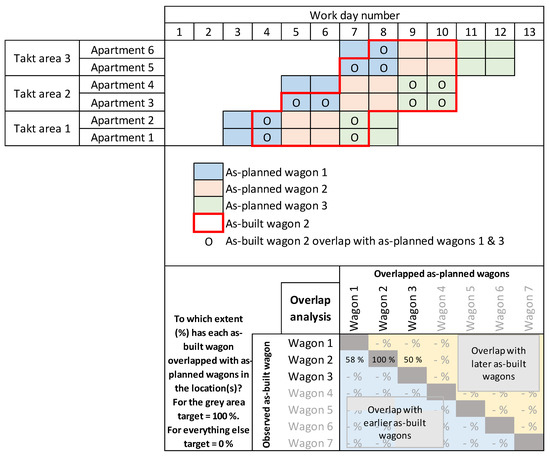
Figure 4.
Indicator of the overlap of wagon 2 execution and schedule targets for wagons 1 and 3.
This indicator assesses the proportion of tasks executed concurrently—a feature that takt production seeks to avoid. This indicator answers the question: “How many takt areas had undisturbed working conditions to work on one wagon?”. More specifically: “In how many takt areas and to what extent did different wagon pairs coincide?”.
4.5. Additional Developed Indicators
4.5.1. The On-Schedule, Early, and Late Proportions of a Wagon
Calculated as the proportions a wagon has been executed ahead, in, and behind the scheduled timeslot for each takt area. The schedule units defined in indicator 4 can be used to quantify this. For example, a wagon started 3 days ahead and finished 2 days behind schedule in location A (takt time 5 days) would have the following proportions for location A:
30% ahead, 50% in schedule, and 20% behind.
Combining proportions for each location for wagon A would reveal the overall performance of wagon A. Combining each wagon and each location would reveal the overall timeliness of the takt production system. Ranges could be introduced to identify tasks severely behind schedule, for example, “proportion of wagon at least 3 takt times behind schedule”.
Short-term production control should focus on trying to minimize the proportion that is behind schedule. Trends could be examined for this. Executing tasks ahead of schedule is technically against standardized takt, too, so it should also be minimized.
Takt plan adherence could be evaluated by calculating the number of units (divided by apartments and days) that have been completed ahead of schedule, on schedule, and behind schedule. This provides quantifiable information on the extent to which wagons have been completed ahead of schedule, on schedule, or behind schedule. This would also provide information on, for example, at which point during production a wagon falls behind schedule. The indicator answers the question: “To what extent did the wagons punctually follow the takt schedule?”. More specifically: “To what extent was the wagon executed ahead of schedule, on schedule or behind schedule?”.
4.5.2. Takt Schedule Performance Index—The Proportion of Scheduled Tasks Executed Until the Moment of Examination
Calculated as the proportion of scheduled wagons executed until the moment of examination. The division is
(Count of completed wagons) divided by (the count of wagons that were supposed to be completed until the moment of examination).
The value can be between 0 and 1; 1 indicates that (takt) production is fully on schedule. Technically, the production could also be ahead of schedule. However, early wagons are not counted to avoid a situation where early wagons cancel late wagons in the calculation. Allowing the value to progress beyond 1 would also encourage production control to progress ahead of schedule, which is against standardized takt.
Production control should attempt to reach a 100% completion rate at any moment of examination. Graphs and trends could be used to evaluate the evolution of the process.
The Duration Performance Index (DPI), examined earlier, seems to be well-suited for the numerical assessment of wagons with one modification. According to Khamooshi and Golafshani [37], the DPI also accounts for tasks that are ahead of schedule, which means that production performance may be better than scheduled (DPI > 1). In takt production, progressing ahead of schedule is not ideal, which is why it should not be credited when calculating production performance. With this adjustment, the DPI can be modified into a new Takt Schedule Performance Index (TSPI) that indicates the extent to which planned wagons have been completed until the moment of examination. The TSPI value can be between 0 and 1 and can be calculated by comparing completed wagons (or work steps) to planned wagons.
If examined on a visual timeline, this indicator indicates the consistency of the takt plan and the takt production execution in percentage. The procedure answers the question “Were the scheduled tasks done in time?”. More specifically, “To what extent have the tasks between the start of the takt schedule and the time of examination been completed?”.
4.5.3. Consistency between Weekly Work Plans and Takt Schedule Targets—The Target Consistency Index
Calculated as the number of wagons targeted for the following week in both the takt schedule AND the weekly work plan, divided by the number of wagons targeted in either the takt schedule OR the weekly work plan.
Target consistency index = A/(A + B), where
A = wagons targeted in both plans;
B = wagons targeted only in the weekly work plan.
For example, there are two wagons that are allocated for next week in both schedules. There are another four wagons that are allocated for the next week only in the weekly work plan (to crash the schedule). The weekly work plan targets are 2/(2 + 4) = 33% consistent with the takt schedule.
The value of the index can be between 0 and 1; 1 denotes 100% consistent targets.
This indicator would be most beneficial for after-the-fact evaluations (R&D). Graphs could be used to see the evolution of the consistency between different weeks.
Short-term scheduling may take place in addition to takt scheduling. The achievement of short-term targets can be evaluated similarly to the Last Planner System’s PPC value. However, the PPC value does not consider the consistency of set targets, which is essential in takt production. In takt production, short-term targets should include adherence to the takt schedule and/or crashing wagons that are late to keep the takt schedule viable and the production as planned. If short-term targets are continuously about crashing the schedule, the consistency and standardization of takt production could be lost.
The consistency between the takt schedule and the short-term targets can be compared by calculating the proportion of targets that are in accordance with the takt schedule out of all short-term targets. Let us call this value the Target Consistency Index (TCI). TCI = 1 signifies that the short-term targets are fully in line with the original takt schedule. Comprehensively documenting set targets is a requirement for this indicator.
This procedure evaluates how consistent the takt and short-term planning are. The indicator answers the question “Have schedule targets remained consistent irrespective of schedule level?”. More specifically, “To what extent do the short-term planning targets correspond with the takt schedule targets?”.
5. Discussion
Although takt production emphasizes punctuality [6] and data-based management [7,15,16], little has been written about how collected production data could be used for takt production management. In this study, production data is considered to include dates and locations of planned or executed tasks since these are the basic parameters a scheduler would define in a takt plan. Similarly, these are parameters that could be documented and monitored on-site, as was shown by Keskiniva et al. [19].
Based on the results, one of the main arguments of this study is that adapting existing indicators into the takt production context requires modifying them. This is because takt production introduces unconventionally rigorous and repetitive targets for each location and task. For example, the Location-Based Management System also emphasizes a steady pace for tasks, but not on conveyor belt style production level.
The connections between the developed indicators and previous work in this area were explained individually under each subchapter describing the developed indicators. The punctuality of executed wagons (Indicator 1) introduces considering each task and location individually, while Kenley and Seppänen [34] proposed monitoring the delay of the first and last location and the overall pace for each task in the Location-Based Management System. Wagon start and finish interval (Indicator 2) evaluates whether the set takt was adhered to. This is somewhat similar to the indicator “variation of duration per location” proposed by Lucko et al. [35] and Sacks et al. [38]. However, in takt production, the variation should be zero between each task (homogenous takt time), not just within one task. This paper suggests monitoring the takted proceeding of locations and trades separately, which borrows the ideas of “location flow” and “trade flow” introduced by Sacks [45] and Lehtovaara et al. [7]. A framework similar to the Clear Flow Matrix (CFMx) by Tiezzi et al. [51] could be used to visualize the status of the locations and tasks in a matrix form.
Wagon durations and WIP (Indicator 3) evaluate how much time (in comparison to the takt) has been spent for each task in each location and how many locations are reserved for a single wagon at once. Introducing location-specific durations is novel since takt production emphasizes executing each location and task in a homogenous takt. A more “regular” production system is more focused on the overall pace and timely start and finish of the first and last locations [34]. Faloughi et al. [31] already proposed calculating WIP from “general” production schedules. However, they do not consider the prospect of utilizing the takted wagon division of takt schedules for it. They also do not consider the as-built data for this, only as-planned schedules. Lucko et al. [35] also propose evaluating the work-in-process and task concurrency in location-based scheduling. They focus on minimizing WIP and task concurrency to ease daily management, resourcing, trade relocation, and learning. They do not focus on the adherence to a homogenous takt by comparing planned and materialized WIP, which is the proposal of this study.
Wagon execution overlap with targets of other wagons (Indicator 4) offers a novel way to evaluate whether trades have had the correct locations unoccupied at the right time. It also indicates to which extent this has happened. This ties into the basic construction management principle of reserving locations for one trade at a time [34]. It also partially considers the theoretical concept of making do, as overlapping wagons would mean starting a task in a location where previous tasks have not been finished.
The on-schedule, early, and late proportions of a wagon (Additional Indicator 1) simply quantify to which extent production has been early, late, or on time. This could be shown as percentages. The lateness and earliness could be graded further, for example, by indicating that “10% of wagons have been late over 5 takt times”. The authors recommend this examination since takt production attempts to achieve a standardized pace for the wagons [6]. Based on the literature study, such an indicator has not been suggested before.
Theoretical and practical views on prohibiting trades from working ahead of the takt schedule still need to be clarified. Theoretically, working ahead of schedule is against the idea of punctuality and homogenous takt. Furthermore, locations may not even be available for working ahead of schedule if other trades are handing over locations at a standardized takted rate. In practice, however, such prohibition may lead to a risk of higher tenders or poor subcontractor income [46]. Further research should be undertaken on whether proceeding ahead of the takt schedule is to be avoided or not.
Takt Schedule Performance Index (Additional Indicator 3) borrows the idea of the Duration Performance Index, which indicates the proportion of completed tasks compared to all targeted tasks up to date [37]. As a novelty, this study proposes omitting wagons completed ahead of time (targeted in the future) from the calculation since proceeding faster than the takt is against the concept of steady takt. This would also prevent wagons from proceeding too fast to cancel wagons proceeding too slow in the calculation.
The Target Consistency Index (Additional Indicator 4) compares the targets of short-term scheduling to the takt schedule. For example, The Last Planner System is sometimes used with takt production [52]. The LPS utilizes weekly work planning to introduce short-term targets, of which completion is evaluated with the PPC [52]. Arguably, a construction site might struggle to adhere to a steady takt while finding ways to determine realistic weekly (non-takted) tasks. This would lead to a high PPC value, but the uniformity between the takt schedule and the weekly work plans would be lost. This is why this paper suggests evaluating the consistency between these different levels of scheduling. Based on the literature review, this seems like a novel suggestion.
The authors of this study suggest that these developed indicators could be used for takt production management and long-term process development and to provide evidence for the status quo of the production method for the academia. The authors have noticed that little concrete evidence has been shown regarding the materialization of takt production projects. These indicators could be used to uniformly quantify the level of success of takt production projects. The practical relevance of this paper is that the indicators provide quick prompts, such as what is not progressing as planned, where should the control efforts be focused on next, and are current control measures effective. Controlling a hectic takt production system with “just briefly talking and meeting once a week” is not sufficient. For the research community, the indicators provide unambiguous valuations about the current state of takt production in practice. They could be used as a standard on which different takt production cases are evaluated. This is why the study is relevant. It contributes to theory because no such takt production indicators exist so far.
Table 3 summarizes the developed indicators, related objectives, and the literature inspiration for them. The as-planned and as-built perspectives are separated in the table. Further indicators for plan evaluation could include evaluating the homogeneity of planned start and finish intervals, the homogeneity of planned durations, and the steadiness of planned WIP. The indicators should be tracked during a longer period, which will show if takt production execution has improved based on the indicators.
Table 3.
The indicators for as-planned and as-built takt production.
6. Conclusions
Based on the literature, punctuality has not always been the target of takt production cases. Instead, the steady takt has already been lost at the planning stage. This is quite contradictory to the theoretical definition of takt production and makes it more difficult to evaluate the execution of takt production, as even the plans are not necessarily consistent with objectives of homogeneity described in the theory. For further research, a clearer distinction should be made regarding what takt production is and is not.
Processing and presenting the data related to the targets and execution of takt production have not been discussed in the literature, even though the significance of daily management [6], visual management [17], and key performance indicator-based management [16] have been highlighted. There is a need for presenting collected production data for the field and the research community, and this study has built a framework for this by considering different ways of defining indicators from the collected data. This paper contributes to the existing knowledge by building a foundation for the evaluation of takt production projects and further development of takt production-related indicator testing and application.
The takt schedule consists of units divided by takt areas and takt time, which, based on this study, enables quantifying the production schedule and execution into a numerical format. This allows comparison of the schedule and execution if temporal as-built information is collected at least with the same accuracy as the schedule is planned. The quantification can be utilized to produce diverse new indicators, which was proven in this study. From the viewpoint of schedule targets, consistent takt times of trades and locations, the planned amount of WIP, and consistency of the takt schedule and short-term targets can be assessed. From the viewpoint of production execution, the takt compliance of wagons, wagon duration by location, wagon overlap, wagon starts without prerequisites being met, and overtime work. In addition, two new indicators, the TSPI and the STCI, were introduced in the study.
From a broader perspective, this study focused on converting temporal data from schedules and production execution into information in indicator form. The purpose of the process is to increase the understanding of the parties of what is to be done in takt production, what has been done, what should have been done, what deviates from the schedule, and which matters should be addressed. Managers and researchers also gain insights from this for constant development. Information makes it possible to identify which tasks are not running according to takt production, in which case development measures can be targeted at these issues. This reduces the amount of development measures taken solely based on recollections.
The results are conceptual, and they have not been tested in practical projects, which is why their effectiveness and suitability should be studied in the future. Practical application was not possible during this study, but it would help identify potential shortcomings or needs for improvement, as well as further clarify potential uses for the indicators. Commercial applications of the indicators in digital software could be a topic for future research. In addition, the development of new and complementary indicators is advisable, as the list of indicators developed in this study is unlikely to be exhaustive. The presumption in this study has been that these indicators, logically, serve the purpose of increasing the knowledge of managers and, when appropriately abridged, trades and subcontractors, as the indicators illustrate production targets, status, and problems in a visual form. It has also been presumed that the indicators, logically, serve development, as they indicate how takt production projects have been executed according to takt production principles.
One of the main limitations of this study is that it has not been tested empirically. The authors attempted to comprehensively describe, rationalize, and visualize the developed indicators so that they are hopefully easy to understand and to evaluate as a reader, especially if the reader is accustomed to takt production. A theoretical background was also provided for the indicators if they were inspired by something that already exists in the literature. Regardless, testing the indicators in a case study could have revealed issues or needs for improvement. Unfortunately, such an opportunity was not available for the authors at this time. The authors see some potential issues that could be revealed by a future case study. Some potential challenges include acquiring robust data, time availability for documentation and updating, data collection methodology, interpreting the indicators, falsifying the data, the ambiguity of data, and the value of each indicator.
Author Contributions
Conceptualization, K.K., A.S., and J.-M.J.; Formal analysis, K.K.; Investigation, K.K.; Methodology, K.K. and A.S.; Project administration, A.S.; Supervision, A.S. and J.-M.J.; Visualization, K.K.; Writing—original draft, K.K.; Writing—review and editing, K.K., A.S., and J.-M.J. All authors have read and agreed to the published version of the manuscript.
Funding
This research received no external funding.
Data Availability Statement
Data is contained within the article.
Conflicts of Interest
The authors declare no conflict of interest.
References
- Liker, K. Toyota Way: 14 Management Principles from the World’s Greatest Manufacturer, 1st ed.; McGraw-Hill Education: New York, NY, USA, 2004. [Google Scholar]
- Haghsheno, S.; Binninger, M.; Dlouhy, J.; Sterlike, S. History and theoretical foundations of takt planning and takt control. In Proceedings of the 24th Annual Conference of the International Group for Lean Construction (IGLC 24), Boston, MA, USA, 20–22 July 2016. [Google Scholar]
- Alhava, O.; Rinne, V.; Laine, E.; Koskela, L. Can a Takt Plan Ever Survive Beyond the First Contact with the Trades On-Site? In Proceedings of the 27th Annual Conference of the International Group for Lean Construction, Dublin, Ireland, 1–7 July 2019. [Google Scholar]
- Frandson, A.; Berghede, K.; Tommelein, I.D. Takt time planning for construction of exterior cladding. In Proceedings of the 21st Annual Conference of the International Group for Lean Construction, Fortaleza, Brazil, 29 July–2 August 2013. [Google Scholar]
- Haugen, C.G.; Lædre, O.; Aslesen, S. Takt performance indicators. In Proceedings of the 28th Annual Conference of the International Group for Lean Construction, Berkeley, CA, USA, 6–12 July 2020. [Google Scholar]
- Dlouhy, J.; Binninger, M.; Oprach, S.; Haghsheno, S. Three-level method of Takt planning and Takt control—A new approach for designing production systems in construction. In Proceedings of the 24th Annual Conference of the International Group for Lean Construction (IGLC 24), Boston, MA, USA, 20–22 July 2016. [Google Scholar]
- Lehtovaara, J.; Seppänen, O.; Peltokorpi, A.; Kujansuu, P.; Grönvall, M. How takt production contributes to construction production flow: A theoretical model. Constr. Manag. Econ. 2020, 39, 73–95. [Google Scholar] [CrossRef]
- Hopp, W.J.; Spearman, M.L. Factory Physics; Waveland Press: LongGrove, IL, USA, 2008. [Google Scholar]
- Frandson, A. Takt Time Planning as a Work Structuring Method to Improve Construction Work Flow; University of California: Berkeley, CA, USA, 2019. [Google Scholar]
- Dlouhy, J.; Binninger, M.; Haghsheno, S. Buffer management in takt planning—An overview of buffers in takt production systems. In Proceedings of the Annual Conference of the International Group for Lean Construction, Dublin, Ireland, 1–7 July 2019. [Google Scholar]
- Linnik, M.; Berghede, K.; Ballard, G. An experiment in takt time planning applied to non-repetitive work. In Proceedings of the 21st Annual Conference of the International Group for Lean Construction, Fortaleza, Brazil, 29 July–2 August 2013. [Google Scholar]
- Binninger, M.; Dlouhy, J.; Oprach, S.; Haghsheno, S. Methods for Production Leveling—Transfer from Lean Production to Lean Contruction. In Proceedings of the 24th Annual Conference of the International Group for Lean Construction, Boston, MA, USA, 20–22 July 2016. [Google Scholar]
- Binninger, M.; Dlouhy, J.; Müller, M.; Schattmann, M.; Haghsheno, S. Short Takt Time in Construction—A Practical Study. In Proceedings of the 26th Annual Conference of the International Group for Lean Construction, Chennai, India, 16–22 July 2018. [Google Scholar]
- Binninger, M.; Dlouhy, J.; Haghsheno, S. Technical takt planning and takt control in construction. In Proceedings of the 25th Annual Conference of the International Group for Lean Construction, Heraklion, Greece, 9–12 July 2017. [Google Scholar]
- Von Heyl, J.; Teizer, J. Lean production controlling and tracking using digital methods. In Proceedings of the 25th Annual Conference of the International Group for Lean Construction, Heraklion, Greece, 9–12 July 2017. [Google Scholar]
- Lehtovaara, J.; Heinonen, A.; Lavikka, R.; Ronkainen, M.; Kujansuu, P.; Ruohomäki, A.; Örmä, M.; Seppänen, O.; Peltokorpi, A. Takt maturity model: From individual successes towards systemic change in Finland. In Proceedings of the 28th Annual Conference of the International Group for Lean Construction, Berkeley, CA, USA, 6–12 July 2020. [Google Scholar]
- Grönvall, M.; Ahoste, H.; Lehtovaara, J.; Reinbold, A.; Seppänen, O. Improving Non-Repetitive Takt Production with Visual Management. In Proceedings of the Annual Conference of the International Group for Lean Construction, Lima, Peru, 14–17 July 2021. [Google Scholar]
- Sahlberg, J.; Lehtovaara, J.; Seppänen, O. Implementing Takt Production in Renovation Projects. In Proceedings of the Annual Conference of the International Group for Lean Construction, Lima, Peru, 14–17 July 2021. [Google Scholar]
- Keskiniva, K.; Saari, A.; Junnonen, J.M. Takt production monitoring and control in apartment renovation projects. Buildings 2021, 11, 92. [Google Scholar] [CrossRef]
- Gilson, L.L.; Goldberg, C.B. Editors’ comment: So, what is a conceptual paper? Group Organ. Manag. 2015, 40, 127–130. [Google Scholar] [CrossRef]
- McGregor, S. Conceptual and theoretical papers. In Understanding and Evaluating Research: A Critical Guide, 1st ed.; SAGE Publications: Thousand Oaks, CA, USA, 2018; pp. 497–528. [Google Scholar]
- San Martin, A.P.; Formoso, C.T. Evaluating building systems based on production’s process management and lean construction’s concepts. In Proceedings of the Conference of the International Group for Lean Construction, Guarujá, Brazil, 13–15 August 1998. [Google Scholar]
- Bernardes, M.M.; Formoso, C.T. Contributions to the evaluation of production planning and control systems in building companies. In Proceedings of the 10th Annual Conference of the International Group for Lean Construction, Gramado, Brazil, 6–8 August 2002. [Google Scholar]
- Ramirez, R.R.; Alarcón LF, C.; Knights, P. Benchmarking system for evaluating management practices in the construction industry. J. Manag. Eng. 2004, 20, 110–117. [Google Scholar] [CrossRef]
- Seppänen, O.; Kenley, R. Performance measurement using location-based status data. In Proceedings of the International Group for Lean Construction (IGLC)-13, Sydney, Australia, 19–21 July 2005. [Google Scholar]
- España, F.; Tsao, C.C.; Hauser, M. Driving continuous improvement by developing and leveraging lean key performance indicators. In Proceedings of the Annual Conference of the International Group for Lean Construction, San Diego, CA, USA, 17–22 July 2012. [Google Scholar]
- Alarcón, L.F.; Salvatierra, J.L.; Letelier, J.A. Using last planner indicators to identify early signs of project performance. In Proceedings of the 22th Annual Conference of the International Group for Lean Construction, Oslo, Norway, 25–27 June 2014. [Google Scholar]
- Bølviken, T.; Kalsaas, B.T. Discussion on strategies for measuring work flow in construction. In Proceedings of the International Group for Lean Construction IGLC19, Lima, Peru, 14–17 July 2011. [Google Scholar]
- Emdanat, S.; Linnik, M.; Christian, D. A framework for integrating Takt planning, last planner system and labor tracking. In Proceedings of the 24th Annual Conference of the International Group for Lean Construction (IGLC), Boston, MA, USA, 20–22 July 2016. [Google Scholar]
- Lehtovaara, J.; Heinonen, A.; Ronkainen, M.; Seppänen, O.; Peltokorpi, A. Takt Production as Operations Strategy: Client’s Perspective to Value-Creation and Flow. In Proceedings of the Annual Conference of the International Group for Lean Construction, Lima, Peru, 14–17 July 2021. [Google Scholar]
- Faloughi, M.; Linnik, M.; Murphy, D.; Frandson, A.G. WIP design in a construction project using takt time planning. In Proceedings of the 23rd Annual Conference of the International Group for Lean Construction, Perth, Australia, 28–31 July 2015. [Google Scholar]
- Ali, R.M.; Deif, A.M. Dynamic lean assessment for takt time implementation. Procedia Cirp 2014, 17, 577–581. [Google Scholar] [CrossRef]
- Barth, K.B.; Formoso, C.T. Requirements in performance measurement systems of construction projects from the lean production perspective. Front. Eng. Manag. 2021, 8, 442–455. [Google Scholar] [CrossRef]
- Kenley, R.; Seppänen, O. Location-Based Management for Construction: Planning, Scheduling and Control; Routledge: London, UK, 2010. [Google Scholar]
- Lucko, G.; Alves TD, C.; Angelim, V.L. Challenges and opportunities for productivity improvement studies in linear, repetitive, and location-based scheduling. Constr. Manag. Econ. 2014, 32, 575–594. [Google Scholar] [CrossRef]
- Fleming, Q.W.; Koppelman, J.M. Earned Value Project Management, 2nd ed.; Project Management Institute: Newtown Square, PA, USA, 2000. [Google Scholar]
- Khamooshi, H.; Golafshani, H. EDM: Earned Duration Management, a new approach to schedule performance management and measurement. Int. J. Proj. Manag. 2014, 32, 1019–1041. [Google Scholar] [CrossRef]
- Sacks, R.; Seppänen, O.; Priven, V.; Savosnick, J. Construction flow index: A metric of production flow quality in construction. Constr. Manag. Econ. 2017, 35, 45–63. [Google Scholar] [CrossRef]
- Kenley, R. CME Forum: A response to “Construction flow index: A metric of production flow quality in construction”. Constr. Manag. Econ. 2019, 37, 112–119. [Google Scholar] [CrossRef]
- Seppänen, O. Empirical Research on the Success of Production Control in Building Construction Projects. Ph.D. Thesis, Helsinki University of Technology, Espoo, Finland, 2009. [Google Scholar]
- Seppänen, O.; Kankainen, J. An empirical research on deviations in production and current state of project control. In Proceedings of the 12th Annual Conference of the International Group for Lean Construction, Helsingør, Denmark, 3–5 August 2004. [Google Scholar]
- Lehtovaara, J.; Mustonen, I.; Peuronen, P.; Seppänen, O.; Peltokorpi, A. Implementing takt planning and takt control into residential construction. In Proceedings of the Annual Conference of the International Group for Lean Construction, Dublin, Ireland, 1–7 July 2019. [Google Scholar]
- Ballard, H.G. The Last Planner System of Production Control. Doctoral Dissertation, University of Birmingham, Birmingham, UK, 2000. [Google Scholar]
- Lipke, W. Connecting earned value to the schedule. Meas. News 2004, 1, 6–16. [Google Scholar]
- Sacks, R. What constitutes good production flow in construction? Constr. Manag. Econ. 2016, 34, 641–656. [Google Scholar] [CrossRef]
- Keskiniva, K.; Saari, A.; Junnonen, J.M. Suggestions for takt production subcontract clauses—A conceptual study. Constr. Innov. 2023, 23, 425–442. [Google Scholar] [CrossRef]
- Keskiniva, K.; Saari, A.; Junnonen, J.M. Takt planning in apartment building renovation projects. Buildings 2020, 10, 226. [Google Scholar] [CrossRef]
- Kujansuu, P.; Lehtovaara, J.; Salerto, S.; Seppänen, O.; Peltokorpi, A. How does takt production contribute to trade flow in construction? In Proceedings of the Annual Conference of the International Group for Lean Construction, Berkeley, CA, USA, 6–12 July 2020. [Google Scholar]
- Koskela, L.J. Making do—The eighth category of waste. In Proceedings of the 12th Annual Conference of the International Group for Lean Construction, Helsingør, Denmark, 3–5 August 2004. [Google Scholar]
- Koskela, L.J.; Stratton, R.; Koskenvesa, A. Last planner and critical chain in construction management: Comparative analysis. In Proceedings of the 18th Annual Conference of the International Group for Lean Construction, Haifa, Israel, 14–16 July 2010. [Google Scholar]
- Tiezzi, A.; Lott, D.; Lott, W.; O’Brien, W.J.; Borcherding, J. Case Study of Efficiency Improvements Using Matrix Methods of Production Management in Building Construction. In Proceedings of the Construction Research Congress, Reston, VA, USA, 8–10 March 2020. [Google Scholar]
- Frandson, A.; Berghede, K.; Tommelein, I.D. Takt-time planning and the last planner. In Proceedings of the 22nd Annual Conference of the International Group for Lean Construction, Oslo, Norway, 25–27 June 2014. [Google Scholar]
Disclaimer/Publisher’s Note: The statements, opinions and data contained in all publications are solely those of the individual author(s) and contributor(s) and not of MDPI and/or the editor(s). MDPI and/or the editor(s) disclaim responsibility for any injury to people or property resulting from any ideas, methods, instructions or products referred to in the content. |
© 2023 by the authors. Licensee MDPI, Basel, Switzerland. This article is an open access article distributed under the terms and conditions of the Creative Commons Attribution (CC BY) license (https://creativecommons.org/licenses/by/4.0/).