Article

Experimental Study on Static Wind Uplift Resistance of Roofing Systems

1
School of Resources and Architectural Engineering, Gannan University of Science and Technology, Ganzhou 341000, China
2
School of Civil Engineering, Central South University, Changsha 410075, China
*
Authors to whom correspondence should be addressed.
Buildings 2024, 14(1), 65; https://doi.org/10.3390/buildings14010065
Submission received: 13 November 2023 / Revised: 19 December 2023 / Accepted: 22 December 2023 / Published: 25 December 2023
(This article belongs to the Section Building Materials, and Repair & Renovation)

Abstract

:
Metal roof systems were widely utilized in various important buildings; however, cases of wind damage were often observed. In this paper, wind uplift tests of standing seam aluminum magnesium manganese and continuous welded stainless-steel roof systems were conducted, and the wind resistance bearing capacity and mechanical properties of key joints in the two roof systems were compared and analyzed. Strain gauges and displacement sensors were arranged at different structural layers and key nodes of the roof system to compare and analyze the stress and displacement changes. The results showed that the wind resistance capacity of the continuous welded stainless-steel roof system was more than 25% higher than that of the standing seam aluminum magnesium manganese roof system. The stress and displacement of the roof system gradually increased with the increase in wind load. Obvious differences in stress at different positions of the two roof systems were identified. The stress at the roof panel of the roof system was greater than that of other structural layers, and the maximum displacement of the roof panel in the elastic stage could reach more than 97.5 mm. The fitting coefficient between the test and the finite element was 0.976, and the ultimate bearing capacity of Specimen B was 479.64 MPa. The research results of this paper can provide some data support and reference for engineering design and applications.

1. Introduction

Compared with foreign countries, China’s roofing systems industry developed relatively late, and the early selection of metal roof panel materials and roof structure forms was relatively limited [1]. However, since the early 21st century, driven by the continuous enhancement of the national economic landscape and ongoing advancements in new materials and technologies, roofing systems have evolved from the initial use of self-tapping screws for direct perforation of roof panels to diverse structural forms such as occlusion, buckling, and continuous welding [2,3]. Currently, the roof systems in projects mainly include the single-layer membrane roof system, the standing seam aluminum alloy roof system, and the continuous welding stainless-steel roof system. The metal enclosure system industry is gradually emerging with the vigorous development of steel structure buildings. Metal coils have the advantages of easy processing and modeling, strong plasticity, corrosion resistance, easy maintenance, light structure, flexible installation, long service life, and recycling. They meet the requirements of light weight, high strength, fast construction, and green environmental protection of steel structure buildings [4]. The system has been widely used in public and industrial installations and steel structures. As a light envelope structure system, the metal roof is susceptible to the action of wind load. In the face of strong winds, the wind suction and pulsation effects often led to component disconnections [5]. It can be seen that understanding the wind resistance of roofing systems is of great significance for engineering applications and design.
The Al-Mg-Mn standing seam roof system is a kind of roofing system which is widely used. Compared with the self-tapping screw-fixed profiled sheet metal roof, the standing seam roof has the advantage of non-perforation of the roof, which can prevent the premature occurrence of roof leakage to a certain extent [6,7]. Nevertheless, the damaging of metal roofs in significant public places caused by wind loads still occurs occasionally. Damatty [8] established a three-dimensional finite element ANSYS model to simulate a full-scale experiment of a standing seam roofing system as part of an experiment on the wind-absorbing performance of standing seam roofing systems to improve the typical roofing system and apply this knowledge to industrial buildings. The roof panel was simulated using thin shell elements, while spring elements were utilized to represent the supporting purlins. Recognizing the intricacy of the bracket and gap areas, an equivalent elasticity approach was implemented in manufacturing these components. The characteristics of these springs are simulated by experiments. The equivalent spring system is then applied to the whole element model to analyze the model’s response under wind suction. This numerical model’s reliability is verified by comparison with the full-scale experimental results. Ali [9] used the finite element method to simulate the response of a standing seam panel under wind load and used a numerical model to evaluate the loss under storm conditions. This method is biased towards single-layer panel members. Petrov [10] studied fatigue life of a steel structure under random wind loads. Xu [11] introduced a method to estimate the fatigue life of metal roofs. The fatigue life of a metal roof was obtained by experimentation and compared with its designed fatigue life. Kumar [12] proposed a method to calculate wind-induced fatigue damage by using Miner’s rule and Goodman’s method. Baskaran [13,14] mainly studied the wind resistance of flexible membrane roofs, obtained a large amount of experimental data, studied the wind suction bearing capacity and bolt connection performance of various roof systems, and put forward some wind resistance design formulas and suggestions for light roofs.
According to post-failure investigations, it has been found that roof systems are vulnerable to damage at the connections of key nodes. Domestic and foreign scholars have conducted a series of studies on the mechanical properties of key connection nodes [15,16]. The connection forms of key nodes in a single-layer membrane roof system are mainly screws, roof panels, and purlins. The main failure modes are pull-through failure and pull-out failure [17,18]. The joint connections of a standing seam metal roofing system mainly includes the roof panel, support, screws, etc., and their failure modes mostly involve the roof panel and the support. Luan [19] studied the uplift bearing capacity of Z-shaped support joints through 20 sets of tests. The results show that the number of supports has a great influence on the failure mode of Z-shaped purlins. More valuable results in this area can also be supplemented and verified in many studies [20,21,22]. The research results provide a large amount of supporting data for strengthening the design safety of metal roofing systems. A continuously welded stainless-steel roof system’s failure nodes mainly occur at the roof panel’s welding point or the bearing connection [23].
In summary, the research on the wind resistance of metal roof systems and the mechanical properties of key joints primarily focused on aluminum–magnesium–manganese standing seam roofs in the past. The emphasis was on studying the bearing capacity of the roof system and its components. However, there are limited studies on the mechanical properties and deformation characteristics of key joints. Furthermore, research on the wind resistance and key node performance of continuous welded stainless-steel roof systems is scarce, and there is no comparative analysis of the wind resistance between the two types of roof system. In this paper, two typical vertically locking edge and continuous welded stainless-steel roof systems from a project were selected for static wind uplift tests. The study involved measuring the stress and displacement at key nodes and comparing and analyzing the mechanical properties of the two roof systems at these critical points. Utilizing the test method, a comprehensive analysis of the mechanical properties and deformation characteristics of the two roof systems under static wind load was conducted. This research offers data support and a reference for the design and implementation of related projects.

2. Experimental Program
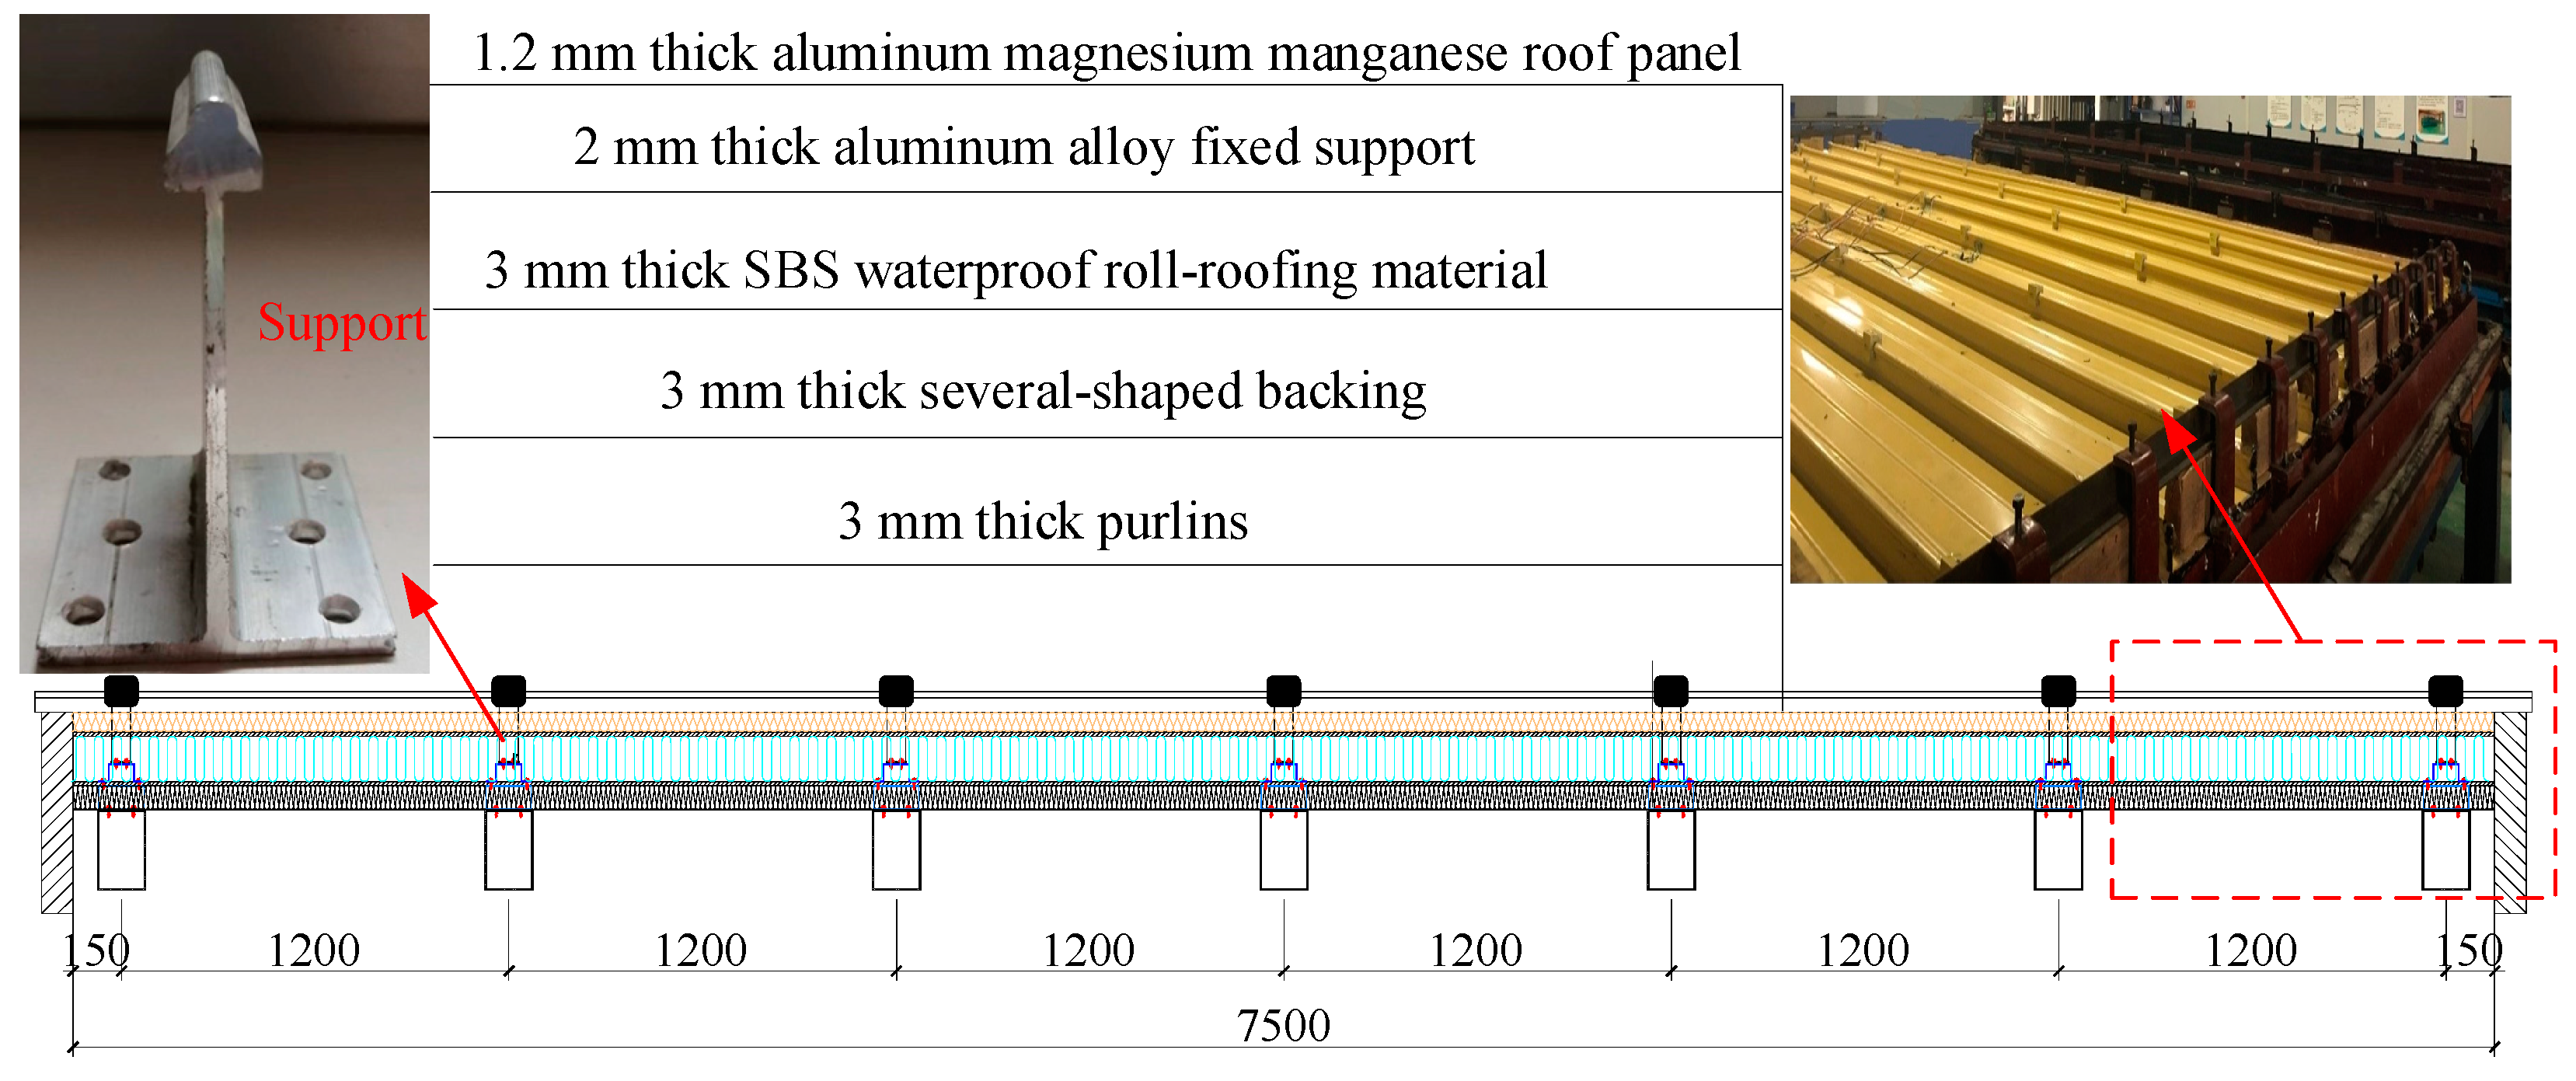
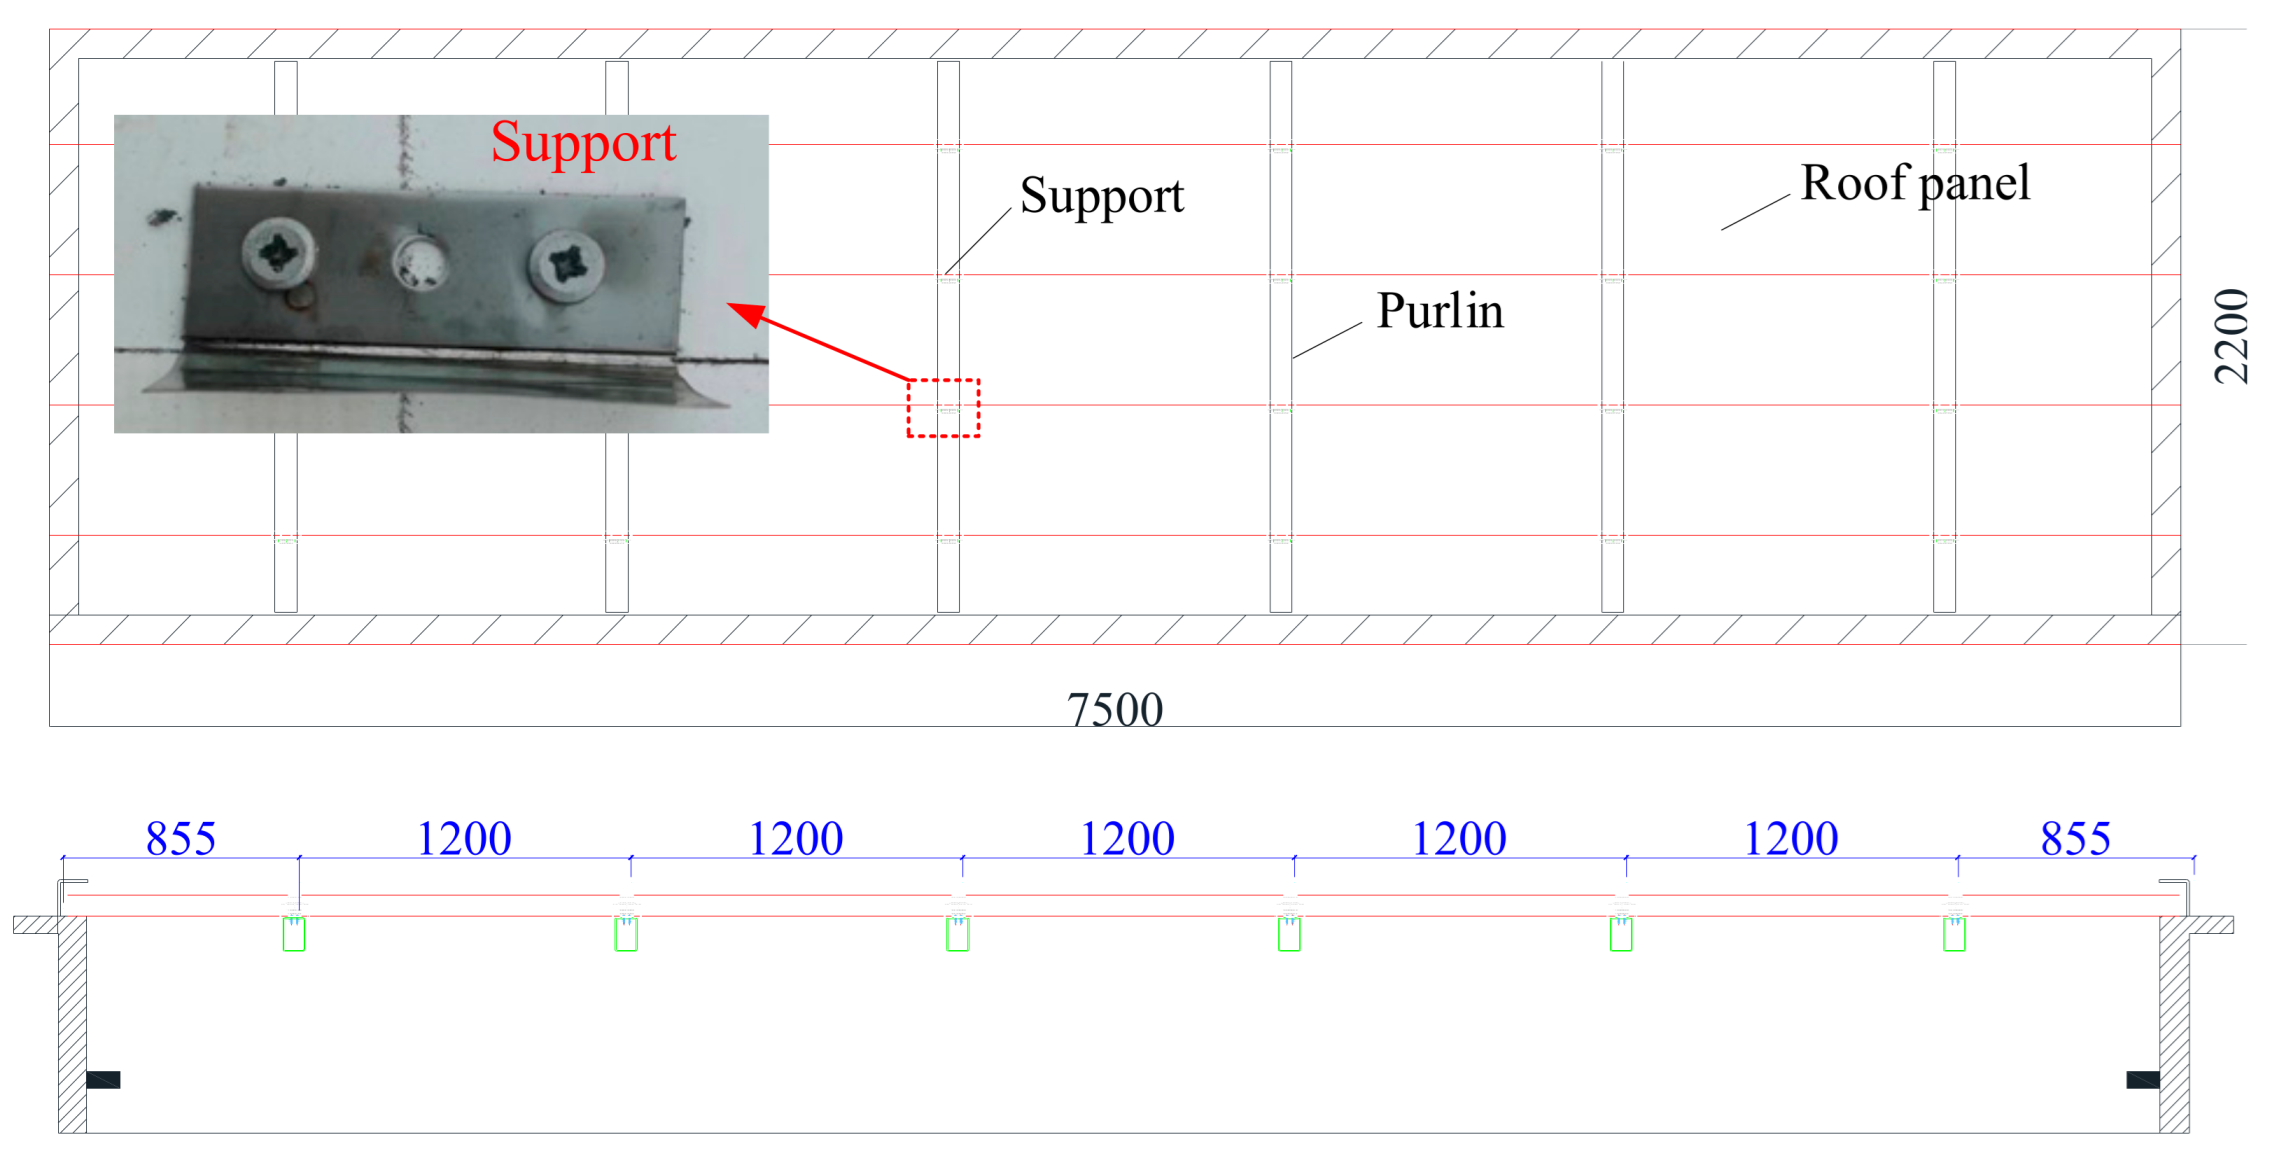
2.1. Test Device

The test device consisted of a bottom mounting frame, an upper-pressure direction, and a wind-pressure-providing device, and its performance met the requirements of the test results [24]. Notably, the upper-pressure box of the test device was in a closed state, featuring an independent pressure application device functioning as a negative pressure chamber. The test box utilized steel structure components, divided into upper, middle, and lower units. The test specimens were installed in the test frame between the upper and lower boxes. Four observation windows were positioned on both sides of the upper box, with lighting and camera devices installed inside. The upper and lower boxes were created by an independent wind-source-generating mechanism, and the pressure measuring point was a wind pressure sensor capable of real-time measurement of the wind pressure in the box. The plane size of the test box was 3.8 m × 7.7 m. Specifically, the upper box could generate a specific frequency of pulse wind suction or pressure inside it based on the test requirements. Similarly, the lower box could generate a certain uniform wind suction or pressure according to the test requirements, equipped with high-precision pressure acquisition equipment that achieved an accuracy level of 0.05 (10 Pa), ensuring precise measurement of the box’s pressure. A schematic diagram of the test device is depicted in Figure 1.

2.2. Specimen Design
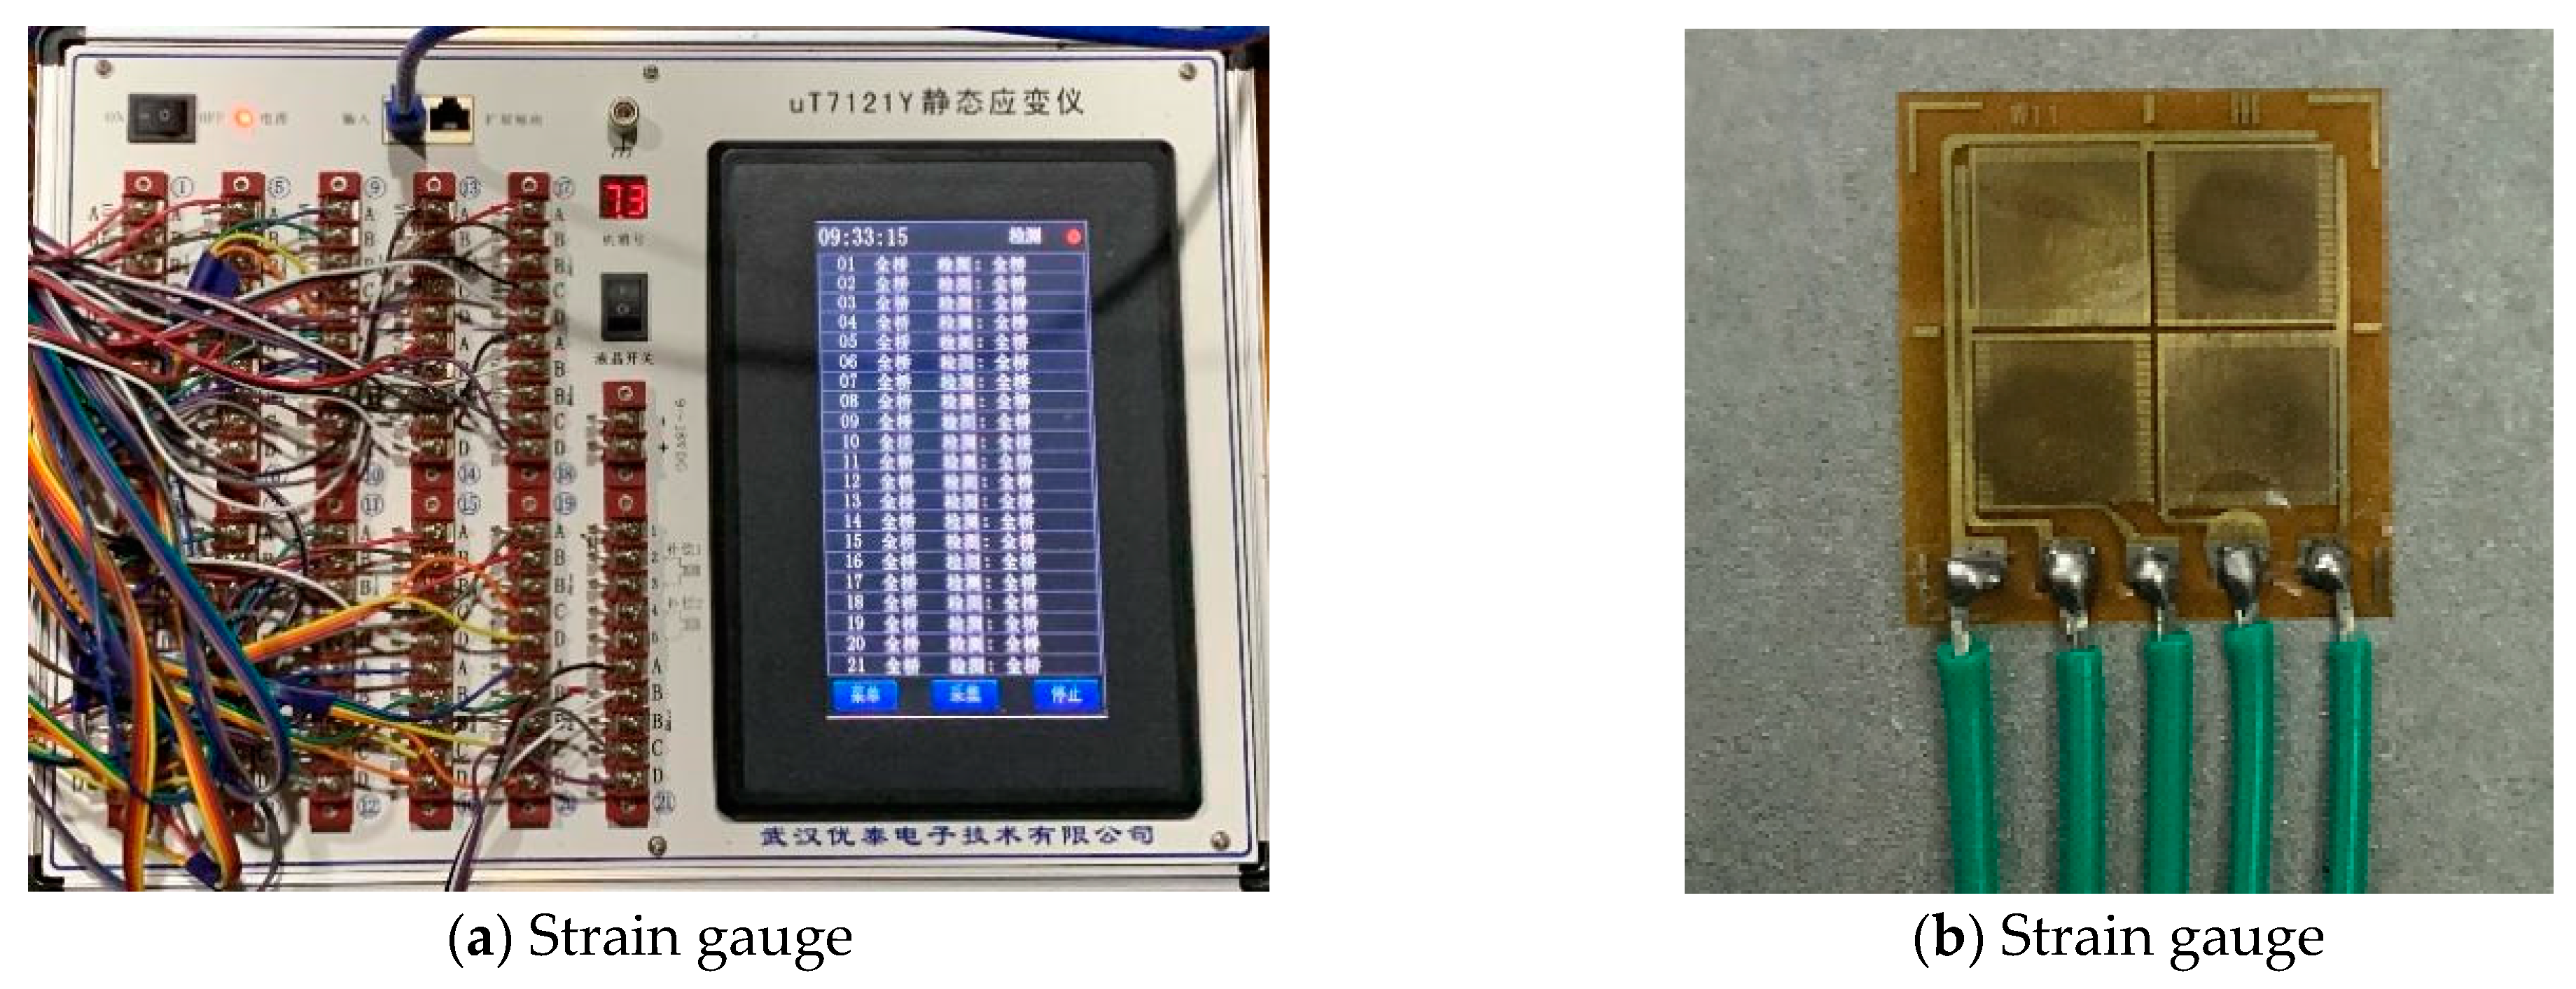
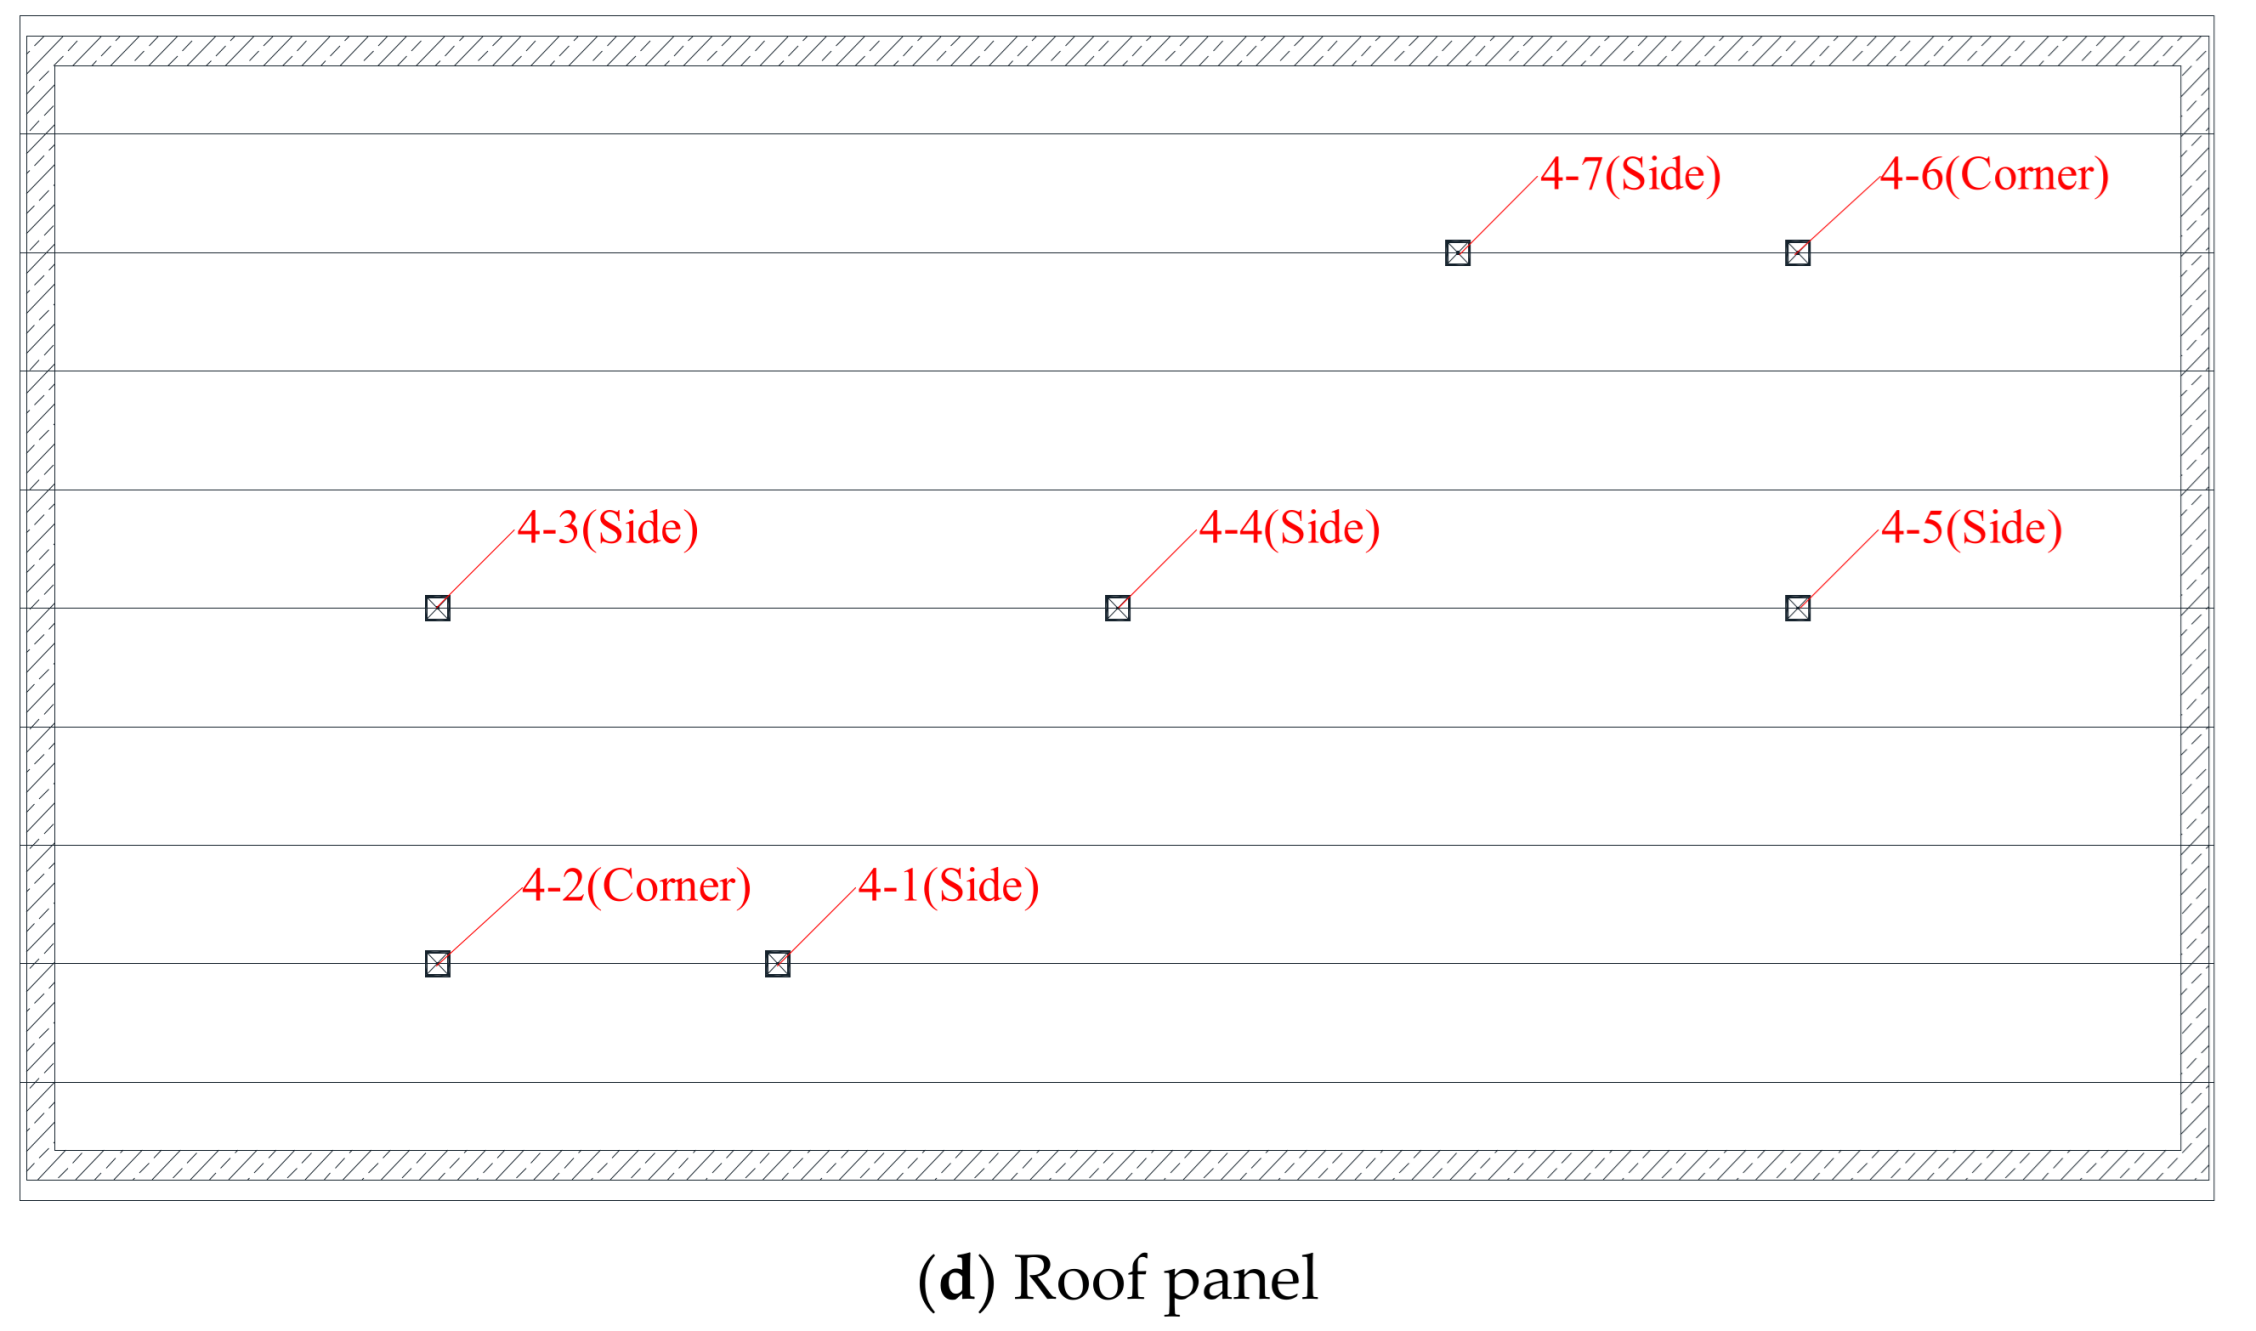
The test specimens comprised a standing seam aluminum magnesium manganese roof system (Specimen A) and a continuous welded stainless-steel roof system (Specimen B). The length and purlin spacing for both specimens were 7500 mm and 1200 mm, respectively. The widths of Specimen A and Specimen B were 3600 mm and 2200 mm, respectively. Specimen A consisted of a complete structural layer with a roof panel made of AA3004 aluminum magnesium manganese material. The thickness and width of the roof panel were 1.2 mm and 400 mm, respectively. The support was constructed from aluminum alloy, with a thickness and width of 2 mm and 60 mm, respectively. Figure 2 illustrates the specific structural diagram of Specimen A, and the material parameters of the main structural layer are detailed in Table 1. Specimen B included a roof panel, support, and purlin. The roof panel was constructed from 445J2 stainless steel, with a thickness and width of 0.6 mm and 468 mm, respectively. The support was made of SUS304 stainless steel, featuring a thickness and width of 0.2 mm and 50 mm, respectively. The purlins for both specimens were Q235 steel square tubes, with a section length and width of 100 mm and a thickness of 4 mm. Figure 3 illustrates the specific structure of Specimen B, and the material properties of the roof panels and bearings are presented in Table 2.

2.3. Stress Test

According to a theoretical stress distribution analysis of the roof system, the external load was transmitted through the roof panel, support, and purlins [23]. In the case of Specimen A, stress and strain testing were conducted on five structural layers: the square braces, purlins, SBS waterproof layers, and roof panels. The strain gauge utilized was the Ut7121Y static strain gauge, with the specific BHF1000-3FG type employed for strain measurements, as depicted in Figure 4. A schematic diagram illustrating the arrangement of strain gauge measuring points in each structural layer is presented in Figure 5.
Figure 5a depicts the arrangement position of the backing strain gauges. A total of 7 measuring points and 10 strain gauges were symmetrically arranged on the roof panel. Among them, 1-1 (side), 1-3 (side), 1-5 (side), and 1-7 (side) were side measuring points, 1-2 (corner) and 1-6 (corner) were corner measuring points, and 1-4 (middle) was the middle measuring point. Additionally, 1-4 (middle), 1-5 (side), and 1-6 (corner) had double-sided arrangements, corresponding to 1-4-2 (middle), 1-5-2 (side), and 1-6-2 (corner). Figure 5b provides a schematic diagram of the locations of purlin strain gauges. Considering the symmetrical arrangement of the lining purlin in the longitudinal direction, three measuring points were set near the middle span, namely, 2-1 (middle), 2-2 (middle), and 2-3 (middle). Figure 5c displays a schematic diagram of the arrangement of the support strain gauges. As the support served as the primary supporting member of the roof panel, it would undergo significant stress during the wind uplift test. Hence, four measuring points were set up in the center, side span, and corner. These were 3-4 (side) and 3-2 (side) as edge measuring points, 3-3 (corner) as a corner measuring point, and 3-1 (middle) as the middle measuring point. All the strain gauges on backings, purlins, and supports used the vertical sticking method to measure vertical strain, as illustrated in Figure 5d. The roof panel, situated at the top position of the entire roof, underwent significant deformation during the load application process due to its thin structure. Following the principle of middle symmetry, seven measuring points were set at the center of the panel surface. Among them, 4-1 (side), 4-3 (side), 4-5 (side), and 4-7 (side) were edge measuring points, 4-2 (corner) and 4-6 (corner) were angle measuring points, and 4-4 (corner) was the middle measuring point.
The strain gauges for Specimen B were primarily arranged on the panel surface and the panel ribs, as illustrated in Figure 6. R1~R10 were placed on the panel rib, while S1~S10 were positioned on the panel surface, with all strain gauges arranged vertically. Additionally, the variation in stress on the panel surface and rib was compared and analyzed at support and non-support locations, the side span, and the middle span.

2.4. Deformation Test
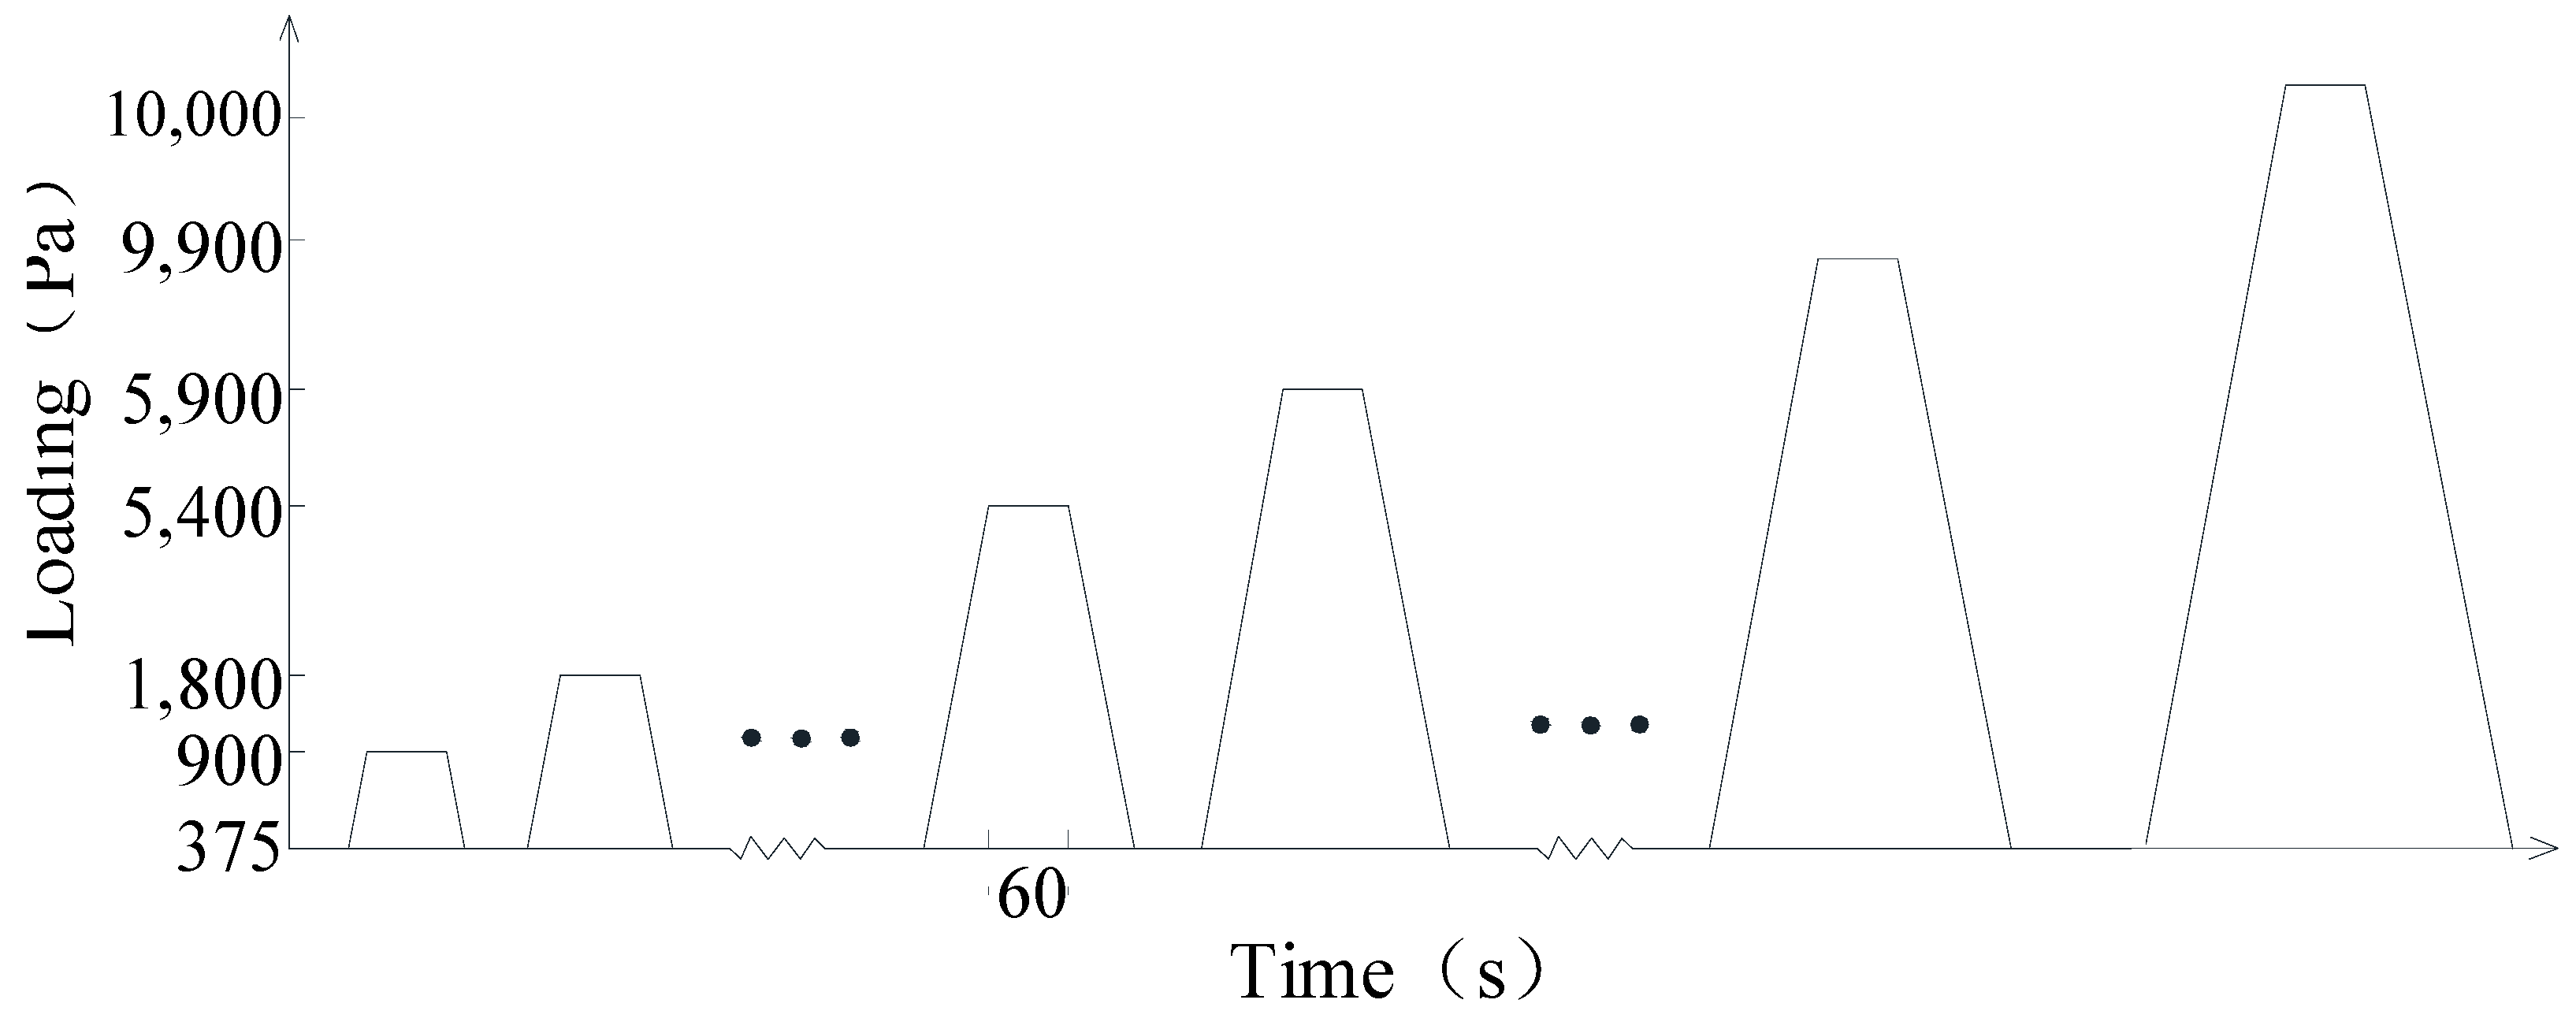
Displacement sensors were positioned on Specimen B’s rib and panel surface to measure the vertical deformation of the roof panel, as depicted in Figure 7. The displacement sensor model used was the EW-YQ-200, with a range of 0~200 mm and a minimum accuracy of 0.1 mm. In this study, a total of 12 displacement sensors were deployed. Among them, D2, D4, D6, D8, D9, and D10 were placed on the panel rib to measure the vertical displacement of the panel rib. The remaining sensors were arranged on the panel surface to measure the vertical displacement of the panel surface. The displacement characteristics of the panel surface and the panel rib were compared and analyzed. Additionally, displacement sensors were strategically positioned at various locations along the length and width directions of the roof panel. The displacements of the roof panel at the side span and the middle span, as well as at the support and non-support areas, were compared and analyzed.

2.5. Test Scheme

According to the relevant specifications of ASTM E1592 [25], the ultimate bearing capacity of a metal roofing system under static negative wind pressure was tested to ensure the engineering quality and structural safety of the metal roofing system, providing the basis for roof wind uplift design. Initially, the test piece was ensured to be in good condition; an observation window was positioned on the upper part of the box, and a camera was installed inside the box to monitor the deformation of the test piece. Subsequently, the pressure sensor was cleared, and negative pressure was added. The first pressure applied was equivalent to 4 to 10 times the weight of the roof panel (375 Pa) for a duration of not less than 60 s, serving as the standard initial pressure. At this point, the displacement sensor was reset. Finally, the design pressure for this test was 5.4 kPa, and the pressure load value for each stage did not exceed 1/6 of the design pressure. In other words, the pressure increment for each stage was −0.9 kPa. Successive negative pressure cycles were then applied, such as −0.9 kPa~375 Pa and −1800~375 Pa, until the design pressure reached −5.4 kPa. The test then continued with a pressure increment of −0.5 kPa per stage. When the pressure was loaded to 10 kPa, the test could not continue due to the limitations of the testing conditions, and the wind resistance test concluded after releasing the pressure. The test loading curve is illustrated in Figure 8.

3. Results Analysis

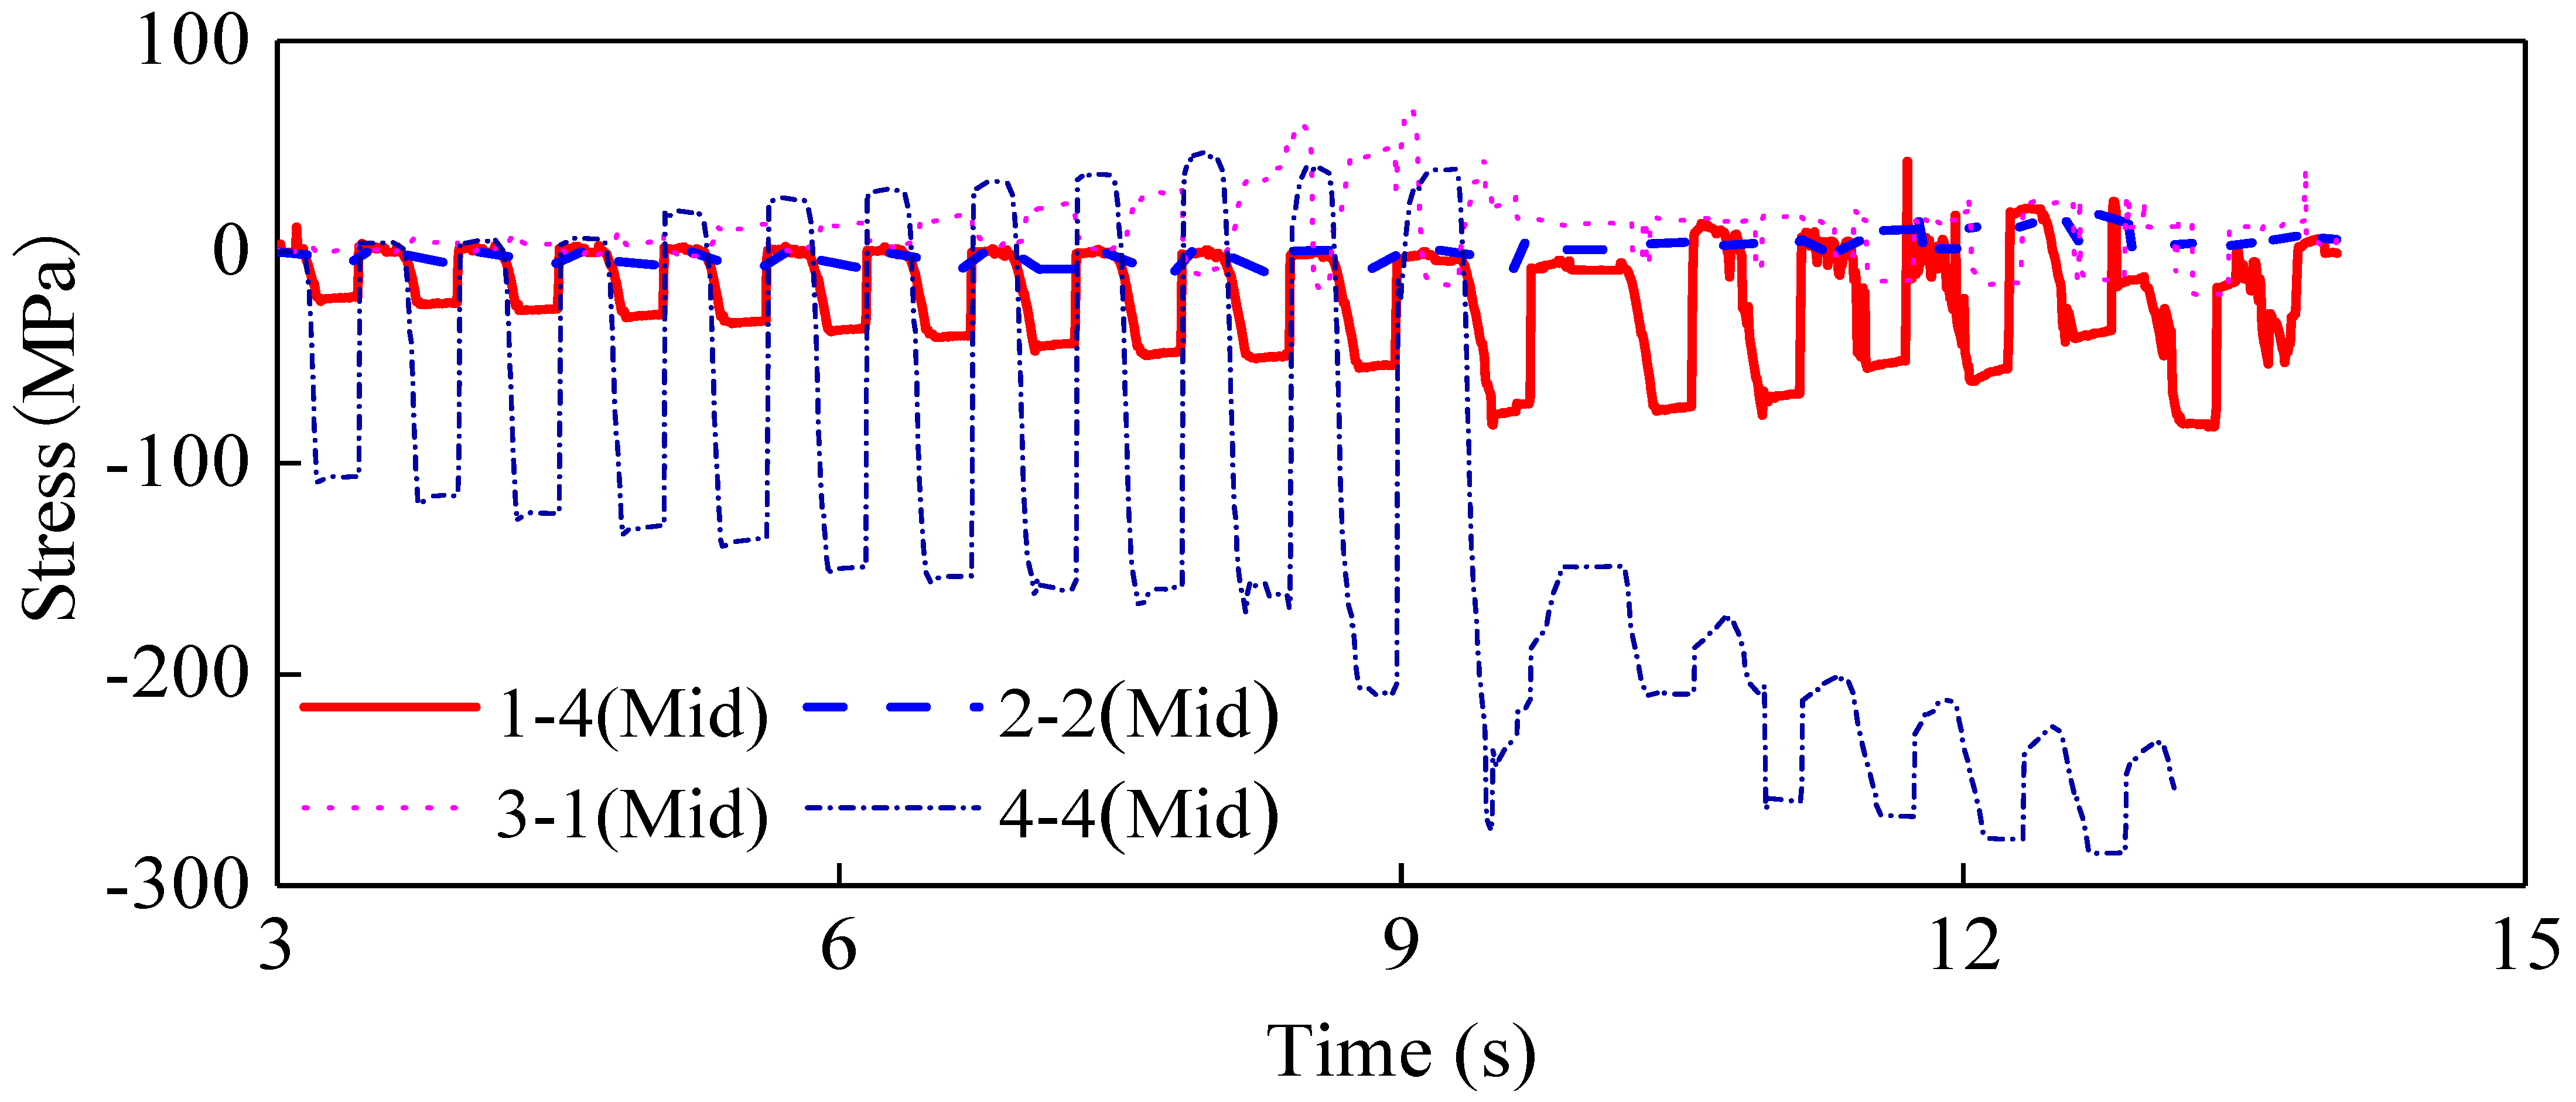
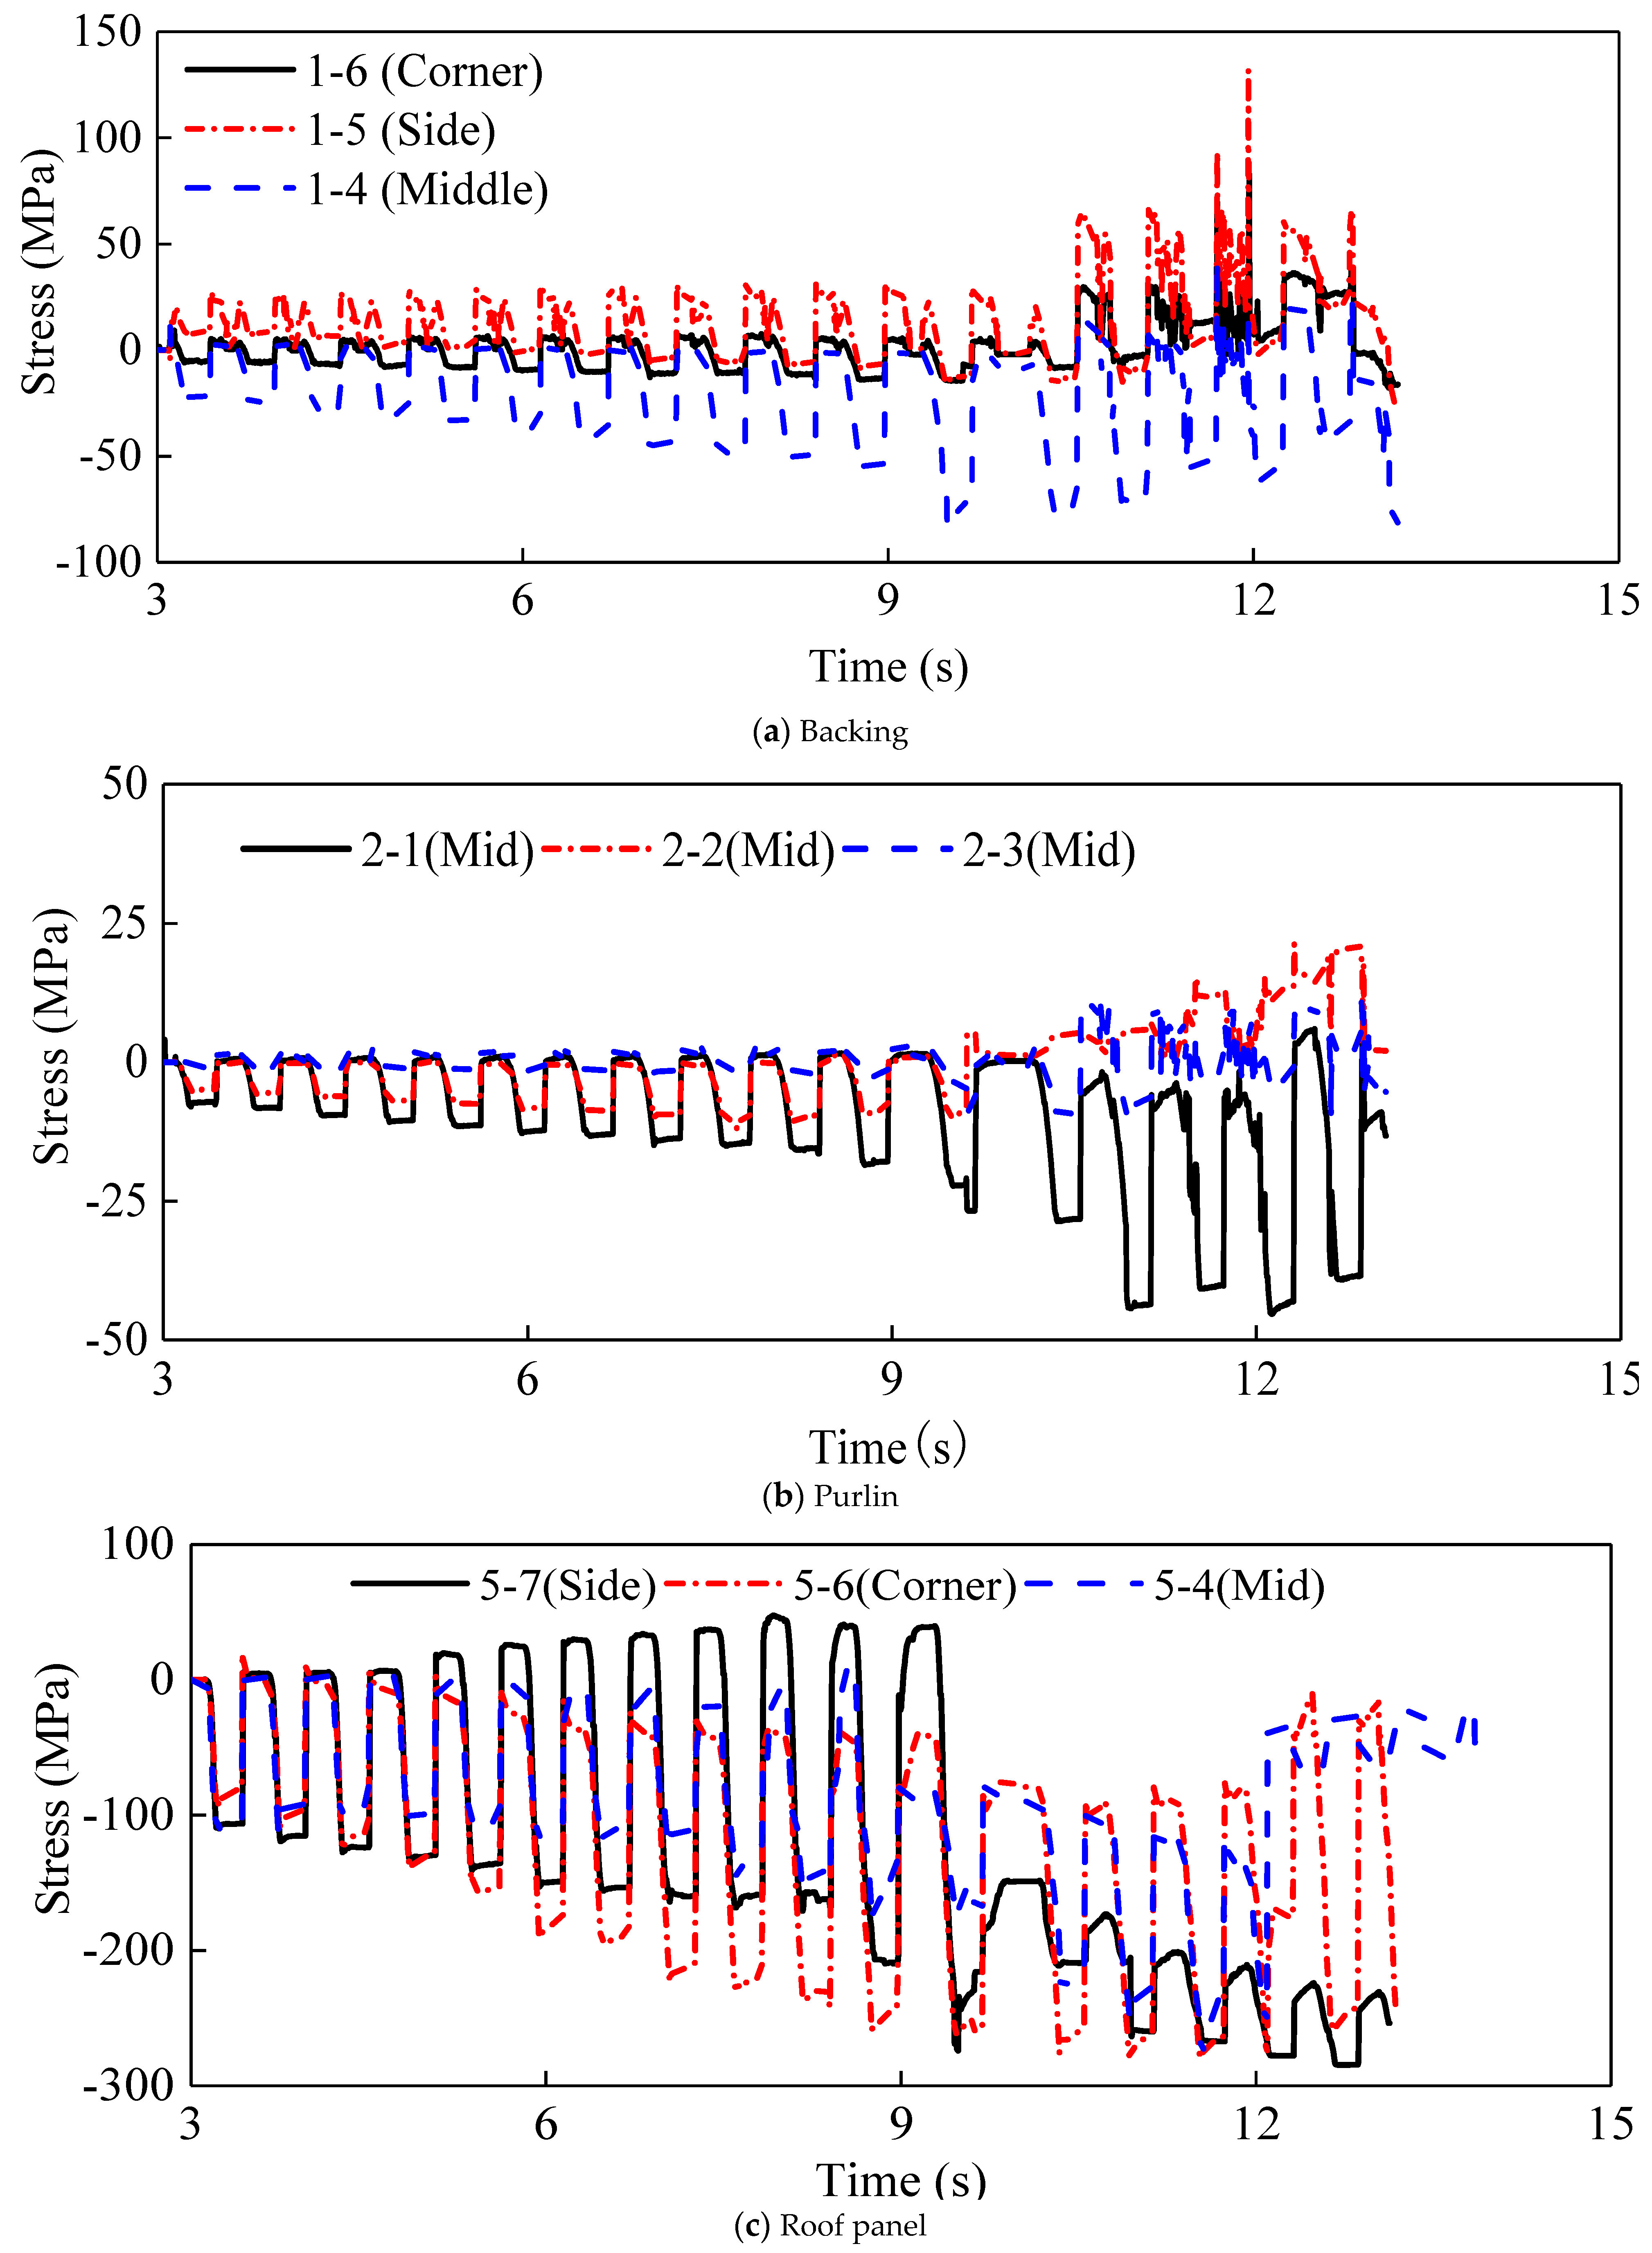
3.1. Specimen A Stress

The load stress diagrams for the same measuring points (middle) 1-4 (backing), 2-2 (purlin), 3-1 (support), and 4-4 (roof panel) of different structural layers were plotted on the same coordinate axis, as depicted in Figure 9. Stress peaks at the center measuring points of different structural layers were documented in Table 3. It was observed that the stress of each structural layer gradually increased with the augmentation of the load. At the same measuring point position for different structural layers, the stress on the roof panel was the highest, and the force borne by the support and the lining purlin was considerably smaller than that of the roof panel and the support. The peak stresses for roof panels, supports, purlins, and backings were 209.9 MPa, 60.6 MPa, 10.9 MPa, and 81.1 MPa, respectively.
The load-stress-strain diagram for the same corner measuring points of 1-6 (backing), 3-3 (support), and 4-6 (roof panel) of different structural layers were plotted on the same coordinate axis, as shown in Figure 10. The peak stress at corner measuring points in different structural layers was presented in Table 4. It was evident that the stress change of the support remained more stable with the evolution of the load, while the stresses of other structural layers exhibited significant variations with the load. The peak stresses for roof panels, supports, and backings were 268.9 MPa, 9.9 MPa, and 29.9 MPa, respectively.
The load stress diagrams for the different measuring points 1-4 (middle), 1-5 (side), and 1-6 (corner) of the backing structure layers were plotted on the same coordinate axis, as depicted in Figure 11a. The load-stress-strain diagram for the different measuring points 2-1 (middle), 2-2 (middle), and 2-6 (middle) of the purlins is presented in Figure 11b. Additionally, the load-stress-strain diagram for the different measuring points 4-4 (middle), 4-6 (corner), and 4-7 (side) of the roof panel is illustrated in Figure 11c. It was observed that the force at different measuring points on the same layer increased with the change in load. The stress of the purlin tended to stabilize with the variation of the load. The force on the middle of the roof panel was less than that on the corner, and the force on the corner measuring point was the largest. The roof panel experienced the highest stress, as evident from the stress time-history curve of the same measuring point in different layers. For instance, at the 3000 Pa load stage, the stress at the measuring points in the roof panel accounted for 79.3% of the stress at the measuring points in all structural layers. As the load increased to 9000 Pa, the stress share at the measuring points in the roof panel decreased to 58.6%. The stress distribution at each structural layer for the corner measuring point was similar to that of the middle measuring point, with the stress of the roof panel being significantly higher than those of other structural layers.

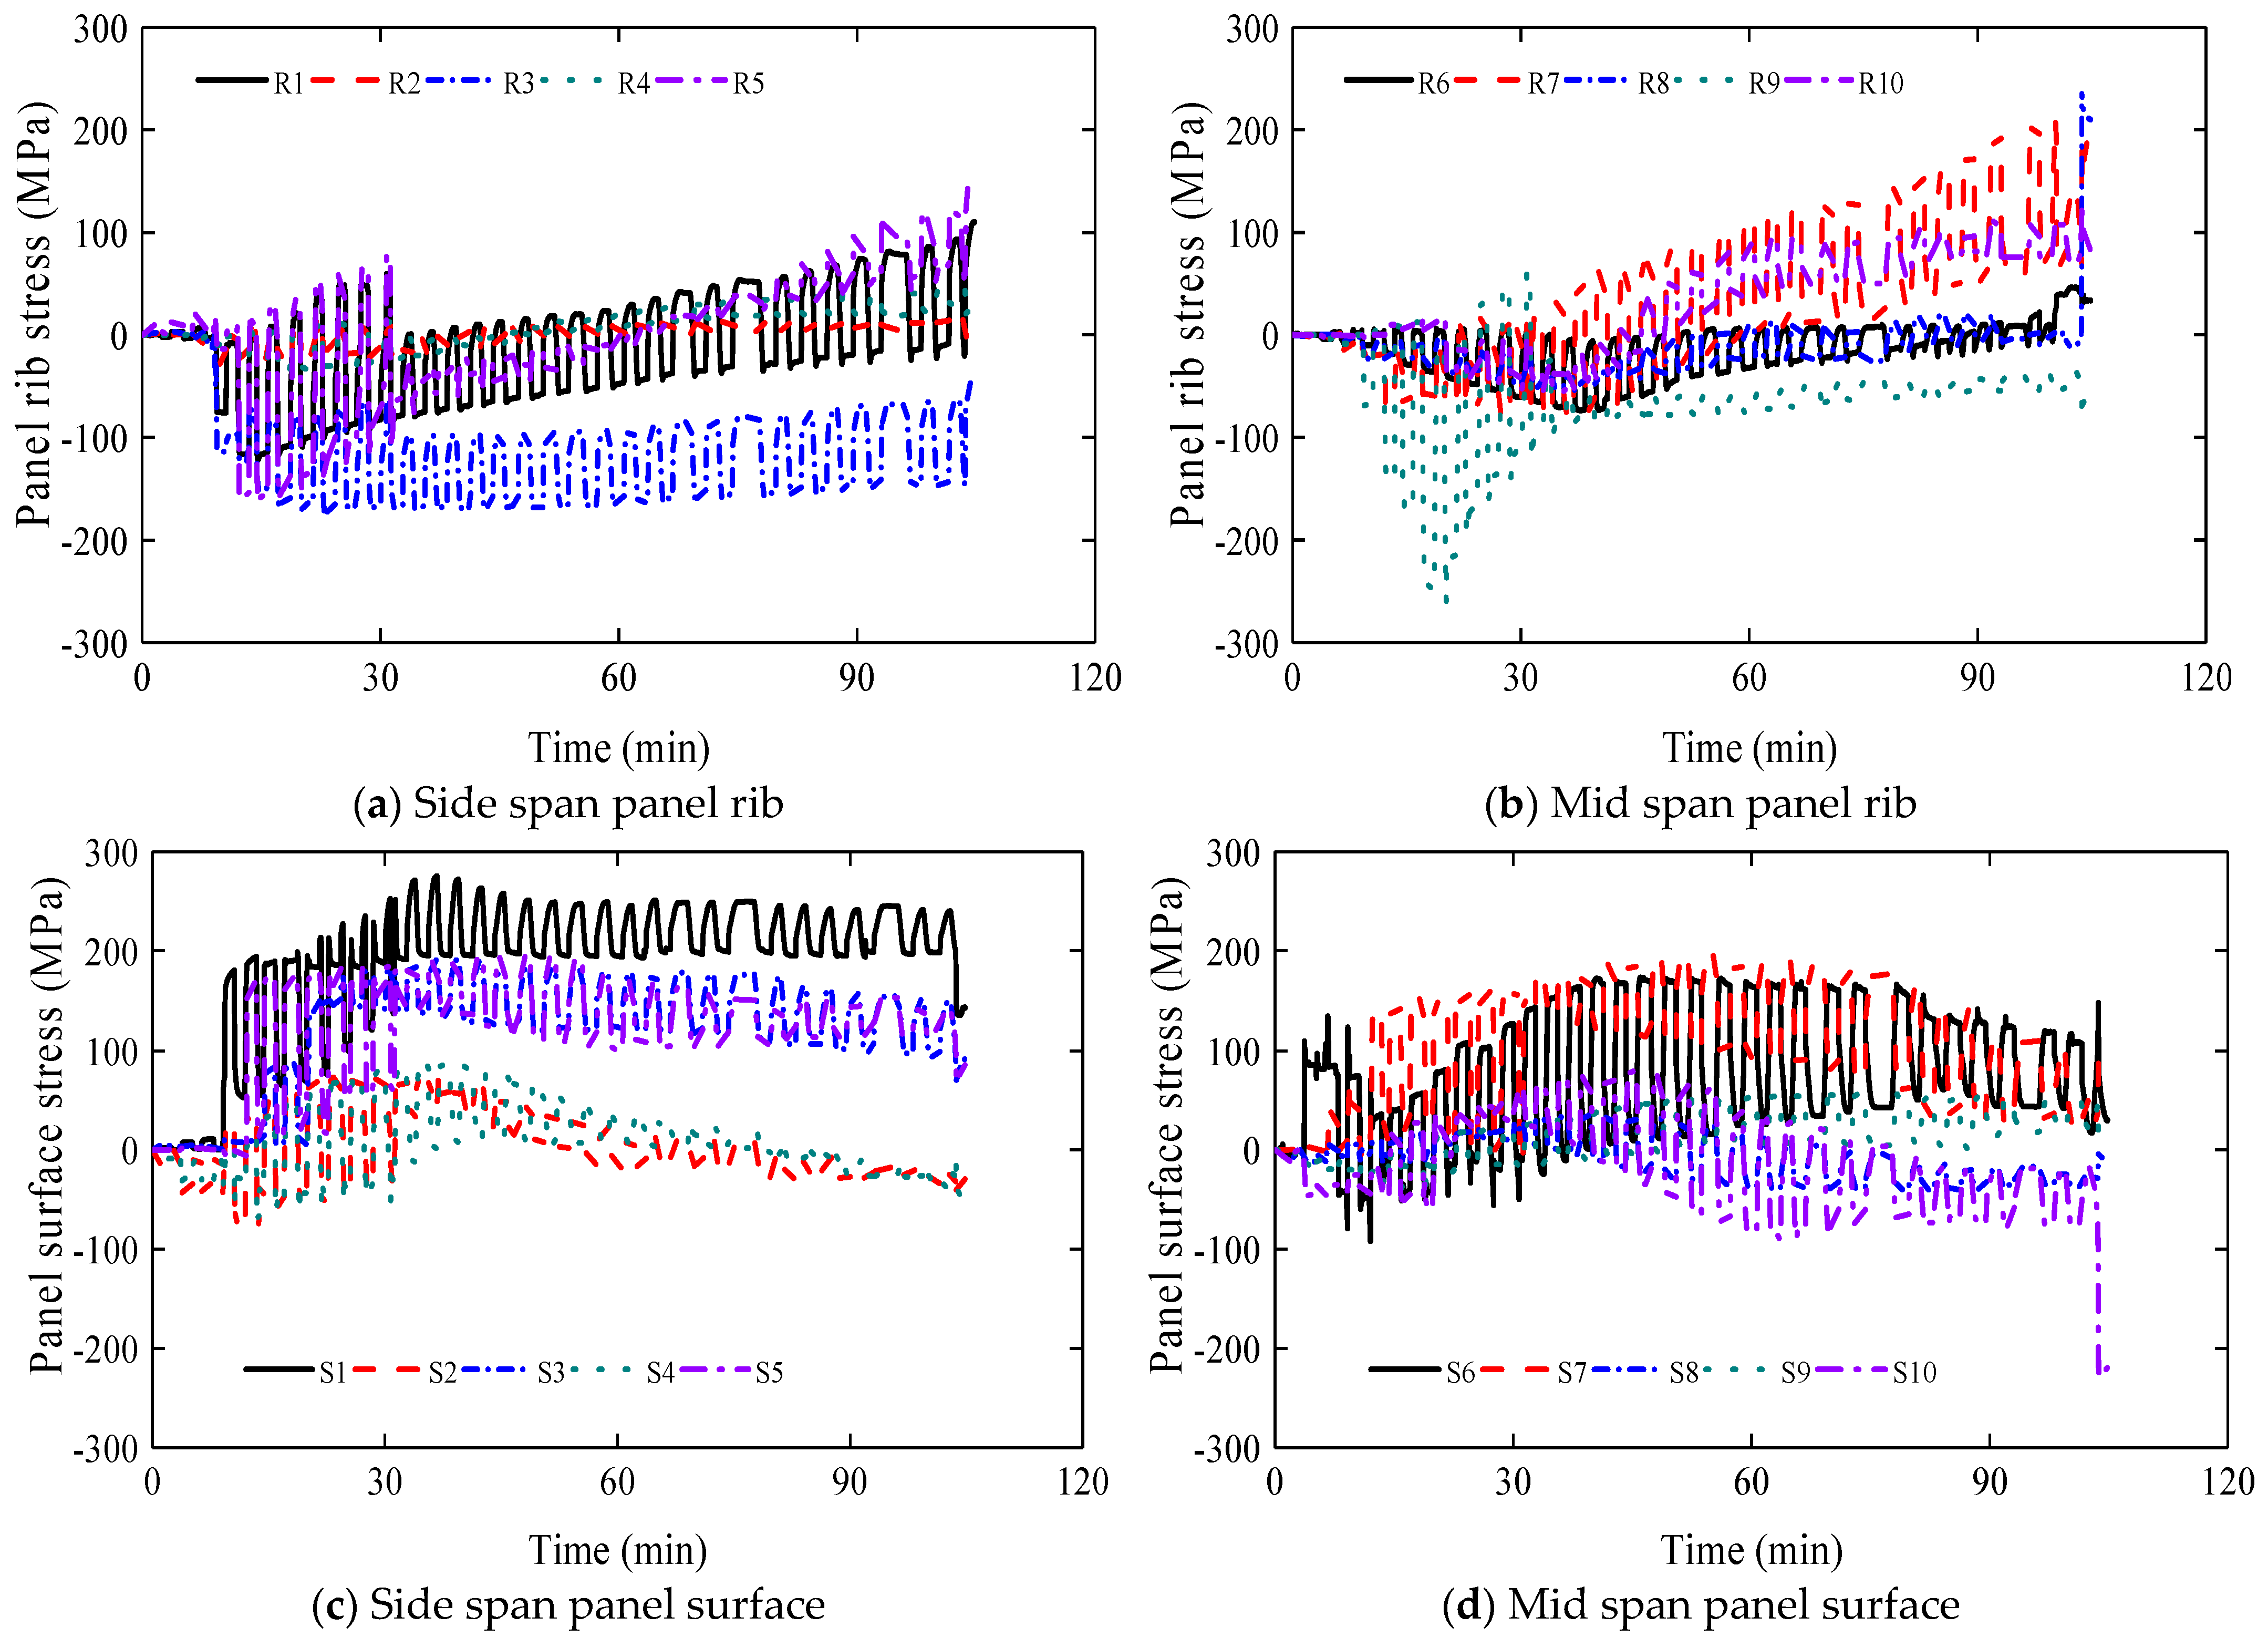
3.2. Specimen B Stress

The stress-change curve for each measuring point of Specimen B’s roof panel is depicted in Figure 12. It is evident that the stress at each measuring point on the panel surface and rib of Specimen B increased gradually with the rise in wind load. In R1~R5, except for the compression at measuring point R3, the other measuring points experienced tension. The peak stresses for R1~R5 were 110.1 MPa, 18.5 MPa, 42.3 MPa, 143.7 MPa, and 142.3 MPa, respectively. In R6~R10, R9 exhibited noticeable stress concentration, accounting for approximately 75.7% of the yield strength of the roof panel. Under wind load, the peak stresses for R6~R10 were 46.1 MPa, 204.6 MPa, 240.9 MPa, 249.5 MPa, and 128.5 MPa, respectively. It was observed that the rib stress of the middle span surpassed that of the side span, and the rib stress at different positions varied significantly. In S1~S5, the stress variation pattern of the panel surface and the panel rib was similar, and the maximum panel surface stress occurred at S1, being approximately 275.3 MPa. For S6~S10, the maximum surface stress at S7 was around 194.8 MPa. Interestingly, the stress on the panel surface of the side span exceeded that on the middle span, which contradicted the pattern observed for panel ribs. Comparative analysis revealed that the peak stresses of the panel surface and the panel rib were 249.5 MPa and 275.3 MPa, respectively.

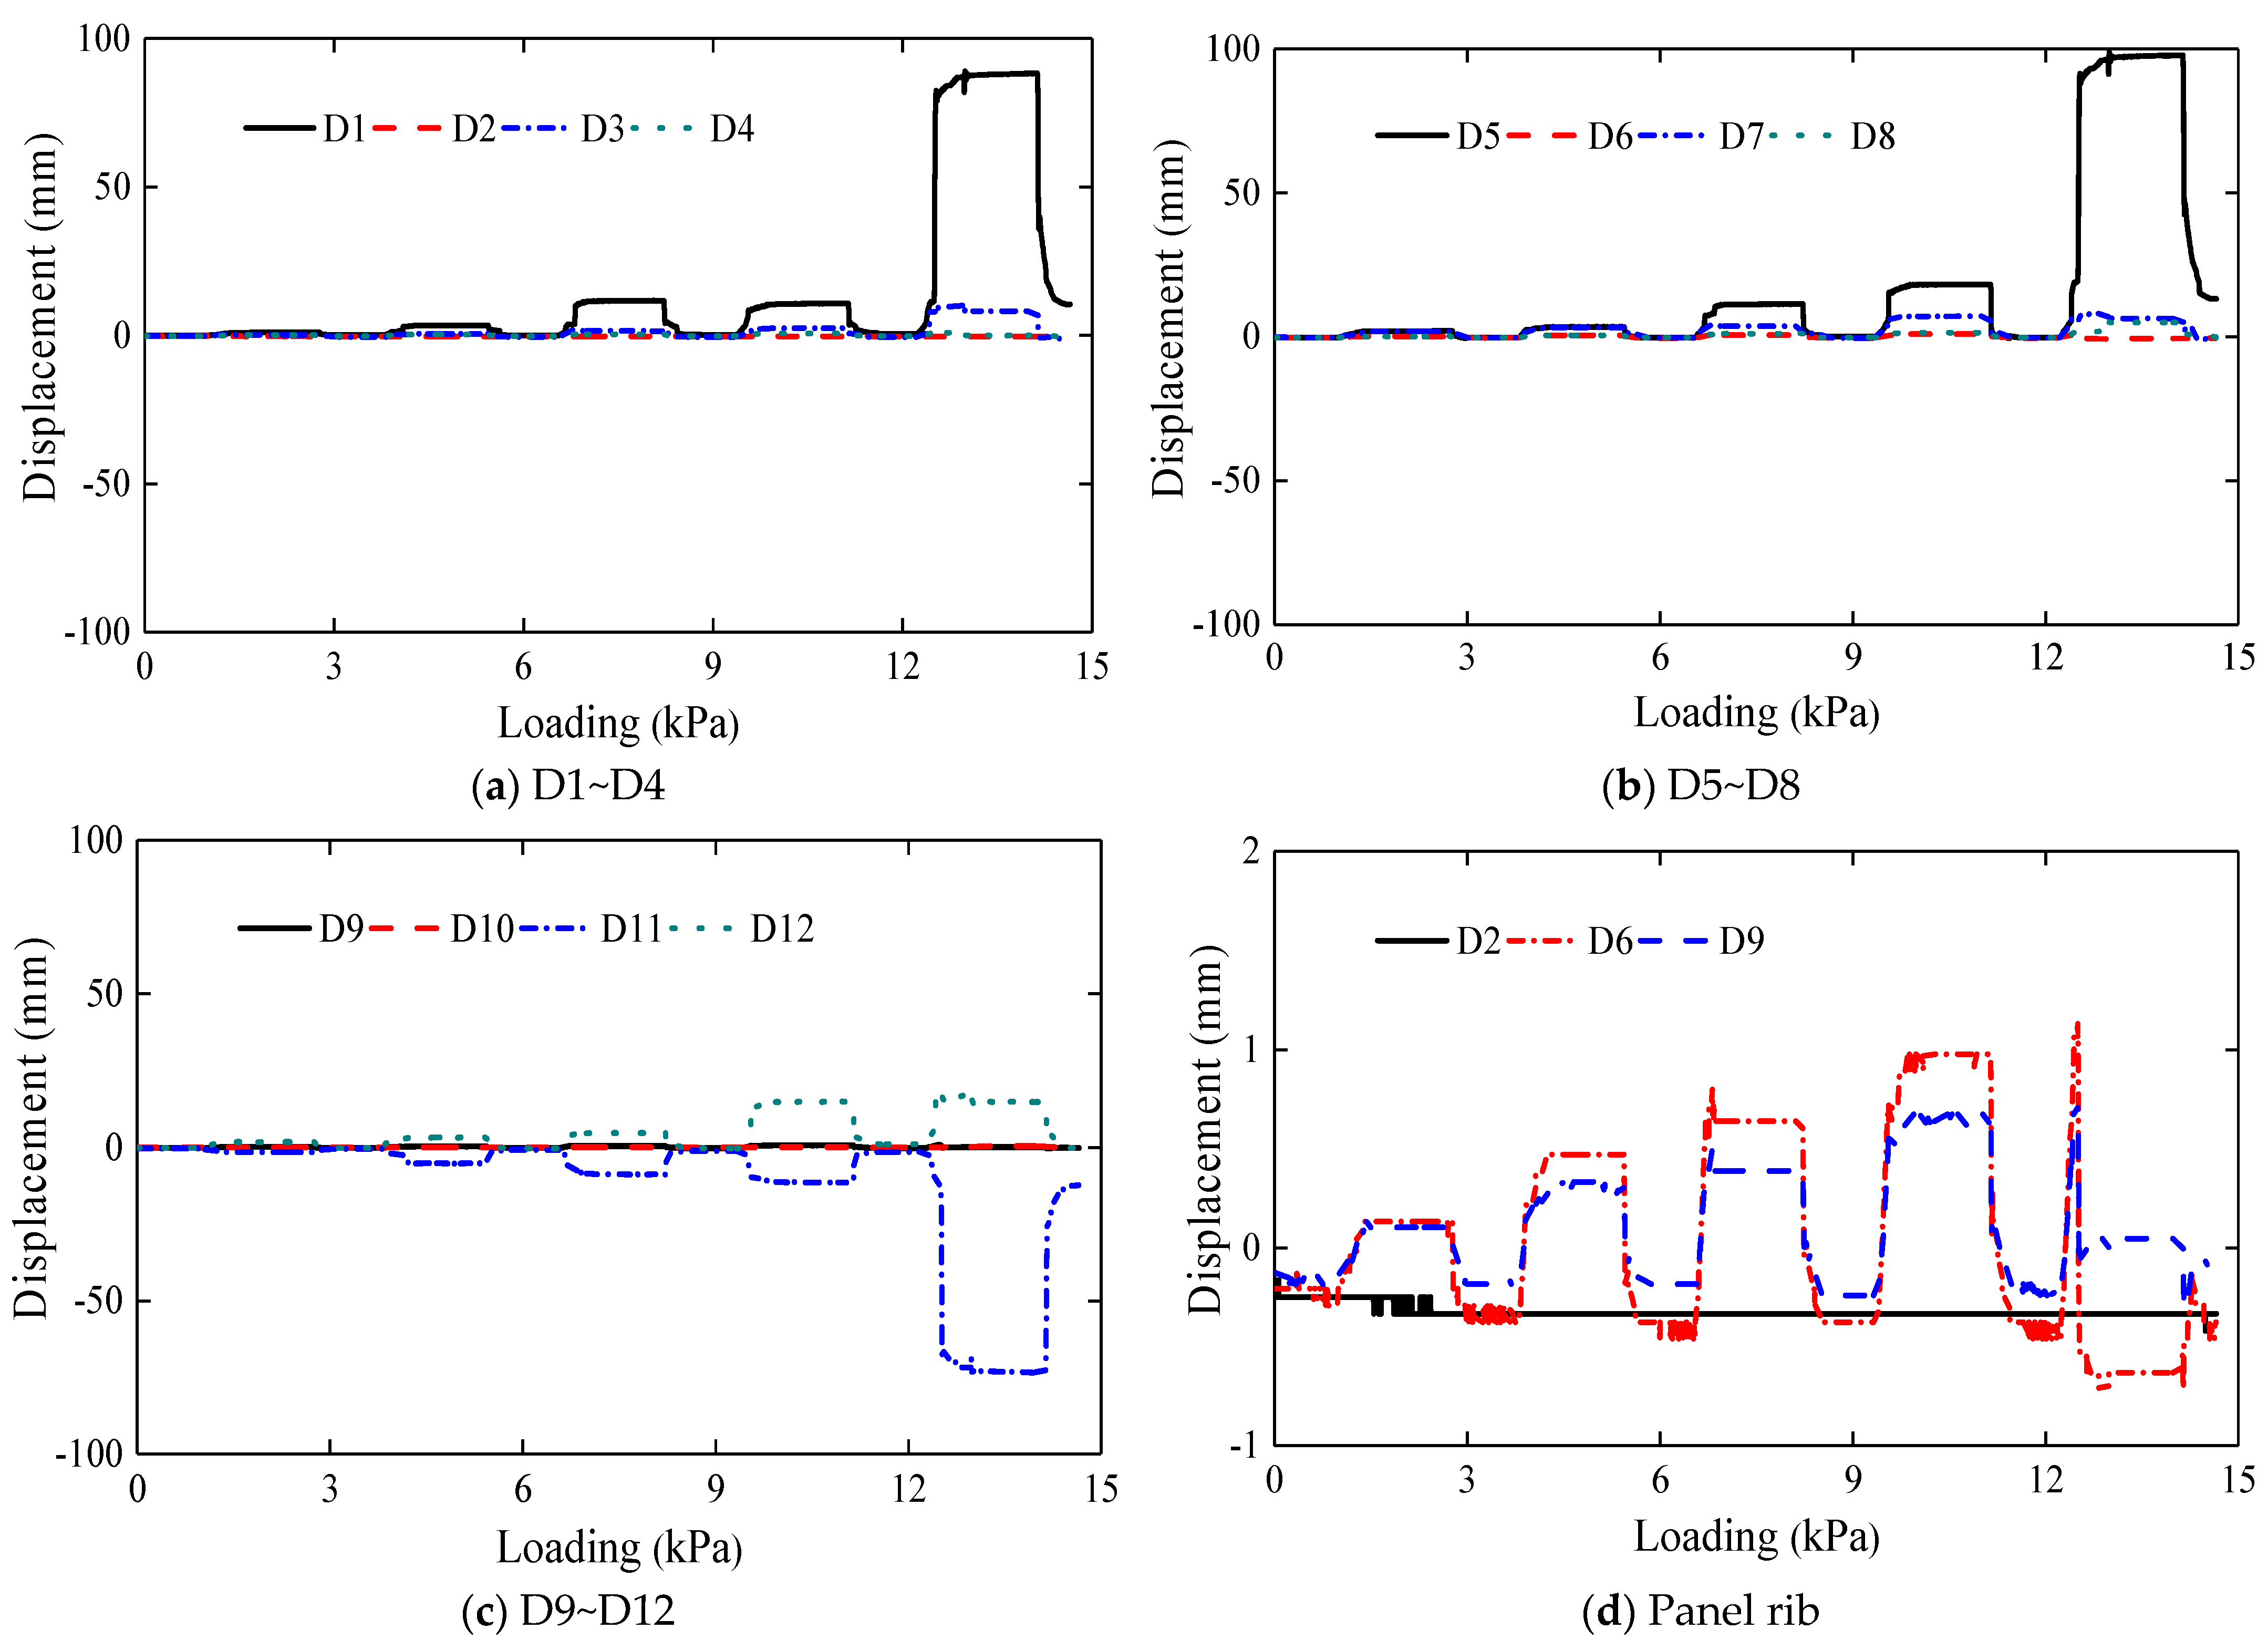
3.3. Specimen B Displacement

The displacement curve of the roof panel of Specimen B is presented in Figure 13. It is apparent that the vertical displacement of the roof panel increased with the rise in wind load. In D1~D4, the maximum displacement of the roof panel was 88.0 mm at D1, while the minimum displacement was 0.8 mm at D2. In D5~D8, the maximum displacement was 97.5 mm at D5. For D9~D12, the maximum displacement at D11 was approximately 73.2 mm. Comparative analysis revealed that the maximum displacements of the panel surface and the panel rib were 97.5 mm and 1.2 mm, respectively, with the displacement of the panel surface being significantly larger than that of the panel rib.

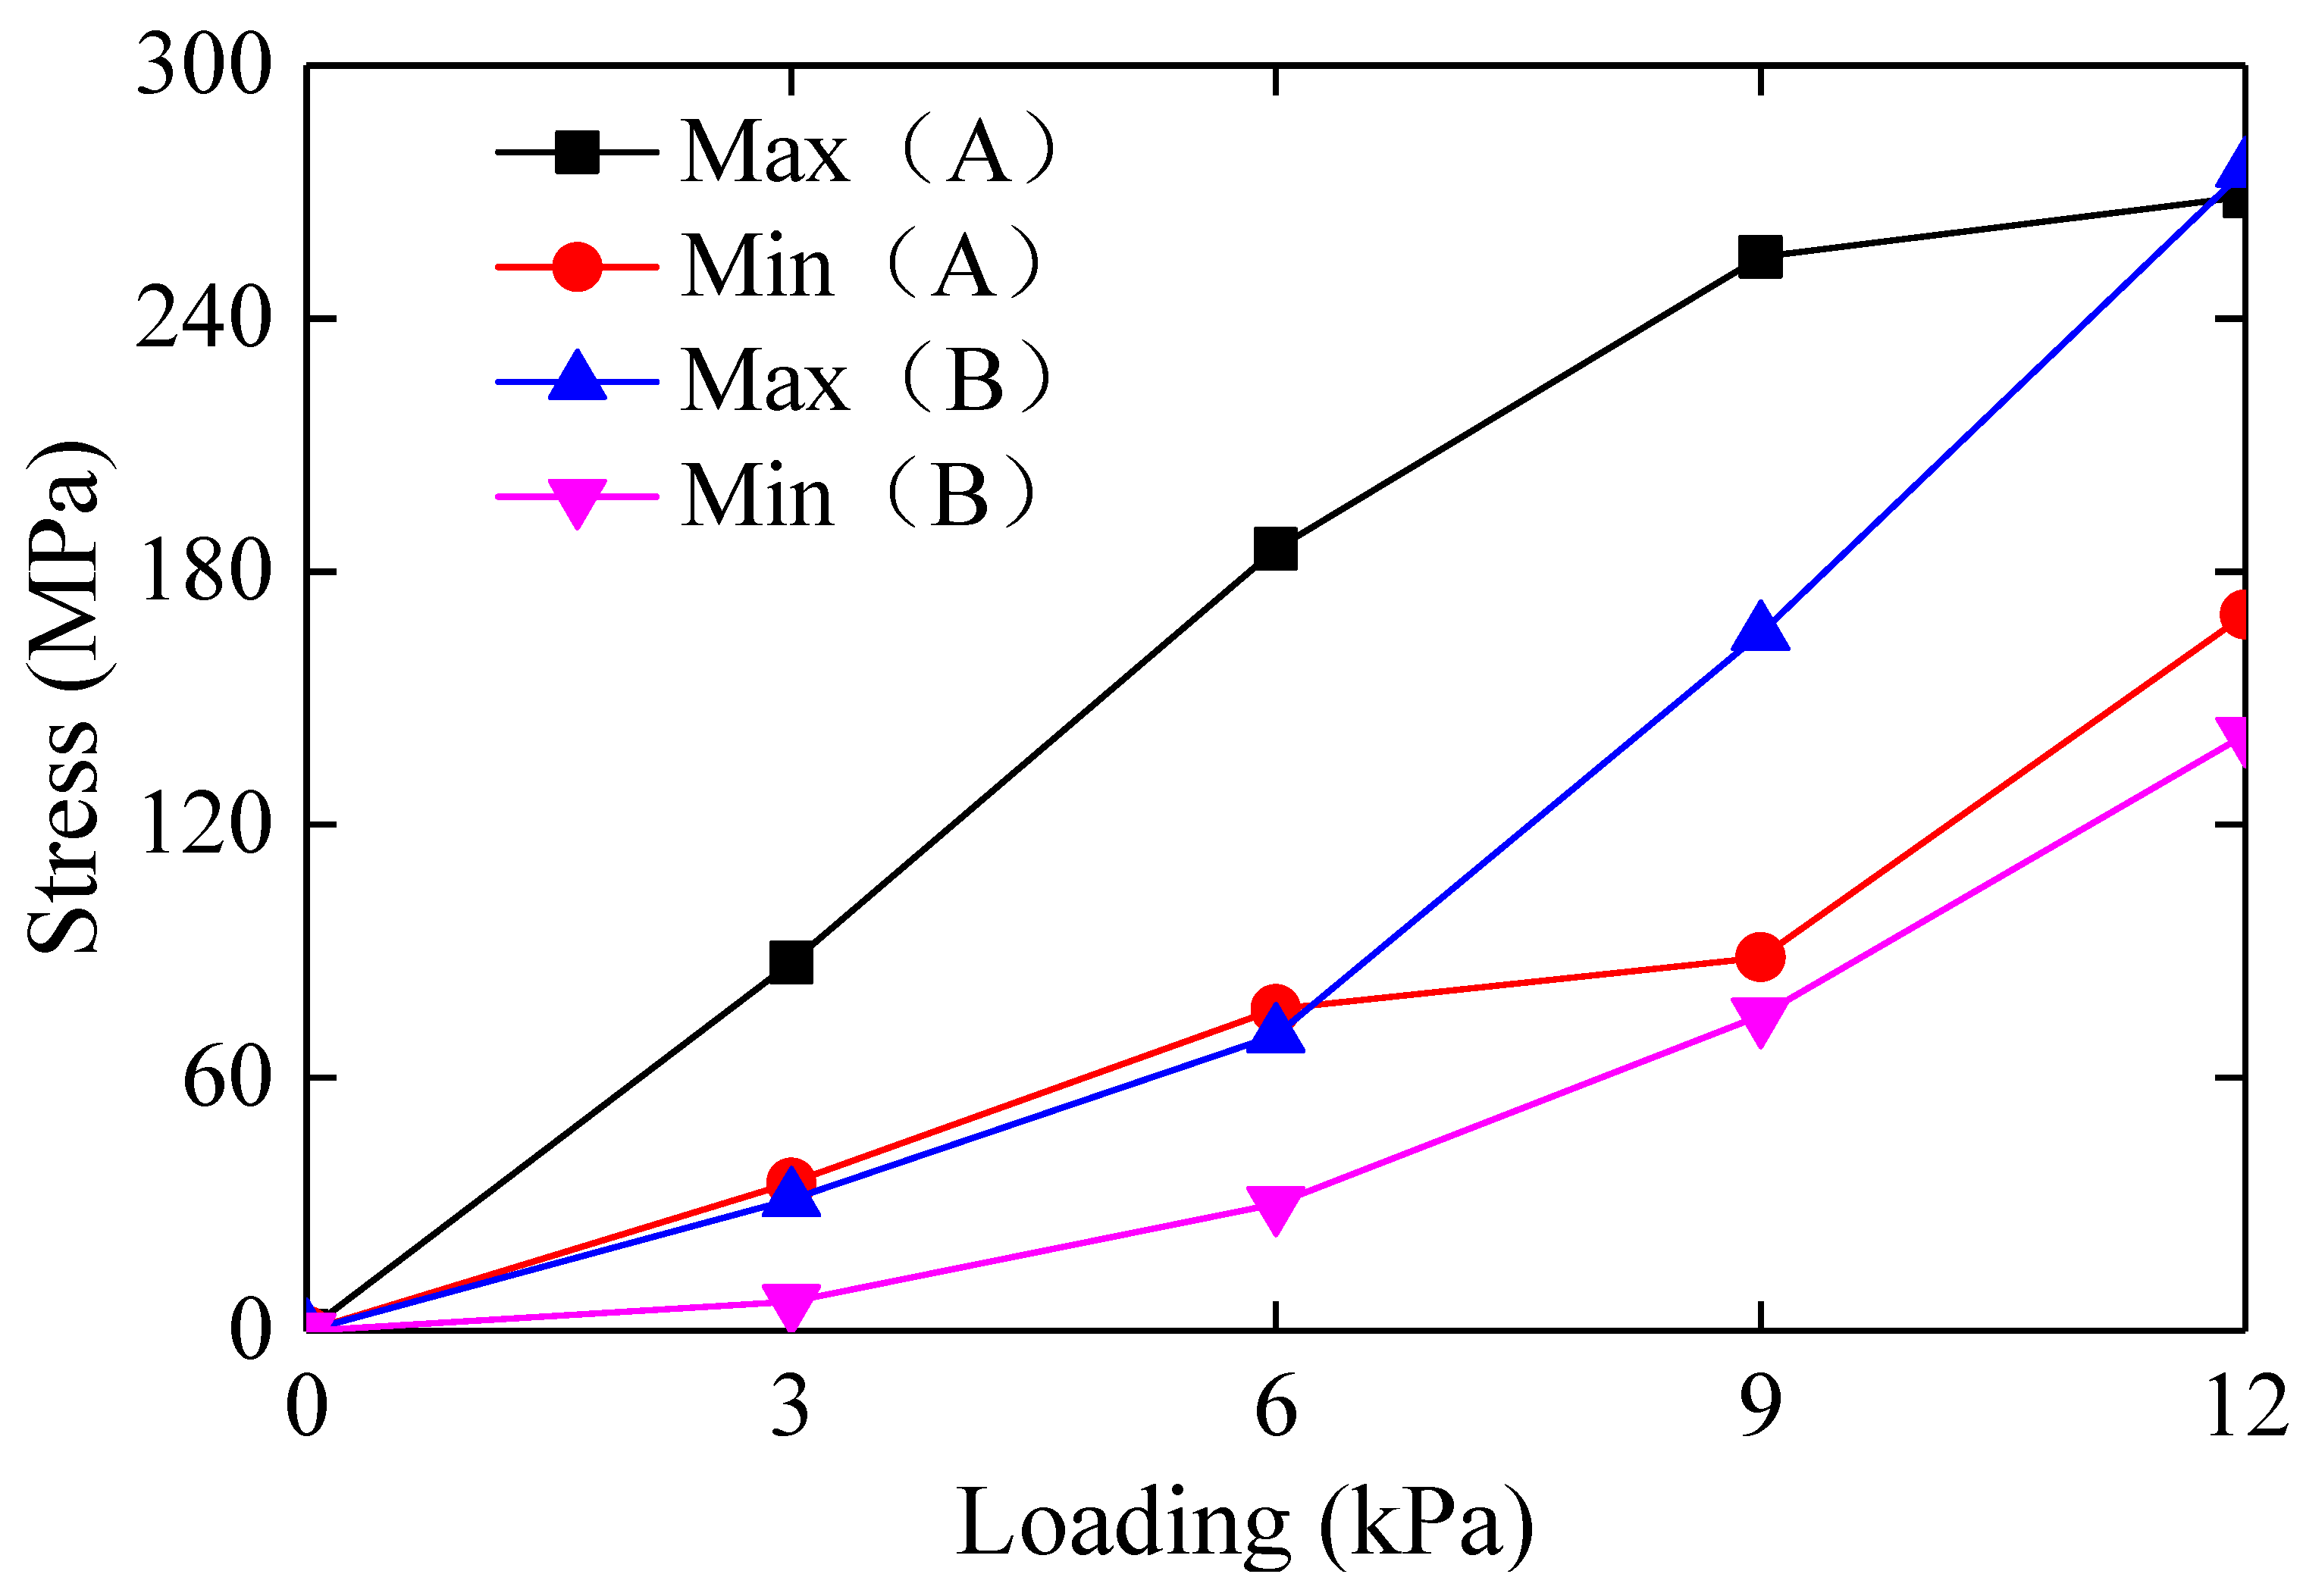
3.4. Comparative Analysis of Two Kinds of Specimen Stress

This section compares and analyzes the roof panel stress of the two specimens. The roof panel stress curves of the two specimens are depicted in Figure 14. The maximum and minimum roof panel stresses of the two specimens under different wind loads are presented in Table 5. The roof panel stresses of the two specimens correspond to the wind load. Under wind loads of 3 kPa, 6 kPa, 9 kPa, and 12 kPa, the maximum stress for Specimen A was 87.3 MPa, 185.3 MPa, 256.4 MPa, and 268.9 MPa, respectively. The maximum stress for Specimen B was 31.2 MPa, 70.1 MPa, 165.4 MPa, and 275.3 MPa, respectively. In the early stage of wind load loading, Specimen A’s stress was more significant than Specimen B’s. However, when the wind load reached 12 kPa, Specimen B’s stress surpassed that of Specimen A. Notably, there were evident differences in the stresses of the roof panels at different positions between the two specimens, with a more pronounced stress concentration in the roof panels. With the increase in wind load, the stress difference of the roof panels for the two specimens gradually decreased. Specimen A’s roof panel yielded at 9 kPa, while Specimen B’s roof panel stood without yielding at 12 kPa. This observation underscores the significantly superior wind resistance capacity of Specimen B compared to Specimen A.

4. Finite Element Analysis

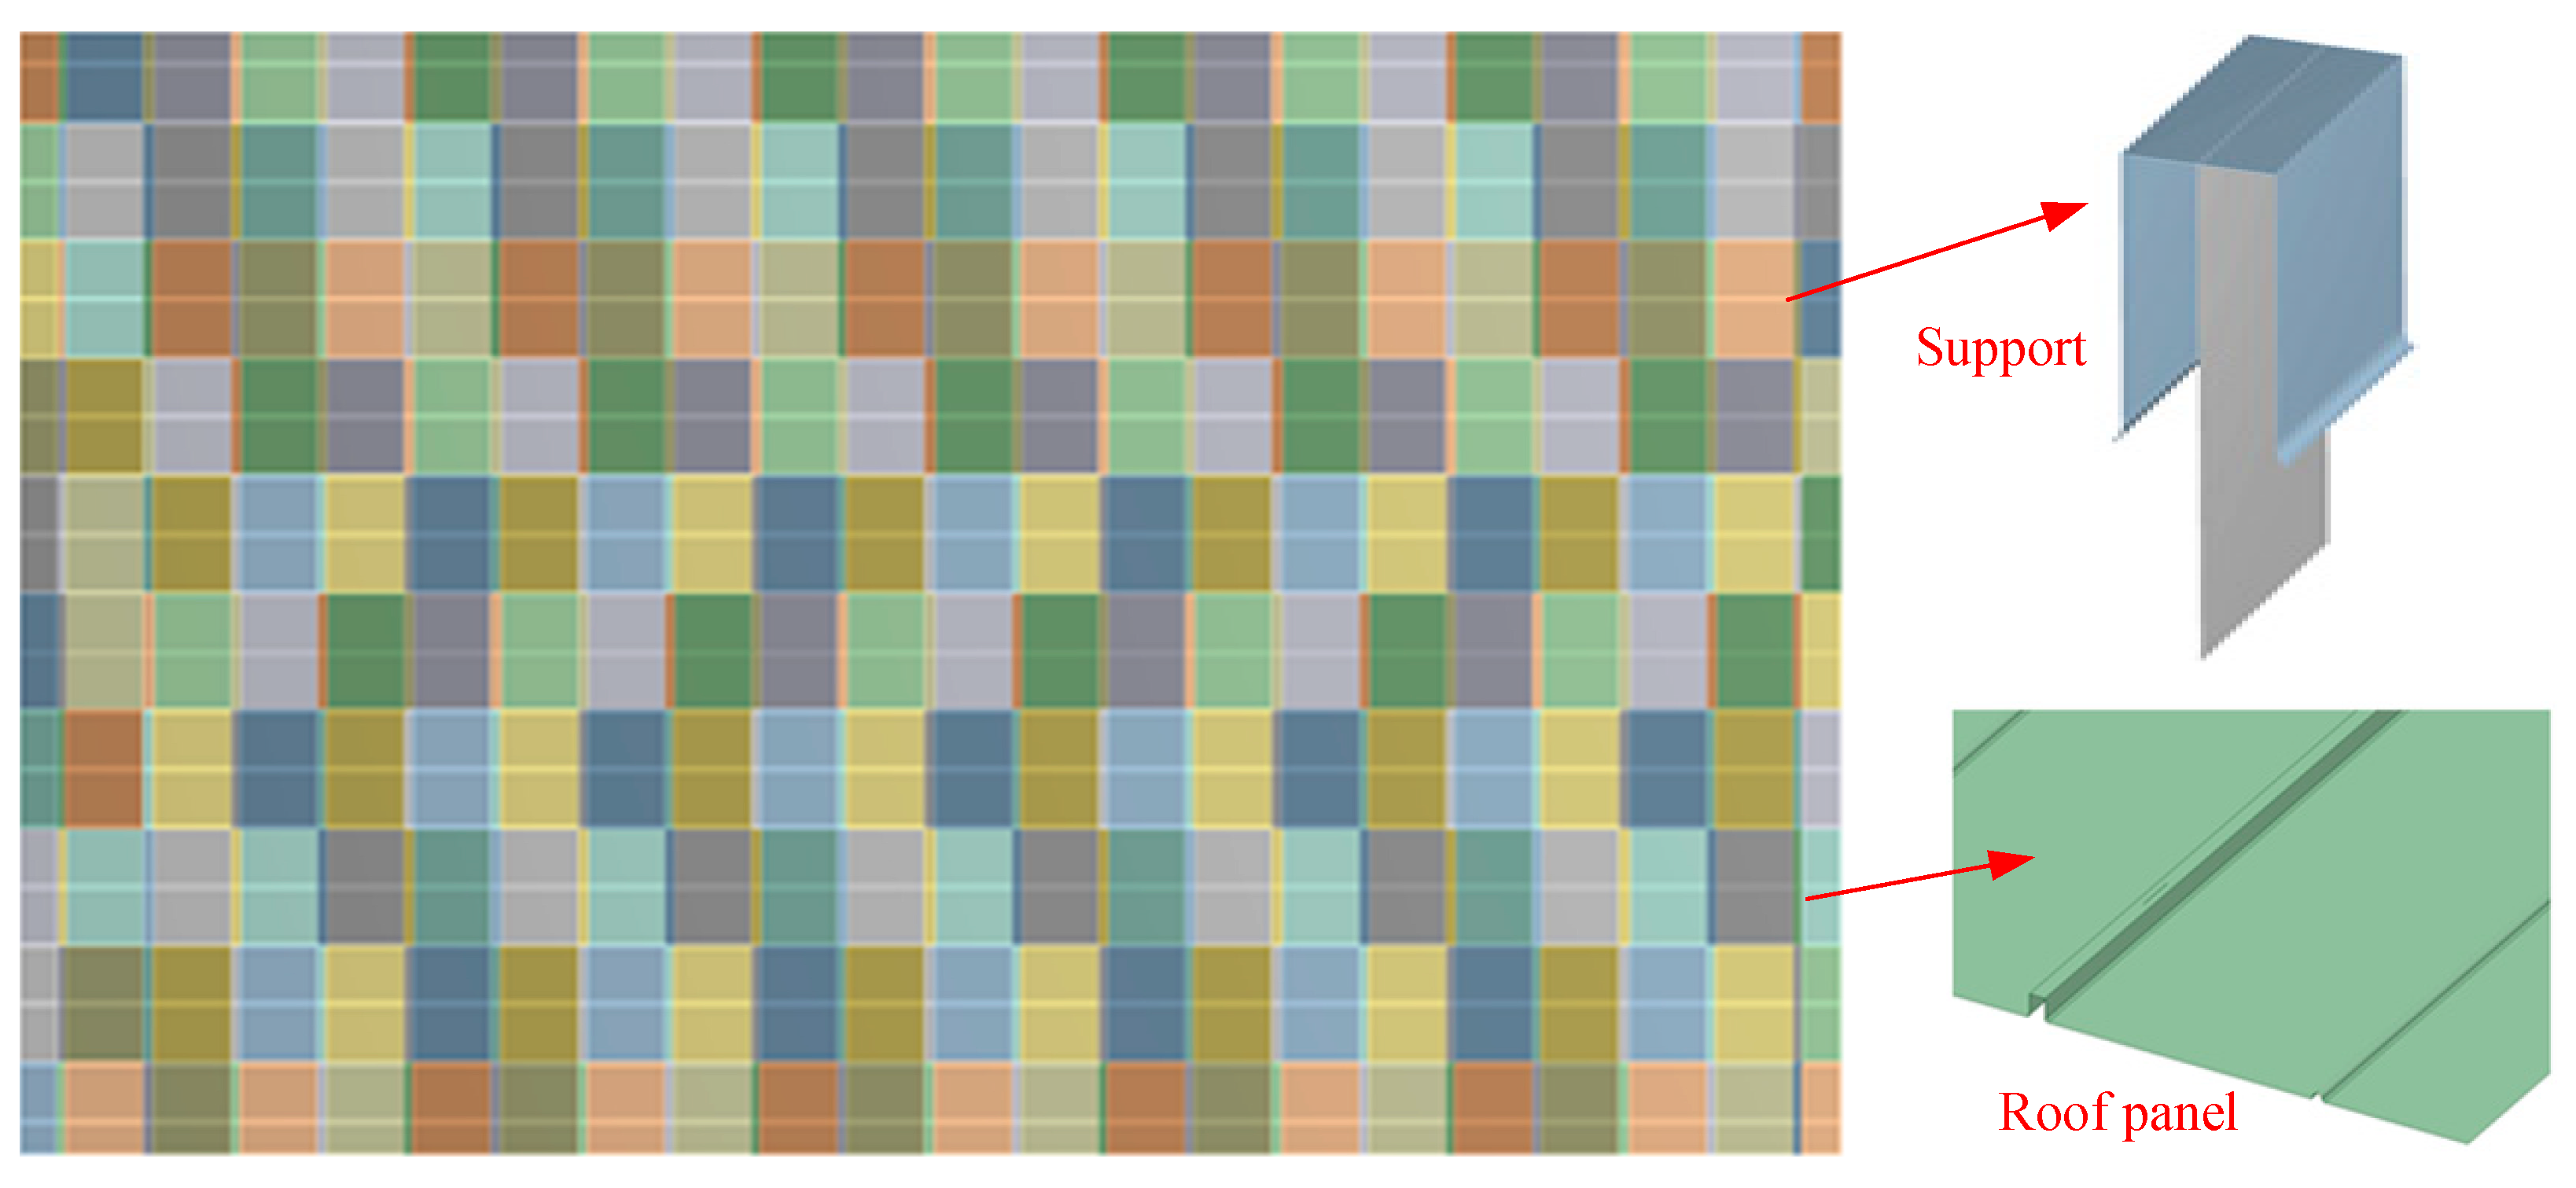
4.1. Finite Element Model

To further investigate the wind resistance performance of the roof system, this paper selected Specimen B for numerical analysis. In the subsequent work, numerical simulation parameter analysis will be conducted for the wind resistance performance of Specimen A. The SHELL181 element was employed to simulate the stainless-steel roof panel. The material and size of the metal roof panel and the support were kept consistent with those of the test specimen. The weld, support, and roof panel were interconnected using springs [8]. The finite element model of Specimen B is presented in Figure 15. During the test, the edges of the roof panel were closed, and the established finite element model was divided into quadrilateral grids. Due to the small size of the support, plate rib, and the mid-span arc of the roof panel, the grid at the plate rib was refined to ensure a smooth transition of the grid. The loading system of the finite element model mirrored that of the test, and the stress and displacement variations of the roof system under different wind loads were further analyzed.

4.2. Model Verification

The finite element simulation is based on completely ideal conditions; however, there may be uncertain factors such as uneven materials and incomplete sealing of the box in the test. Consequently, there could be some errors between the data collected in the test and the finite element simulation results. To quantify the error between the test and simulation results, the concept of the linear correlation coefficient in statistics is introduced [24]. The linear correlation determination coefficient R2 can reflect the degree of agreement between the test and simulation to a certain extent. The closer the R2 value is to 1, the better the fitting degree. By comparing the strain gauge data arranged at the rib of the roof panel with the simulated data in the experiment, as shown in Figure 16, the maximum fitting coefficient is 0.976, and the minimum fitting coefficient is 0.923. All data points are scattered near a straight line with a slope of 1. Therefore, it can be considered that the error between the test and the simulation is within an acceptable range, preliminarily verifying the rationality of the finite element model.

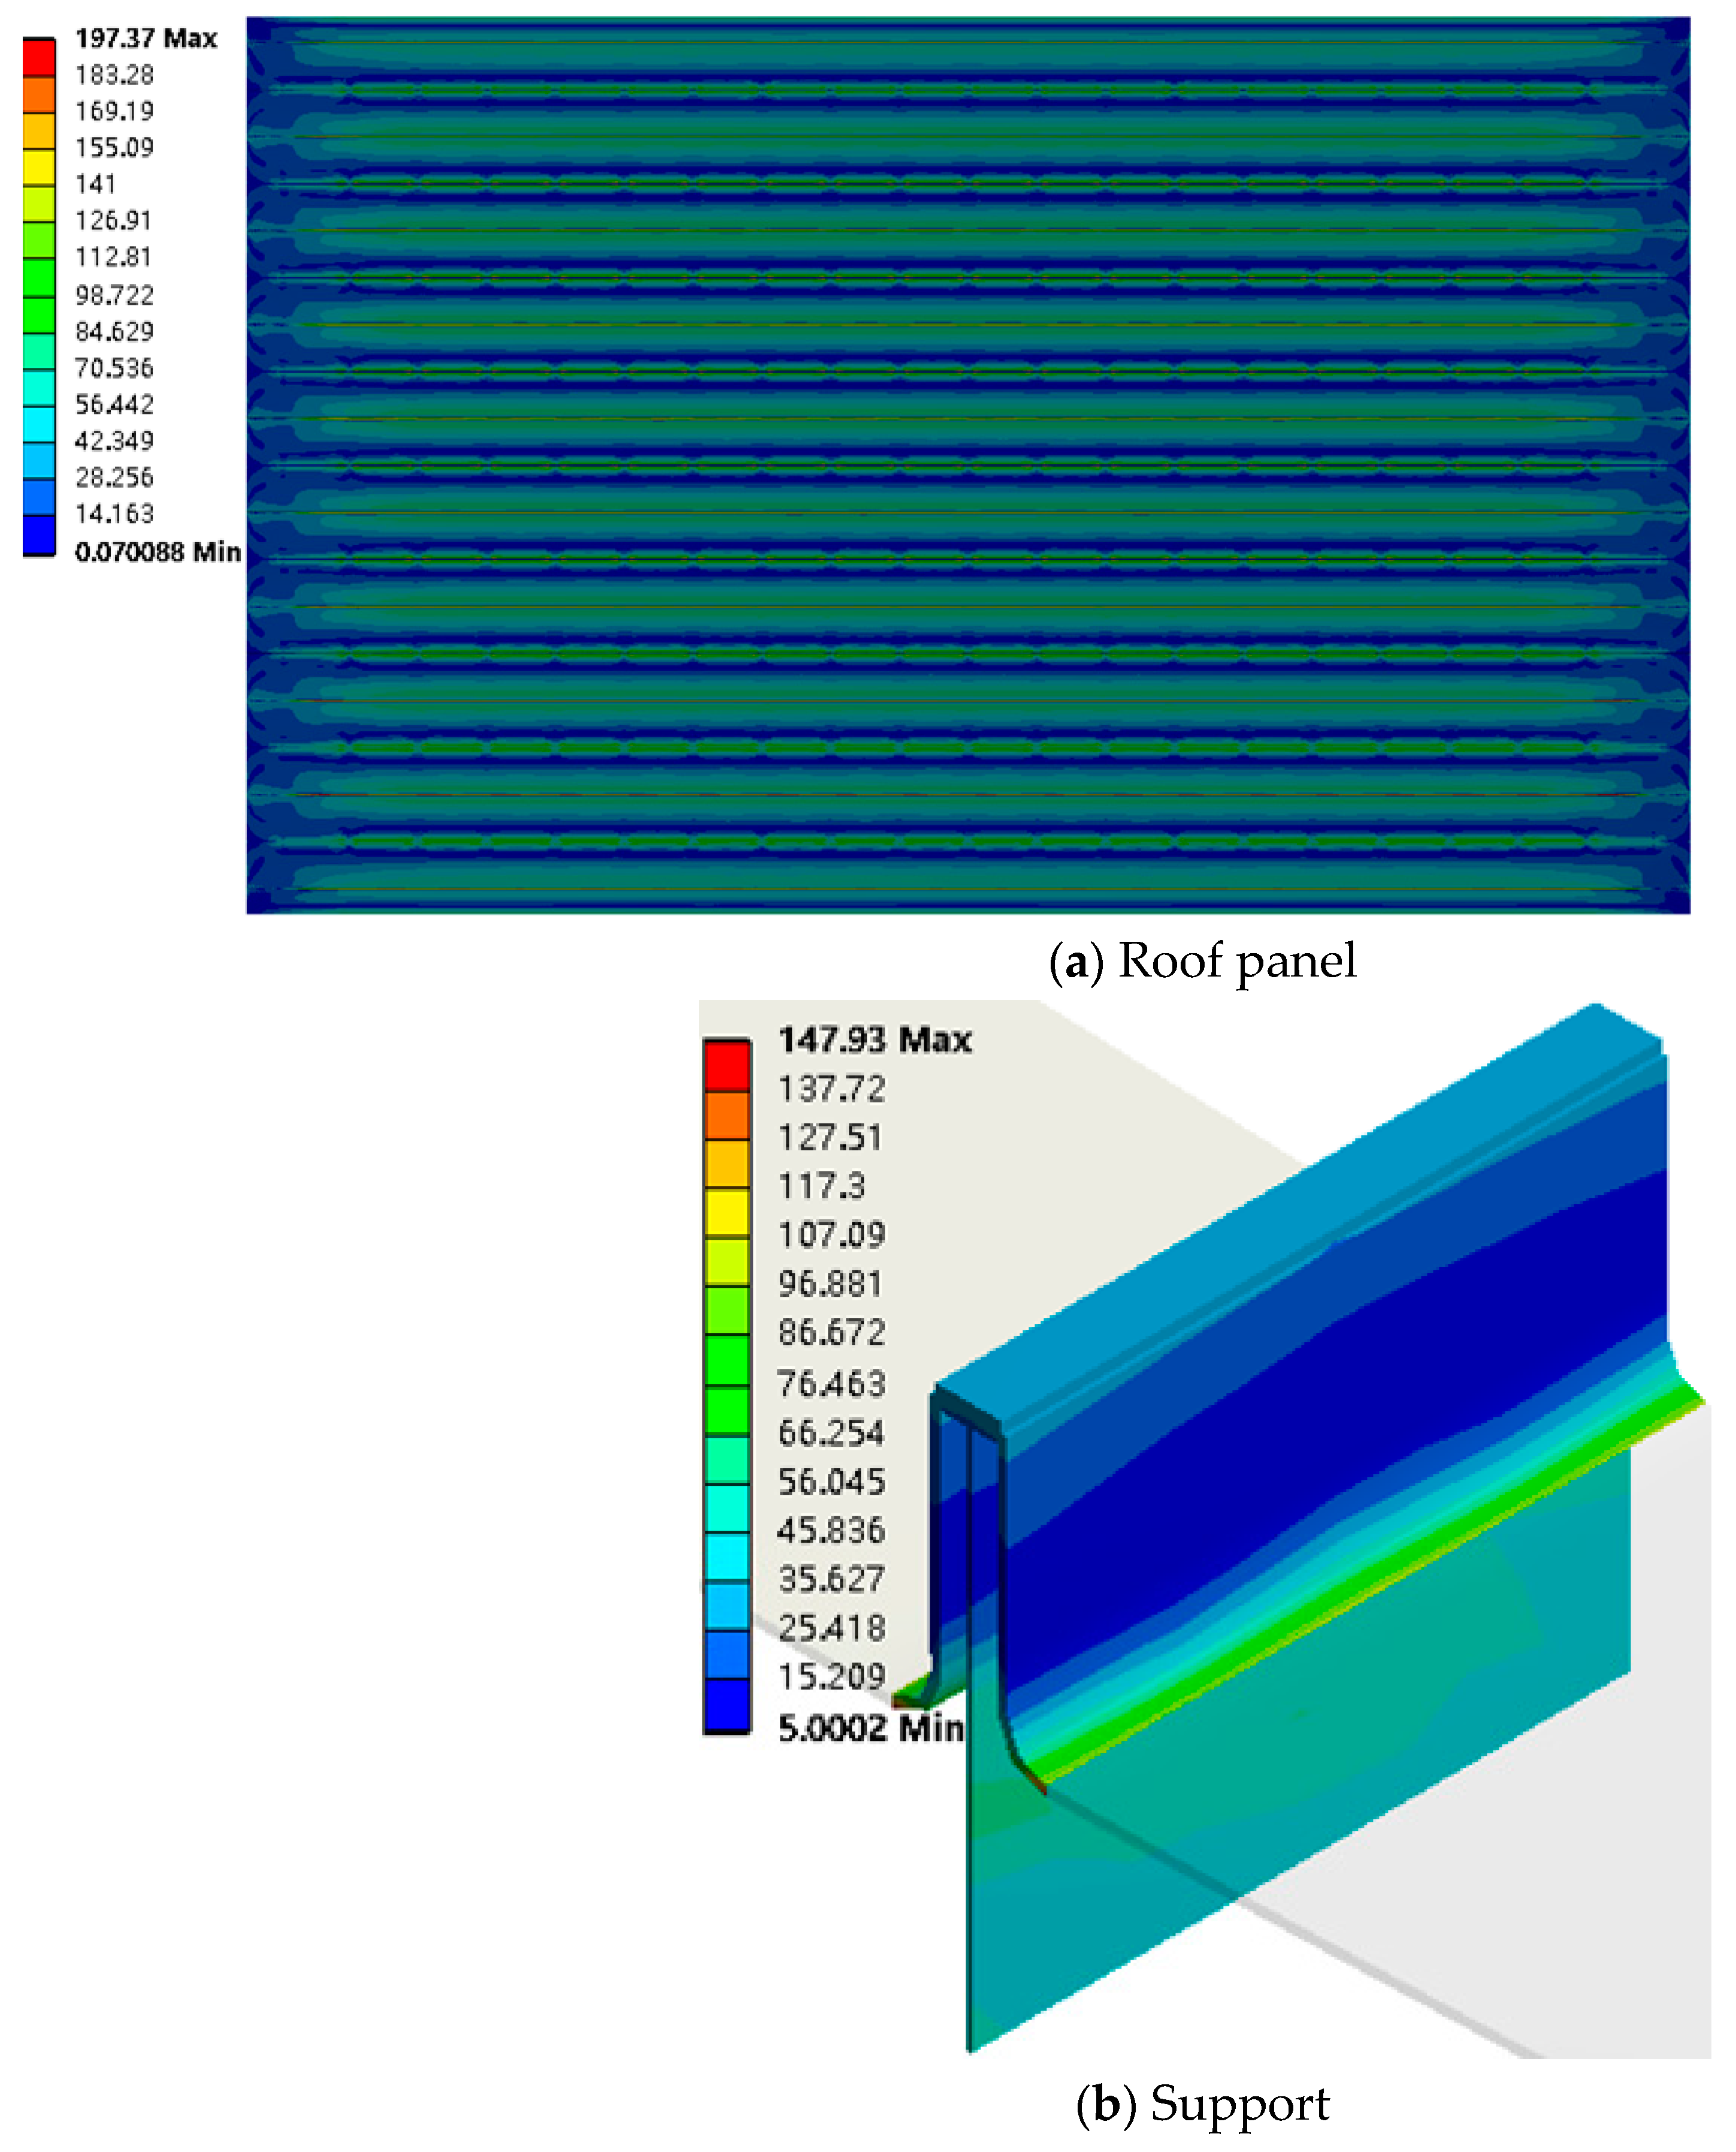
4.3. Analysis of Finite Element Results

Figure 17 shows the equivalent stress cloud diagram of the roof panel and the support after applying a load of 15 kPa. It can be observed that the residual stress after unloading is 197.37 MPa, primarily concentrated in the arc of the roof panel span. The maximum stress on the bearing and rib under wind load is mainly focused on the corner of the roof panel. The equivalent stress distribution of the plate rib decreases first and then increases from top to bottom, exhibiting obvious stratification. The peak residual stress on the bearing is 147.93 MPa, primarily concentrated in the middle of the plate rib.
To further analyze the ultimate bearing capacity of the roof system, the load is applied on the surface of the roof panel in the form of surface load. When loading to 18 kPa, the stress cloud diagram of the roof panel is shown in Figure 18. It can be seen that the maximum stress of the roof panel reaches 479.64 MPa, and the stress is still diffused along the support. The maximum stress no longer appears at the corner of the roof panel, but at the mid-span arc of the roof panel. This shows that with the continuous increase of load, the roof panel will produce large stress due to excessive deformation; that is, when the roof panel is subjected to ultimate load, the most prone-to-damage area is at the arc of the roof panel. At this time, the roof panel reaches the current yield strength, and the roof panel material fails under continuous loading. Therefore, it can be inferred that the ultimate bearing capacity of the continuous welded stainless-steel roof is 18 kPa. Figure 19 shows the change of peak stress of the roof slab and support with the increase of load. It can be seen that the equivalent stress of the support is smaller than that of the roof panel.

5. Conclusions

In this study, wind uplift tests were conducted on two types of metal roof systems. The mechanical properties and deformation characteristics of the roof systems were analyzed under various wind loads. The following conclusions can be drawn:
  • The stress of each structural layer of the roof system gradually increased with the increase of the wind load. Specimen B’s wind-resistant bearing capacity was more significant than Specimen A’s. Specimen A yielded under a wind load of 9 kPa, while Specimen B remained in the elastic stage.
  • The stress of the roof panel was significantly larger than that of other structural layers. The stress at the corner of the roof panel of Specimen A was more significant than that in the middle. With the change of the wind load, the stress of the purlin tended to stabilize.
  • Specimen B’s most extensive roof panel experienced a peak stress of approximately 275.3 MPa, representing 86% of the yield strength. The vertical displacement of the panel surface was more pronounced than that of the panel rib, and the maximum displacement of the roof panel reached 97.5 mm. The stress difference between the roof slabs of the two specimens gradually decreased as the load increased.
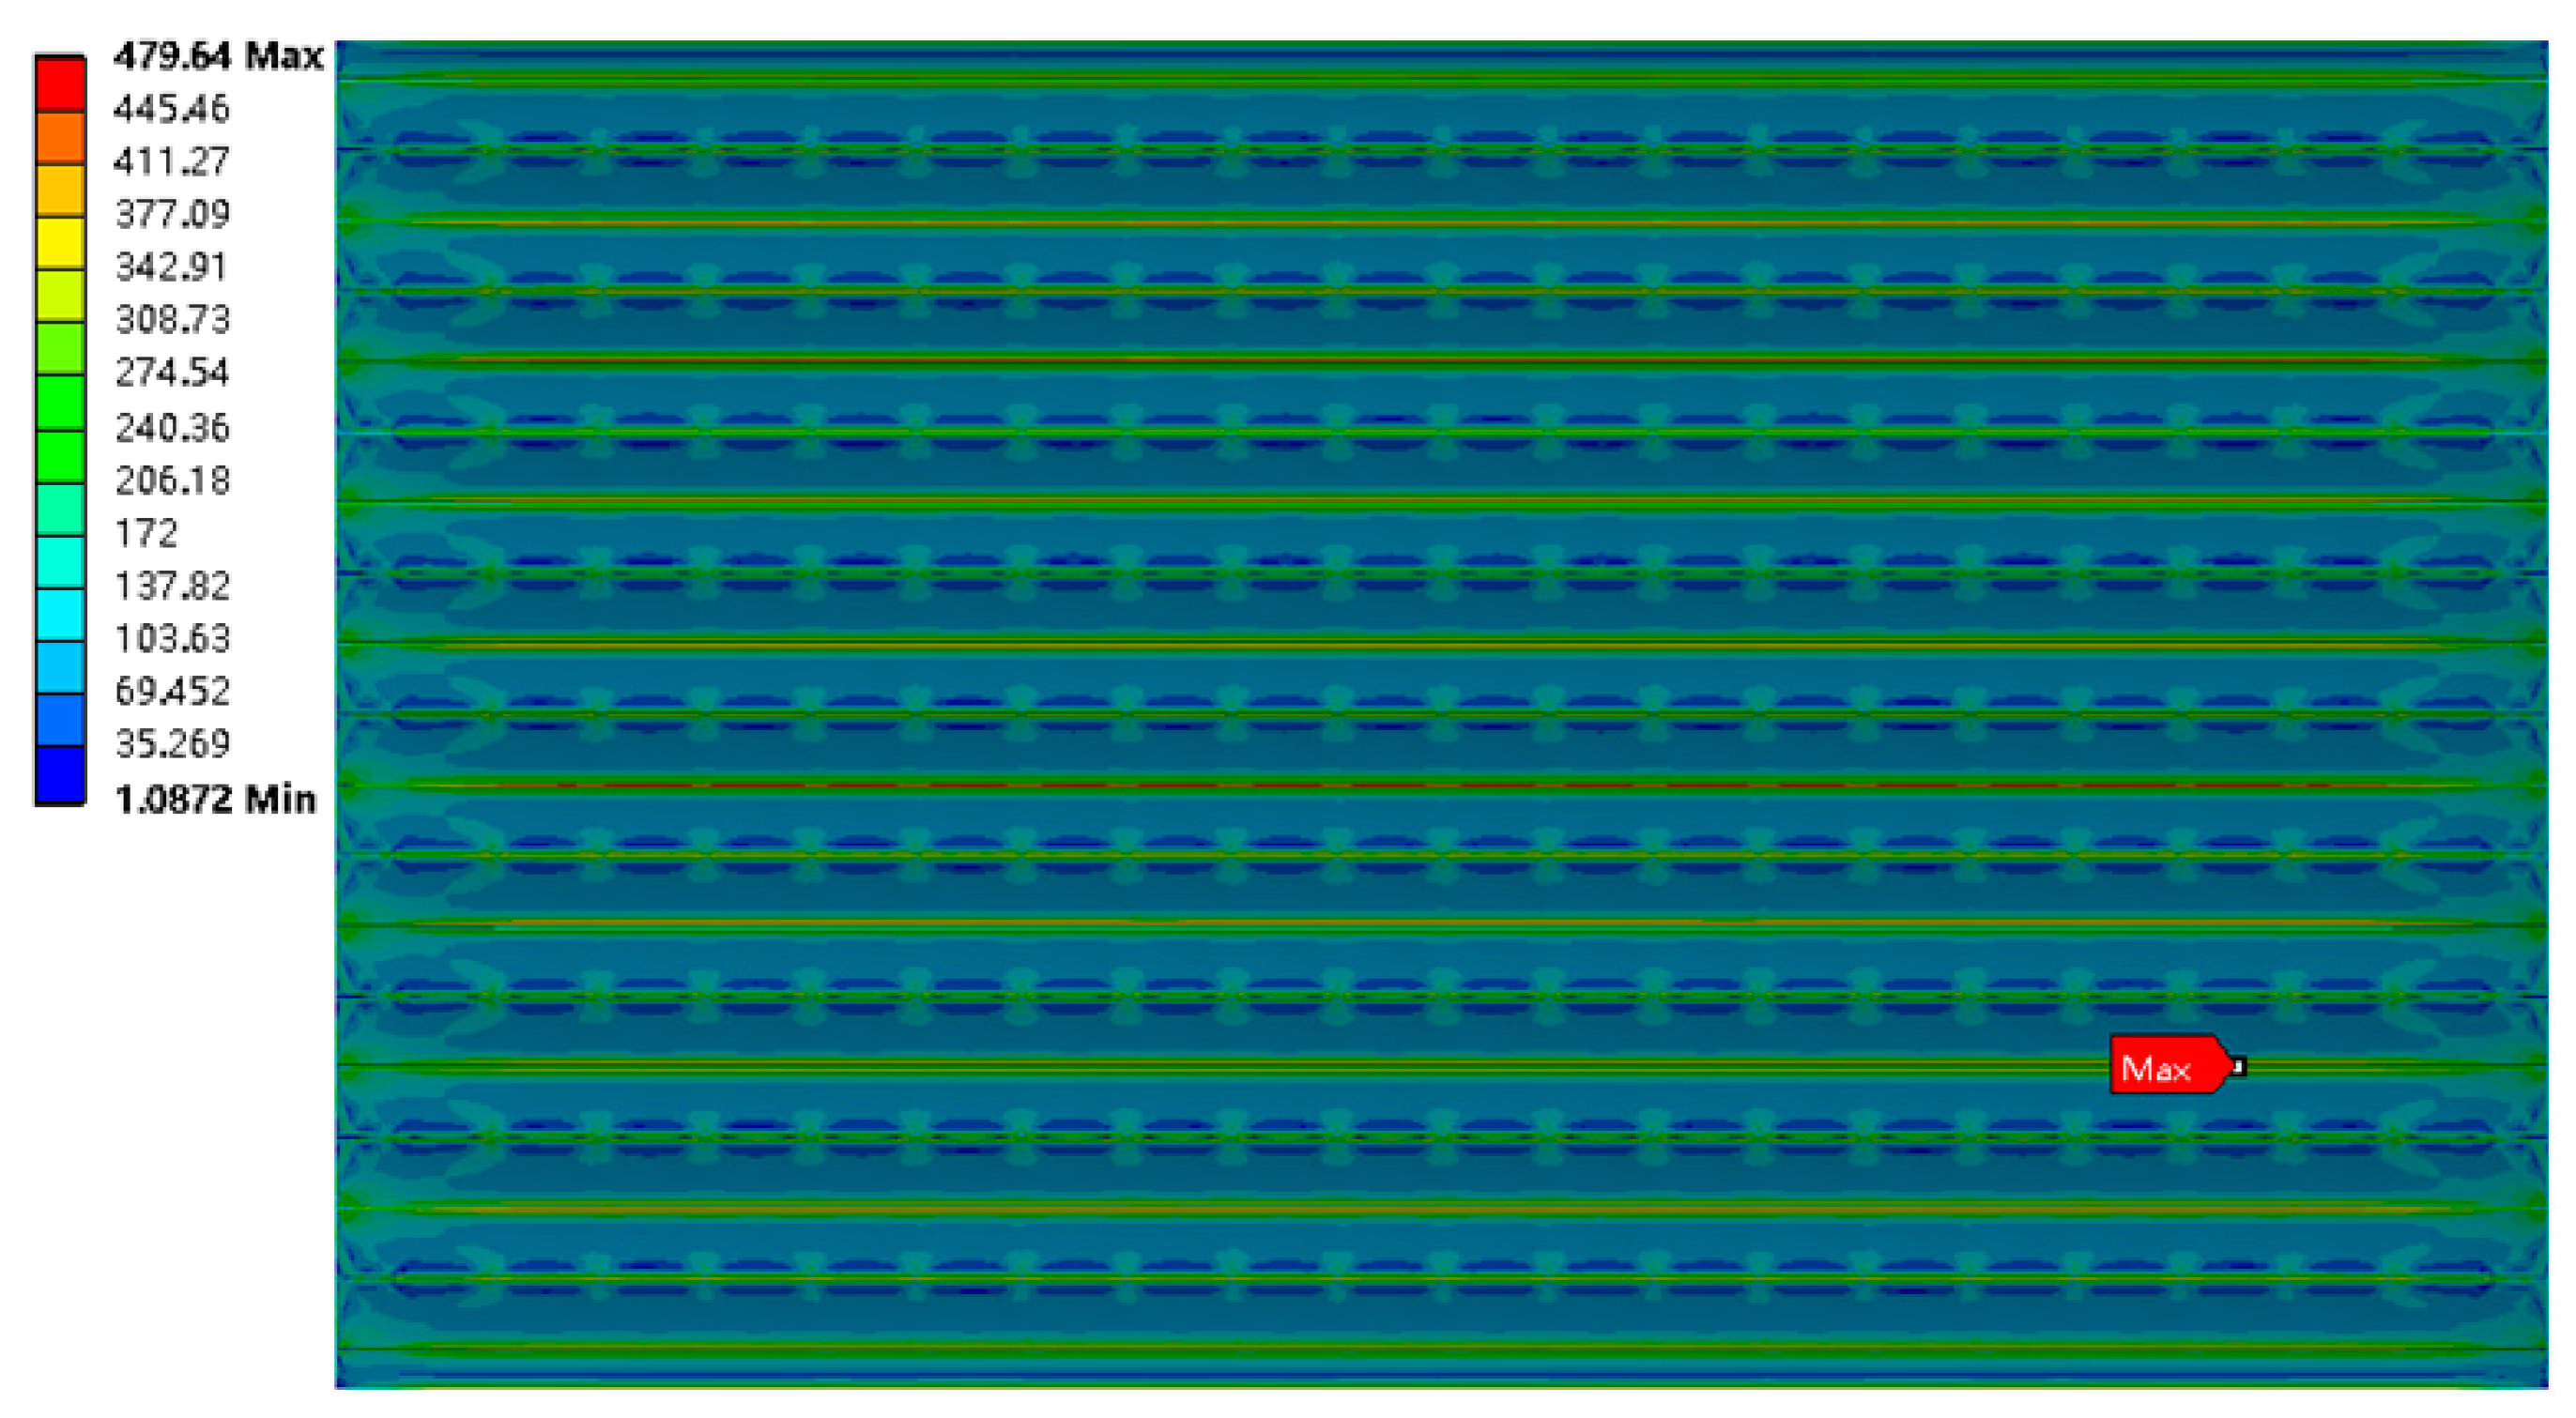
  • The finite element simulation results in this paper had a certain reliability, and the maximum fitting coefficient was 0.976. The ultimate bearing capacity of the roof panel exceeded that of the support, and the maximum stress reached 479.64 MPa.
The subsequent phase will involve conducting finite element parameter analysis or theoretical research for systems with varying purlin spacing or support spacing. Additionally, tests will be conducted for different sheet dimensions or thicknesses. The study will also include an exploration of the damage characteristics of a roof system under wind load.

Author Contributions

Conceptualization, L.C. and J.C.; methodology, L.C.; software, J.C.; validation, J.C.; formal analysis, L.C.; investigation, L.C.; resources, L.C.; data curation, L.C.; writing—original draft preparation, L.C.; writing—review and editing, L.C.; visualization, L.C.; supervision, L.C.; funding acquisition, L.C. All authors have read and agreed to the published version of the manuscript.

Funding

This research was funded by [the Science and Technology Research Program of Jiangxi Provincial Education Department] grant number [GJJ209408] And The APC was funded by Hunan Provincial Innovation Foundation for Postgraduates] grant number [CX20190127].

Data Availability Statement

The data presented in this study are available on request from the corresponding author. The data are not publicly available due to [Some of the data in this paper are the contents of the dissertation, because the dissertation has not been published publicly].

Conflicts of Interest

The authors declare no conflict of interest.

References

  1. Zhou, M.; Fan, J.S.; Liu, Y.F.; Zhang, J.X.; Duan, X.J.; Lei, S.S. Non-uniform temperature field and effect on construction of large-span steel structures. Autom. Constr. 2020, 119, 103399. [Google Scholar] [CrossRef]
  2. Azzi, Z.; Habte, F.; Vutukuru, K.S.; Chowdhury, A.G.; Moravej, M. Effects of roof geometric details on aerodynamic performance of standing seam metal roofs. Eng. Struct. 2020, 225, 111303. [Google Scholar] [CrossRef]
  3. Seek, M.W.; Avci, O.; McLaughlin, D. Effective standoff in standing seam roof systems. J. Constr. Steel Res. 2021, 180, 106590. [Google Scholar] [CrossRef]
  4. Ou, T.; Wang, D.; Xin, Z.; Tan, J.; Wu, C.; Guo, Q.; Zhang, Y. Full-scale tests on the mechanical behavior of a continuously welded stainless steel roof under wind excitation. Thin-Walled Struct. 2020, 150, 106680. [Google Scholar] [CrossRef]
  5. Wu, T.; Sun, Y.; Cao, Z.; Yu, Z.; Wu, Y. Study on the wind uplift failure mechanism of standing seam roof system for performance-based design. Eng. Struct. 2020, 225, 111264. [Google Scholar] [CrossRef]
  6. Xia, Y.; Kopp, G.A.; Chen, S. Failure mechanisms and load paths in a standing seam metal roof under extreme wind loads. Eng. Struct. 2023, 296, 116954. [Google Scholar] [CrossRef]
  7. Mobasher, M.E.; Adams, B.; Mould, J.; Hapij, A.; Londono, J.G. Damage mechanics based analysis of hail impact on metal roofs. Eng. Fract. Mech. 2022, 272, 108688. [Google Scholar] [CrossRef]
  8. El Damatty, A.A.; Rahman, M.; Ragheb, O. Component testing and finite element modeling of standing seam roofs. Thin-Walled Struct. 2003, 41, 1053–1072. [Google Scholar] [CrossRef]
  9. Ali, H.M.; Senseny, P.E. Models for standing seam roofs. J. Wind Eng. Ind. Aerodyn. 2003, 91, 1689–1702. [Google Scholar] [CrossRef]
  10. Petrov, A.A. Dynamic response and life prediction of steel structures under wind loading. J. Wind Eng. Ind. Aerodyn. 1998, 74, 1057–1065. [Google Scholar] [CrossRef]
  11. Xu, Y. Fatigue damage estimation of metal roof cladding subject to wind loading. J. Wind Eng. Ind. Aerodyn. 1997, 72, 379–388. [Google Scholar] [CrossRef]
  12. Kumar, K.S. Prediction of wind-induced fatigue on claddings of low buildings. Comput. Struct. 2000, 75, 31–44. [Google Scholar] [CrossRef]
  13. Baskaran, B.A.; Lei, W.; Richardson, C. Dynamic evaluation of thermoplastic roofing system for wind performance. J. Archit. Eng. 1999, 5, 16–24. [Google Scholar] [CrossRef]
  14. Baskaran, B.A.; Ko, S.K.P. Optimizing the wind uplift resistance of mechanically attached roofing systems. J. Archit. Eng. 2008, 14, 65–75. [Google Scholar] [CrossRef]
  15. Sivapathasundaram, M.; Mahendran, M. Development of fragility curves for localised pull-through failures of thin steel roof battens. Eng. Struct. 2016, 124, 64–84. [Google Scholar] [CrossRef]
  16. Sivapathasundaram, M.; Mahendran, M. Experimental studies of thin-walled steel roof battens subject to pull-through failures. Eng. Struct. 2016, 113, 388–406. [Google Scholar] [CrossRef]
  17. Myuran, K.; Mahendran, M. New test and design methods for steel roof battens subject to fatigue pull-through failures. Thin-Walled Struct. 2017, 119, 558–571. [Google Scholar] [CrossRef]
  18. Myuran, K.; Mahendran, M. Unified static-fatigue pull-through capacity equations for cold-formed steel roof battens. J. Constr. Steel Res. 2017, 139, 135–148. [Google Scholar] [CrossRef]
  19. Luan, W.; Li, Y. Experimental investigation on wind uplift capacity of single span Z-purlins supporting standing seam roof systems. Thin-Walled Struct. 2019, 144, 106324. [Google Scholar] [CrossRef]
  20. Hong, H.; He, W. Effect of human error on the reliability of roof panel under uplift wind pressure. Struct. Saf. 2015, 52, 54–65. [Google Scholar] [CrossRef]
  21. Jancauskas, E.D.; Mahendran, M.; Walker, G.R. Computer simulation of the fatigue behaviour of roof cladding during the passage of a tropical cyclone. J. Wind Eng. Ind. Aerodyn. 1994, 51, 215–227. [Google Scholar] [CrossRef]
  22. Kot, P.; Ali, A.S.; Shaw, A.; Riley, M.; Alias, A. The application of electromagnetic waves in monitoring water infiltration on concrete flat roof: The case of Malaysia. Constr. Build. Mater. 2016, 30, 435–445. [Google Scholar] [CrossRef]
  23. Wang, D.; Xin, Z.; Ou, T.; Wang, M.; Zhu, Y.; Mao, J. Experimental study on mechanical properties of the key connection joint for the continuous welded stainless steel roof system. Structures 2023, 48, 53–63. [Google Scholar] [CrossRef]
  24. Wang, D.; Zhao, Z.; Ou, T.; Xin, Z.; Wang, M.; Zhang, Y. Wind resistance performance of a continuous welding stainless steel roof under static ultimate wind loading with testing and simulation methods. Wind Struct. 2021, 32, 12989. [Google Scholar]
  25. ASTM E1592-05; Standard Test Method for Structural Performance of Sheet Metal Roof and Siding Systems by Uniform Static Air Pressure Difference. ASTM International: West Conshohocken, PA, USA, 2017.
Figure 1. Schematic diagram of wind resistance test device.
Buildings 14 00065 g001
Figure 2. Structural diagram of Specimen A.
Buildings 14 00065 g002
Figure 3. Structure diagram of Specimen B.
Buildings 14 00065 g003
Figure 4. Test equipment and strain gauges.
Buildings 14 00065 g004
Figure 5. Measuring point arrangement of Specimen A.
Buildings 14 00065 g005aBuildings 14 00065 g005b
Figure 6. Measuring point arrangement of Specimen B.
Buildings 14 00065 g006
Figure 7. Displacement sensor arrangement of Specimen B.
Buildings 14 00065 g007
Figure 8. Test loading curve.
Buildings 14 00065 g008
Figure 9. The stress-change curve of the middle measuring point in different structural layers.
Buildings 14 00065 g009
Figure 10. The stress-change curve of the corner measuring points in different structural layers.
Buildings 14 00065 g010
Figure 11. The stress-change curve of different measuring points.
Buildings 14 00065 g011
Figure 12. The stress-change curve of Specimen B.
Buildings 14 00065 g012
Figure 13. The displacement-change curve of Specimen B.
Buildings 14 00065 g013
Figure 14. Roof panel stress comparison.
Buildings 14 00065 g014
Figure 15. Finite element model of Specimen B.
Buildings 14 00065 g015
Figure 16. Comparison of experiment and FEM results.
Buildings 14 00065 g016
Figure 17. The equivalent stress cloud diagram of the roof panel and the support.
Buildings 14 00065 g017
Figure 18. Equivalent stress cloud diagram of roof panel.
Buildings 14 00065 g018
Figure 19. Equivalent stress variation curves of roof panel and support.
Buildings 14 00065 g019
Table 1. Major material properties of Specimen A.
Structural FloorMaterialElastic Modulus (GPa)Yield Strength (MPa)
BackingQ345B206345
PurlinQ345B206345
SupportAluminum alloy69170
Roof panelAA3004 aluminum magnesium manganese70190
Table 2. Major material properties of Specimen B.
CategorySupport (B)Roof Panel (B)
Yield strength (MPa)300329
Elasticity modulus (GPa)193200
Poisson’s ratio0.30.29
Thickness (mm)0.20.6
Width (mm)30468
Length (mm)507500
Table 3. Comparison of stress peaks at different middle measuring points.
Middle Measuring PointsLoading (Pa)
3000~50005000~70007000~90009000~11,000
1-4 (MPa)−30.5−39.7−54.3−81.1
2-2 (MPa)−6.8−9.2−10.9−9.0
3-1 (MPa)6.918.760.616.0
4-4 (MPa)−123.8−156.1−126.1−209.9
Table 4. Comparison of stress peaks at different corner measuring points.
Corner Measuring PointsLoading (Pa)
3000~50005000~70007000~90009000~11,000
1-6 (MPa)−13.4−23.7−27.9−29.2
3-3 (MPa)7.67.09.94.7
4-6 (MPa)−135.5−192.7−254.8−268.9
Table 5. The maximum and minimum roof panel stresses under different wind loads.
Loading (kPa)A Max (MPa)B Max (MPa)Difference = (A − B)/A (%)A Min (MPa)B Min (MPa)Difference = (A − B)/A (%)
387.331.264.335.16.980.0
6185.370.162.276.330.260.5
9254.6165.435.088.674.719.3
12268.9275.32.5169.8141.416.6
Disclaimer/Publisher’s Note: The statements, opinions and data contained in all publications are solely those of the individual author(s) and contributor(s) and not of MDPI and/or the editor(s). MDPI and/or the editor(s) disclaim responsibility for any injury to people or property resulting from any ideas, methods, instructions or products referred to in the content.

