Article

Night Lighting Fault Detection Based on Improved YOLOv5

1
Institute for Electric Light Sources, School of Information Science and Technology, Fudan University, Shanghai 200433, China
2
HES Technology Group Co., Ltd., Noble Center, 128 South 4th Ring West Road, Fengtai District, Beijing 100070, China
*
Authors to whom correspondence should be addressed.
Buildings 2024, 14(10), 3051; https://doi.org/10.3390/buildings14103051
Submission received: 1 September 2024 / Revised: 20 September 2024 / Accepted: 23 September 2024 / Published: 25 September 2024
(This article belongs to the Section Building Materials, and Repair & Renovation)

Abstract

:
Night lighting is essential for urban life, and the occurrence of faults can significantly affect the presentation of lighting effects. Many reasons can cause lighting faults, including the damage of lamps and circuits, and the typical manifestation of the faults is that the lights do not light up. The current troubleshooting mainly relies on artificial visual inspection, making detecting faults difficult and time-consuming. Therefore, it is necessary to introduce technical means to detect lighting faults. However, current research on lighting fault detection mainly focuses on using non-visual methods such as sensor data analysis, which has the disadvantages of having a high cost and difficulty adapting to large-scale fault detection. Therefore, this study mainly focuses on solving the problem of the automatic detection of night lighting faults using machine vision methods, especially object detection methods. Based on the YOLOv5 model, two data fusion models have been developed based on the characteristics of lighting fault detection inverse problems: YOLOv5 Channel Concatenation and YOLOv5 Image Fusion. Based on the dataset obtained from the developed automatic image collection and annotation system, the training and evaluation of these three models, including the original YOLOv5, YOLOv5 Channel Concatenation, and YOLOv5 Image Fusion, have been completed. Research has found that applying complete lighting images is essential for the problem of lighting fault detection. The developed Image Fusion model can effectively fuse information and accurately detect the occurrence and area of faults, with a mAP value of 0.984. This study is expected to play an essential role in the intelligent development of urban night lighting.

1. Introduction

With the development of the urban economy, night lighting plays an increasingly important role in urban life, not only lighting up the night sky of the city but also bringing spiritual enjoyment to people and adding new vitality to the city. Therefore, quality night lighting and signage lighting are vital to the night-time design of modern urban environments and can provide lighting function, aesthetics, and an emotional experience [1].
Night lighting improves people’s lives, but the occurrence of faults is also inevitable, which can affect the perfect presentation of lighting effects. Due to the large number of lighting points, it is time-consuming and labor-intensive to rely on artificial visual inspection to troubleshoot, and it is also prone to omissions and misjudgments. Therefore, how to use equipment to accurately, quickly, and automatically identify and detect lighting faults is a necessary task that must be completed.
There is some research on lighting fault detection. In automotive lighting systems, the method for detecting lighting faults is based on analyzing the voltage, current, temperature, and other states in the circuit to determine whether there is a lighting fault [2,3,4], and specifically, a method utilizing neural networks for detection has been proposed to improve the effectiveness of detection [4]. In traffic light systems, traffic signal light faults are detected through specially designed circuit boards and the analysis of the values from sensors [5]. In street light systems, an IoT system based on the Light-Dependent Resistor (LDR) has been proposed to detect the damage of light [6]. It can be seen that current detection methods for lighting faults are mainly focused on nonvisual aspects, such as analyzing sensor data. However, the scale of urban night lighting is large, and the distribution of lamps is scattered. Therefore, to detect lighting faults, many sensor devices are needed, which will increase the cost of designing and constructing night lighting systems. Therefore, other detection methods need to be studied for night lighting.
There is a suitable method of using images for fault detection in night lighting. On the one hand, one image contains sufficient information to detect lighting faults.On the other hand, cameras are peripheral equipment that do not require any modifications to the original circuit and have a relatively low cost. Machine vision is a system that automatically collects and analyzes images. Images are collected through optical devices or non-contact sensors, such as a camera, and the analysis of images is achieved through machine vision algorithms [7]. Traditional machine vision algorithms extract features through statistical methods, requiring the manual analysis of image features and the design of feature extractors for image analysis, which makes it difficult to cope with various complex scenarios [8,9,10]. In contrast, machine learning algorithms represented by deep learning can automatically learn image features through training, have the characteristics of automatic feature extraction, high universality, a strong learning ability, and high accuracy, and are becoming the mainstream machine vision method [11].
Deep learning is a method of computing and analyzing images by simulating the connections of human brain neurons to construct neural networks. It has progressed in various machine vision tasks, such as image recognition and classification [12], image segmentation [13], object detection [14], object tracking [15], and semantic segmentation [16], and a relatively complete review can be found be referring to the paper in reference [11].
In lighting fault detection, the main goal is to ascertain whether a fault has occurred or not and, if so, the location where it occurred. Therefore, we can adopt object detection methods to achieve this target. Two main object detection methods are based on deep learning: two-stage algorithms and one-stage algorithms [14]. Two-stage algorithms mainly perform object detection through two steps: the extraction of candidate regions and classification and regression correction for these candidate regions. Representative algorithms include SPP-Net [17] and R-CNN series, including R-CNN [18], Fast R-CNN [19], and Faster R-CNN [20]. Compared to two-stage algorithms, one-stage algorithms directly complete the regression of bounding box positions and determine object categories in one step without extracting candidate regions, achieving the end-to-end detection of an image. One-stage algorithms have a relatively simple network structure and training process and generally perform better in actual detection. Representative algorithms include SSD [21] and YOLO series, including YOLOv1 [22], YOLOv2 [23], YOLOv3 [24], YOLOv4 [25], YOLOv5 [26], YOLOv6 [27], YOLOv7 [28], etc., and a review of YOLO series can be found by referring to the paper in reference [29].
In this study, we use YOLOv5 as our basic algorithm to detect the faults of night lighting, and the manifestation form of the lighting faults is that the area should have lit up, but the light did not. The selection of YOLOv5 is mainly based on two considerations. On the one hand, it can simultaneously balance the detection effect and speed with the characteristics of a good detection effect, a fast detection speed, and relatively low computational complexity, which can meet the needs of practical applications. On the other hand, it is one of the most common models in research and applications. Many studies and applications are based on this model or its extensions, such as autonomous driving [30], industrial detection [31], forest fire prevention [32], road inspection [33], underwater detection [34], and banknote detection [35]. The fault manifestation form is selected because, in engineering practice, the most common damage manifestation is that the light does not light up, which will significantly impact night lighting. Therefore, it is chosen to detect this type of fault.
In this study, based on YOLOv5, we have developed a new image fusion algorithm for detecting night lighting faults. In order to verify the effectiveness of the algorithm, an automatic collection and annotation system for night lighting fault images has been developed under laboratory conditions. With this system, the collection of lighting fault images and the training and testing of the developed algorithm have been completed. The paper is organized as follows: In Section 2, we will introduce our developed algorithm and automatic image collection and annotation system. And then, in Section 3, the experiment configurations and results will be given. Finally, the conclusions are given in Section 4.

2. Methods

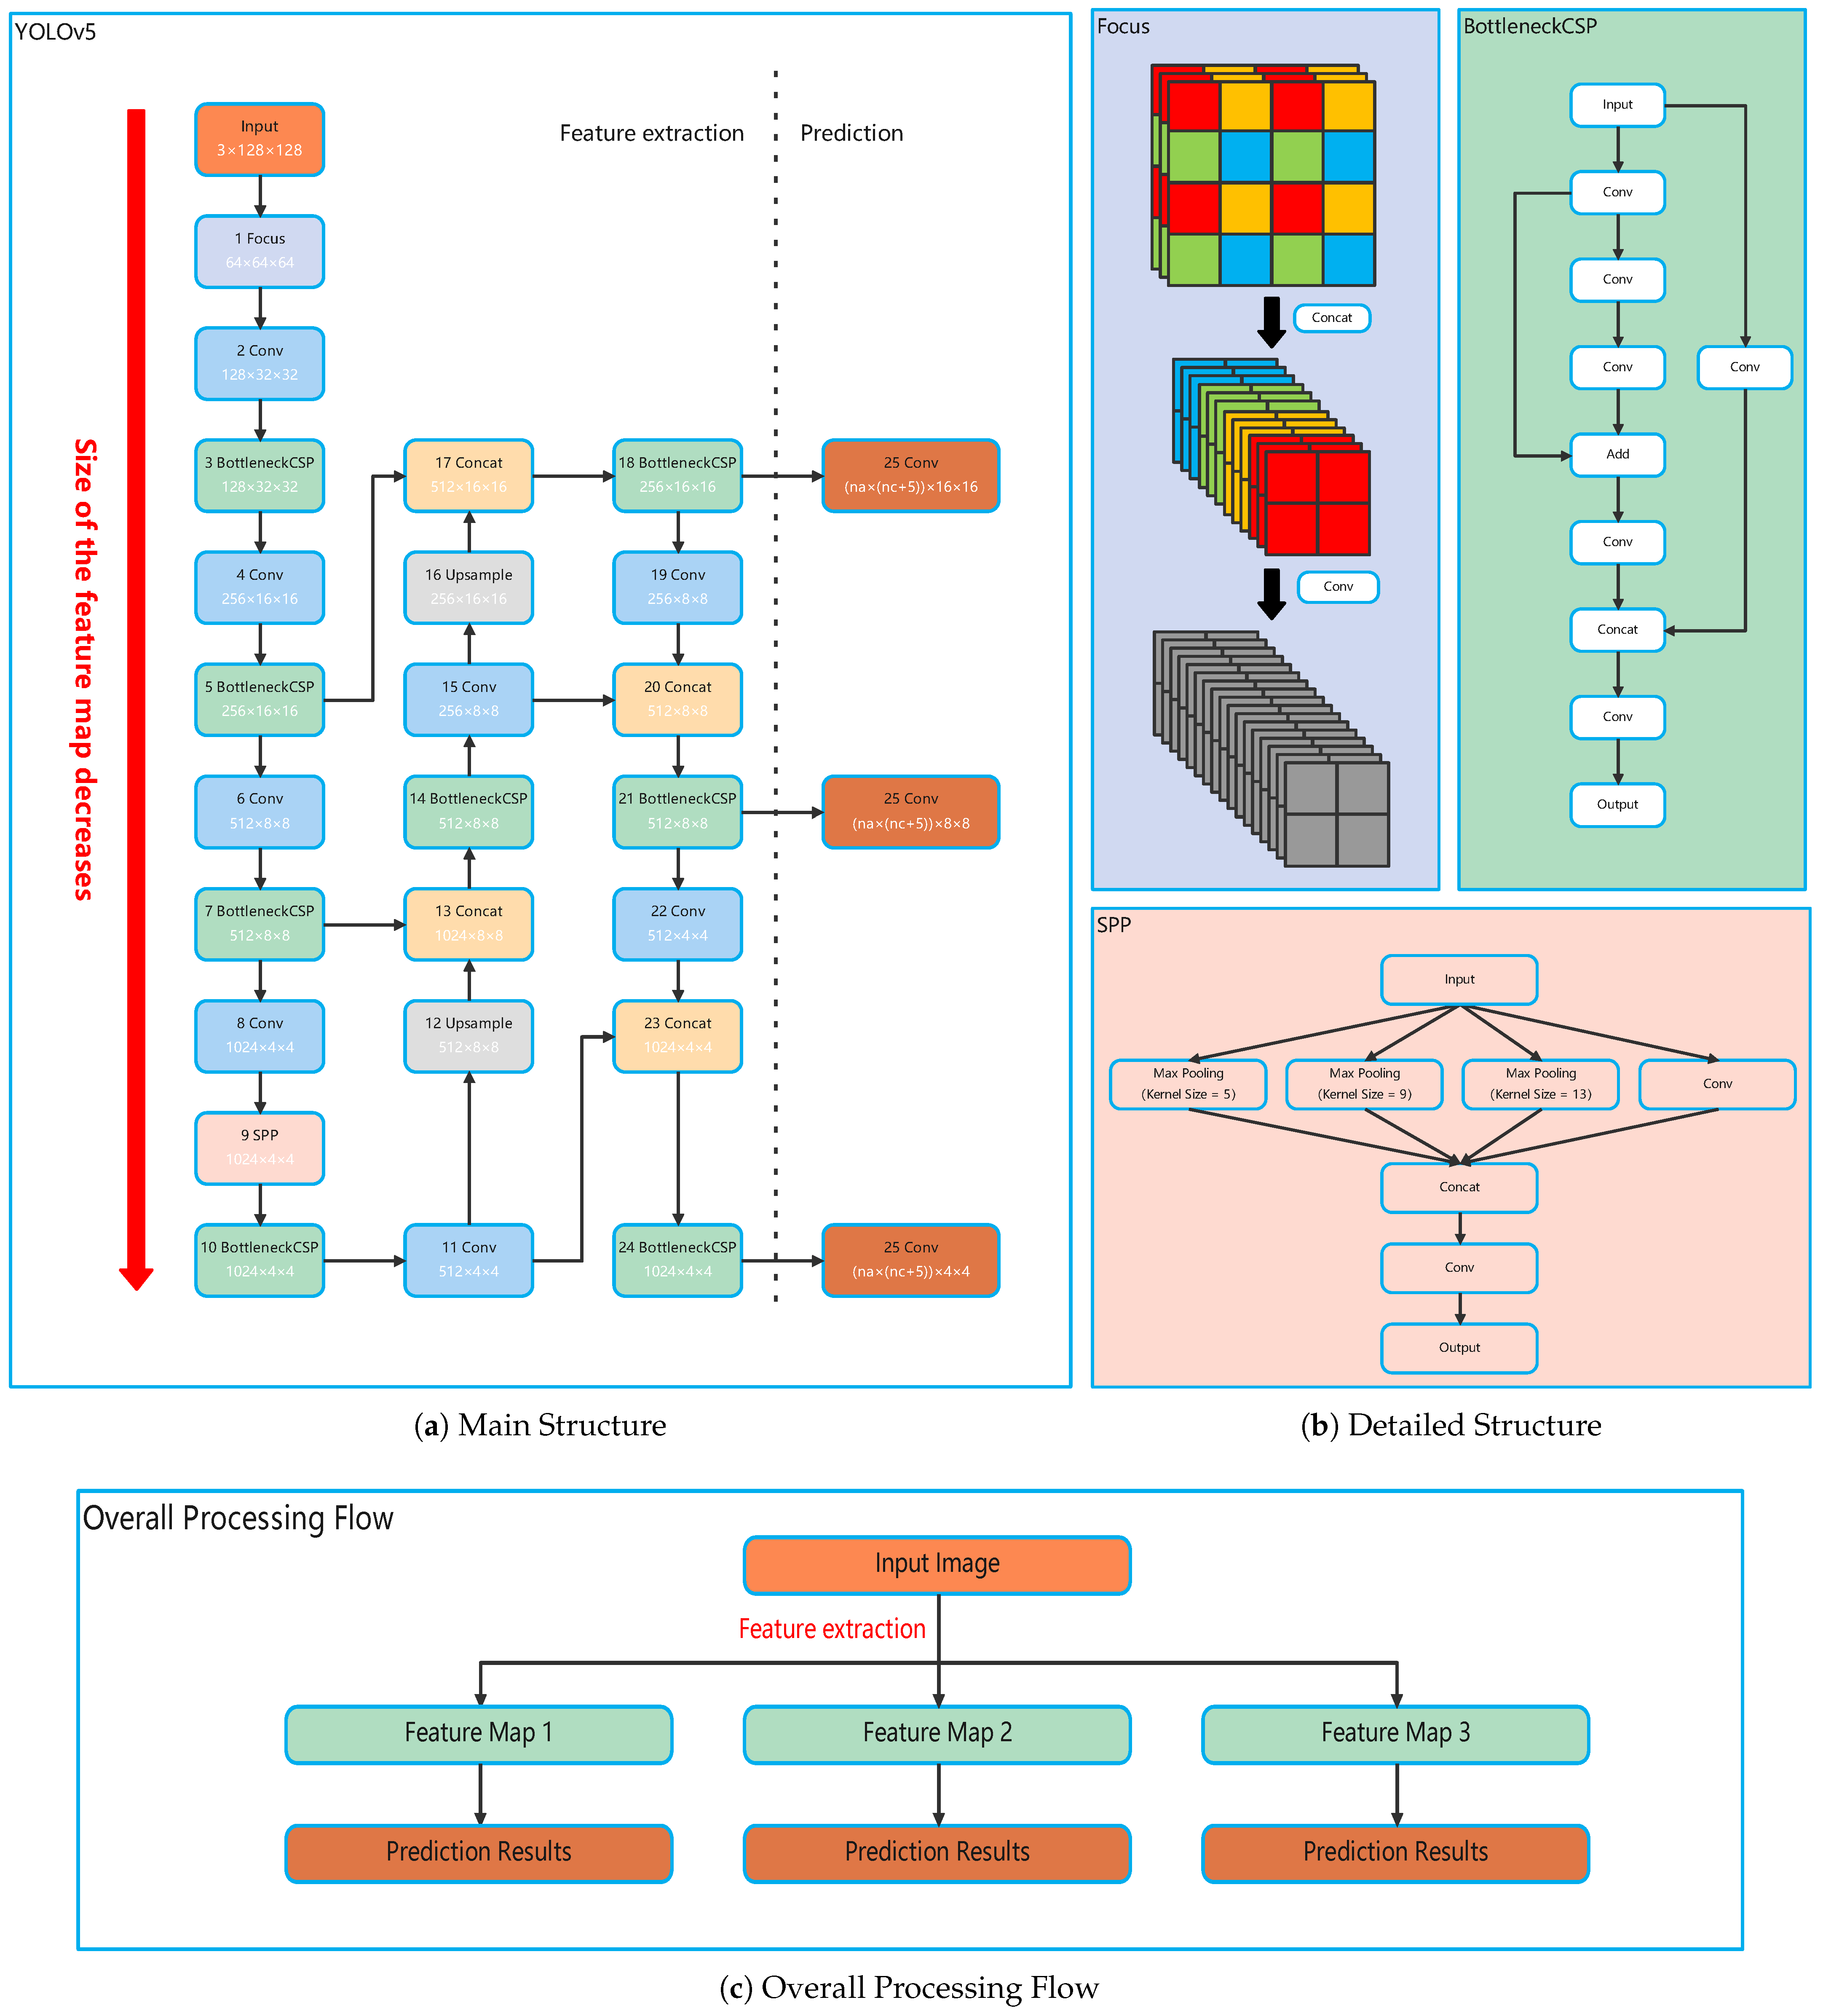
2.1. Network Structure

In this section, we will introduce the original YOLOv5 algorithm and propose the specific network structure of the developed algorithm based on the actual situation of night lighting fault detection.

2.1.1. YOLOv5

The YOLO series algorithms are single-stage object detection algorithms with roughly the same network structure, which can be broadly divided into two parts: a feature extraction module and a prediction module, with differences reflected in the details of the structure.
The main structure of YOLOv5 is shown in Figure 1a. The figure separates the two main parts by a dashed line. The left side of the dashed line is the feature extraction module, which mainly extracts the features of the image through convolution, pooling, upsampling, and other operations. The right side of the dashed is the prediction module, which includes three detection heads to predict objects of different sizes.
The operation order of the algorithm starts from the input unit, and the operation is carried out in the order of the arrows. To easily distinguish the direction of the algorithm, a number is used before the name of each operation unit to indicate the approximate operation order. To make it easier to understand the operation logic of the algorithm, the size of the feature map after this unit operation is given in the unit: Channel × Heigh × Width, which is given according to the input image size of 3 × 128 × 128, where 3 represents the RGB three channels of the image, and 128 × 128 is the height and width of the image. As shown by the red arrow in the figure, with the extraction of features, the size of the feature map of the entire network structure gradually decreases from top to bottom. It is worth noting that YOLOv5 does not limit the height and width of the image. Therefore, if the height and width of the image are not this size, it only needs to be converted by multiples.
In the feature extraction module, in addition to conventional units, there are also some special composite units: Focus, BottleneckCSP, and SPP, whose detailed structures are shown in Figure 1b. The structures of the BottleneckCSP and SPP units are relatively easy to understand. Here, we will focus on the Focus unit, whose operation process is as follows: First, the image pixels are separated and divided into four sub-images, represented by different colors in the Figure. Then, these four sub-images are concatenated along the channel and convolved. This operation’s advantage is increasing the receptive field while reducing the computational complexity.
In the prediction module, each pixel of the detection head corresponds to na anchors, which are preset target boxes. Each anchor is responsible for predicting whether an area in the original image contains objects and their category information. The anchors are predicted based on the pixel information in the channel dimension. The predicted information includes the confidence of the anchor containing the object, four size and position adjustment values, and nc object category probability values. Therefore, there are a total of (nc + 5) pieces of information. Each pixel has na anchors, so the number of channels is na × (nc + 5). There are three detection heads, and as shown in Figure 1a, the size of the predicted objects increases sequentially from top to bottom.
When ignoring structure details, the overall processing flow of YOLOv5 can be concluded as in Figure 1c: for an input image, a series of network modules are used for feature extraction to obtain three feature maps, and each feature map is used to provide prediction results.
Figure 1 only shows the network structure of the YOLOv5 algorithm. In order to complete object prediction, there are also a series of post-processing parts, including restoring the predicted object scale to the original image, Non-Maximum Suppression (NMS) processing [36], etc. In order to complete algorithm training, there are also some processes, including image transformations, loss function construction, etc., which will not be repeated here. For specific details, please refer to the original YOLOv5 content introduction [26].
YOLOv5 has a total of 4 versions: YOLOv5s, YOLOv5m, YOLOv5l, and YOLOv5x. The main difference between them is the number of layers in the model and the number of feature map channels, while the main structure of the model is the same, which can lead to differences in the number of parameters, the detection speed, and the detection accuracy of the model. YOLOv5s is the model with the smallest number of parameters; although this may affect the detection accuracy, it is sufficient for the purpose of this research. Therefore, the YOLOv5s model was used in this study.
This study focuses on night lighting fault detection, and the original YOLOv5 algorithm is not feasible. The reason for this is that night lighting fault detection is an inverse problem, which can be described as
Normal Detection problem : F ( image ) = objects Inverse Detection problem : F ( image ) = non - objects
where F represents the detection algorithm. Generally, detection algorithms are focused on detecting the presence of target objects, while this study aims to detect the lack of lighting in areas that should have been illuminated. For this study, the most considerable difficulty is determining whether there is a lack of lighting or if there is no lighting in the first place. Therefore, it is not a conventional object detection problem, nor can it be solved by the original YOLOv5 algorithm.

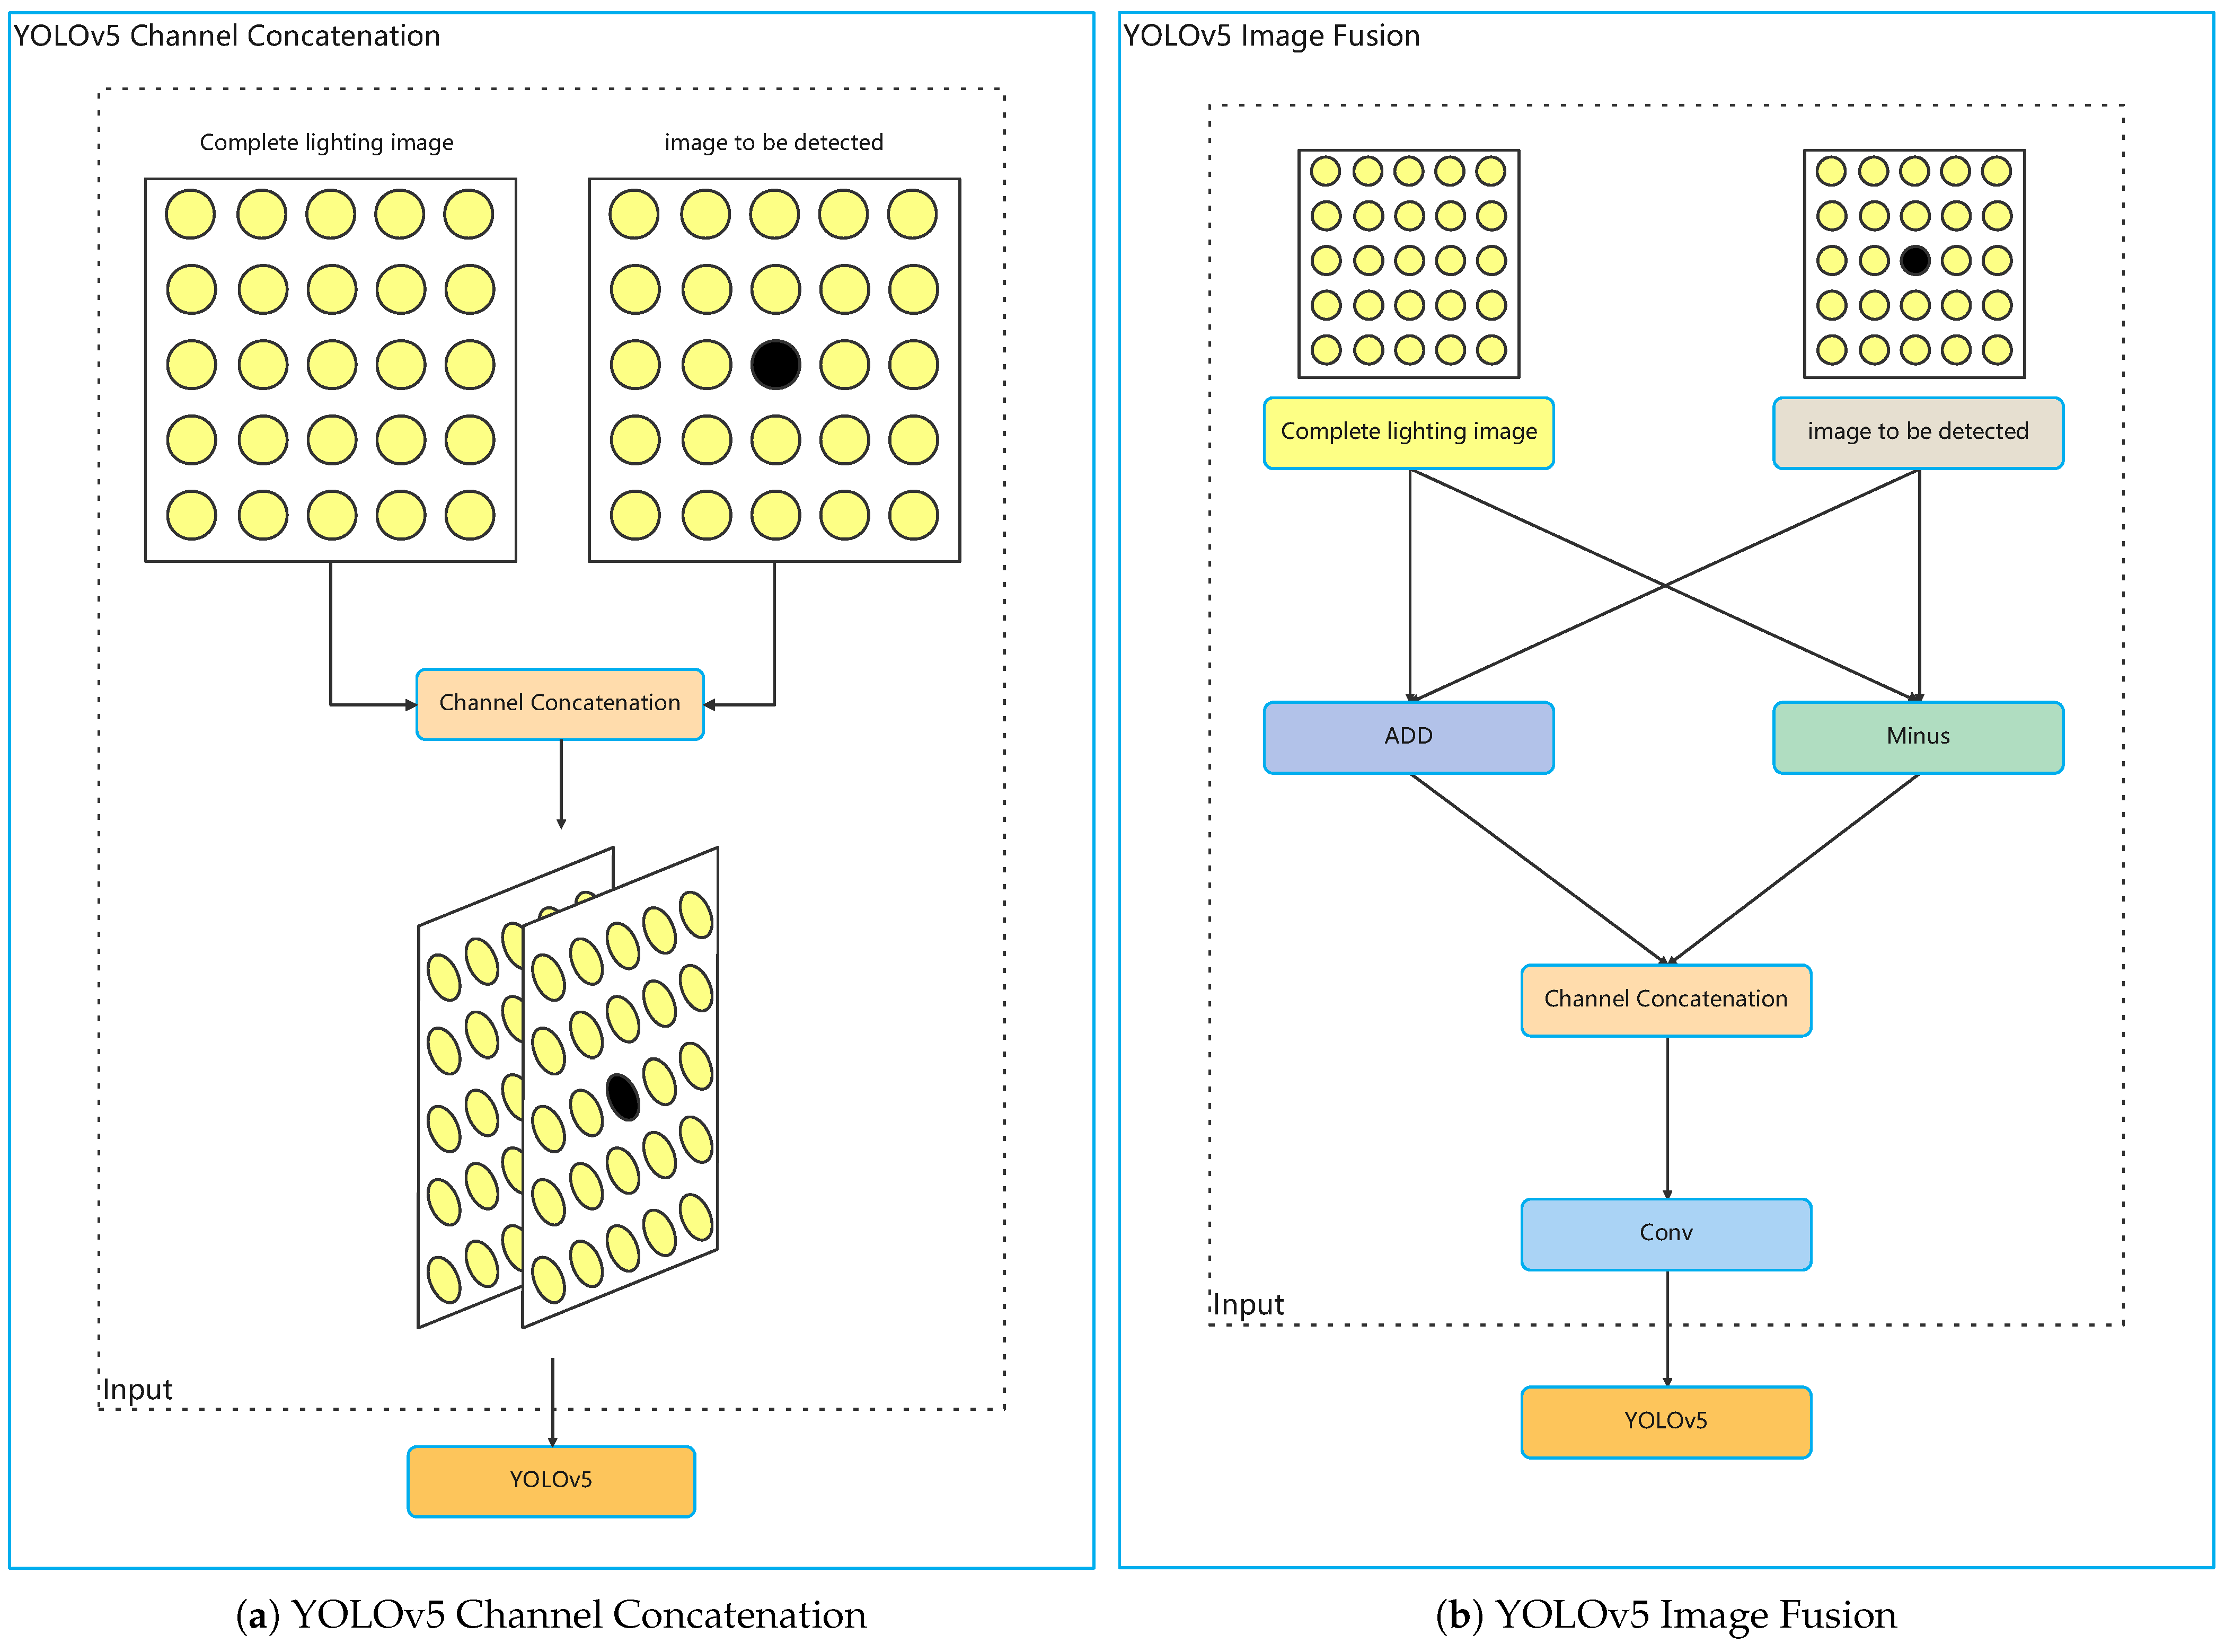
2.1.2. YOLOv5 Channel Concatenation

Due to the particularity of the problem of night lighting fault detection, it is considered to add prior knowledge to the algorithm, that is, the image features when the lighting is complete. Therefore, an improved algorithm for YOLOv5 is proposed: YOLOv5 Channel Concatenation. As shown in Figure 2a, the idea is simple: concatenate the complete lighting image and the image to be detected along the channel dimension directly, and then put the concatenated image as the Input into the YOLOv5 model. It should be noted that the channel dimension of the current Input is 6, so corresponding modifications also need to be made in the YOLOv5 program. Through Channel Concatenation, the prior complete lighting image information is entered into the model to guide the prediction of the image to be detected.
After testing, the YOLOv5 Channel Concatenation model can utilize complete lighting information to guide the model’s detection of untrained lighting scenes. However, the effectiveness of the utilization is not ideal, and there is a significant gap between the training and test scenes. Therefore, it is necessary to furhter study how to integrate the complete lighting information.

2.1.3. YOLOv5 Image Fusion

To better integrate the information of the image to be detected and the complete lighting image, the YOLOv5 Image Fusion model has been developed, and the structure can be seen in Figure 2b. The model first performs the add and minus operations on the corresponding channels of the complete lighting image and the image to be detected. The purpose of the minus operation is to extract the differences between these two images. In order to avoid the excessive loss of image information caused by the minus operation, the add operation is used to enhance and compensate for the information in the image. Then, the added and minus feature maps are concatenated along the channel dimension, and the convolution operation is used for image information fusion. Finally, the fused feature maps are input into the YOLOv5 network. The Image Fusion operation can be expressed as
O u t p u t = C o n v ( C o n c a t ( ( X d + X c ) , ( X d X c ) , a x i s = c h a n n e l ) )
where X d and X c , respectively, represent the image to be detected and the complete lighting image.
Through the YOLOv5 Image Fusion model, theoretically, the unique inverse problem of lighting fault detection can be solved, allowing the features of the complete lighting image and the image to be detected to be fully fused and utilizing the information of the complete image to better guide the prediction of the image to be detected.

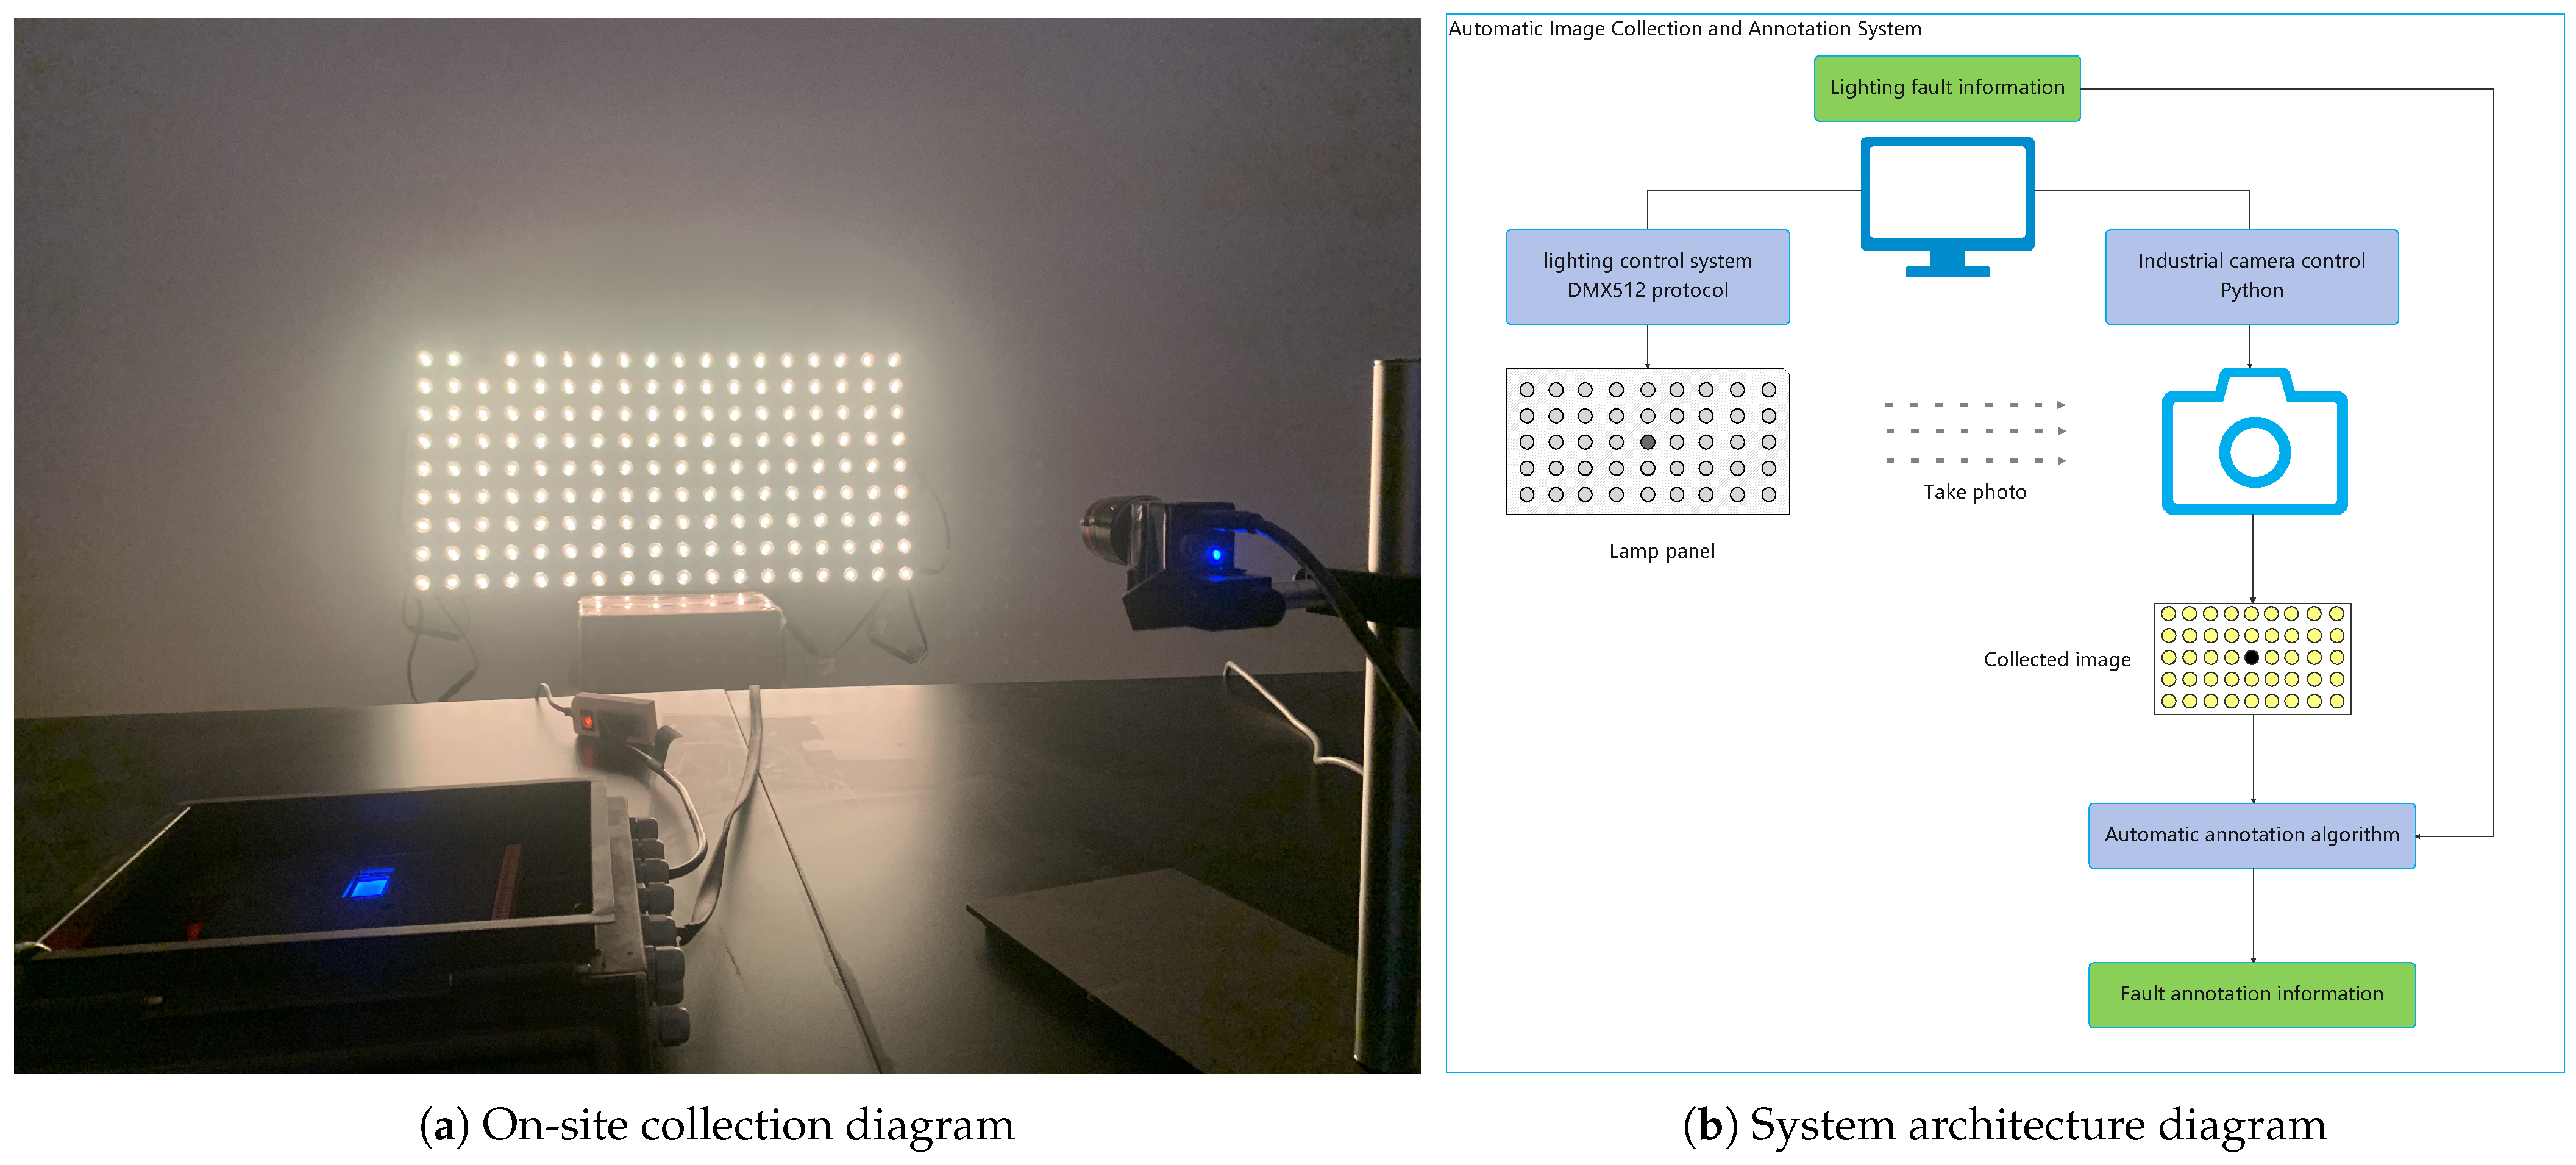
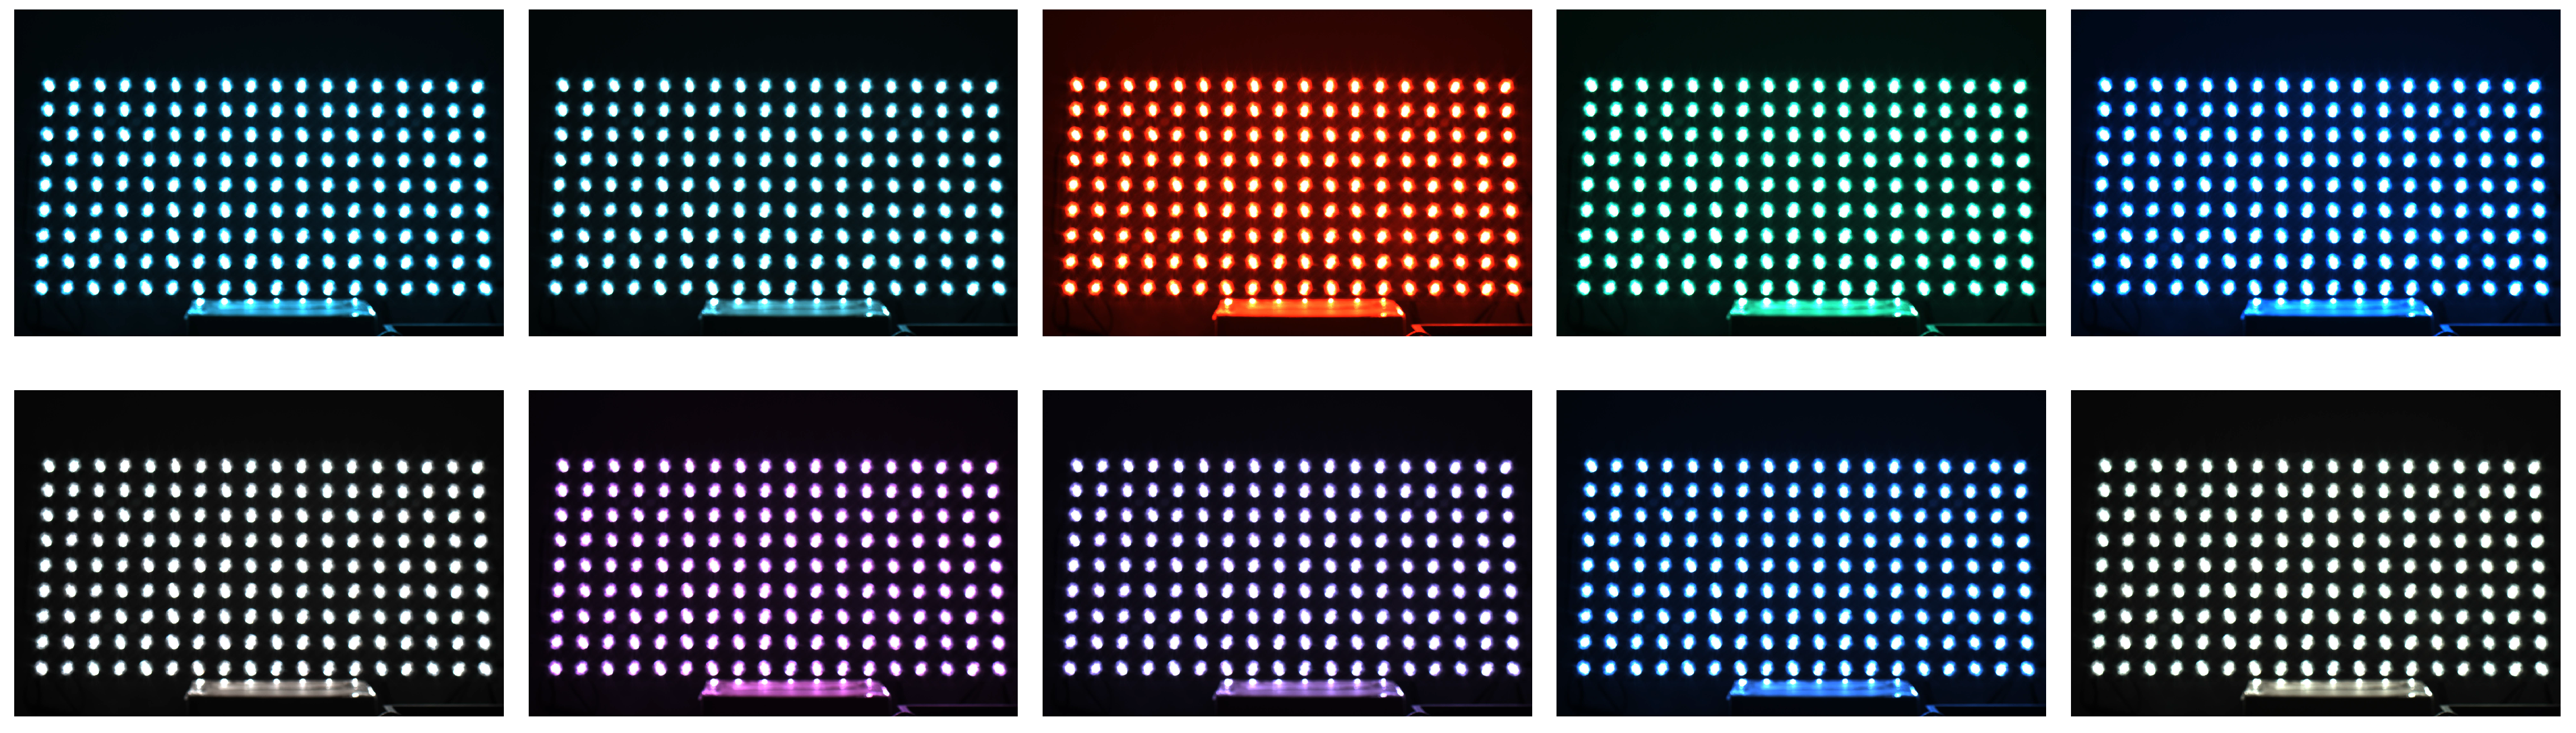
2.2. Automatic Image Collection and Annotation System

In order to test the effectiveness of algorithms in night lighting fault detection, an automatic image collection and annotation system (AICAS) has been developed, and the on-site collection and system architecture diagrams are shown in Figure 3.
Figure 3a is the on-site collection of the experiment, mainly showing the lamp panel, industrial camera, and lighting controller used in the experiment, and there is a simulated fault light point position in the first-row third column of the lamp panel. Figure 3b shows the AICAS architecture, which mainly consists of an automatic image collection system and an automatic image annotation system.
The automatic image collection system follows the following steps:
  • Step 1: The system automatically and randomly generates lighting fault information: the area where the fault occurred.
  • Step 2: Based on the lighting fault information, the lighting control system generates actual lighting information, which is output to the lamp panel through the DMX512 protocol. The lamp panel lights up according to the information.
  • Step 3: Images are collected and the fault information is saved.
  • Step 4: Steps 1 to 3 are repeated until enough images are collected.
Three of the collected images are shown in Figure 4 through the automatic image collection system.
Based on the collected fault images, the automatic annotation of the images can be achieved using fault information, and the diagram of the automatic image annotation algorithm process and the corresponding visualization of actual operations can be seen in Figure 5. For a collected image, as shown in the process: first, grayscale and binary processing is performed; second, the bright spots on the edges are matched with the coordinates of the edge points to obtain the entire area where the lights are located; then, the entire area is gridded to obtain the area where each light point is located; finally, using lighting fault information, the area where the fault occurred can be obtained, thus achieving automated fault annotation.

3. Experiment Configurations and Results

In order to test the effectiveness of different models in lighting fault detection, this section will introduce a series of experiments we conducted based on previous research, including detailed experimental configurations and results.

3.1. Experiment Configurations

The experiment mainly consists of dataset collection and model training and testing.
In the part of the dataset collection, we have constructed 6 complete lighting device layouts, as shown in Figure 6, each with 10 colors, as shown in Figure 7, resulting in 60 complete lighting images. Using the AICAS, we collected a total of 500 images from Layout 1 to Layout 5 as the training set, with 100 lighting fault images collected for each layout; 120 images from Layout 1 to Layout 6 as the validation set, with 20 lighting fault images collected for each layout; 120 images from Layout 1 to Layout 6 as the test set, with 20 lighting fault images collected for each layout. Three lighting fault images can also be referred to in Figure 4. The camera used in the experiment is a HIKVISION industrial camera, and the product model number is MV-CE060-10UC, which has a resolution of 3072 × 2048.
In the part of model training and testing, the training set is used to train the model, the validation set is used to select the model parameters with the best training performance, and the test set is used to test the model’s generalization ability. When selecting the epoch with the best training performance, the evaluation criterion is
Fitness = 0.1 × mAP @ 0.5 + 0.9 × mAP @ 0.5 : 0.95
where the weight values of 0.1 and 0.9 are a comprehensive indicator of [email protected] and [email protected]:0.95, which are from the original YOLO setup, and we will continue to use them here. mAP is the mean average precision over all the classes, which equals
mAP = i = 1 N AP ( i ) N
where N is the number of classes, which is equal to 1 in this study because there is only one classification for lighting faults. AP is the area under the P-R curve and can be obtained from equations
AP = 0 1 P ( R ) dR , P = TP TP + FP , R = TP TP + FN
where P is the precision, R is the recall, TP represents the positive samples correctly predicted by the model, FP represents the positive samples incorrectly predicted by the model, and FN represents the negative samples incorrectly predicted by the model. These values are the function of the IoU threshold and confidence threshold, so different P values correspond to R values, which can form a function P(R). [email protected] is mAP at the IoU threshold of 0.5, while [email protected]:0.95 is the average mAP at different IoU thresholds, equidistant from 0.5 to 0.95, where the Intersection over Union (IoU) is commonly used in target detection to measure the degree of overlap between the prediction box and the ground truth box. The loss function required for model training remains unchanged, mainly including three parts of loss: Bounding Box Regression Loss (box_loss), Classification Loss (cls_loss), and Objectivity Loss (obj_loss), which are consistent with the original YOLOv5 model [26].
It should be noted that during the training process, as long as the image to be detected belongs to the same layout as the complete lighting image and the colors are not matched, i.e., the complete images of 10 colors are randomly used. The purpose of doing this is to make the model more versatile, as long as the lights are on, without adding more color requirements.
In the experiment, the main hardware configuration includes Intel Core i7-11700k CPU and RTX 2060 GPU, and the operating system is Windows 10. The model training and testing environment is PyTorch v1.10.0 and Cuda v10.2, and the main hyperparameter settings are shown in Table 1. All training and validation are completed under these configurations.

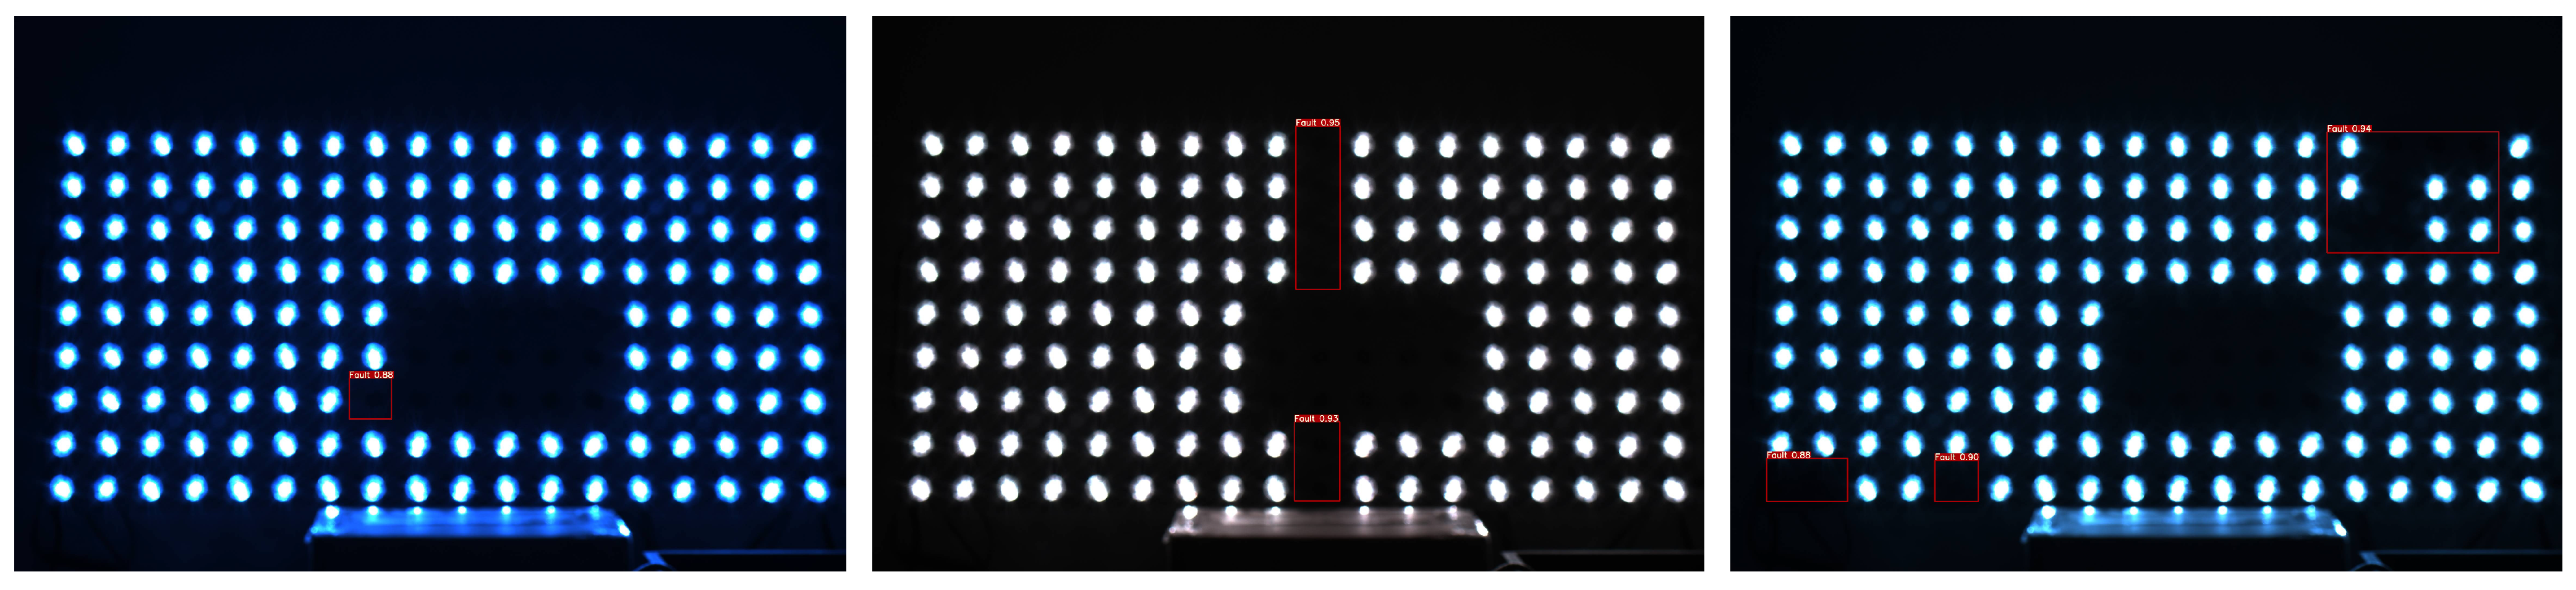
3.2. Experiment Results

Based on the training set of 500 images and the validation set of 120 images introduced above, three models were trained: the original YOLOv5, YOLOv5 Channel Concatenation, and YOLOv5 Image Fusion. The training process is shown in Figure 8, which illustrates the changes in the three loss functions on the training and validation sets, as well as the changes in [email protected], [email protected]:0.95, and Fitness on the validation set during the training process.
As can be seen, the box_loss and obj_loss of the training and validation sets have continuously decreased, while the mAP and Fitness values of the validation set have been increasing. After 200 epochs, the degree of change is very small. Due to the single classification training, the cls_loss remains at 0. Therefore, the training of the three models is effective.
During the training process, the model will retain the set of parameters with the highest Fitness value as the best model parameters, which can be used to test the model’s performance on the test set of 120 images. The test results of three models, the original YOLOv5, YOLOv5 Channel Concatenation, and YOLOv5 Image Fusion, are shown in Table 2.
In Table 2, a total of three sets of results are presented. The first set of results shows the performance of three models on the entire test set. The second set of results shows the performance on the Layout 1–5 dataset, which has the same distribution as the training set. The third set of results shows the performance on the Layout 6 dataset, which has not appeared in the training set before. Therefore, the third set of results can reflect the models’ generalization ability and truly demonstrate its effectiveness.
When comparing the results of the three models, it can be found that when only testing the performance of the three models on Layout 1–5, that is, when the model has seen the Layout during training, the performance of the three models is basically the same. This phenomenon is very reasonable because all models have learned the features of the training data. However, the difference is reflected when testing the performance on Layout 6. The representation of the original YOLOv5 is indigent, making it difficult to detect the faults. As analyzed earlier, in principle, the original YOLOv5 model cannot distinguish whether it is a lighting fault or whether there is no lighting at all, while the other two models that combine complete lighting image information perform better, with differences in various results compared to Layout 1–5 significantly reduced. When comparing the performance on all test data, the performance gap between the three models decreases. This phenomenon is because the Layout 6 data only account for a small part, so the performance is not so obvious, and this cannot reflect the true ability of the models, because in actual projects, what is needed is that the models need to be able to work on unseen layouts.
Comparing the two developed YOLOv5 models, it can be found that compared with the Channel Concatenation model, the structural design of the Image Fusion model makes it have a better information fusion ability, better mAP performance, and a significantly reduced performance gap with the training set, indicating that the model has truly learned the ability to detect and compare with complete lighting images.
On an unprecedented Layout, the Image Fusion model achieves an mAP of 0.984 at the IoU threshold of 0.5 and an average mAP of 0.803 at the 0.5–0.95 threshold. This result indicates that the model has a sufficient detection capability, and actual predictions also show this. Figure 9 shows the prediction results for the three images belonging to the Layout 6 type. It can be seen that the model successfully and accurately predicted the occurrence and area of lighting faults.

4. Conclusions

In this study, the primary research focuses on using machine vision technology for night lighting fault detection. The entire research process can be divided into two parts: using an automatic image collection and annotation system to collect image datasets and completing algorithm training and performance evaluation based on the collected dataset. In the dataset collection section, 740 images were collected, including 500 training sets, 120 validation sets, and 120 test sets, all annotated automatically through algorithms. In terms of algorithms, two models for data fusion have been developed based on the YOLOv5 model, YOLOv5 Channel Concatenation, and YOLOv5 Image Fusion, targeting the characteristics of night lighting fault detection. The main results of these three models can be concluded in Table 3.
After comparing and analyzing the main results of the original YOLOv5 model and the developed models, it was found that the information of the complete lighting image is crucial for detecting lighting faults. The developed models, especially the Image Fusion model, can effectively detect lighting faults using complete lighting information, with a mAP value of 0.984.
This study is applicable to the fault detection of urban-level landscapes or night lighting. The occurrence of lamp faults can be detected by simply using a camera without the need to modify the original circuit. However, due to its non-contact nature, this study can only detect the occurrence of faults and cannot confirm the cause.
This study is beneficial for improving the intelligence level of urban night lighting, which can effectively save labor costs, improve fault detection accuracy, and shorten the time for fault detection. Of course, this study has only been completed in the laboratory, and its implementation and application in specific projects are still ongoing. We hope to quickly promote the practical implementation of the algorithm and demonstrateits application value in urban night lighting.

Author Contributions

Conceptualization, C.D. and S.L.; methodology, W.Z. and R.G.; software, F.Z.; validation, F.Z.; formal analysis, S.L. and R.G.; investigation, F.Z.; resources, C.D.; data curation, C.D.; writing—original draft preparation, F.Z.; writing—review and editing, S.L. and R.G.; visualization, C.D. and W.Z.; supervision, C.D.; project administration, C.D.; funding acquisition, F.Z. All authors have read and agreed to the published version of the manuscript.

Funding

This research was supported by the Beijing Postdoctoral Research Foundation (2023-ZZ-102).

Data Availability Statement

The original contributions presented in the study are included in the article. Further inquiries can be directed to the corresponding author.

Conflicts of Interest

Authors Feng Zhang, Congqi Dai, and Shu Liu were employed by the company HES Technology Group Co., Ltd. The remaining authors declare that the research was conducted in the absence of any commercial or financial relationships that could be construed as a potential conflict of interest.

References

  1. Rankel, S. Future lighting and the appearance of cities at night: A case study. Urbani Izziv 2014, 25, 126–141. [Google Scholar] [CrossRef]
  2. Arora, A.; Goel, V. Real Time Fault Analysis and Acknowledgement System for LED String. In Proceedings of the 2018 International Conference on Computing, Power and Communication Technologies (GUCON), Greater Noida, India, 28–29 September 2018; pp. 457–461. [Google Scholar] [CrossRef]
  3. von Staudt, H.M.; Elnawawy, L.T.; Wang, S.; Ping, L.; Choi, J.W. Probeless DfT Scheme for Testing 20k I/Os of an Automotive Micro-LED Headlamp Driver IC. In Proceedings of the 2022 IEEE International Test Conference (ITC), Anaheim, CA, USA, 23–30 September 2022; pp. 365–371. [Google Scholar] [CrossRef]
  4. Martínez-Pérez, J.R.; Carvajal, M.A.; Santaella, J.J.; López-Ruiz, N.; Escobedo, P.; Martínez-Olmos, A. Advanced Detection of Failed LEDs in a Short Circuit for Automotive Lighting Applications. Sensors 2024, 24, 2802. [Google Scholar] [CrossRef] [PubMed]
  5. Marzuki, M.Z.A.; Ahmad, A.; Buyamin, S.; Abas, K.H.; Said, S.H.M. Fault monitoring system for traffic light. J. Teknol. 2015, 73, 59–64. [Google Scholar] [CrossRef]
  6. Nanduri, A.K.; Kotamraju, S.K.; Sravanthi, G.; Sadhu, R.B.; Kumar, K.P. IoT based Automatic Damaged Street Light Fault Detection Management System. Int. J. Adv. Comput. Sci. Appl. 2020, 11, 110853. [Google Scholar] [CrossRef]
  7. Patel, K.K.; Kar, A.; Jha, S.; Khan, M. Machine vision system: A tool for quality inspection of food and agricultural products. J. Food Sci. Technol. 2012, 49, 123–141. [Google Scholar] [CrossRef]
  8. Ren, Z.; Fang, F.; Yan, N.; Wu, Y. State of the art in defect detection based on machine vision. Int. J. Precis. Eng. Manuf.-Green Technol. 2022, 9, 661–691. [Google Scholar] [CrossRef]
  9. Intelligent Defect Inspection Powered by Computer Vision and Deep Learning. 2022. Available online: https://www.infopulse.com/blog/intelligent-defect-inspection-powered-by-computer-vision-and-deep-learning/ (accessed on 30 August 2024).
  10. Ameliasari, M.; Putrada, A.G.; Pahlevi, R.R. An evaluation of svm in hand gesture detection using imu-based smartwatches for smart lighting control. J. Infotel 2021, 13, 47–53. [Google Scholar] [CrossRef]
  11. Manakitsa, N.; Maraslidis, G.S.; Moysis, L.; Fragulis, G.F. A Review of Machine Learning and Deep Learning for Object Detection, Semantic Segmentation, and Human Action Recognition in Machine and Robotic Vision. Technologies 2024, 12, 15. [Google Scholar] [CrossRef]
  12. Voulodimos, A.; Doulamis, N.; Doulamis, A.; Protopapadakis, E. Deep learning for computer vision: A brief review. Comput. Intell. Neurosci. 2018, 2018, 7068349. [Google Scholar] [CrossRef]
  13. Feng, X.; Jiang, Y.; Yang, X.; Du, M.; Li, X. Computer vision algorithms and hardware implementations: A survey. Integration 2019, 69, 309–320. [Google Scholar] [CrossRef]
  14. Zhao, Z.Q.; Zheng, P.; Xu, S.T.; Wu, X. Object Detection With Deep Learning: A Review. IEEE Trans. Neural Networks Learn. Syst. 2019, 30, 3212–3232. [Google Scholar] [CrossRef] [PubMed]
  15. Soleimanitaleb, Z.; Keyvanrad, M.A.; Jafari, A. Object Tracking Methods:A Review. In Proceedings of the 2019 9th International Conference on Computer and Knowledge Engineering (ICCKE), Mashhad, Iran, 24–25 October 2019; pp. 282–288. [Google Scholar] [CrossRef]
  16. Hao, S.; Zhou, Y.; Guo, Y. A Brief Survey on Semantic Segmentation with Deep Learning. Neurocomputing 2020, 406, 302–321. [Google Scholar] [CrossRef]
  17. He, K.; Zhang, X.; Ren, S.; Sun, J. Spatial pyramid pooling in deep convolutional networks for visual recognition. IEEE Trans. Pattern Anal. Mach. Intell. 2015, 37, 1904–1916. [Google Scholar] [CrossRef] [PubMed]
  18. Girshick, R.; Donahue, J.; Darrell, T.; Malik, J. Rich Feature Hierarchies for Accurate Object Detection and Semantic Segmentation. In Proceedings of the IEEE Conference on Computer Vision and Pattern Recognition (CVPR), Columbus, OH, USA, 23–28 June 2014. [Google Scholar]
  19. Girshick, R. Fast r-cnn. In Proceedings of the IEEE International Conference on Computer Vision, Santiago, Chile, 7–13 December 2015; pp. 1440–1448. [Google Scholar]
  20. Ren, S.; He, K.; Girshick, R.; Sun, J. Faster r-cnn: Towards real-time object detection with region proposal networks. Adv. Neural Inf. Process. Syst. 2015, 28, 91–99. [Google Scholar] [CrossRef] [PubMed]
  21. Liu, W.; Anguelov, D.; Erhan, D.; Szegedy, C.; Reed, S.; Fu, C.Y.; Berg, A.C. Ssd: Single shot multibox detector. In Proceedings of the Computer Vision–ECCV 2016: 14th European Conference, Amsterdam, The Netherlands, 11–14 October 2016; Proceedings Part I 14. Springer: Berlin/Heidelberg, Germany, 2016; pp. 21–37. [Google Scholar]
  22. Redmon, J.; Divvala, S.; Girshick, R.; Farhadi, A. You Only Look Once: Unified, Real-Time Object Detection. In Proceedings of the IEEE Conference on Computer Vision and Pattern Recognition (CVPR), Las Vegas, NV, USA, 27–30 June 2016. [Google Scholar]
  23. Redmon, J.; Farhadi, A. YOLO9000: Better, Faster, Stronger. In Proceedings of the IEEE Conference on Computer Vision and Pattern Recognition (CVPR), Honolulu, HI, USA, 21–26 July 2017. [Google Scholar]
  24. Redmon, J.; Farhadi, A. Yolov3: An incremental improvement. arXiv 2018, arXiv:1804.02767. [Google Scholar]
  25. Bochkovskiy, A.; Wang, C.Y.; Liao, H.Y.M. Yolov4: Optimal speed and accuracy of object detection. arXiv 2020, arXiv:2004.10934. [Google Scholar]
  26. Jocher, G. YOLOv5 by Ultralytics; Zenodo: Geneva, Switzerland, 2022. [Google Scholar] [CrossRef]
  27. Li, C.; Li, L.; Jiang, H.; Weng, K.; Geng, Y.; Li, L.; Ke, Z.; Li, Q.; Cheng, M.; Nie, W.; et al. YOLOv6: A single-stage object detection framework for industrial applications. arXiv 2022, arXiv:2209.02976. [Google Scholar]
  28. Wang, C.Y.; Bochkovskiy, A.; Liao, H.Y.M. YOLOv7: Trainable Bag-of-Freebies Sets New State-of-the-Art for Real-Time Object Detectors. In Proceedings of the IEEE/CVF Conference on Computer Vision and Pattern Recognition (CVPR), Vancouver, BC, Canada, 17–24 June 2023; pp. 7464–7475. [Google Scholar]
  29. Terven, J.; Córdova-Esparza, D.M.; Romero-González, J.A. A comprehensive review of yolo architectures in computer vision: From yolov1 to yolov8 and yolo-nas. Mach. Learn. Knowl. Extr. 2023, 5, 1680–1716. [Google Scholar] [CrossRef]
  30. Mahaur, B.; Mishra, K.K. Small-object detection based on YOLOv5 in autonomous driving systems. Pattern Recognit. Lett. 2023, 168, 115–122. [Google Scholar] [CrossRef]
  31. Li, Z.; Tian, X.; Liu, X.; Liu, Y.; Shi, X. A Two-Stage Industrial Defect Detection Framework Based on Improved-YOLOv5 and Optimized-Inception-ResnetV2 Models. Appl. Sci. 2022, 12, 834. [Google Scholar] [CrossRef]
  32. Xue, Z.; Lin, H.; Wang, F. A Small Target Forest Fire Detection Model Based on YOLOv5 Improvement. Forests 2022, 13, 1332. [Google Scholar] [CrossRef]
  33. Guo, G.; Zhang, Z. Road damage detection algorithm for improved YOLOv5. Sci. Rep. 2022, 12, 15523. [Google Scholar] [CrossRef] [PubMed]
  34. Lei, F.; Tang, F.; Li, S. Underwater Target Detection Algorithm Based on Improved YOLOv5. J. Mar. Sci. Eng. 2022, 10, 310. [Google Scholar] [CrossRef]
  35. Hanif, M.Z.; Saputra, W.A.; Choo, Y.H.; Yunus, A.P. Rupiah Banknotes Detection Comparison of The Faster R-CNN Algorithm and YOLOv5. J. Infotel 2024, 16, 502–517. [Google Scholar]
  36. Zheng, Z.; Wang, P.; Liu, W.; Li, J.; Ye, R.; Ren, D. Distance-IoU loss: Faster and better learning for bounding box regression. In Proceedings of the AAAI Conference on Artificial Intelligence, New York, NY, USA, 7–12 February 2020; Volume 34, pp. 12993–13000. [Google Scholar]
  37. Available online: https://github.com/ultralytics/yolov3/issues/898 (accessed on 30 August 2024).
Figure 1. The network structure of YOLOv5, with the main structure on the left, some detailed structures on the right, and the overall processing flow on the lower side.
Buildings 14 03051 g001
Figure 2. The structures of the YOLOv5 Channel Concatenation and Image Fusion model.
Buildings 14 03051 g002
Figure 3. The on- site collection and system architecture diagrams of the Automatic Image Collection and Annotation System.
Buildings 14 03051 g003
Figure 4. Three of the images collected by the automatic image collection system.
Buildings 14 03051 g004
Figure 5. Automatic image annotation algorithm process and corresponding visualization of actual operations.
Buildings 14 03051 g005
Figure 6. Six complete lighting device layouts constructed in the experiment.
Buildings 14 03051 g006
Figure 7. Ten colors constructed in the experiment.
Buildings 14 03051 g007
Figure 8. The training process of these models: the original YOLOv5 (red line), YOLOv5 Channel Concatenation (green line), and YOLOv5 Image Fusion (blue line), including the changes in the three loss functions on the training and validation sets, as well as the changes in [email protected], [email protected]:0.95, and Fitness on the validation set.
Buildings 14 03051 g008
Figure 9. The prediction results of the YOLOv5 Image Fusion model for the three images belonging to the Layout 6 type.
Buildings 14 03051 g009
Table 1. The main hyperparameters in the model’s training and testing.
HyperparameterValueHyperparameterValue
Training epochs200Batch size16
Input image resolution640 × 640OptimizerSGD
Optimizer momentum0.973Optimizer weight decay0.0005
Initial learning rate0.01Final learning rate0.002
Single classTrueWarmup epochs3
Warmup initial momentum0.8Warmup initial bias learning rate0.1
Table 2. The test results of three models: the original YOLOv5, YOLOv5 Channel Concatenation, and YOLOv5 Image Fusion on the test set, where @ Layout 1–6 represents the results on all datasets, @ Layout 1–5 represents the results on the dataset composed of Layout 1–5, and @ Layout 6 represents the results on the dataset composed of Layout 6. The best mAP values in each scenario are highlighted in bold. TP, FP, FN, P, and R are the values at the IOU threshold of 0.5 and the confidence threshold of 0.1 [37].
Model NameTPFPFNPR[email protected][email protected]:0.95
Original YOLOv5 @ Layout 1–61463970.7890.9540.9370.856
YOLOv5 Channel Concatenation @ Layout 1–61502730.8470.9800.9810.854
YOLOv5 Image Fusion @ Layout 1–61502730.8470.9800.9850.865
Original YOLOv5 @ Layout 1–51211540.8900.9680.9690.902
YOLOv5 Channel Concatenation @ Layout 1–51232020.8600.9840.9800.871
YOLOv5 Image Fusion @ Layout 1–51221930.8650.9760.9860.891
Original YOLOv5 @ Layout 6252430.5100.8930.6810.576
YOLOv5 Channel Concatenation @ Layout 627710.7940.9640.9630.764
YOLOv5 Image Fusion @ Layout 628900.7571.0000.9840.803
Table 3. The main results of three models: the original YOLOv5, YOLOv5 Channel Concatenation, and YOLOv5 Image Fusion.
Model NamePR[email protected]
Original YOLOv50.5100.8930.681
YOLOv5 Channel Concatenation0.7940.9640.963
YOLOv5 Image Fusion0.7571.0000.984
Disclaimer/Publisher’s Note: The statements, opinions and data contained in all publications are solely those of the individual author(s) and contributor(s) and not of MDPI and/or the editor(s). MDPI and/or the editor(s) disclaim responsibility for any injury to people or property resulting from any ideas, methods, instructions or products referred to in the content.

