Article

Fatigue Life Predictions Using a Novel Adaptive Meshing Technique in Non-Linear Finite Element Analysis

by
M. Thiruvannamalai
*,
P. Vincent @ Venkatesan
and
Maheswaran Chellapandian
Department of Civil Engineering, Mepco Schlenk Engineering College, Sivakasi 626005, India
*
Author to whom correspondence should be addressed.
Buildings 2024, 14(10), 3063; https://doi.org/10.3390/buildings14103063
Submission received: 8 August 2024 / Revised: 22 September 2024 / Accepted: 23 September 2024 / Published: 25 September 2024

Abstract

:
Fatigue is a common issue in steel elements, leading to microstructural fractures and causing failure below the yield point of the material due to cyclic loading. High fatigue loads in steel building structures can cause brittle failure at the joints and supports, potentially leading to partial or total damage. The present study deals with accurate prediction of the fatigue life and stress intensity factor (SIF) of pre-cracked steel beams, which is crucial for ensuring their structural integrity and durability under cyclic loading. A computationally efficient adaptive meshing tool, known as Separative Morphing Adaptive Remeshing Technology (SMART), in ANSYS APDL is employed to create a reliable three-dimensional finite element model (FEM) that simulates fatigue crack growth with a stress ratio of “R = 0”. The objective of this research is to examine the feasibility of using a non-linear FE model with an adaptive meshing technique, SMART, to predict the crack growth, fatigue life, and SIF on pre-cracked steel beams strengthened with FRP. Through a comprehensive parametric analysis, the effects of different types of FRPs (carbon and glass) and fiber orientations (θ = 0° to 90°) on both the SIF and fatigue life are evaluated. The results reveal that the use of longitudinally oriented FRP (θ = 0°) significantly reduces the SIF, resulting in substantial improvements in the fatigue life of up to 15 times with CFRP and 4.5 times with GFRP. The results of this study demonstrate that FRP strengthening significantly extends the fatigue life of pre-cracked steel beams, and the developed FE model is a reliable tool for predicting crack growth, SIF, and fatigue life.

1. Introduction

In steel elements, fatigue is an increasingly common issue that can make the material fail well below its yielding limit. To maintain safety, fatigue-related repairs to steel structures are essential for their continued service until the end of their design life [1]. Pre-eminent levels of fatigue in steel bridges or buildings may result in brittle failure at their joints and supports, which could cause partial or complete damage. Joints, commonly used in large-span spatial structures and high-rise buildings due to their mechanical and construction advantages, are particularly susceptible to fatigue cracks at welds, which can result in structural damage or destruction [2]. Estimating the fatigue life of components or materials that are subjected to cyclic loading is a challenging task [3]. Paris and Erdogan’s fracture mechanics-based approach [4], Wohler’s stress-life method [5], and Coffin’s strain-life method [6] have been used in the past to study the fatigue properties of metals. Stress-life and strain-life approaches are commonly used in fatigue design and the evaluation of new components but are less suitable for assessing fatigue damage in existing components or structures [7]. By performing fatigue crack growth analysis, fracture mechanics-based methods offer an alternative approach to estimating the fatigue life of existing structures by considering the actual crack behavior. Using the fracture mechanics principle, the total fatigue life evaluation is carried out by adding the predicted number of cycles for crack initiation and the number of cycles for the propagation of the crack [8].
Paris’ law provides a reliable modeling approach to analyzing fatigue crack growth (especially in the stable crack growth phase) by relating the crack growth rate to the stress intensity factor range as da dN = C(ΔK)m, where da/dN represents the number of cycles required for a crack to grow by a certain increment, C and m are material-specific constants that characterize the material’s resistance to crack growth, and ΔK is the range of the stress intensity factor at the crack tip [9]. Li et al. [10] proposed a law for predicting fatigue crack growth by incorporating the strength and toughness of high-strength steels, and a quantitative relationship between strength, toughness, and fatigue crack growth rate was established, highlighting that improving both strength and toughness simultaneously enhances fatigue crack growth resistance. This criterion enables the rapid prediction of the optimal fatigue crack growth resistance and offers new insights for material selection and anti-fatigue design of metallic materials. Zhang [11] conducted a series of fatigue crack growth studies on compact tension specimens, and the relation between the magnetic field and fatigue crack growth parameters was observed. A linear relationship between magnetic induction and the stress intensity factor, as well as an exponential relation between the gradient of the rotating magnetic field’s distribution and crack growth, was established. Li et al. [12] developed a new model that captured all stages of crack growth based on the energy distribution. The material constant “m” in Paris’ law derived from the new model showed excellent agreement with the experimental results. The accuracy of this model was successfully validated using various engineering materials, including steel, titanium alloys, and aluminum alloys.
However, the fatigue life of full-scale structural components should not be evaluated solely using deterministic methods, such as S-N curves or local strain curves derived from small-scale experiments [13,14,15]. A probabilistic framework for estimating the safety factors for the fatigue design of steel bridges was introduced, considering realistic modeling of fluctuating loads and fatigue resistance and considering uncertainties. These factors are derived from Eurocode’s Fatigue Load Model 4 and Eurocode’s tri-linear S-N curve but also apply to other traffic and design models [16]. Hu et al. [17] proposed a vehicle–bridge coupled vibration numerical model to analyze the dynamic response of bridges. By applying an S-N curve and Miner’s linear cumulative damage theory, they developed a method for assessing the fatigue life of suspenders in large-span bridge structures. Their study also investigated the impact of environmental corrosion, revealing that corrosion significantly reduces the effective cross-sectional area of the suspenders, leading to increased cyclic stresses under vehicle loads, particularly in bridges with heavy traffic and poor road conditions.
The stress intensity factor (SIF) plays a pivotal role in estimating the value of fatigue crack growth, as it significantly influences the observed crack behavior. Analytical equations for determining the SIF at the crack tip in steel plates are already available in manuals [18,19]. Moreover, equations for predicting the SIF for standard compact tension specimens and three-point/four-point bending specimens were developed by Herrmann [20] based on a stress analysis method. Later, Dunn [21] introduced expressions for steel I-beams where the cracks extend to the level of the web. In addition, an analytical approach to predicting the SIF for cracked steel beams in I-sections was developed. In recent times, the strengthening of structural assets using advanced composites like fiber-reinforced polymers (FRPs) has been extensively studied [22,23,24,25,26,27,28,29,30,31,32,33,34,35] to overcome issues with their load-carrying capacity, corrosion, ductility, etc. Despite there being several examples in the available literature related to FRP strengthening of steel beams under fatigue loading [36,37,38,39,40], research on strengthening of steel structures to delay crack growth, reduce the SIF, and improve their fatigue life is relatively less [41,42,43,44,45]. Colombi and Fava [41] extended optimizing the SIF of conventional members to cracked steel beams reinforced with adhesive-bonded CFRP patches, while Yu and Wu [43] used mechanical anchors to bond CFRP laminates with steel beams. However, the SIF calculated for the CFRP-strengthened beams was found to vary from the values obtained through experiments. This can be attributed to the difference in estimating the tensile stress of FRP by theoretical procedures. In general, the estimation of stress in FRP-strengthened cracked steel beams is complex due to the variability in the different design parameters used. Hence, accurate prediction of the fatigue life of structural components is critical to prevent catastrophic failures and enhance the safety of steel elements. Hosseini [44] utilized pre-stressed CFRP to arrest an existing fatigue crack in a steel beam and investigated the influence of the crack length and the level of pre-stressing required to slow the cracking. Their study found that the influence of the crack length on the crack activation load was negligible, while the pre-stressing level had a significant effect on the load. The notched steel beams were strengthened by Shape Memory Alloy patches, CFRP sheets, and Shape Memory Alloy/CFRP composites and tested with different fatigue load amplitudes. The specimens repaired with SMA/CFRP exhibited the greatest web crack length, indicating that SMA/CFRP strengthening allowed for better utilization of the strength of the notched steel beam.
Several previous studies have used the 3D finite element method (FEM) to predict the SIF and fatigue life of steel elements [46,47,48,49] due to the difficulties in performing full-scale tests. The FEM offers a cost-effective means to model complex geometries and vary the parameters to determine an optimal solution. Despite the presence of various tools, such as the extended finite element method [48,50,51], the Virtual Crack Closure Technique [52], and Cohesive Zone Modeling [53], for numerical modeling of crack growth, the present work utilizes the novel SMART method, which is an automated re-meshing tool adopted in ANSYS Workbench that can predict the SIF and the associated fatigue life. The reason for choosing this tool is its ability to automatically refine the mesh around the crack tip as the crack propagates and avoid singularities during the process. From a thorough review of the literature, it is clear that only a few studies have focused on the effect of pre-cracking on fatigue life estimation for notched steel beams. To be specific, no previous studies have evaluated the enhancement in the fatigue behavior of notched steel beams strengthened using FRP composites. Hence, the present study fills this existing knowledge gap by developing a unique 3D finite element model capable of estimating the fatigue properties of pre-cracked steel beams with and without FRP strengthening. Specifically, the SIF and the associated fatigue life of a three-point bending beam reinforced with orthotropic CFRP and GFRP laminates with different fiber braid angles (i.e., θ ranging from 0° to 90°) will be accurately estimated. The distinct contributions made by the present work include the following:
(a)
Developing a reliable and robust 3D non-linear FE model using SMART re-meshing technology capable of predicting the dynamic stress intensity factor and fatigue life of pre-cracked steel beams.
(b)
Understanding the effect of different design parameters such as the crack growth length and FRP braid angle and type on fatigue life assessment of pre-cracked steel beams through an extensive parametric investigation.
The following section provides a detailed overview of the fatigue crack growth procedure using ANSYS Workbench, followed by validation of the finite element model through comparison with benchmark experimental and theoretical data. The subsequent section deals with detailed discussions of fatigue analysis of unstrengthened beams and the influence of fiber-reinforced polymer composites on enhancements to their fatigue life. The conclusions derived from the current research are provided in the form of design recommendations, which could be crucial to design engineers and researchers understanding the influence of the fiber braid angle or fiber type on the fatigue life of pre-cracked steel beams.

2. Methods

2.1. The Fatigue Crack Growth Procedure

Figure 1 shows the flow of the 3D finite element modeling process for pre-cracked steel beams with an initial crack size “ai”. To create the steel section, 10-node SOLID187 tetrahedral elements are used with an unstructured meshing approach comprising two distinct meshes—one enveloping a sphere around the crack tip and the other covering the remaining model. This strategy aims to refine the mesh specifically around the crack tip, effectively minimizing the computing time and enhancing the overall computational efficiency for 3D finite element (FE) analysis. A local coordinate system at the crack tip, as illustrated in Figure 2, is defined, where the local X-axis precisely denotes the crack growth direction. In general, there are two methods available for fatigue crack growth calculations: (a) incremental crack extension [54] and (b) incremental load cycle extension [55] methods, respectively.
This work incorporates Reimer’s incremental crack extension method [54], which is most suitable for the application of a constant-amplitude fatigue load. In the first step, the number of load cycles is assumed to be zero, followed by extending the crack by a small amount, (Δa), in the predefined direction. For the crack increment obtained, (Δa), the number of load cycles is estimated using the Paris’ law equation. This analysis is continued until the crack extends to a length of 20 mm from the tip of the notch. The accuracy of the developed FE model in estimating fatigue life depends on the fracture parameter, which in this case is the stress intensity factor (SIF). Hence, ANSYS proposes two approaches to numerical analysis of the SIF: (i) the Interaction Integral Method (IIM) and (ii) the Displacement Extrapolation Method (DEM). Due to its easy implementation and better accuracy with fewer meshing requirements, the IIM is frequently used, in which the Mode I SIF is separated from the other Mode SIFs using auxiliary fields.
As per Fageehi [48], the integral (I) related to the different modes of SIF is shown in Equation (1):
I = 2 E ( K I K I a u x + K II K II a u x ) + 1 G ( K III K III a u x )
Here,
  • KI, KII, and KIII are the Mode I, II, and III SIFs, respectively;
  • K I a u x , K II a u x , and K III a u x are the auxiliary Mode I, II, and III SIFs, respectively;
  • E* = E for the plane stress and E ( 1 ν 2 ) for the plane strain;
  • E, G, and ν are the Young’s modulus, shear modulus, and Poisson’s ratio of the material, respectively.
By substituting K I a u x = 1 and K II a u x and K III a u x = 0 in Equation (1), the value of KI can be calculated. Similarly, the values of KII, and KIII are computed separately by setting the respective K i a u x to 1 and the other auxiliary Ki to zero. The extension of the crack, in applying the incremental crack propagation analysis, is limited to the stable crack growth region of a typical fatigue crack curve, as given by Equation (2).
d a d N =   C   ( Δ K ) m
Here,
  • da/dN = the rate of crack growth in mm/cycles;
  • ΔK = the range of the SIF in MPa.mm1/2;
  • “C” and “m” = Paris’ law constants depending on the material characteristics as well as the stress ratio.
The crack growth rate is arrived at from the simulated N-a curves as per the secant method specified in ASTM E647-11e1 [56] as follows:
Let ai, ai+1 be the crack extensions and Ni, Ni+1 be the corresponding fatigue lives during the i-th and (i + 1)-th steps of crack extension. Then, the average crack extension rate for Δa is
d a d N a _ = a i + 1 a i N i + 1 N i ,   where   a _ = 0.5   ( a i + a i + 1 )
Using Equation (2), the SIF range can be calculated as
Δ K = 1 c d a d N a _ 1 / m
Similarly, the range of the stress intensity factor (ΔK) during a crack increment step can be calculated using Equation (5):
ΔK = Kmax − Kmin = (1 − R) Kmax
Kmin and Kmax are the SIF values corresponding to the minimum and maximum loads in a load cycle. Here, the ratio Kmin/Kmax is termed the stress ratio or load ratio, denoted by “R”, and the value of the stress intensity factor becomes Kmax when R = 0. The number of load cycles for each crack increment (Δa) based on Equations (2) and (4) can be calculated using Equation (6):
0 a d a C ( K ) m = 0 N d N = N
Alternatively, for smaller increments in the crack in successive steps, Δa = ai+1 − ai, the associated fatigue life (ΔN) in the above equation can be calculated using a simplified form proposed by Sajith et al. [57], shown in Equation (7):
Δ N   = Δ a C ( Δ K ) m
The same procedure is repeated for the beams strengthened with bonded FRP laminates; however, the effectiveness of FRP strengthening is understood through parametric investigation. The average crack extension rate and the range of the SIF for the FRP-strengthened beams are denoted with the index FRP and are calculated as per Equations (3) and (4), respectively, while their fatigue life is calculated as per Equation (7).

2.2. Validation of the FE Model

SMART is a cutting-edge innovation that complements established crack growth models like the VCCT, CZM, and the XFEM. It significantly reduces the computational time by generating solid tetrahedral elements using the Unstructured Mesh Method (UMM), cutting the computation time from hours down to minutes. The sphere of influence technique refines the mesh around the crack tip, enhancing the reliability and accuracy of the simulation results. The reliability and accuracy of the proposed finite element (FE) model are demonstrated through comparisons of the stress intensity factor (SIF) values and failure modes with the experimental results from Yu and Wu [45], theoretical benchmarking using Dunn et al. [21] equations, and mesh sensitivity analysis comparing the default meshing (5 mm and 1 mm) with SMART’s adaptive meshing. These comparisons confirm the model’s robustness in predicting the crack growth and fatigue life while significantly reducing the computation time.
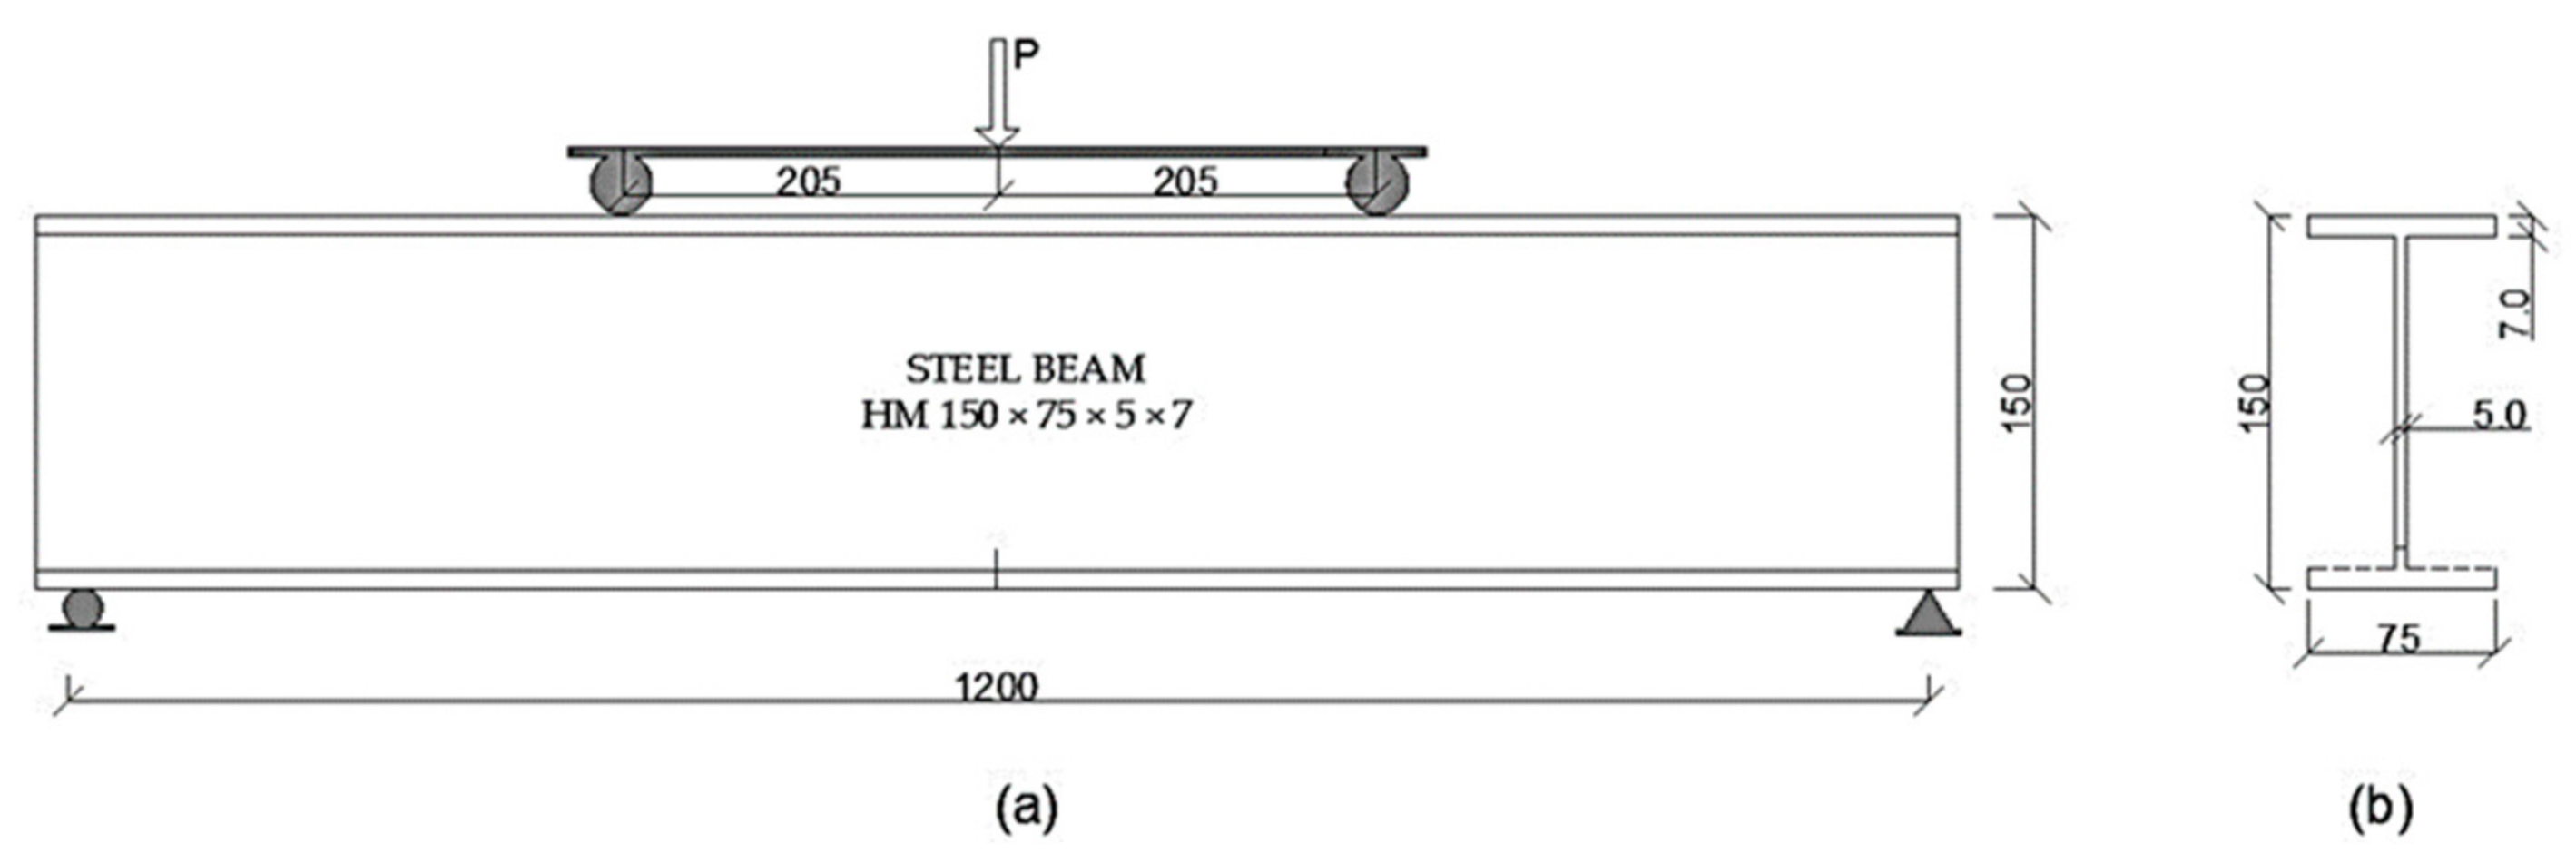
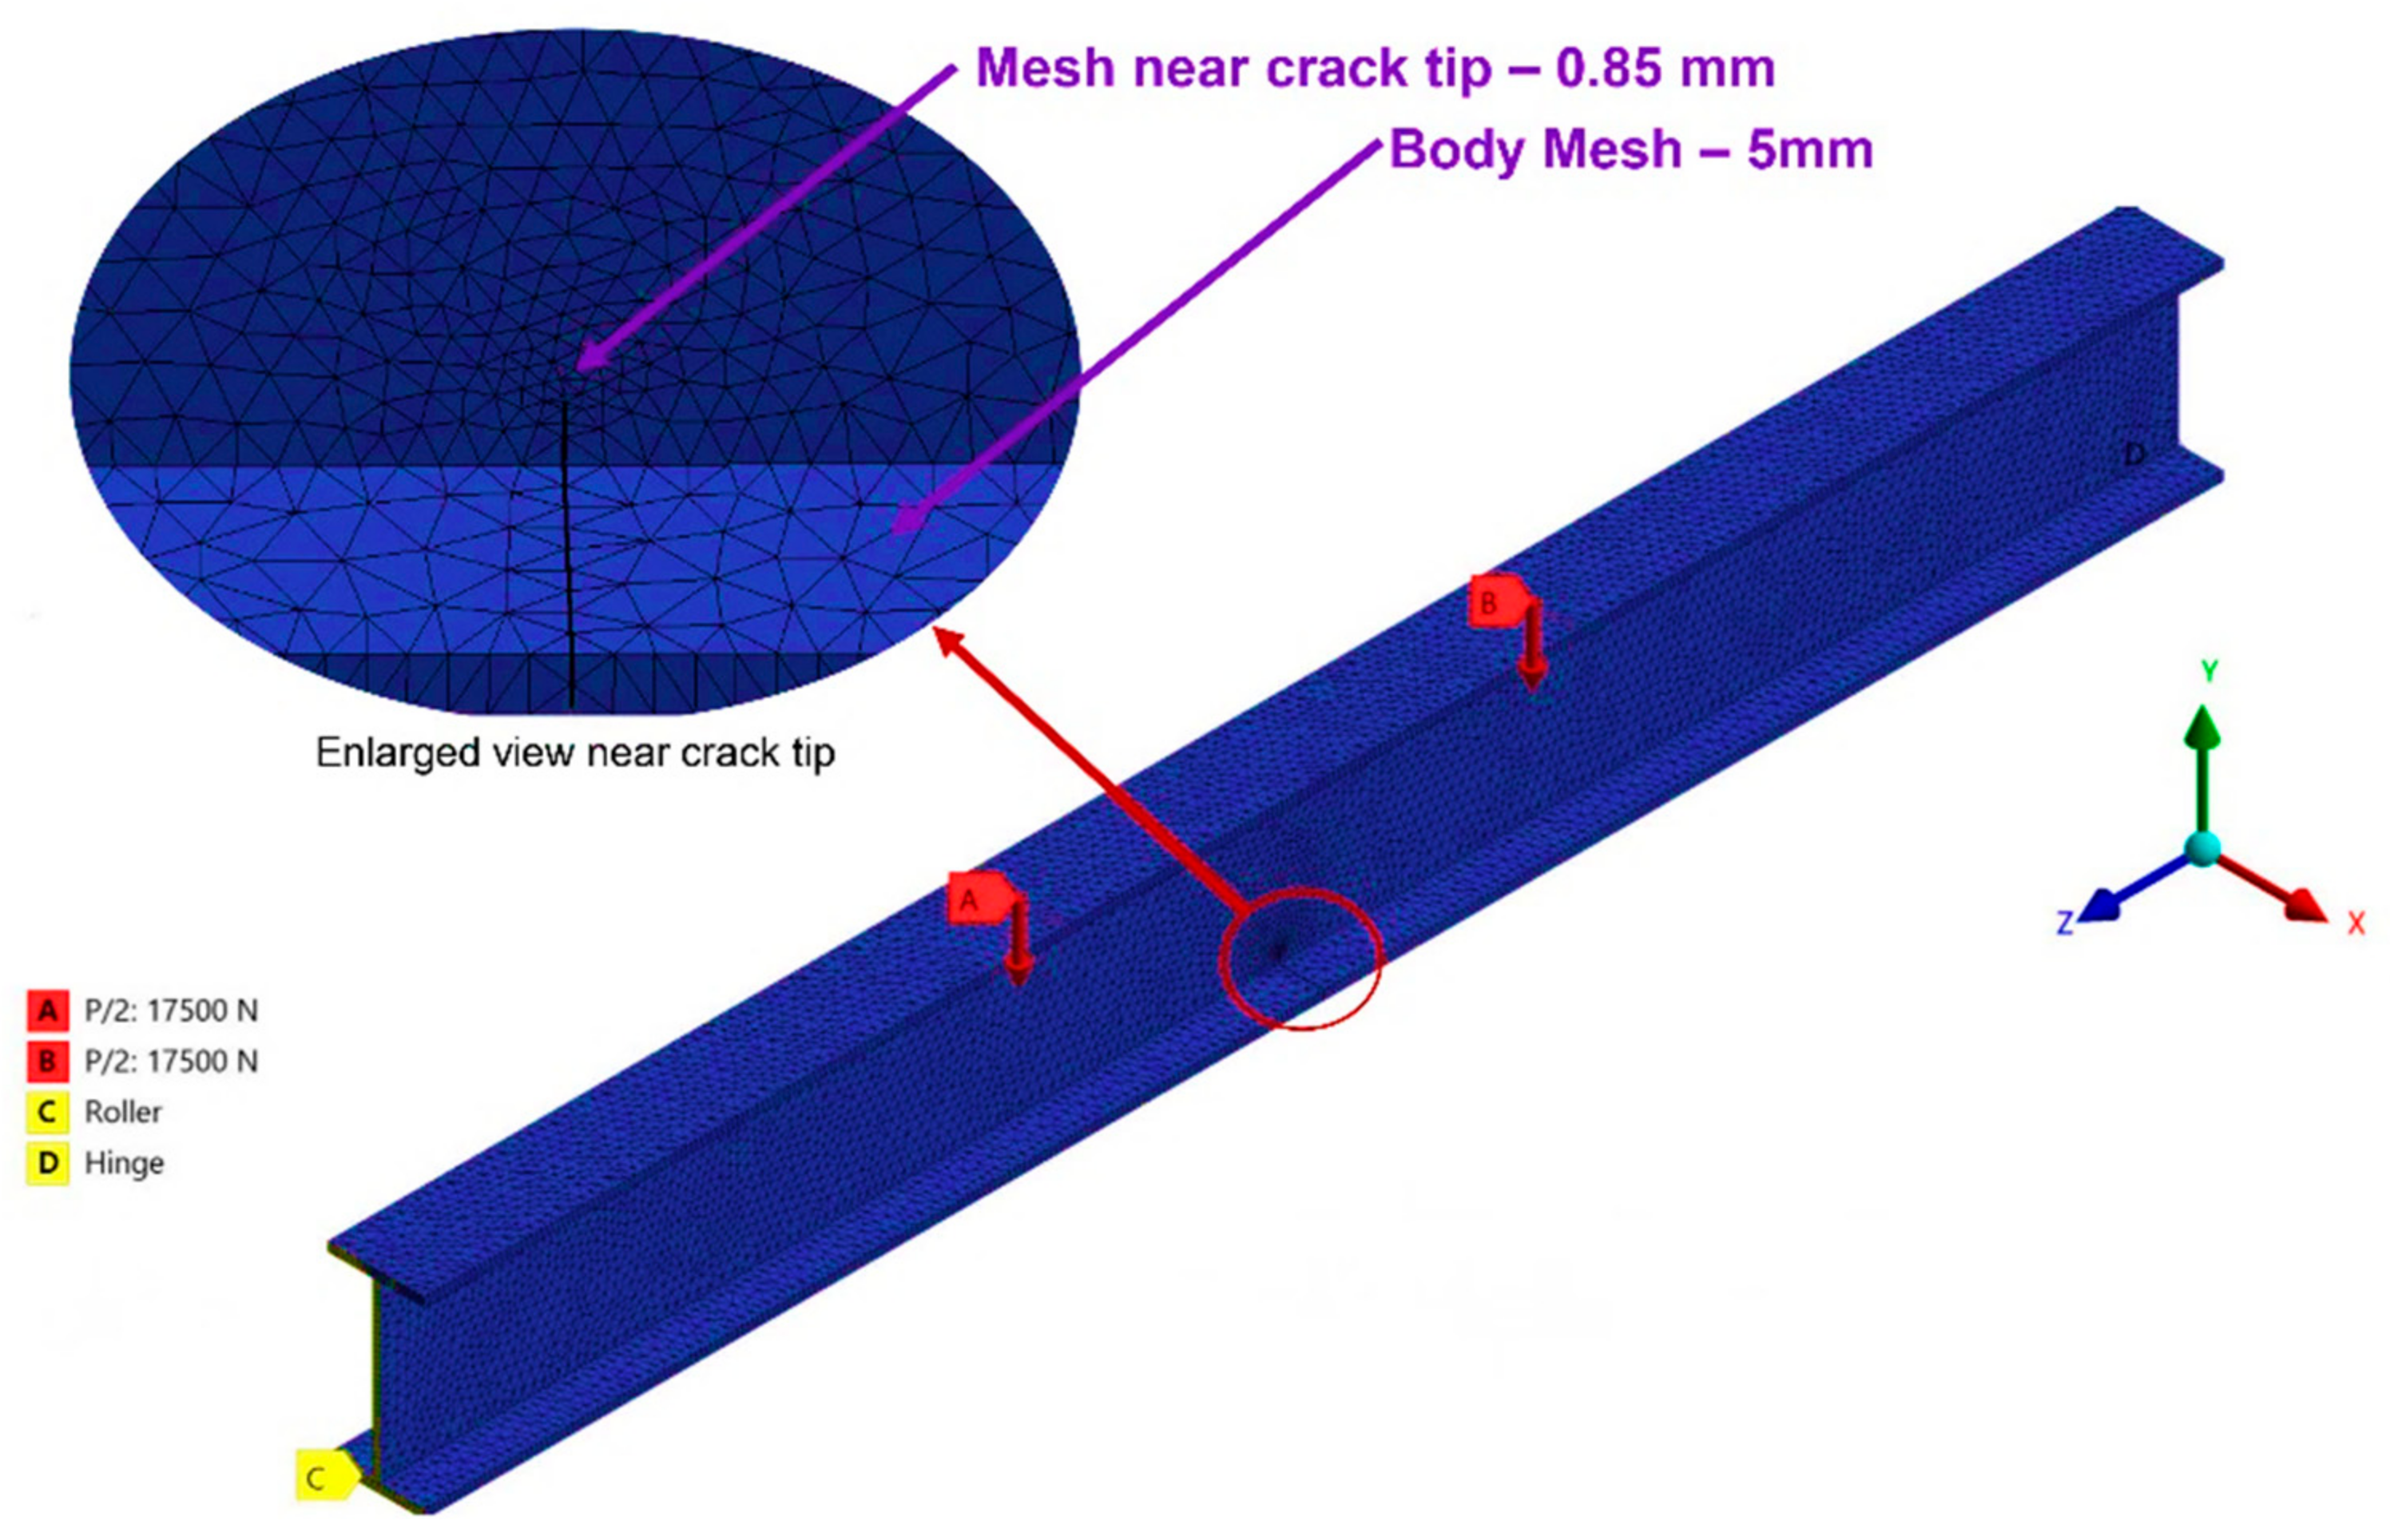
A pre-cracked beam without FRP strengthening (Beam ID: 2) from Yu et al. [37] was analyzed for the comparison with experimental work. The sectional dimensions of the selected beam were 150 mm × 75 mm × 5 mm × 7 mm. Figure 3 shows the dimensions, loading conditions (a typical four-point bending scenario), supports, and details of the notch used in the work by Yu and Wu [45]. The initial crack size was 15 mm, which was 1/10th of the beam’s total depth. The beam was modeled using 10-node tetrahedral (SOLID187) elements, with a mesh size of 0.85 mm around the crack tip and 5 mm in the remaining beam portions, as shown in Figure 4. The material properties used in the FE analysis, as reported by Yu and Wu [45] were as follows: yield strength = 378.2 MPa, tensile strength = 519.0 MPa, Young’s modulus = 192.8 GPa, and Paris’ law parameters “C” and “m” = 3.98 × 10⁻¹³ and 2.88, respectively. A load range of 3.5–35 kN was applied, corresponding to a stress ratio (R) = 0.1. The crack growth analysis was conducted according to the procedure outlined in Figure 1. The analysis predicted the stress intensity factor (SIF) and fatigue life numerically for every 1 mm of crack extension until the crack length reached 75 mm, which was half the beam’s depth.
To further ensure the accuracy of the FE model, the experimental results and the FE predictions were compared with the standard equation for estimating the stress intensity factor. The value of the stress intensity factor can be theoretically estimated, as suggested by Dunn et al. [21], using Equation (8):
K I = M   β I t I I 1
where
β = 1.16 ξ1−0.374
“M” is the applied moment; “β” is the non-dimensional parameter based on dimensional analysis; “I” is the moment of inertia of the uncracked section; “I*” is the moment of inertia of the cracked section; t is the thickness of the web; and “ξ1” is the ratio between the crack length (a) and the beam depth (h), which is used to quantify the extent of the damage.
A mesh sensitivity analysis was performed using the SMART adaptive mesh and standard meshes, one with a coarser mesh of 5 mm and the other with a finer mesh of 1 mm. A comprehensive comparison of the SIF values obtained using the SMART adaptive meshing, the default meshing, and the experimental results of Yu et al. [37], along with the theoretical benchmark from Equation (8) developed by Dunn [21], is presented in the bar chart in Figure 5a. Additionally, Table 1 displays the percentage error for the default coarse mesh, the fine mesh, and the proposed SMART adaptive mesh. The theoretical benchmark values were used as a reference for calculating the error percentages. From Figure 5a and Table 1, it is evident that the SIF values simulated using the proposed SMART adaptive meshing are in close agreement with the theoretical benchmarks, with minimum and maximum errors of 2.11% and 9.57%, respectively. In contrast, validation of the FE model against the experimental results of Yu et al. resulted in a wider range of percentage errors, from 2.8% to 22%. Several factors, such as variations in the material properties due to manufacturing defects, residual stresses, heterogeneity, and measurement errors, particularly in capturing the precise crack lengths and the SIF during dynamic fatigue testing, are inevitable. Despite the higher error percentages when compared to the experimental data, the FEM model remains within an acceptable range of accuracy, especially considering the complexities involved in real-world testing. In contrast, the SIF values calculated numerically using the default mesh, even with a fine mesh, result in a much higher percentage of error, ranging from 34% to 60%. However, SMART is capable of yielding high-fidelity results due to its adaptive re-meshing feature.
Also, the fatigue life corresponding to a 75 mm crack length in the experiment [37] was reported to be 16,500 cycles. For a similar crack length of 75 mm, the fatigue life obtained from the numerical simulation was 17,400 cycles. The ratio between the fatigue life reported in the experiment and the finite element predictions was 0.948, with an error percentage of 5%. Moreover, the fatigue life determined from the theoretical calculation corresponding to a crack width of 75 mm was 16,890 cycles. Therefore, the ratio of the fatigue life according to the equation of Dunn et al. [21] to the finite element predictions was 0.960.
Figure 5c shows the crack propagation in the web of the beam observed in the experiment, whereas Figure 5c shows the same in the FE analysis. This comparison reveals that the crack predominantly propagates through the web of the beam, similar to the experimental findings. However, slight differences in the exact crack path may arise due to simplifications in the FE model or experimental variability (e.g., material imperfections). These factors contribute to discrepancies in the crack trajectory, but the overall growth of the crack in the web region is consistent across both cases.
Thus, the proposed FE model can accurately predict the SIF, fatigue life, and failure mode of pre-cracked steel beams. Similarly, the analysis takes more than 2 h for the model with the standard meshing but is reduced to a few minutes [58] when using the SMART adaptive meshing. Therefore, the SMART technique is computationally efficient for estimating the fatigue life of structures. Hence, this validated FE model can be used further to understand the effect of FRP strengthening on the enhancement of the fatigue life of pre-cracked steel beams. To be specific, the effect of the fiber braid angle and the crack growth length can be extensively evaluated so that generic design recommendations can be provided.

3. Design of Pre-Cracked Steel Beams with and without FRP Strengthening

3.1. A Pre-Cracked Steel I-Beam (B01) without FRP Strengthening

The effect of FRP strengthening is studied on the validated model by varying the beam dimensions, stress ratio, loading conditions, and initial crack size, expanding its applicability to different scenarios. The dimensions and geometry of an I-beam with an initial crack (ai) of 20 mm extending from the bottom of the flange to the web are shown in Figure 6a–c, while the initial mesh of the 3D FE model is shown in Figure 6d. Table 2 shows the properties of the steel beams used in the work. Important parameters such as tensile strength, ultimate strength, and Young’s modulus were found by testing standard coupons to be 250 MPa, 460 MPa, and 200 GPa. These important parameters were obtained by experimental testing of standard coupons under tensile loading, and their complete stress–strain behavior is described in the subsequent section for completeness. Paris’ coefficient “C” and the exponent “m” were adopted from [59]. The initial crack length ai = 20 mm was extended in 20 steps to a final length of af = 40 mm, and the crack increment Δa was kept at 1 mm. Figure 6d depicts the meshing obtained for the pre-cracked steel beams. To improve the accuracy of the predictions, two different element sizes were considered with the unstructured mesh. The element size near the crack tip was kept at 0.85 mm to obtain better crack predictions, whereas the remaining portion of the beam was maintained more coarsely at 5 mm to reduce the computation time. The ID for the control beam without any FRP strengthening is designated as B01, which will be used for comparison throughout.
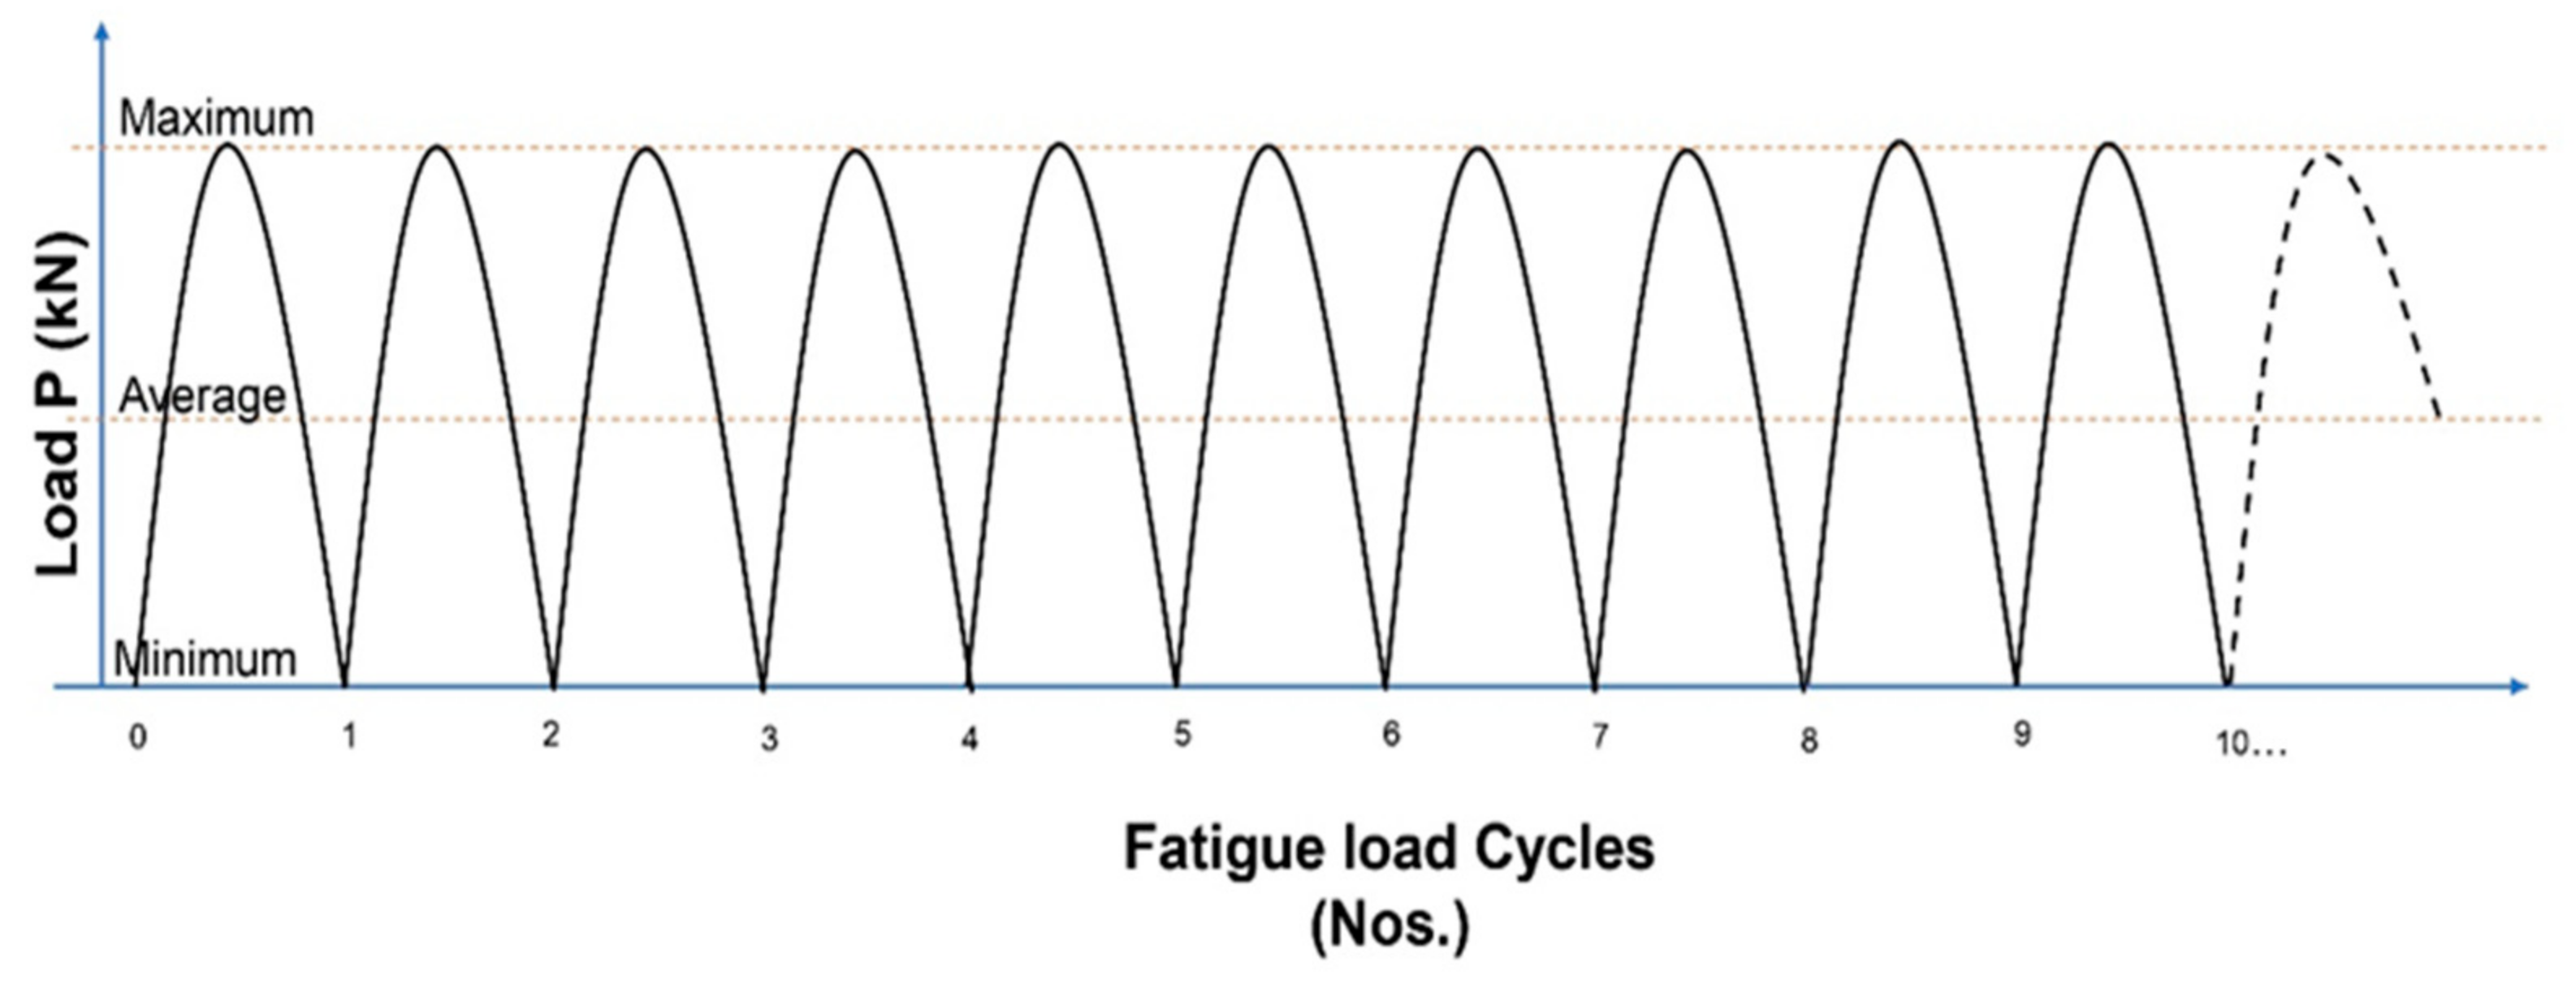
The load was applied to the top of the beam just above the crack, and the simulated support conditions corresponded to a three-point bending case. The beam was subjected to a fatigue load with a constant-amplitude load ratio (R = 0), as depicted in Figure 7. As specified, the beam was exposed to a cyclic fatigue load varying between the minimum and maximum loads (P = 1.0 kN). The waveform applied to generate the cyclic load resembled a sinusoidal form, the minimum load was set to zero, and the load in each cycle was incremented to the value of P. The stop criteria for the simulation were fixed as extension of the crack until 20 mm.
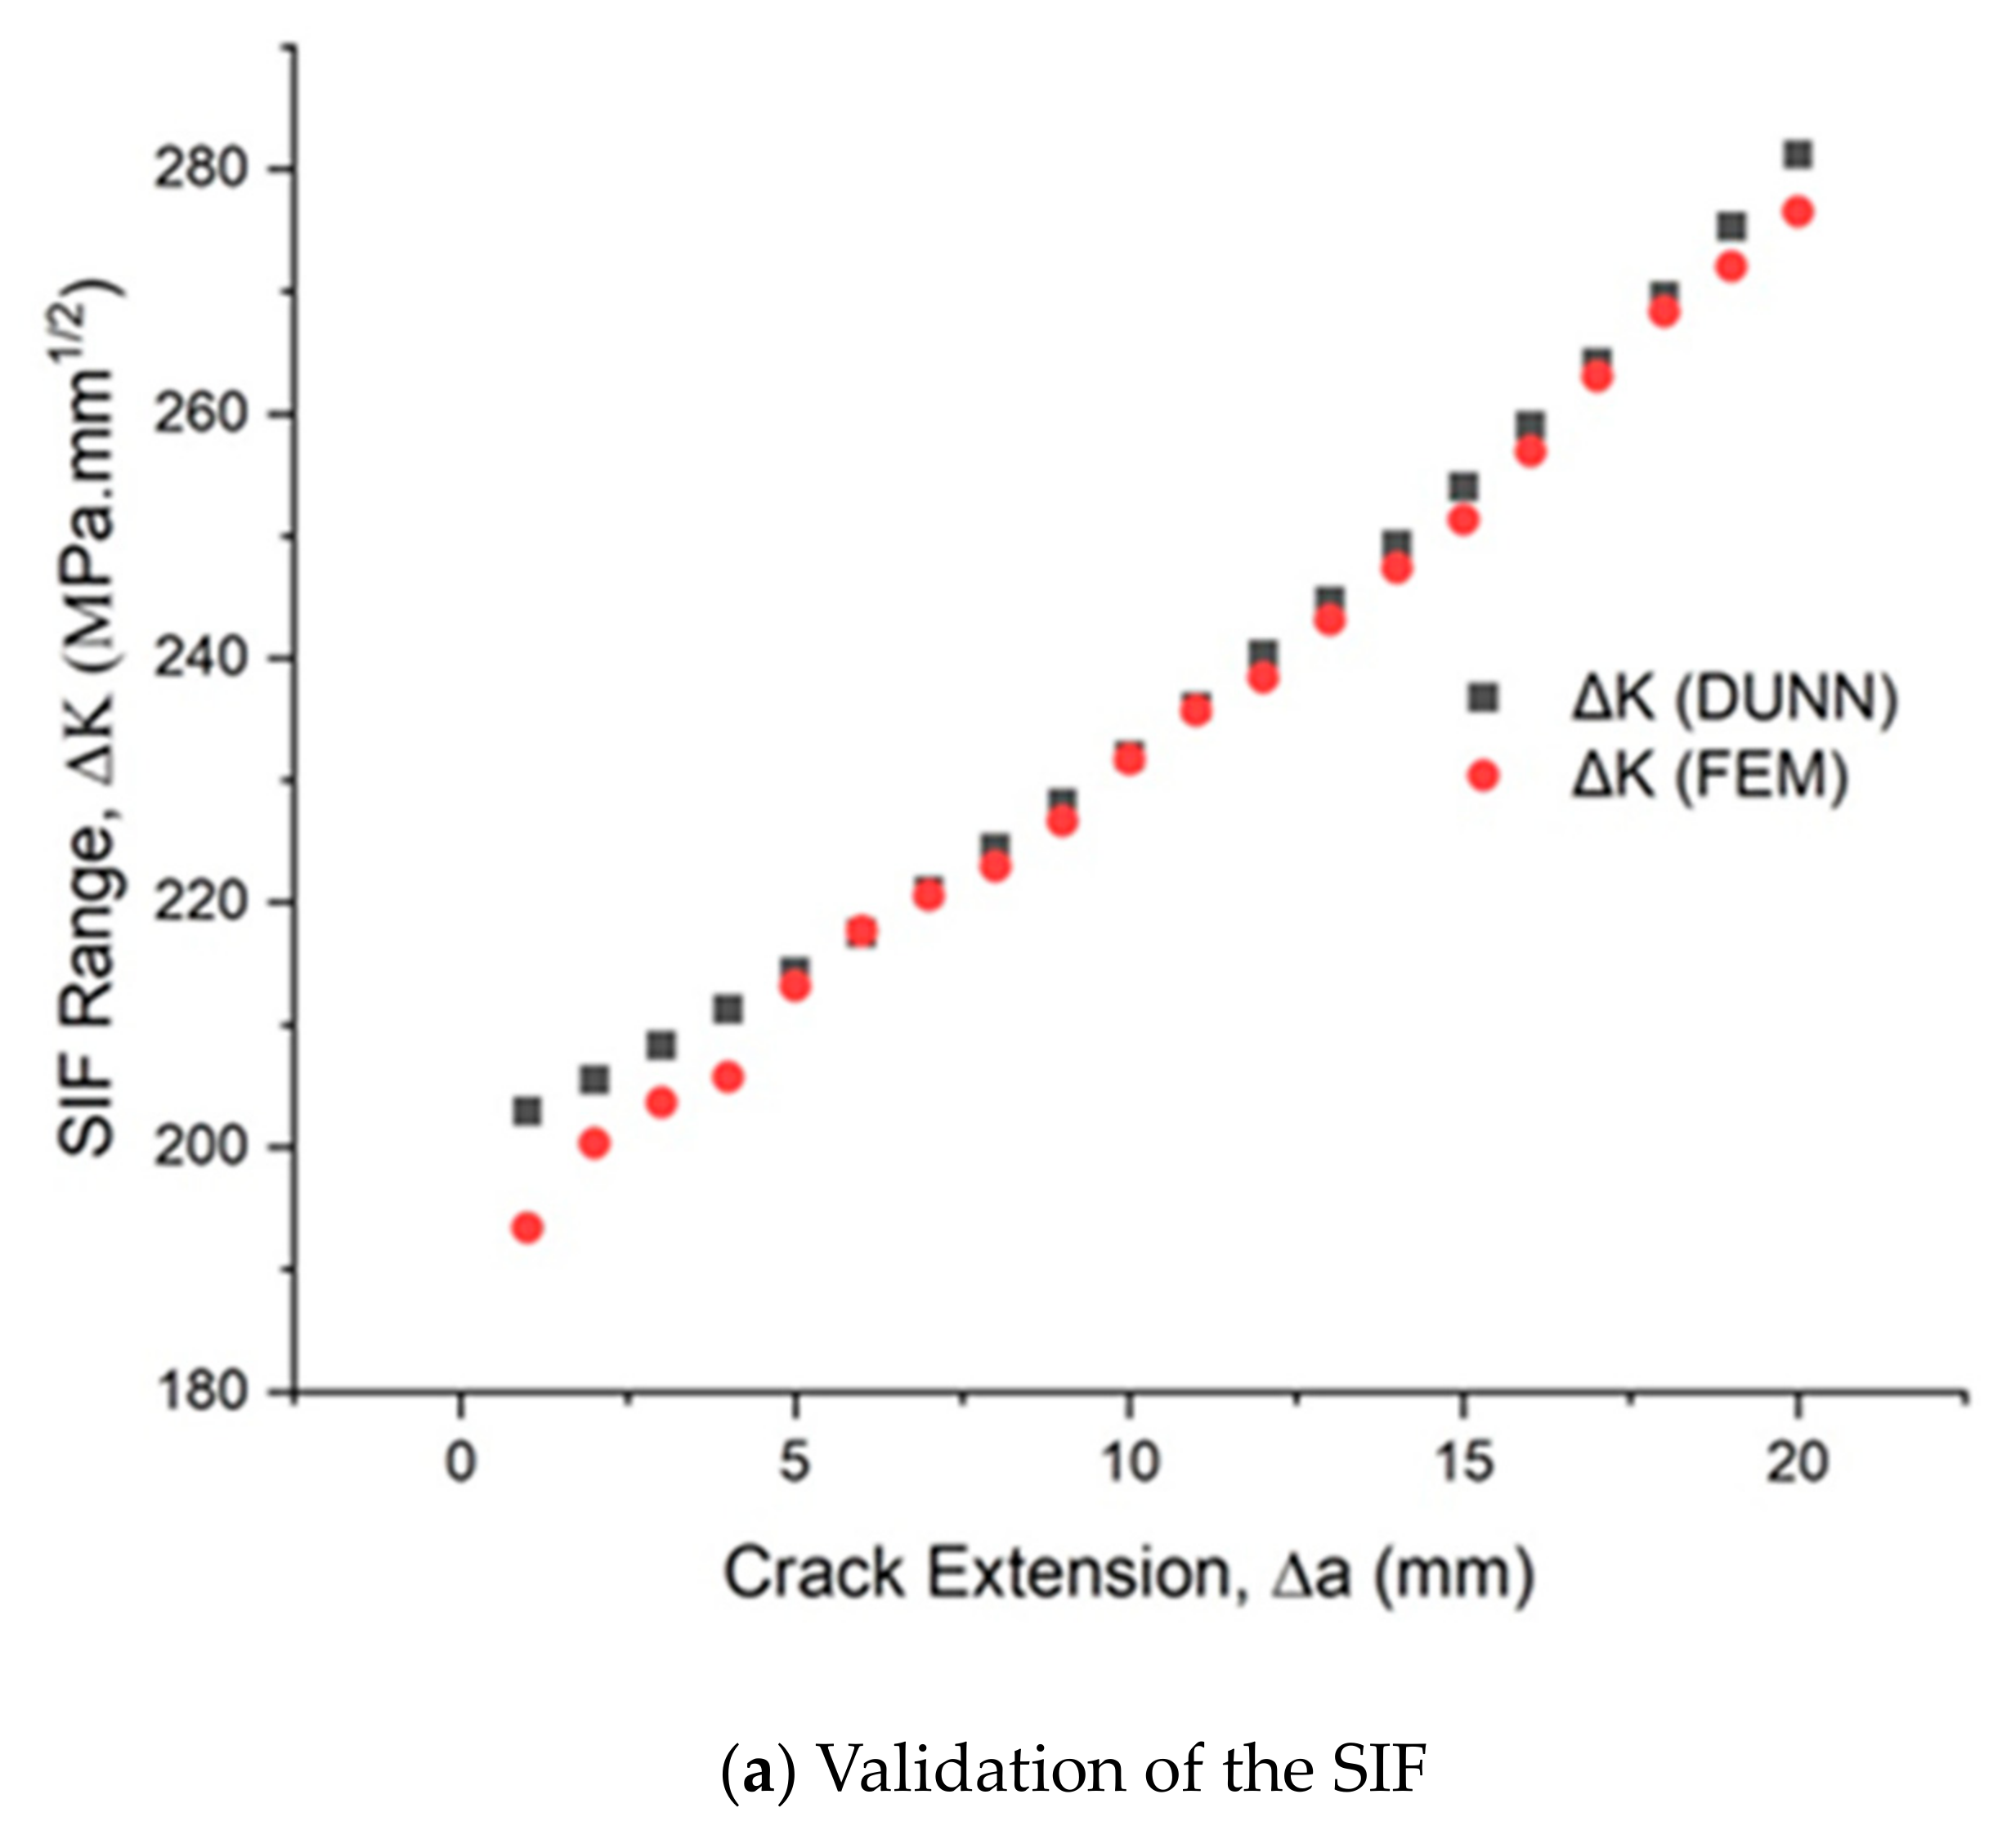
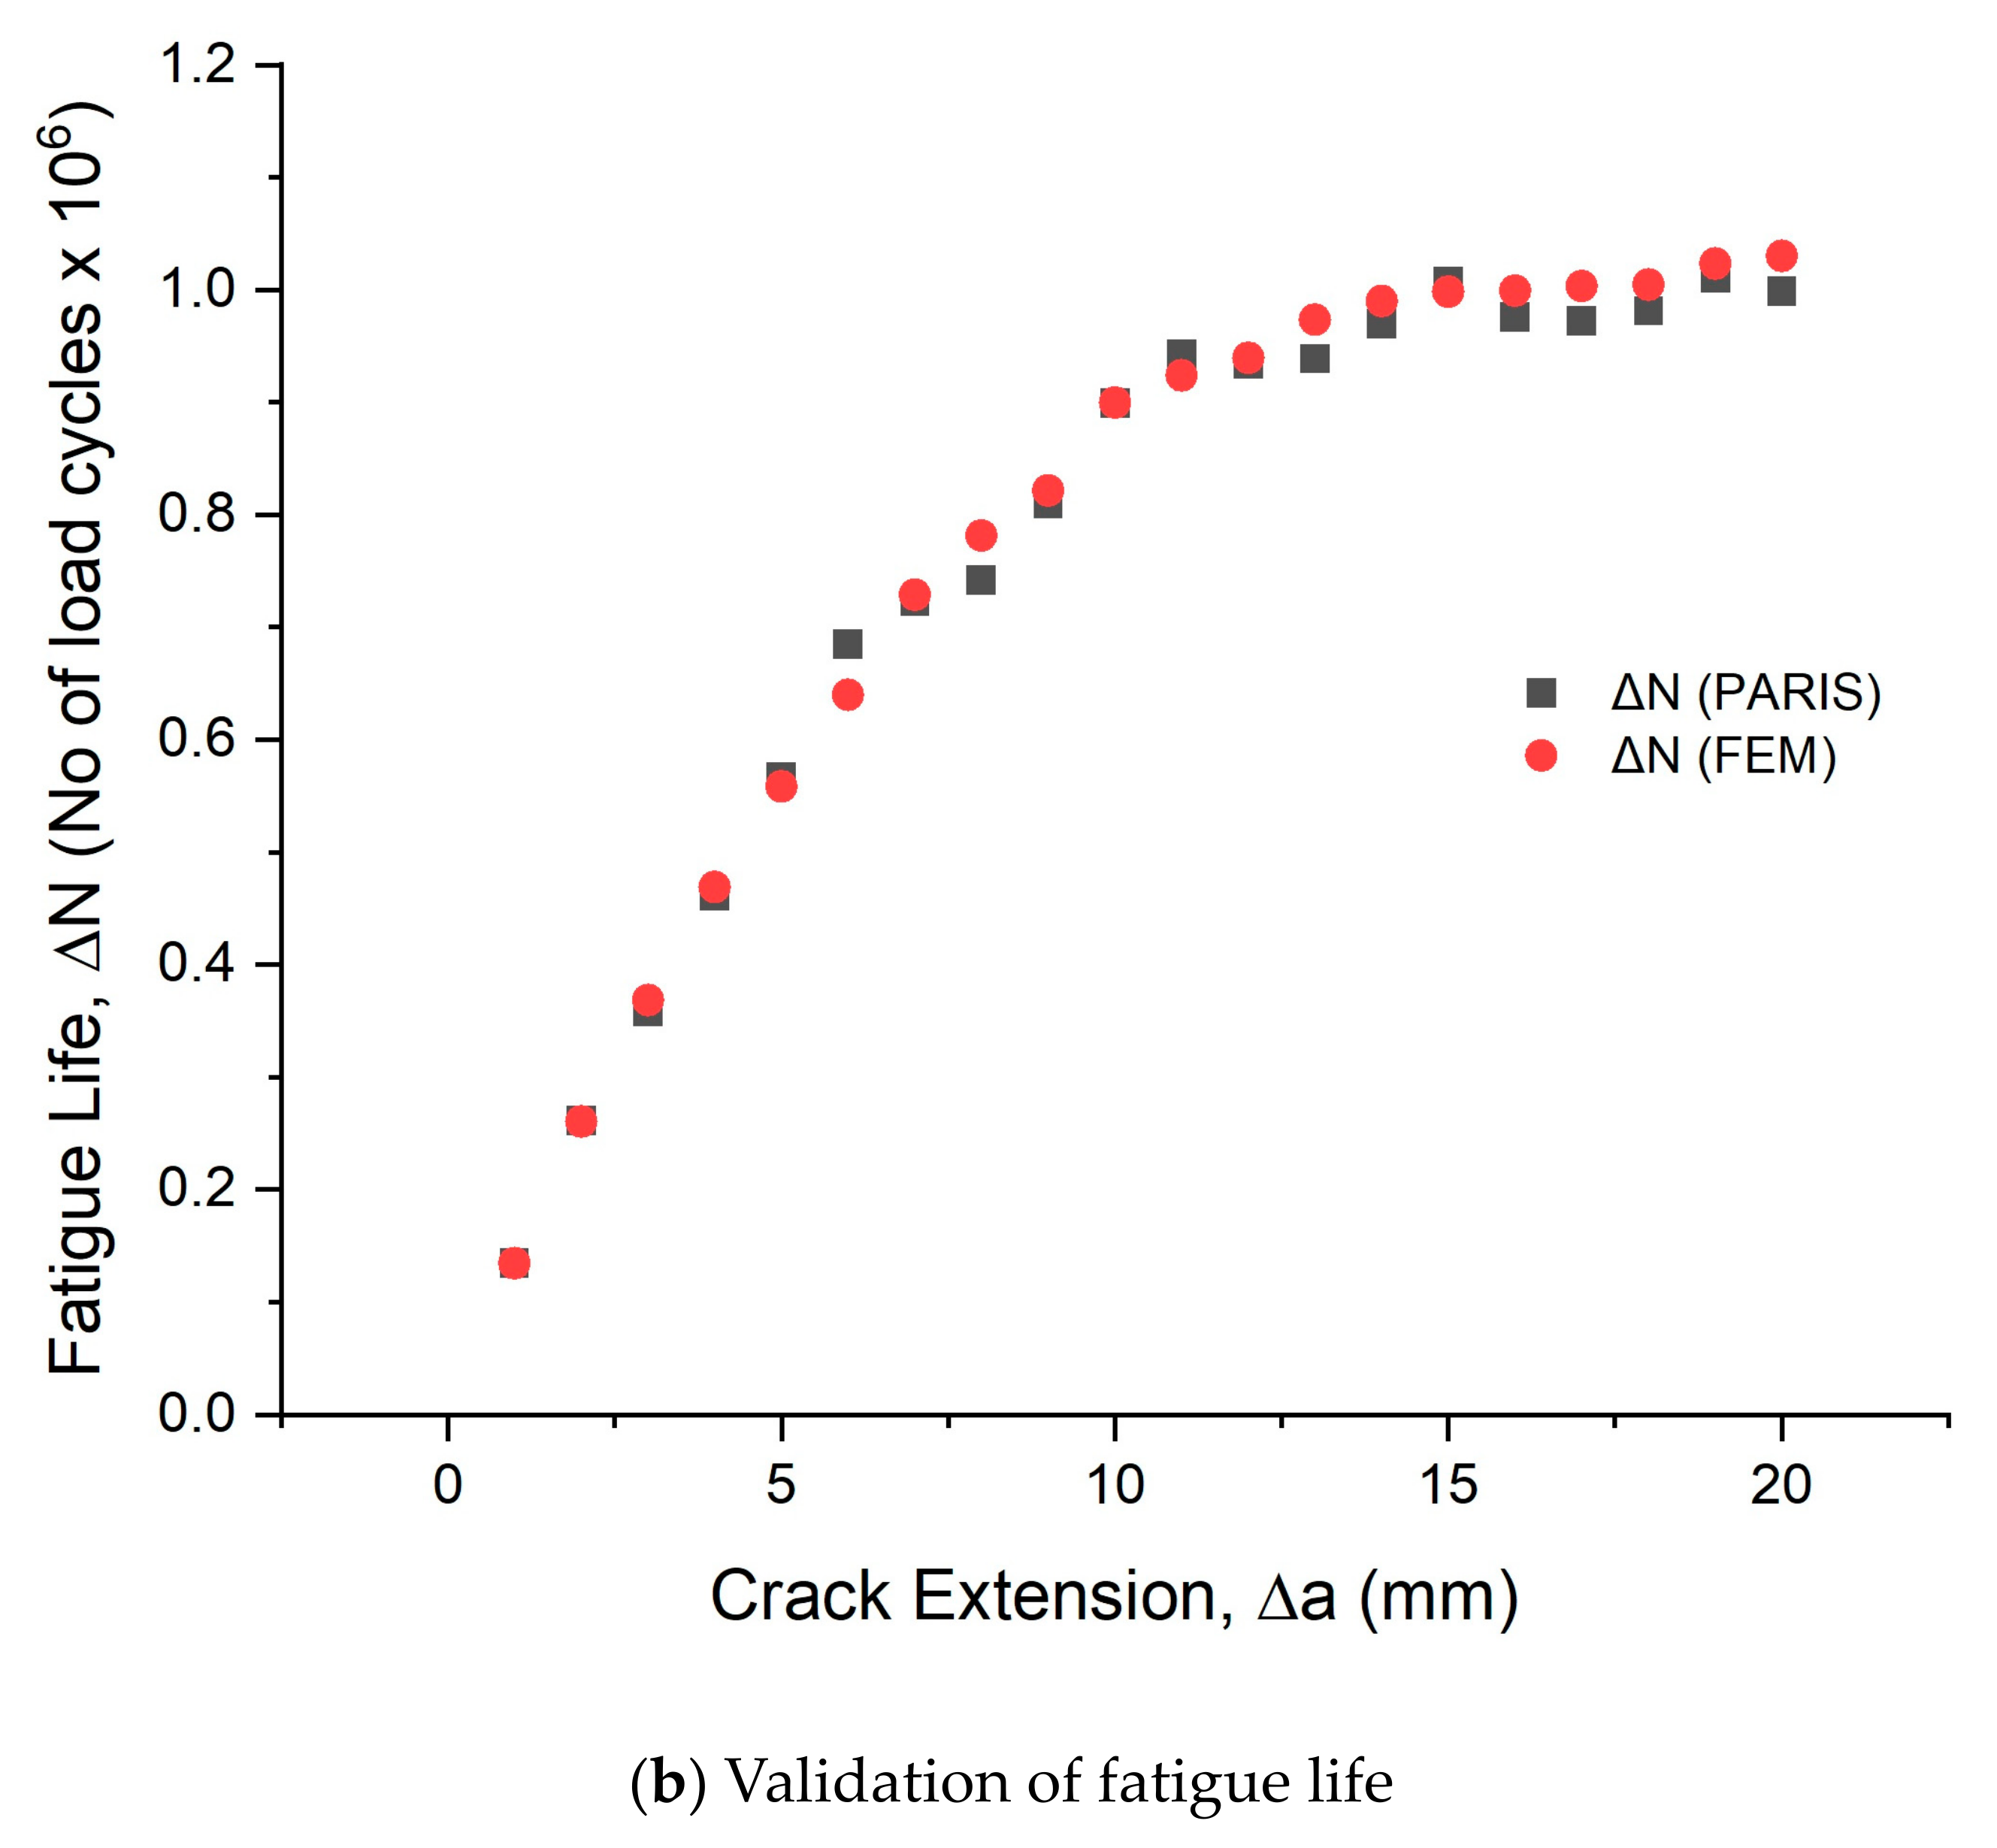
Figure 8a compares the results for the stress intensity factor obtained from the finite element model and the theoretical calculations. The validation of the control beam (B01) helps in ensuring the accuracy of the developed FEM so that the enhancement in the fatigue life obtained for the FRP-strengthened specimens can be used to generate generic design recommendations. The results demonstrate close agreement between the predictions obtained from the closed-form solution for the stress intensity factor given by Equation (8) and the 3D finite element analysis. The SIF corresponding to the 20 mm crack growth predicted by the FE model was 283.67, while the theoretical value was 277.7, with an error of 2.2%. This shows the accuracy of the developed FE model in comparison with the theoretical equation of Dunn et al. [21]. Similarly, comparison of the fatigue life (ΔN) values from the theoretical predictions based on Paris’ law and the 3D finite element model is shown in Figure 8b. For a crack growth of 20 mm, the fatigue life predicted by the FE model was 1 × 10⁶ cycles, whereas the maximum fatigue life was 0.99 × 10⁶ cycles according to Paris’ law [9]. The predicted values have a minimum and maximum error of 2.48% and 5.37%, respectively.
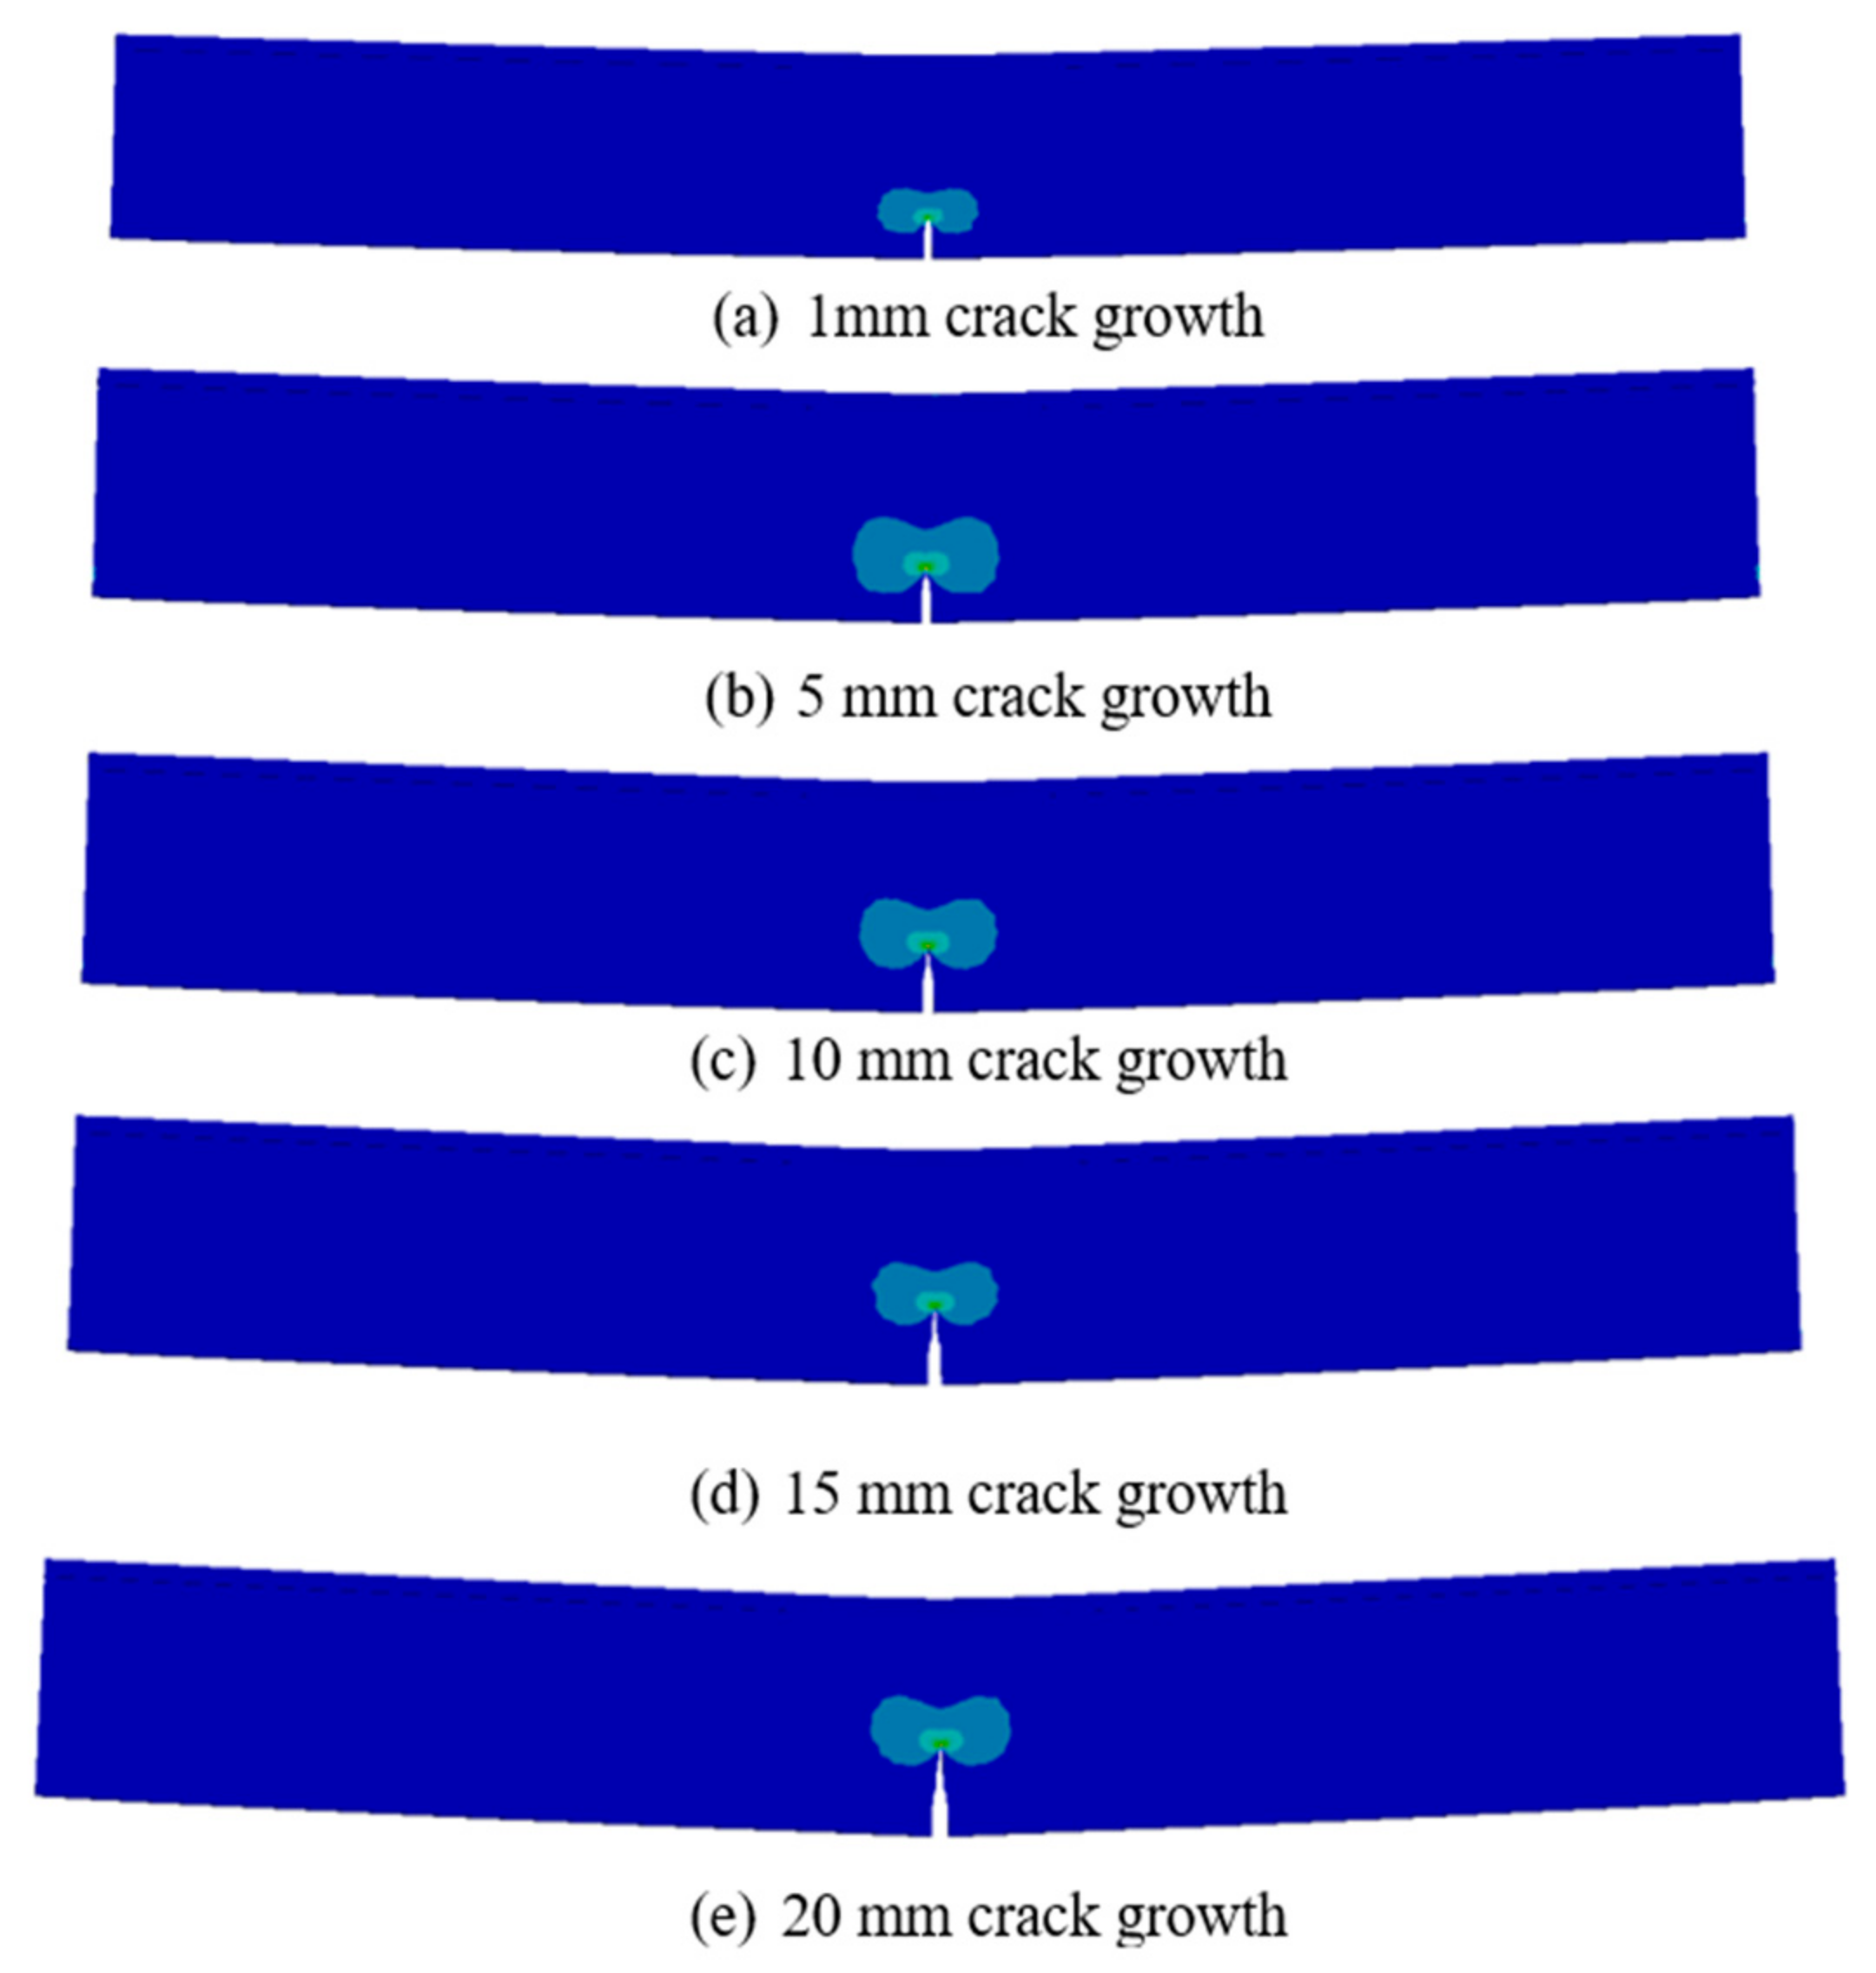
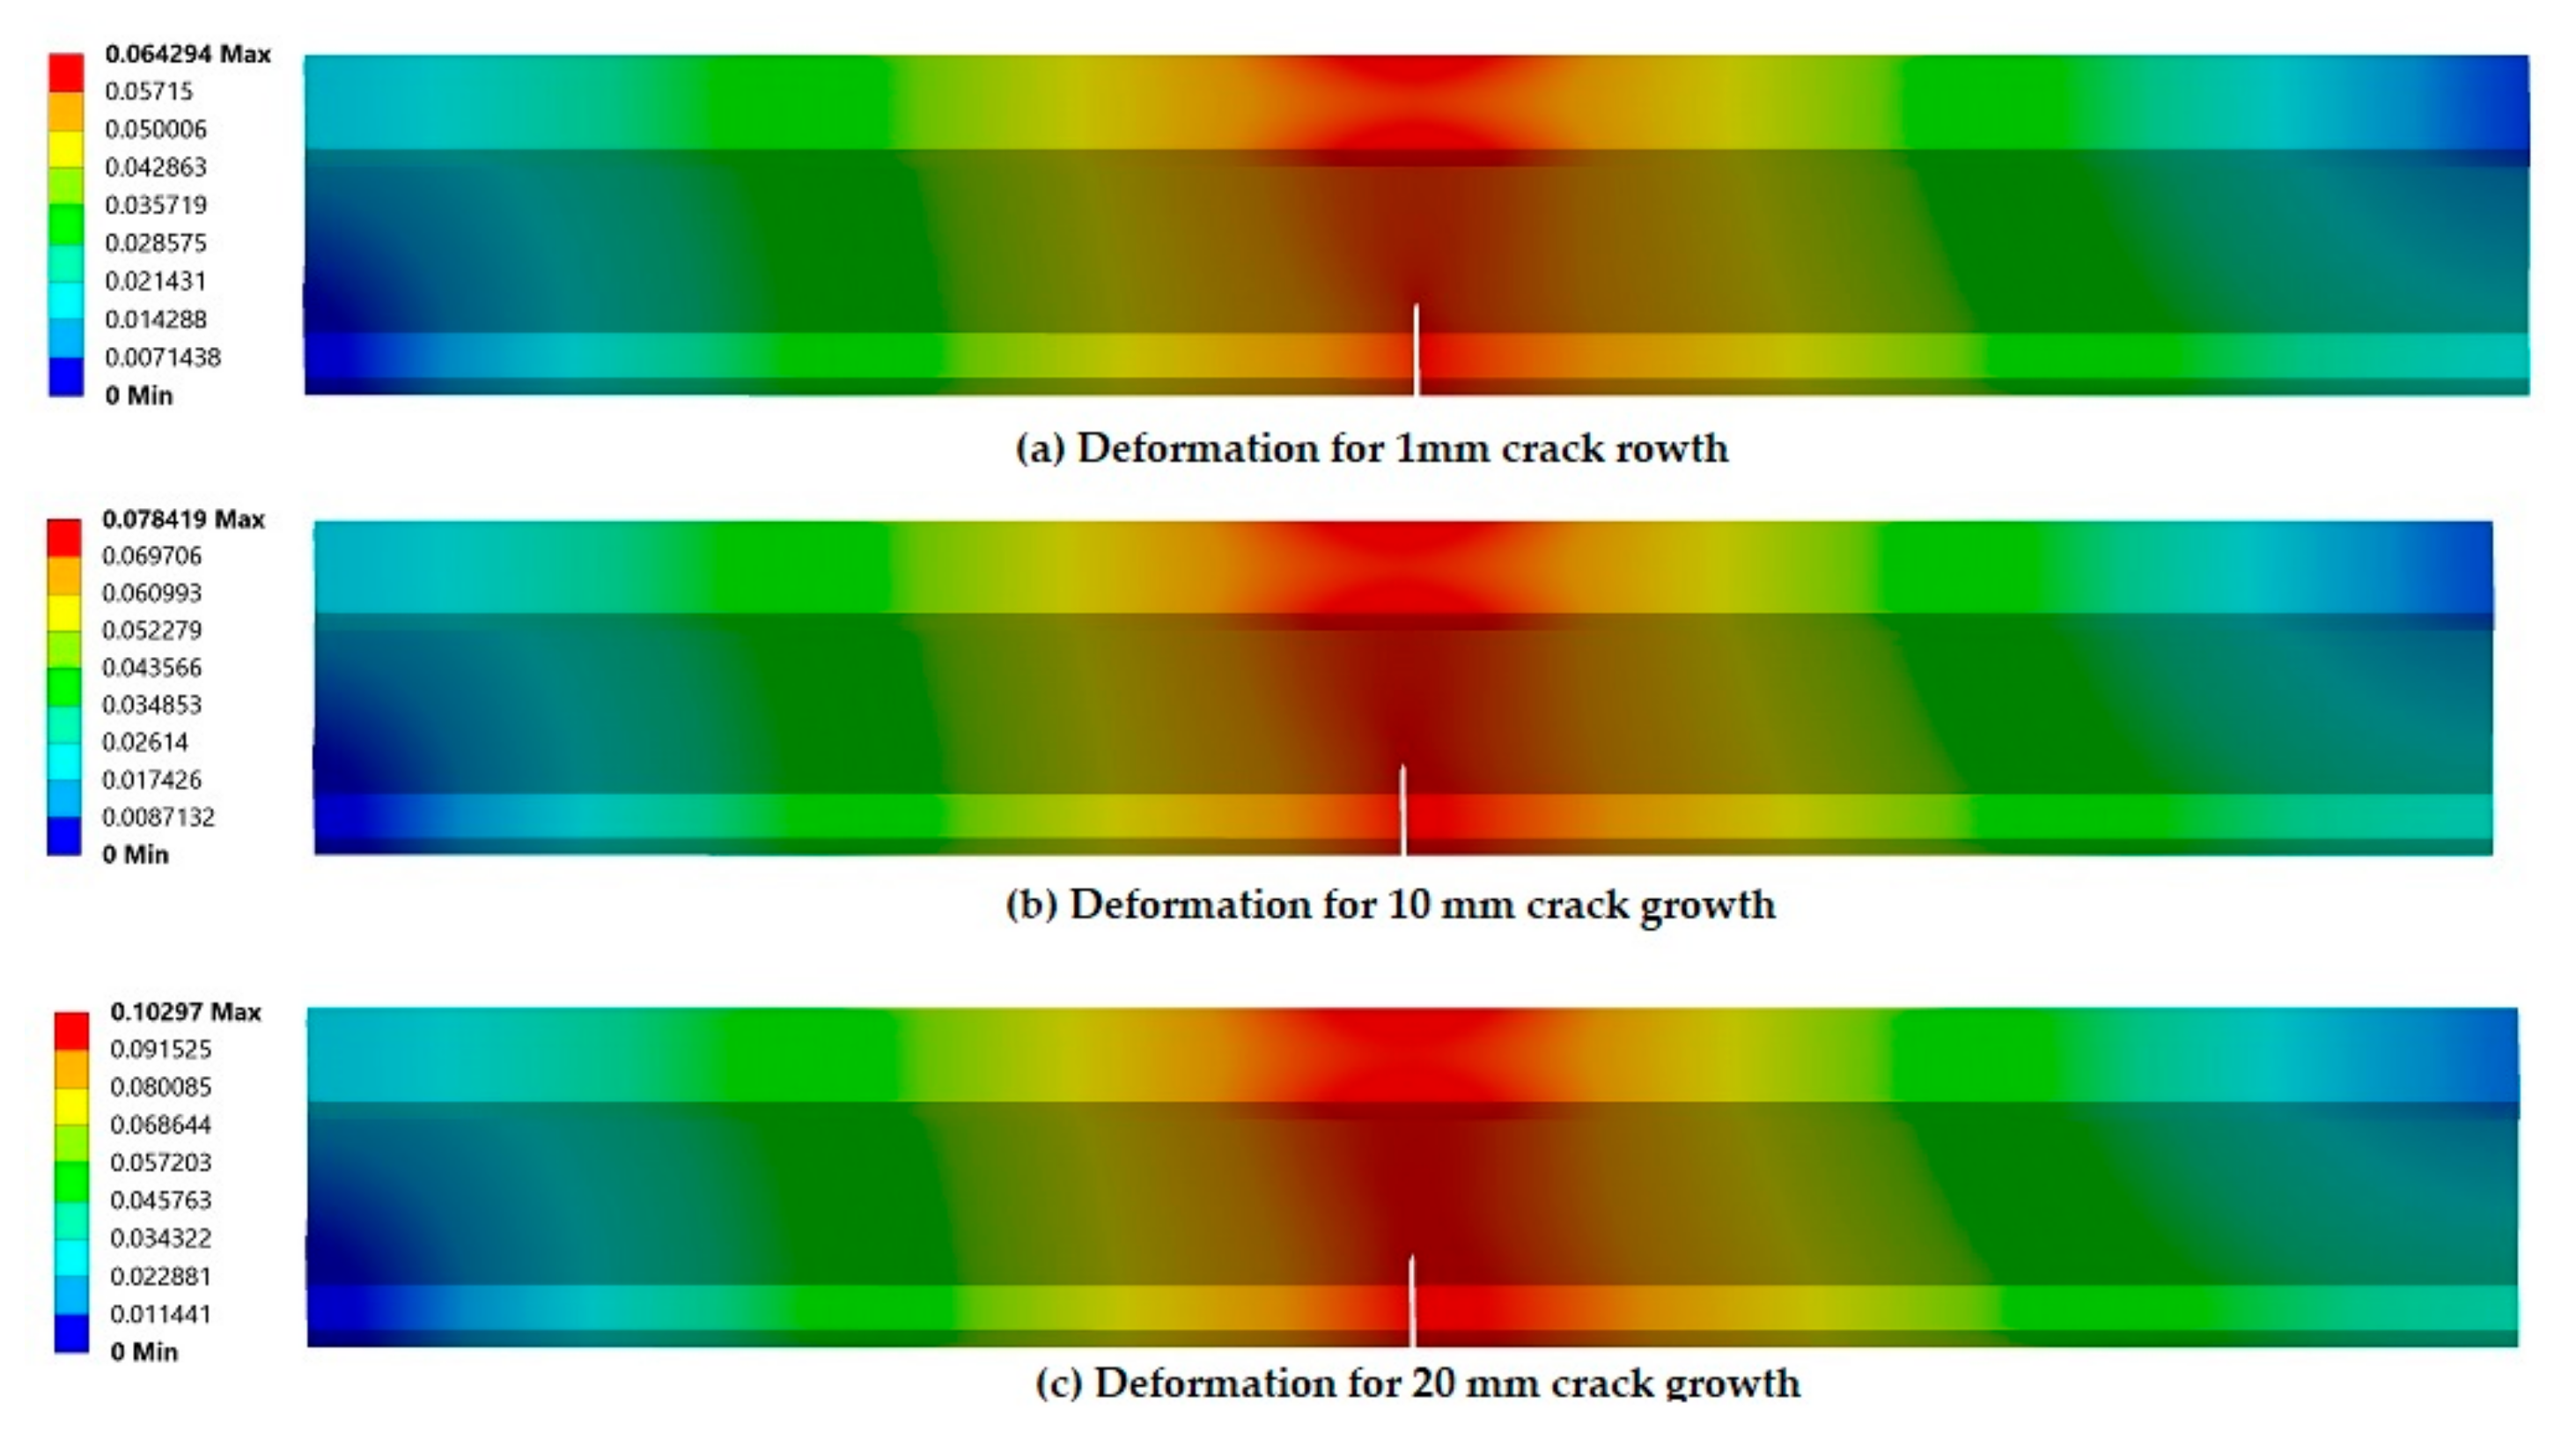
Figure 9 shows the variation in the von Mises stress distribution of the unstrengthened beam (B01) during different stages of crack growth, i.e., 1 mm, 5 mm, 10 mm, 15 mm, and 20 mm from the tip of the notch. For crack growth of 1 mm, the von Mises stress at the tip of the notch is 142.6 MPa. As the crack extends to 5 mm, the stress increases to 167.79 MPa. Similarly, when the crack is extended to 10 mm, 15 mm, and 20 mm, the von Mises stress increases by 21.4%, 25.21%, and 29.5%, respectively, compared to the stress corresponding to a crack extension of 1 mm. Figure 10 depicts the total deformation of the unstrengthened beam (B01) at different stages of crack growth. In general, the deformation corresponding to the bending direction increases significantly with an increase in the crack length. From Figure 10c, it can be seen that the maximum deformation value corresponds to 0.1 mm.

3.2. The Parametric Study

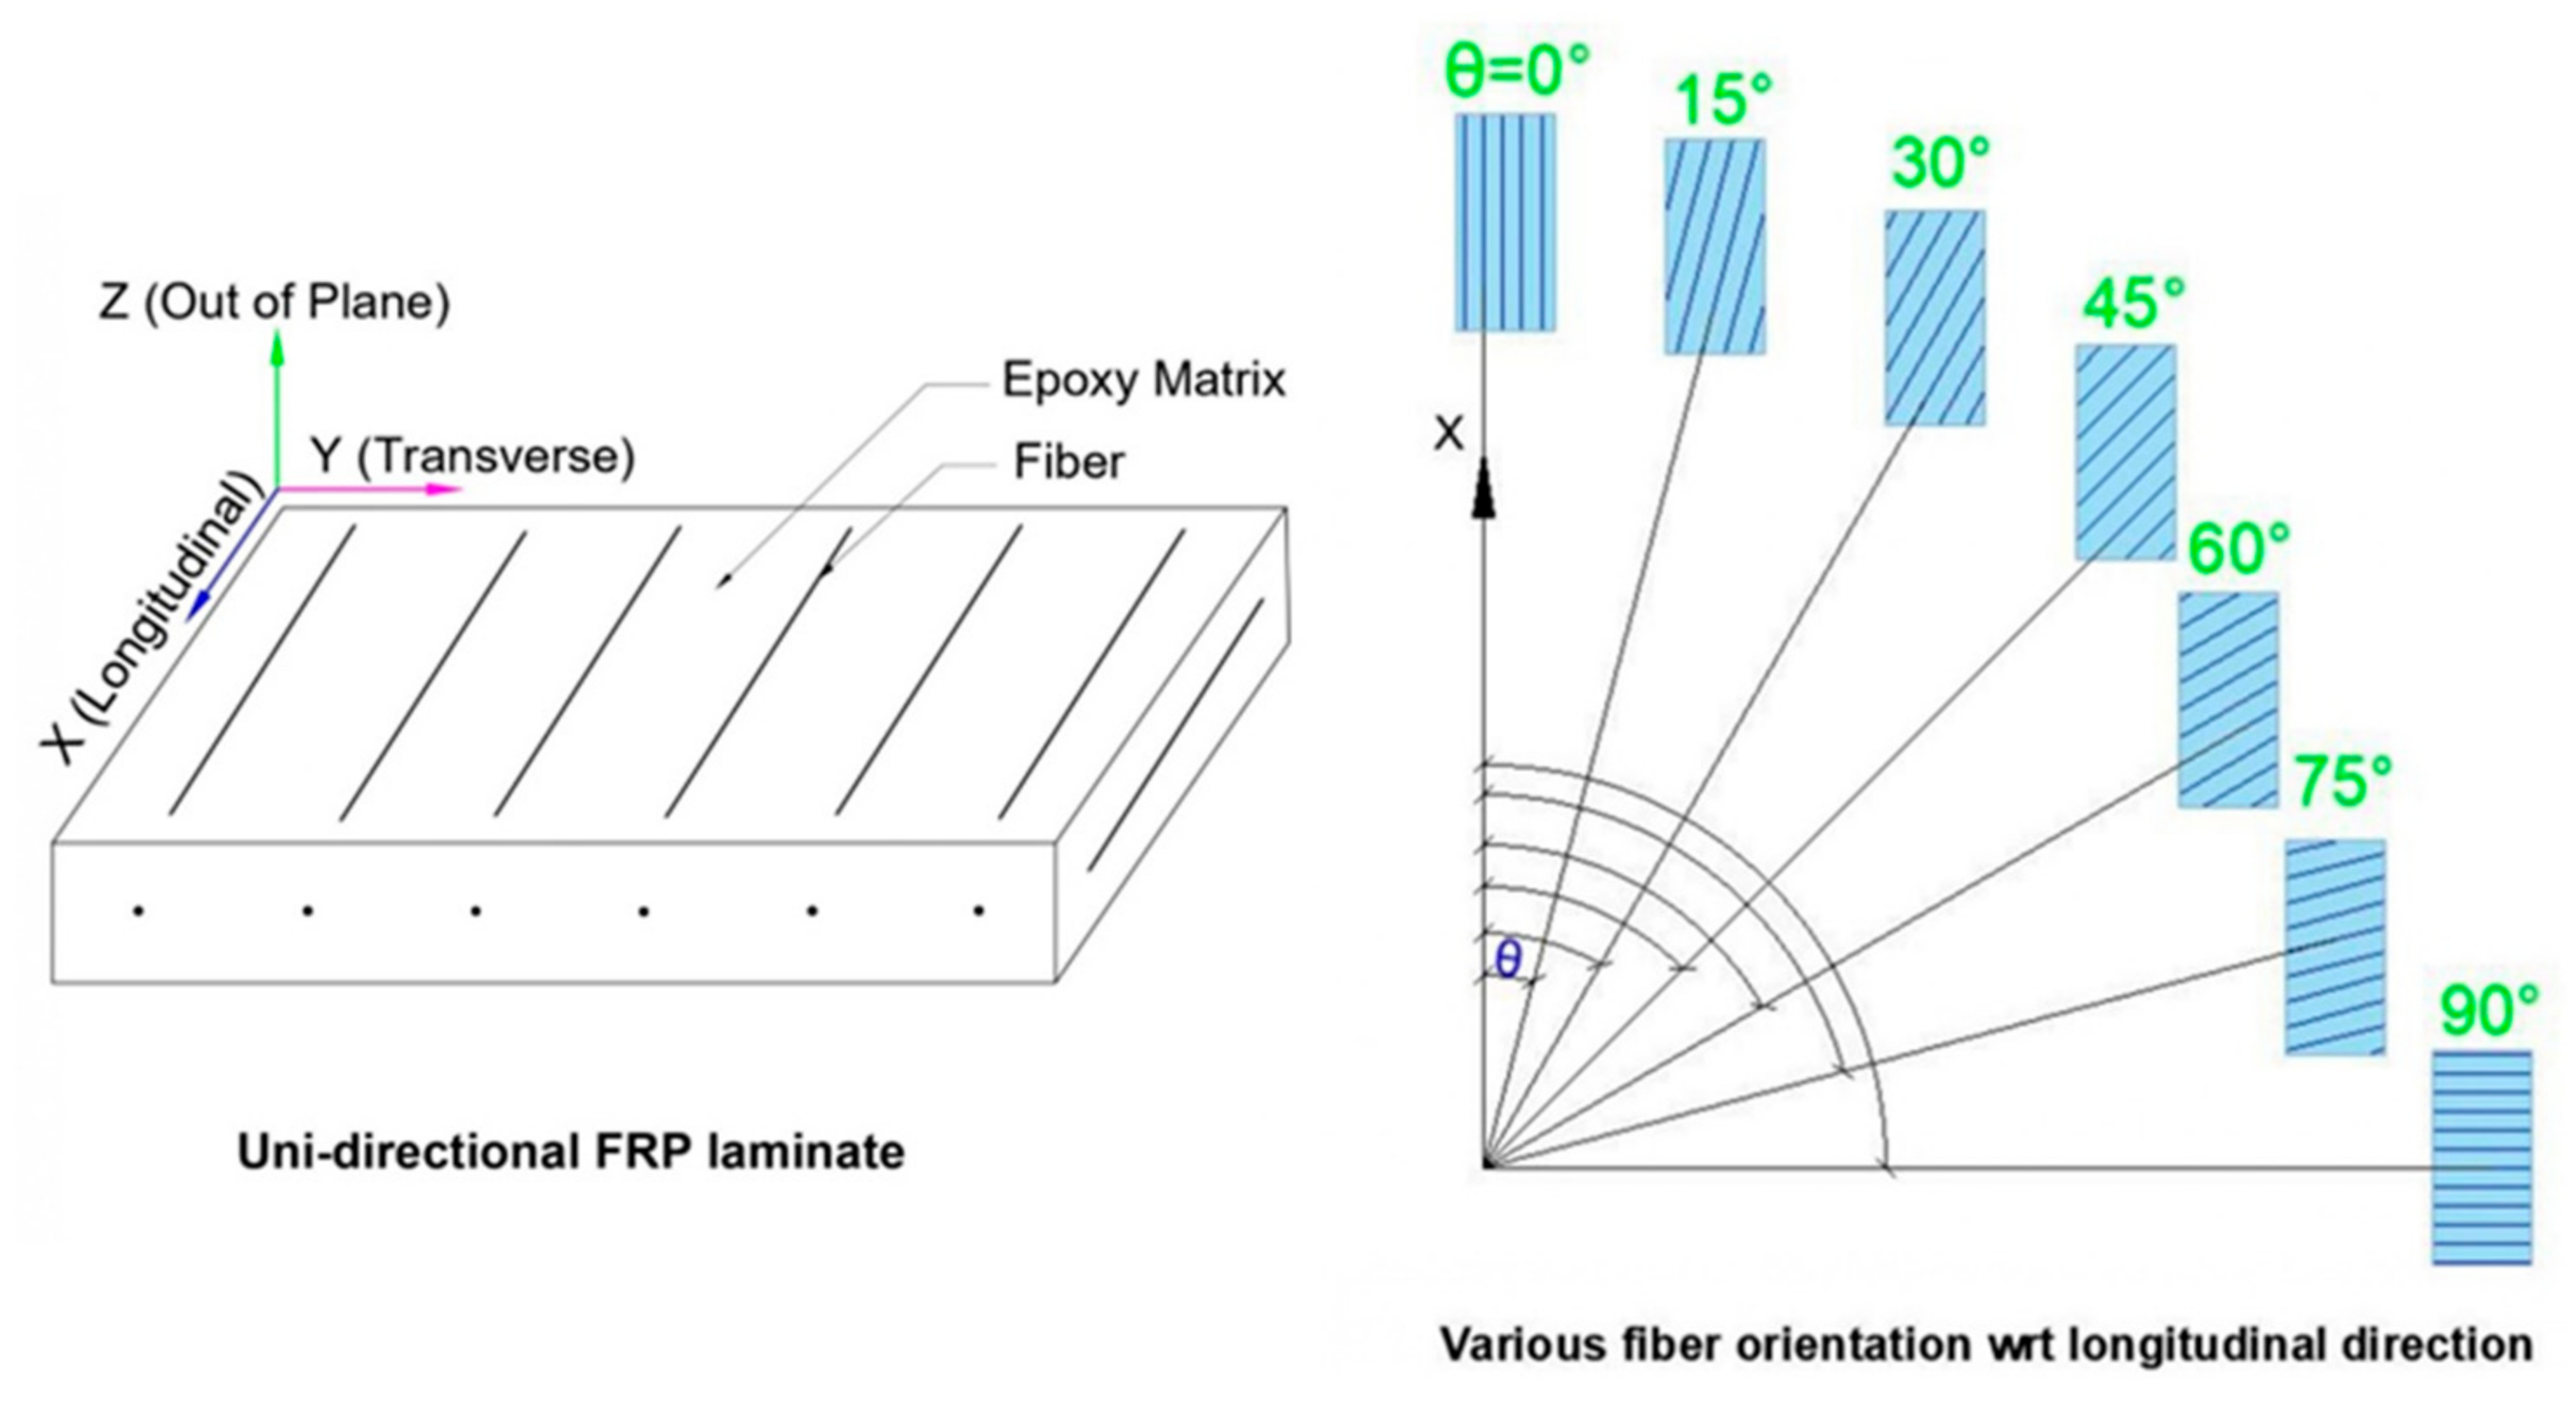
The developed FE model, validated against the standard theoretical equations, is used to understand the behavior of pre-cracked steel beams with FRP strengthening. The key objective of the parametric study was to understand the effect of the FRP design parameters on the enhancement in the fatigue life of notched steel beams. The detailed parametric study investigated the influence of the orthotropic properties of different types of FRP (i.e., CFRP and GFRP) and the fiber braid angles on slowing the crack growth rate, reducing the SIF, and extending the fatigue life. Table 3 provides the details of various parameters and FRP characteristics used in the parametric studies of the notched steel I-sections. In the nomenclature provided (CBXX or GBXX), the first two letters represent the type of FRP material used to strengthen the beam, i.e., a CFRP-strengthened beam (CB) or a GFRP-strengthened beam (GB). The last two numbers help in correlating the type of strengthening with the orientation of the fibers in the FRP. For example, CB02 represents a CFRP-strengthened beam with the carbon fibers oriented perpendicular to the direction of loading (θ = 0°).
The following are the important assumptions considered in the FE analysis of the FRP-strengthened notched steel beams:
  • The Paris’ law parameters are the same for the unstrengthened and FRP-strengthened steel beams, implying that the FRP laminate only contributes to reducing the SIF at the crack tip [52].
  • There is no debonding between the FRP laminate and the steel beam interface (i.e., perfect bonding), which is achieved by merging the nodes of the beam’s bottom flange and the FRP laminate’s top face [60].
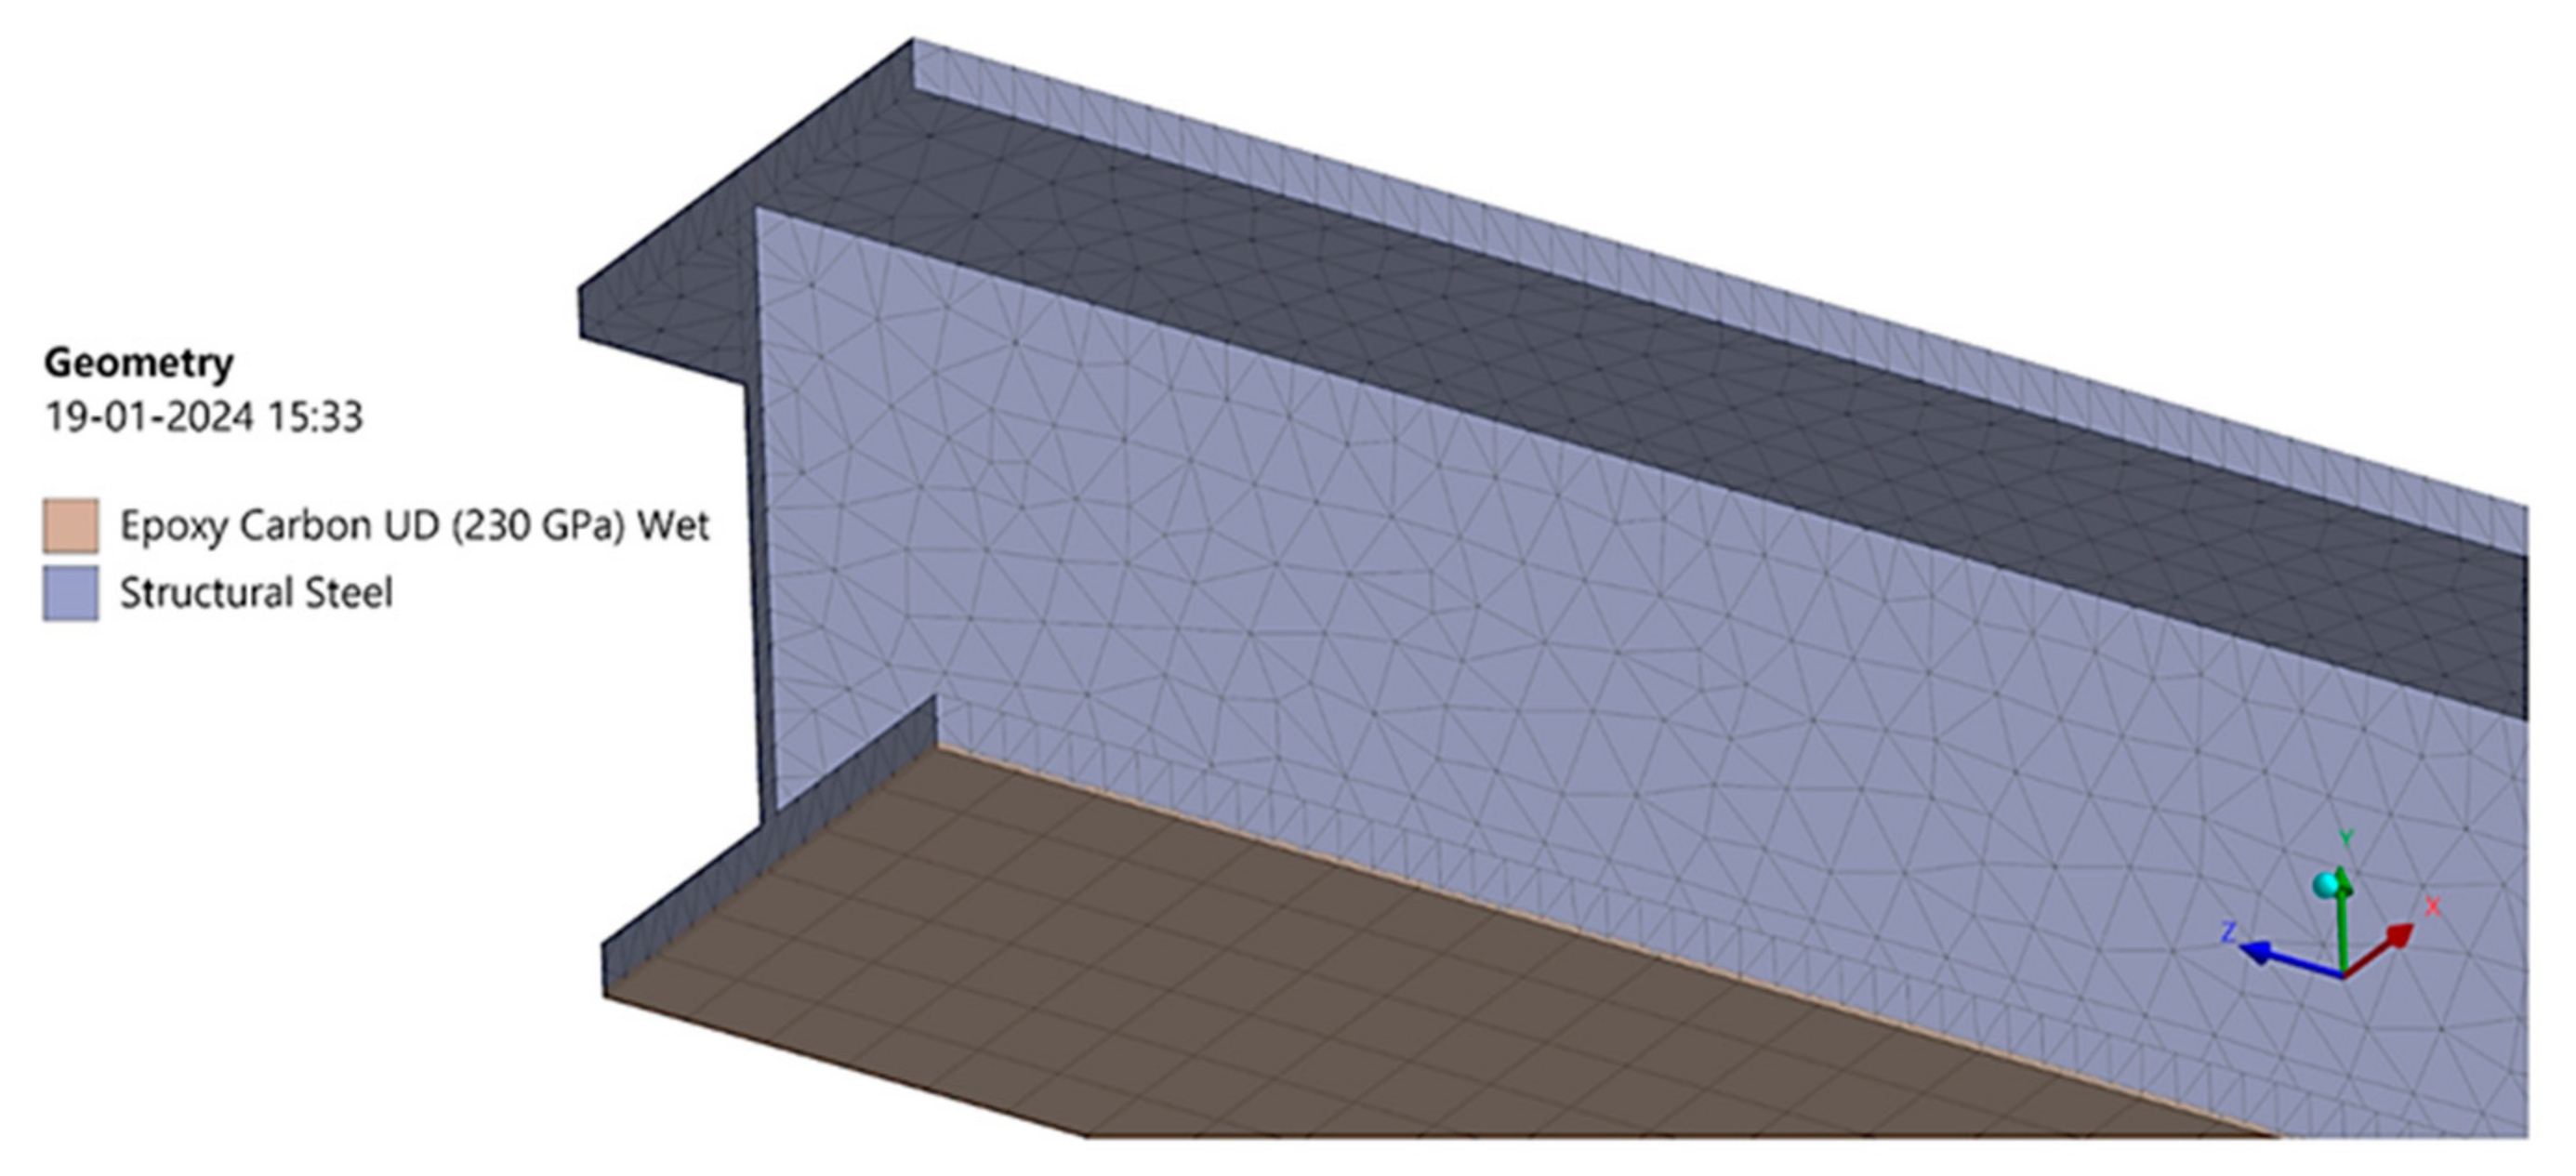
Figure 11 depicts the meshing of a notched steel beam with FRP laminates attached at the soffit of the beam. To model unidirectional carbon/glass FRP using the FEM, ANSYS software is built in with a shell element (SHELL281), and that was used in the present work.
Figure 12 shows the different fiber braid angles used in the parametric studies. The orientation of the FRP laminates in the direction of loading is considered a parallel alignment (i.e., θ = 90°). Similarly, the orientation of the fibers perpendicular to the direction of loading is considered a horizontal alignment (i.e., θ = 0°). Other orientations of the FRP laminates were also studied to understand their influence on the fatigue resistance of the steel I-beams.
Figure 13 depicts the experimental comparison of the stress–strain behavior of the steel (E250) and FRP sheets. The materials were tested as per the ASTM standards [56], and a minimum of three samples were tested to obtain the average tensile characteristics. From the graph, it can be observed that the stiffness of steel and carbon FRP is comparable. However, the initial stiffness of the FRP is about 5 times less than that of the steel/CFRP used. However, the failure strain of the FRP was significantly lower than that of steel, i.e., the ultimate strain of steel was 6%, whereas the ultimate strain of GFRP and CFRP was about 2.3% and 0.8%, respectively. Similarly, the ultimate stress in the steel, GFRP, and CFRP was 460 MPa, 850 MPa, and 2400 MPa, respectively. These values obtained from mechanical characterization were used as the input in the FE analysis.
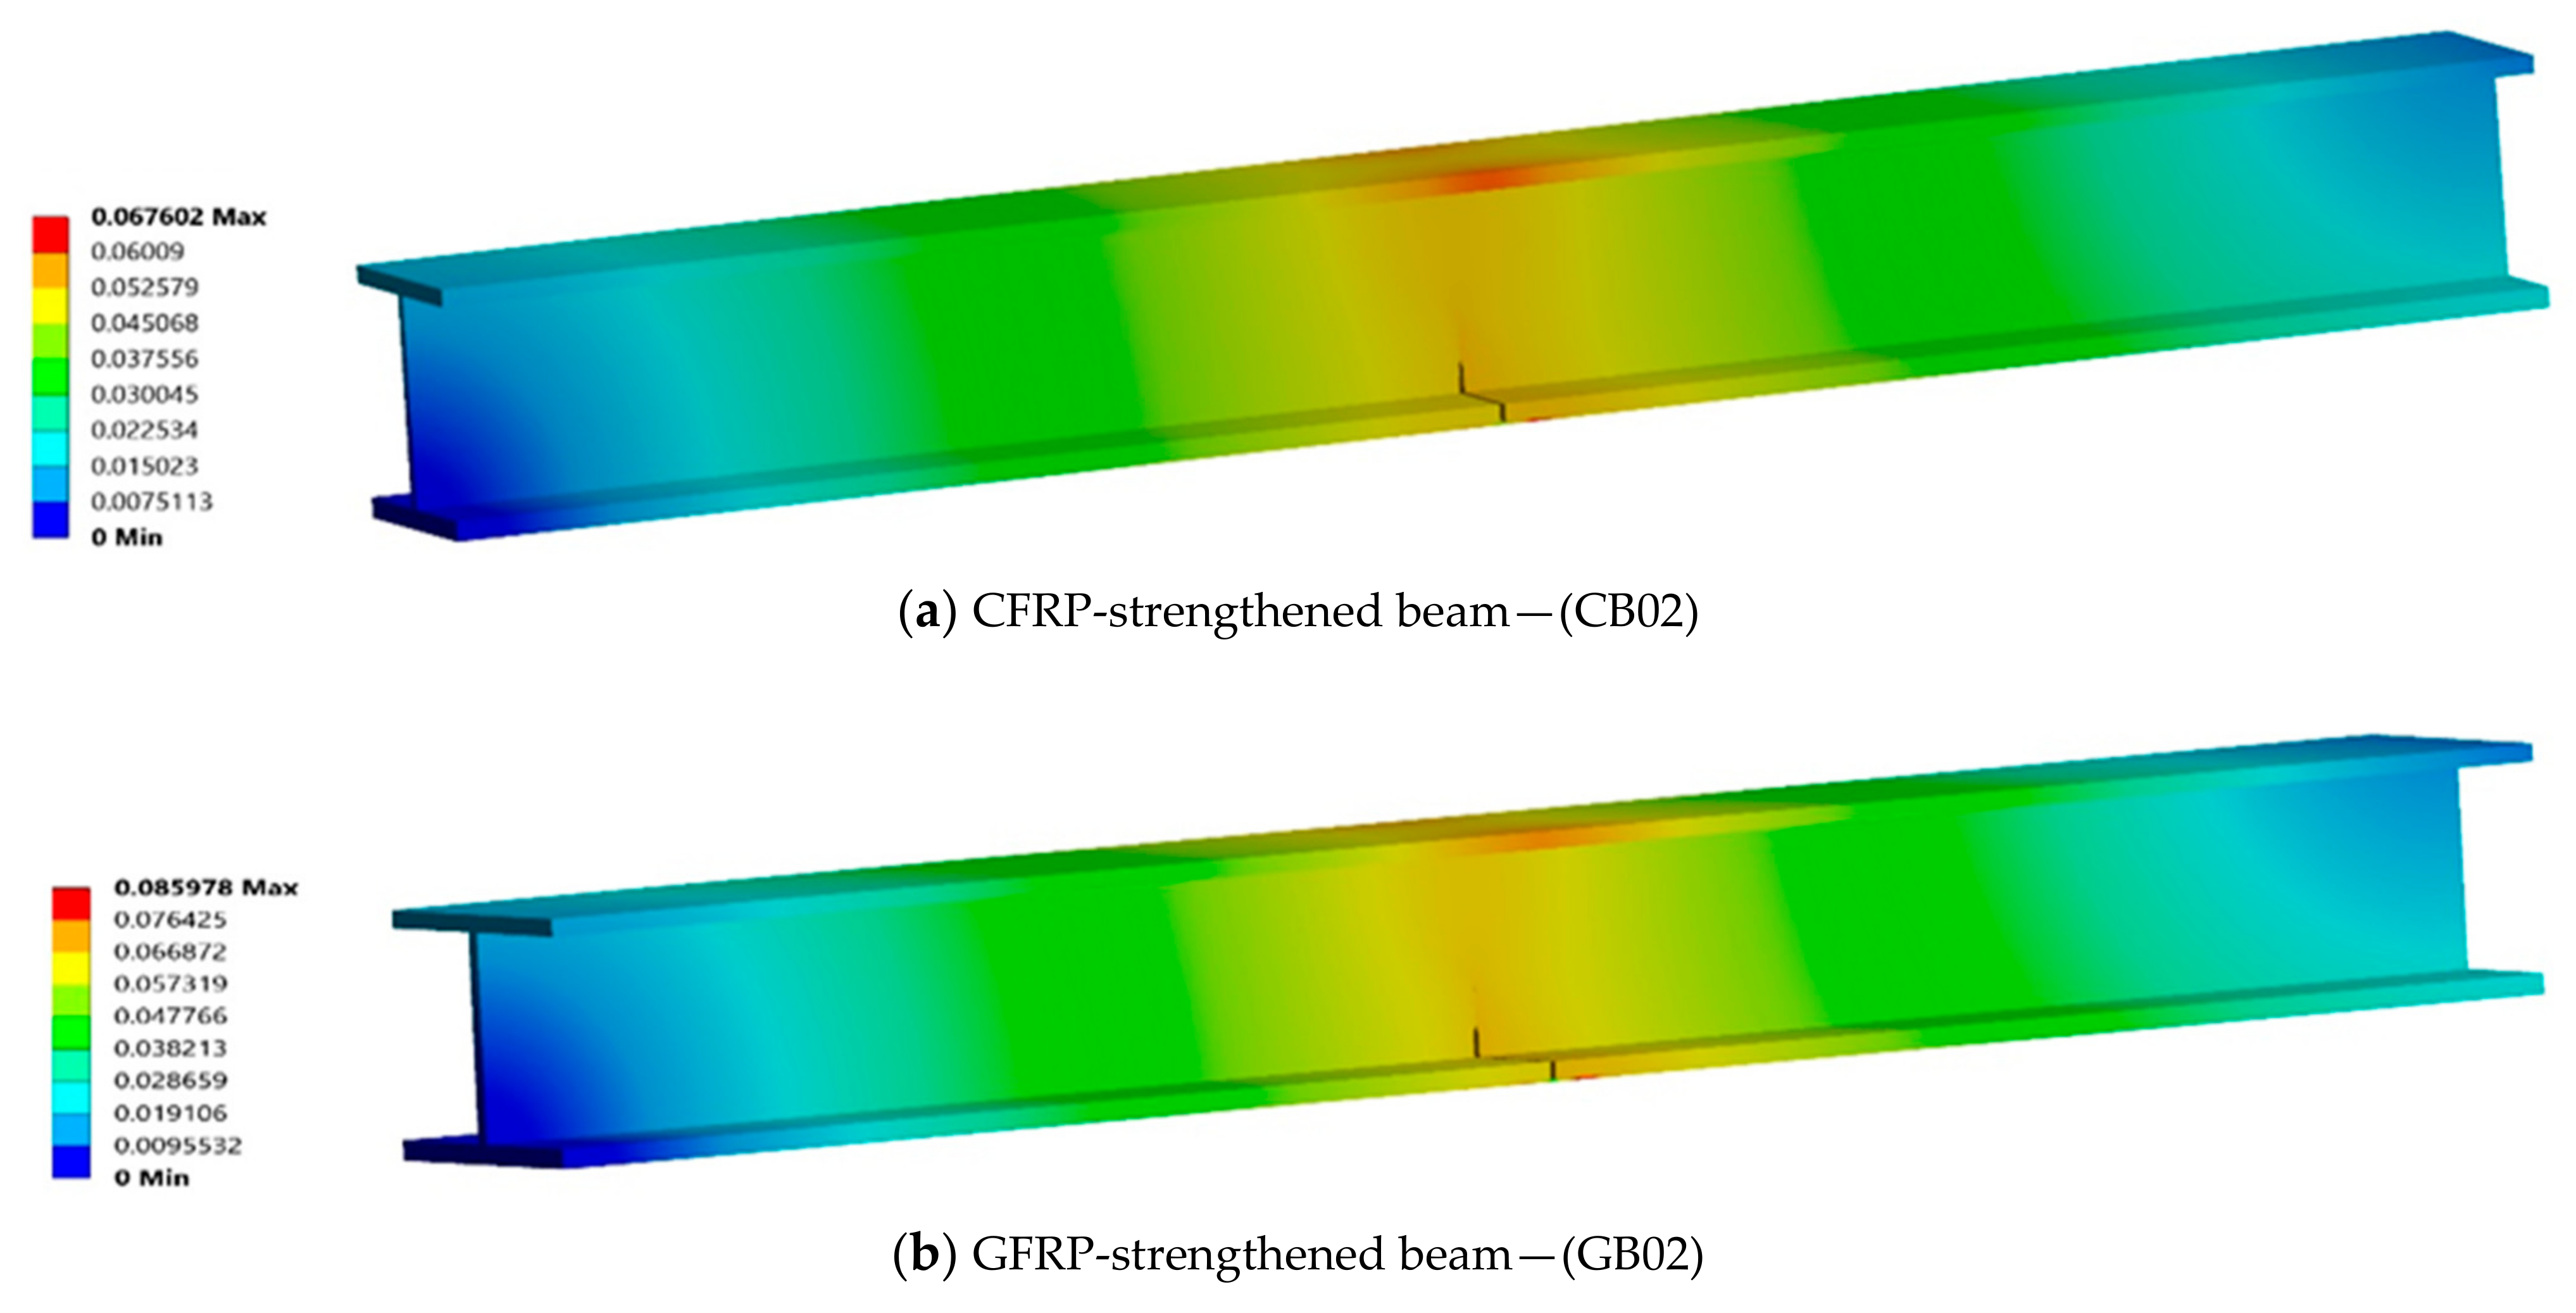
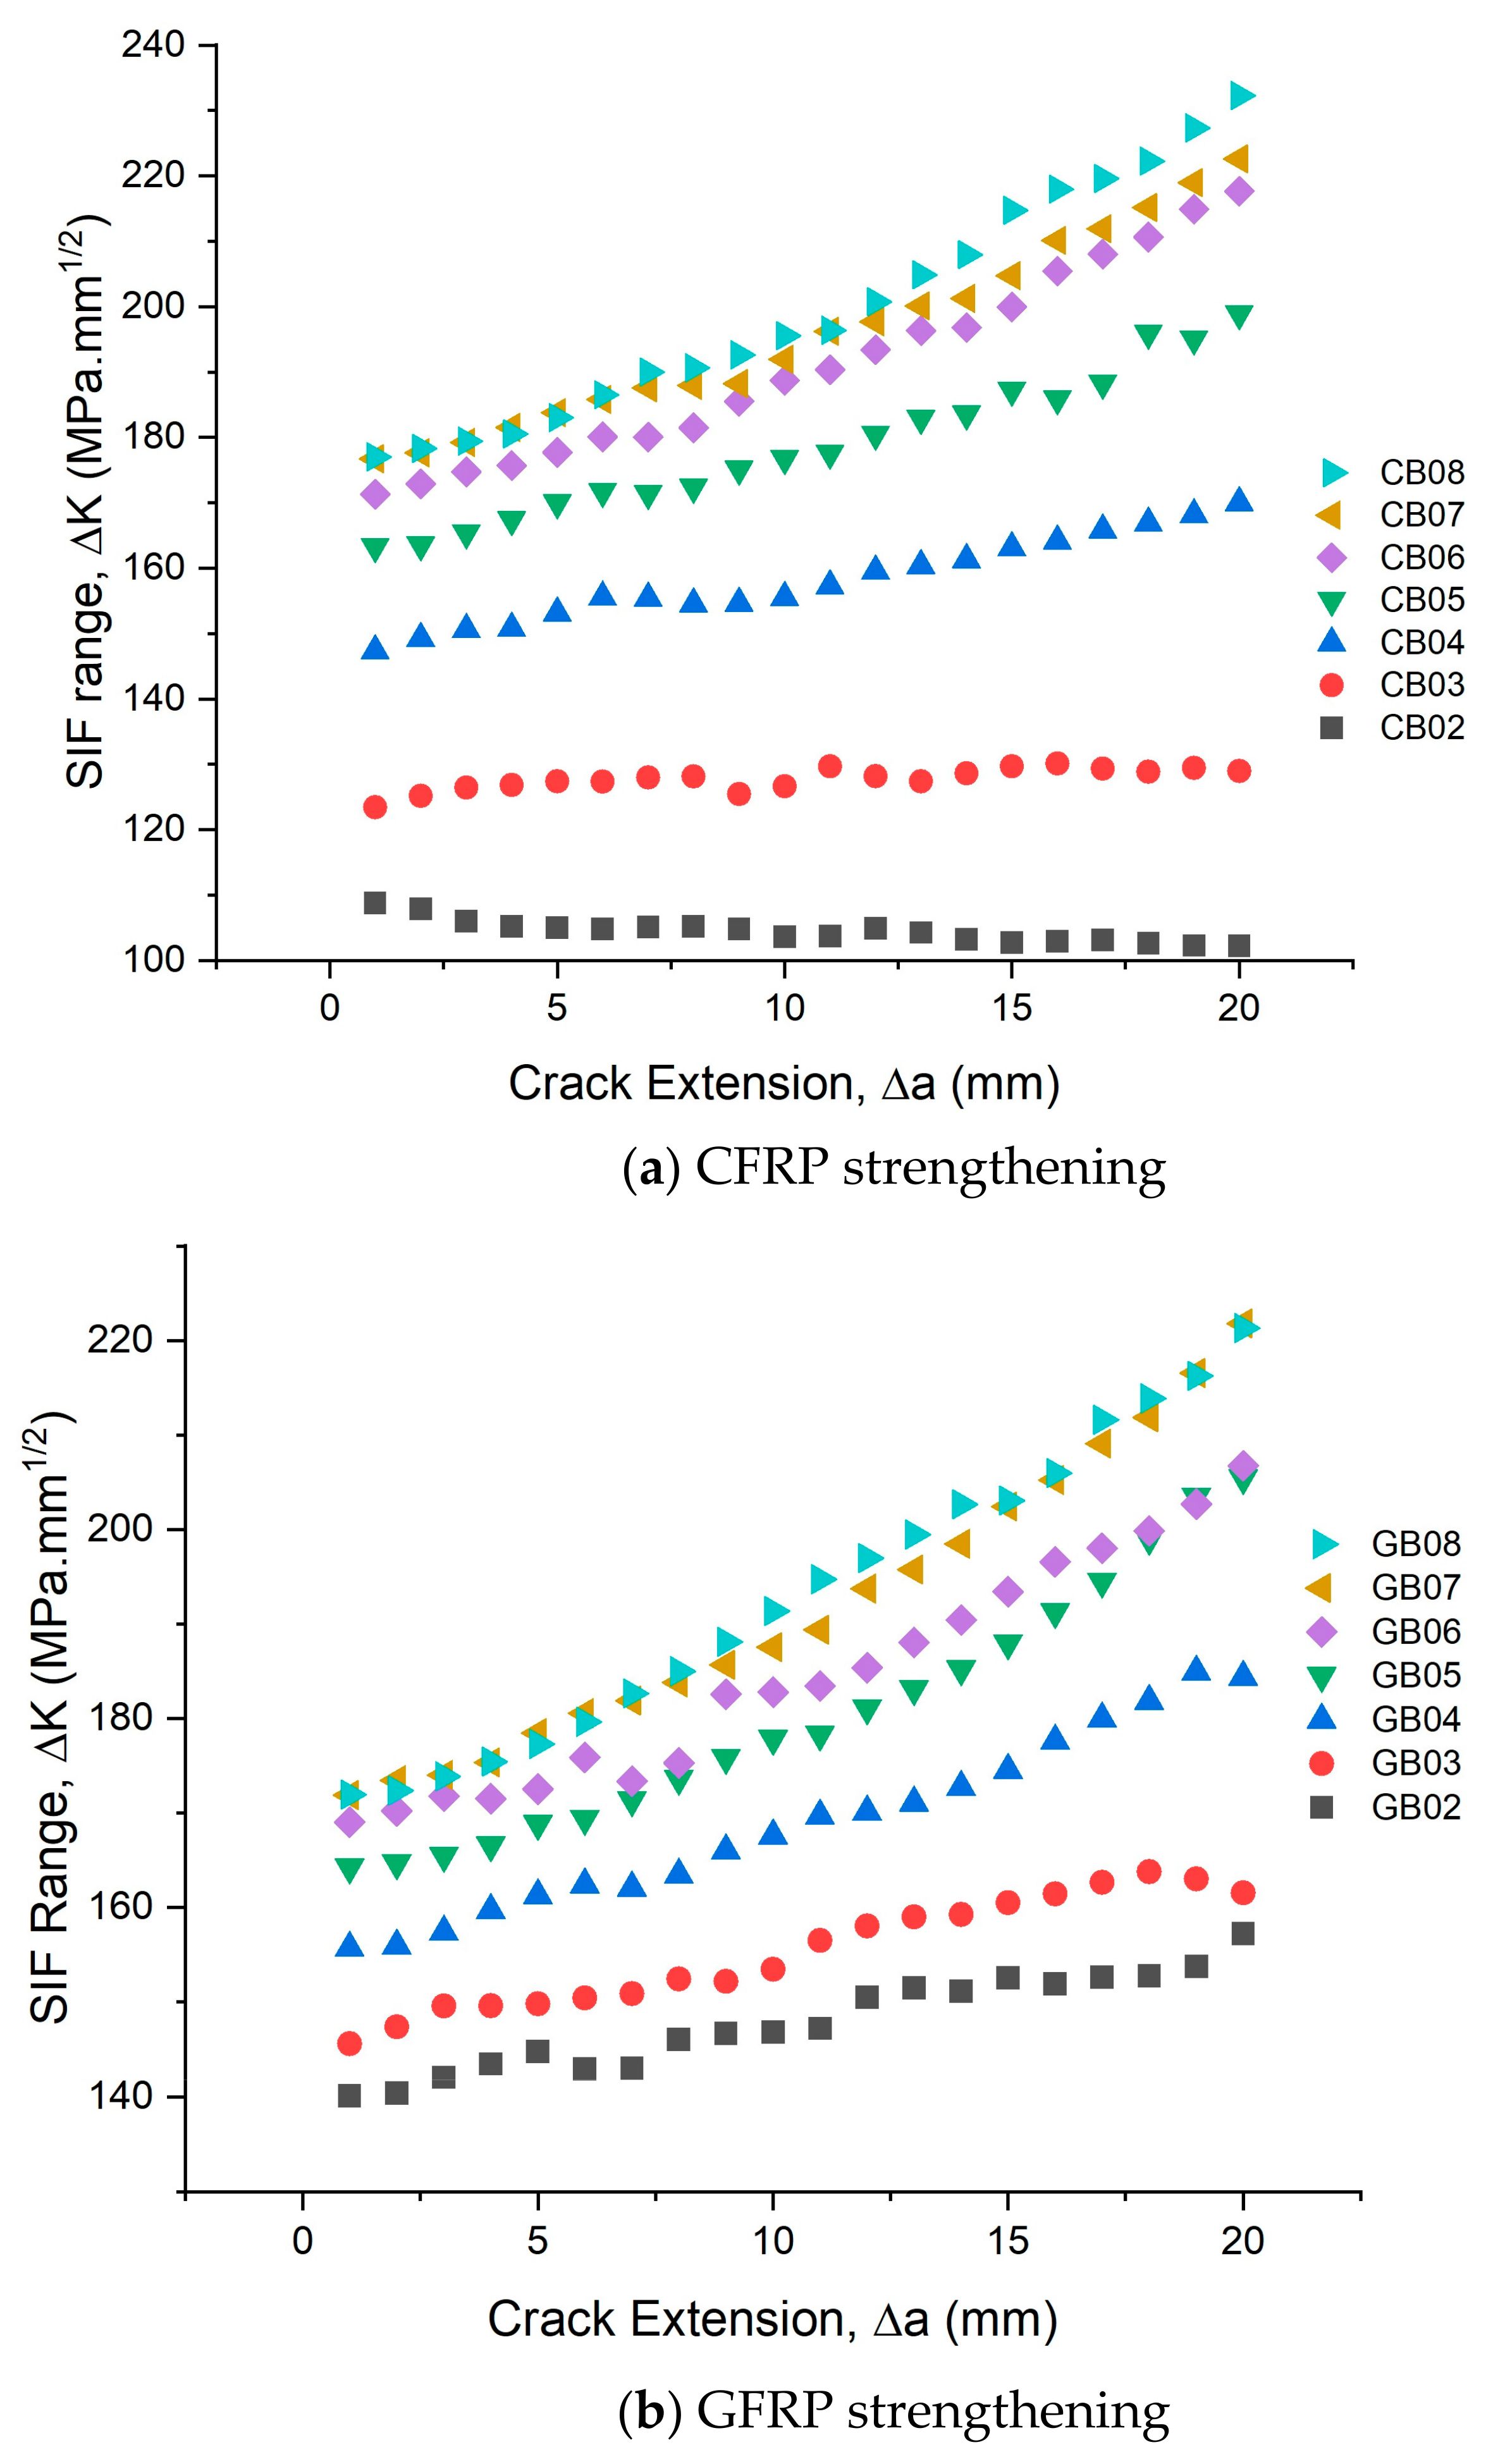
The numerically simulated crack growth curves for the CFRP- and GFRP-strengthened beams are shown in Figure 14. From the graphs, it can be seen that the crack propagation rate is lower for beams CB02 and GB02 and higher for beams CB08 and GB08, which gradually increases from B02 to B08 irrespective of the type of FRP. Therefore, the FRP laminate is highly effective in reducing the SIF when the fibers are oriented in the longitudinal direction (i.e., θ = 0°) and is least effective when the fibers are oriented parallel to the application of the load (i.e., θ = 90°) [61]. The total deformation during the final step of the increase in the crack for beams CB02 and GB02 is given in Figure 15. From comparison of the total deformation, the deformation at the final crack growth for the CFRP- and GFRP-strengthened beams was 0.067 mm and 0.086 mm, respectively, which are 33% and 14% lower when compared to the unstrengthened beam (B01).
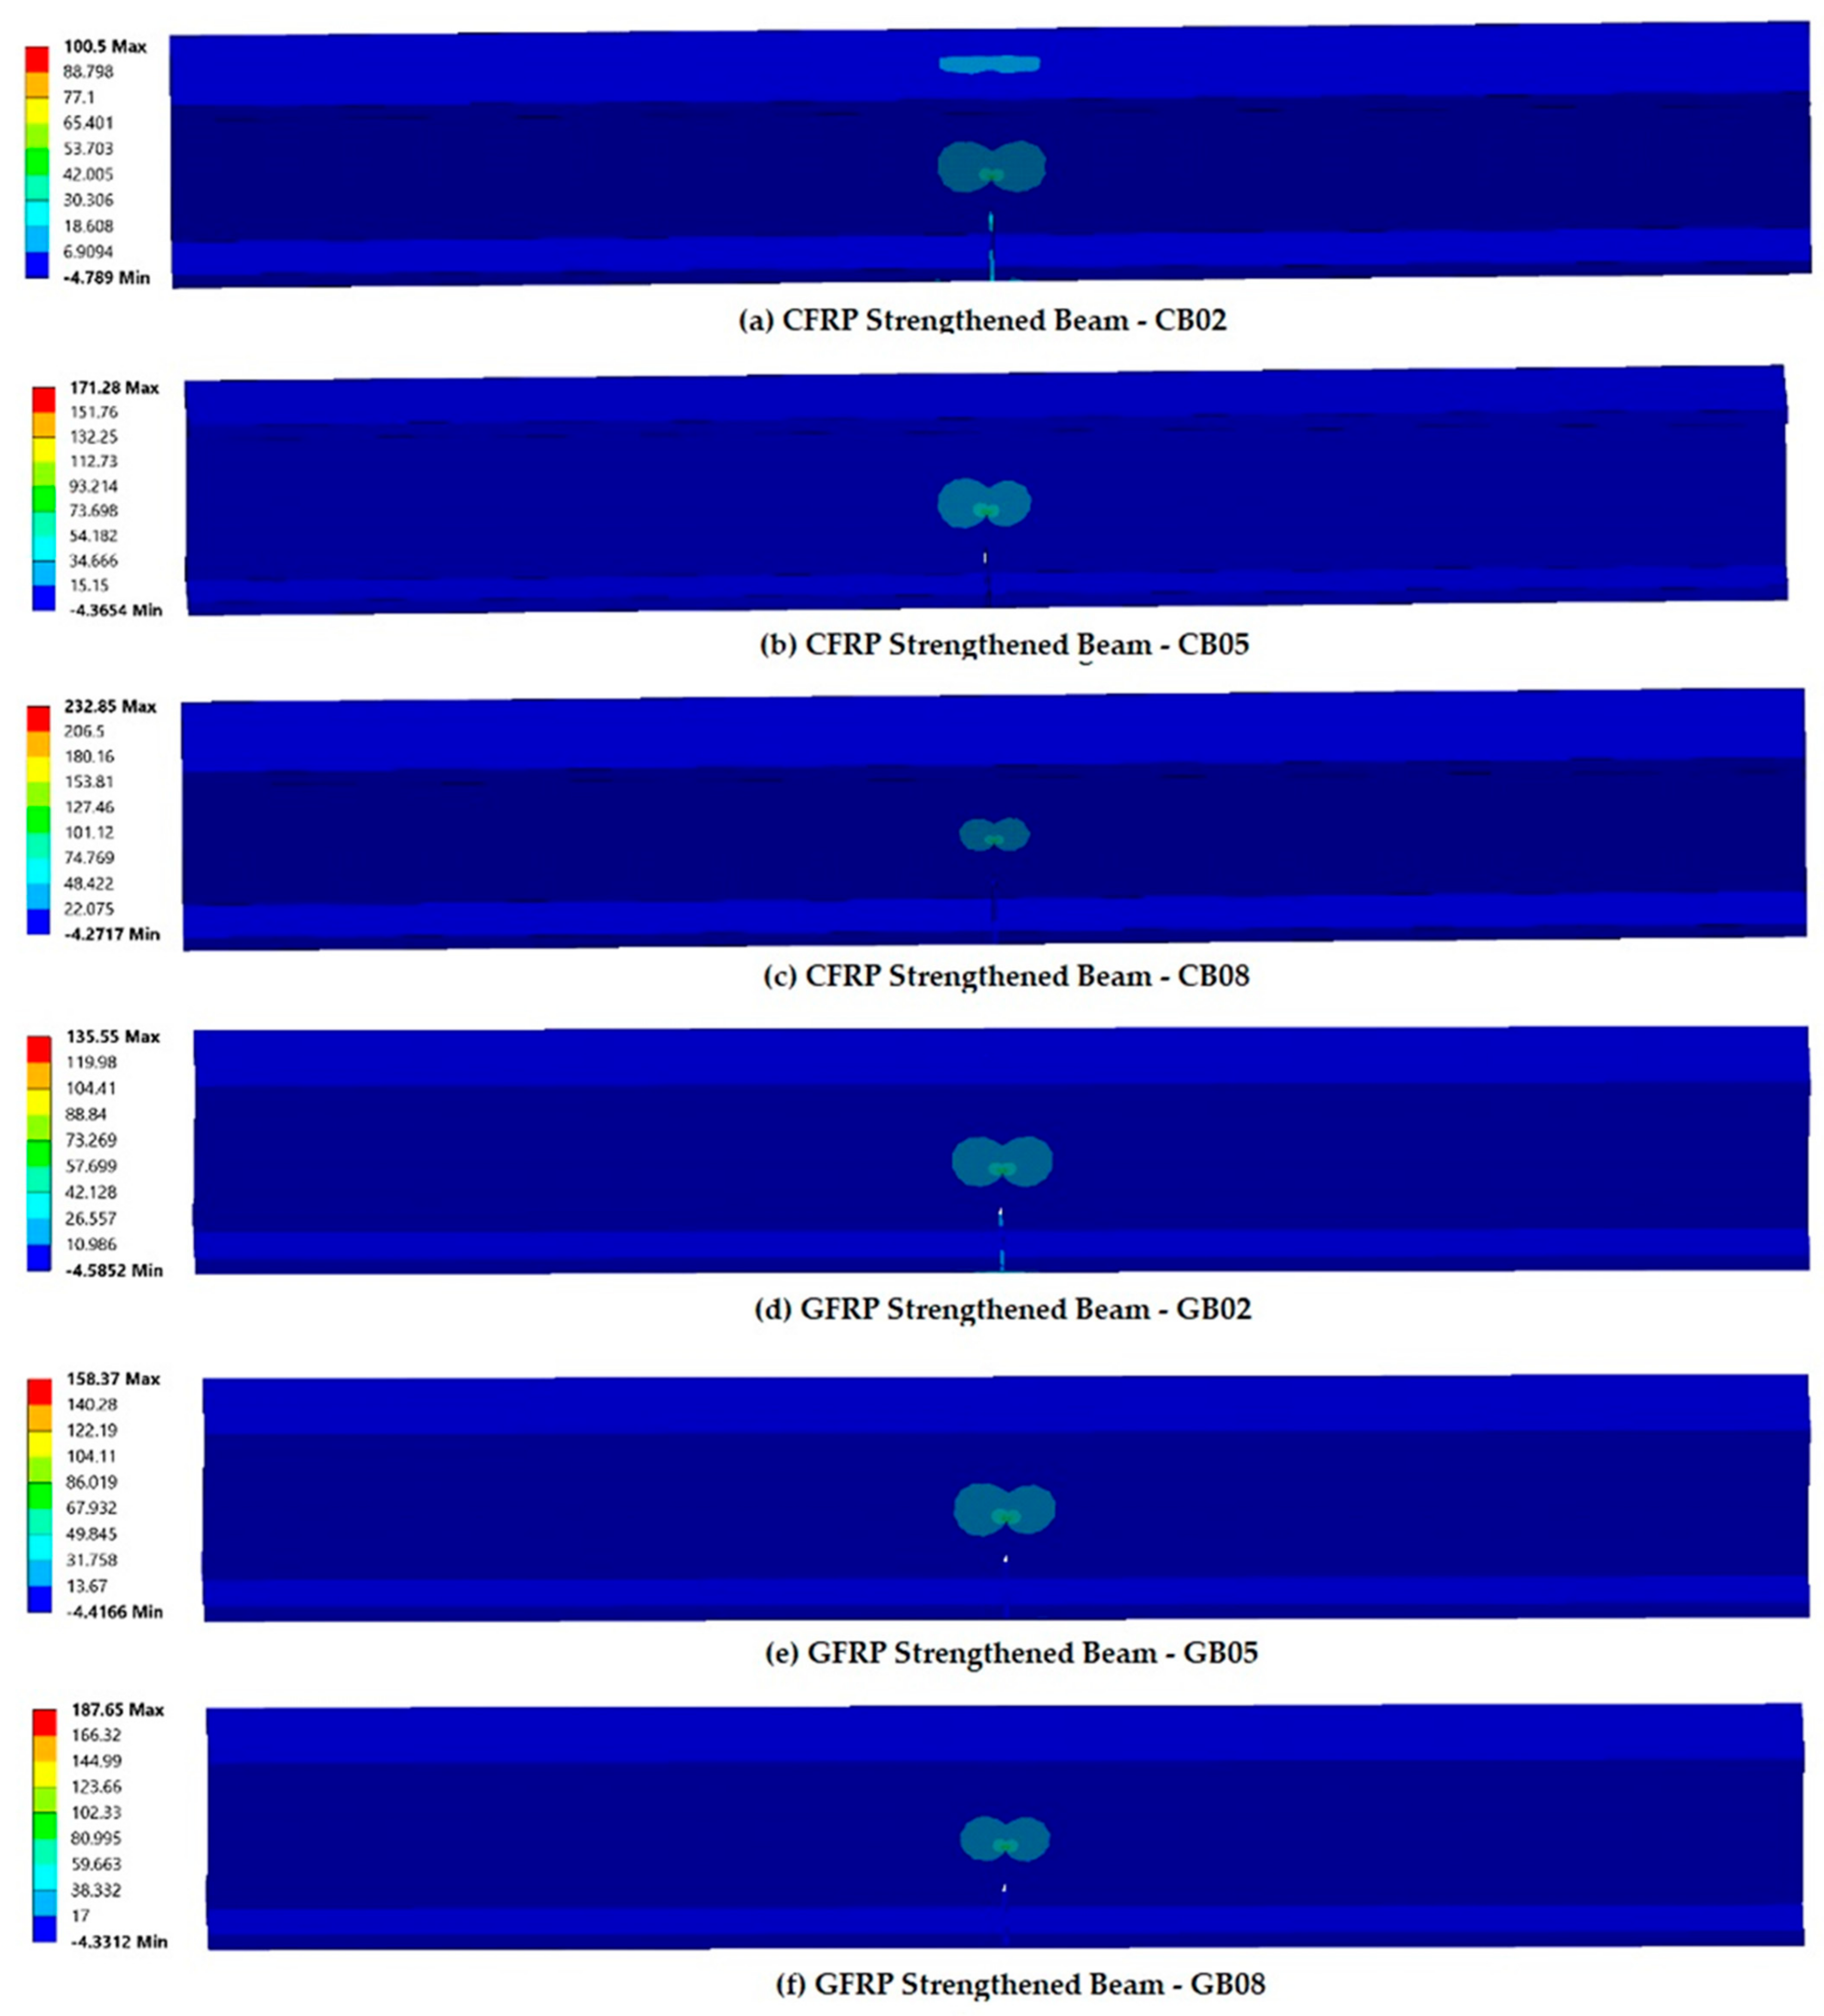
Figure 16 depicts a comparison of the principal stress of the CFRP- and GFRP-strengthened beams. Only three samples from each type of strengthening are shown for brevity and better understanding. From the figure, it can be seen that the principal stress value increases from 63.9 MPa to 232.9 MPa when the orientation of the CFRP laminates increases from 0° to 90°. This shows the reduction in the strengthening efficiency with an increase in the fiber braid angle. Similar observations were made for the GFRP-strengthened beams, for which the principal stress values were 135.6 MPa (i.e., θ = 0°) and 187.7 MPa (i.e., θ = 90°).
Colombi and Fava and Yu and Wu [41,43] extended analytical solutions for the SIF of unstrengthened cracked beams to those of beams strengthened with FRP laminates. They considered the FRP as an isotropic overlay transferring axial compression at the interface. The equation governing this extension is given in Equation (9):
K I = M β M I t I I 1 N   β N A t A A 1
where
M’ = M − N.(y)
Here, N is the axial force in the CFRP based on analysis of the transformed section exactly below the crack; A and A* are the cross-sectional areas of the uncracked and cracked steel beams; y is the neutral axis of the cracked steel beam section; and βN is identical to βM. It was assumed that the CFRP had substantially less stiffness than the steel beams in bending. Hence, the stresses in the FRP were not calculated accurately. Additionally, the unidirectional FRP laminates exhibited orthotropic behavior due to their pronounced fiber alignment [62]. Furthermore, the stress concentration was of a 3D nature, necessitating a 3D model for precise estimation of the SIF. Therefore, a 3D analysis is conducted, and a reduction factor (K‘) for the SIF is numerically calculated using a semi-empirical approach based on Paris’ law, for centrally cracked plates [52] but extended to steel beams in this study.
K = K F R P K u n r e i n f o r c e d
The slowing of the crack growth as per the semi-empirical approach based on Paris’ law is reflected in Figure 17, which depicts the distribution of the SIF over the crack extension for the CFRP- and GFRP-reinforced beams. From these results, it can be observed that the use of carbon/glass FRP could help in reducing the stress intensity factor when the fibers are oriented in the perpendicular direction (i.e., θ = 0°). However, with an increase in the orientation of the fibers, the SIF was found to increase almost linearly with an increase in the extension of the crack (Δa). For instance, the stress intensity factor range corresponding to Δa = 20 mm was 228 MPa. (mm)0.5 and 218 MPa. (mm)0.5 for the CFRP- (CB08) and GFRP-reinforced (GB08) specimens, respectively. However, for the fibers oriented in the perpendicular direction, the range of the SIF was found to show only a marginal increase in the crack width irrespective of the type of FRP. This can be attributed to the effective bridging of the fibers of the opening of a major crack.
The variation in the reduction factor for the SIF, K’, calculated using Equation (10), for the CFRP- and GFRP-strengthened beams is graphically represented in Figure 18. Both the reduction in the crack propagation rate and the SIF extend up to a final crack length of 40 mm, which is mainly due to the stress in the FRP increasing as the crack extends. Considering a specific crack extension of 30 mm, the SIF reduction factor for specimens CB02 and GB02 was 0.36 and 0.57, respectively. However, with an increase in the orientation from 0° to 90° (i.e., the CB08 or GB08 specimen), the stress reduction factor increased by 54.4% (K’CFRP = 0.79) and 31.3% (K’GFRP = 0.83), which shows the ineffectiveness of parallel-oriented fibers in resisting major crack opening.
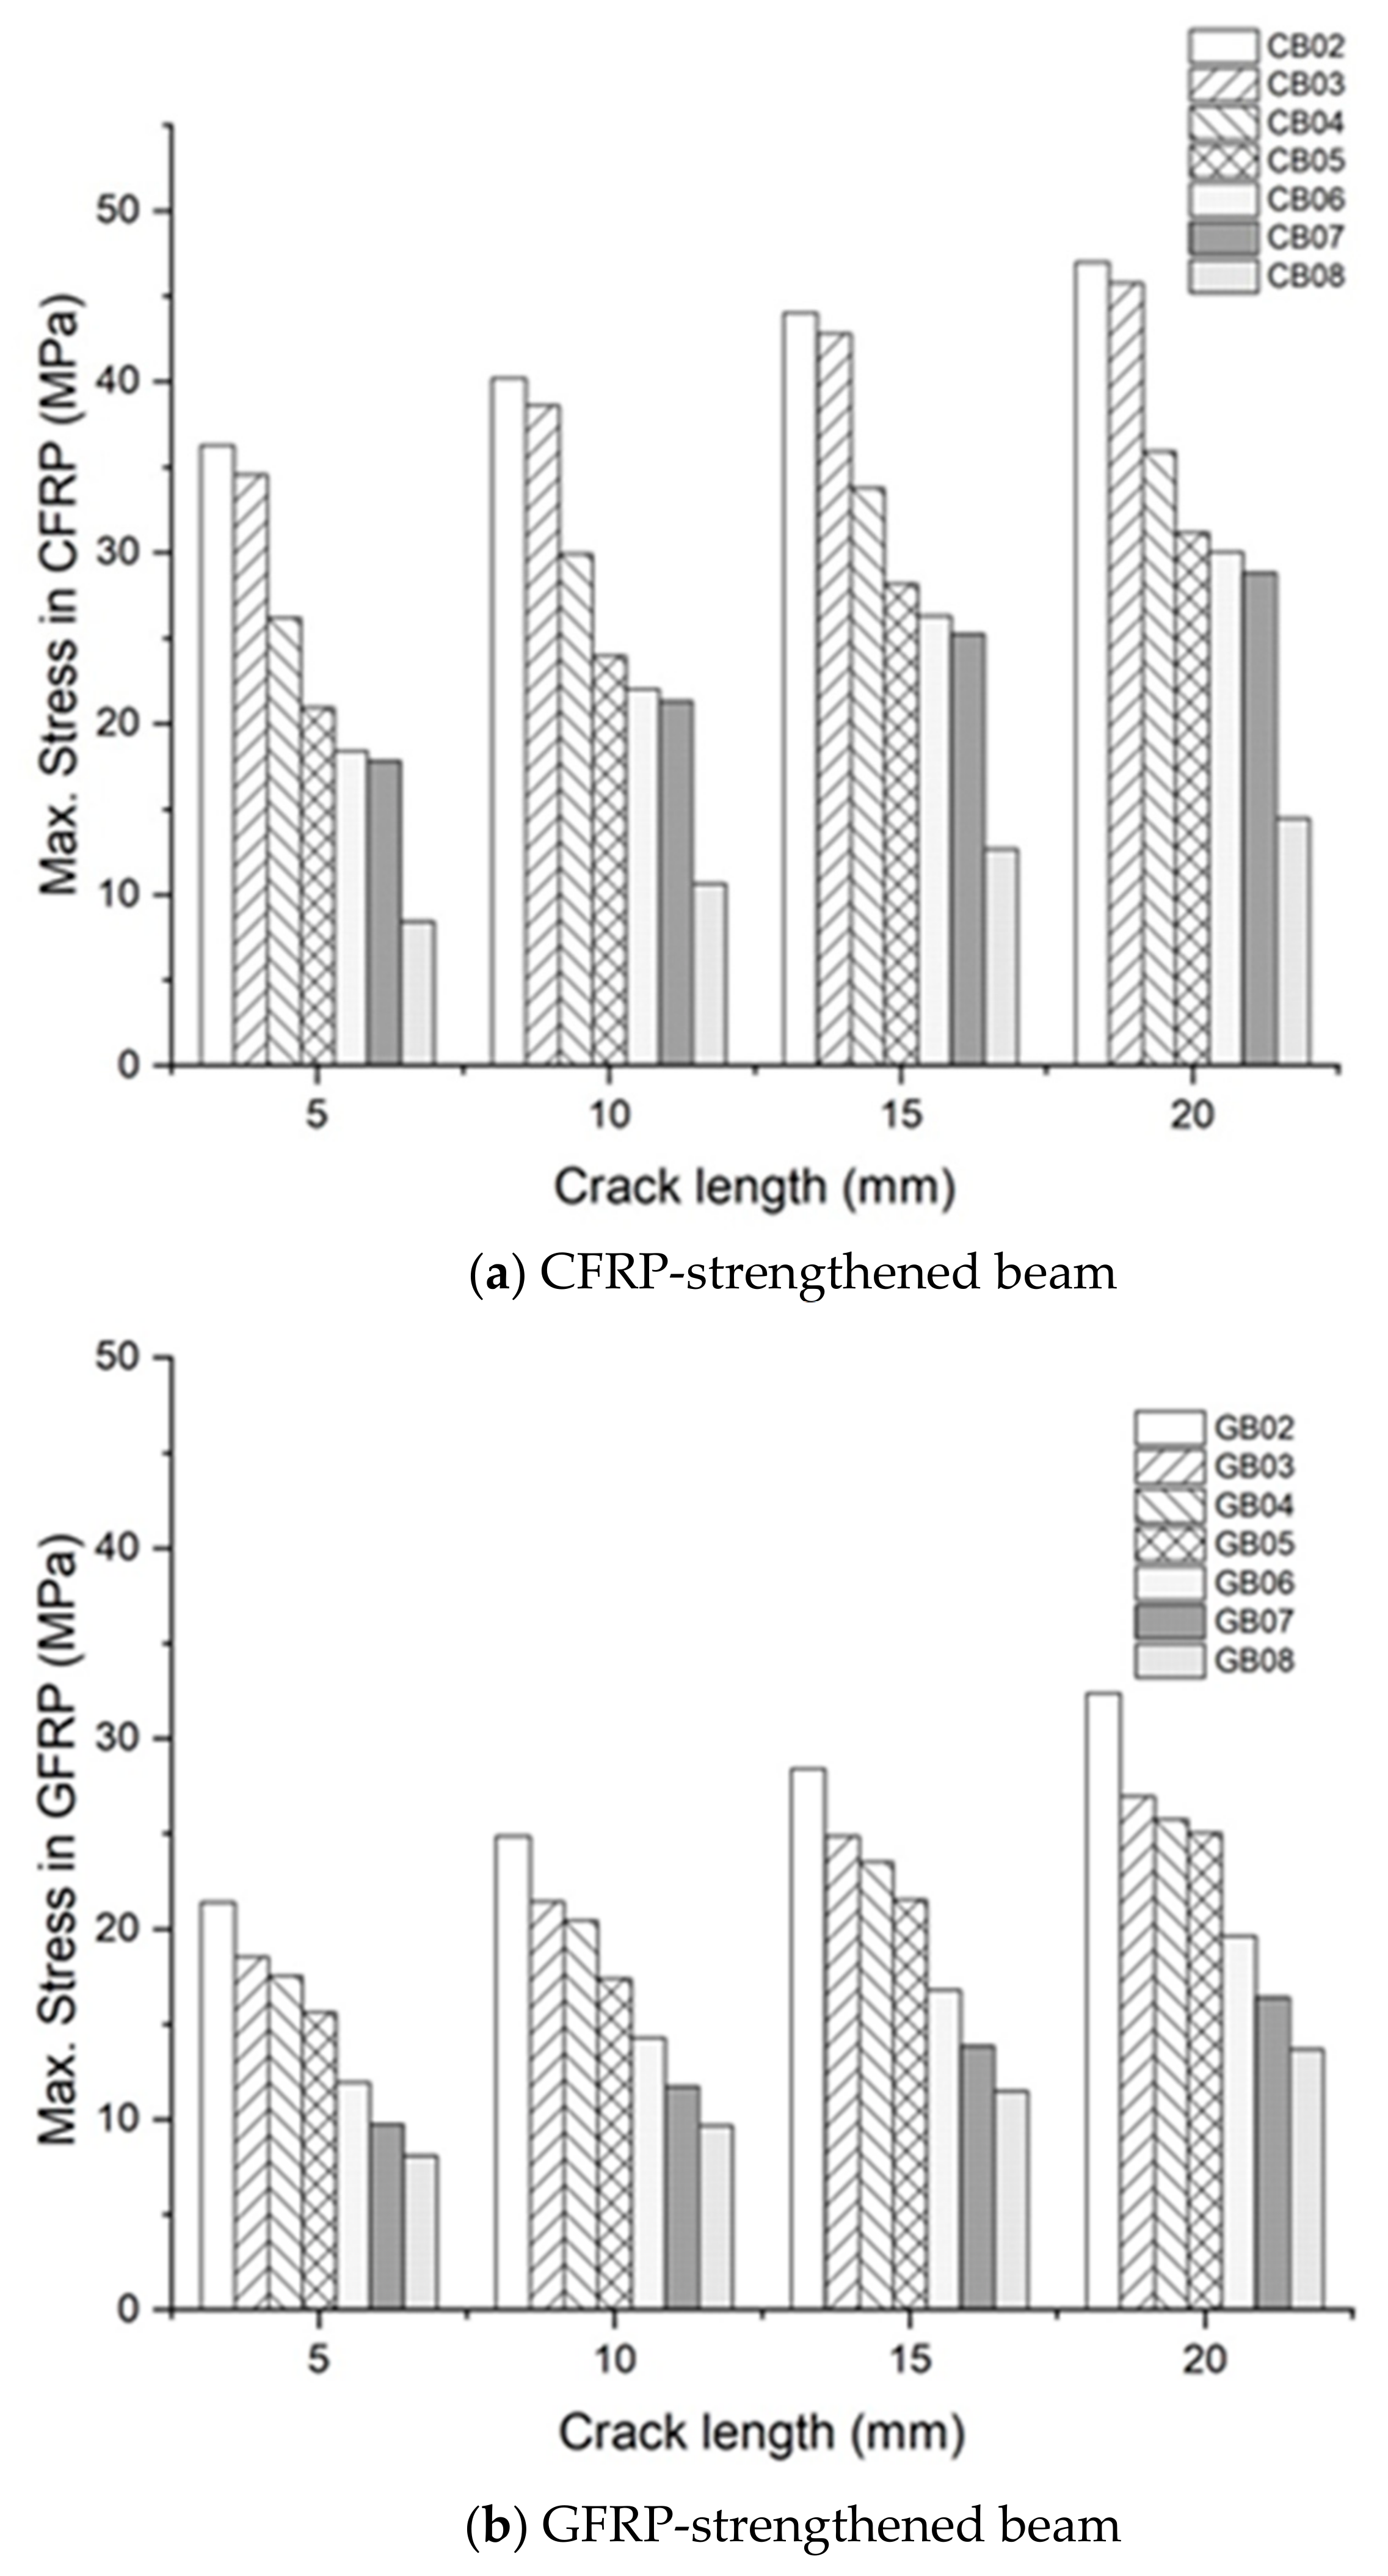
The increase in the FRP stress over the crack length, particularly for 5, 10, 15, and 20 mm, is shown in Figure 19. In general, the variation in the maximum stress in the FRP-strengthened steel beams reduced drastically, irrespective of the type of FRP or the crack length. For the CF02 specimen, the maximum stress in the CFRP corresponding to crack extensions of 5, 10, 15, and 20 mm was 36.5 MPa, 40.2 MPa, 44.5 MPa, and 47.0 MPa, respectively. With an increase in the fiber braid angle from 0° to 90°, the major stress reduced significantly, i.e., for crack extensions of 5, 10, 15, and 20 mm, the maximum stress for the GF08 specimen was 9.5 MPa, 11.0 MPa, 13.8 MPa, and 15.2 MPa, respectively. Similarly, for the GF02 specimen, the maximum stress in the GFRP corresponding to crack extensions of 5, 10, 15, and 20 mm was 21.5 MPa, 25.0 MPa, 28.6 MPa, and 33.0 MPa, respectively.
The fatigue life corresponding to the final crack length of all the beams, along with the life enhancement factor, is given in Table 4. The enhancement factor is the ratio of the number of load cycles for the corresponding beam to that of beam B01. To be specific, the enhancement in the fatigue life achieved due to the CFRP strengthening corresponding to a fiber braid angle of 0° (Specimen ID: CB02) was 15.24 times higher when compared to that of the unstrengthened steel beam (B01). The enhancement factor for CB02 is comparable with that reported in the previous study [45]. Moreover, this CFRP-strengthened beam (CB02) had the highest enhancement factor when compared to the other CFRP specimens with different braid angles. The CFRP-strengthened specimen with a parallel-oriented fiber angle of 90° (CB08) had the lowest enhancement in its fatigue life of 1.64 when compared to the B01 specimen. Comparing CB02 and CB08, the enhancement in the fatigue life was about 9.3 times lower. Unlike the CFRP-strengthened beams, the GFRP-strengthened steel beams achieved a moderate enhancement in their fatigue life improvement factor. Though GFRP-reinforced beam GB02 had a fatigue life nearly 3 times lower than that of CB02, the braid angle changed the behaviors of this CFRP-reinforced beam and the GFRP-reinforced one to similar values.
The variation in the average strain in the FRP throughout the crack growth simulation is depicted in Figure 20. The variation in the strain over the crack growth is similar to the distribution of the SIF range (ΔK) for the CFRP- and GFRP-strengthened beams. The fatigue behavior of beam CB02 was more efficient compared to that of the other FRP-strengthened beams, as well as unstrengthened beam B01. Due to the reduction in the SIF, the reinforced beams exhibited a prolonged fatigue life up to the final crack length. For CFRP-strengthened specimens CB02 (θ = 0°), CB04 (θ = 30°), CB06 (θ = 60°), and CB08 (θ = 90°), the average strain in the CFRP laminates corresponding to a crack width of 20 mm was 1.56 × 10⁻⁵, 2.13 × 10⁻⁵, 2.52 × 10⁻⁵, and 2.61 × 10⁻⁵, respectively. These results show that the average surface strain in the FRP increased with an increase in the fiber braid angle. Similar observations were made for the GFRP-strengthened notched steel beams. To be specific, for the GFRP-strengthened specimens GB02 (θ = 0°), GB04 (θ = 30°), GB06 (θ = 60°), and GB08 (θ = 90°), the average surface strain in the GFRP laminates corresponding to a crack width of 20 mm was 1.98 × 10⁻⁵, 2.21 × 10⁻⁵, 2.38 × 10⁻⁵, and 2.51 × 10⁻⁵, respectively. On the contrary, comparing the similar GFRP- and CFRP-strengthened notched beams (CB02 and GB02), the average surface strain in the GFRP was 26.9% higher when compared to the CFRP-strengthened specimen at a crack length of 20 mm.

4. Conclusions

In this study, the fatigue life of pre-cracked steel beams was studied using a 3D finite element analysis. The model used an effective adaptive meshing tool (SMART) through ANSYS software to simulate the fatigue crack growth in cracked steel I-beams. The results obtained from the FE analysis were validated using the predictions obtained from theoretical equations. Furthermore, the proposed FE model was used to evaluate the fatigue behavior of FRP strengthening to understand design parameters such as the fiber braid angle and FRP type (carbon and glass). The following conclusions can be derived from the outcomes of the present work:
The various challenges associated with the simulation of FRP composites, like their orthotropic response, fiber braid angle, ply thickness, and stacking sequence, are handled using ANSYS ACP, an appropriate tool for modeling advanced composite materials.
From the results of the parametric study, it is evident that the FRP’s tensile stress is greatest for the beams strengthened with FRP and with longitudinally oriented fibers (θ = 0°), and it is minimal for those reinforced with FRP and with transversely oriented fibers, which helps to the delay the crack growth, reduce the SIF, and increase the fatigue life for all the reinforced beams up to the last step of crack growth.
A SIF reduction factor K’ based on a semi-empirical approach and a fatigue life enhancement factor N’ are calculated for all of the FRP-strengthened beams for comparison with the unstrengthened beams.
CFRP exhibits a notably superior performance compared to GFRP, especially regarding the extension of the fatigue life, in the case of longitudinally oriented fibers (θ = 0°). However, an increase in the fiber braid angle (>30°) did not show any significant improvement in the fatigue life of the pre-cracked steel beams.
From the results available in the present work, the following generic design suggestions can be made:
(a)
The use of FRP with longitudinally oriented fibers (θ = 0°) can provide good enhancements to the stress intensity factor and the fatigue life prediction factors of notched steel sections.
(b)
For achievement of the desired fatigue performance, the selection of the type of fiber used in composites holds as a key factor. For heavily distressed structures, the use of carbon FRP can be recommended. However, for lightly or moderately distressed structures, the use of glass FRP is recommended for practical considerations.
(c)
Though the use of FRP composites in enhancing the fatigue life of notched steel beams has been studied, their long-term effectiveness in terms of durability is important and yet to be understood, which will be within scope for further studies.

Author Contributions

Conceptualization, M.T. and P.V.V.; methodology, M.T.; software, M.T.; validation, M.T., P.V.V. and M.C.; formal analysis, M.T.; investigation, M.C. and P.V.V.; resources, M.C.; data curation, M.T.; writing—original draft preparation, M.T.; writing—review and editing, M.C.; visualization, M.T.; supervision, P.V.V. All authors have read and agreed to the published version of the manuscript.

Funding

This research received no external funding.

Data Availability Statement

The data used in this work will be made available by the corresponding author upon reasonable request.

Conflicts of Interest

The authors declare no conflicts of interest.

References

  1. Abeygunasekara, S.; Gamage, J.C.P.; Fawzia, S. Investigation of Crack Repairing Technique to Delay Fracture Initiation of Steel Members Subjected to Low Cycle Fatigue. Buildings 2023, 13, 2958. [Google Scholar] [CrossRef]
  2. Diao, Y.; He, S.; Wang, Y.; Tu, L. Experimental and Numerical Investigations on Stress Concentration Factors of Concrete Filled Steel Tube X-Joints. Sci. Rep. 2024, 14, 11415. [Google Scholar] [CrossRef]
  3. Wang, Q.J.; Chung, Y.W. (Eds.) Fatigue of Materials. In Encyclopedia of Tribology; Springer: Boston, MA, USA, 2013. [Google Scholar] [CrossRef]
  4. Paul Paris, M.G.W.A. A Rational Analytic Theory of Fatigue_Paris_Base Ref. Trend Eng. 1961, 9–14. [Google Scholar]
  5. Wöhler, A. Versuche zur Ermittlung der Auf die Eisenbahnwagenachsen Einwirkenden Kräfte und die Widerstandsfähigkeit der Wagen-Achsen. Z. Für Bauwes. 1860, 10, 583–614. [Google Scholar]
  6. Coffin, L. Fatigue and Endurance of Metals. In Cyclic Deformation and Fatigue of Metals (Russian Translation); USSR: Moscow, Russia, 1963; pp. 257–272. [Google Scholar]
  7. Cui, W. A state-of-the-art review on fatigue life prediction methods for metal structures. J. Mar. Sci. Technol. 2002, 7, 43–56. [Google Scholar] [CrossRef]
  8. Makkonen, M. Predicting the Total Fatigue Life in Metals. Int. J. Fatigue 2009, 31, 1163–1175. [Google Scholar] [CrossRef]
  9. Paris, P.; Director, A.; Erdogan, F. A Critical Analysis of Crack Propagation Laws. J. Basic Eng. 1963, 85, 528–533. [Google Scholar] [CrossRef]
  10. Li, H.F.; Zhang, P.; Wang, B.; Zhang, Z.F. Predictive Fatigue Crack Growth Law of High-Strength Steels. J. Mater. Sci. Technol. 2022, 100, 46–50. [Google Scholar] [CrossRef]
  11. Zhang, K.; Zhang, J.; Jin, W.; Mao, J.; Li, Q.; Xu, F. A Novel Method for Characterizing the Fatigue Crack Propagation of Steel via the Weak Magnetic Effect. Int. J. Fatigue 2021, 146, 106166. [Google Scholar] [CrossRef]
  12. Li, H.F.; Liu, Y.Q.; Zhang, P.; Zhang, Z.F. A Full-Stage Fatigue Crack Growth Model for Metallic Materials. Int. J. Fatigue 2023, 172, 107662. [Google Scholar] [CrossRef]
  13. Li, X.K.; Zhu, S.P.; Liao, D.; Correia, J.A.F.O.; Berto, F.; Wang, Q. Probabilistic Fatigue Modelling of Metallic Materials under Notch and Size Effect Using the Weakest Link Theory. Int. J. Fatigue 2022, 159, 106788. [Google Scholar] [CrossRef]
  14. Faghihi, D.; Sarkar, S.; Naderi, M.; Rankin, J.E.; Hackel, L.; Iyyer, N. A Probabilistic Design Method for Fatigue Life of Metallic Component. ASCE-ASME J. Risk Uncertain. Eng. Syst. Part B Mech. Eng. 2017, 4, 031005. [Google Scholar] [CrossRef]
  15. Liao, D.; Zhu, S.P.; Keshtegar, B.; Qian, G.; Wang, Q. Probabilistic Framework for Fatigue Life Assessment of Notched Components under Size Effects. Int. J. Mech. Sci. 2020, 181, 105685. [Google Scholar] [CrossRef]
  16. Maljaars, J.; Leonetti, D.; Hashemi, B.; Snijder, H. Systematic Derivation of Safety Factors for the Fatigue Design of Steel Bridges. Struct. Saf. 2022, 97, 102229. [Google Scholar] [CrossRef]
  17. Hu, W.; Zhou, B.; Zheng, X. Fatigue Evaluation of CFST Arch Bridge Based on Vehicle–Bridge Coupling Vibration Analysis. Buildings 2024, 14, 1787. [Google Scholar] [CrossRef]
  18. Fett, T. Stress Intensity Factors-T-Stresses-Weight Functions. Supplement Volume; KIT Scientific Publishing: Karlsruhe, Germany, 2014; Volume 55. [Google Scholar]
  19. Tada, H.; Paris, P.C.; Irwin, G.R. The Stress Analysis of Cracks Handbook; American Society of Mechanical Engineers: New York, NY, USA, 1973; Volume 34. [Google Scholar]
  20. Moiler, W.H.; Herrmann, G.; Gao, H. Elementary Strength Theory of Cracked Beams. Theor. Appl. Fract. Mech. 1993, 18, 163–177. [Google Scholar] [CrossRef]
  21. Dunn, M.L.; Suwito, W.; Hunter, B. Stress Intensity Factors for Cracked I-Beams. Eng. Fract. Mech. 1997, 57, 609–615. [Google Scholar] [CrossRef]
  22. Selvaraj, S.; Madhavan, M. Strengthening of Laterally Restrained Steel Beams Subjected to Flexural Loading Using Low-Modulus CFRP. J. Perform. Constr. Facil. 2019, 33, 1–15. [Google Scholar] [CrossRef]
  23. Brindha, U.; Maheswaran, J.; Chellapandian, M.; Arunachelam, N. Quantitative Assessment of Strengthening Strategies and Design Recommendations for the Repair of Corrosion-Damaged Reinforced Concrete Members. Buildings 2023, 13, 1080. [Google Scholar] [CrossRef]
  24. Selvaraj, S.; Madhavan, M. Strengthening of Unsymmetrical Open Channel Built-up Beams Using CFRP. Thin-Walled Struct. 2017, 119, 615–628. [Google Scholar] [CrossRef]
  25. Selvaraj, S.; Madhavan, M. Design of Steel Beams Strengthened with Low-Modulus CFRP Laminates. J. Compos. Constr. 2020, 24, 04019052. [Google Scholar] [CrossRef]
  26. Maheswaran, J.; Chellapandian, M.; Arunachelam, N. Retrofitting of severely damaged RC members using fiber reinforced polymer composites: A comprehensive review. Structures 2022, 38, 1257–1276. [Google Scholar] [CrossRef]
  27. Silwal, P.K.; Parvin, A.; Alhusban, M. Numerical Investigation on Strengthening of Steel Beams for Corrosion Damage or Web Openings Using Carbon Fiber Reinforced Polymer Sheets. Buildings 2024, 14, 1069. [Google Scholar] [CrossRef]
  28. AbouEl-Hamd, O.R.; Sweedan, A.M.I.; El-Ariss, B. Flexural Performance of Steel Beams Strengthened by Fastened Hybrid FRP Strips Utilizing Staggered Steel Bolts. Buildings 2022, 12, 2150. [Google Scholar] [CrossRef]
  29. Keykha, A.H. Structural Performance Evaluation of Deficient Steel Members Strengthened Using CFRP under Combined Tensile, Torsional and Lateral Loading. J. Build. Eng. 2019, 24, 100746. [Google Scholar] [CrossRef]
  30. Yoresta, F.S.; Nhut, P.V.; Nakamoto, D.; Matsumoto, Y. Enhancing Buckling Capacity of Angle Steel Using Unbonded CFRP Laminates Processed by Vacuum-Assisted Resin Transfer Molding (VaRTM). Structures 2022, 41, 173–189. [Google Scholar] [CrossRef]
  31. Chellapandian, M.; Jain, S.; Prakash, S.S.; Sharma, A. Effect of cyclic damage on the performance of RC square columns strengthened using hybrid FRP composites under Axial Compression. Fibers 2019, 7, 90. [Google Scholar] [CrossRef]
  32. Ghafoori, E.; Motavalli, M. Lateral-Torsional Buckling of Steel I-Beams Retrofitted by Bonded and Un-Bonded CFRP Laminates with Different Pre-Stress Levels: Experimental and Numerical Study. Constr. Build. Mater. 2015, 76, 194–206. [Google Scholar] [CrossRef]
  33. Yu, Y.; Chiew, S.P.; Lee, C.K. Bond Failure of Steel Beams Strengthened with FRP Laminates—Part 2: Verification. Compos. Part B Eng. 2011, 42, 1122–1134. [Google Scholar] [CrossRef]
  34. Photiou, N.K.; Hollaway, L.C.; Chryssanthopoulos, M.K. Strengthening of an Artificially Degraded Steel Beam Utilising a Carbon/Glass Composite System. Constr. Build. Mater. 2006, 20, 11–21. [Google Scholar] [CrossRef]
  35. Patil, V.M.; Awati, M.M.; Ahankari, S.S.; Lande, A.C. Enhancing Rolled Steel I Beam Performance Through FRP Strengthening: Analytical and Numerical Modelling for Behavior Prediction. J. Inst. Eng. Ser. A 2024, 105, 563–580. [Google Scholar] [CrossRef]
  36. Fernando, D.; Schumacher, A.; Motavalli, M.; Teng, J.G.; Yu, T.; Ghafoori, E. Fatigue Strengthening of Cracked Steel Beams with CFRP Plates. ASME Int. Mech. Eng. Congr. Expo. Proc. 2010, 9, 271–276. [Google Scholar] [CrossRef]
  37. Wu, G.; Wang, H.-T.; Wu, Z.-S.; Liu, H.-Y.; Ren, Y. Experimental Study on the Fatigue Behavior of Steel Beams Strengthened with Different Fiber-Reinforced Composite Plates. J. Compos. Constr. 2012, 16, 127–137. [Google Scholar] [CrossRef]
  38. Kamruzzaman, M.; Jumaat, M.Z.; Ramli Sulong, N.H.; Islam, A.B.M.S. A Review on Strengthening Steel Beams Using FRP under Fatigue. Sci. World J. 2014, 2014, 702537. [Google Scholar] [CrossRef]
  39. Hu, L.; Feng, P.; Zhao, X.L. Fatigue Design of CFRP Strengthened Steel Members. Thin-Walled Struct. 2017, 119, 482–498. [Google Scholar] [CrossRef]
  40. Bagale, B.R.; Parvin, A. Fiber-Reinforced Polymer Strengthening of Steel Beams under Static and Fatigue Loadings. Pract. Period. Struct. Des. Constr. 2021, 26, 04020046. [Google Scholar] [CrossRef]
  41. Colombi, P.; Fava, G. Fatigue Crack Growth in Steel Beams Strengthened by CFRP Strips. Theor. Appl. Fract. Mech. 2016, 85, 173–182. [Google Scholar] [CrossRef]
  42. Colombi, P.; Fava, G. Experimental Study on the Fatigue Behaviour of Cracked Steel Beams Repaired with CFRP Plates. Eng. Fract. Mech. 2015, 145, 128–142. [Google Scholar] [CrossRef]
  43. Yu, Q.Q.; Wu, Y.F. Fatigue Durability of Cracked Steel Beams Retrofitted with High-Strength Materials. Constr. Build. Mater. 2017, 155, 1188–1197. [Google Scholar] [CrossRef]
  44. Hosseini, S.M.; Melchior, J.; Izadi, M.; Ghafoori, E. Fatigue Crack Arrest in Steel Beams Using FRP Composites. Eng. Fail. Anal. 2021, 127, 105397. [Google Scholar] [CrossRef]
  45. Yu, Q.-Q.; Wu, Y.-F. Fatigue Strengthening of Cracked Steel Beams with Different Configurations and Materials. J. Compos. Constr. 2017, 21, 04016093. [Google Scholar] [CrossRef]
  46. Hmidan, A.; Kim, Y.J.; Yazdani, S. Stress Intensity Factors for Cracked Steel Girders Strengthened with CFRP Sheets. J. Compos. Constr. 2015, 19, 04014085. [Google Scholar] [CrossRef]
  47. Bashiri, A.H.; Alshoaibi, A.M. Adaptive Finite Element Prediction of Fatigue Life and Crack Path in 2d Structural Components. Metals 2020, 10, 1316. [Google Scholar] [CrossRef]
  48. Fageehi, Y.A. Fatigue Crack Growth Analysis with Extended Finite Element for 3d Linear Elastic Material. Metals 2021, 11, 397. [Google Scholar] [CrossRef]
  49. Alshoaibi, A.M.; Ali Fageehi, Y. 3D Modelling of Fatigue Crack Growth and Life Predictions Using ANSYS. Ain Shams Eng. J. 2022, 13, 101636. [Google Scholar] [CrossRef]
  50. Lv, W.; Ding, B.; Zhang, K.; Qin, T. High-Cycle Fatigue Crack Growth in T-Shaped Tubular Joints. Buildings 2023, 13, 2722. [Google Scholar] [CrossRef]
  51. Bergara, A.; Dorado, J.I.; Martin-Meizoso, A.; Martínez-Esnaola, J.M. Fatigue Crack Propagation in Complex Stress Fields: Experiments and Numerical Simulations Using the Extended Finite Element Method (XFEM). Int. J. Fatigue 2017, 103, 112–121. [Google Scholar] [CrossRef]
  52. Lepretre, E.; Chataigner, S.; Dieng, L.; Gaillet, L. Stress Intensity Factor Assessment for the Reinforcement of Cracked Steel Plates Using Prestressed or Non-Prestressed Adhesively Bonded CFRP. Materials 2021, 14, 1625. [Google Scholar] [CrossRef]
  53. Mohajer, M.; Bocciarelli, M.; Colombi, P.; Hosseini, A.; Nussbaumer, A.; Ghafoori, E. Irreversible Cyclic Cohesive Zone Model for Prediction of Mode I Fatigue Crack Growth in CFRP-Strengthened Steel Plates. Theor. Appl. Fract. Mech. 2020, 110, 102804. [Google Scholar] [CrossRef]
  54. Reimers, P. Simulation of Mixed Mode Fatigue Crack Growth. Comput. Struct. 1991, 40, 339–346. [Google Scholar] [CrossRef]
  55. Kim, K.S.; Lee, H.S. An Incremental Formulation for the Prediction of Two-Dimensional Fatigue Crack Growth with Curved Paths. Int. J. Numer. Methods Eng. 2007, 72, 697–721. [Google Scholar] [CrossRef]
  56. ASTMC 273/C 273M-06; Standard Test Method for Shear Properties of Sandwich Core Materials. ITeh Standards: Newark, DE, USA, 2010.
  57. Sajith, S.; Krishna Murthy, K.S.R.; Robi, P.S. Prediction of Accurate Mixed Mode Fatigue Crack Growth Curves Using the Paris’ Law. J. Inst. Eng. Ser. C 2019, 100, 165–174. [Google Scholar] [CrossRef]
  58. Alshoaibi, A.M.; Fageehi, Y.A. Numerical Analysis of Fatigue Crack Growth Path and Life Predictions for Linear Elastic Material. Materials 2020, 13, 3380. [Google Scholar] [CrossRef] [PubMed]
  59. Mlikota, M.; Staib, S.; Schmauder, S.; Božić, Ž. Numerical Determination of Paris Law Constants for Carbon Steel Using a Two-Scale Model. J. Phys. Conf. Ser. 2017, 843, 012042. [Google Scholar] [CrossRef]
  60. ANSYS. Fracture Analysis Guide; ANSYS, Inc.: Canonsburg, PA, USA, 2022. [Google Scholar]
  61. Gürdal, Z.; Haftka, R.T.; Hajela, P. Design and Optimization of Laminated Composite Materials; John Wiley & Sons: Hoboken, NJ, USA, 1999. [Google Scholar]
  62. Jones, R.M. Mechanics of Composite Materials; CRC Press: Boca Raton, FL, USA, 2018. [Google Scholar]
Figure 1. Stepwise procedure to determine the fatigue life of pre-cracked steel beams.
Buildings 14 03063 g001
Figure 2. Local coordinate system at the crack tip.
Buildings 14 03063 g002
Figure 3. Geometry and dimensions of Beam 2. (a) Longitudinal section; (b) cross-section with notch details.
Buildings 14 03063 g003
Figure 4. Initial mesh of beam (ID: 2) with an unstructured mesh.
Buildings 14 03063 g004
Figure 5. Comparison of the results and failure modes of tests and numerical studies. (a) Validation of the SIF with experimental and theoretical benchmarks and mesh sensitivity analysis. (b) Experimental failure (Yu and Wu 2017) [45] (at the end). (c) Failure from FE analysis (crack length—75 mm).
Buildings 14 03063 g005
Figure 6. Geometry and dimensions of steel I-beam. (a) Longitudinal section, (b) unstrengthened beam, (c) beam strengthened with FRP laminates at the soffit, and (d) initial 3D meshing.
Buildings 14 03063 g006
Figure 7. Loading protocol used for dynamic analysis in the FEM.
Buildings 14 03063 g007
Figure 8. Comparison of the analytical and numerical results for pre-cracked steel I-beam.
Buildings 14 03063 g008aBuildings 14 03063 g008b
Figure 9. Von Mises distribution of control beam at different stages of crack growth.
Buildings 14 03063 g009
Figure 10. Total deformation of the control beam at different crack increments.
Buildings 14 03063 g010
Figure 11. Meshed model of FRP-strengthened beam.
Buildings 14 03063 g011
Figure 12. Orientation of FRP laminates used in parametric analysis.
Buildings 14 03063 g012
Figure 13. Stress–strain behavior comparison of steel and FRP.
Buildings 14 03063 g013
Figure 14. Fatigue crack propagation curves for FRP-strengthened steel beams.
Buildings 14 03063 g014
Figure 15. Deformation at the last step of crack growth of FRP-strengthened beams.
Buildings 14 03063 g015
Figure 16. Principal stress variation for different FRP-strengthened steel beams.
Buildings 14 03063 g016
Figure 17. Distribution of SIF range over crack length for FRP-strengthened beams.
Buildings 14 03063 g017
Figure 18. Variation in SIF reduction factor over crack length for FRP-strengthened steel beams.
Buildings 14 03063 g018
Figure 19. Variation in FRP stress over crack length for FRP-strengthened steel beams.
Buildings 14 03063 g019
Figure 20. Average strain in FRP vs. crack extension for FRP-strengthened beams.
Buildings 14 03063 g020
Table 1. Comparison of SIF values—numerical, experimental, and theoretical results.
Crack
Extension
Δa (mm)
Experimental
Results
(Yu and Wu [45])
Theoretical
Results
(Dunn)
Numerical Study
SMART
UMM
Error %Default Mesh (5 mm)Error %Default Mesh (1 mm)Error %
52444.852874.373003.614.501058.6163.171163.8459.50
152977.943103.593382.548.991204.5961.181308.3257.84
253014.703432.193760.729.571451.4157.711565.1454.39
353602.943863.294138.857.131878.8251.362007.9648.02
454650.734423.884517.242.112357.5046.702502.7643.42
555606.625165.424893.865.263219.0137.683385.7334.45
Table 2. Properties of steel beam used in FE model.
PropertyValue (Units)Dimensions of Beam (mm)
Yield strength, σy250 MPah = 100
bf = 75 mm
tf =7.2 mm
tw = 4 mm
Tensile strength, σu460 MPa
Young’s modulus, E200 GPa
Poisson’s ratio, ν0.30
Paris’ law coefficient, C3.80 × 10−12
Paris’ law exponent, m2.75
Table 3. Details of parametric study performed on pre-cracked steel beams.
Reinforcing MaterialBeam IDFiber Braid AngleProperties (MPa)
CFRPCB02σt—2450
Ex, Ey, Ez—160,000, 8600, 8600
μxy, μyz, μzx—0.27, 0.42, 0.27
Gxy, Gyz, Gzx—4700, 3100, 4700
CB0315°
CB0430°
CB0545°
CB0660°
CB0775°
CB0890°
GFRPGB02σt—850
Ex, Ey, Ez—45,000, 6250, 6250
μxy, μyz, μzx—0.2, 0.21, 0.2
Gxy, Gyz, Gzx—3630, 2050, 3630
GB0315°
GB0430°
GB0545°
GB0660°
GB0775°
GB0890°
Note: σt—tensile strength of unidirectional FRP laminate; Ex, Ey, Ez—Young’s modulus in x, y, and z directions, respectively; μxy, μyz, μzx—Poisson’s ratio along respective planes; Gxy, Gyz, Gzx—shear moduli along respective planes.
Table 4. Comparison of fatigue lives of all beams at af = 40 mm.
BeamFatigue Life at af = 40 mmFatigue Life Enhancement Factor
B0110,30,087-
CB021,57,00,99615.24
CB0382,66,3898.02
CB0438,95,3833.78
CB0525,17,8372.44
CB0620,18,2811.96
CB0719,53,0971.90
CB0816,84,8991.64
GB0248,22,8834.68
GB0344,53,5154.32
GB0431,19,6483.03
GB0523,38,8342.27
GB0622,93,8472.23
GB0719,08,3621.85
GB0819,23,4161.87
Disclaimer/Publisher’s Note: The statements, opinions and data contained in all publications are solely those of the individual author(s) and contributor(s) and not of MDPI and/or the editor(s). MDPI and/or the editor(s) disclaim responsibility for any injury to people or property resulting from any ideas, methods, instructions or products referred to in the content.