Abstract
To simulate the influence of rainfall on the internal forces of expansive soil slope retaining structures, an approximate calculation method for the humidity stress field of expansive soil is proposed in this study. Considering both rainy and non-rainy conditions, on a high expansive soil slope, a numerical model is constructed for a combining supporting structure, which is composed of upper and lower anti-sliding piles and anchor rods/cable frames. Furthermore, the distribution of internal forces in the retaining structure is studied, and design optimization is performed. The research findings reveal that the bending moment profile along the longitudinal axis of the lower anti-sliding pile demonstrates a distinctive “W” pattern, which is characterized by initial reduction, following augmentation, a subsequent reduction, and final amplification. In contrast, the upper anti-sliding pile experiences an ascending trend, followed by a descending trend, and then a subsequent ascending trend. Interestingly, the introduction of rainfall grants an escalation in both the shear force exerted along the entire length of the upper and lower anti-sliding piles and the bending moment encountered by the lower anti-sliding pile. The determination of the internal force distribution of the expansive soil slope retaining structures under different conditions, using the proposed calculation method, provides a further optimization in their design.
1. Introduction
As a special kind of soil, expanding soil is rich in expansive clay minerals, such as montmorillonite and illite. Under the alternating action of a dry and wet environment, volume expansion and contraction and strength attenuation will occur, which is extremely harmful to the engineering structure. Expansive soil is widely distributed in the western regions of China, including Yunnan, Guangxi [1,2,3], etc. Although researchers worldwide have been committed to developing disaster prevention and reduction technologies and engineering practices for expansive soil areas, many challenges remain unresolved. For instance, many artificially constructed gentle slopes with a gradient of 1:4 to 1:5 are prone to sliding after rainfall. This instability poses serious risks to the construction and operation of highways, railways, and hydraulic engineering projects.
The Nankun Railway, known as the Southwest Artery in China, was designed and constructed in the 1990s. It stretches from Nanning in the east to Kunming in the west, passing through several expansive soil zones along its route [4]. Due to insufficient attention being paid to expansive soil during construction, the Nanning Railway Bureau has invested over hundreds of millions of USD over ten years to address 551 cases of embankment disorders along the 110 km stretch from Nali to Baise. This included issues such as side ditches being squeezed into narrow gaps and sheared-off anti-sliding piles. Among these cases, a particularly representative incident occurred at Linfeng Railway Station, which is situated on a slope composed of expansive soil. Here, the embankment experienced repeated landslides, necessitating subsequent remedial measures and resulting in three cumulative modifications of the slope protection schemes [5]. Such repeated landslides and remediation efforts have not only resulted in significant financial and manpower losses, but have also posed threats to railway operations safety. To ensure the operational safety of the railway, railway authorities eventually adopted a combination of pile–soil walls and anchor rods (cables) with grid beam structures to reinforce high slopes of expansive soil. However, determining the distribution of internal forces on such combination support structures is of significant reference value for slope reinforcement.
As a primary measure against sliding, anti-slide piles are driven through landslide bodies and into slide beds, suitable for shallow- to medium-thickness landslides. They support the sliding forces and stabilize slopes. There are two reinforcement techniques: single-row and double-row pile configurations. Double-row piles are commonly used for supporting large-scale complex slopes. Researchers have studied the effectiveness of double-row anti-slide pile reinforcement on expansive soil slopes [6,7,8,9,10,11]. Sun and Hu [10] employed the finite difference method to analyze these piles on river slopes composed of expansive soil. They found that the technique effectively increased the stability coefficient of the slopes from 1.1 to 1.40 after pile installation. Optimizing pile parameters such as the diameter, length, spacing, and positioning significantly influences reinforcement effects. Scholars [12,13,14,15,16] have focused not only on optimizing these parameters, but also on studying pile–soil interaction models, internal pile forces, structural deformation, and more.
Compared to conventional soil slope support structures, the design of retaining structures for expansive soils necessitates the consideration of the impact of expansive forces. Expansive forces refer to the pressure exerted by the volume expansion of saturated soils against supporting structures. Currently, there is no mature calculation theory for these forces, and they are often determined experimentally. Zhang [17] conducted horizontal expansive force tests on expansive soils, revealing that, within the top 2 m, the distribution follows a parabolic shape, while, below 3.5 m, it tends to be uniform. Richards [18], focusing on concrete retaining walls, observed under natural conditions that horizontal expansive forces form a triangular distribution. Mohamed et al. [19], using field measurements, found that, under lateral constraint conditions, horizontal expansive forces exhibit reverse C-shaped distribution. Khattab et al. [20], through experimental setups inducing the full expansion of soils, monitored the long-term distribution patterns of horizontal expansive forces. Kassiff et al. [21] conducted field and laboratory experiments in order to establish trapezoidal distributions of horizontal expansive forces in soils. Wang et al. [22], using large-scale model tests, studied the lateral expansive pressures of expansive soil retaining walls under deep immersion conditions, identifying a reverse S-shaped distribution pattern. Zhang et al. [23], employing improved measurement devices for expansive forces, determined that, under lateral constraint conditions, the distributions of horizontal expansive forces exhibit trapezoidal and rectangular shapes. Lin et al. [24], focusing on pile–plate structures for expansive soil slopes, utilized indoor model tests to ascertain that horizontal expansive forces follow reverse K-shaped distribution, subsequently deriving formulas for internal forces within the pile bodies of such structures. Yang et al. [25] conducted long-term field monitoring during rainy seasons on multi-tiered composite support structures for high expansive soil slopes in Baise, Guangxi. Their findings revealed distinct patterns in the horizontal expansive forces acting behind the walls, which were observed to follow triangular, rectangular, and trapezoidal distributions. Overall, various forms of distribution for expansive forces behind retaining walls—such as rectangular, trapezoidal, reverse K-shaped, reverse S-shaped, triangular, and parabolic—have been identified through experiments, indicating a lack of unified understanding.
To address drawbacks such as the time-consuming and costly nature of experimental research, as well as inconsistent conclusions, scholars have developed expansive constitutive models. Additionally, they have utilized numerical simulation software to study how expansive soil characteristics affect slope stability and the internal force distribution of support structures. Yang et al. [26] proposed a finite element analysis method considering equivalent expansive forces to study the stability of expansive soil slopes. Pei et al. [1], using Geostudio 2016 software, investigated the impact of moisture content on the stability of expansive soil slopes, revealing variations in stability under different moisture conditions. Wang et al. [27] established a hydraulic coupling model in ABAQUS to study the deformation characteristics of expansive soil slopes under varying water conditions, elucidating the mechanisms through which hydraulic conditions affect slope deformation. Zhang et al. [28] examined the failure characteristics of geogrid-reinforced expansive soil slopes considering the lateral expansion effects. Mei et al. [29] employed finite element methods to study the influence of wetting on expansive soil landslides reinforced with anti-slide piles, focusing solely on soil moisture absorption, without considering the subsequent volumetric expansion of the soil mass. Wang et al. [22] utilized FLAC3D software to simulate double-row anti-slide pile reinforcement of expansive soil slopes, investigating the distribution of internal forces within the piles. The results indicated that the force redistribution of the double-row piles occurred under longitudinal connections. The maximum reduction in pile displacement, at 20.66%, was observed under the X-type connection, accompanied by changes in the internal force distribution within the pile body. The subsequent redistribution of pile forces occurred under the full connection mode, resulting in increased pile displacements of 4.38%, 95.14%, and 82.09% under the transverse and longitudinal connection modes, front and rear full connection modes, and frame full connection mode, respectively.
However, comprehensive research findings on the stability of expansive soil high slopes and the distribution of internal forces in support structures reinforced with both piles and anchors (cables) are scarce in the literature. The design of traditional expansive soil pile–anchor composite retaining structures generally relies on the maximum expansive force derived from long-term field monitoring, applying it as an external load in the calculations for the pile–anchor system [25,30,31,32,33,34,35], which is considered excessively conservative and has limitations in practical applications due to its high costs.
To date, no scholars have utilized a temperature stress field equivalent to a moisture field to model the wet swelling of expansive soil as a foundational criterion for the design of pile–anchor composite structures. Therefore, this paper proposes an approximate method for calculating the humidity stress field of expansive soil, suitable for simulating the influence of soil expansion pressure on the internal forces of slope support structures. A numerical model is constructed, using a specific expansive soil high slope as a case study, to investigate the distribution patterns of internal forces in a support structure consisting of two levels of piles and four levels of anchor (cable) frame beams on the expansive soil high slope. Additionally, this study aims to optimize the pile design in relation to the expansive soil high slope. The findings aim to provide design references for similar support structures on expansive soil high slopes.
2. Materials and Methods
2.1. Model Establishment and Meshing
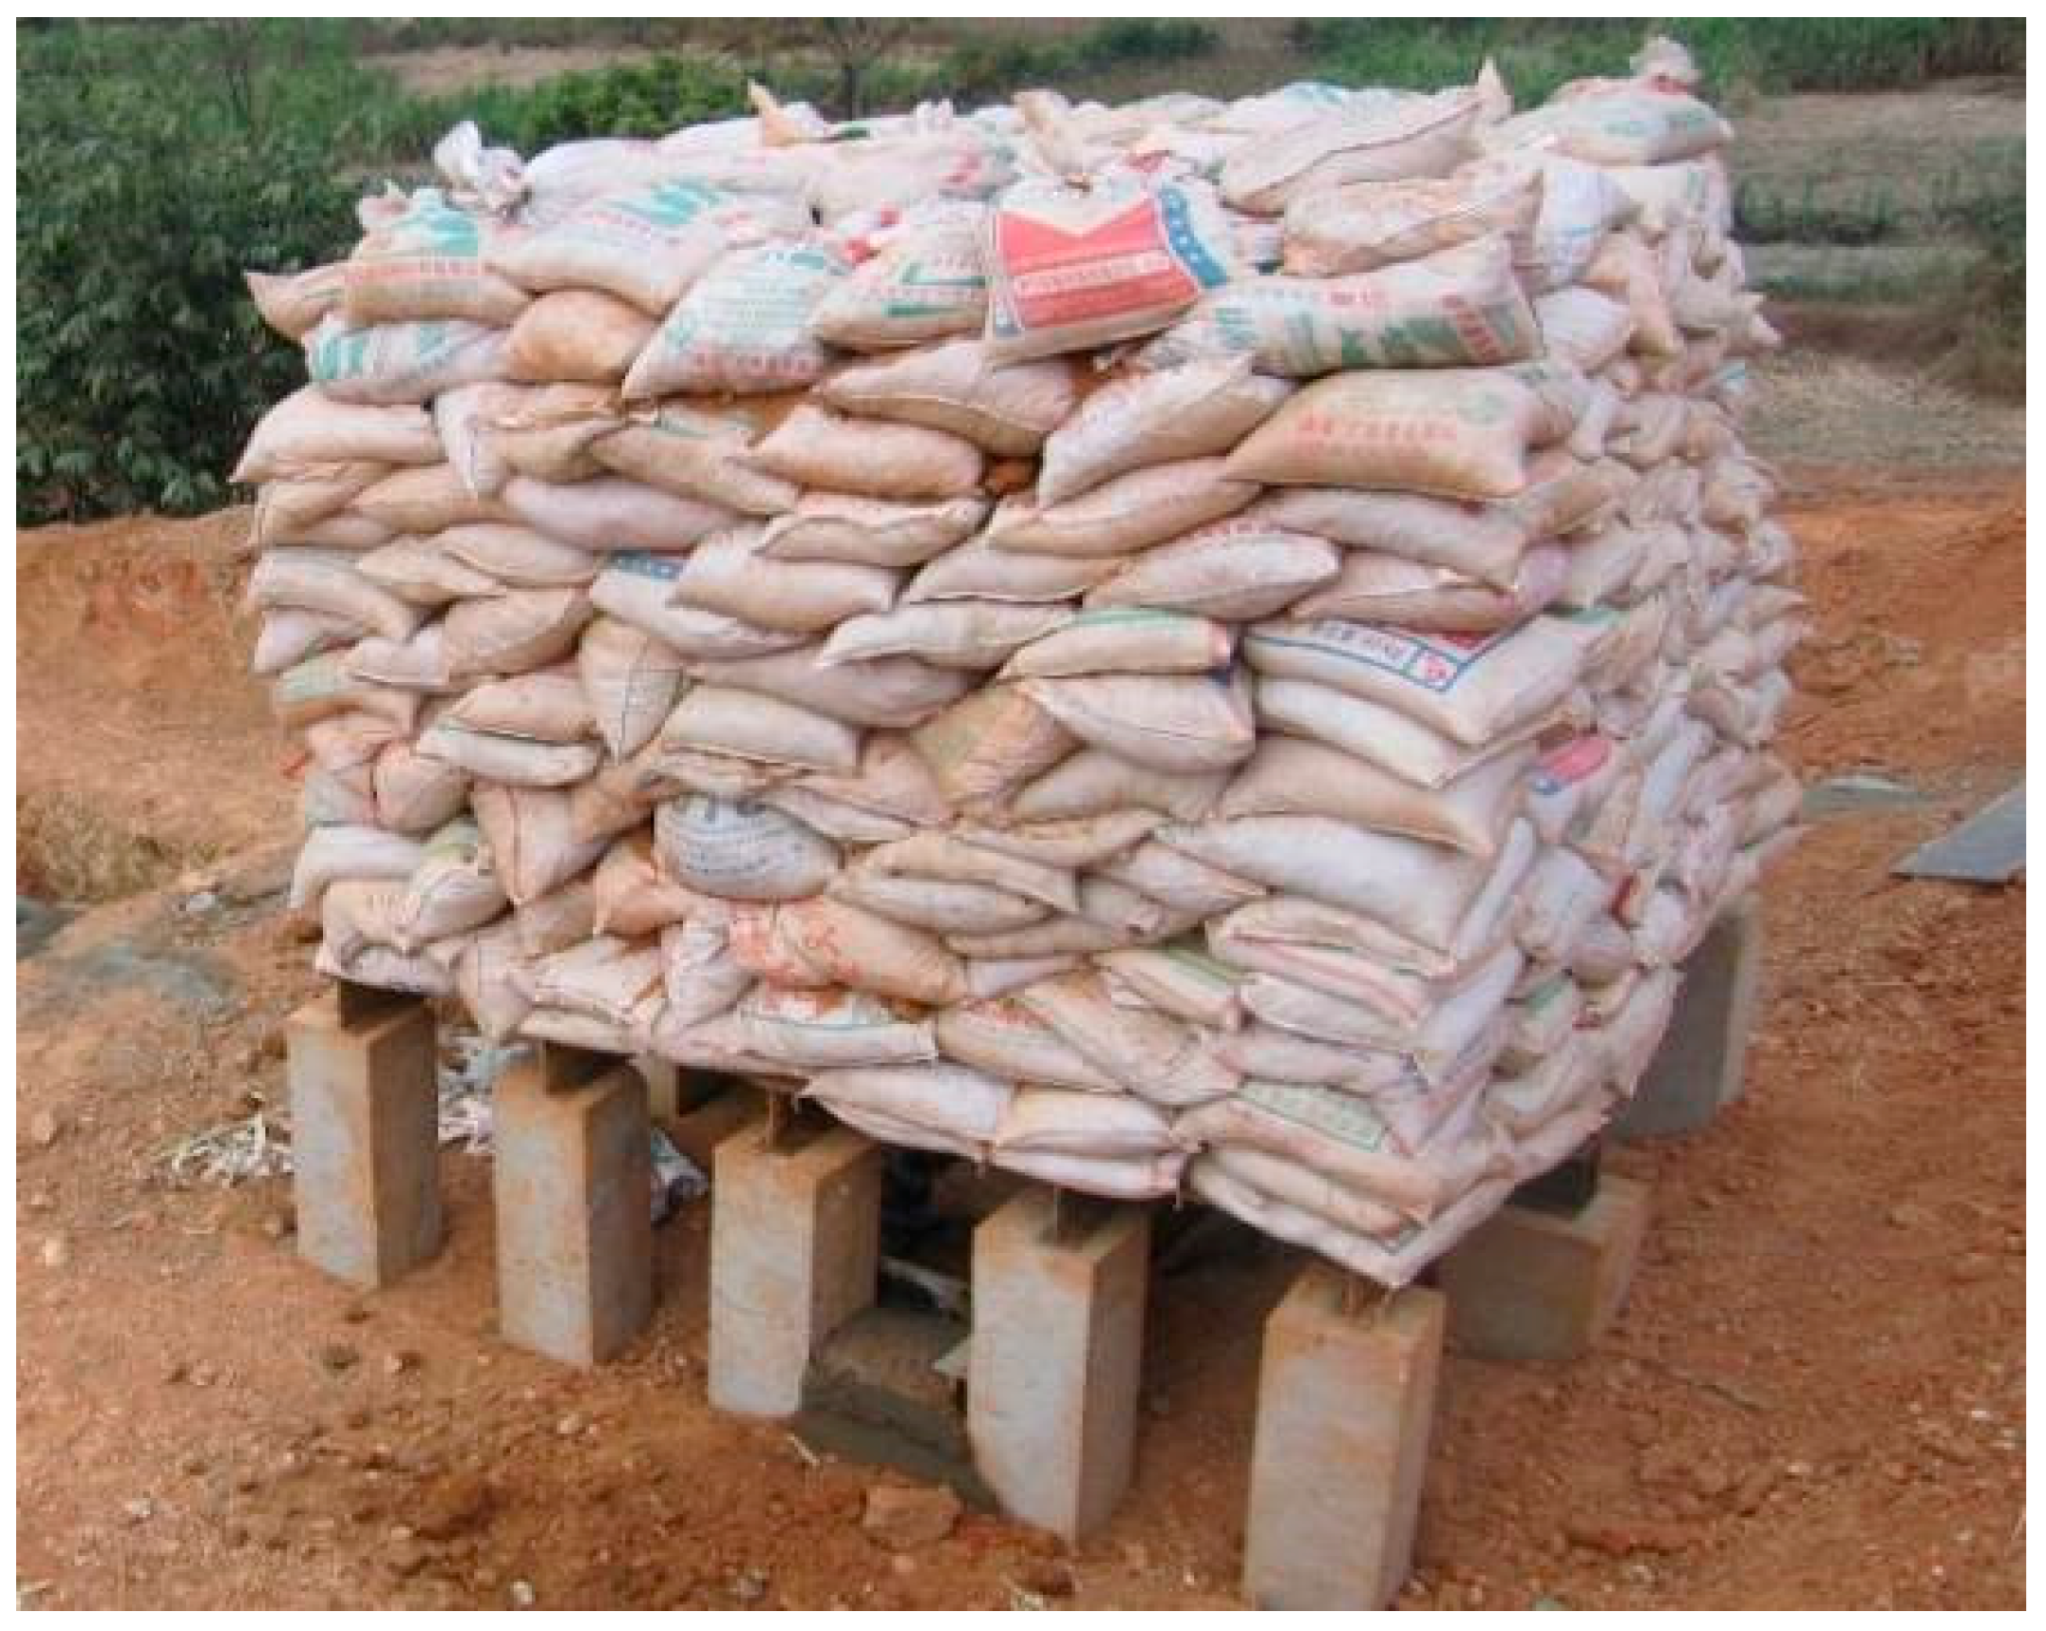
The simulation of the on-site slope (Figure 1) was conducted using the general finite element software ANSYS 2020, and the constructed model is depicted in Figure 2. For elongated entities like slopes, the computational model can be simplified into a plane strain problem. Assuming that the external forces acting on the slope do not vary along the Z-axis, and that displacement and strain occur within the plane of the slope itself, the slope soil can be considered as a plane strain problem during modeling.
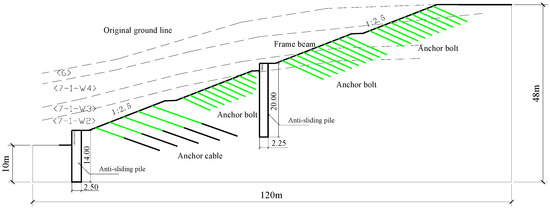
Figure 1.
On-site slope model.
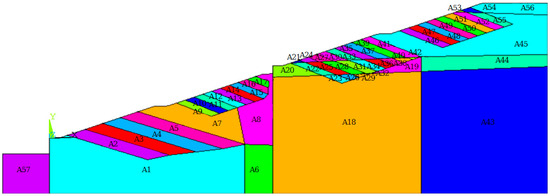
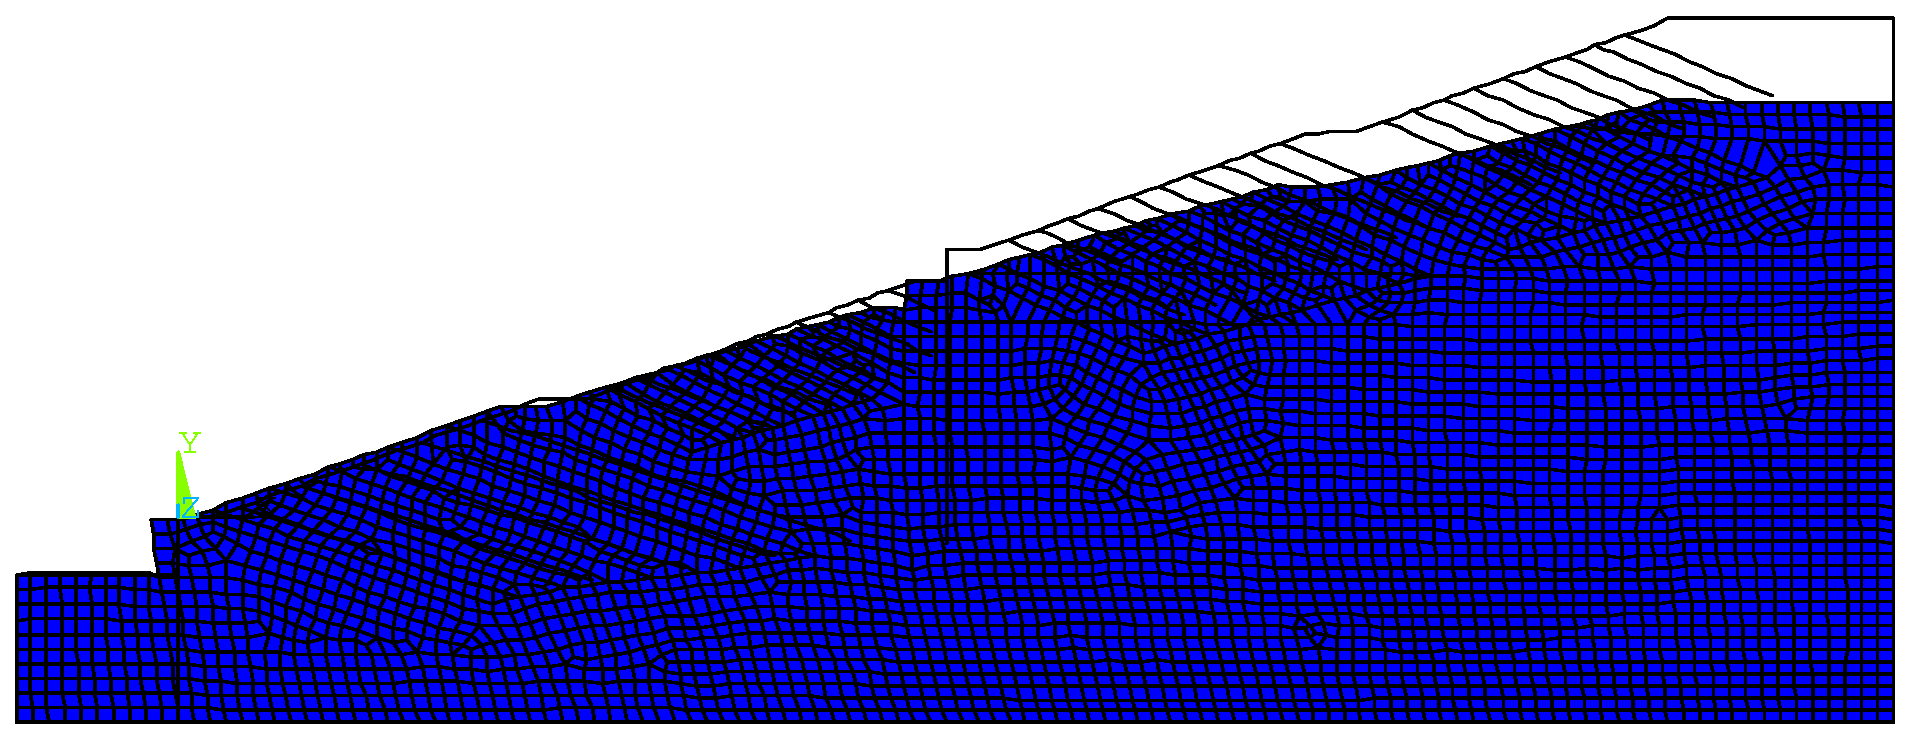
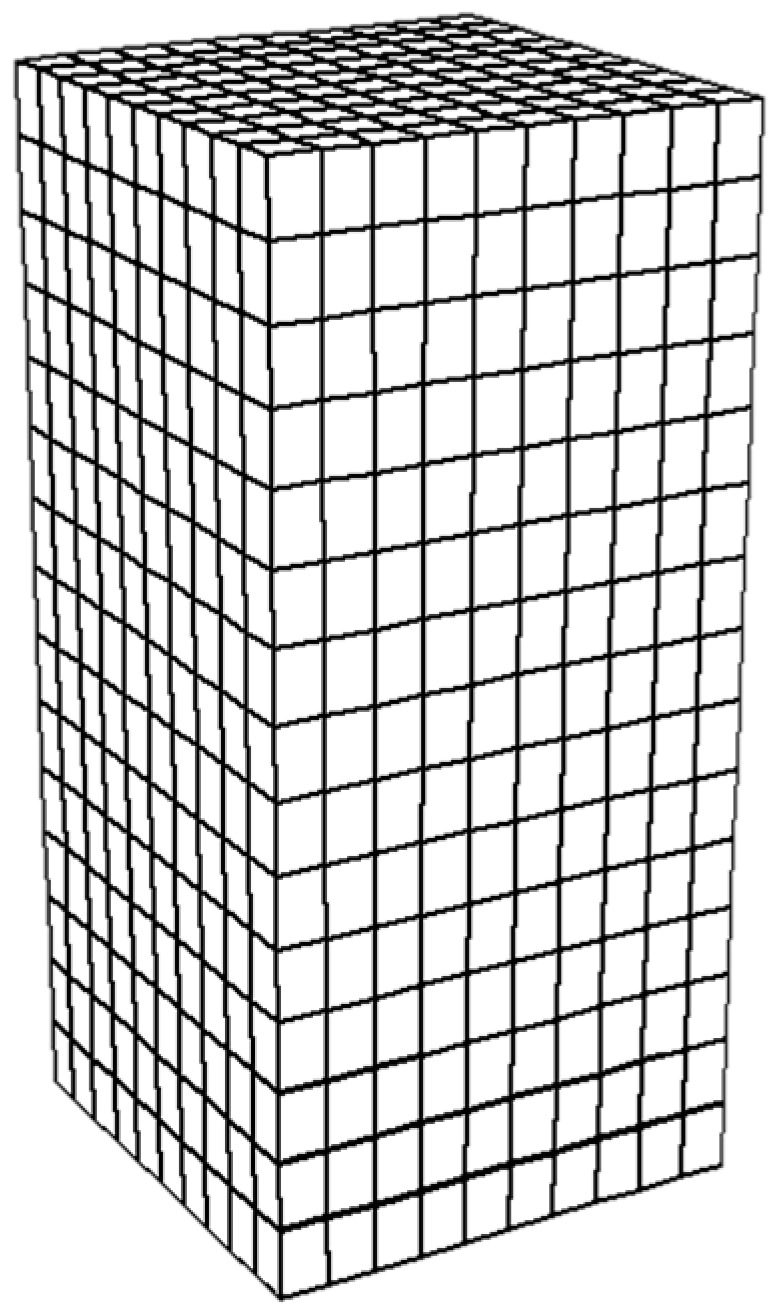
Figure 2.
Finite element model.
The overall length of the model is 120 m, the height is 48 m, and the lower anti-sliding pile has a height of 14 m. The cantilever section of the anti-sliding pile is 4 m long, the upper pile is 20 m long, and the cantilever section is 2 m long. The left side of the first-level anti-sliding pile serves as the roadbed, with a width of 10 m, and the top step width of the slope is set at 14 m. In the model, LINK1 element No. 1 simulates the anchor rod, BEAM3 element No. 1 simulates the anti-sliding pile, PLANE82 element No. 1 simulates the soil, and BEAM3 element No. 2 simulates the frame beam. Considering the scope of the internal anchor rod and other components, the model mesh division is mainly based on the free division of the quadrangle grid and the regional division for different constructs. The accuracy of the simulated grid is 1 m, and the local accuracy of the component is 0.5 m. The meshing of the model primarily consists of freely divided quadrilateral grids, as shown in Figure 3. The model is constrained in the horizontal (X-direction) displacement on both sides and constrained in the horizontal and vertical (X and Y directions) displacement at the bottom, with parameters listed in Table 1.
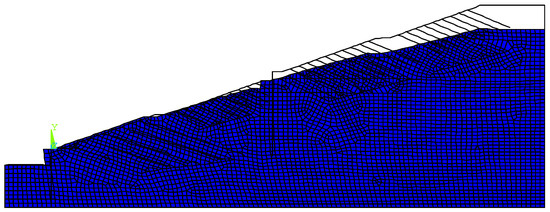
Figure 3.
Slope deformation diagram.

Table 1.
Basic physical and mechanical parameters of high slope.
After meshing, applying boundary conditions, and imposing gravity loads, the influence of expansion deformation was not considered in this calculation. The deformation of the slope is obtained, as shown in Figure 3. Under the action of gravity, the maximum vertical deformation of the slope is 2.908 mm.
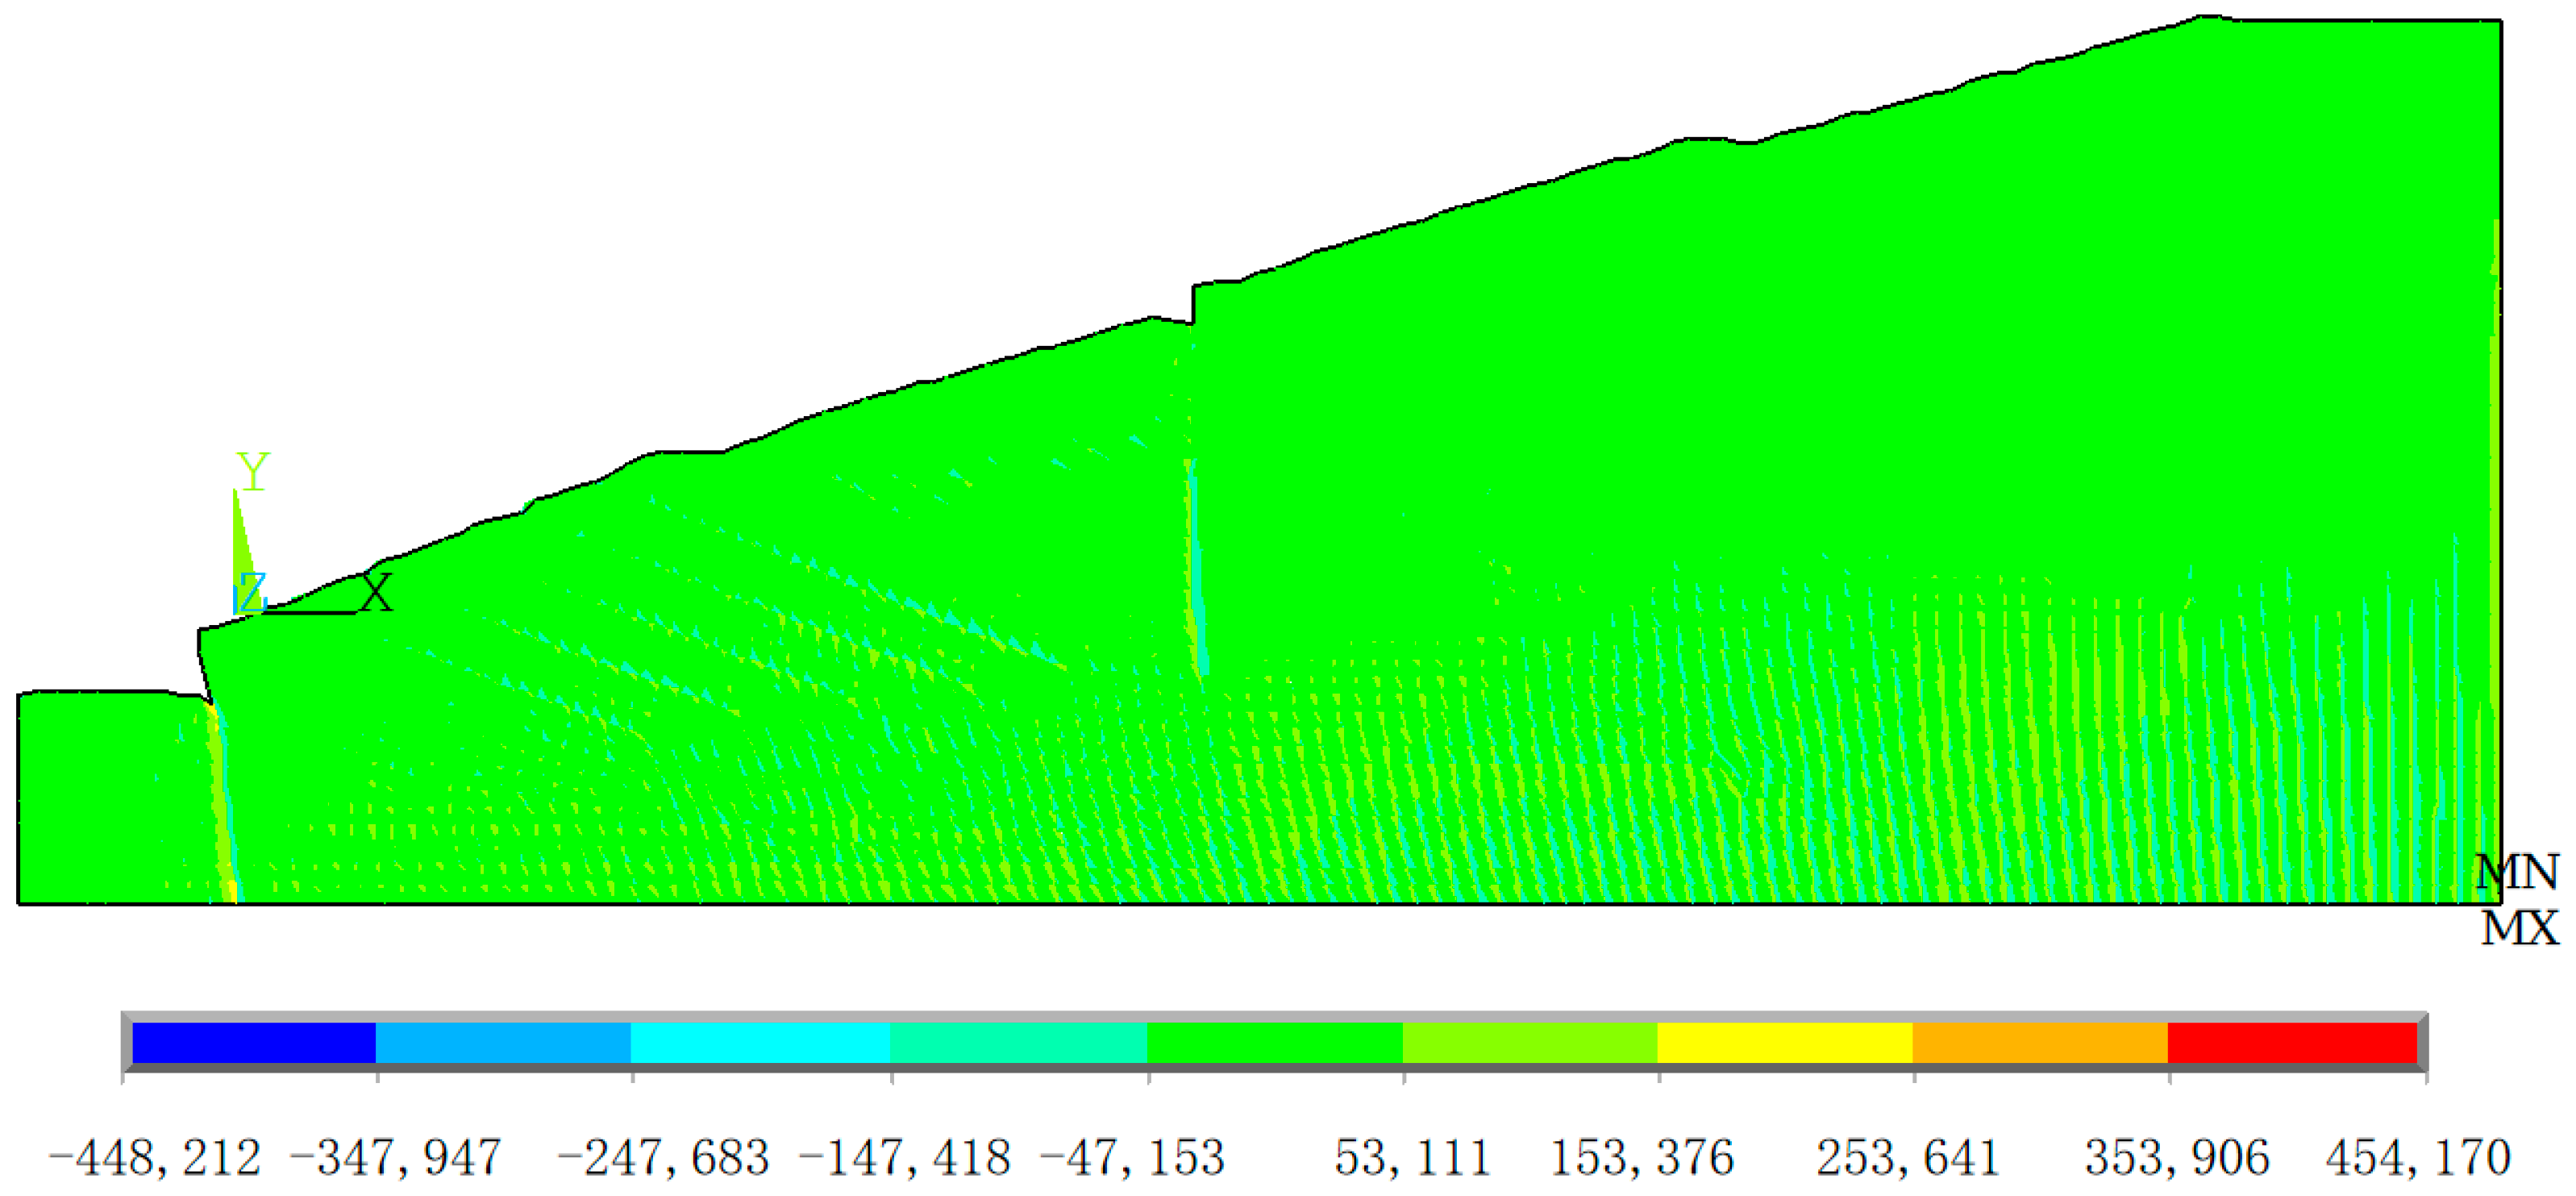
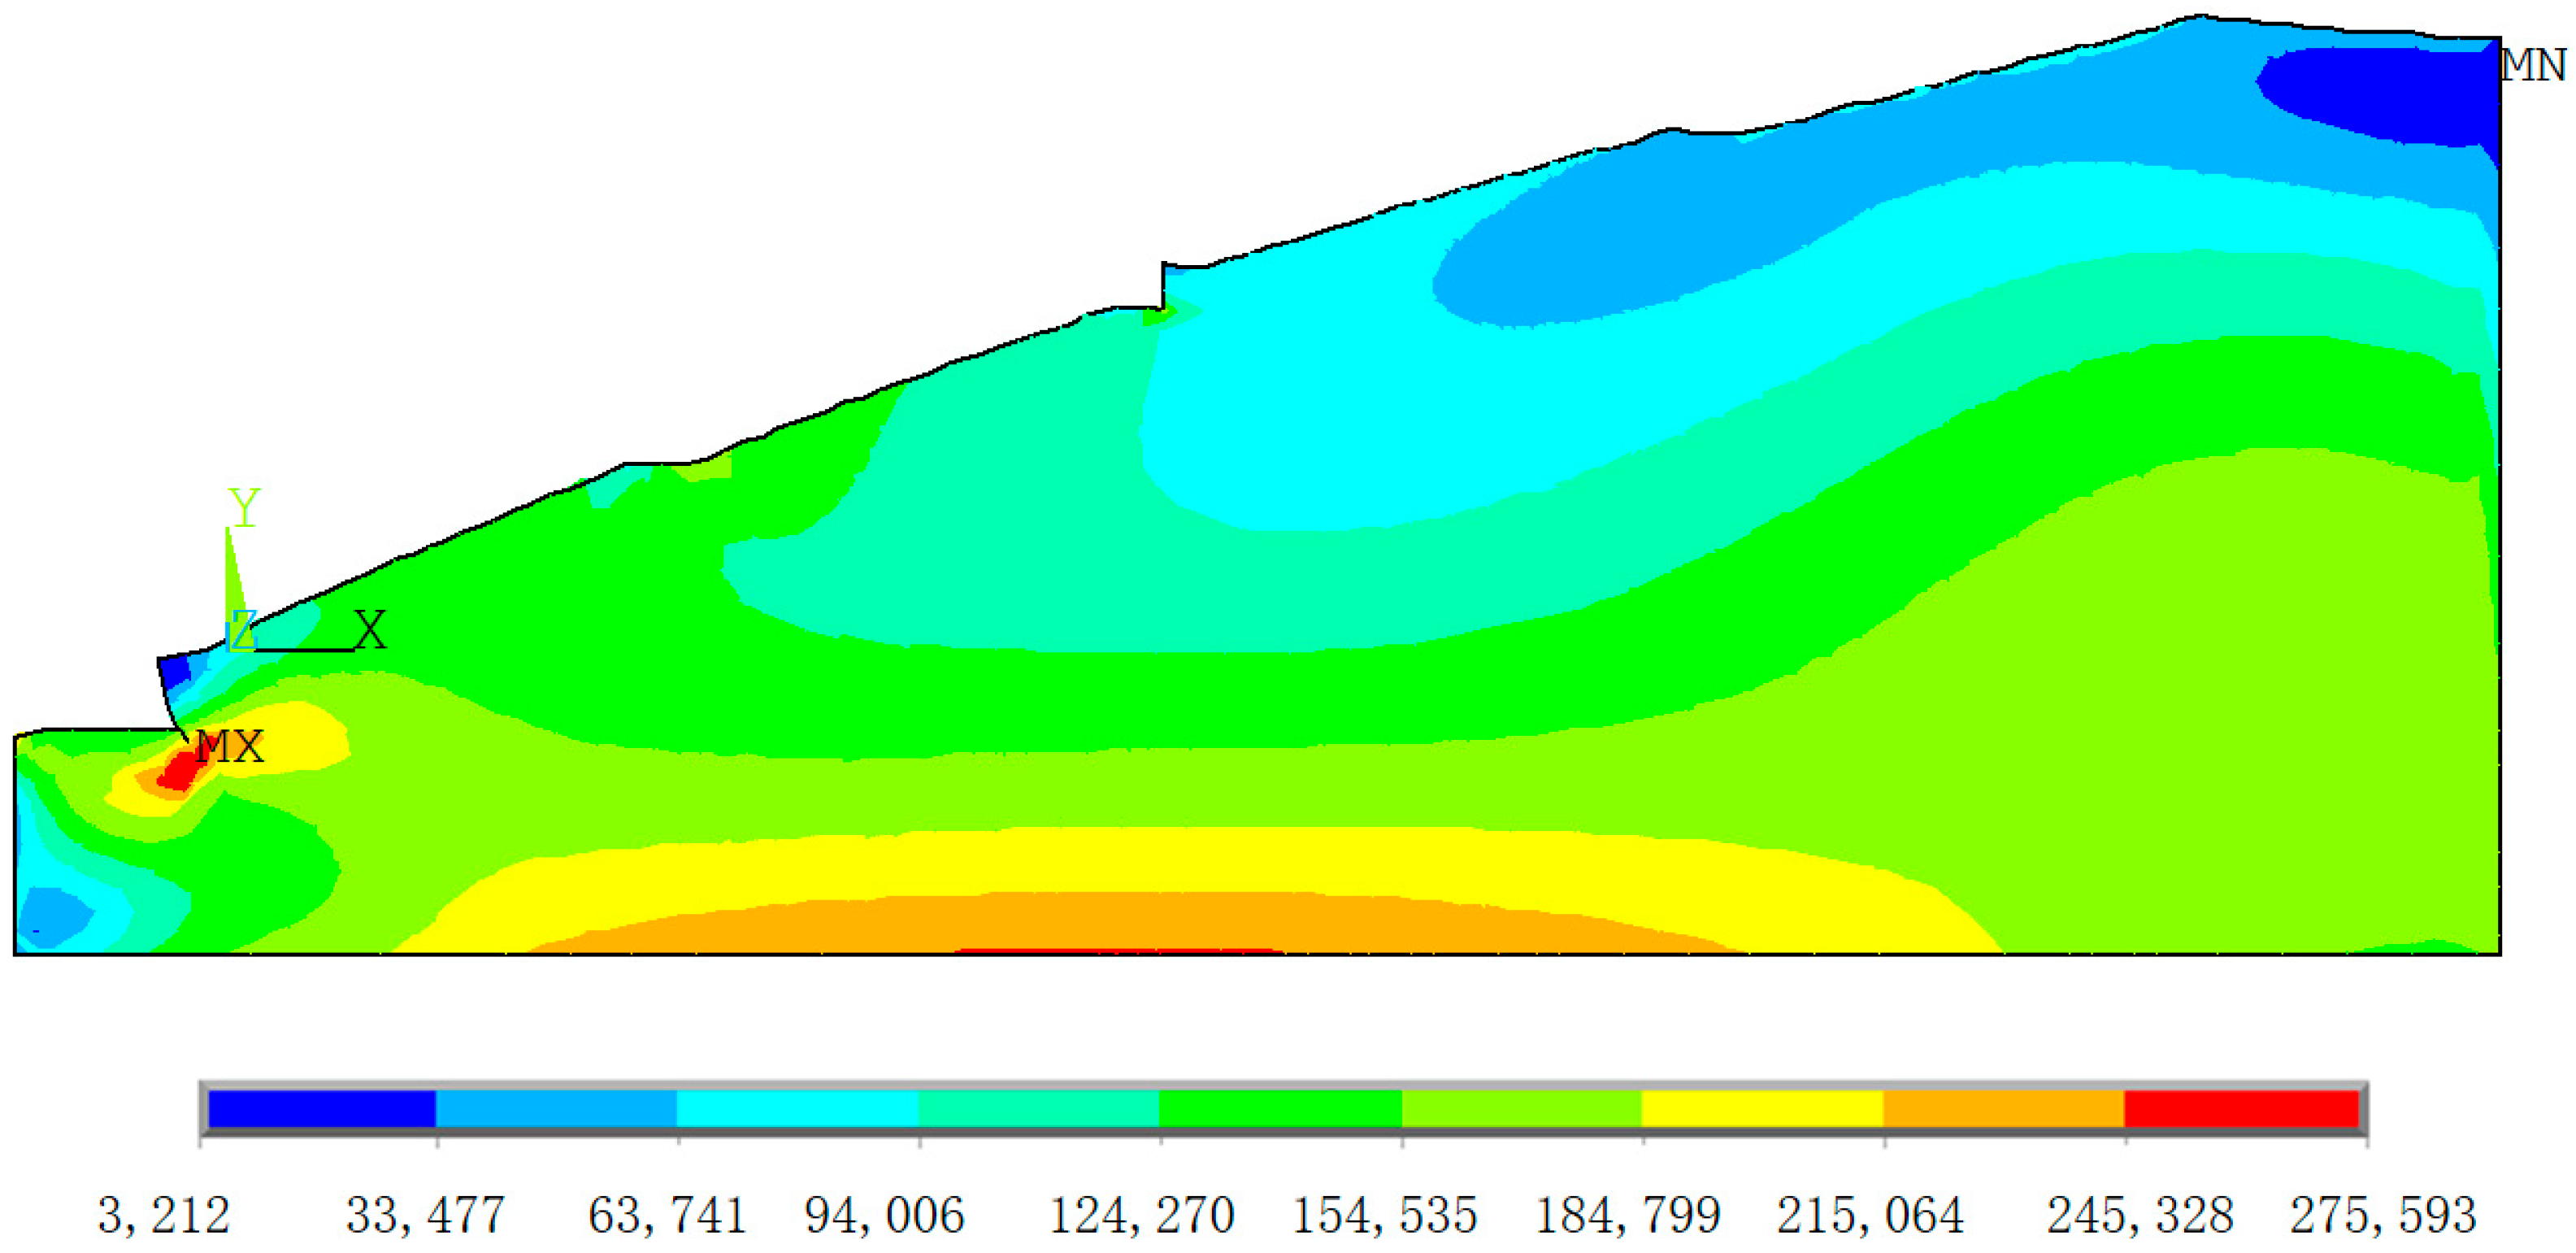
The X-direction principal stress diagram is shown in Figure 4. It indicates that the principal stress in the X-direction represents the component of landslide thrust. The areas with larger values are mainly concentrated at the upper and lower piles and pre-stressed anchor rods. This implies that the piles and anchor rods are the main structures resisting landslide thrust. There are also regions of significant X-direction thrust at the bottom of the model, caused by the constraints applied in the X and Y directions of the slope model.
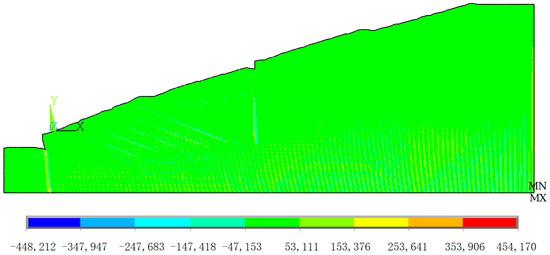
Figure 4.
X-direction principal stress contour.
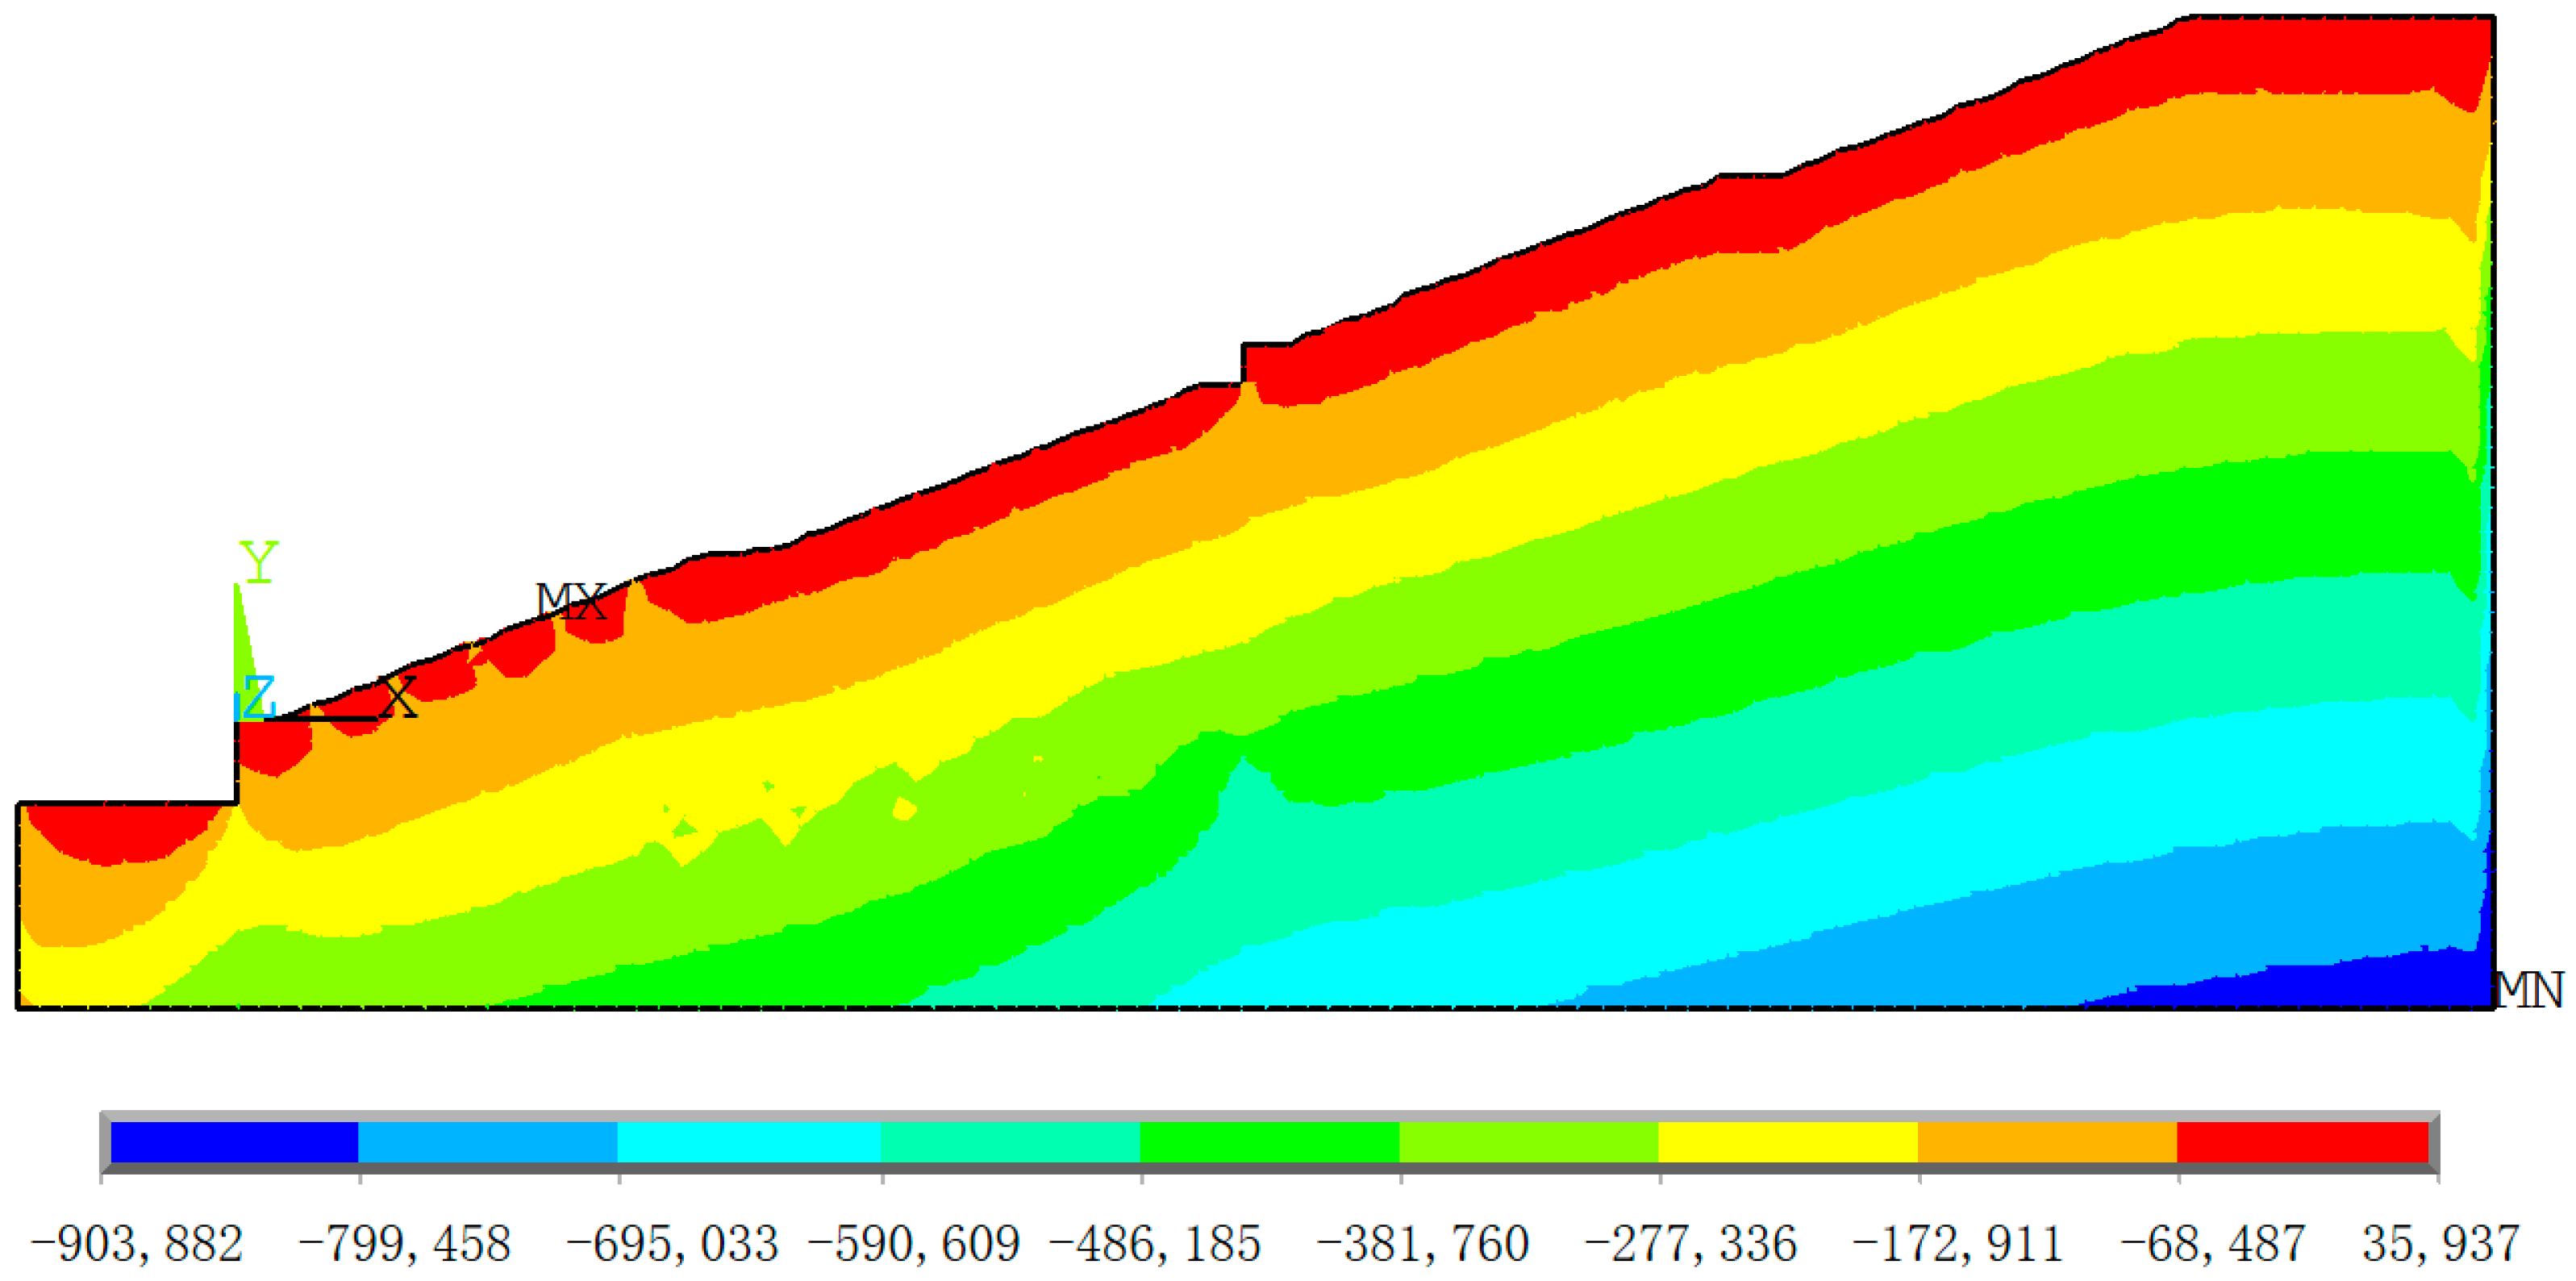
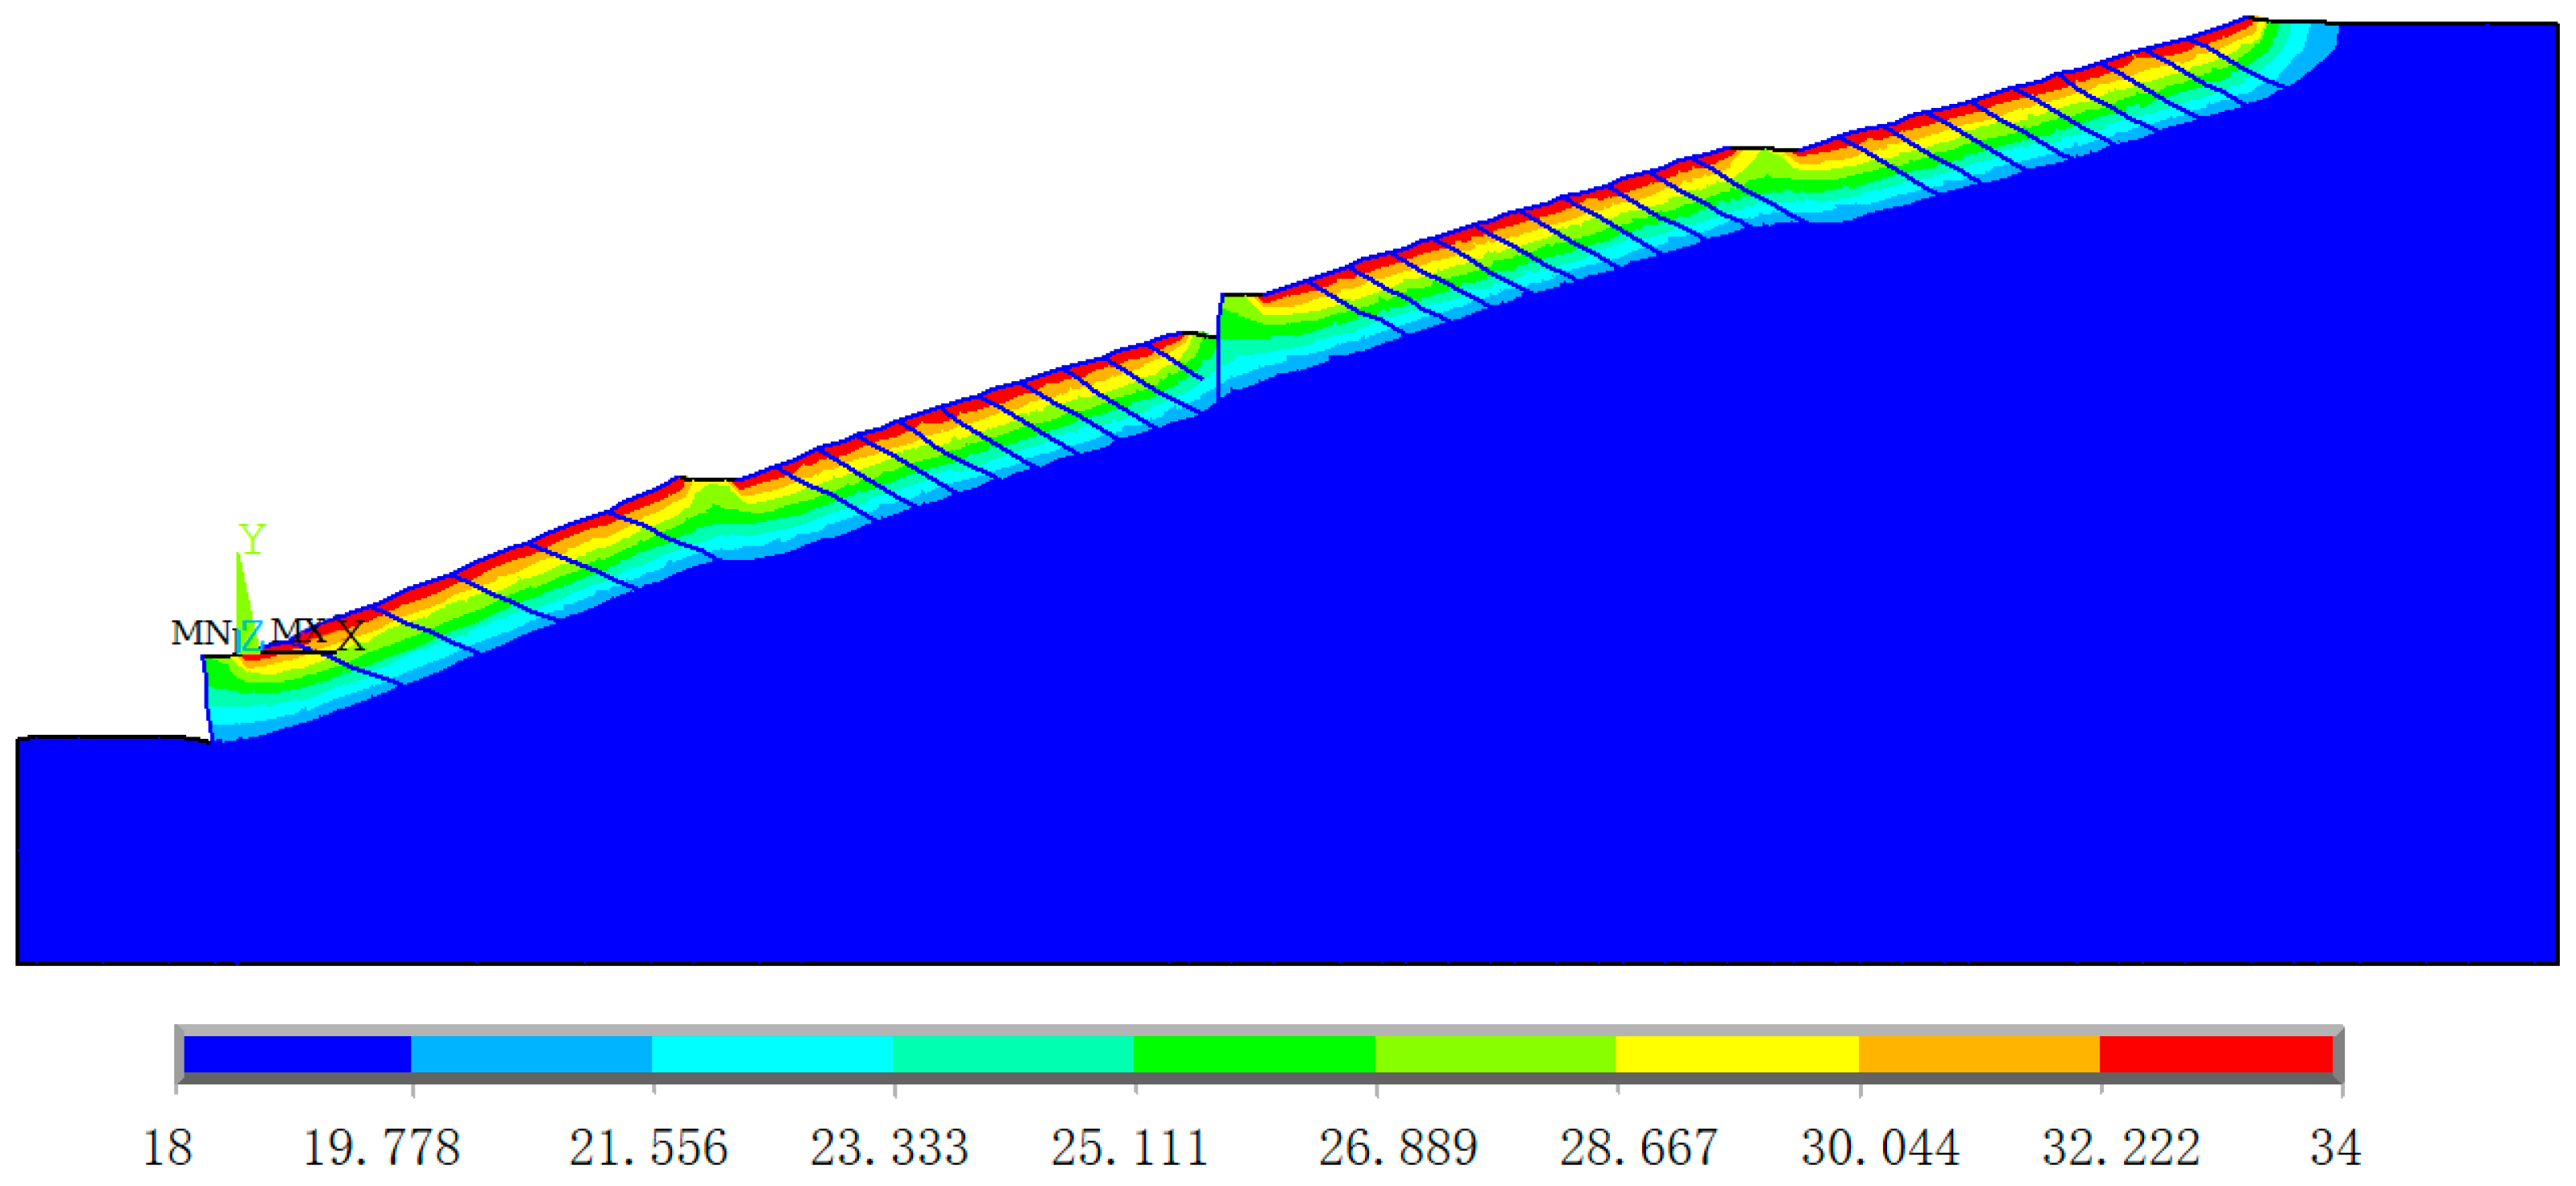
Figure 5 illustrates the Y-direction principal stress contour. The Y-direction principal stress is layered and transmitted downward, with the stress contour lines bending around the piles and anchor rods. This indicates that the presence of piles and anchor rods influences the distribution of Y-direction principal stress.

Figure 5.
Y-direction principal stress contour.
2.2. Simulation of Experimental Conditions
For expansive soil slopes, rainfall induces volume expansion of the expansive soil, similar to the volume expansion caused by an increase in temperature. The thermal expansion characteristics of materials caused by a rise in temperature can effectively simulate the swelling characteristics of expansive soil when subjected to water. Therefore, in the ANSYS software, the impact of rainfall on expansive soil is primarily considered using the thermal stress field, specifically the equivalent humidity stress field.
This study, in conjunction with in situ vertical expansion force tests, utilizes numerical simulation software to emulate on-site experiments, thus determining the thermal expansion coefficient. The thermodynamic equation for thermal expansion is expressed as follows:
where
αt represents the thermal expansion coefficient.
ΔT is the temperature change.
δij is the Kronecker symbol.
The equation expressing the influence of humidity on solid deformation is as follows:
where
β is the expansion coefficient of the humidity field.
Δω is the change in unit volume water content.
By simultaneously solving Equations (1) and (2), the thermal expansion coefficient is determined as follows:
Additionally, the relationship between expansion force and incremental water content is given as follows:
where
Ps is the expansion force.
K is the bulk modulus.
By substituting the elastic model and Poisson’s ratio into Equation (5), K = 29.17 × 10³ kPa is obtained, and, finally, the linear expansion coefficient β = 1.73 × 10⁻⁴ is derived.
2.3. Determination of Thermal Expansion Coefficient
The indoor model can control the boundary conditions and parameters. Through this control, the purpose of eliminating the influence of irrelevant factors can be achieved. However, the soil is inevitably disturbed in the collection, transportation, preservation, and compaction in the model box, which makes the results obtained using the test have different degrees of distortion. Nevertheless, a field test can reflect the real situation, and a field test is the most effective means to study the internal force distribution of a pile–plate wall. Therefore, the in situ expansion force test is used to obtain the maximum expansion force parameter. In addition, because the water may be uneven in the soil, the simulation of the temperature and water content is based on the test maximum expansion force. Then, the thermal expansion coefficient of the expanded soil is calculated according to the previous formula.
The thermal expansion coefficient is determined through a combination of numerical simulation and in situ experiments. A square test block with dimensions of 70.7 cm × 70.7 cm and a depth of 150 cm is set up at the mid-to-strong expansive soil test point. The test block is loaded from the top using a jack to apply a reactive force to the expansive soil test block, as shown in Figure 6. Water is poured onto the top of the test block to simulate the rainfall process, allowing water to seep from the surface into the interior of the soil, causing the expansive soil to swell and generate expansion forces. The experimental process is as follows:
- (1)
- Before the experiment starts, a certain amount of pressure is applied using the jack to ensure good contact between the various parts of the test system. The initial readings of the soil pressure box and the dial gauge are recorded.
- (2)
- Water is poured onto the surface of the test block, and the time and amount of water poured are recorded. A thin layer of water should always be maintained above the test block.
- (3)
- When the dial gauge reading on the load plate changes, the jack is adjusted promptly to return the dial gauge pointer to its initial value. The readings of the dial gauge and the soil pressure box are recorded before and after each adjustment of the jack, with observations being made every 10 min.

Figure 6.
In Situ vertical expansion force test.
Figure 6.
In Situ vertical expansion force test.
As the experiment progresses, the expansion deformation of the expansive soil will gradually slow down and eventually stabilize. The observation interval can be appropriately extended, and the experiment is concluded when both the vertical deformation and the expansion force of the expansive soil stabilize.
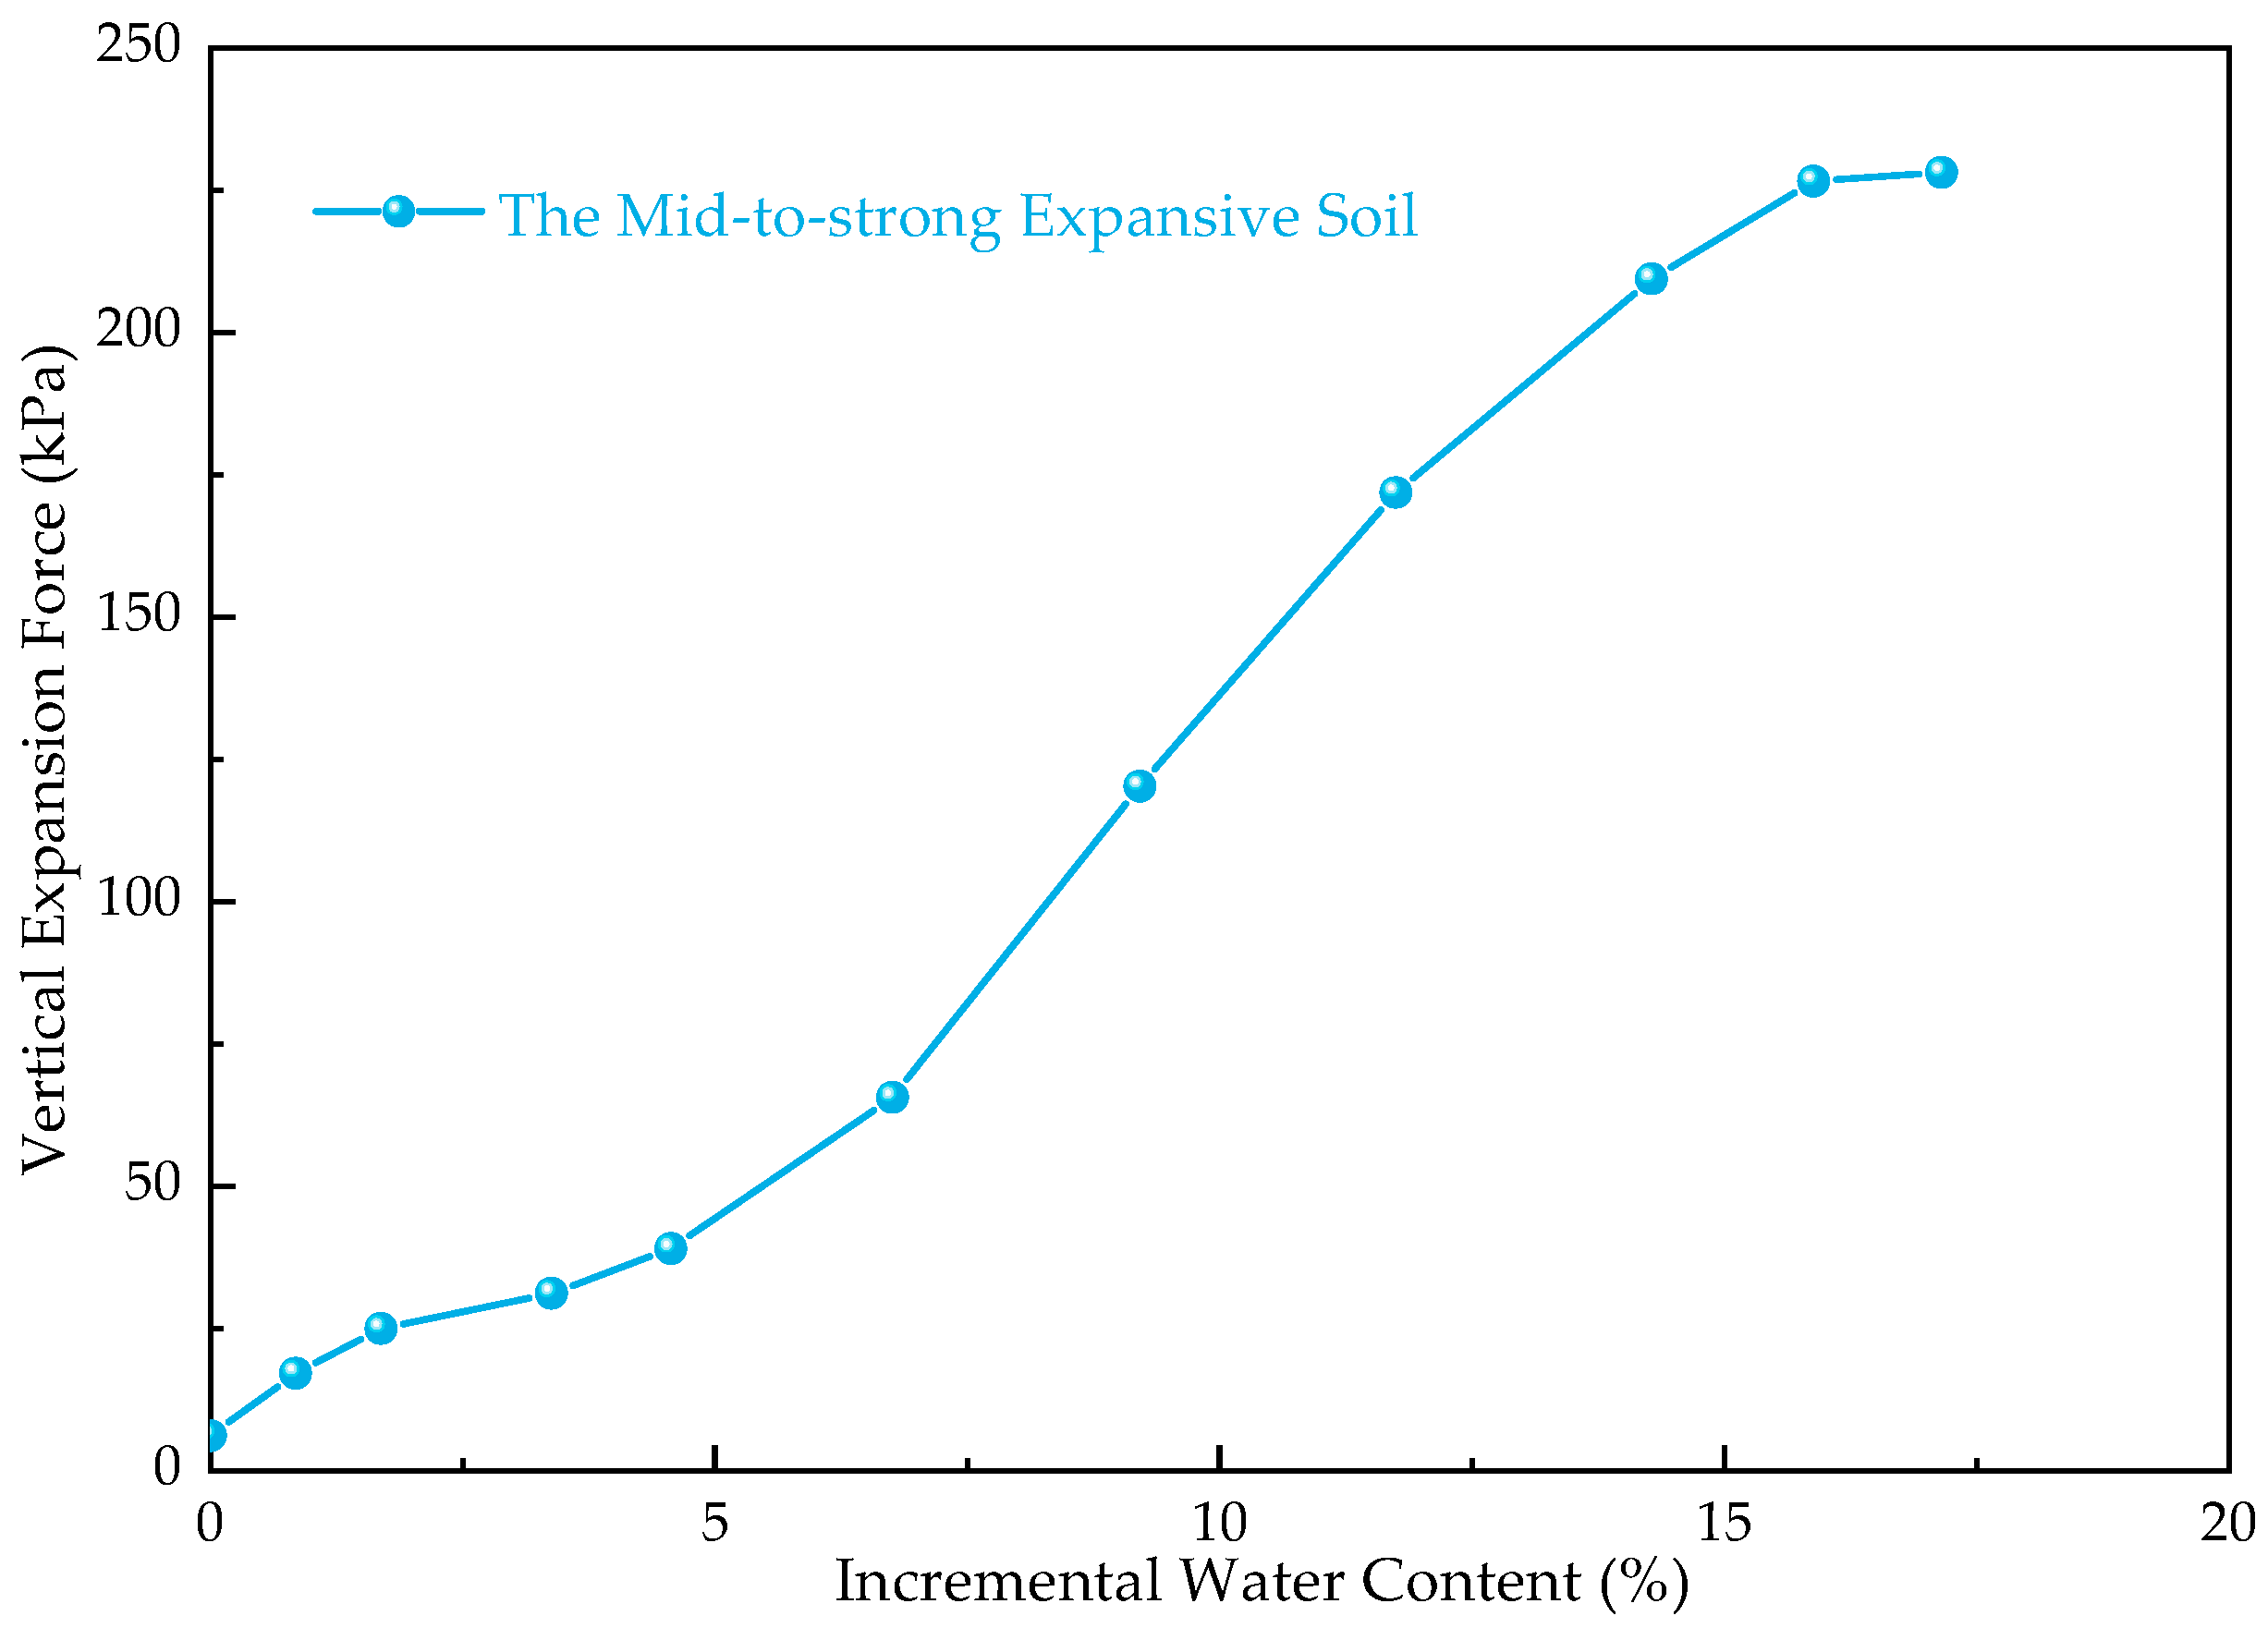
The relationship between vertical expansion force and incremental water content obtained from the experiment is shown in Figure 7. From Figure 7, it is evident that the vertical expansion force increases nonlinearly with the increase in water content. When the increment in water content is below 5%, the vertical expansion force increases slowly. When the increment in water content is between 5% and 15%, the vertical expansion force increases rapidly. When the change in water content of the mid-to-strong expansive soil exceeds 15.0%, the expansion force tends to stabilize, and the maximum vertical expansion force is 227 kPa.

Figure 7.
Relationship between vertical expansion force and incremental water content.
The vertical expansion force test is simulated using numerical software. Based on the in situ vertical load expansion force test of the expansive soil (rock), a numerical model with dimensions of 0.7 m in length, 0.7 m in width, and 1.5 m in height is established. The model, as shown in Figure 8, has displacement constraints applied to the top, full constraints applied to the bottom, and radial constraints applied to all sides.
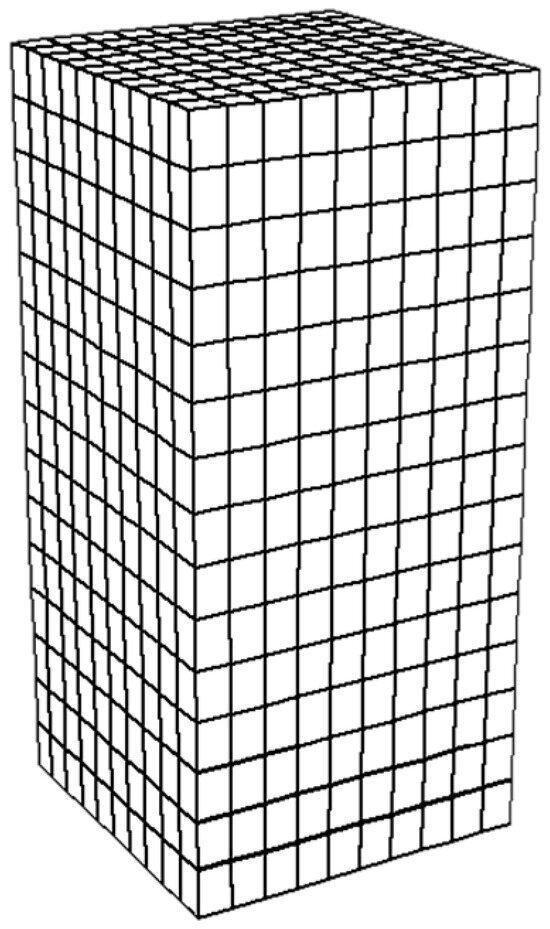
Figure 8.
Numerical model of the vertical expansion force test.
The initial natural water content of this test point is 19%, and the maximum water content after wetting is 34%. At this point, Δω = 15%, and the expansion force is 227 kPa. By applying an initial temperature T0 = 0 (corresponding to the initial water content) to the bottom and top of the model and varying the top temperature T1, a thermal–structural coupled analysis is performed on the model. When the top temperature T1 = 30.2°, the stress on the structure’s surface is exactly 227 kPa. At this point, the corresponding water content on the surface of the soil is 34%. Therefore, ΔT = 30.2°, and αt = 9 × 10⁻⁵ can be obtained by substituting these parameters into Equation (3).
The application of the expansive load on the slope is simulated using the ANSYS thermal–structural coupling module. The natural water content of the slope soil is 18%, and, after rainfall, the surface soil becomes saturated with a water content of 34%. The range of rainfall influence is 4 m (atmospheric influence depth), and the thermal expansion coefficient of the expansive soil is 9 × 10⁻⁵. Thus, the temperature field simulating the humidity field formed by rainwater infiltration is shown in Figure 9 and Figure 10.
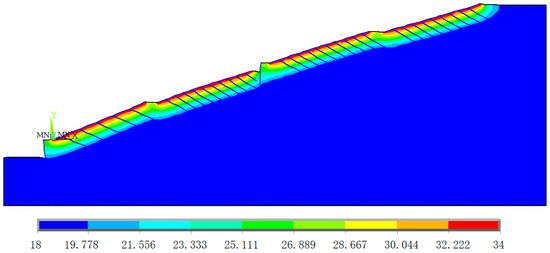
Figure 9.
Temperature field simulating rainwater infiltration.

Figure 10.
Expansion deformation of the slope under rainwater infiltration conditions.
From Figure 9, it can be observed that rainwater slowly infiltrates the body of the slope. Rainwater infiltration causes the surface of the expansive soil slope to deform and bulge, as indicated in Figure 10. The slope surface exhibits varying degrees of outward expansion deformation, with the maximum deformation occurring at the second-level slope, where the Y-direction displacement is approximately 1.2 mm.
2.4. Case Study
2.4.1. Verification of Maximum Deformation
The calculation results of the maximum deformation for typical slope cases, as presented in Reference [36], Case 1 (Simulation Analysis of Highway Slope Construction Process, Section 6.2 in Reference [36]) and Case 2 (Simulation Analysis of High Slope Anchor Support Structure Construction Process, Section 6.3 in Reference [36]), are compared in Table 2. The results show consistency between the calculations conducted in this paper and those in the reference. The slight deviation in Case 2 is attributed to the difference in the slope model’s mesh size between this paper and the reference.
Table 2.
Results comparison of maximum deformation.
2.4.2. Verification of Safety Factor
A typical fourth-level expansive soil high slope is considered as a case study. The safety factors obtained using the ANSYS program for this case are shown in Table 3. The safety factor obtained using the ANSYS finite element strength reduction method is 1.23, which is consistent with the result obtained using the FLAC finite difference method. This confirms the correctness and feasibility of the ANSYS program in this paper.
Table 3.
Results comparison of safety factor.
2.4.3. Verification of Expansion Force
For the verification of expansion force, a typical case from Section 5.4.3 of Reference [37] is selected. The results obtained using the ANSYS program are compared with the reference results in Table 4. The consistency between the results from this paper and those of the reference indicates the correctness of the calculation program. The comparison between the finite element results and the experimental results shows close agreement, verifying the feasibility of using ANSYS software for the numerical simulation of expansion deformation.
Table 4.
Results comparison of expansion force.
3. Results
3.1. Analysis of Pile Internal Forces
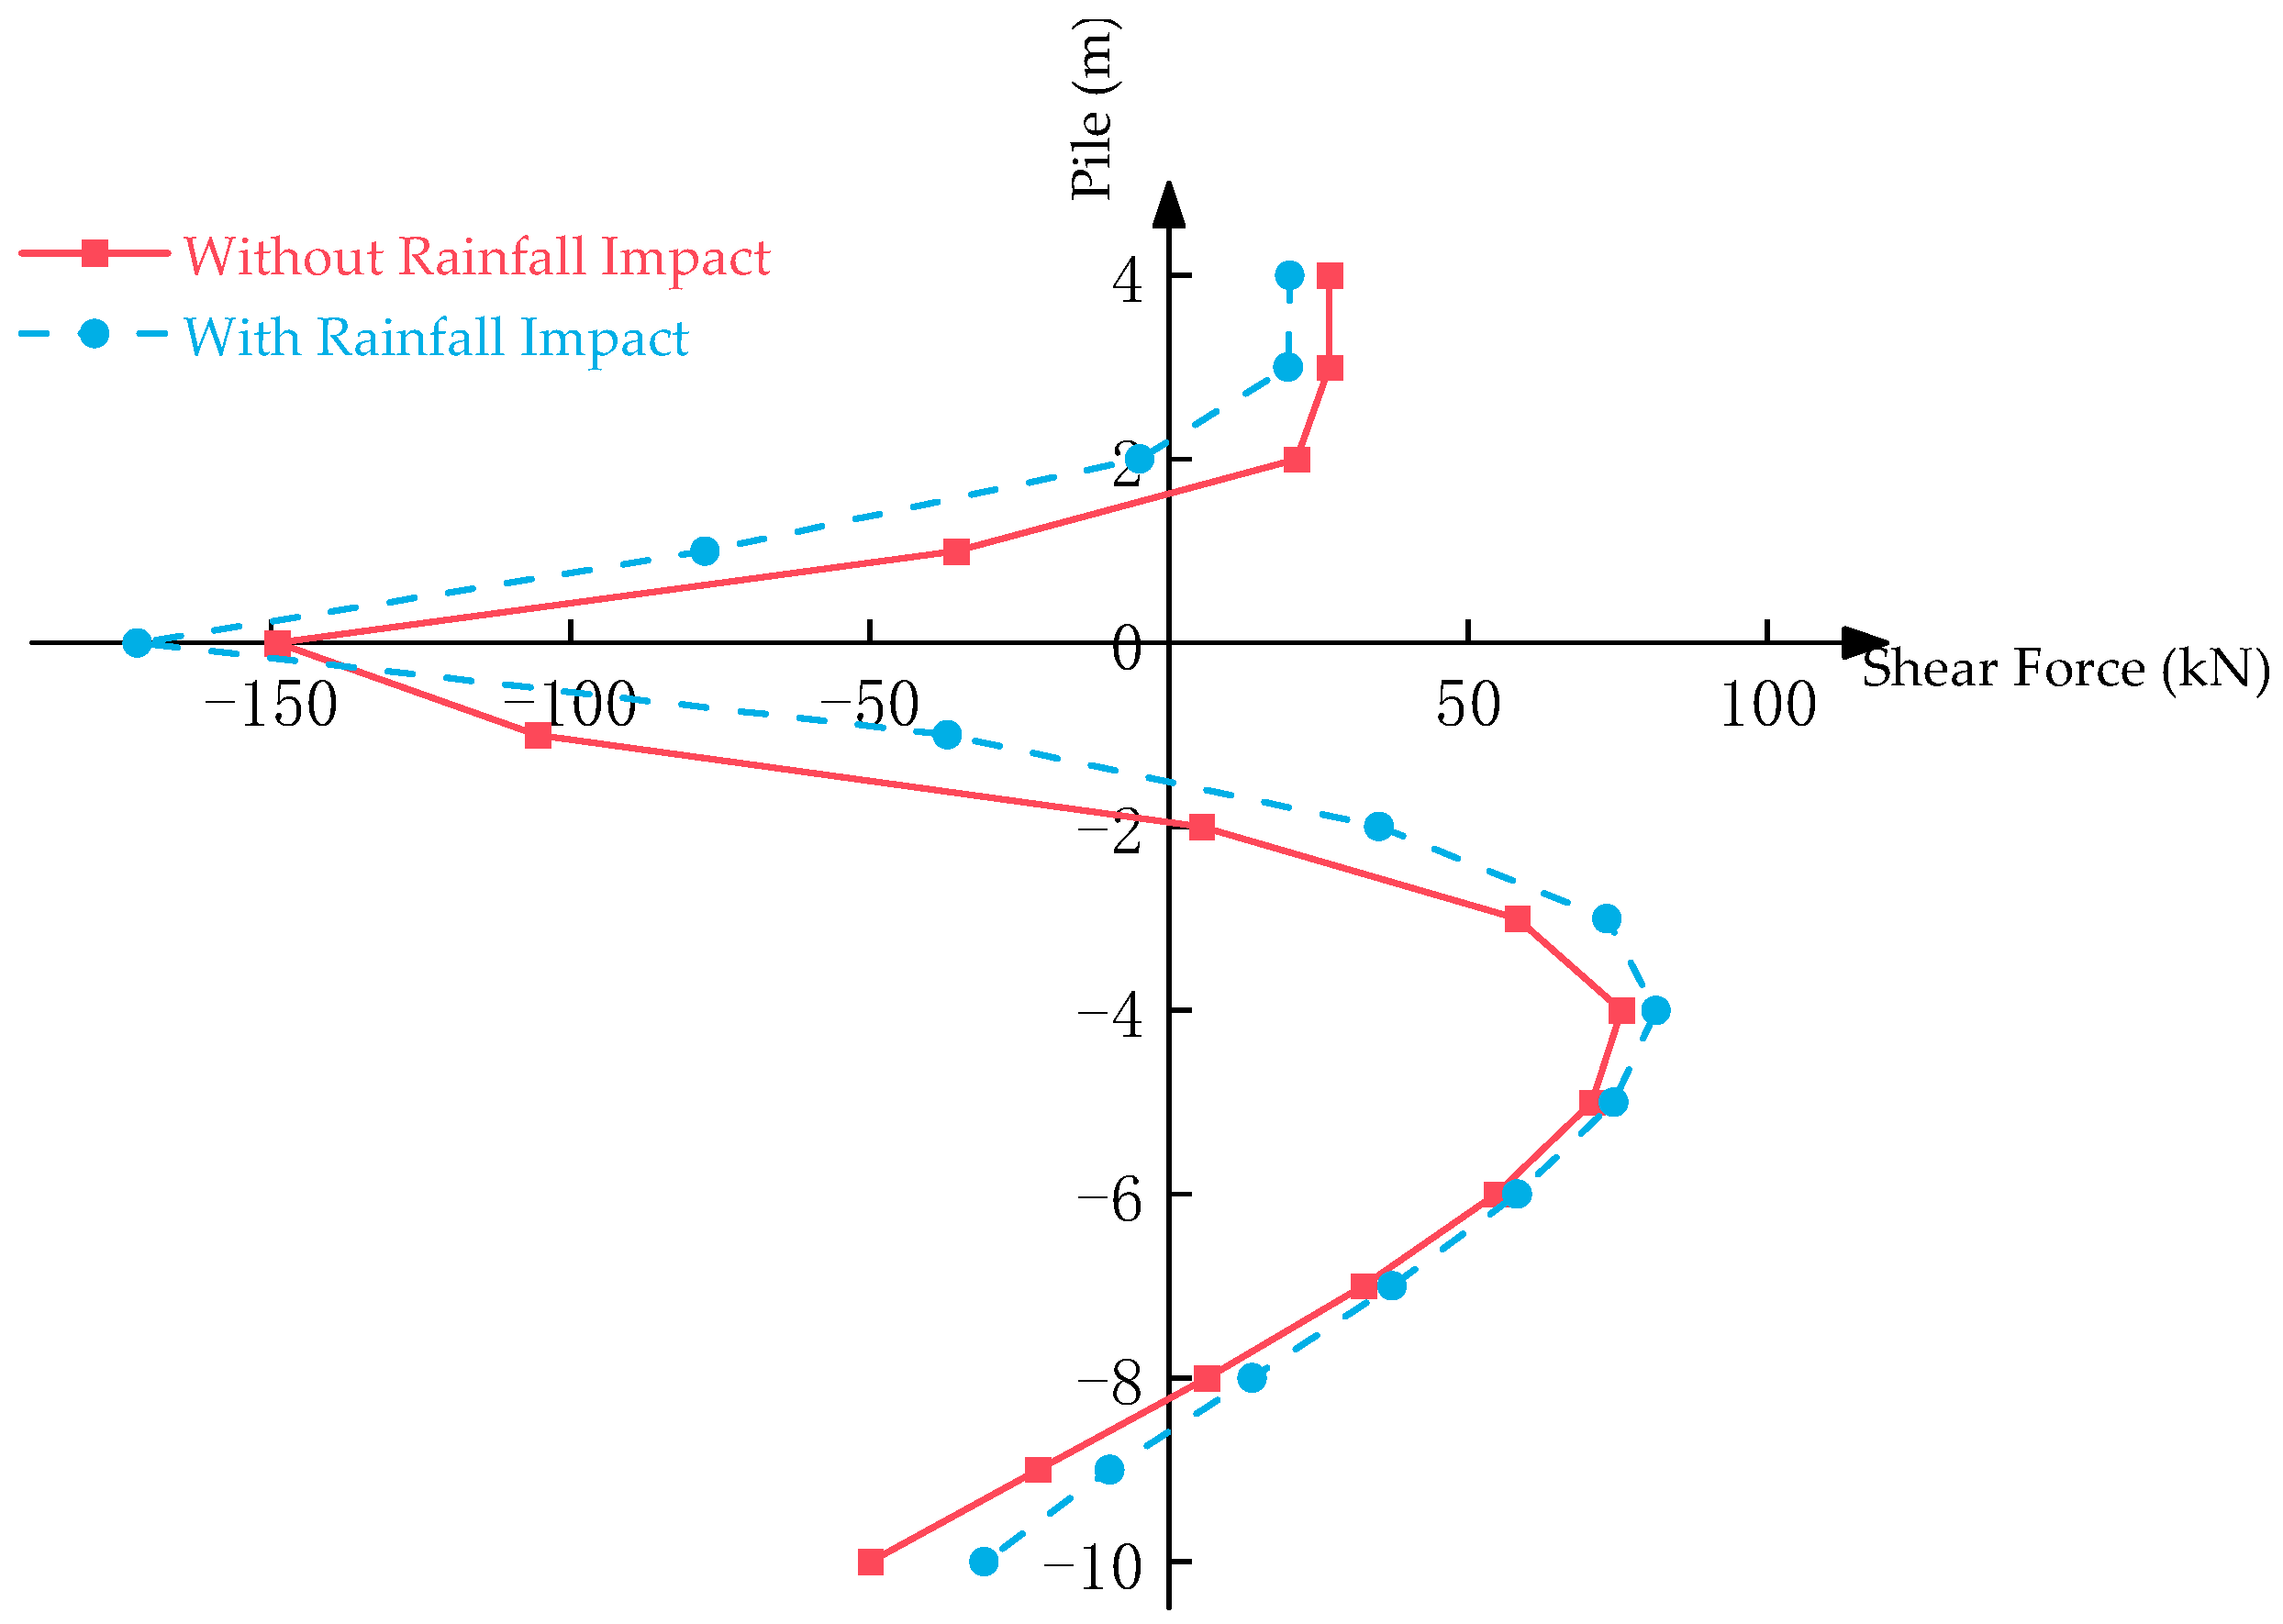
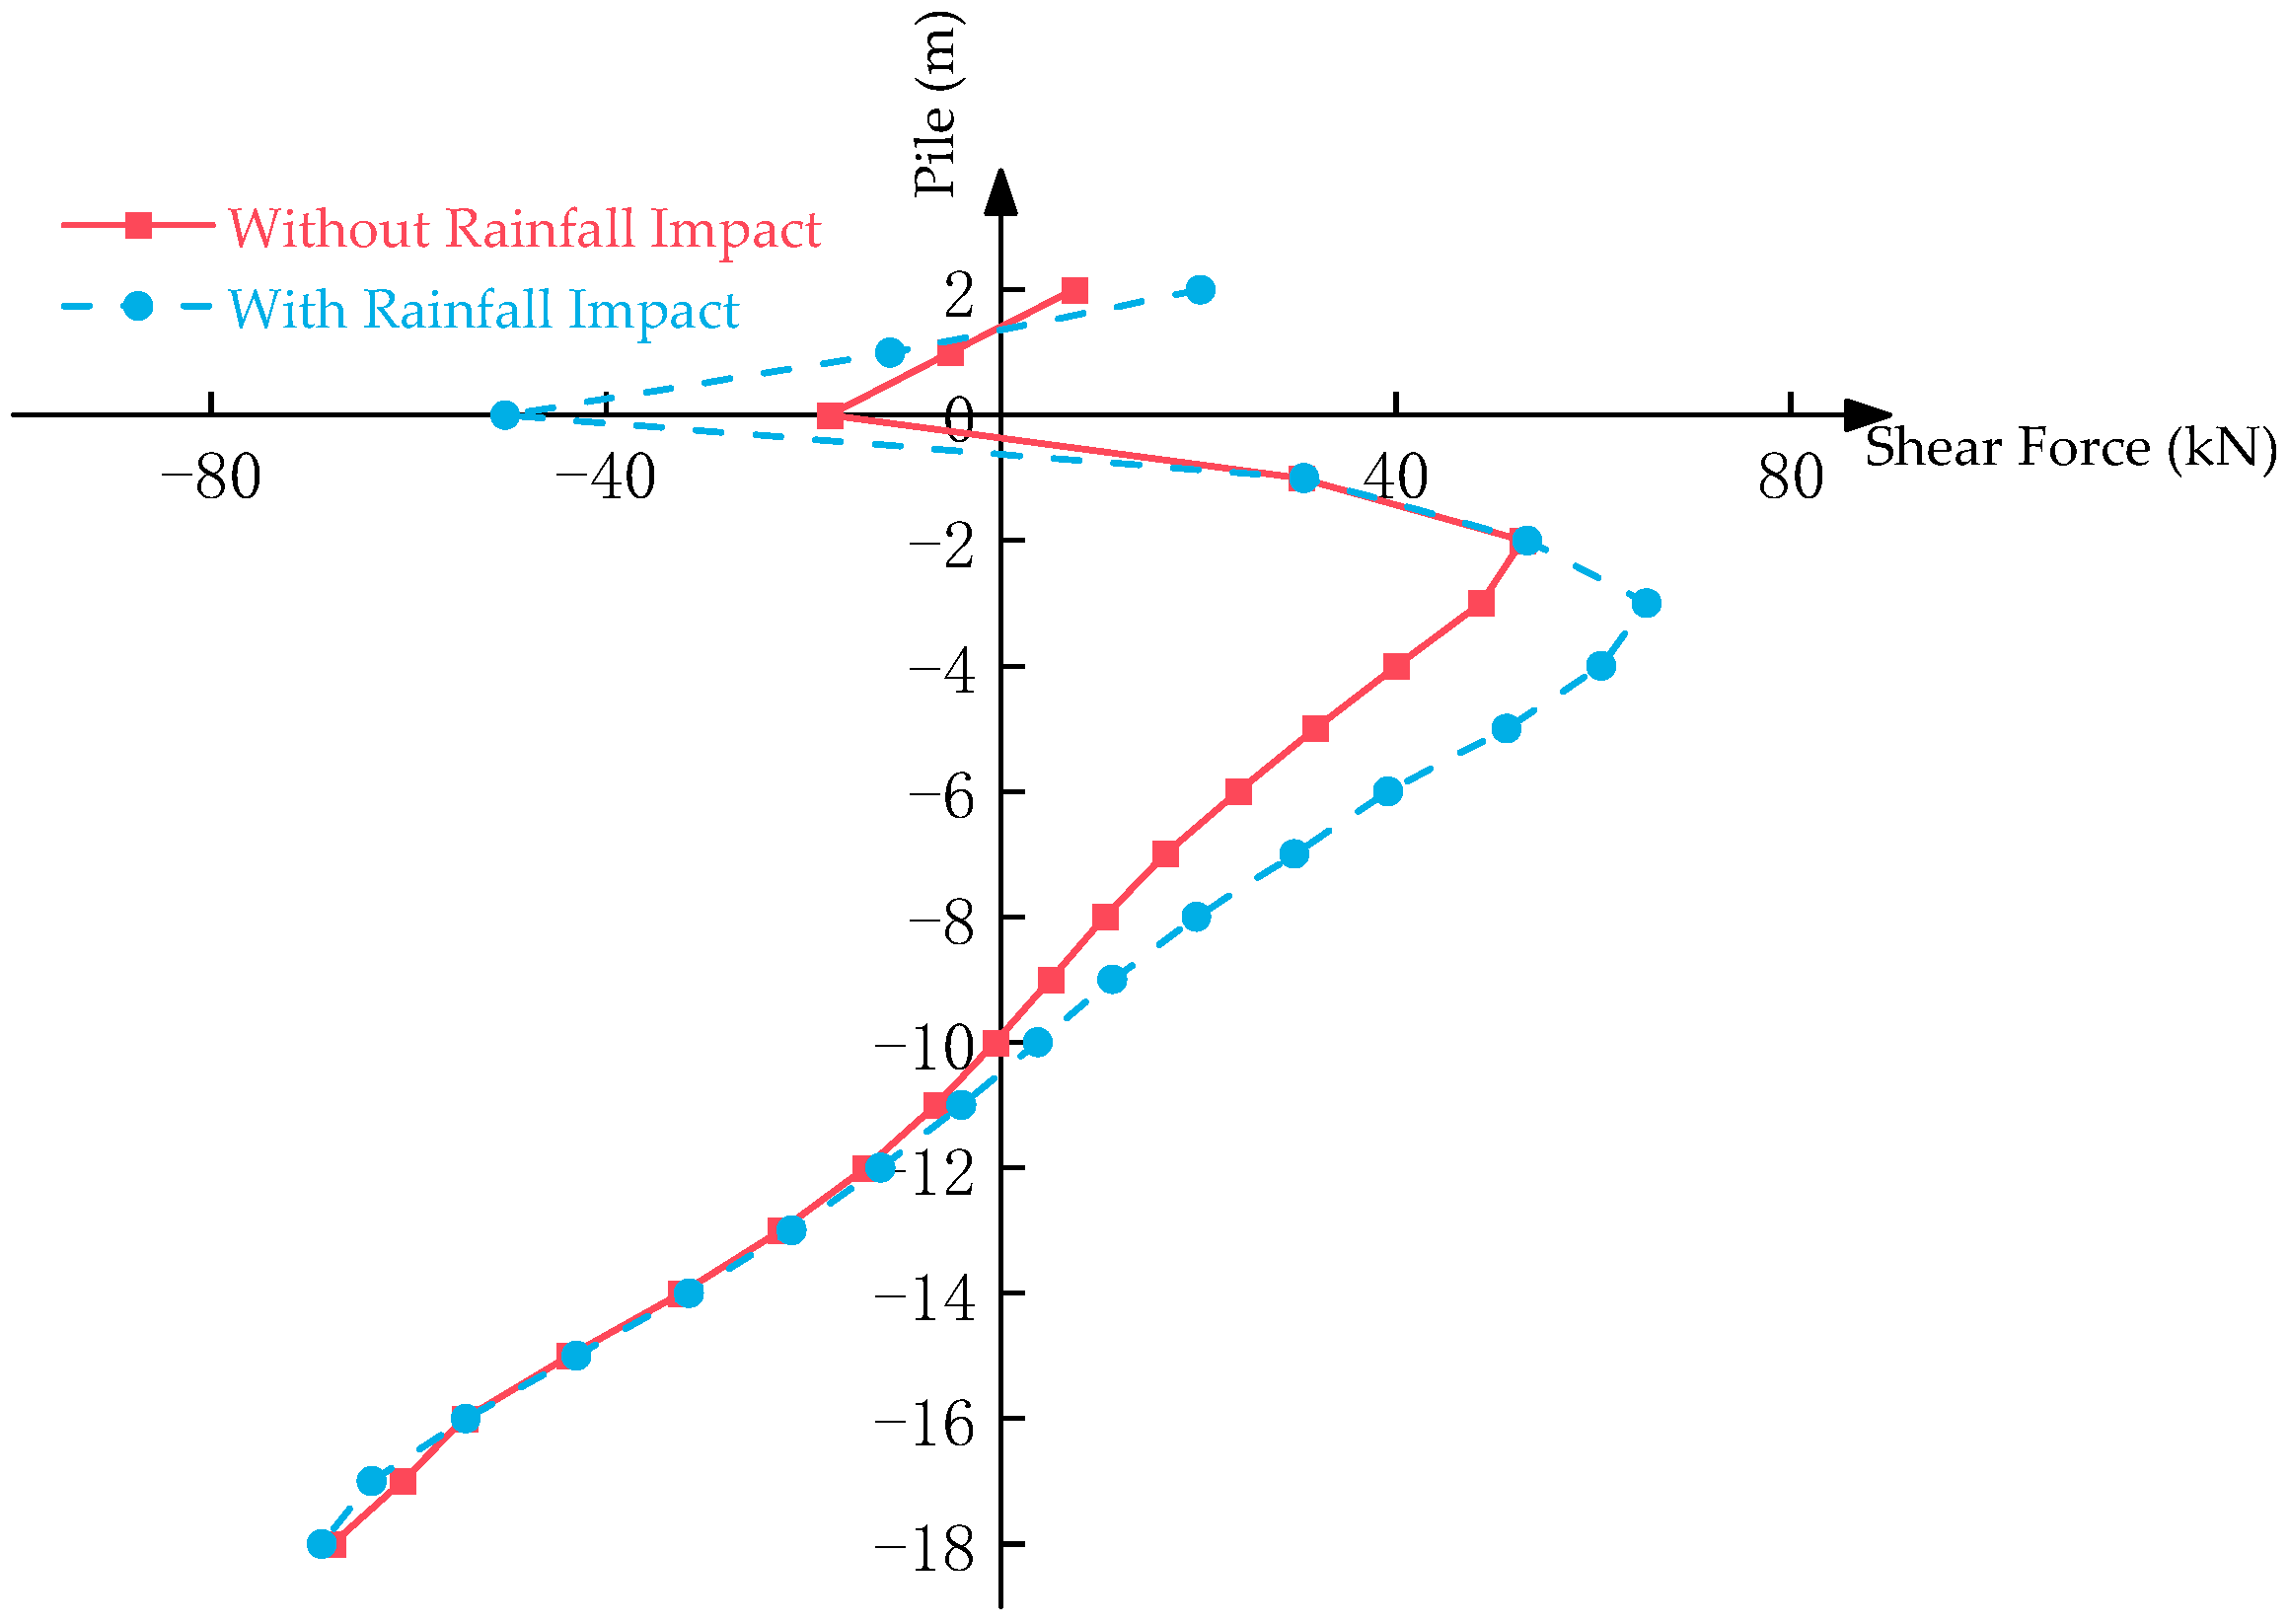
Figure 11 illustrates the shear forces in the lower pile with and without considering rainfall. It can be observed that the shear force in the cantilever section gradually decreases along the pile, while, in the anchored section, it initially increases and then decreases. The maximum absolute value of the shear force in the lower pile occurs 4 m below the top of the pile, precisely at the junction of the cantilever and fixed ends, with a maximum value of 149.65 kN. Considering rainfall, the maximum shear force increases to 158.34 kN, and the maximum value still occurs at the same location. Rainfall has a significant impact on the shear forces in the lower pile. After introducing rainfall conditions, the shear forces at both ends of the lower pile decrease to some extent, ranging between 25.75% and 38.08%. However, there is a noticeable increase in shear forces in the middle section of the lower pile (within 3 to 12 m from the top of the pile), with the most rapid increase occurring around 3 m from the top, at approximately 42.0 kN, representing a 118.31% increase.
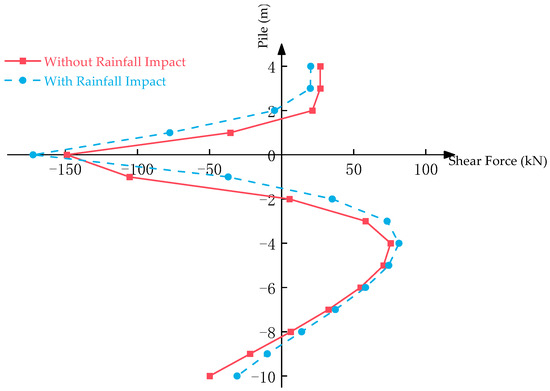
Figure 11.
Shear forces in the lower pile comparison.
Figure 12 presents the shear forces in the upper pile with and without considering rainfall. Similar to the lower pile, the shear force in the cantilever section gradually decreases along the pile, while, in the anchored section, it initially increases and then decreases. The maximum shear force in the upper pile occurs 6 m below the top of the pile, with a maximum value of 54 kN. Considering rainfall, the maximum shear force shifts to 7 m below the top, reaching 65 kN. Rainfall significantly affects the shear forces in the upper pile within the 0 to 12 m range from the top of the pile, leading to varying degrees of increase. The most noticeable increase occurs around 2 m from the top, at approximately 32.8 kN, representing a 188.51% increase.

Figure 12.
Shear forces in the upper pile comparison.
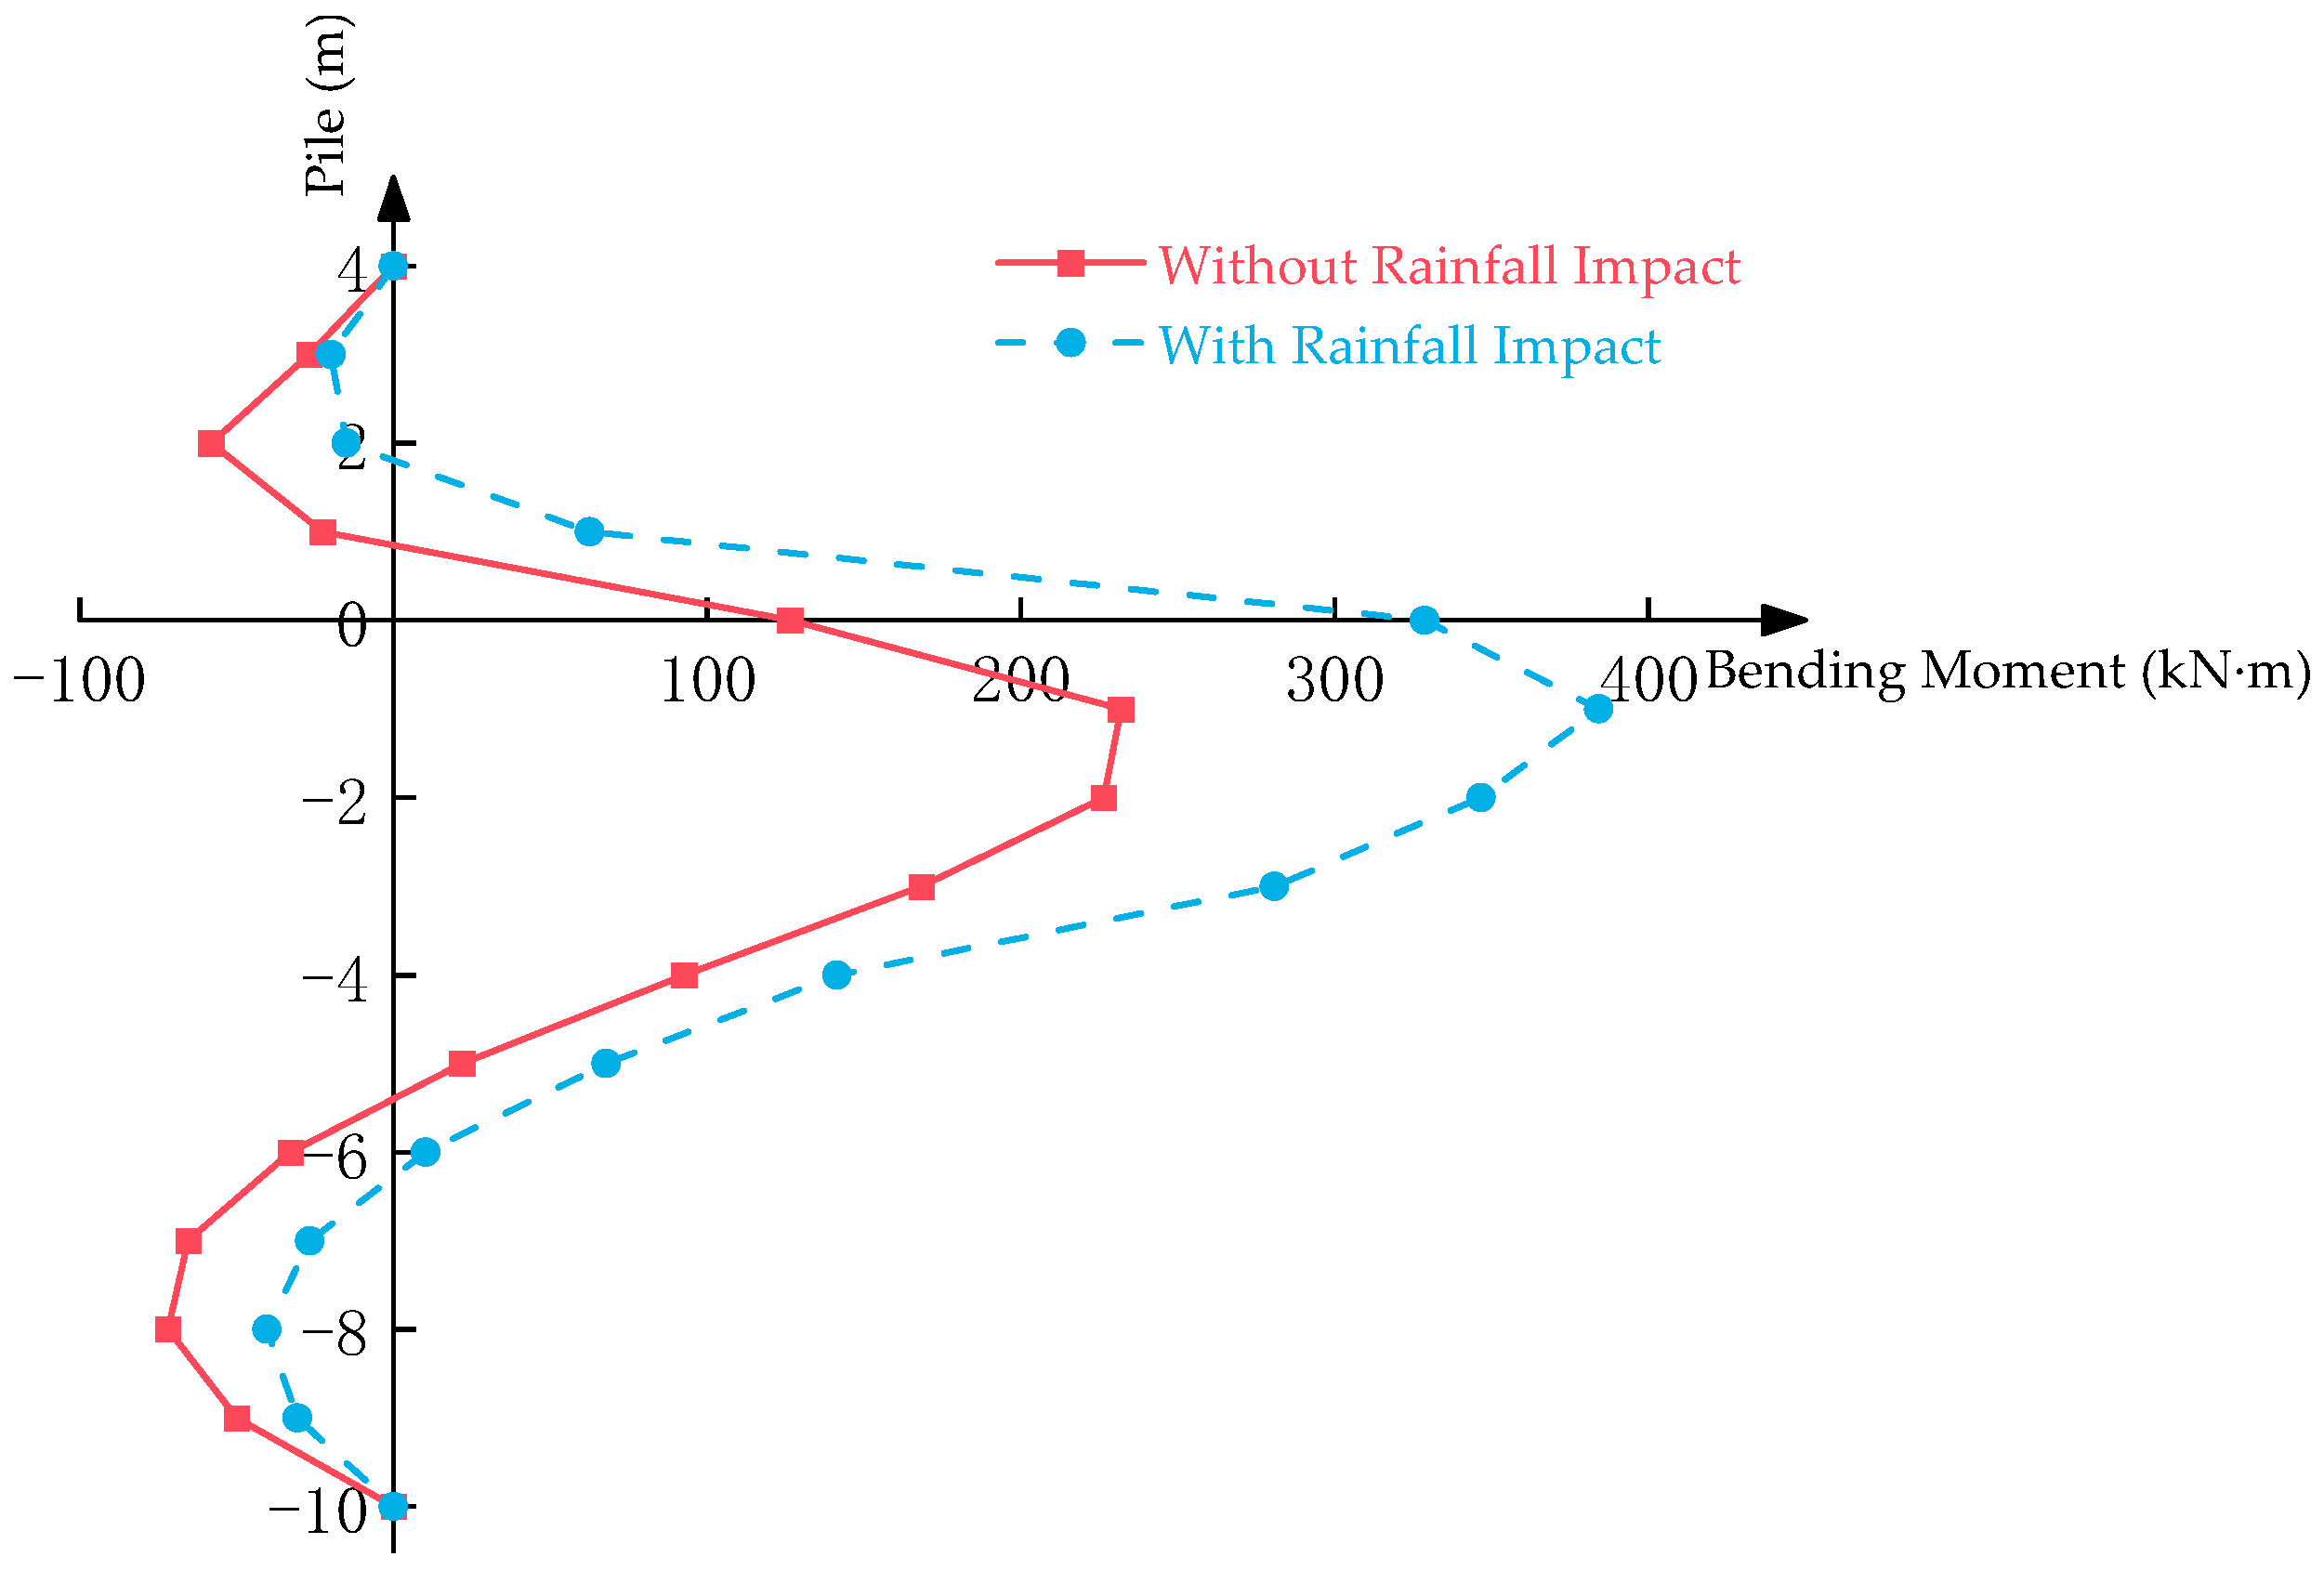
Figure 13 displays the bending moments in the lower pile with and without considering rainfall. The bending moments exhibit W-shaped distribution along the pile, initially decreasing, then increasing, decreasing again, and finally increasing. The maximum bending moment occurs 6 m below the top of the pile, with a maximum value of 237 kN·m. Considering rainfall, the maximum bending moment remains at the same location, but increases to 384.2 kN·m. The introduction of rainfall significantly influences the bending moments in the lower pile, leading to a reduction in bending moments at both ends, while there is a significant increase in the 3 to 10 m range from the top of the pile. The maximum bending moment in the pile occurs at 5 m from the top, increasing from 231.9 kN·m to 384.2 kN·m, representing a 65.67% increase.

Figure 13.
Bending moments in the lower pile comparison.
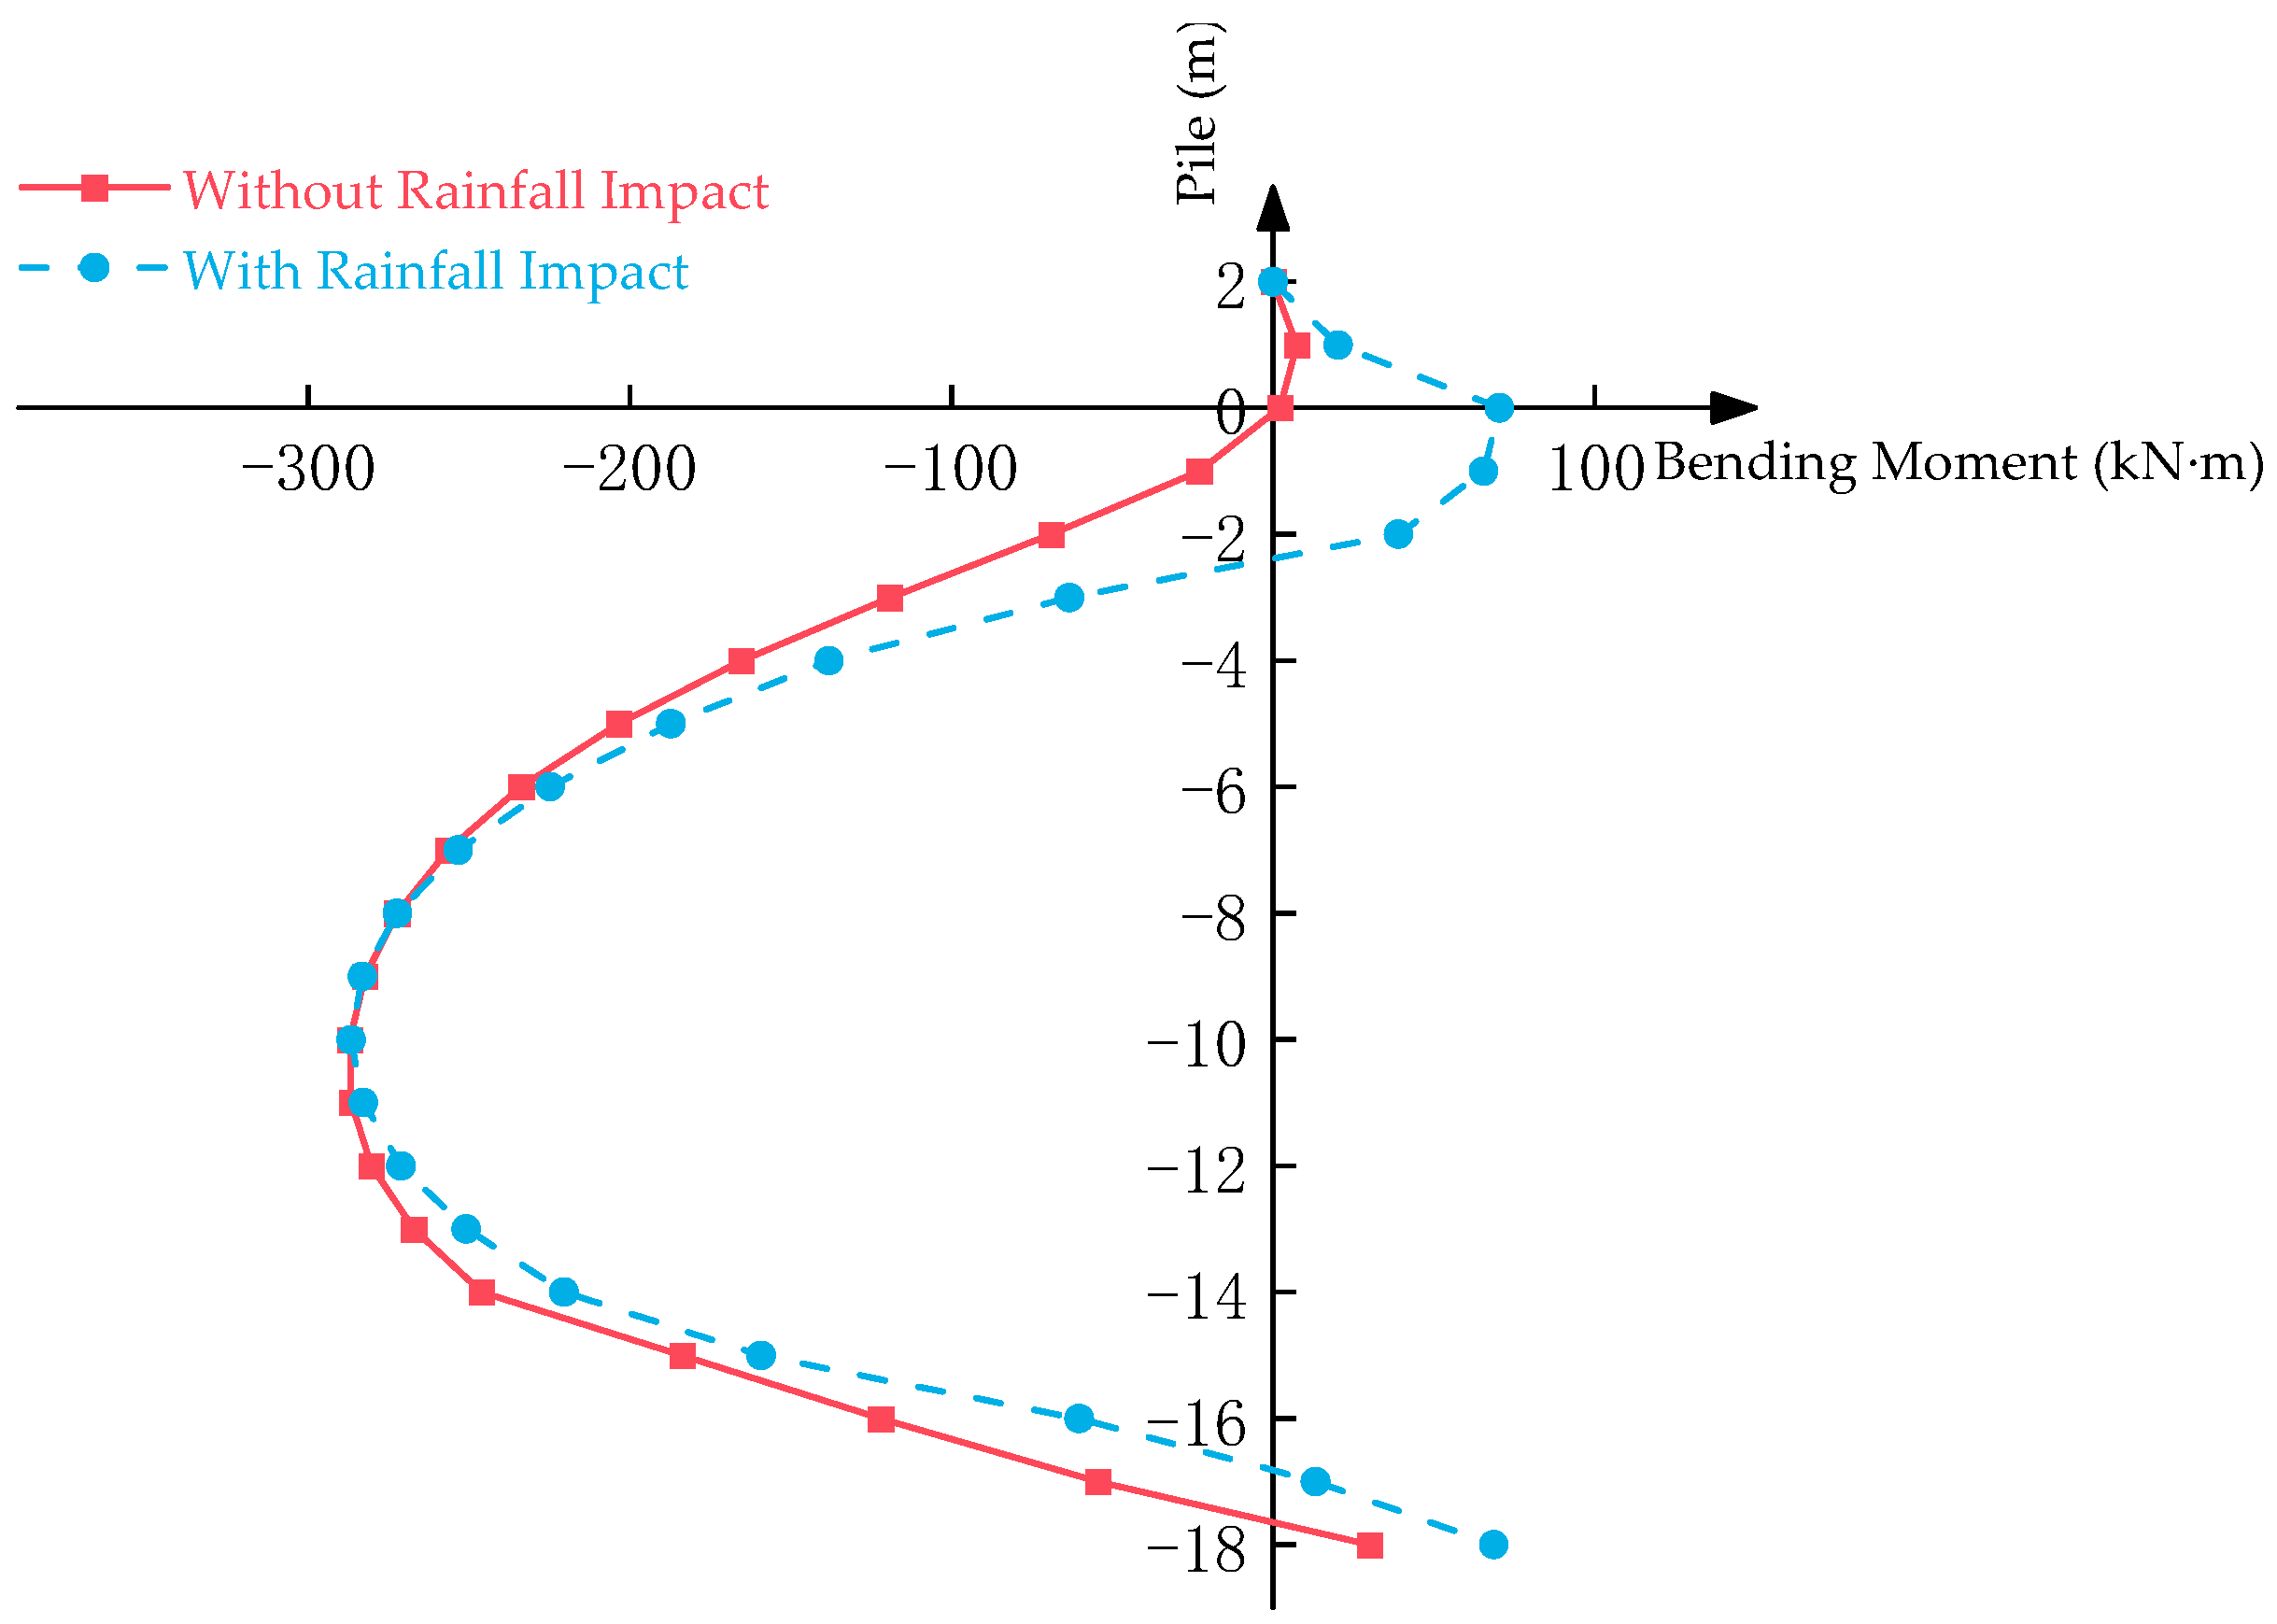
Figure 14 illustrates the bending moments in the upper pile with and without considering rainfall. The bending moments increase, then decrease, and increase again along the pile. The maximum absolute value of the bending moment in the upper pile occurs 10 m below the top of the pile, with a maximum value of 285 kN·m. Considering rainfall, the maximum bending moment remains at the same location, reaching 287 kN·m. The introduction of rainfall has some impact on the bending moments in the upper pile, particularly within the 0 to 4 m range from the top, but the change in the maximum bending moment value is not significant.

Figure 14.
Bending moments in the upper pile comparison.
The simulated value, measured value, and theoretical value of the bending moment of the subordinate anti-skid pile are compared, as shown in Figure 15.
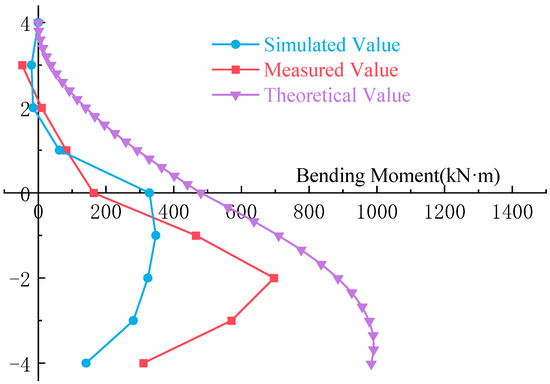
Figure 15.
Comparison of bending moment results of lower anti-skid pile.
From Figure 15, the simulated value, measured value, and theoretical value are basically the same rules. The bending moment value increases first and then decreases as the pile goes down.
The calculated bending moment value of the pile is greater than that of the simulated and measured values. The main reason lies in the theoretical calculation. The maximum value of the expansion force after the pile is taken as the theoretical calculation value to calculate the pile bending moment, while the measured value of the expansion force after the pile is less than the maximum value, so the calculated bending moment value is too large.
The distribution of the simulated pile moment is roughly the same as the measured value. This demonstrates the correctness and feasibility of this numerical simulation. However, there are still deviations between the simulated and measured values. First, for the geotechnical engineering problems, the actual working conditions on the site are far more complex than the numerical simulation, and no numerical software can completely or accurately simulate the actual working conditions. Secondly, this paper uses the two-dimensional plane problem to establish the model, which has an error with the three-dimensional actual slope. In addition, some unpredictable factors in the site affect the measured value and produce certain errors, such as uneven soil distribution, uneven dry and wet circulation, etc.
3.2. Influence of Pile Length on Internal Forces of Support Structure
Due to the critical role of the pile and anchor rods in resisting landslide forces, the impact of pile length and anchor rod prestress on the internal forces of the slope support structure is investigated.
3.2.1. Influence of Upper Pile Length
Considering the influence of the upper pile length while keeping other parameters constant, the upper pile length varies from 20 m to 10 m, with a 1 m interval. Taking the shear force at the top of the pile with a length of 20 m as the base value, the shear force at the top of the pile for each pile length is expressed as a ratio to the base value, creating shear force maximum value ratio coefficients. The numerical results are shown in Figure 16, indicating the following:
- (1)
- As the pile length decreases, the shear force maximum value in the upper part of the pile first increases and then decreases, exhibiting inverted C-shaped distribution. When the pile length is 15 m, it reaches the maximum value, at 1.1 times that of the base value. Considering rainfall, the shear force maximum value in the upper part increases with decreasing pile length, reaching a maximum of 1.25 times that of the base value. This suggests a noticeable influence of rainfall on the shear force maximum value in the upper part.
- (2)
- The shear force maximum value in the lower part of the pile first decreases, then increases, and then decreases again, forming S-shaped distribution. Considering rainfall, the shear force maximum value in the lower part increases first and then decreases, showing inverted C-shaped distribution. When the pile length is 16 m, it reaches the maximum value, at 1.04 times that of the base value. This indicates a significant influence of rainfall on the shear force maximum value in the lower part.
- (3)
- According to the principles of static equilibrium, the shear force in the upper part of the pile is equal to the horizontal component of the landslide thrust. Thus, when the pile length is 15 m, the pile bears the maximum landslide thrust.
- (4)
- The shear force in the lower part is the horizontal component of the anchoring force. Ideally, a larger value is better, but longer piles result in higher costs. Therefore, when considering slope safety, a shorter pile length is preferable. The software calculations reveal that, when the upper pile length is 15 m, the slope remains safe and reliable. Thus, it is recommended to set the upper pile length to 15 m.

Figure 16.
Shear force maximum value ratio coefficients vs. pile length.
Figure 16.
Shear force maximum value ratio coefficients vs. pile length.
Taking the bending moment at the top of the pile with a length of 20 m as the base value, the bending moment at the top of the pile for each pile length is expressed as a ratio to the base value, creating bending moment maximum value ratio coefficients. The results are shown in Figure 17, indicating the following:
- (1)
- The lower pile bending moment maximum value does not show a clear change with variations in the upper pile length, suggesting a minor impact of the upper pile length on the lower pile bending moment. The upper pile bending moment maximum value nonlinearly decreases with decreasing pile length. When the pile length is 10 m, the bending moment is minimized, reaching 0.32 times that of the base value, mainly due to the decrease in the shear force and pile length.
- (2)
- After considering rainfall, the influence of changes in the upper pile length on the lower pile bending moment is still minor. The upper pile bending moment first decreases and then increases with decreasing pile length. When the pile length is 12 m, the bending moment is minimized, reaching 0.43 times that of the base value.
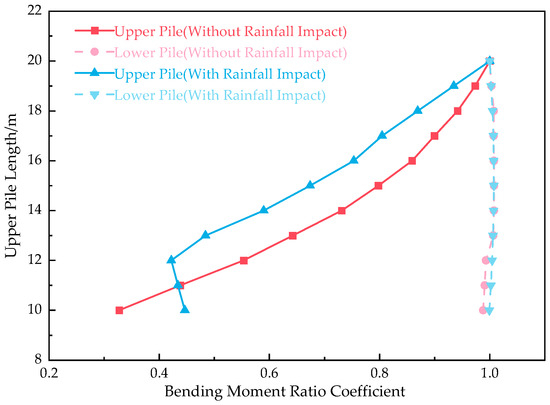
Figure 17.
Bending moment maximum value ratio coefficients vs. pile length.
Figure 17.
Bending moment maximum value ratio coefficients vs. pile length.
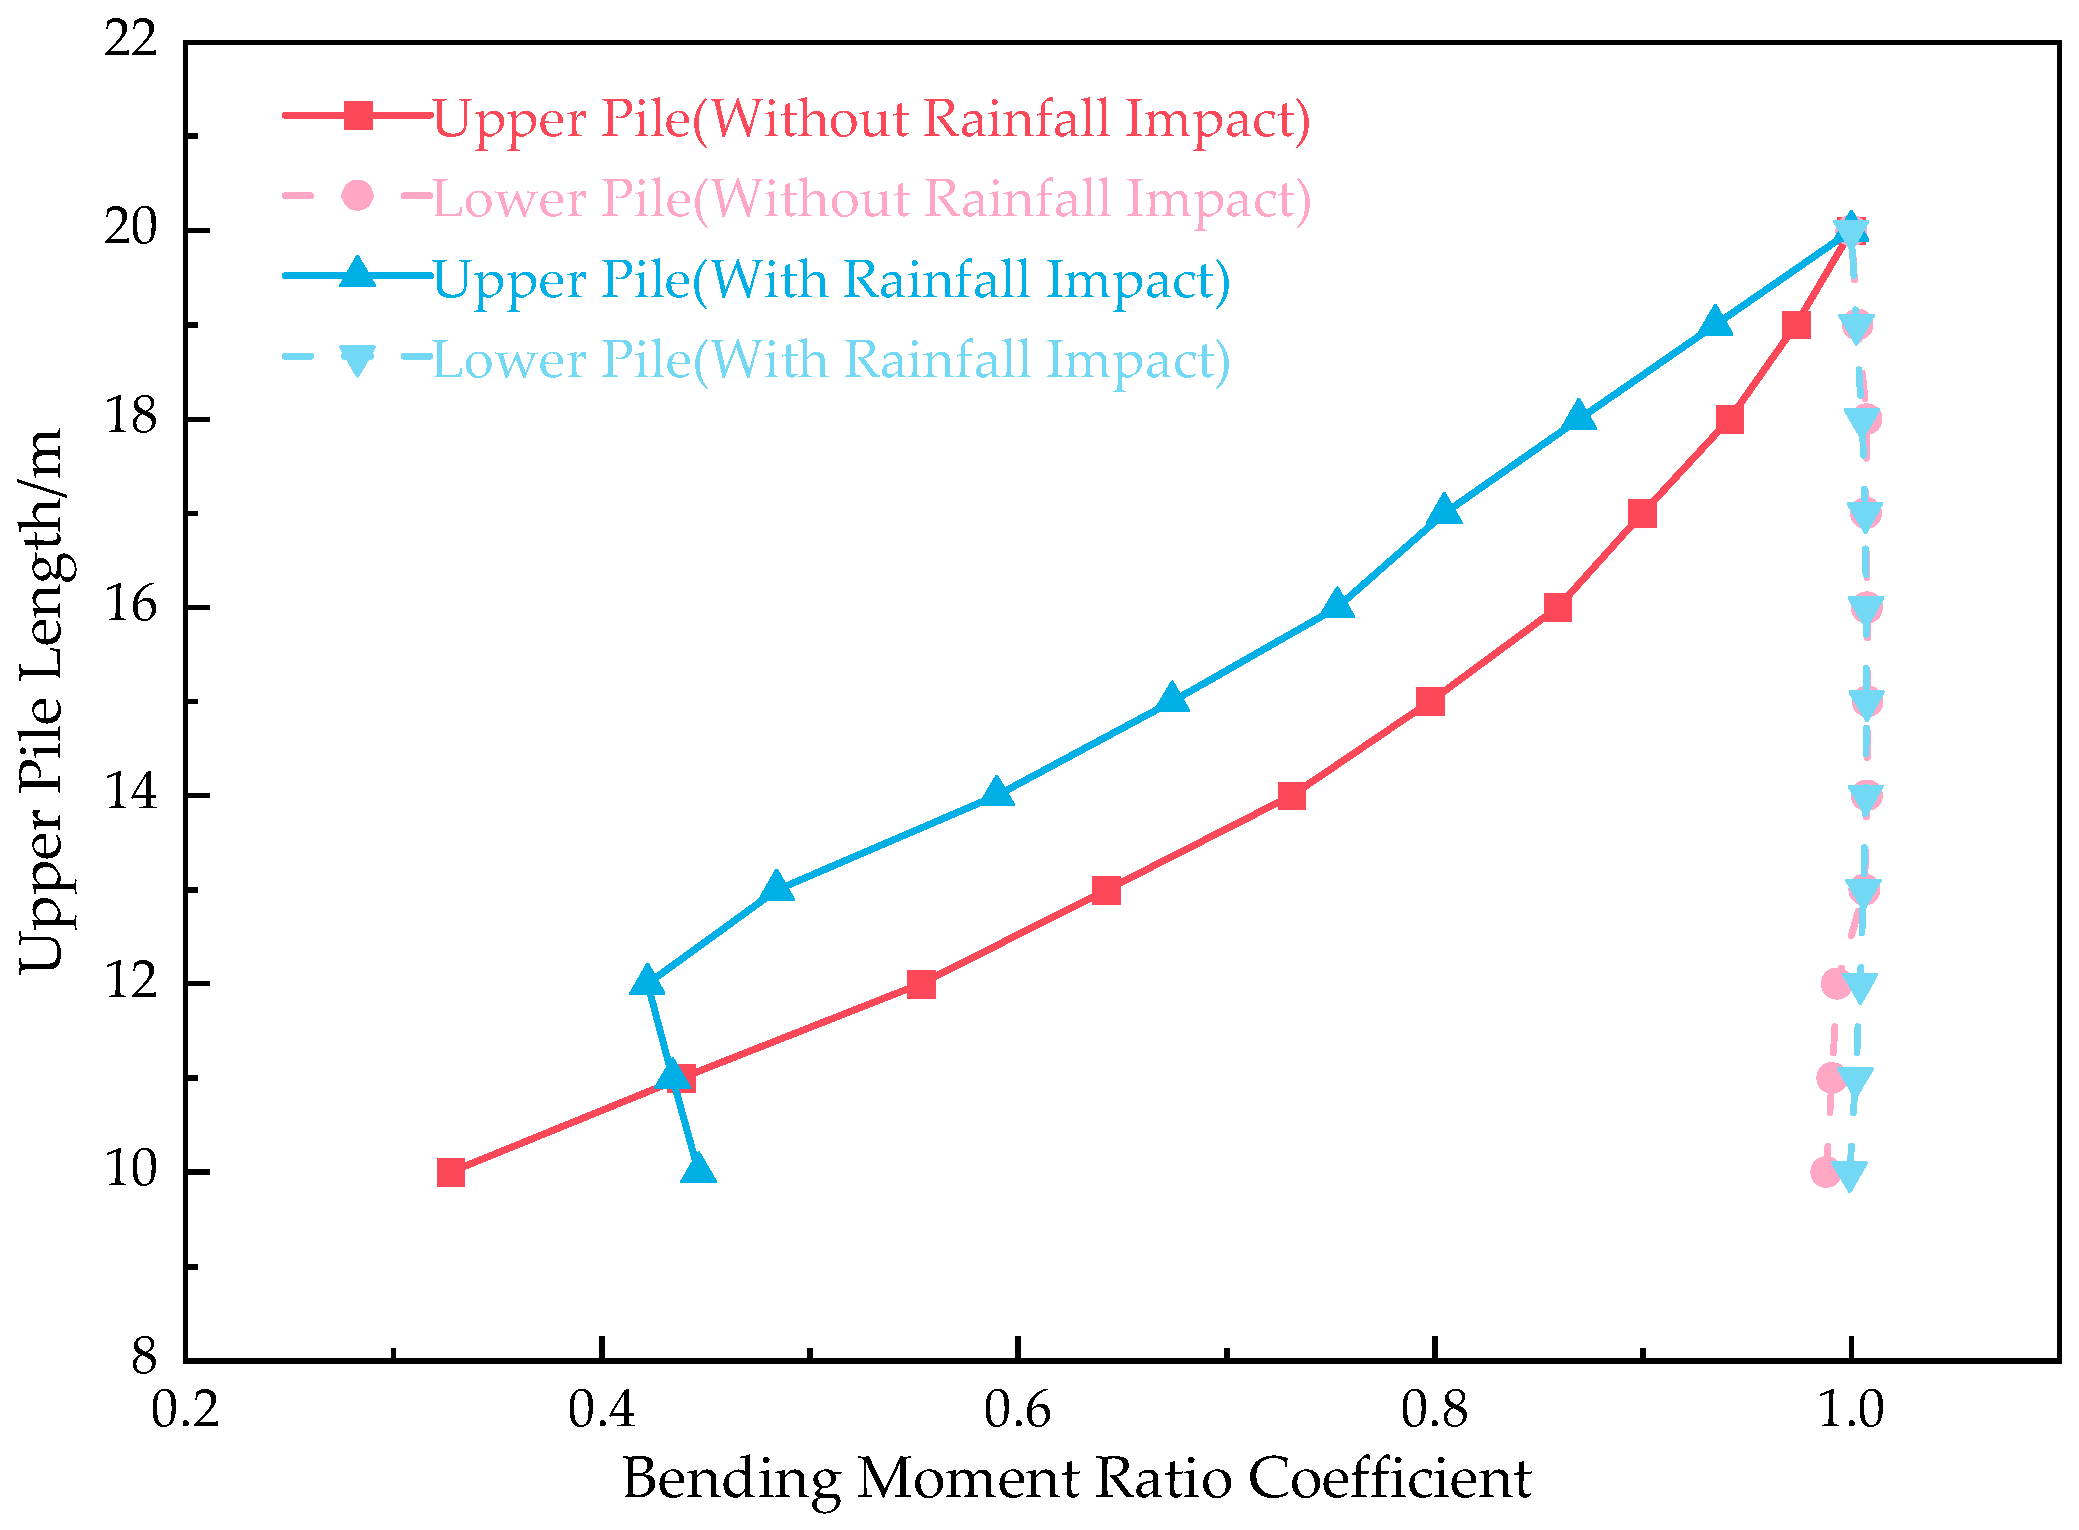
Table 5 provides information on the variation of beam moments and anchor rod tensions with pile length. It can be observed that the beam moments and anchor rod tensions are minimally affected by changes in the upper pile length. After considering rainfall, the maximum values of the anchor rod beam moments nearly double, while anchor rod tensions increase by 41%.
Table 5.
Variation of beam moments and anchor rod tensions with upper pile length.
3.2.2. Influence of Lower Pile Length
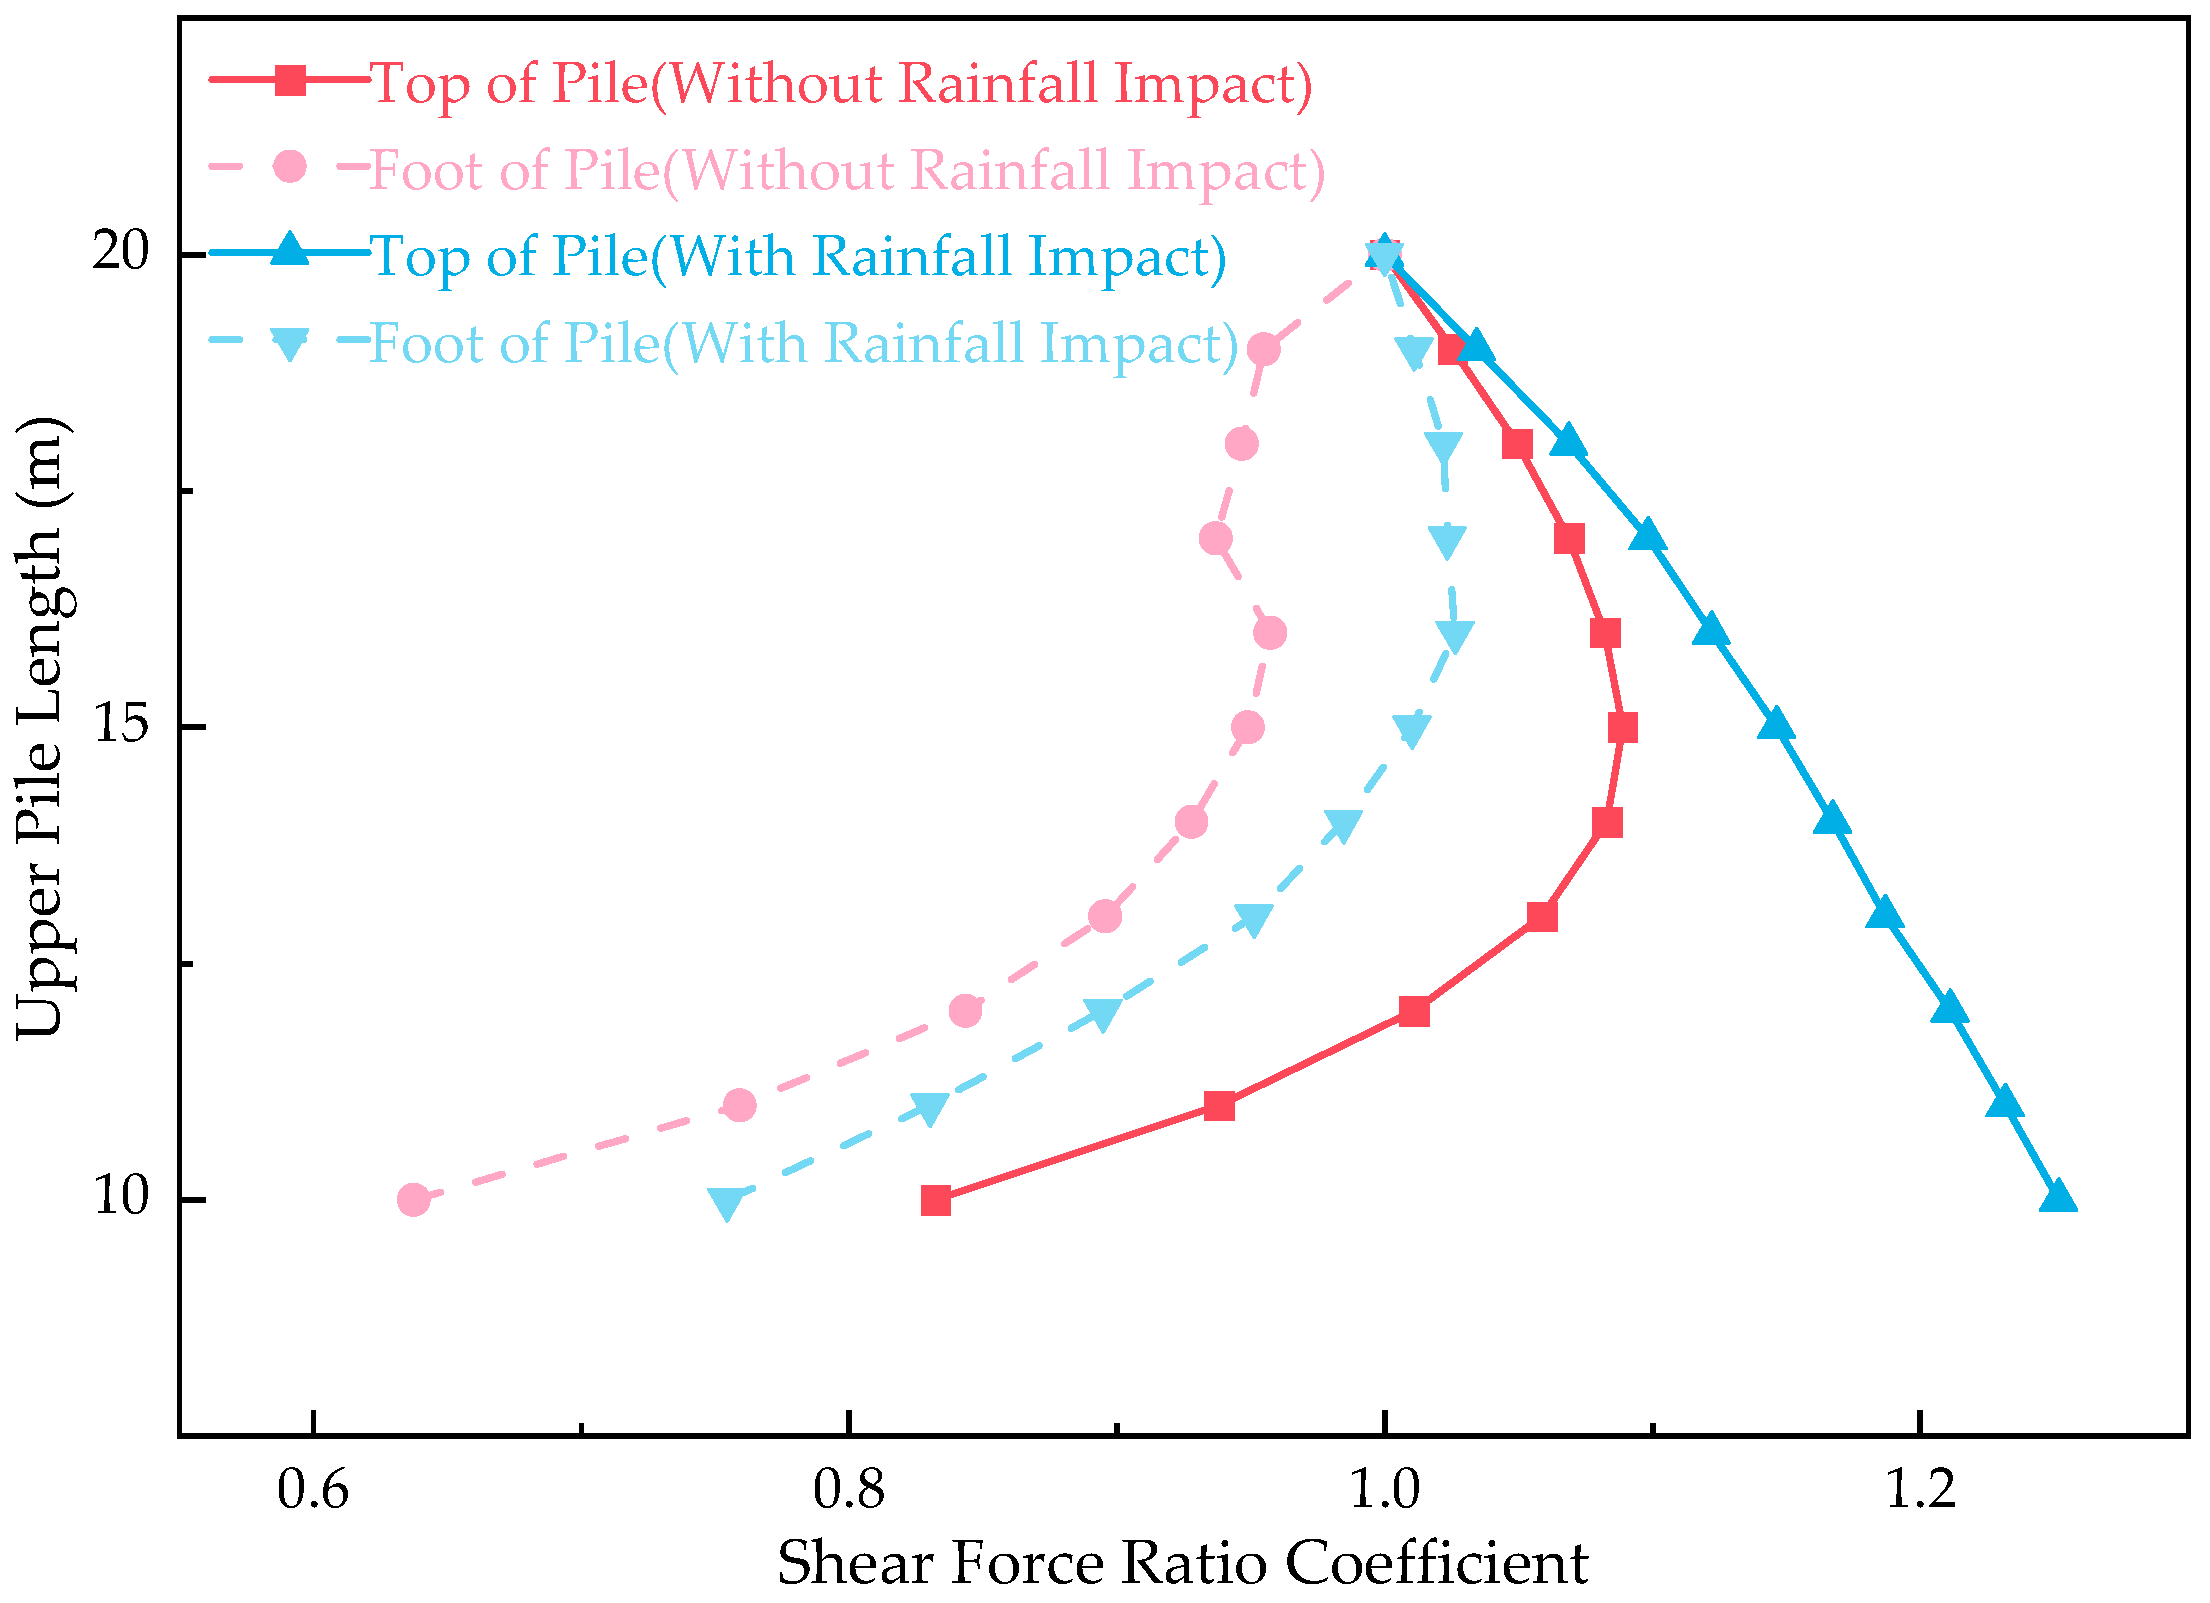
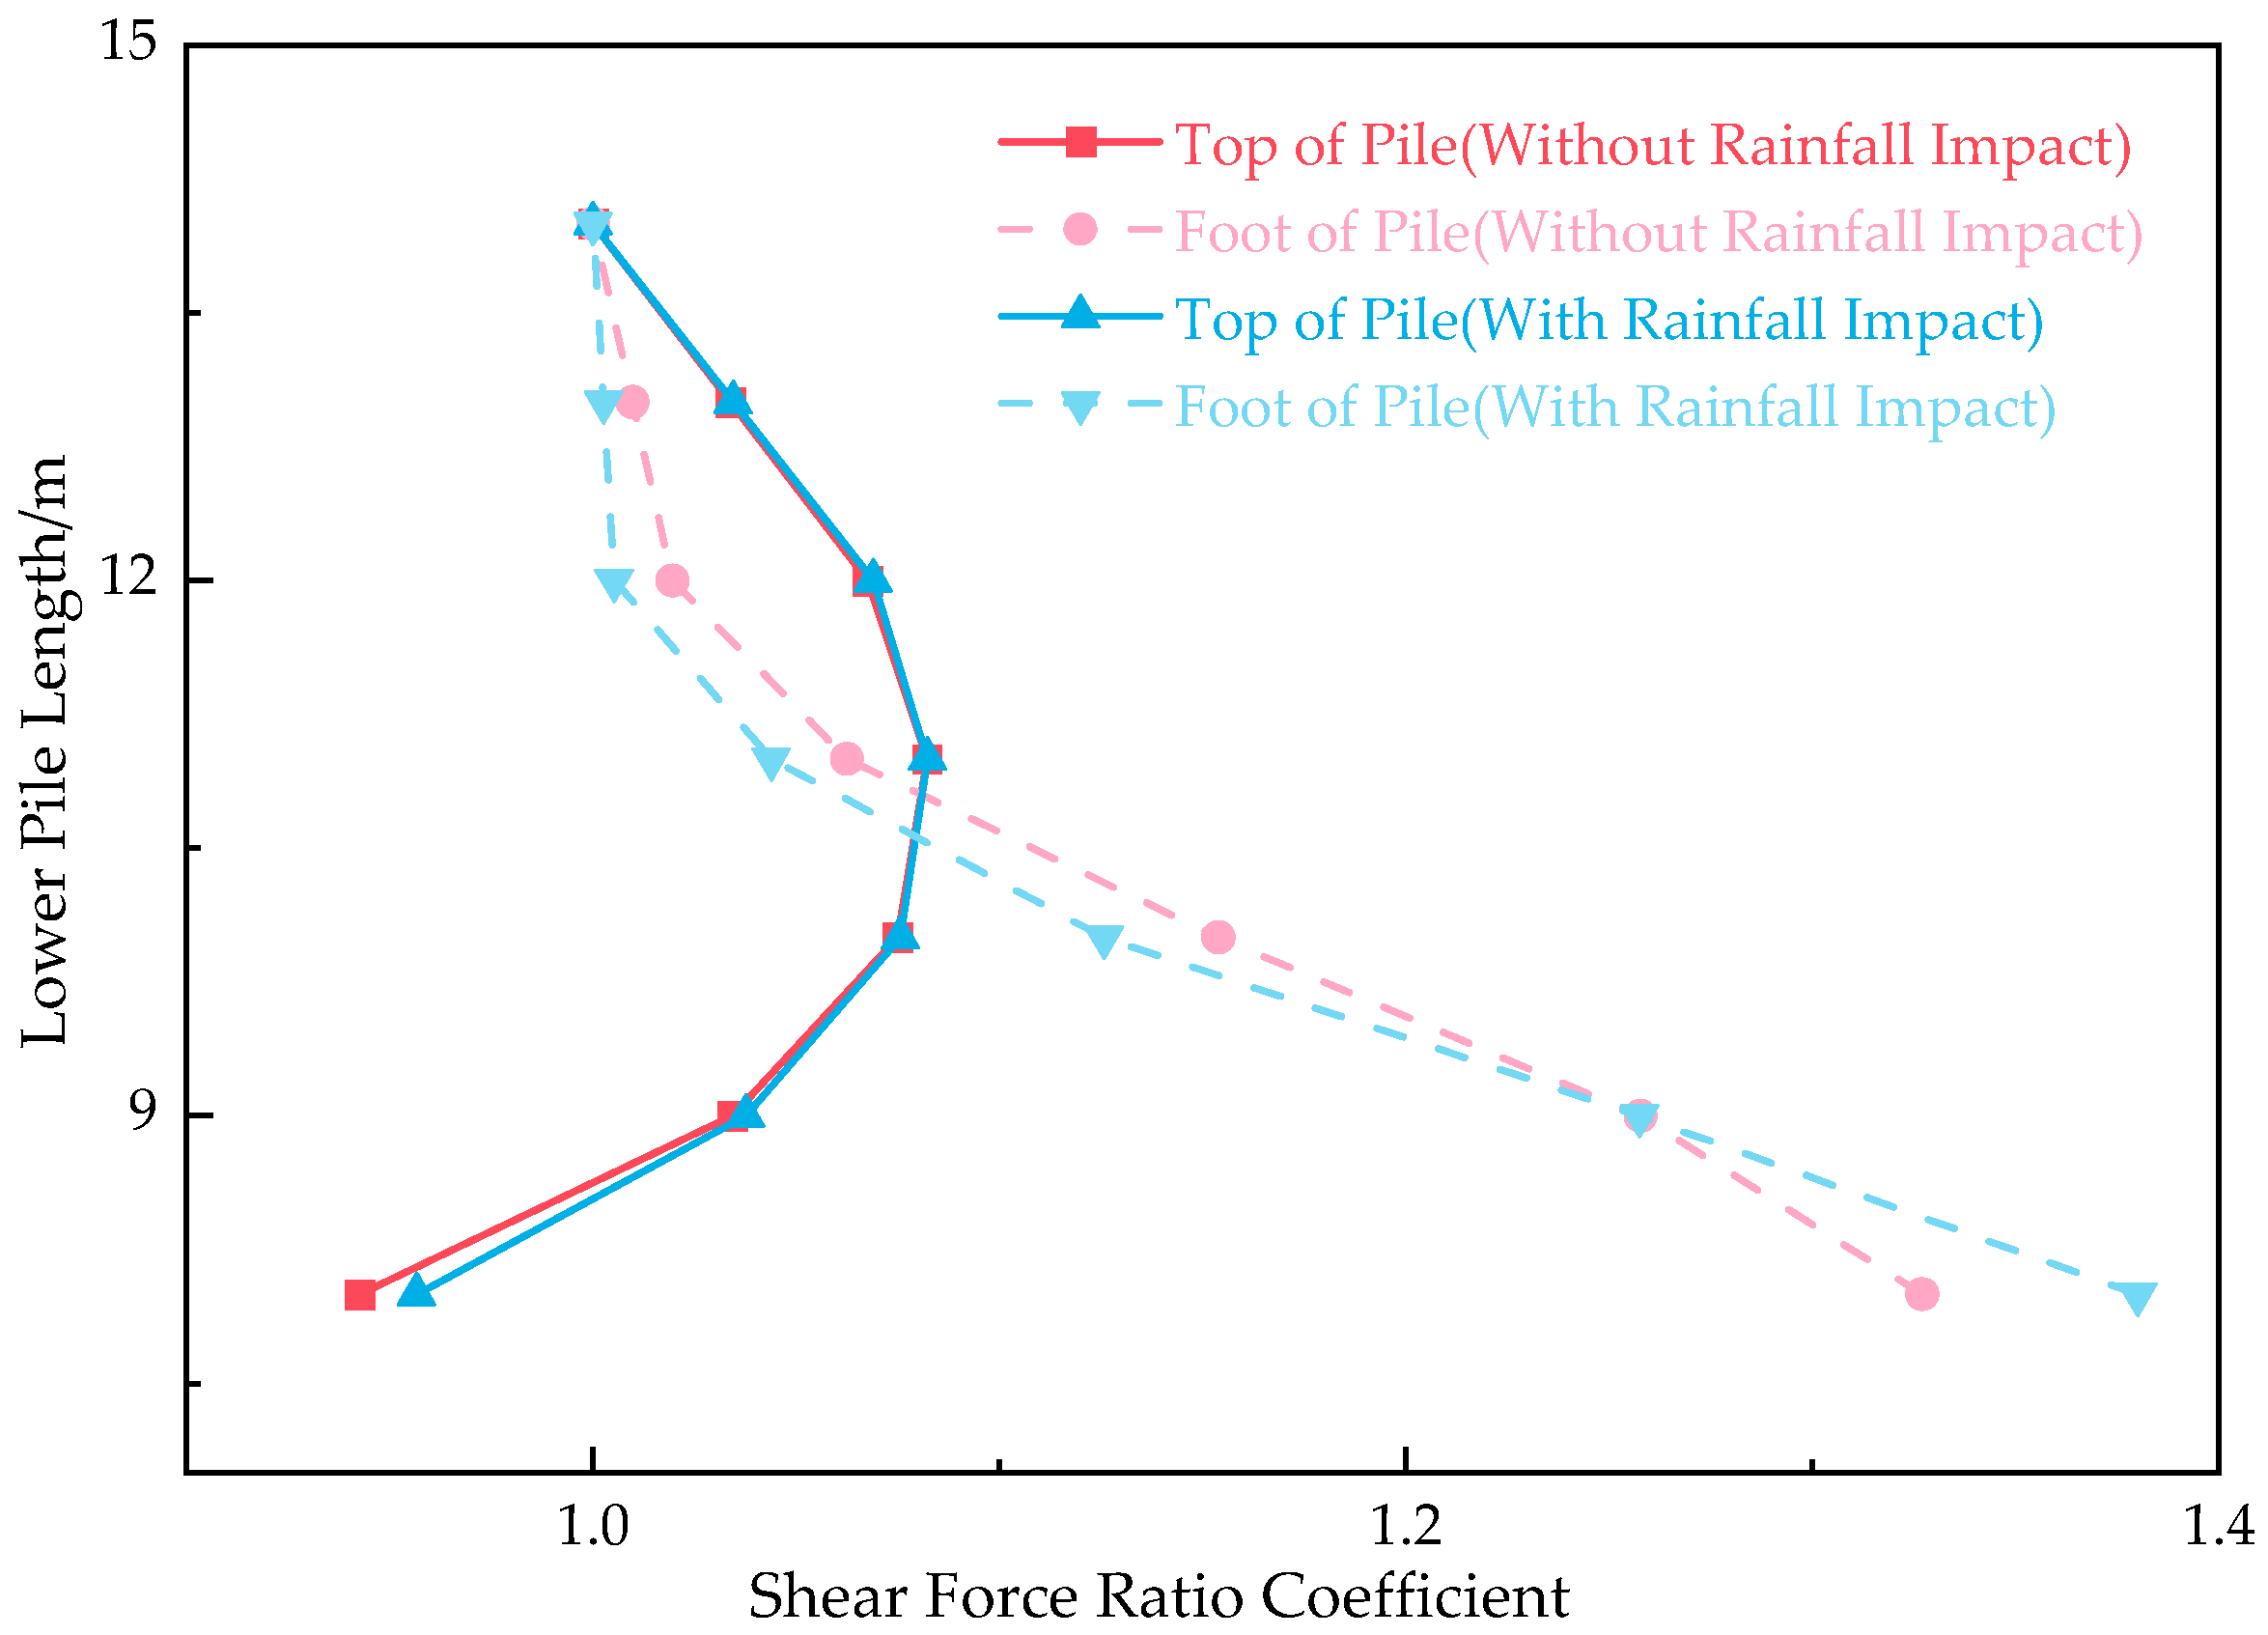
Considering the impact of the lower pile length, with other parameters held constant, the lower pile length varies from 14 m to 8 m at 1 m intervals. Figure 17 illustrates the ratio of the maximum shear force with respect to the pile length. From Figure 18, we can observe the following:
- (1)
- The maximum shear force at the lower part of the pile increases as the pile length decreases. When the pile length is 8 m, the maximum shear force reaches 1.33 times that of the reference value. Considering the influence of rainfall, the pattern of the maximum shear force at the lower part remains consistent with the variation in pile length. However, when the pile length is 8 m, the maximum shear force becomes 1.39 times that of the reference value. This indicates that rainfall leads to an increase in the maximum shear force at the lower part of the pile.
- (2)
- No matter whether there is rainfall or not, the maximum shear value of the upper part of the pile increases and then decreases with the decrease in the length of the lower pile, showing an anti-C distribution. In addition, when the pile length is 11 m, the maximum value is taken, and the maximum value is 1.1 times that of the base. It can be seen that, when considering the influence of the lower pile length, the rainfall has very little influence on the maximum shear value of the upper part of the pile.
- (3)
- According to the software calculations, when the lower pile length is 11 m, the slope remains safe and reliable. Therefore, it is recommended to set the lower pile length to 11 m.
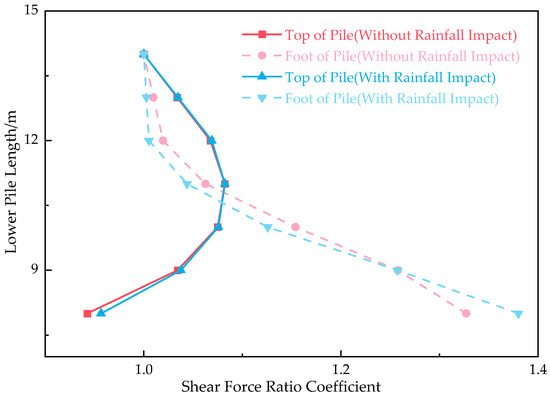
Figure 18.
Variation pattern of shear force maximum value ratio with pile length.
Figure 18.
Variation pattern of shear force maximum value ratio with pile length.
For a lower pile length of 14 m, the maximum bending moment is taken as the reference value of 1. The ratio of the maximum bending moment with respect to the pile length is shown in Figure 19. From Figure 19, the following observations can be made:
- (1)
- The maximum bending moment of the upper pile body shows little variation with changes in the lower pile length. This suggests that changes in the lower pile length have a minor impact on the maximum bending moment of the upper pile body. Considering the influence of rainfall, the variation in the lower pile length has a similarly minor effect on the maximum bending moment of the upper pile body.
- (2)
- The maximum bending moment of the lower pile body initially increases and then decreases, showing reverse ‘C’-shaped distribution. When the pile length is 11 m, the maximum value is 1.2 times that of the reference value. The variation pattern of the maximum bending moment of the lower pile body is consistent with the pattern of the upper pile shear force with changes in pile length. Considering the impact of rainfall, the variation pattern of the maximum bending moment of the lower pile body remains consistent with changes in pile length. When the pile length is 11 m, the maximum bending moment becomes 1.18 times that of the reference value. Rainfall leads to an increase in the maximum bending moment of the lower pile body.
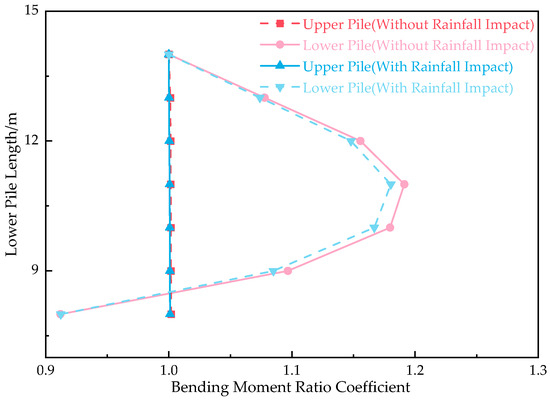
Figure 19.
Variation pattern of bending moment maximum value ratio with pile length.
Figure 19.
Variation pattern of bending moment maximum value ratio with pile length.
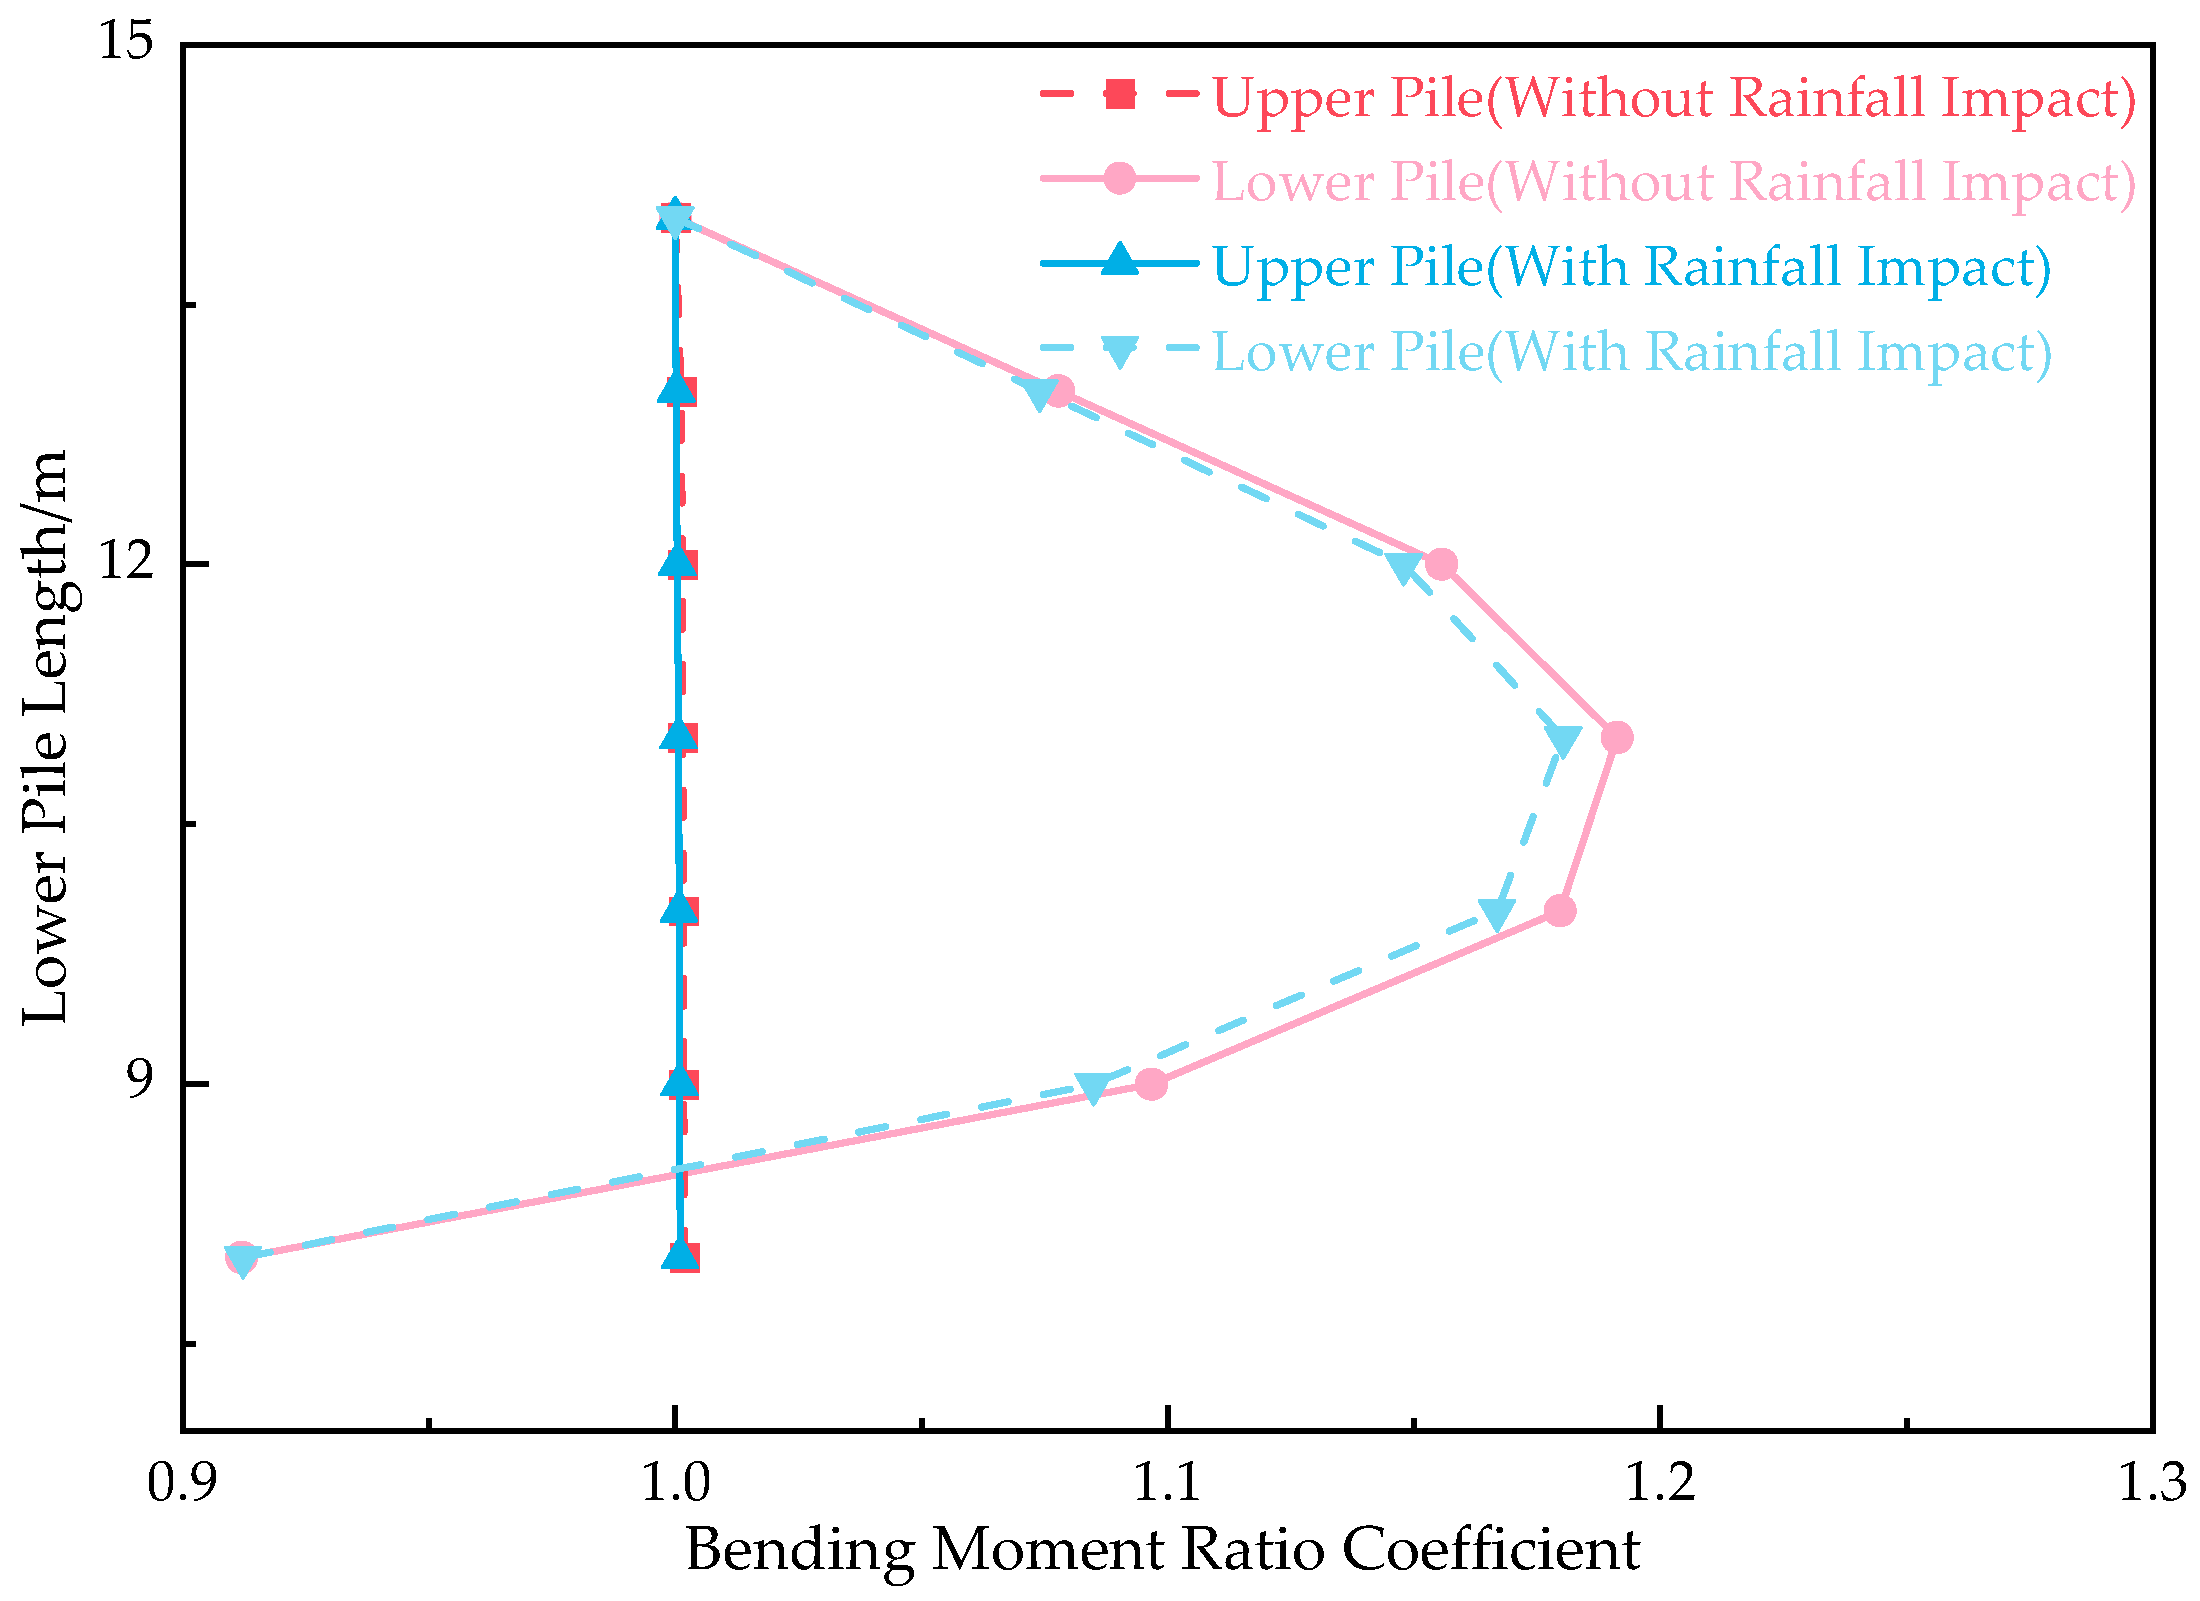
Table 6 shows the bending moment of the frame beam and anchor bolt tension changing with the pile length. From Table 6, it can be observed that the beam moments of the frame and the tension in the anchor rod generally remain unchanged. However, after considering the impact of rainfall, the maximum beam moment of the anchor rod frame nearly doubles, from 9.16 to 18.55, while the maximum moment of the anchor frame increases by 18%, from 1.02 to 1.23, and the maximum force of the anchor increases by 40%, from 2.64 to 3.73.
Table 6.
Variation of beam moments and anchor rod tensions with lower pile length.
3.3. Anti-Sliding Pile Optimization
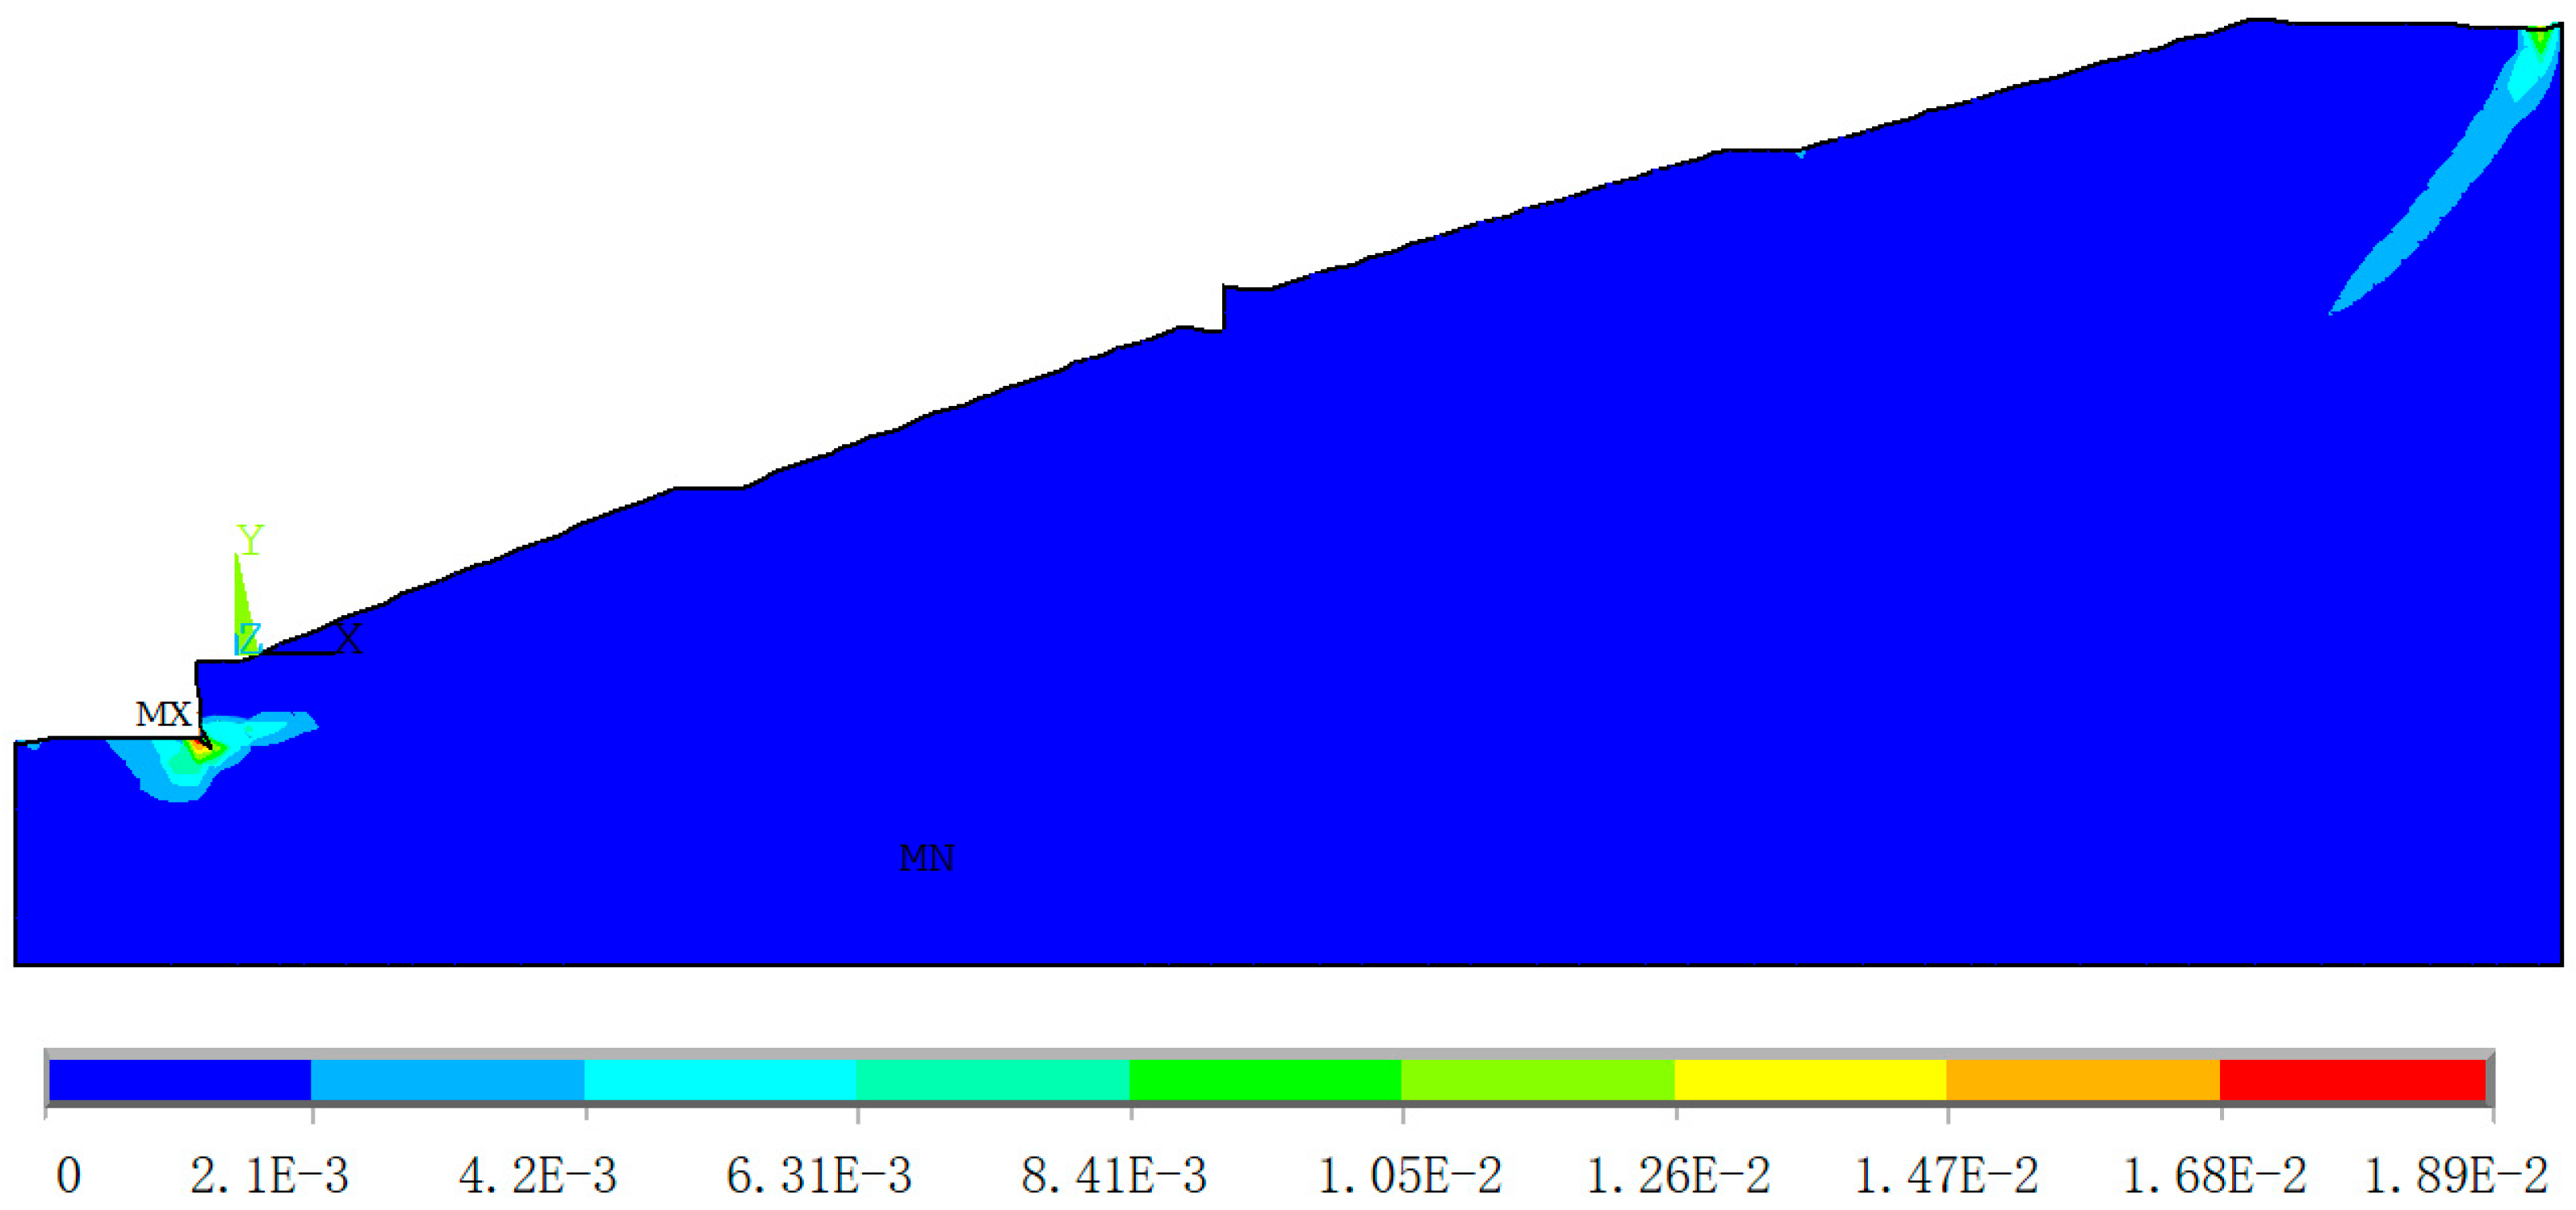
The results of the numerical analysis suggest that the recommended length for the upper anti-sliding piles is 15 m, and, for the lower ones, it is 11 m. When the length of the upper pile is set to 15 m, and the lower pile to 11 m, with the other parameters unchanged, the slope’s safety factor is calculated using the strength reduction method. The software calculations indicate that, when the safety factor of the slope reaches 1.45, the software calculations do not converge. The plastic strain contour of the slope is illustrated in Figure 20. From Figure 20, it can be observed that the plastic strain in the slope does not fully penetrate; moreover, only the localized plastic strain is significant, leading to non-convergence in the calculation. This indicates that the safety factor of the slope is ≥1.45, ensuring the stability and reliability of the slope [38].

Figure 20.
Slope plastic strain contour.
According to the software calculations, when the length of the upper anti-sliding pile is 15 m and the lower anti-sliding pile is 11 m, the maximum moment of the pile body is 421.5 kN·m, significantly less than the design value of 814.73 kN·m for the anti-sliding pile. Therefore, with the current design dimensions and reinforcement of the pile body, the requirements are met. Consequently, each upper anti-sliding pile can be optimized by 5 m, and each lower anti-sliding pile can be optimized by 3 m.
4. Discussion
In this study, a numerical simulation analysis was conducted on a high slope composed of expansive soil and its supporting structure. The effects of rainfall and pile length on the internal forces within the expansive soil slope and the supporting structure were investigated. Although valuable conclusions were drawn, some limitations remain, and directions for future research and applications are suggested.
First, an approximate method for calculating the humidity stress field of expansive soil, based on the equivalent humidity stress field of the temperature field, was proposed to simulate the impact of rainfall on the expansive soil slope. While this method effectively simulates the effects of rainfall on slope stability, the assumptions and simplifications may not fully reflect the complex water–soil interactions in real-world conditions. Future research should further optimize this method, incorporating more field data to enhance its accuracy. Additionally, the parameters of the humidity stress field were primarily determined through numerical simulations and field testing, but their adaptability to different climatic conditions and soil properties requires further validation. Future studies could explore various site conditions to verify this approach.
Second, this study revealed the shear force and bending moment distribution patterns of both the upper and lower piles, providing a theoretical basis for optimizing pile length design. However, these findings were derived under specific slope conditions. Future research could expand the scope to investigate the mechanical behavior of different types of soil and slopes. Furthermore, this study highlighted how rainfall affects the shear force distribution in the piles, emphasizing the importance of rainfall in slope support design. However, the effects of varying rainfall intensity and frequency require further investigation to address the complex climatic conditions in practical engineering projects.
Regarding the optimization design, this study proposed reducing the lengths of the upper and lower piles by 5 m and 3 m, respectively, using the finite element strength reduction method. This resulted in a slope safety factor of ≥1.45 and a cost savings of RMB 420,000 for the piles. However, the applicability of this optimization scheme needs further verification under different slope conditions and support types. Future studies could also explore the use of intelligent optimization algorithms to improve design efficiency and cost savings.
5. Conclusions
A numerical simulation analysis was performed on a high slope composed of expansive soil, coupled with its supporting structure. This study examined the effects of rainfall and pile length on the internal forces within the expansive soil slope and the supporting structure. Additionally, the optimization of the supporting structure for the high slope was investigated. The conclusions drawn are as follows:
- (1)
- An approximate method for calculating the humidity stress field of expansive soil, based on the equivalent humidity stress field of the temperature field, was proposed to simulate the impact of rainfall on the expansive soil slope. The relevant parameters were determined through a combination of numerical simulation and in situ testing.
- (2)
- Both upper and lower piles exhibit distinct patterns in their shear force and bending moment distributions along their bodies. In the cantilever section of both piles, the shear force gradually decreases, while, in the anchorage section, it first increases and then decreases. The bending moment along the upper pile body shows an increase–decrease–increase pattern, whereas the lower pile body exhibits a decrease–increase–decrease–increase pattern. Notably, the bending moment along the longitudinal axis of the lower anti-sliding pile demonstrates a characteristic “W” shape.
- (3)
- Decreasing the length of the upper anti-sliding pile results in an initial increase followed by a decrease in the maximum shear force in its upper part, forming inverted “C” distribution. Conversely, the maximum shear force in the lower part of the upper pile initially decreases and then increases, showing “S” distribution. Considering the influence of rainfall, the maximum shear force in the lower part of the pile initially increases and then decreases, displaying inverted “C” distribution. Rainfall notably impacts the maximum shear forces in both the upper and lower parts of the upper pile.
- (4)
- Similarly, reducing the length of the lower anti-sliding pile leads to an initial increase followed by a decrease in the maximum shear force in its upper part, resulting in inverted “C” distribution. Meanwhile, the maximum shear force in the lower part of the lower pile increases. The rainfall has very little influence on the maximum shear value of the pile.
Author Contributions
Conceptualization, Q.S. and Y.Z.; methodology, Q.S.; software, Q.S.; validation, Q.S., Y.Z. and Y.Y.; investigation, Y.Y.; resources, Q.S.; data curation, Y.Y.; writing—original draft, Y.Z.; writing—review and editing, Y.Y.; visualization, C.W.; funding acquisition, Q.S. All authors have read and agreed to the published version of the manuscript.
Funding
This research was funded by the National Natural Science Foundation of China (Grant No. 41672296), the Guangxi Key Laboratory of Disaster Prevention and Mitigation and Engineering Safety (Grant No. 2019ZDX02), and the Natural Science Foundation of Hunan Province (Grant No. 2023JJ50183).
Data Availability Statement
The data presented in this study are available on request from the corresponding author on reasonable request.
Conflicts of Interest
The authors declare no conflicts of interest.
References
- Pei, P.; Zhao, Y.L.; Ni, P.P.; Mei, G.X. A protective measure for expansive soil slopes based on moisture content control. Eng. Geol. 2020, 269, 105527. [Google Scholar] [CrossRef]
- Jiang, G.; Chen, W.; Liu, X.; Yuan, S.; Wu, L.; Zhang, C. Field study on swelling-shrinkage response of an expansive soil foundation under high-speed railway embankment loads. Soils Found. 2018, 58, 1538–1552. [Google Scholar] [CrossRef]
- Chen, W.; Sun, D.; Zhang, J. The maximum shear modulus of expansive soil during wetting-drying processes and its prediction. Hydrogeol. Eng. Geol. 2021, 48, 89–96. [Google Scholar]
- Jiang, Z.; Zeng, L.; Li, A. Technical research on subgrade slope engineering in construction of Nanning-Kunming Railway. Chin. J. Rock Mech. Eng. 2002, 09, 1408–1414. [Google Scholar]
- Feng, Z.J.; Feng, J.D.; Xue, Y.; Yang, G.; He, X. Application of flexible retaining walls in the engineering of strong expansive soil cut slopes on the Yungui Railway. High-Speed Railw. Technol. 2012, 3, 71–73+78. [Google Scholar]
- Comodromos, E.M.; Papadopoulou, M.C. Pile foundation analysis and design using experimental data and 3-D numerical analysis. Comput. Geotech. 2009, 36, 819–836. [Google Scholar] [CrossRef]
- Kim, Y.; Jeong, S.S. Analysis of soil resistance on laterally loaded piles based on 3D soil–pile interaction. Comput. Geotech. 2011, 38, 248–257. [Google Scholar] [CrossRef]
- Yang, X.X.; Ren, J. Diseases features and treatment measures of expansive-soil channel slope. Adv. Mater. Res. 2012, 430–432, 1390–1394. [Google Scholar] [CrossRef]
- Tang, X.Y.; Li, Y.P. Treatment technology for embankment landslide caused by expansive soil foundation instability. Appl. Mech. Mater. 2012, 204–208, 3035–3039. [Google Scholar] [CrossRef]
- Sun, H.; Hu, B. Analysis of fissured expansive soil slope stability and its reinforcement with anti-slippery piles. Appl. Mech. Mater. 2013, 275–277, 1489–1492. [Google Scholar] [CrossRef]
- He, H.; Xu, Y. A study on micro pile reinforcement technology for the accumulative landslide of expansive soil. Appl. Mech. Mater. 2014, 580–583, 544–551. [Google Scholar] [CrossRef]
- Cai, F.; Ugai, K. Numerical analysis of the stability of a slope reinforced with piles. Soils Found. 2000, 40, 73–84. [Google Scholar] [CrossRef]
- Won, J.; You, K.; Jeong, S.; Kim, S. Coupled effects in stability analysis of pile-slope systems. Comput. Geotech. 2005, 32, 304–315. [Google Scholar] [CrossRef]
- Nian, T.K.; Chen, G.Q.; Luan, M.T.; Yang, Q.; Zheng, D.F. Limit analysis of the stability of slopes reinforced with piles against landslide in nonhomogeneous and anisotropic soils. Can. Geotech. J. 2008, 45, 1092–1103. [Google Scholar] [CrossRef]
- Kanagasabai, S.; Smethurst, J.A.; Powrie, W. Three-dimensional numerical modelling of discrete piles used to stabilize landslides. Can. Geotech. J. 2011, 48, 1393–1411. [Google Scholar] [CrossRef]
- Gao, Y.; Ye, M.; Zhang, F. Three-dimensional analysis of slopes reinforced with piles. J. Cent. South Univ. 2015, 22, 2322–2327. [Google Scholar] [CrossRef]
- Zhang, Y. A preliminary analysis of the distribution of lateral pressure on retaining walls with expansive clay backfill. China Railw. Sci. 1993, 14, 90–99. [Google Scholar]
- Richards, B. Pressures on a retaining wall by an expansive clay. In Proceedings of the 9th International Conference on Soil Mechanics and Foundation Engineering, Dallas, TX, USA, 11 July 1977; pp. 705–710. [Google Scholar]
- Mohamed, O.; Taha, Y.; El-Aziz, E. Field study of the distribution of lateral swelling pressure of expansive soil on retaining structure. JES J. Eng. Sci. 2014, 42, 289–302. [Google Scholar] [CrossRef]
- Khattab, S.; Al-Shamam, M.; Al-Juari, K. Model test on lateral earth pressure of highly expansive soil. In Unsaturated Soil Mechanics—From Theory to Practice; CRC Press: Boca Raton, FL, USA, 2015; pp. 709–716. [Google Scholar]
- Kassiff, G.; Zeitlen, J. Lateral swelling pressure on conduits from expansive clay backfill. Highw. Res. Board Bull. 1962, 313, 1–11. [Google Scholar]
- Wang, H.; Zhang, L.; Shi, C.; Zhao, L.; Zhang, Y. Comparative Study of Anti-Slide Pile Reinforcement Schemes for Expansive Soil Canal Slopes in Cold and Arid Regions. KSCE J. Civ. Eng. 2024, 28, 3741–3757. [Google Scholar] [CrossRef]
- Zhang, R.; Liu, Z.; Zheng, J.; Zhang, J. Experimental evaluation of lateral swelling pressure of expansive soil fill behind a retaining wall. J. Mater. Civ. Eng. 2020, 32, 04019360. [Google Scholar] [CrossRef]
- Lin, Y.; Zhang, Z.; Luo, G.; Xiao, H.; Yang, G.; Lu, L.; Duan, J. Analysis of lateral swelling pressure of expansive soil slope and internal force of pile-sheet structure. J. Cent. South Univ. (Sci. Technol.) 2022, 53, 140–149. [Google Scholar]
- Yang, G.; Li, Q.; Duan, J.; Luo, G.; Xiao, H.; Yang, T. Field investigation on mechanical properties of multi-stage combined supporting structure for expansive soil high slopes. J. Cent. South Univ. (Sci. Technol.) 2022, 53, 171–180. [Google Scholar] [CrossRef]
- Yang, Q.; Li, R.; Zhang, S.; Li, R.; Bai, W.; Xiao, H. Algorithm Implementation of Equivalent Expansive Force in Strength Reduction FEM and Its Application in the Stability of Expansive Soil Slope. Water 2022, 14, 1540. [Google Scholar] [CrossRef]
- Wang, A.; Xu, Y.; Xu, Y. Numerical modeling on the deformation features of expansive soil slopes under moisture variations based on fractal model. Comput. Geotech. 2024, 165, 105900. [Google Scholar] [CrossRef]
- Zhang, R.; Long, M.; Lan, T.; Zheng, J.; Geoff, C. Stability analysis method of geogrid reinforced expansive soil slopes and its engineering application. J. Cent. South Univ. 2020, 27, 1965–1980. [Google Scholar] [CrossRef]
- Mei, G.; Zhang, F.; Wei, J.; Yuan, J. Analysis of the expansive soil slope on anti-slide pile with finite element method. J. Jiangsu Univ. Sci. Technol. (Nat. Sci. Ed.) 2010, 2, 130–133. [Google Scholar]
- Li, X.Y.; Jia, G.L.; Yang, G.L.; Deng, Z.H.; Wang, P.F. Field test study of pile-anchor wall on expansive soil cut slope. Constr. Technol. 2022, 51, 94–97+103. [Google Scholar]
- Jiang, H.; Xing, L. Deformation mechanism and treatment effect of deeply excavated expansive soil slopes with high groundwater level: Case study of MR-SNWTP, China. Transp. Geotech. 2024, 46, 101253. [Google Scholar]
- Fan, K.; Zou, W.; Zhang, P.; Wang, X.; Shen, Y. Laboratory investigation and theoretical analysis of lateral pressure exerted by expansive soils on retaining walls with expanded polystyrene geofoam block upon water infiltration. Geotext. Geomembr. 2024, 52, 332–341. [Google Scholar] [CrossRef]
- Liu, G.Y.; Zhong, Z.R.; Ma, K.; Bo, W.; Zhao, P.H.; Li, Y.X.; Zhang, Z.P.; Zhang, P. Field experimental verifications of 3D DDA and its applications to kinematic evolutions of rockfalls. Int. J. Rock Mech. Min. Sci. 2024, 175, 105687. [Google Scholar] [CrossRef]
- Liu, G.Y.; Meng, H.Y.; Song, G.Y.; Bo, W.; Zhao, P.H.; Ning, B.K.; Xu, X.L. Numerical simulation of wedge failure of rock slopes using three-dimensional discontinuous deformation analysis. Environ. Earth Sci. 2024, 83, 310. [Google Scholar] [CrossRef]
- Liu, G.Y.; Zhong, Z.R.; Ye, T.J.; Meng, J.; Zhao, S.Z.; Liu, J.J.; Luo, S.Y. Impact failure and disaster processes associated with rockfalls based on three-dimensional discontinuous deformation analysis. Earth Surf. Process. Landf. 2024, 49, 3344–3366. [Google Scholar] [CrossRef]
- Wang, K.; Diao, X.H. A constitutive model for humidity stress field of expansive rocks. Chin. J. Rock Mech. Eng. 2015, S2, 3781–3792. [Google Scholar]
- Li, Q. Application of ANSYS in Civil Engineering; Posts and Telecom Press: Beijing, China, 2005. [Google Scholar]
- Hu, Y.N.; Ji, J.; Sun, Z.B.; Dias, D. First order reliability-based design optimization of 3D pile-reinforced slopes with Pareto optimality. Comput. Geotech. 2023, 162, 105635. [Google Scholar] [CrossRef]


Disclaimer/Publisher’s Note: The statements, opinions and data contained in all publications are solely those of the individual author(s) and contributor(s) and not of MDPI and/or the editor(s). MDPI and/or the editor(s) disclaim responsibility for any injury to people or property resulting from any ideas, methods, instructions or products referred to in the content. |
© 2024 by the authors. Licensee MDPI, Basel, Switzerland. This article is an open access article distributed under the terms and conditions of the Creative Commons Attribution (CC BY) license (https://creativecommons.org/licenses/by/4.0/).