Article

Mechanical Properties and Stress–Strain Constitutive Relations of Coal-Fired Slag Concrete

by
Jianpeng Zhang
1,
Gang Li
2,*,
Daidong Yu
2,
Yingdong Lei
2 and
Yonghua Zhang
3
1
College of Physical Science and Technology, Yili Normal University, Yining 835000, China
2
College of Water Conservancy and Architecture, Shihezi University, Shihezi 832000, China
3
Audit Department, Yili Normal University, Yining 835000, China
*
Author to whom correspondence should be addressed.
Buildings 2024, 14(10), 3103; https://doi.org/10.3390/buildings14103103
Submission received: 9 September 2024 / Revised: 17 September 2024 / Accepted: 24 September 2024 / Published: 27 September 2024
(This article belongs to the Collection Advanced Concrete Materials in Construction)

Abstract

:
In this study, we conducted a single-factor experiment where fine aggregates in each mixture were replaced with coal-fired slag at replacement rates in the range of 0–100%. We investigated the effect of slag substitution rate on the cubic compressive strength, splitting tensile strength, axial compressive strength, and static modulus of elasticity of slag concrete. Based on the experimental data, the stress–strain curve of the coal-fired slag concrete was divided into four phases: elastic, elasto-plastic, peak, and decline phases. A stress–strain constitutive equation was established to describe the coal-fired slag concrete. A replacement rate of 50% of the formulated coal-fired slag concrete meets the strength requirements of C60 structural applications, and the cubic compressive strength is the same as that of ordinary concrete. Coal-fired slag can be utilized in large quantities, improving the economic value of coal-fired slag and expanding the scope of application of slag concrete.

1. Introduction

In 2022, China’s coal consumption reached 4.41 billion tons, accounting for 56.2% of the country’s total energy consumption [1,2]. The combustion of coal produces two distinct types of solid industrial waste: fly ash, which is fine ash collected from the flue gas emitted during combustion, and slag, which is collected at the bottom of the combustion furnace and is referred to as bottom ash or lump slag [3].
Currently, the utilization of fly ash is relatively advanced, as it is effectively utilized in the production of building materials, such as cement and concrete additives [4,5]. In contrast, slag faces challenges in utilization due to its structural instability, looseness, light weight, and internal porosity [6,7]. Consequently, only a small portion of slag is used in roadbed fillers and brick production [8,9,10]. More than 85% of the slag produced by coal-fired power plants (hereafter referred to as “coal-fired slag”) [11] is either piled in open-air heaps or disposed of in landfills, significantly impacting the surrounding air and soil [5,12,13].
Concrete is widely used construction material, with significant volumes produced annually for various projects. However, concrete production relies heavily on natural sand and stone, both of which have adverse environmental effects. Incorporating coal-fired slag into concrete can assist in mitigating the environmental pollution caused by open slag heaps and reduce the demand for natural sand and stone resources, thereby promoting ecological balance.
Recently, with increased attention to environmental issues, the resource utilization of industrial solid waste, including coal-fired slag, has become a prominent research topic. For example, Singh et al. [14] investigated the effects of substituting fine aggregates with coal slag on the cubic compressive strength and durability of concrete. Their experimental results indicated that although the initial strength of the slag concrete was lower than that of ordinary concrete, its strength growth rate surpassed that of ordinary concrete as it aged. Notably, at 90 d, the strength of the SC exceeded that of ordinary concrete, and it also demonstrated superior dimensional stability and durability. In another study, Huang et al. [15] investigated the effects of substituting river sand with coal gangue powder on the mechanical properties of concrete. They found that a 50% replacement rate for coal gangue powder yielded optimal mechanical performance, with increases in compressive, splitting tensile, and axial compressive strengths of 5.2%, 22.6%, and 13.7%, respectively, compared to conventional concrete. Zhao et al. [16] investigated the use of circulating fluidized bed (CFB) slag in self-compacting recycled aggregate concrete, testing five distinct replacement rates ranging from 0% to 40%. Their results revealed that a 10% replacement rate for CFB slag provided optimal performance, improving by 2.5% relative to the control group. Horiguchi et al. [17] investigated the feasibility of using coal gasification slag to replace fine aggregates in concrete. They found that when the slag replacement rate was maintained at or below 25%, the strength characteristics of the concrete either remained unchanged or improved compared to conventional concrete. Zhang et al. [18] conducted an experimental study on the mechanical properties of SC and found that incorporating coal-fired slag significantly reduced the strength of the concrete, demonstrating its suitability for nonstructural stress components in construction. Zhou et al. [19] and Guo et al. [20] analyzed the mechanisms by which slag affects concrete strength, highlighting the significant impact of micropores and microcracks within slag particles on the hydration reaction of the concrete. Tyulenev et al. [21] examined the composition of ash from coal-fired power plants and explored its use in cement production. Poudel et al. [22] investigated using coal-fired bottom ash and slag as cement substitutes, finding that concrete with 10% coal-fired bottom ash exhibited improved tensile strength, elastic modulus, and durability.
Furthermore, Reshma and Chandan [23] examined the influence of slag on the cubic compressive strength of cement slag mortar. They utilized slag aggregates in preparing the mortar and examined the mechanical properties of mortars with various slag proportions. The results demonstrated that slag mortar could effectively replace ordinary mortar with an optimal slag percentage of 50% in the mortar mixture. Korkut et al. [24] prepared concrete by replacing some cementitious materials with waste andesite dust and showed that the performance of concrete prepared by adding 10% waste andesite dust was slightly lower than that of normal concrete. Ecemis et al. [25] proposed a new method of utilizing waste tires by incorporating fibers made from tires into reinforced concrete beams, and in the presence of the rubber fibers, the mechanical properties and weight of the reinforced concrete beams showed a decrease in mechanical properties and weight. Alharthai [26] conducted tests on the preparation of lightweight aggregate concrete by incorporating pumice and aluminum chips in different volume ratios into concrete at high temperatures. The test results revealed that high temperature is the main reason for the decrease in the strength of lightweight concrete. Moreover, the addition of pumice and aluminum chips leads to a decrease in the cubic compressive strength of concrete. The use of industrial solid waste to replace part of the aggregate preparation of concrete reduces the cost of concrete and addresses the issue of industrial solid waste pollution. Research in these areas can help promote green building technology and achieve sustainable development in human society.
Current research on coal-fired SC is primarily focused on experimentally investigating the cubic compressive strength and split tensile strength of concrete with different mix ratios, and the results apply only to ordinary concrete. However, relatively few studies on the theoretical aspects of the stress–strain relationship and energy consumption capacity of coal-fired SC have been conducted. This knowledge gap hinders the widespread application of coal-fired SC in building structures. Addressing this issue involves testing coal-fired slag as a replacement for fine aggregates and investigating its effects on the mechanical properties and energy consumption capacity of concrete. This can provide valuable theoretical support for the application of coal-fired slag in structural engineering projects.

2. Overview of the Experiment
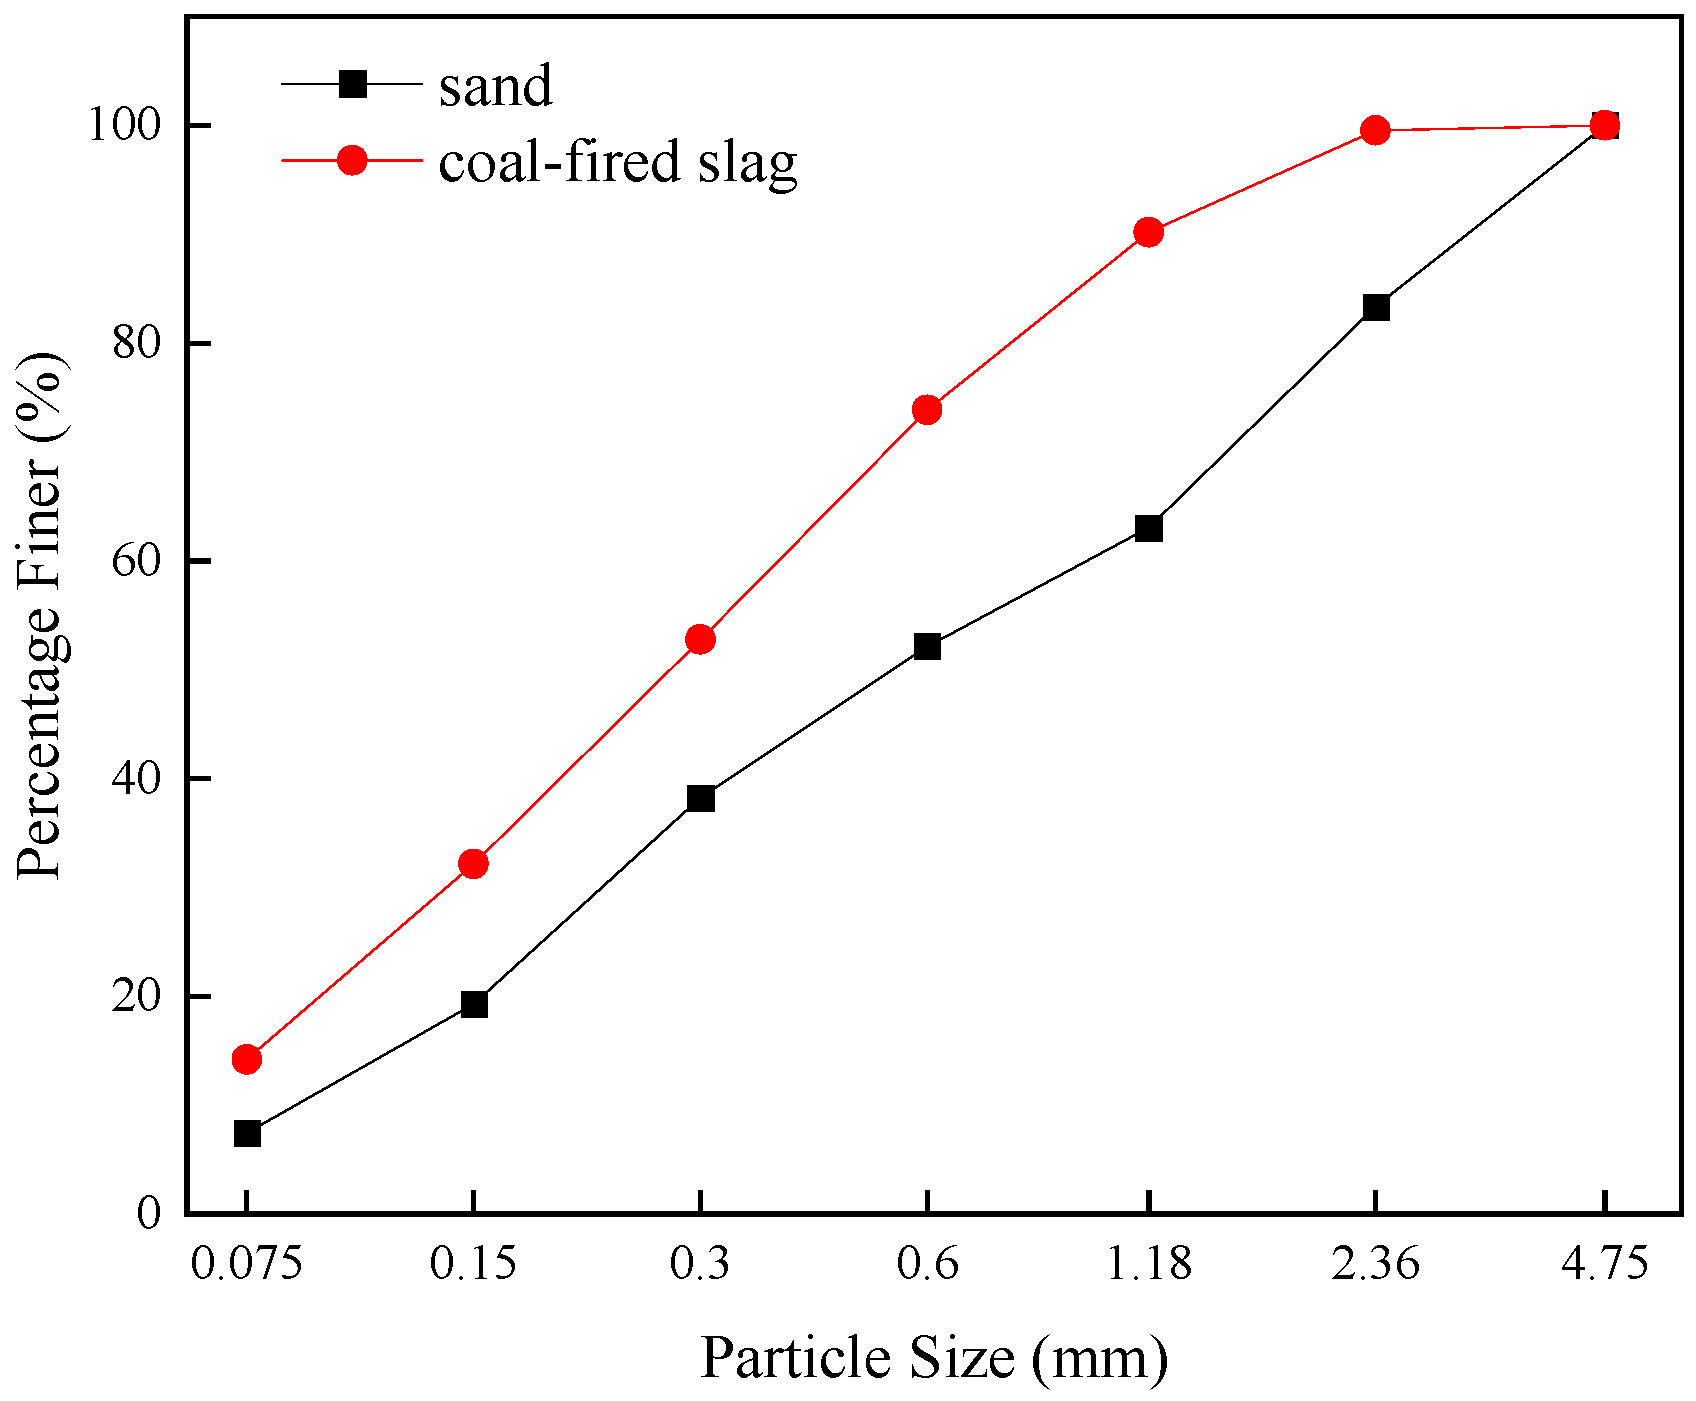
2.1. Raw Materials

In this study, P-O42.5 cement from the Xinjiang Shihezi Nanshan Cement Plant was used. Table 1 displays the properties of the cement, which meet the physical, mechanical, and chemical standards outlined in the Chinese national standard GB175-2007 [27]. The fly ash used in this study was from Xinjiang Yue Longda Renewable Resources Technology Co., Ltd. (Shihezi, China). The parameters of fly ash are listed in Table 2. The aggregates used were as follows: (1) sand: river sand with a fineness modulus of 2.84, classified as medium sand, and a water content of 5.7%; (2) coal-fired slag: preliminary crushed slag from the Shihezi South Thermal Power Station, with a particle size of less than 5 mm, a bulk density of 834 kg·m−3, and a water content of 5.4%; (3) stones: pebbles with a particle size in the range of 5–20 mm and a water content of 2.3%. The particle size distribution of coal-fired slag and sand is presented in Figure 1. The chemical composition of the slag is detailed in Table 3. The water-reducing agent used was HSC polycarboxylic acid with a water-reducing rate of 15 wt%, and the test water was municipal tap water.

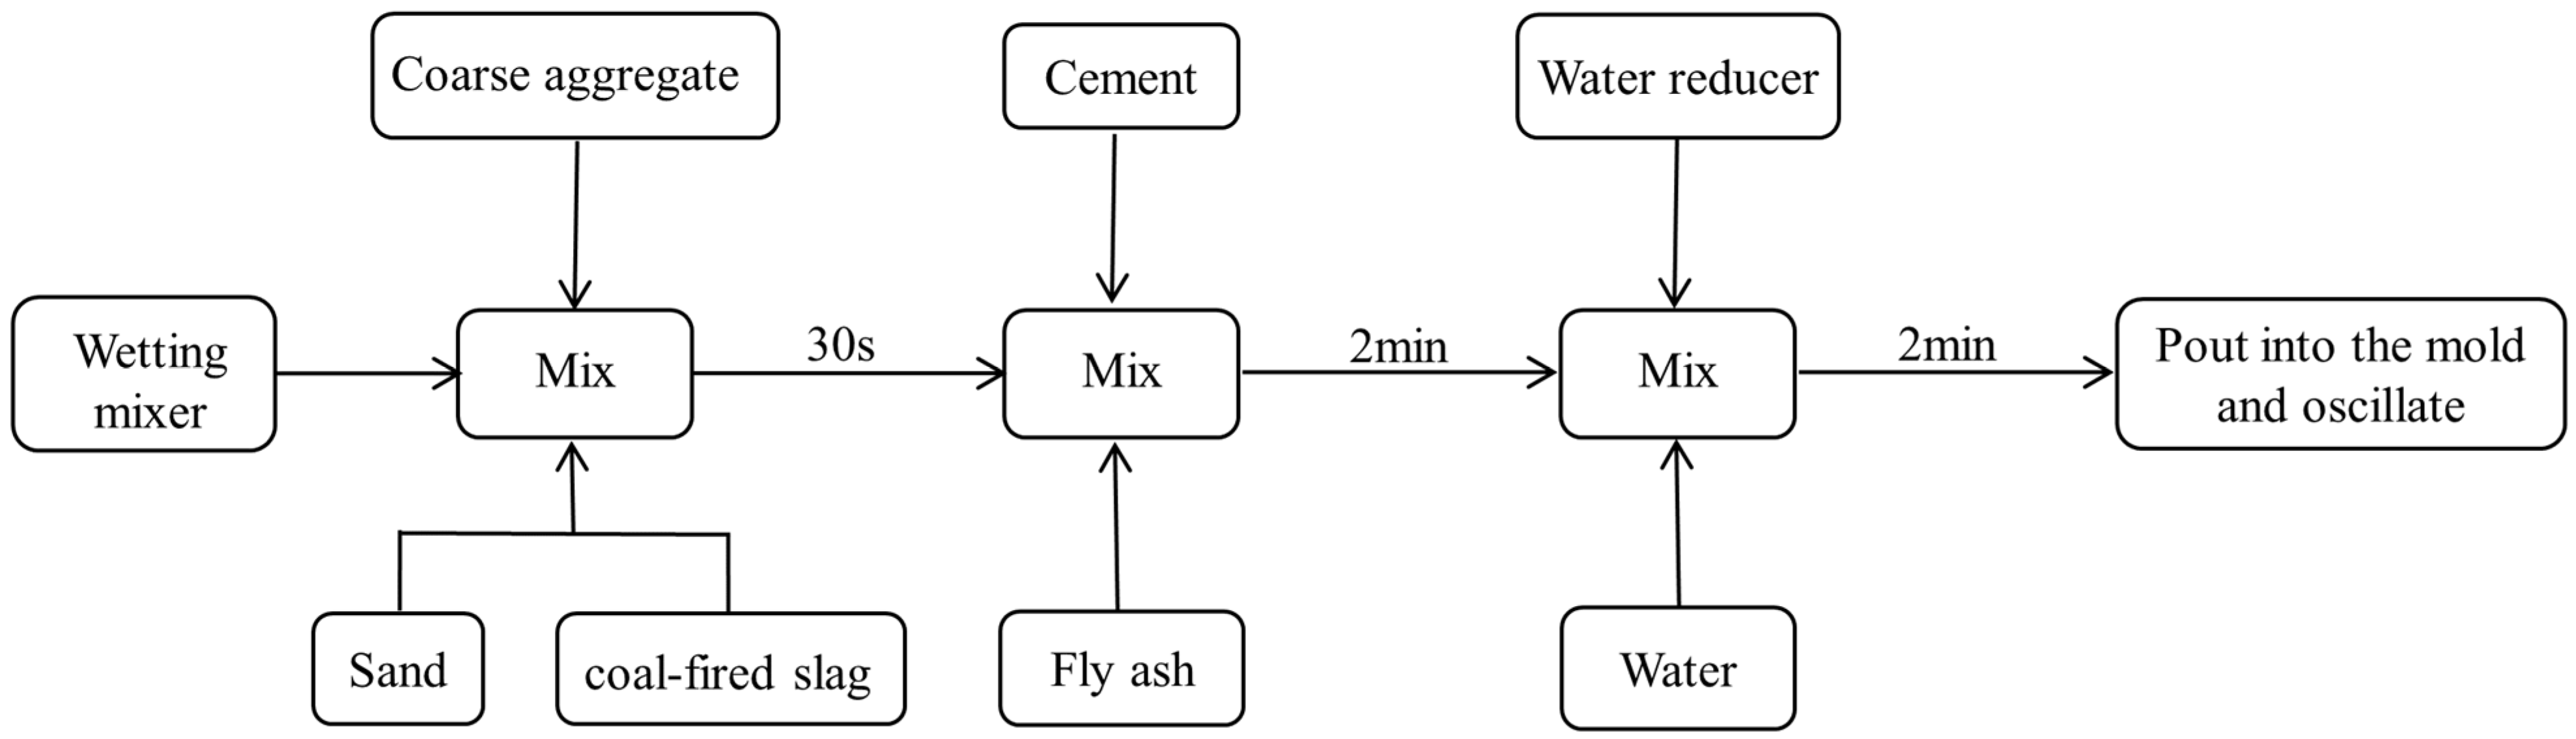
2.2. Design of the Experiment

In this test, the slag replacement rate was selected according to a gradient ranging from 0% to 100% and was divided into 11 groups, each labeled “SC-X”, where “SC” represents slag concrete and “X” denotes the coal-fired slag replacement rate. The SC-0 group, which consisted of ordinary concrete, was used as the control group. Twelve test blocks were prepared for each group, which were equally divided into four parts allocated for testing the cubic compressive strength, split tensile strength, axial compressive strength, and static modulus of elasticity. Based on a pre-orthogonal test, the water–cement ratio for each group was set to 0.45, the fly ash replacement ratio was 10%, and the sand ratio was 45%. These test ratios were designed according to standard JGJ 55-2011, “Specification for the Design of Ordinary Concrete Mixes” [28]. First, the dosages of various materials in the control group SC-0 were calculated, with those of water, cement, fly ash, stone, and water reducer being fixed. The sand and slag dosages for each group from SC-1 to SC-100 were determined by measuring the mass of fine aggregates substituted. The test ratios for each group are listed in Table 4.

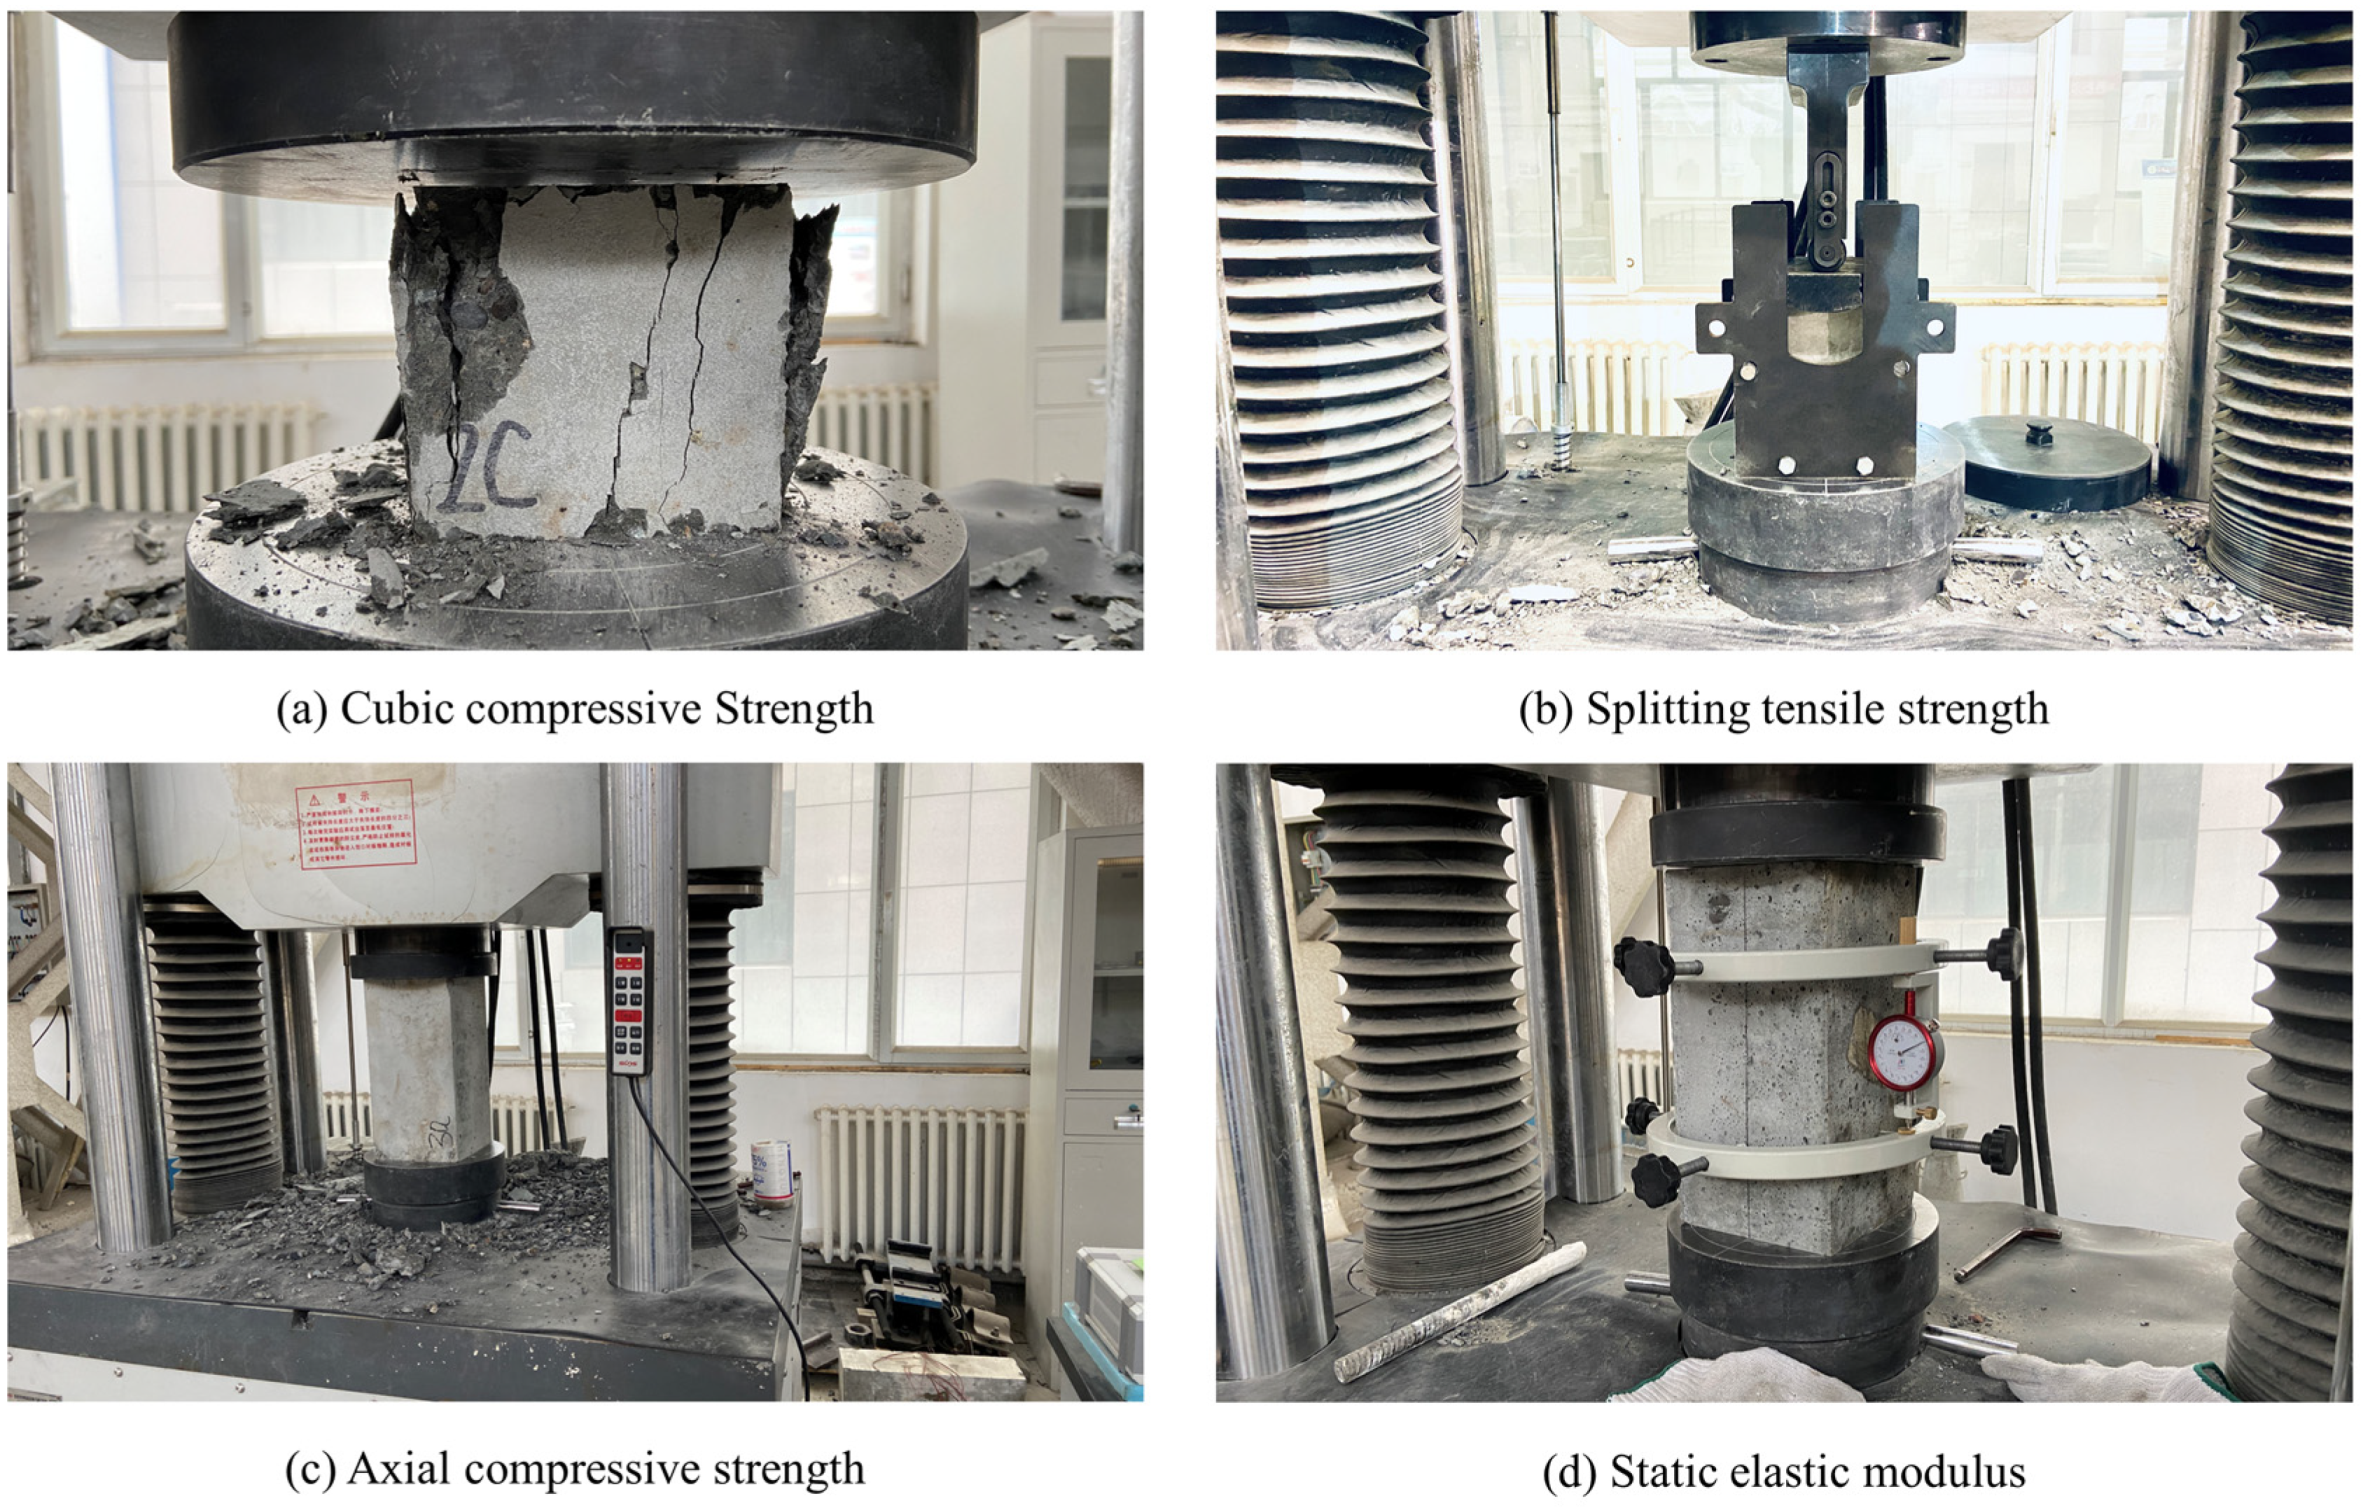
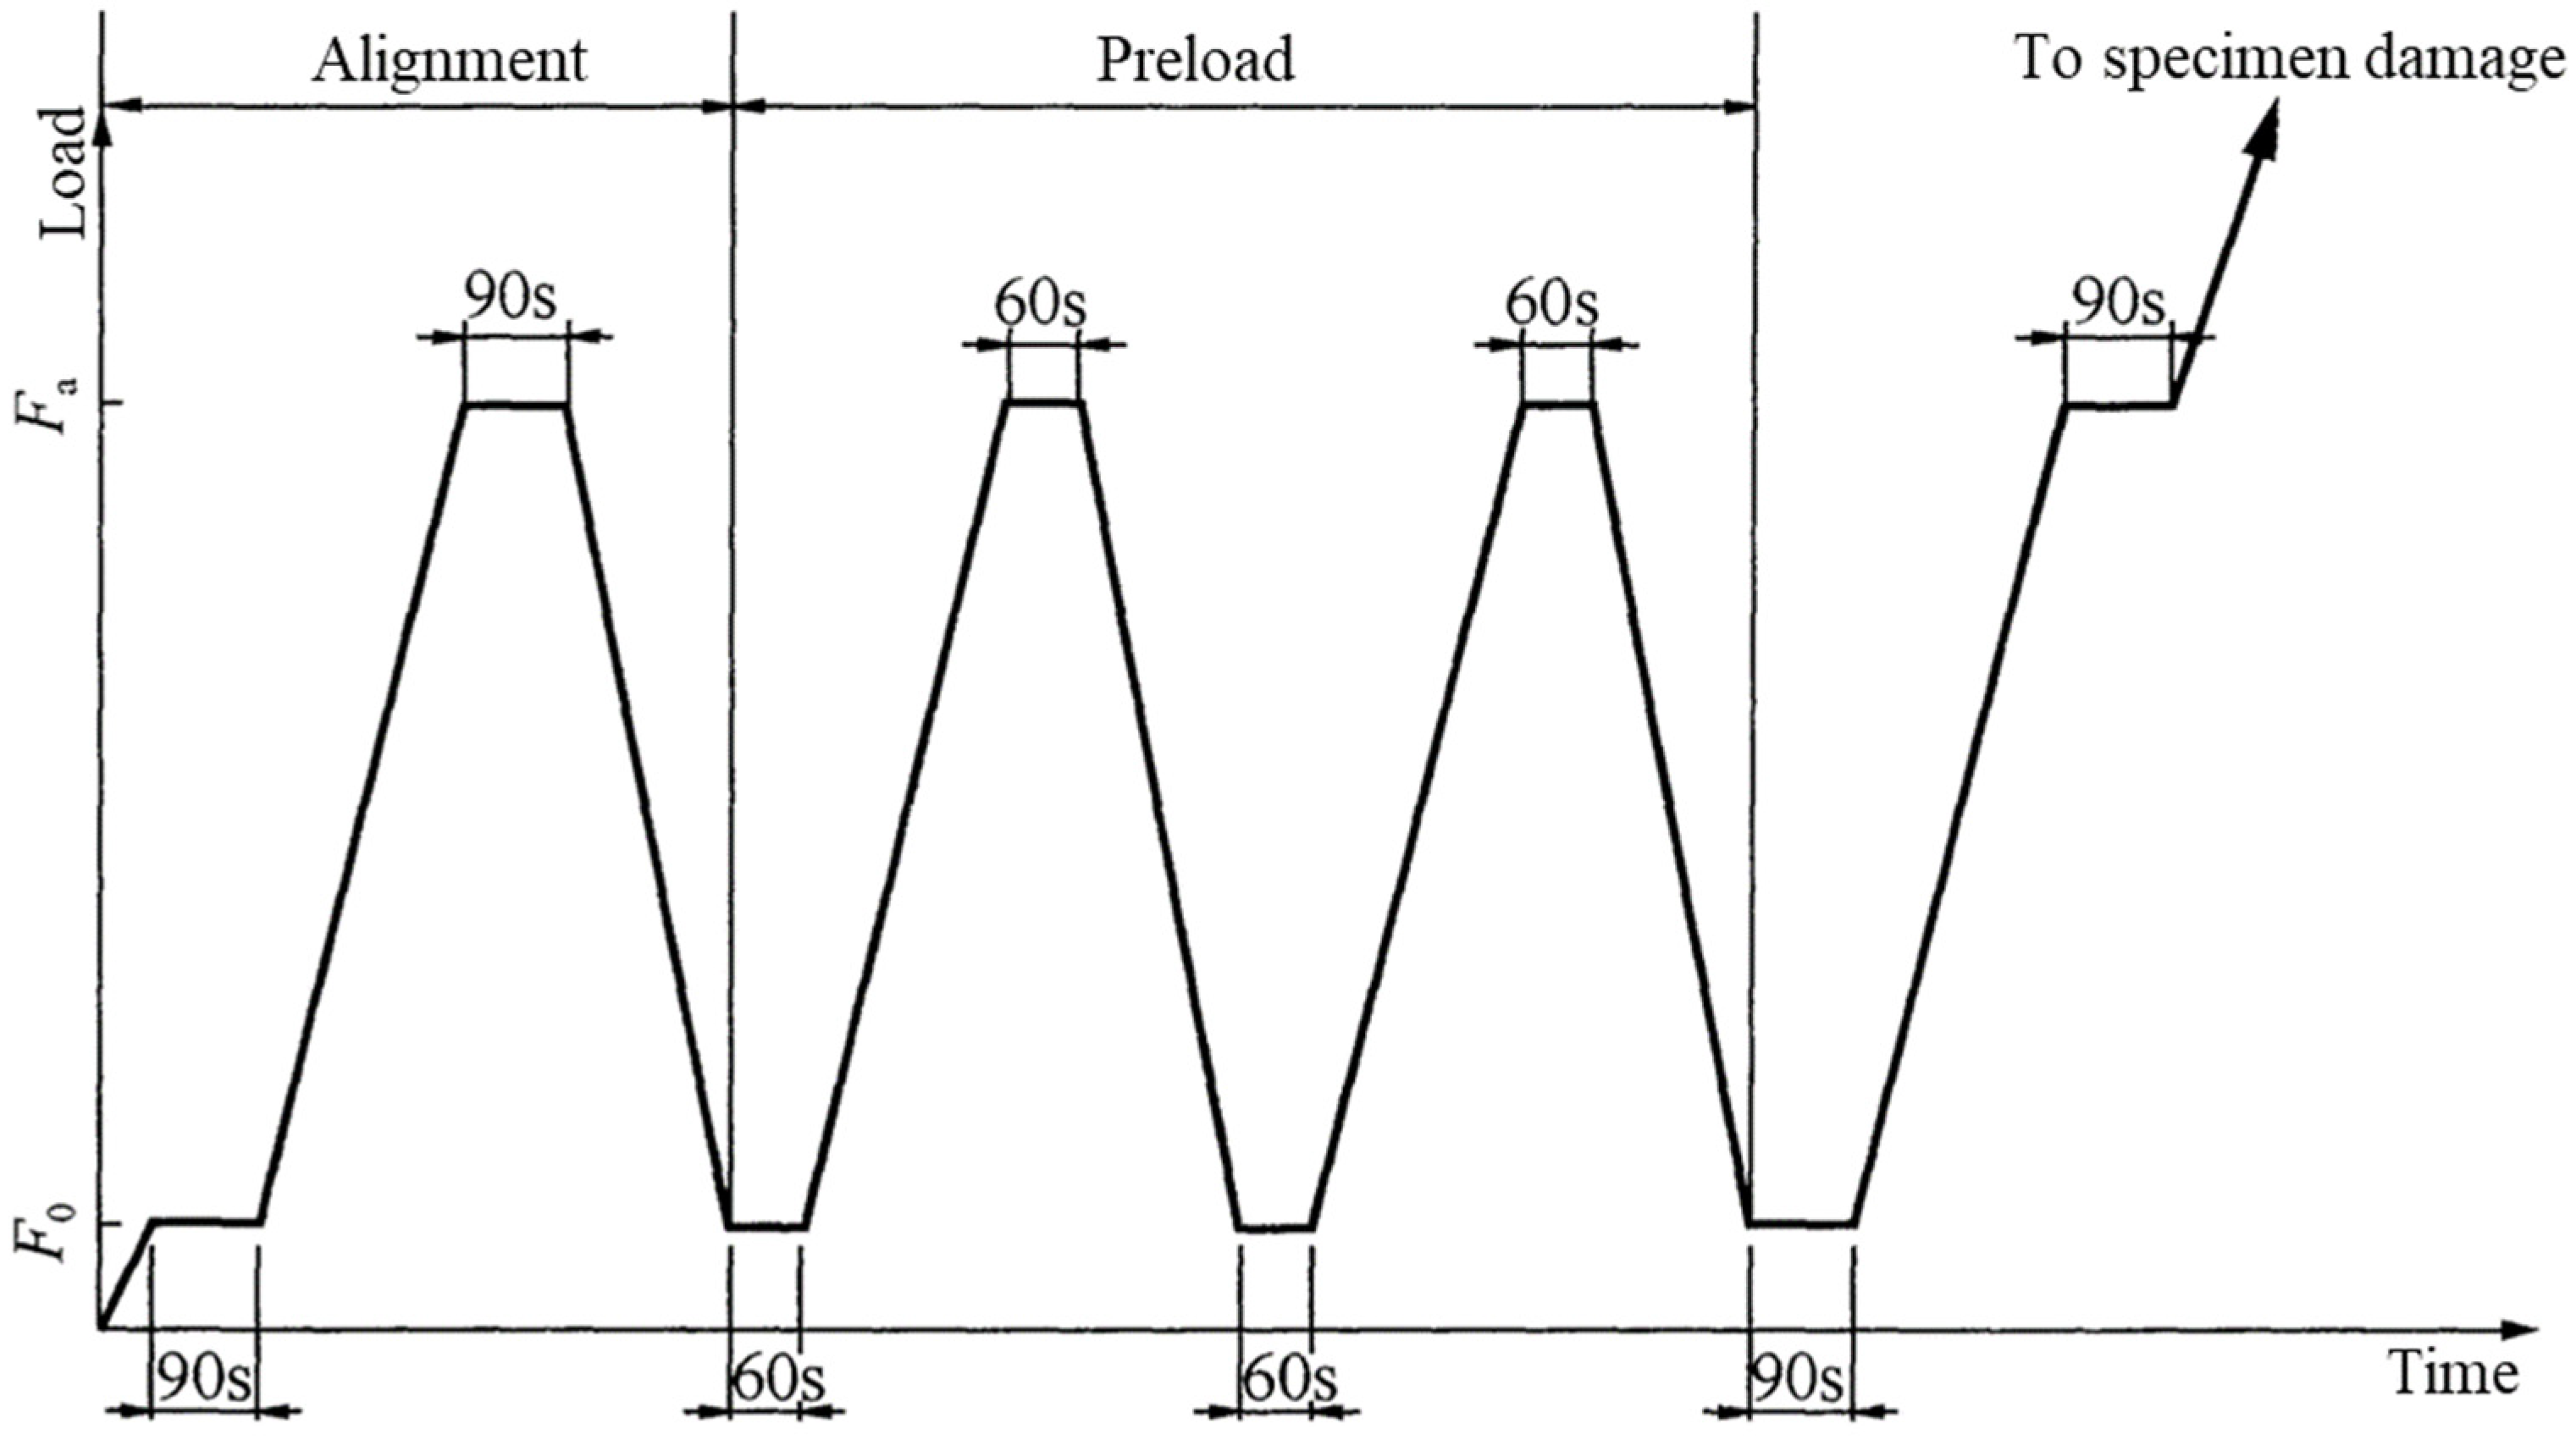
2.3. Test Methods and Loading Devices

The process for preparing the concrete is depicted in Figure 2. To prepare the concrete, the mixer was first wetted. Next, the weighted stones, sand, and slag were added and mixed for 30 s. Then, cement and fly ash were added, and the mixture was blended for 2 min. Finally, water and the water-reducing agent were added, followed by another 2 min of mixing to ensure uniform mixing of the concrete. The concrete was poured into molds to create 100 mm × 100 mm × 100 mm and 150 mm × 150 mm × 300 mm test blocks. After molding, the specimens were placed in a standard curing box set to a temperature of 20 ± 1 °C at a relative humidity of 90 ± 5%. The specimens were cured in this environment for 28 d.
The workability of the concrete was evaluated according to GB/T 50080-2016, “Standard of Test Methods for Properties of Ordinary Concrete Mixes” [29]. The cubic compressive strength, splitting tensile strength, axial compressive strength, and static modulus of elasticity were tested according to GB/T 50081-2019, “Standard of Test Methods for Physical and Mechanical Properties of Concrete” [30]. To measure the cubic compressive strength and splitting tensile strength of the concrete, three cube specimens of dimensions 100 mm × 100 mm × 100 mm were prepared. Similarly, to measure the axial compressive strength and static modulus of elasticity of the concrete, three cube specimens of dimensions 150 mm × 150 mm × 300 mm were prepared. The arithmetic mean of the test values of the three specimens was considered the strength value of the final specimen. If the difference between the maximum or minimum test value and median value exceeded 15% of the median value, the maximum and minimum test values were excluded and the median value was used as the test result. Because of the use of nonstandard specimens for testing, the values of the cube compressive and split tensile strengths were multiplied by a size-conversion factor. The dimensional conversion factor was 0.95 for the former and 0.85 for the latter. The loading rates of cube compressive strength, axial compressive strength, and static modulus of elasticity test should be between 0.5 and 0.8 MPa/s, and the split tensile strength loading speed should be between 0.05 and 0.08 MPa/s. The loading method is illustrated in Figure 3. A schematic of the elastic loading method is shown in Figure 4. A scanning electron microscope (SEM; ZEISS Gemini, Oberkochen, Germany) was used to study the microinterfaces, providing a detailed analysis and characterization of the concrete sample interfaces and valuable insights into their microstructural properties. Additionally, the hydration reaction of the SC was investigated using an X-ray diffractometer (D8 ADVANCE; Bruker AXS, Karlsruhe, Germany) to examine the physical phases of the hydration products after 7 and 28 d. This sophisticated instrument enabled the comprehensive characterization of the hydration products, supporting the study of the chemical processes within the SC.

3. Test Results and Analyses

3.1. Test Results

The results of the coal-fired SC performance tests are listed in Table 5. The compressive and split tensile strength values in the table account for the size effect coefficient of the test block.

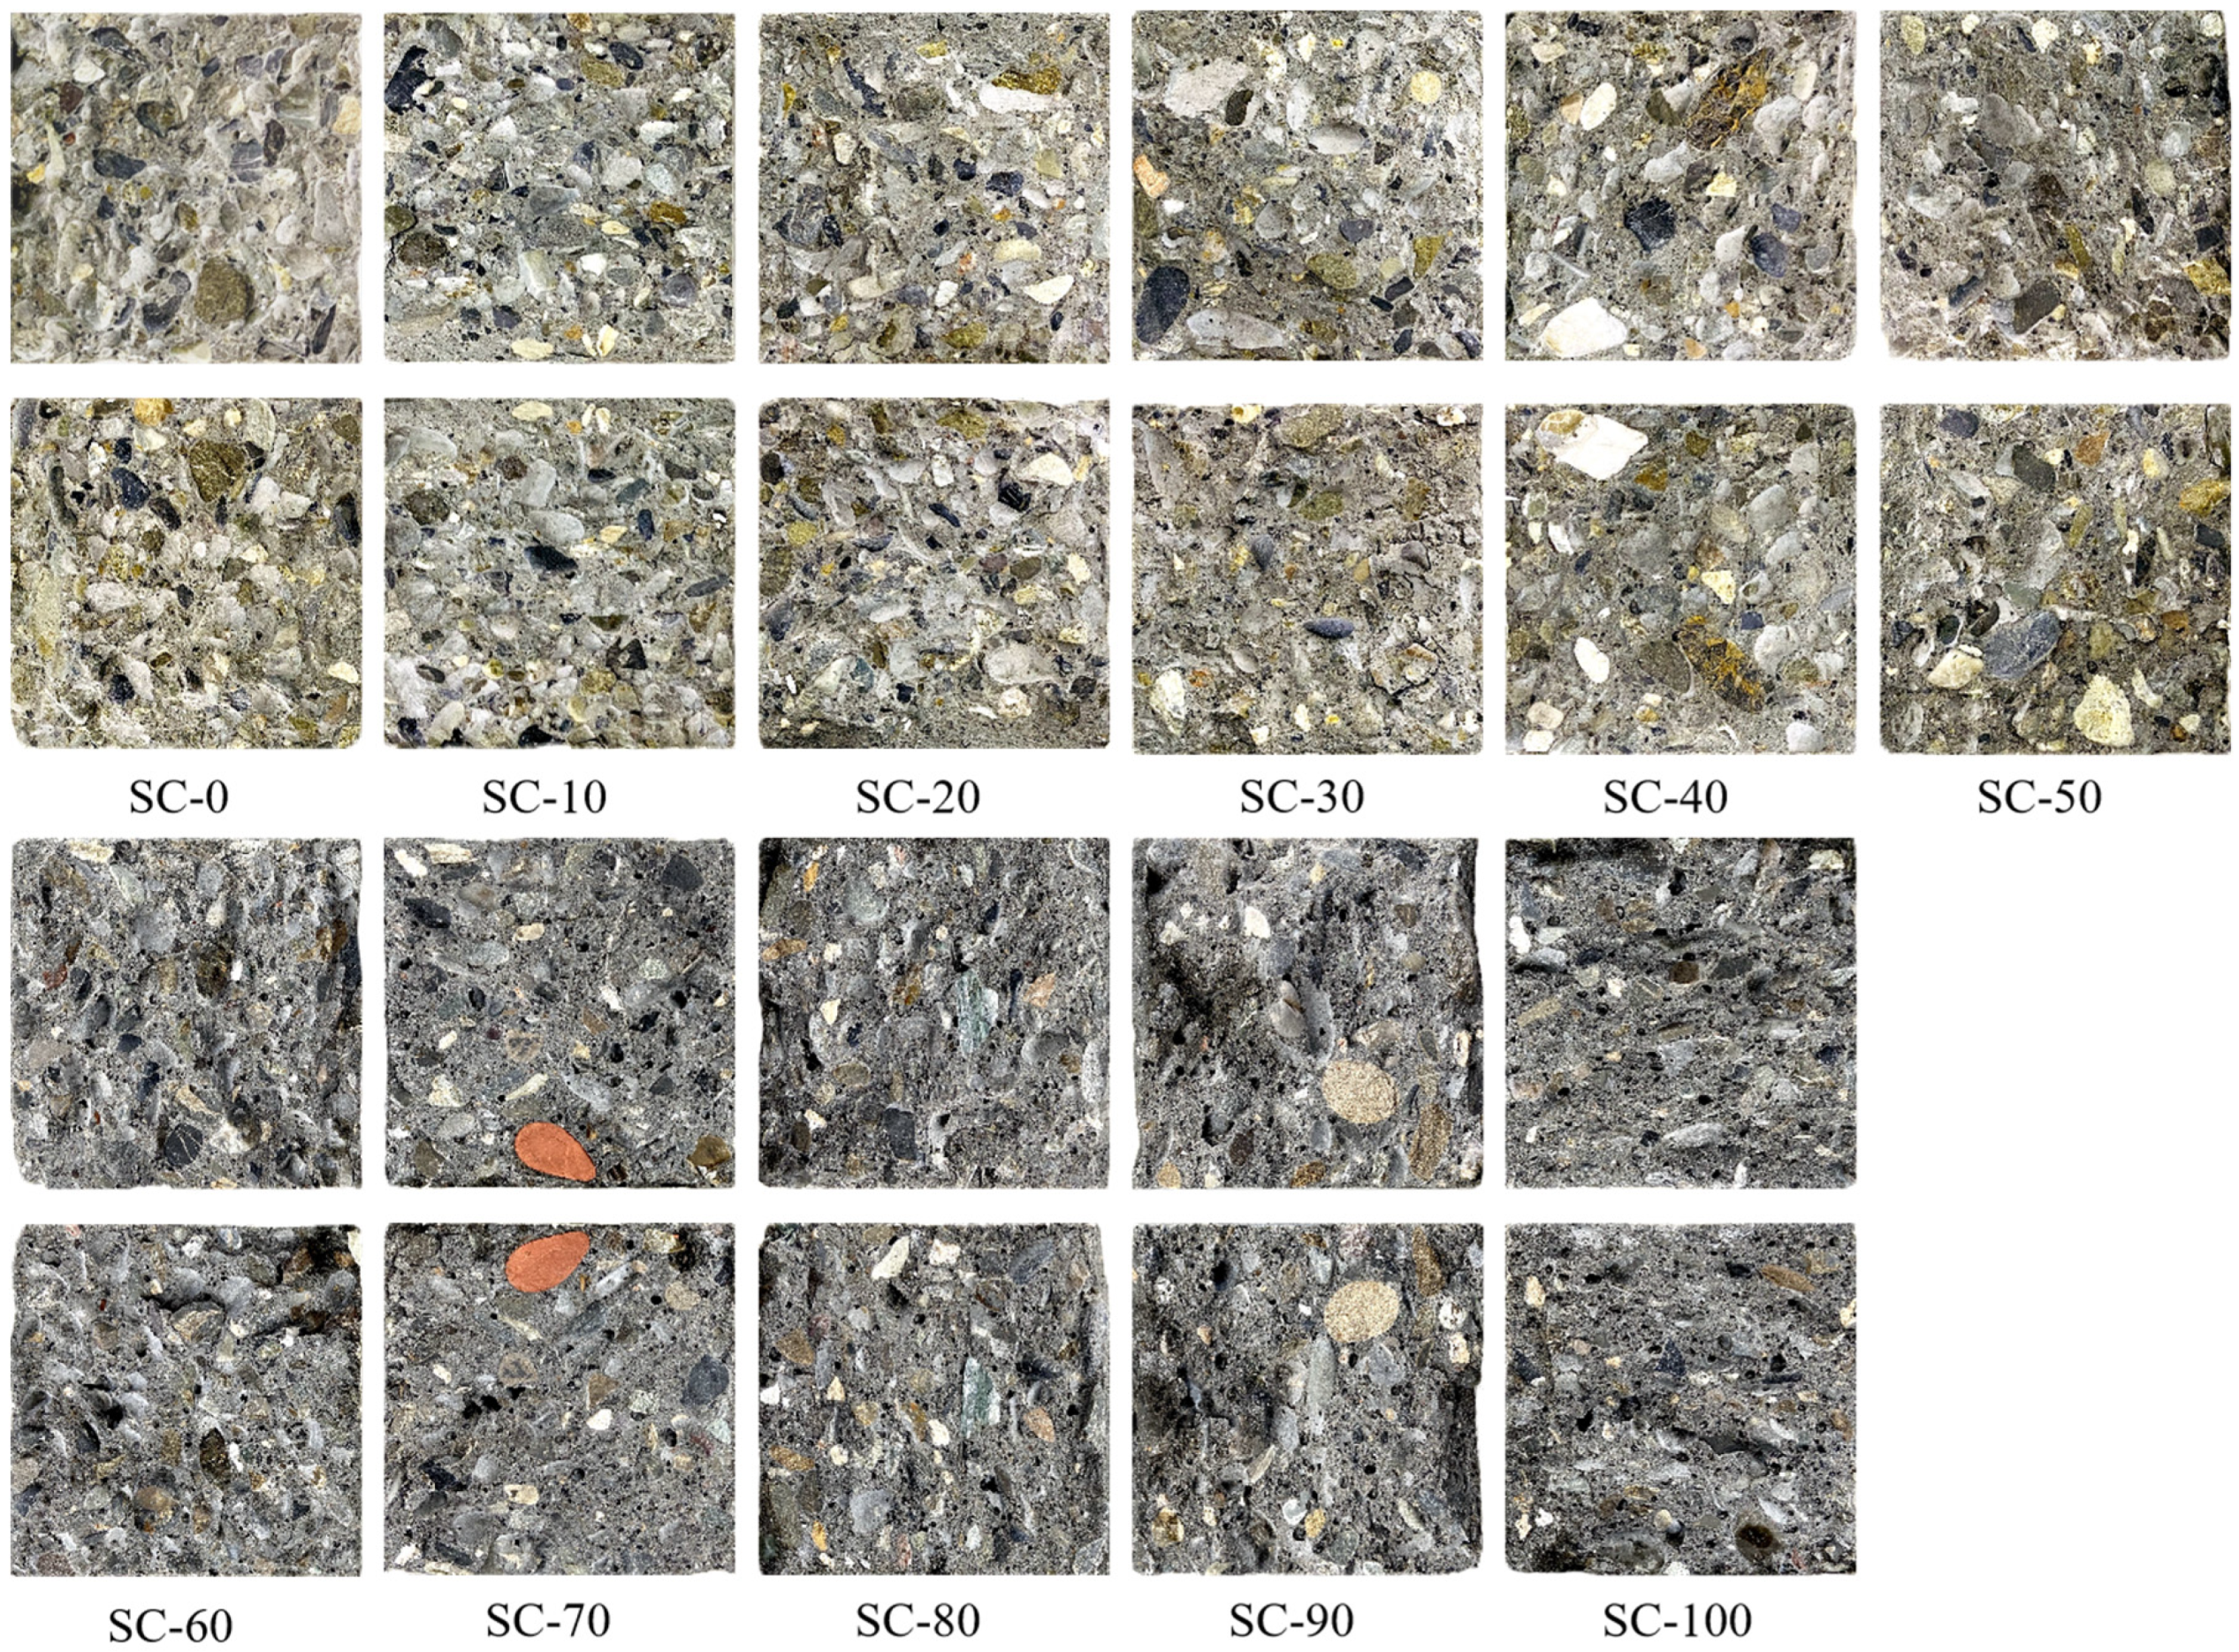
3.2. Work Performance of the SC

The results of the slump test showed that when the coal-fired slag replacement ratio was 20% or less, the slag addition had no noticeable effect on the performance of the concrete. However, as the replacement ratio exceeded 20%, the performance of the concrete began to deteriorate, with the slump gradually decreasing as the replacement rate increased. At replacement ratios greater than 60%, a sharp reduction in slump was observed, indicating a decrease in the cohesion of the concrete. This was evident as the concrete started to appear more granular during mixing. Some of the coarse aggregate surfaces were not coated with the cement mortar, and the mixture began to exhibit dry hardness. When the replacement ratio exceeded 80%, the concrete aggregates failed to bond properly, leading to a slump approaching zero. This behavior can be attributed to the high water absorption capacity and presence of micropores in the coal-fired slag particles, which absorb significant amounts of water and interact with the water-reducing agent. Consequently, the absorption of water and water-reducing agents by the cementitious materials was insufficient, resulting in extremely poor concrete cohesion. During the initial curing stages, the water absorbed by the coal-fired slag particles was released, causing poor water retention. These observations are consistent with those reported by Singh et al. [31]. Based on the slump performance, in order to ensure good quality of slag concrete, the best choice of slag replacement rate is below 60%.

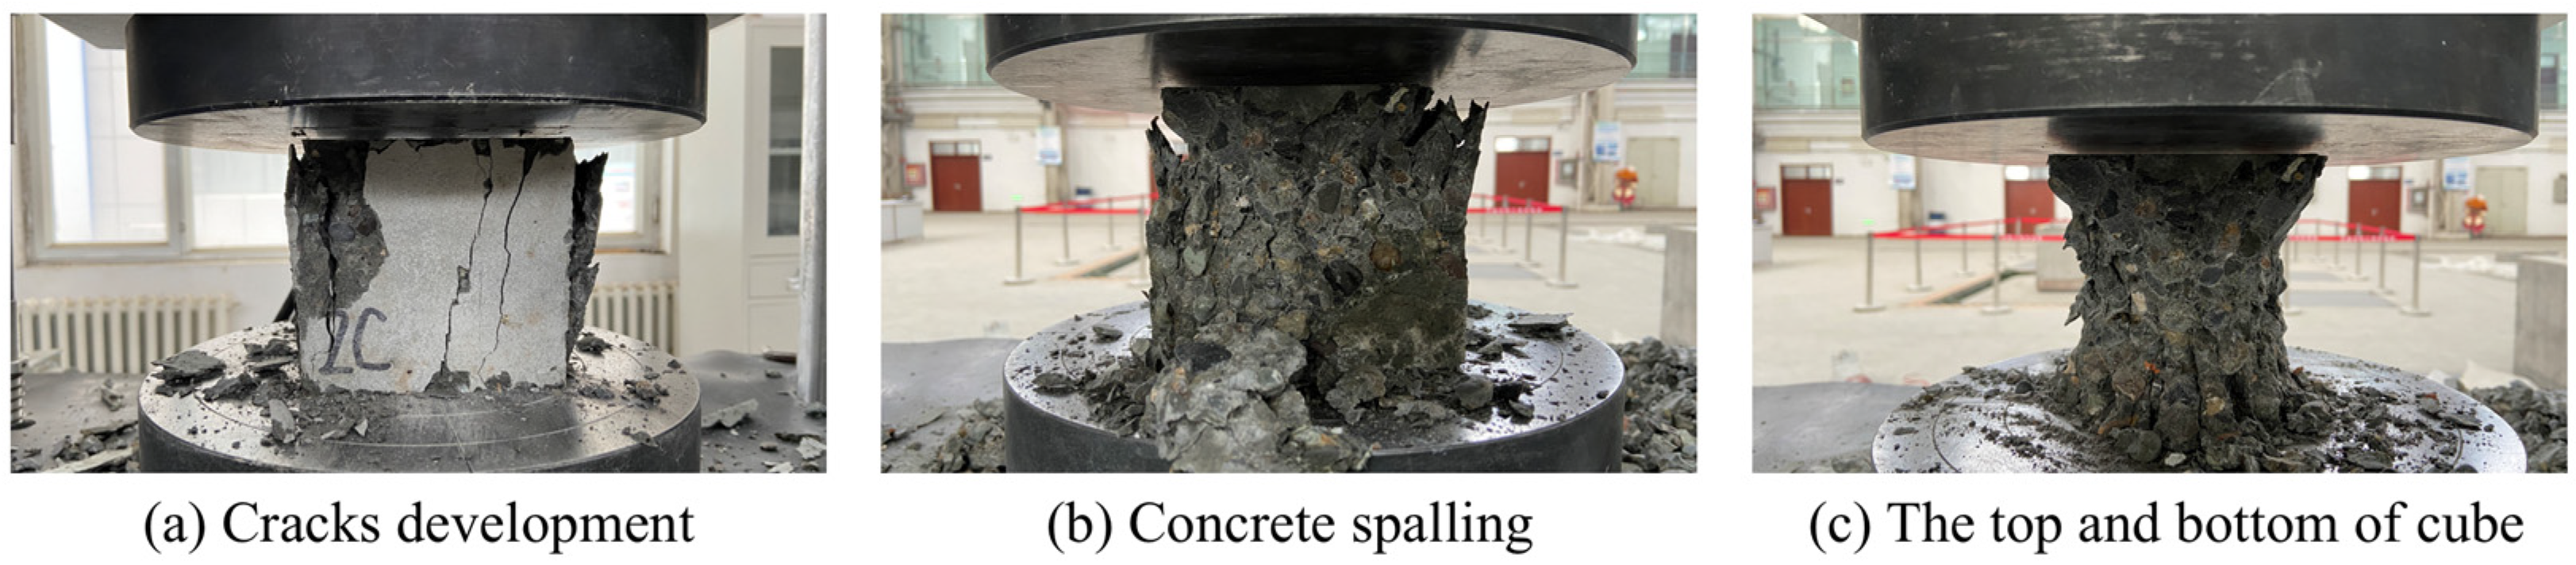
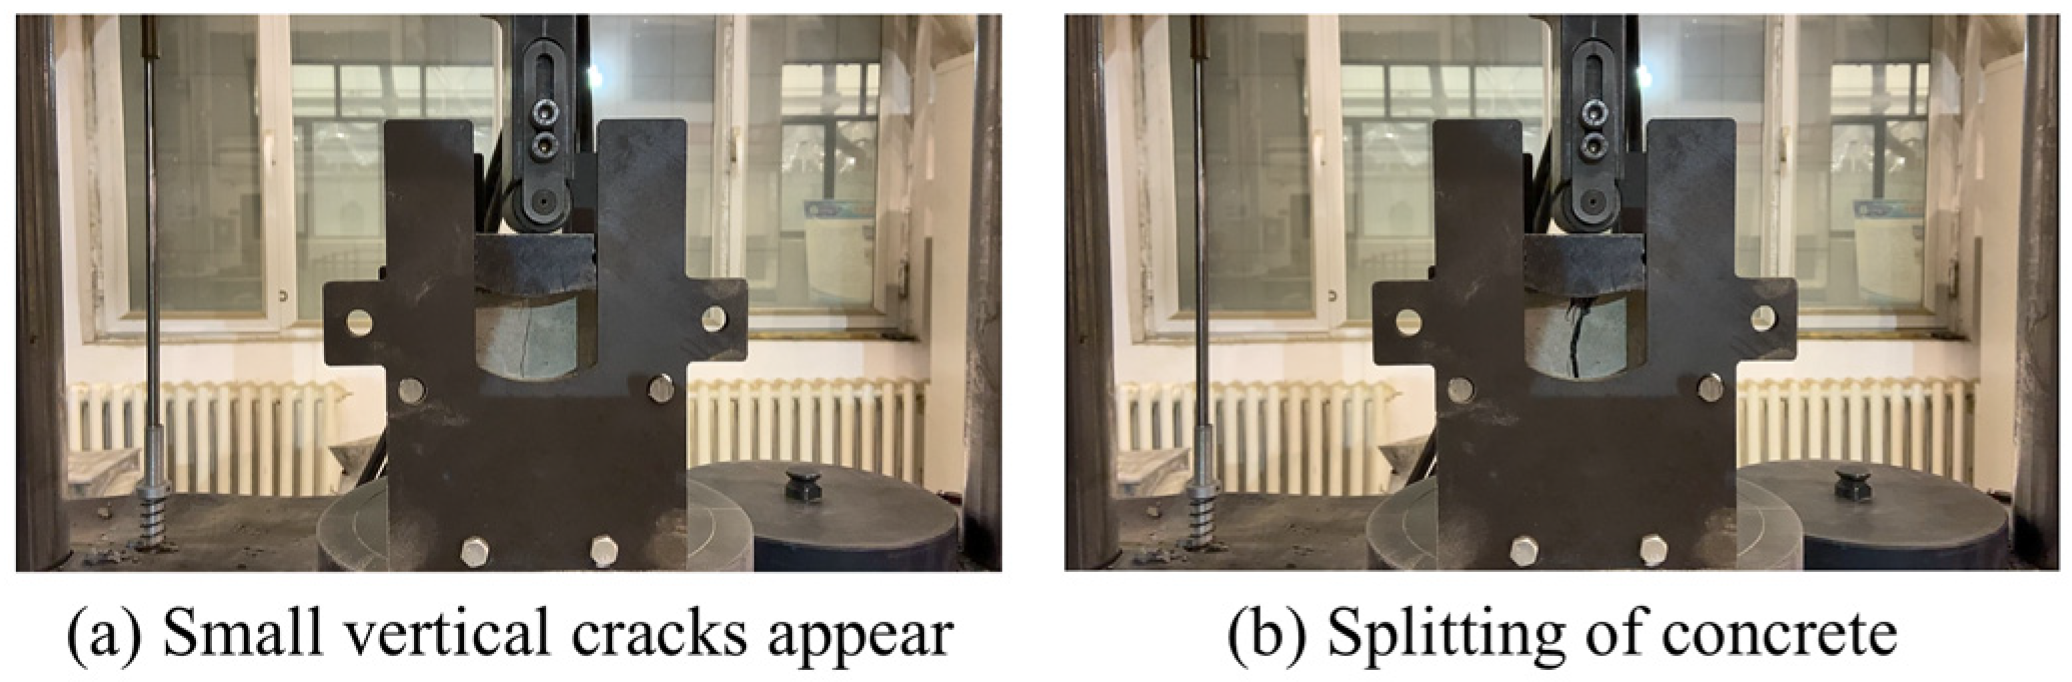
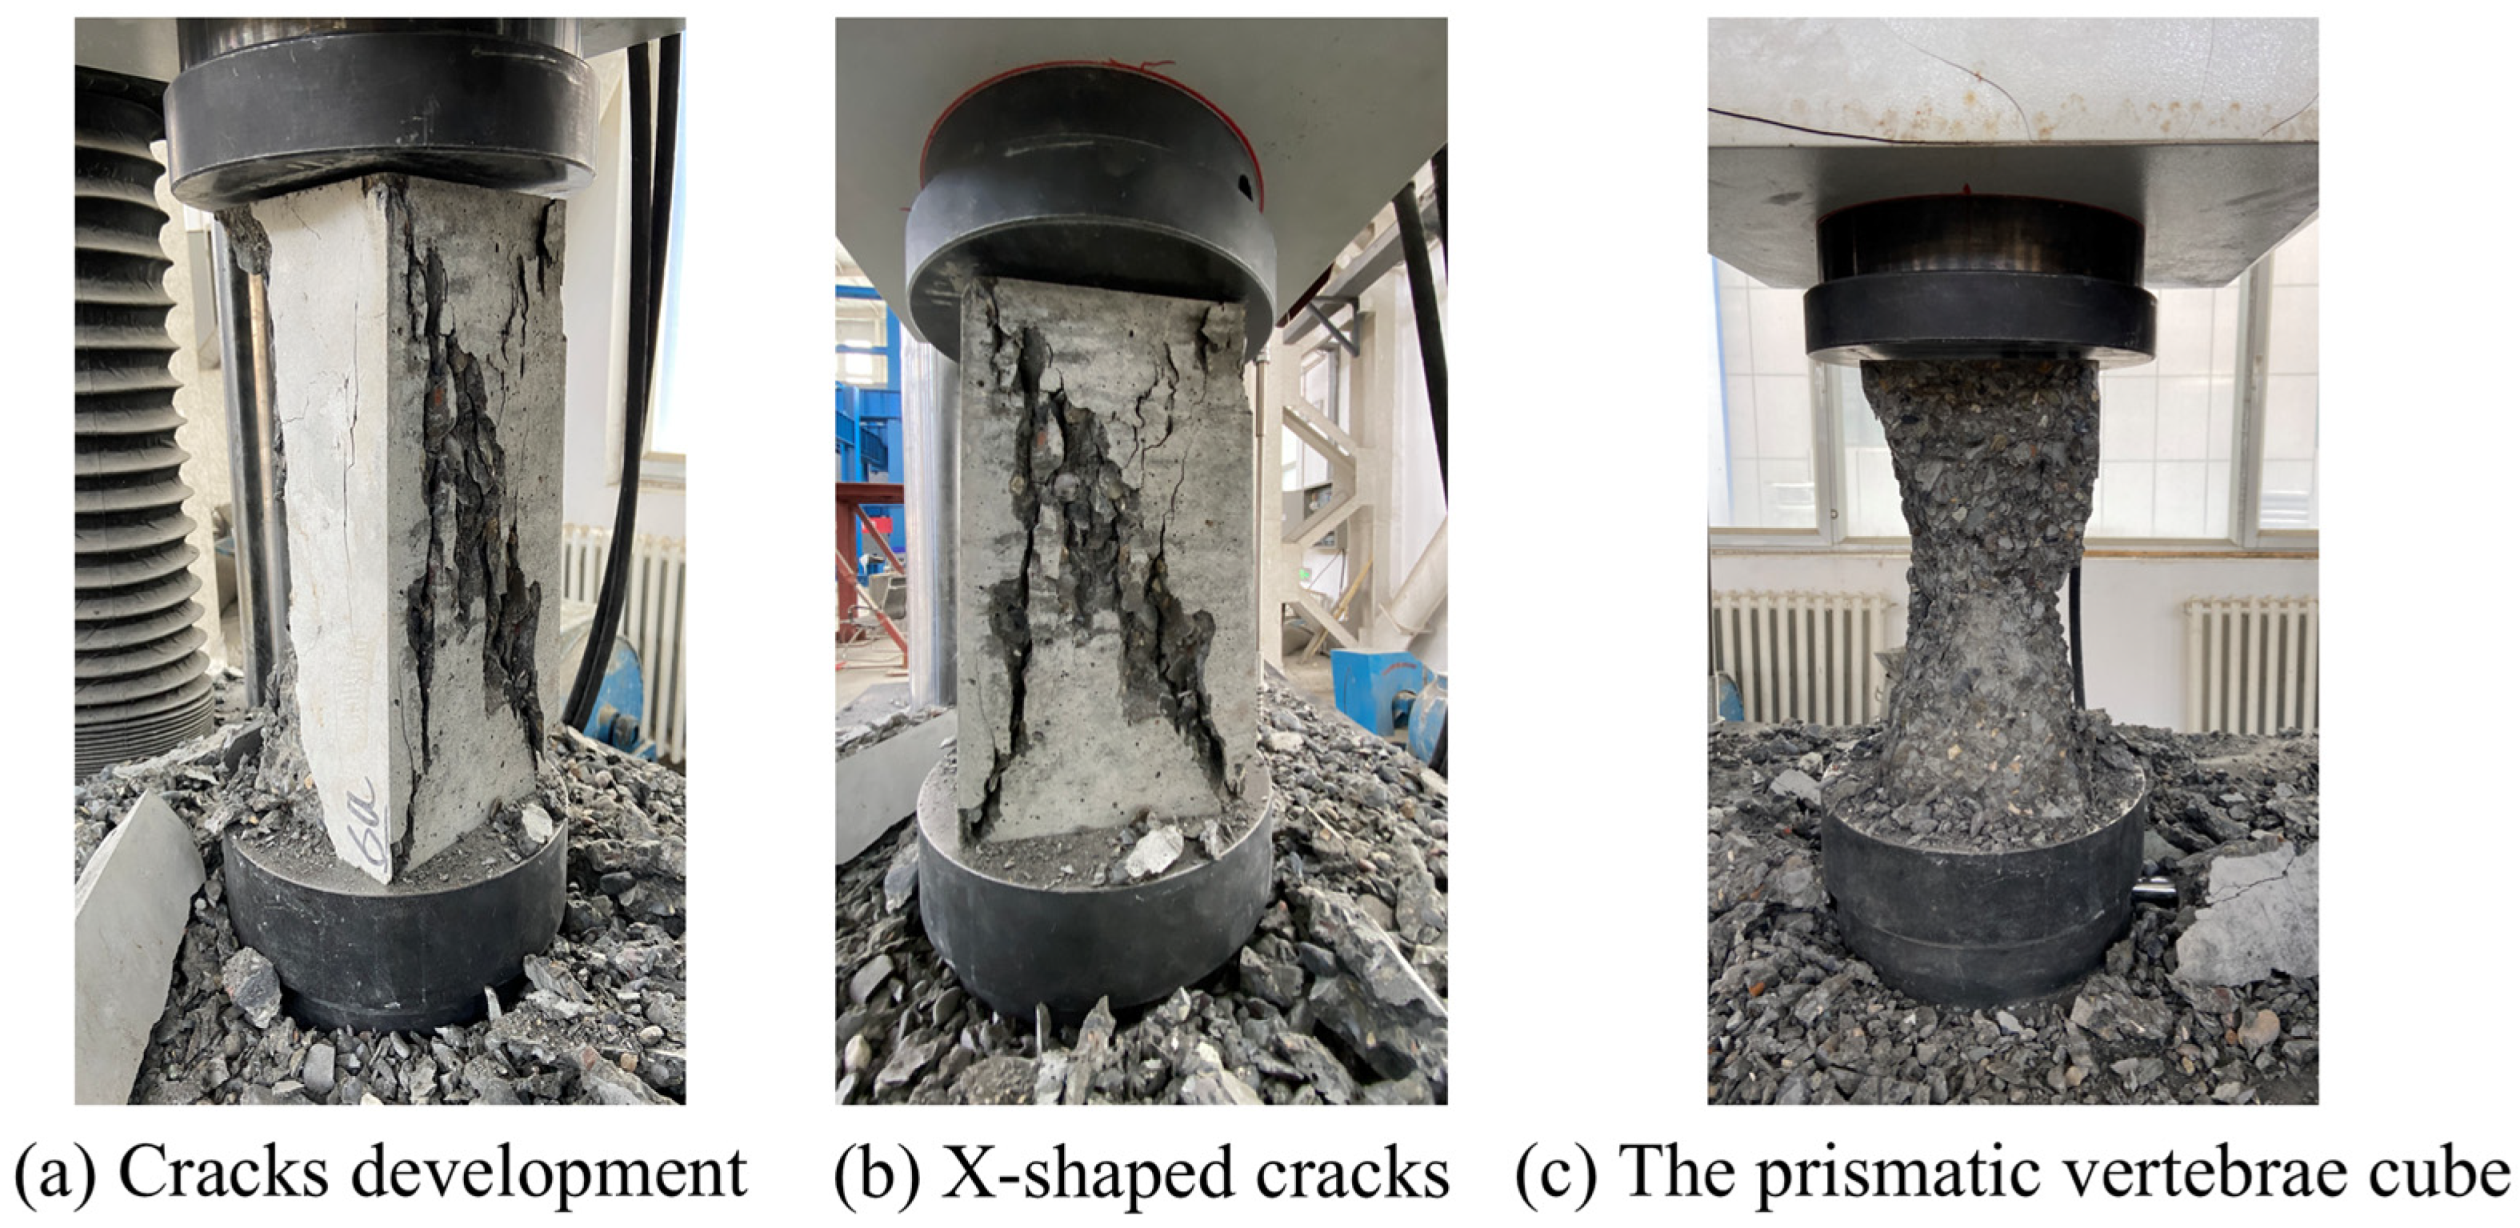
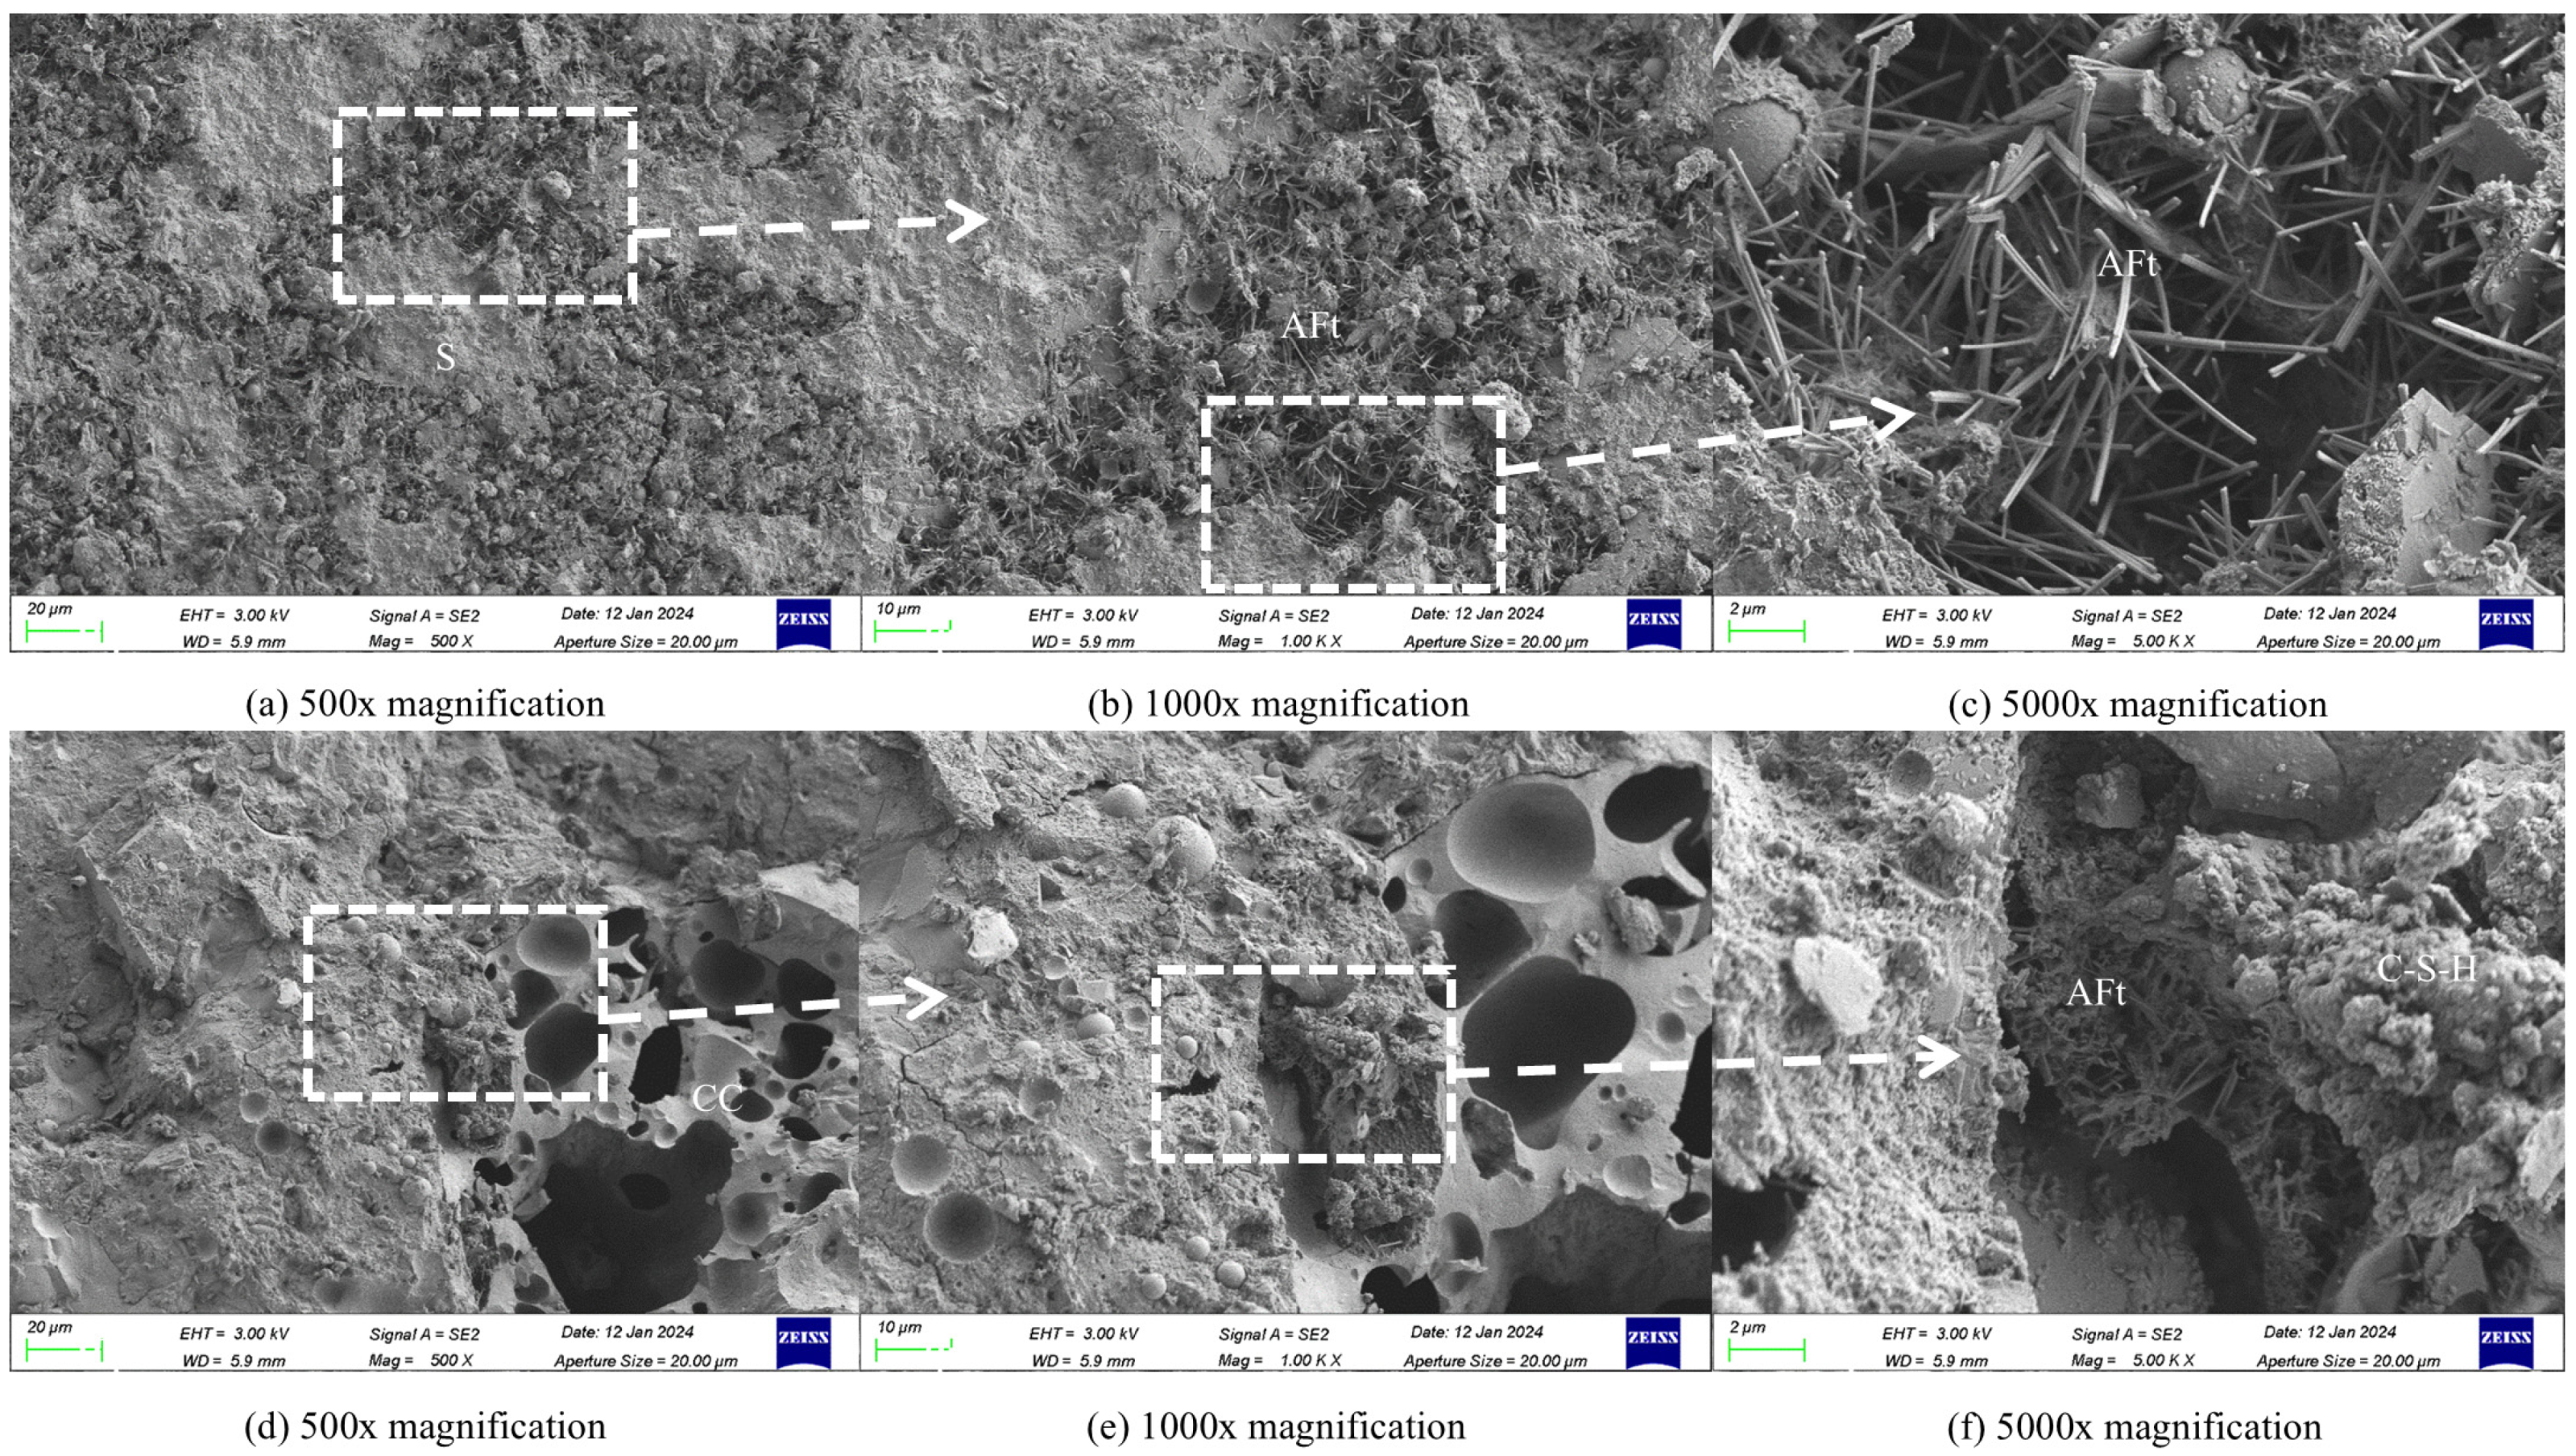
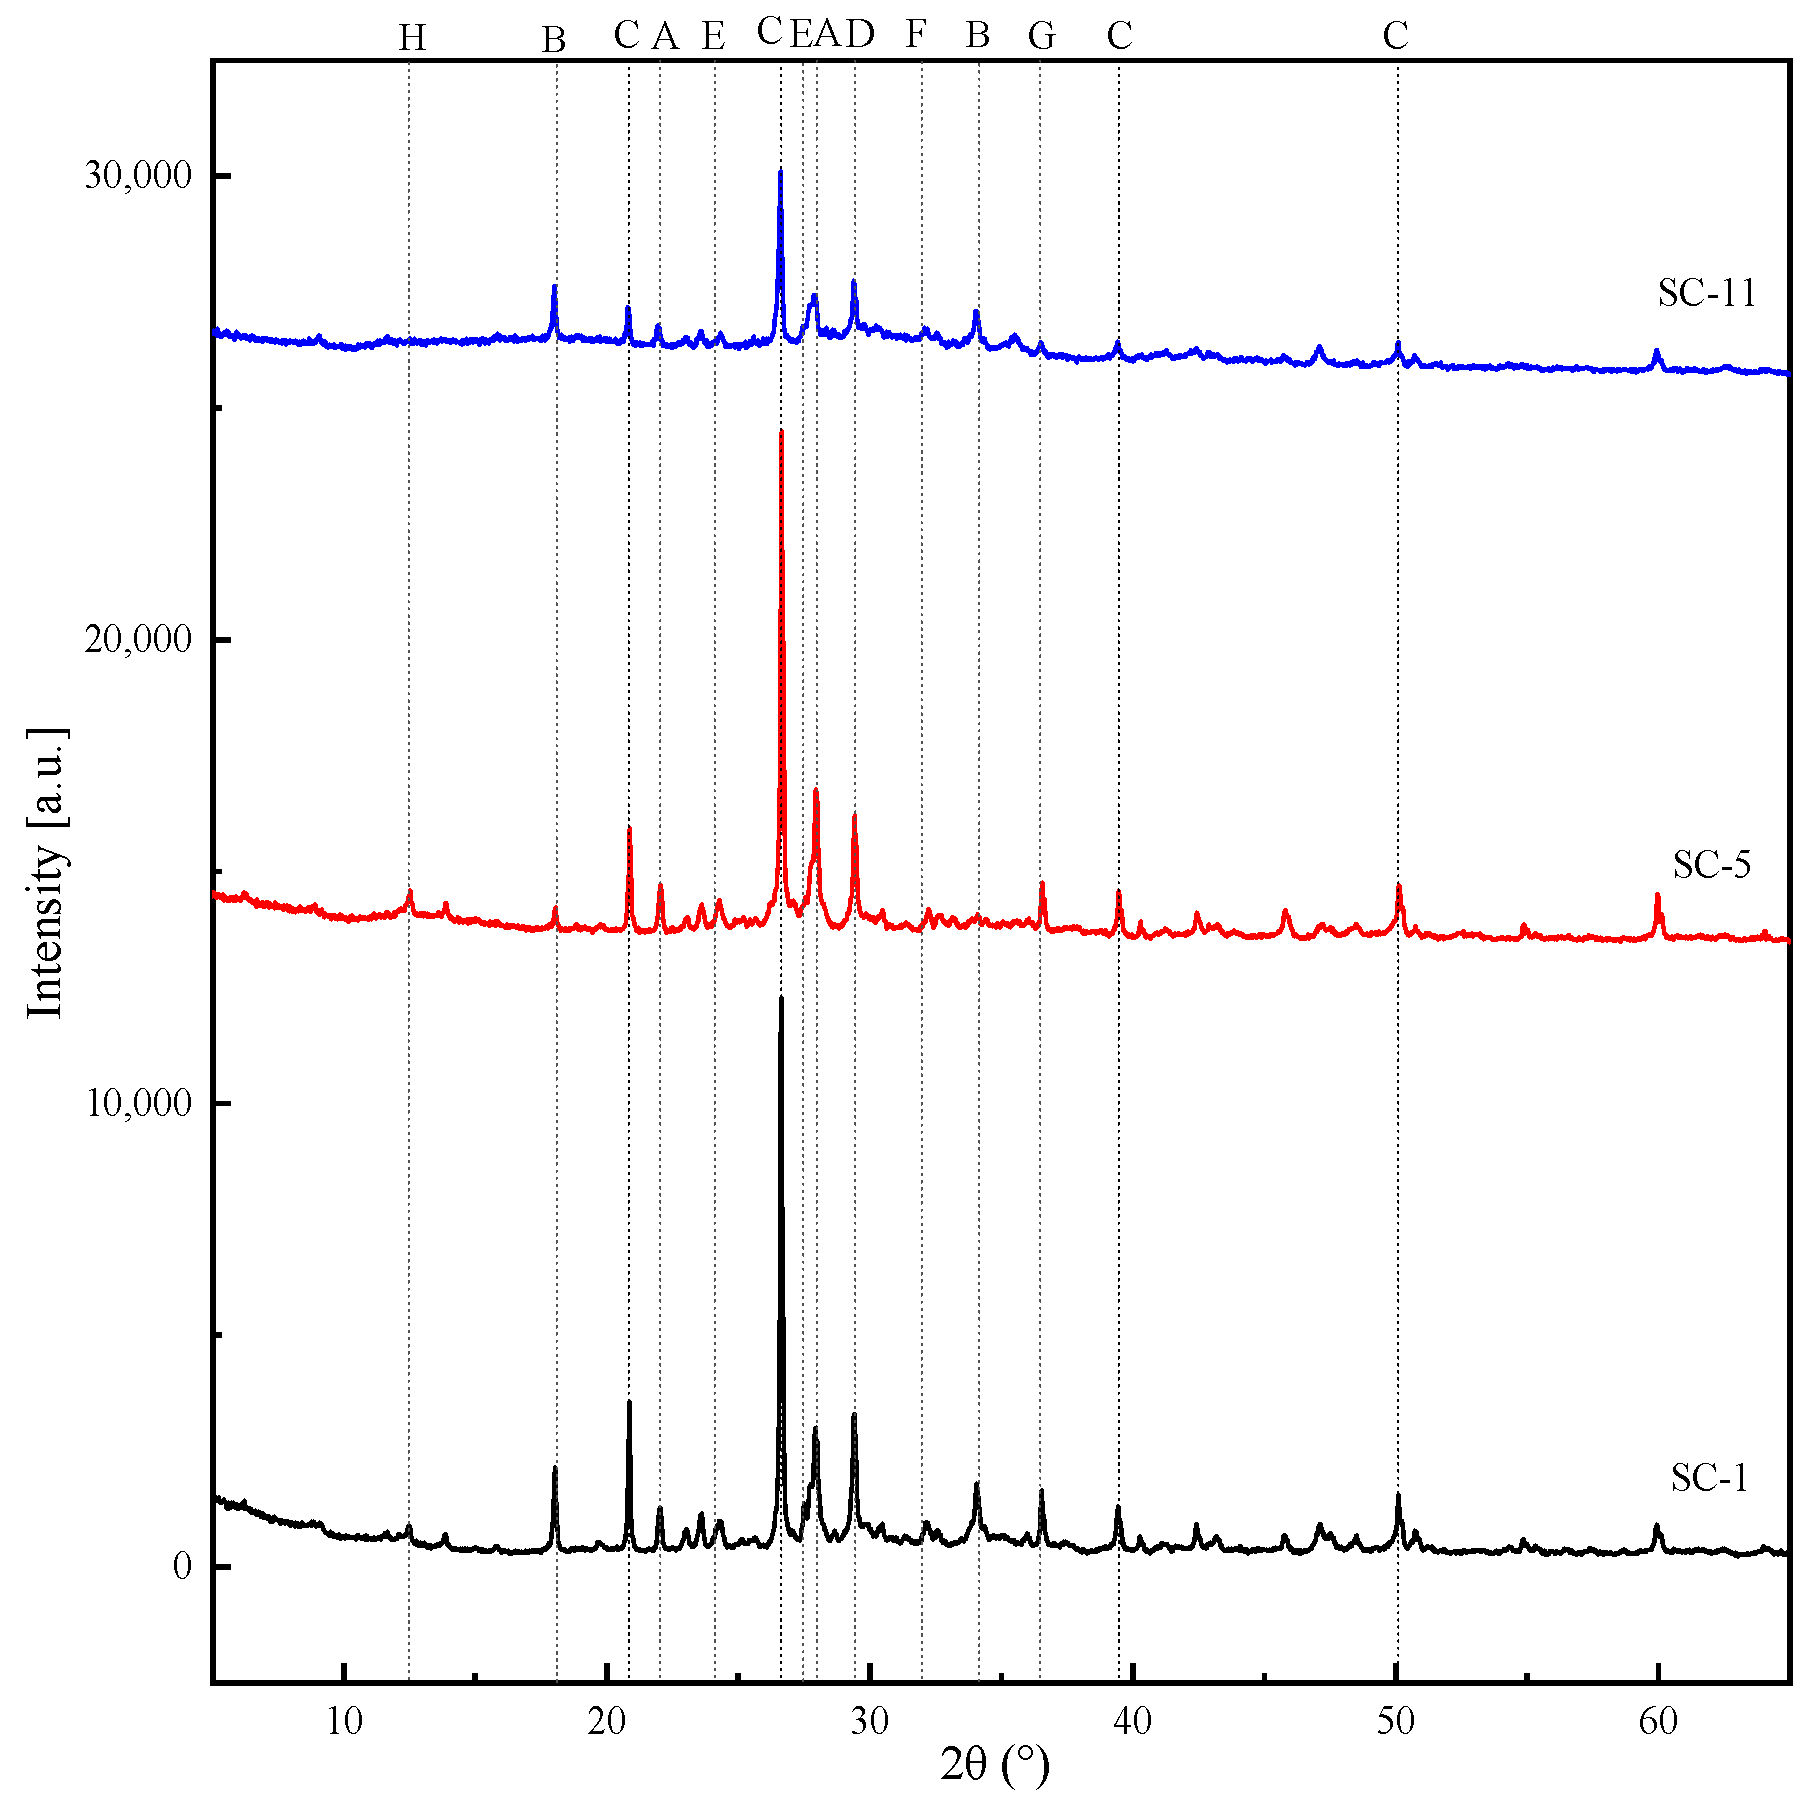
3.3. Destructive State of the SC

Cubic compressive strength tests were conducted on the concrete to observe the damage evolution and morphology of the SC, which were found to be similar to those of ordinary concrete. At approximately 0.8 times the peak load, small vertical cracks first appeared at the top and bottom edges of the sides of the cube. As the load increased, the cracks widened and extended to the middle of the sides. Upon reaching the peak load, the concrete on the side surface was peeled off, and an “X”-shaped diagonal crack was formed in the middle of the cube at an angle of approximately 45°. The top and bottom of the cube were connected by two prismatic cracks. The damage patterns are shown in Figure 5.
The splitting tensile strength test found that, at approximately 0.95 times the peak load, small vertical cracks first appeared on the side of the test block. As the load continued to increase, these cracks rapidly widened, leading to the splitting of the test block, although the cross-section remained relatively flat. The morphologies of the SC specimens from the splitting tensile strength test are shown in Figure 6. Further observation of the splitting cross-sections of each SC specimen revealed two types of failures: (1) stone fractures and (2) the peeling off of stones from the cement mortar matrix. This indicated that, in some cases, the bond strength between the slag cementitious mortar and the coarse aggregate was higher than the strength of the slag itself. From group SC-6 onwards, holes began to appear in the split cross-sections. As the slag replacement rate increased, both the number and size of these holes increased, suggesting that a high dosage of slag adversely affected the performance of the concrete. The splitting cross-sections of the SC specimens are shown in Figure 7.
An axial compressive strength test was conducted during the initial loading period. The SC surface did not show obvious cracks as the loading continued, up to 0.75 times the peak load. The middle of the side of the specimen in the direction of the loading, which was vertically parallel to the direction of the crack, continued to be loaded, and cracks developed vertically. As the load continued to increase to 0.9 times the peak load, the specimen side of the diagonal cracks quickly developed through the side surface of the concrete peeling and in the middle of the test block to form “X”-shaped oblique cracks intersecting at a 75° angle, thereby forming the top and bottom of the two top-connected prismatic vertebrae. The damaged surfaces exhibited peeling cracks in the stone and cement mortar matrices. The SC axial compressive strength test patterns are shown in Figure 8.
The static modulus of elasticity test showed that the SC specimens did not exhibit any cracks during the alignment or pre-compression stages. The subsequent loading process exhibited characteristics similar to those observed in the axial compressive strength test; however, the damage load was approximately 10% lower compared to the axial compressive strength test.
The structural state of each component of the SC was analyzed at the microscopic level using an SEM. An SC-5 concrete block, sampled after 28 days, was selected for this analysis. The SEM image of the base phase interface is shown in Figure 9.
As shown in Figure 9a–c, dense needle- and rod-shaped calcite (AFt) formed in the spaces around the aggregate (S). These formations filled the interstitial spaces between the aggregates, producing a dense concrete paste. Figure 9d reveals micropores of various sizes within the slag (CC) particles visible on the ruptured surfaces. These micropores absorbed a significant amount of water during mixing, which reduced the workability of the concrete. In addition, the presence of micropores decreased the solidity of the slag, adversely affecting the strength of the concrete. Figure 9e,f show that needle- and rod-like calcite (AFt) and cluster-like hydrated calcium silicate (C–S–H) formed around the slag particles. The strength of these hydration products was greater than that of the slag particles. Consequently, the SC rupture surface first appeared on the slag particles under loading and then extended outward, leading to concrete damage.
Microscopic observations indicated that the strength of the coal-fired SC was closely related to the degree of hydration and the amount of slag added. A higher degree of hydration resulted in a dense concrete slurry with fewer voids and greater strength. Conversely, a smaller amount of slag reduced the number of weak areas in the concrete structure, thereby increasing its strength, as reported in the literature [32]. This observation is consistent with the mechanical properties of concrete. The slag particles of the SC-5 group are surrounded by the hydration products C-S-H because of the water absorbed inside the slag particles in the later curing process. This contributes to the hydration of the cementitious material around the slag particles, and the protection of slag particles to strengthen the SC-5 group is the same as that of ordinary concrete.
The X-ray diffraction (XRD) test results for the 28-d old SC-1, SC-5, and SC-11 groups are shown in Figure 10. As shown in the figure, the hydration products across all groups, including quartz (SiO2), ettringite (AFt), calcite (CaCO3), calcium hydroxide (Ca(OH)2), and hydrated calcium silicate(C-S-H), were similar. However, the intensities and appearance of the diffraction peaks of certain hydration products differed.
Overall, the intensities of the diffraction peaks for each phase were highest for SC-1, second highest for SC-5, and lowest for SC-11. Specifically, C–S–H diffraction peaks were evident in SC-1, indicating the formation of a substantial amount of C-S-H. The diffraction peaks of SC-5 were similar to those of SC-1, but with a reduced intensity. The diffraction peak intensity of Ca(OH)2 was low, while the intensities of Aft and CaCO3 were high, suggesting that Ca(OH)2 continued to react to form Aft and CaCO3. In SC-11, the diffraction peak intensities of the physical phases were smaller compared to SC-1 and SC-5, and the hydration products were less apparent, correlating with the reduced strength of these concrete specimens. The SEM and XRD analysis results strongly supported the observed trends in the mechanical properties of the SC. Silica diffraction peaks were observed in all the samples owing to the incorporation of fly ash. Unhydrated fly ash was the main quartz phase, as observed in the SEM images. Some fly ash did not participate in the hydration and instead acted as a filler within the internal microcracks and variously sized pores, contributing to the denser internal structure of the concrete [33]. Additionally, the presence of calcium carbonate diffraction peaks in all the XRD results was attributed to the conversion of free calcium ions into Ca(OH)2 in an alkaline environment, leading to the formation of a calcite phase [34,35].

3.4. Analysis of Mechanical Properties of the SC

3.4.1. Cubic Compressive Strength of the SC

To show the effect of the slag replacement rate on the mechanical index of the concrete, the test results were normalized. The SC-0 group was used as the reference benchmark. For each mechanical index, the test results for each SC group were divided by those of the SC-0 group. The dimensionless results are shown in Figure 11.
As shown in Figure 11, the SC cubic compressive strength initially increased and then decreased as the slag replacement rate rose, with the overall strength ranging from 89% to 107% of the benchmark. Except for the SC-100 group, all other groups achieved cubic compressive strengths exceeding 60 MPa, comparable to ordinary concrete, demonstrating favorable compressive properties. When the slag replacement rate was below 60%, the cubic compressive strength was comparable to or slightly higher than that of the benchmark group, with the highest strength observed at a 10% substitution rate. Two main factors in these variations in cubic compressive strength are favorable and unfavorable conditions in the cubic compressive strength. First, the slag particles exhibited advantageous water absorption properties, enabling them to store water during the mixing process. This indirectly reduced the water–cement ratio and enhanced the strength of the concrete. During the curing phase, the slag particles continued to absorb and retain water, and the cementitious material was formed on the slag particle surface, which comprised calcium aluminate and hydrated calcium silicate [31]. This improved the structural compactness of the concrete, and the SC cubic compressive strength increased. Second, the slag particles exhibited poor texture, with an unstable and weak structure owing to micropores. Under loading, these particles tended to crush and develop fissures, which compromised the integrity of the concrete and decreased the SC cubic compressive strength. In practice, these conditions have opposing effects. When favorable conditions outweigh unfavorable ones, the SC strength increases. Conversely, when unfavorable conditions dominate, the strength decreases. Analysis of the cubic compressive strength test results indicates that with slag replacement rates below 60%, favorable conditions prevailed. When the replacement rate exceeded 60%, unfavorable conditions became more pronounced, with higher slag replacement rates exacerbating these effects.

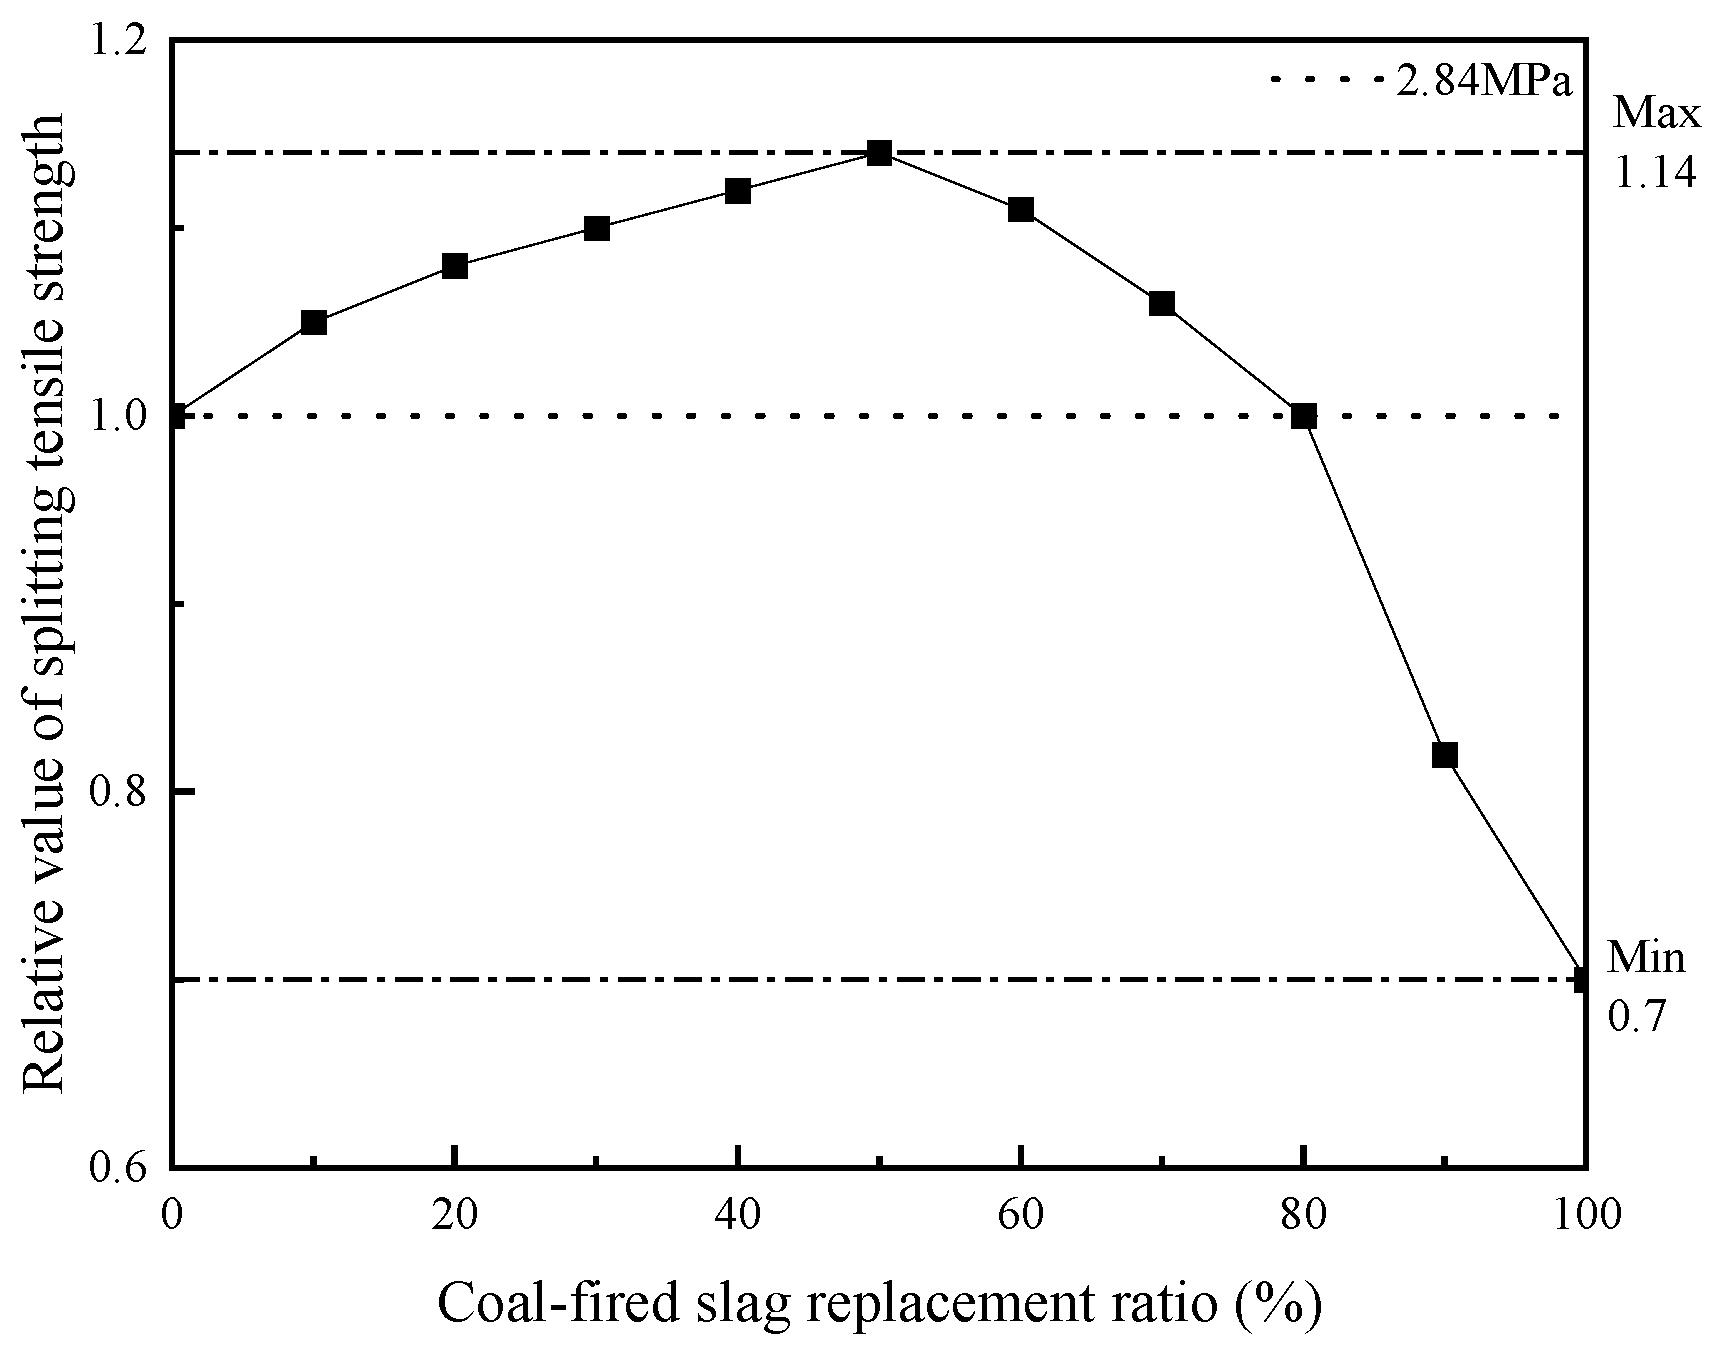
3.4.2. Splitting Tensile Strength of the SC

Considering the splitting tensile strength of the SC-0 group as the base value, the splitting tensile strengths of each group were normalized, and the results are shown in Figure 12.
Figure 12 shows that the splitting tensile strength of the SC increased with the slag replacement rate up to a certain point. The values ranged from 70% to 114% of the control group’s strength. All groups except SC-90 and SC-100, achieved a splitting tensile strength of at least 2.84 MPa. The highest splitting tensile strength of 3.24 MPa was observed at a slag replacement rate of 50%.

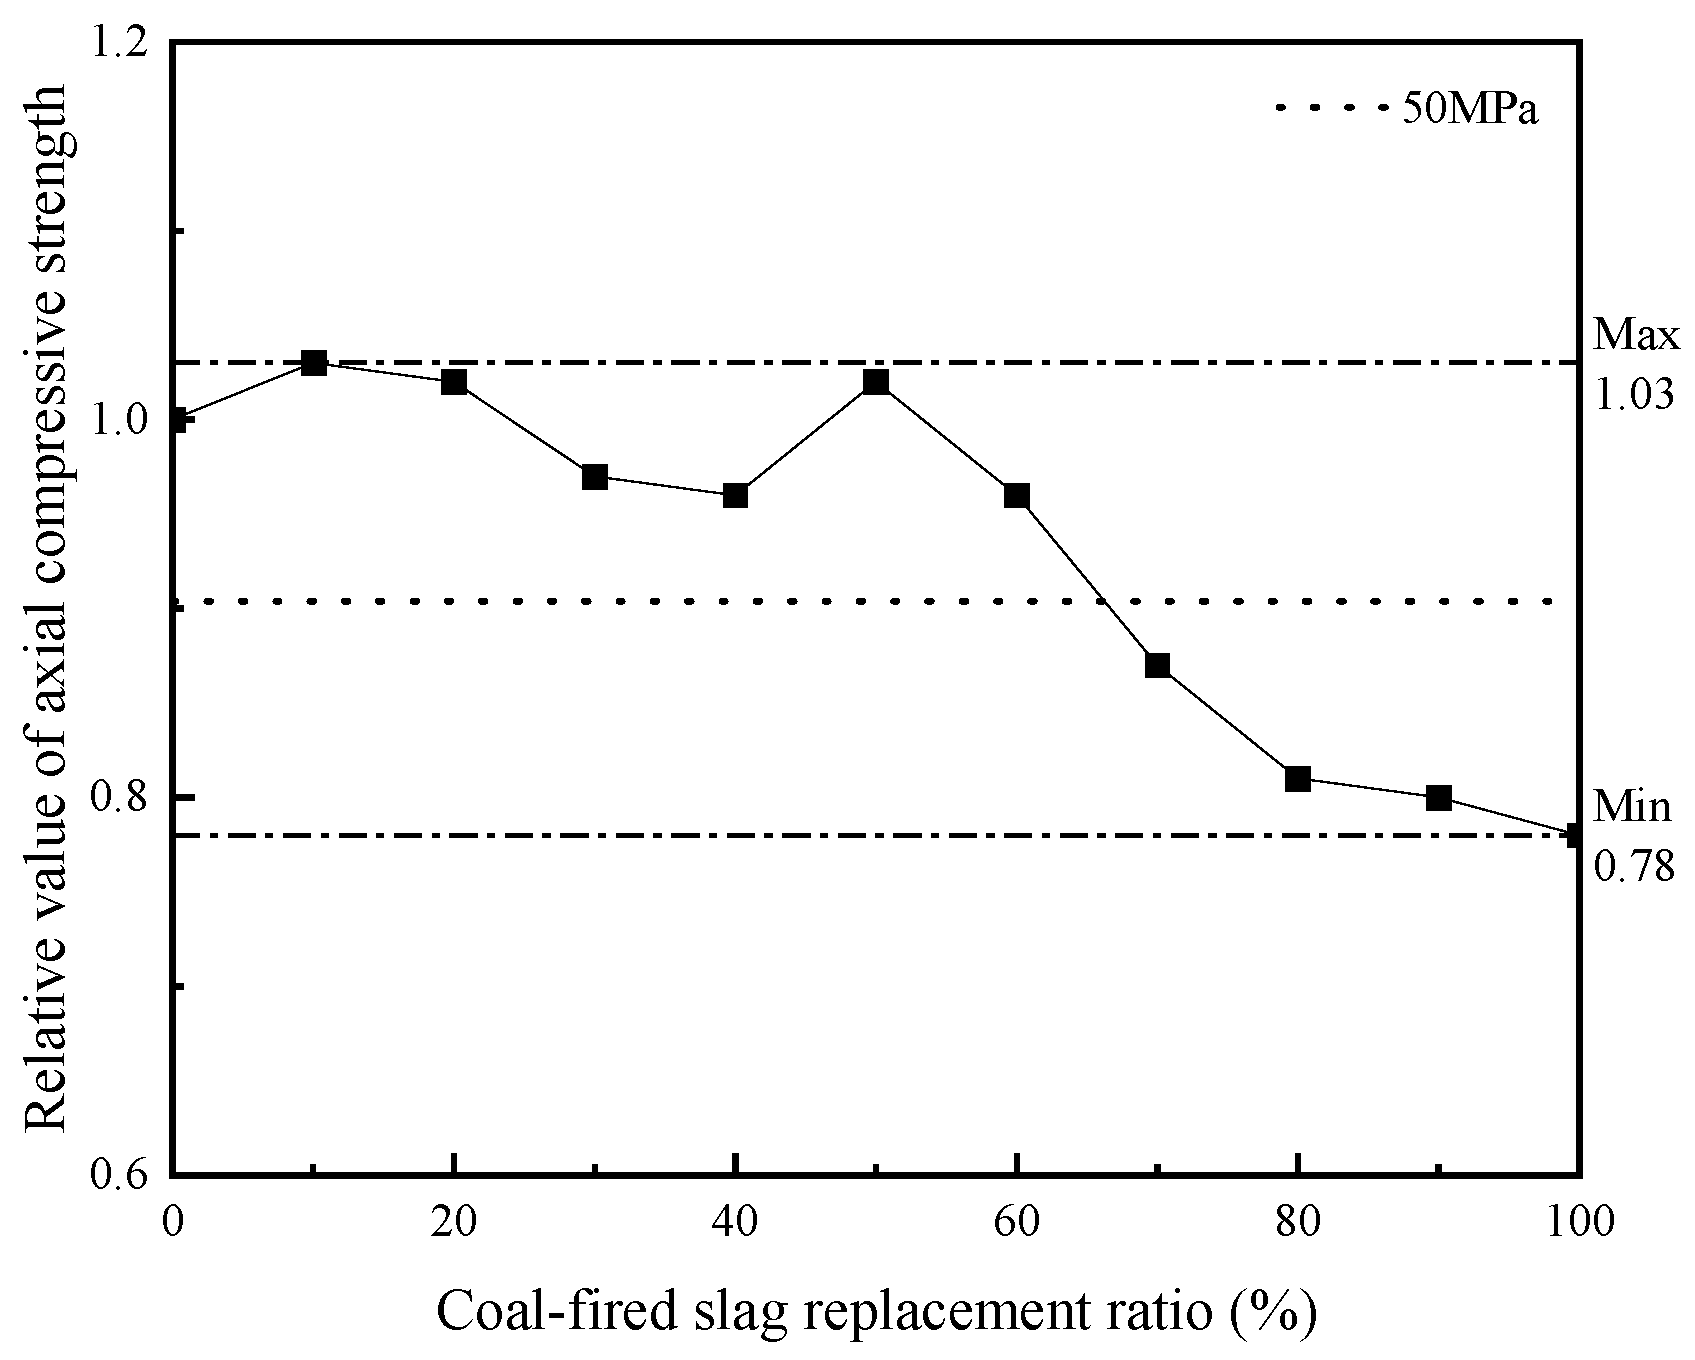
3.4.3. Axial Compressive Strength of the SC

Considering the axial compressive strength of the SC-0 group as the base value, the normalized axial compressive strength for each group is shown in Figure 13.
As shown in Figure 13, the axial compressive strength of the SC concrete initially increased with the slag replacement rate but then decreased. The overall rate of change ranged from 78% to 103%. When the slag replacement rate was below 60%, the strength changes were minimal compared to the benchmark group, remaining above 50 MPa. The highest axial compressive strength (57.23 MPa) was observed at a 10% replacement rate. However, when the replacement rate exceeded 50%, the axial compressive strength of the SC concrete gradually decreased.

3.4.4. Static Elastic Modulus of the SC

The static moduli of elasticity values for the SC-0 group were used as the base values, and the normalized static modulus of elasticity for each group is shown in Figure 14.
As shown in Figure 14, the normalized static moduli of elasticity values of the SC were less than 1. As the slag replacement rate increased, the values initially decreased, then increased, and subsequently decreased again, exhibiting an overall reduction of 20% or less.

3.4.5. Optimal Slag Substitution Rate

Considering the cubic compressive strength, the concrete strength of the SC-1 group was optimal and was 7% higher than that of the SC-0 group. Considering the split tensile strength, the concrete strength of the SC-5 group was optimal and was 14% higher than that of ordinary concrete. Considering the axial compressive strength, the concrete strengths of the SC-1, SC-2, and SC-5 groups were higher than those of ordinary concrete. Considering slag utilization and strength changes, the optimum slag replacement rate in this study was 50%. At this time, the concrete splitting tensile strength and axial compressive strength were the highest, and the cubic compressive strength of the SC-5 group was reduced by approximately 5.6% compared with that of the SC-1 group; however, it was still higher than that of the SC-0 group and greater than 60 MPa. Most importantly, a slag substitution rate of up to 50% enables the use of considerable amounts of slag in construction projects.

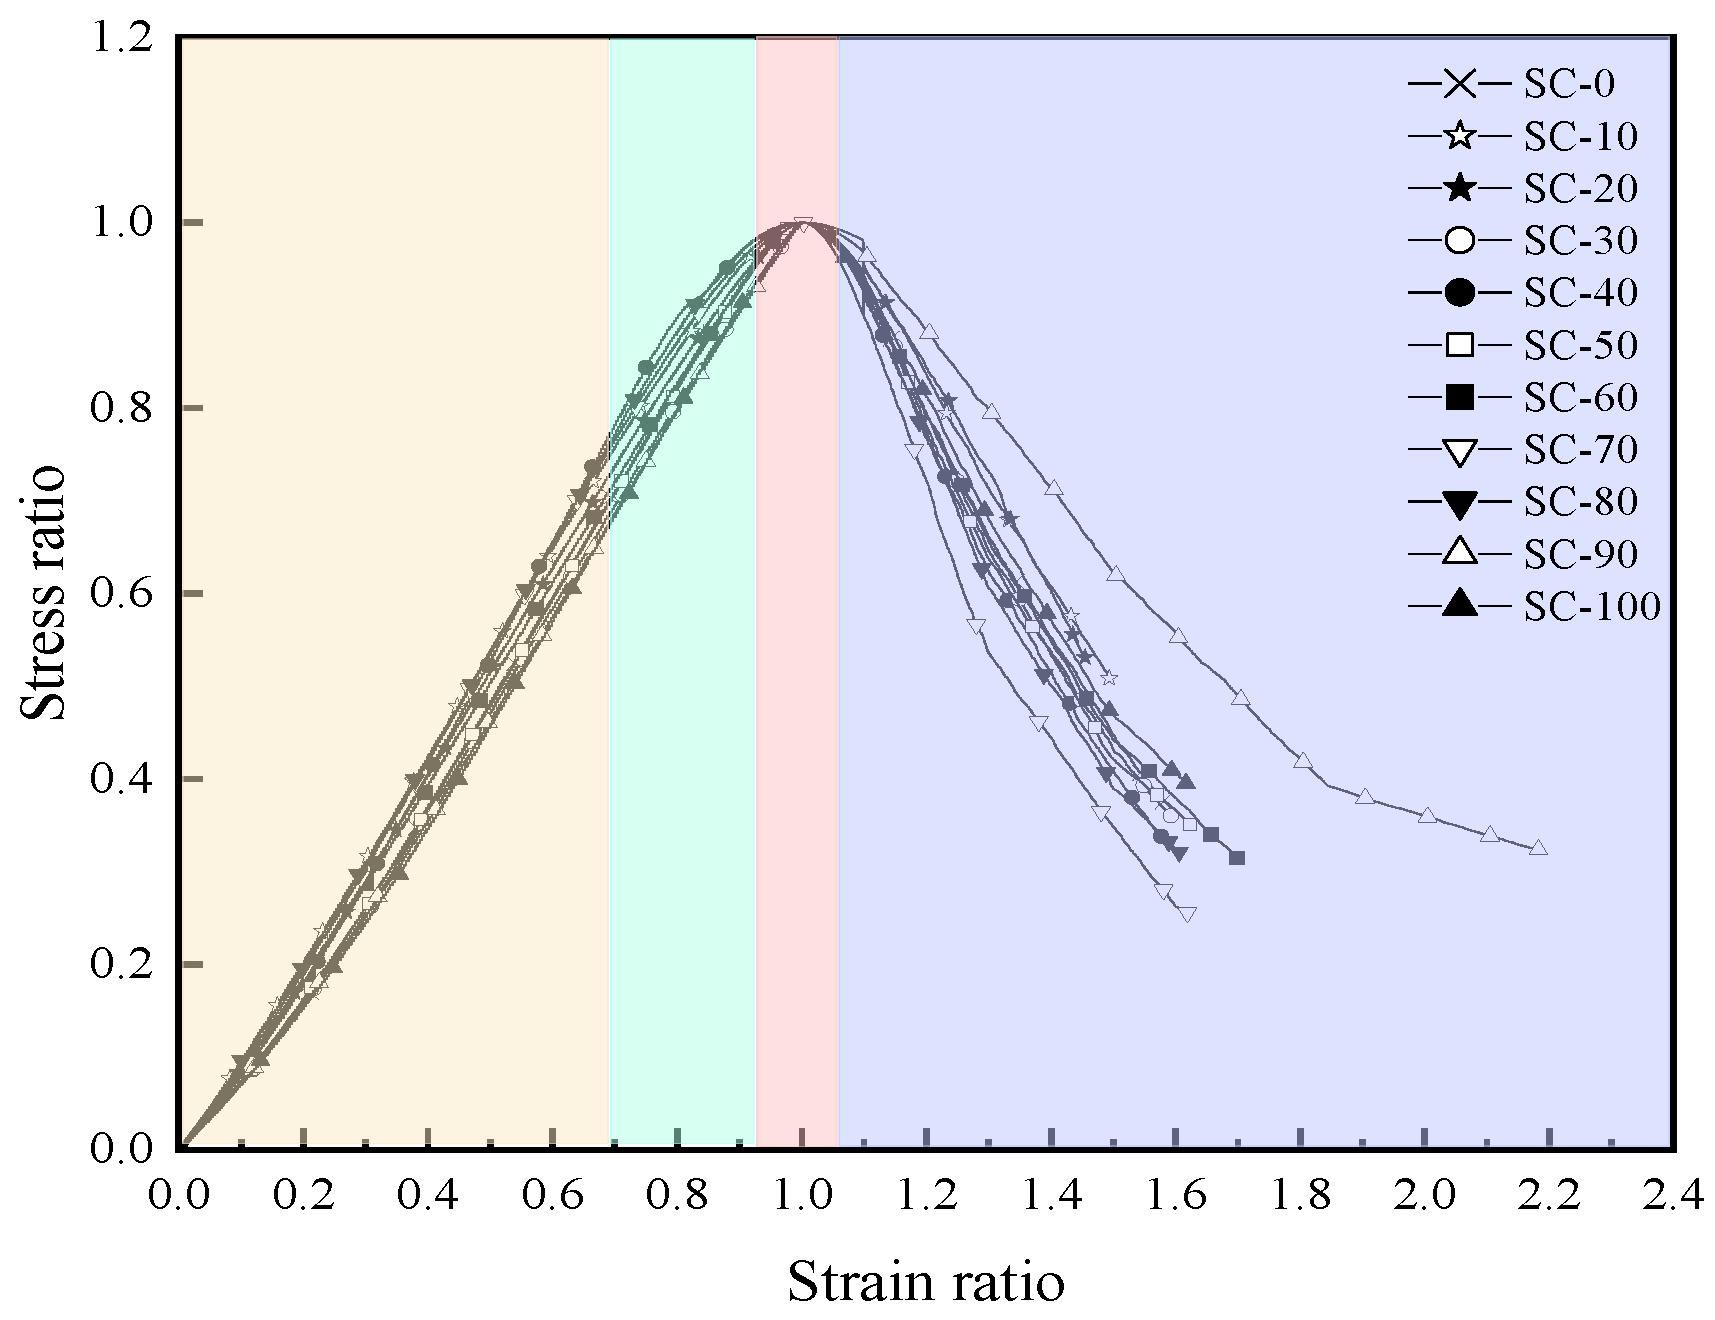
3.4.6. Stress–Strain Curve

According to the load and position data exported from the testing machine, the specimen stress–strain values were obtained using
σ = F / A ,   ε = Δ L / L
where F represents the axial compressive load, A represents the axial compression cross-sectional area, Δ L represents the axial compression deformation of the specimen, and L represents the axial length of the original specimen.
Considering the peak stress σ c and peak strain ε c of the specimen as the reference values, the stress and strain values calculated using Equation (1) were compared to the reference values. The stress ratio was plotted on the vertical coordinate, and the strain ratio on the horizontal coordinate. The dimensionless processing of the specimen stress–strain values enabled the generation of the full curve of the SC dimensionless stress–strain data, which are shown in Figure 15.
As shown in Figure 15, the SC dimensionless stress–strain curve closely resembles the stress–strain curve of ordinary concrete and can be approximately divided into four stages: elasticity, elasto-plasticity, peak, and decline. The strain ratios in the elastic, elasto-plastic, peak, and decline phases are in the ranges of 0–0.7 (light yellow region), 0.7–0.92 (light green region), and 0.92–1.07 (light pink region), which are greater than 1.07 (light purple region), respectively. From the beginning to the peak stress stage, the trends of the test curve were similar, indicating that the components in the specimen were stressed simultaneously and worked together. After reaching the peak stress, the decline stage curve became steeper and differed from the linearity observed in the elasticity stage, with increased curve dispersion. This indicates that, following the peak stress, cracks and damage developed within the concrete, with damage propagation occurring at different weak points. Notably, the smaller the slag substitution rate, the flatter the descending segment in the stress–strain curve. The larger the slag substitution rate, the steeper the slope of the descending segment in the stress–strain curve. This phenomenon was a result of the destruction of slag particles. When the strain ratio exceeded 1.07, the slag particles were the first to rupture and form a weak point, which further developed to form a ruptured surface and led to the failure of the specimen. The more the slag added, the faster the weak point developed on the rupture surface and the greater the slope of the curve.

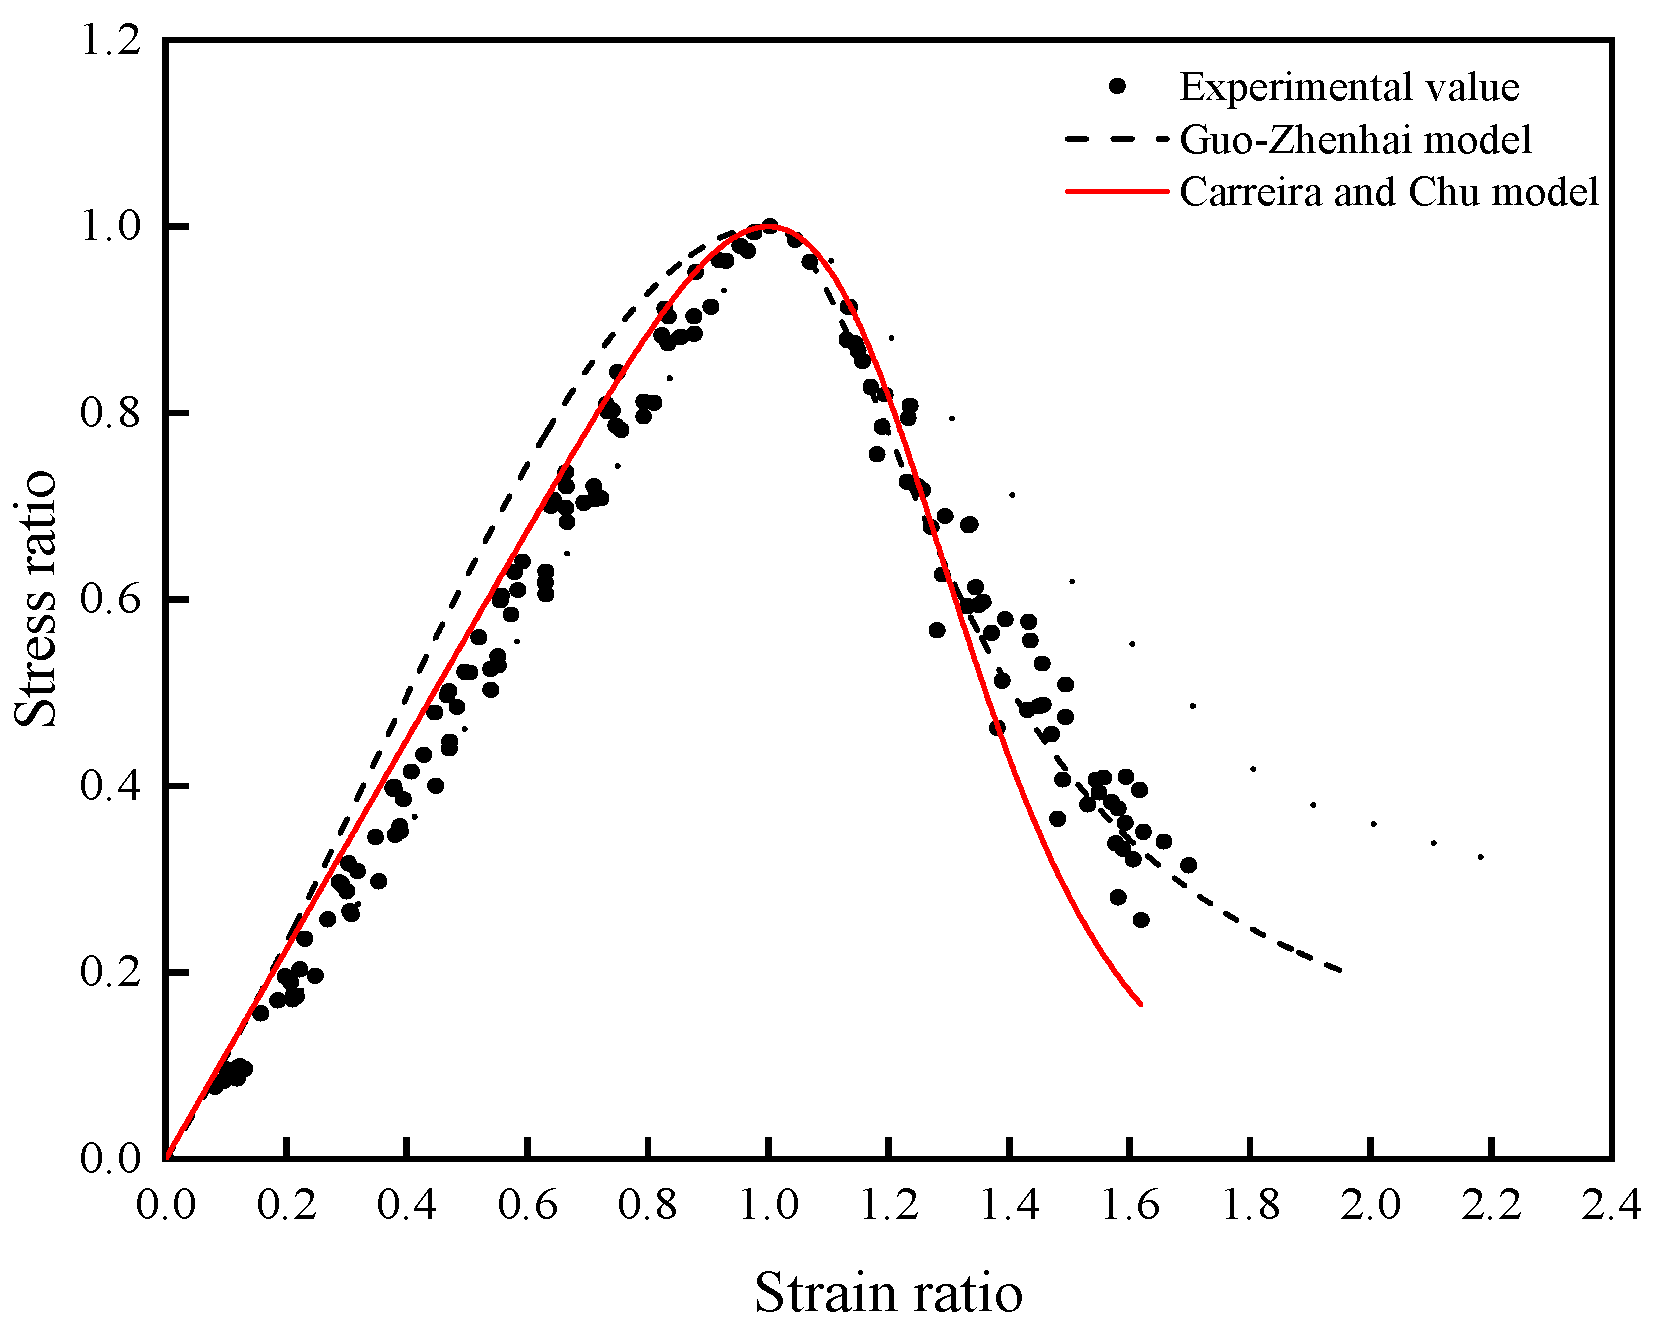
4. Constitutive Equation of the SC

4.1. Constitutive Equation

Several typical constitutive equations that describe the stress–strain relationship in ordinary concrete have been developed. These include the models of Carreira and Chu [36] and Guo-Zhenhai [37]. The curve equations for the Guo-Zhenhai and Carreira–Chu models are presented in Table 6. In this study, these typical constitutive equations were used as references to perform nonlinear fitting based on the normalized stress–strain curve of the SC. The best-fit curves are shown in Figure 16.
As shown in Figure 16, during the ascending stage, the Carreira and Chu model demonstrated better consistency, with an R2 value of 0.968, while the Guo-Zhenhai model exhibited greater deviation, with an R2 value of 0.7852. In the descending stage, the Guo-Zhenhai model aligned more closely with the Carreira and Chu model, exhibiting an R2 value of 0.9978. Therefore, the equations for the intrinsic SC model were expressed using a segmented approach. Specifically, the Carreira and Chu model was used in the ascending stage, and the Guo-Zhenhai model was used in the descending stage. This approach can be expressed as
{ y = β x β 1 + x β , ( 0 x 1 ) y = x α ( x 1 ) 2 + x , ( x 1 )
where β is the parameter in the equation for the ascending stage of the full stress–strain curve of the SC ( β = 1 1 f C / ( ε C E C ) ), E C is the modulus of elasticity of the concrete, and α is the parameter in the equation for the descending stage of the full stress–strain curve of the SC (which represents the brittleness of the material). The SC constitutive model equation was determined via segmental fitting with the test data, using β = 9.13 for the rising stage and α = 9.08 for the descending stage of the curve.

4.2. Damage Eigen Structure Equation

According to damage mechanics theory, which models the damage process of SC, the degree of damage is expressed by
D = 1 E E 0
where E 0 is the initial cutline modulus of elasticity and E is the continuous damage cutline modulus of elasticity.
Considering concrete damage that occurs according to the Weibull distribution [38], introducing the Lemaitre strain equivalence hypothesis [39], and based on the research of Li et al. [40] on the damage equations for desert sand, the elastic–plastic damage equation for SC can be expressed as
y = exp [ ( x η ) m ] [ ( 1 C ) x B ]
Based on the SC test data, Equation (4) was fitted using OriginPro 2020 (Learning Edition) and the parameters of the stress–strain constitutive equation were obtained as m = 5.51, η = 1.39, B = 0.069, and C = −0.223. The fitting results are shown in Figure 17.

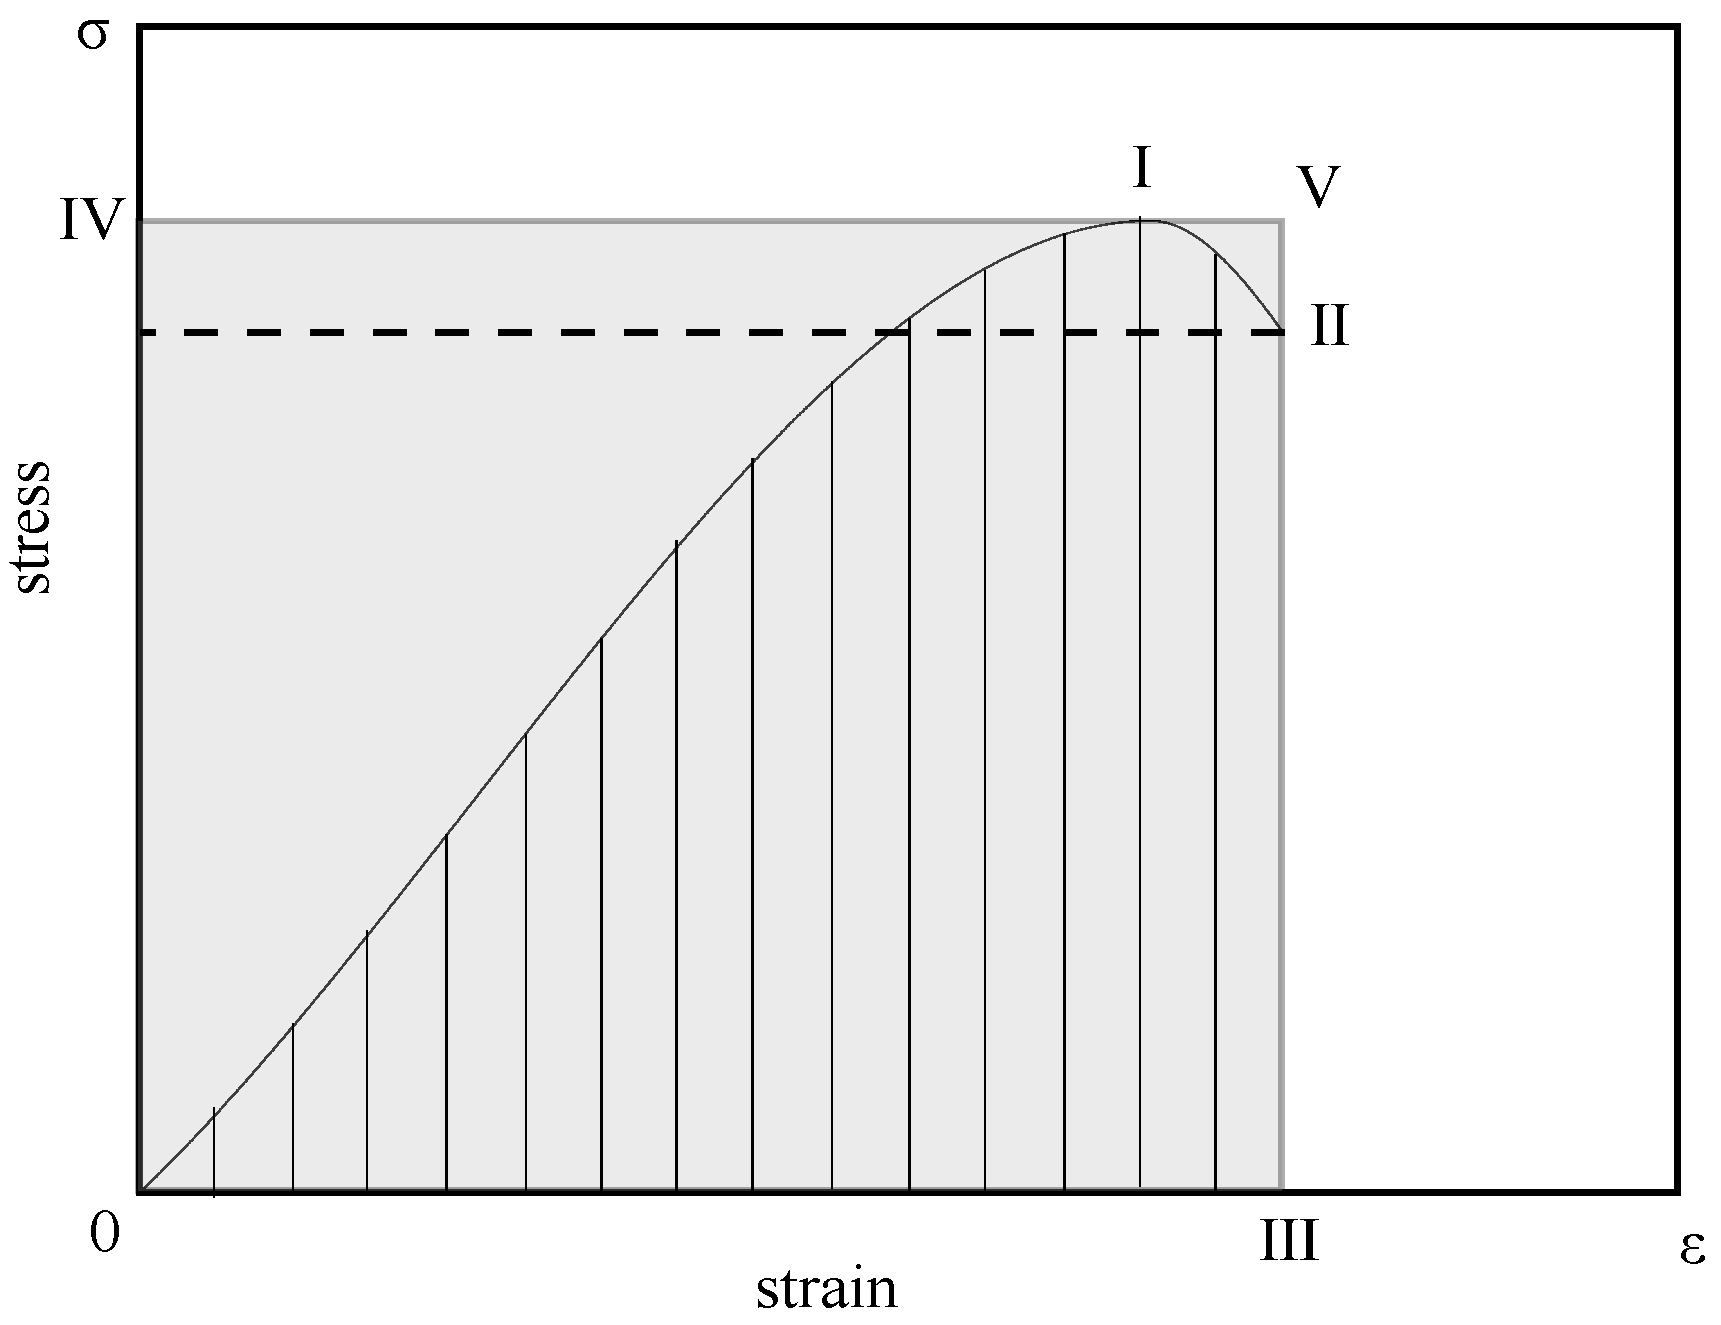
5. Energy Consumption Analysis of the SC

An energy dissipation factor was introduced to analyze the energy dissipation properties of SC; it is expressed as
δ = S 0 I II III / S 0 IV IV III
where S 0 I II III is the area surrounded by the stress–strain curves 0 I II and horizontal axis 0 III , and S 0 IV IV III is the shaded area of the rectangle surrounded by the peak stress point I and ultimate strain point II . The stress at the ultimate strain point was 0.85 times the peak stress, as shown in Figure 18.
The energy dissipation coefficient for each concrete group was calculated using Equation (5), and the results are listed in Table 7. When the slag replacement rate was 30% or less, the energy dissipation coefficient of the SC was not significantly different from that of ordinary concrete. However, when the slag replacement rate exceeded 30%, the energy dissipation coefficient of the SC gradually decreased with increasing slag replacement rate. This indicates that SC with a higher proportion of slag admixture exhibited inferior energy dissipation performance compared to ordinary concrete.

6. Conclusions

In this study, SC was prepared by replacing fine aggregate with slag produced by a coal-fired power plant. The effects of the slag replacement rate on the mechanical properties, workability, and overall characteristics of the SC were investigated. The following conclusions were drawn:
(1) The slag incorporated in concrete reduced the workability of concrete. The more the slag incorporated, the more significantly the workability of concrete was reduced. The pores of slag absorbed more water during mixing than those of river sand, the amount of water allocated to cement and fly ash was reduced, and the cementitious materials did not receive enough water for the hydration reaction, leading to poorer concrete cohesion.
(2) As the slag replacement rate increased, the cubic compressive strengths and axial compressive strengths of the SC exhibited a pattern of initial increase, subsequent decrease, another increase, and final decrease. The split tensile strength initially increased and then decreased, while the static modulus showed an initial decrease, followed by an increase, and then a final decrease. These changes were observed because the slag particles absorbed water and indirectly reduced the water–cement ratio of the concrete. Moreover, the defects of the slag with voids developed weak parts in the concrete; the higher the extent of slag incorporated, the greater the number of weak parts. These two reasons account for these changes.
(3) The full stress–strain curve of the SC was divided into four stages: elasticity, elastoplasticity, peak, and decline. Stress–strain and damage eigen equations for the SC were constructed, with the best-fit curves aligning well with the experimental results.
(4) When the slag replacement rate was 30% or less, the difference in the energy dissipation coefficient between SC and ordinary concrete was minimal. However, with slag replacement rates exceeding 30%, the energy dissipation coefficient of the SC gradually decreased. When the slag substitution rate was 100%, the energy-dissipation coefficient was approximately 13.8% lower than that of ordinary concrete.
(5) For slag replacement rates of 40–60%, the mechanical properties of the SC were enhanced. Based on split tensile strength, a slag replacement rate of 50% was found to be optimal for satisfying the C60 strength requirements for structural engineering applications of SC. At this time, the strength of concrete increased by 0.6% compared with that of ordinary concrete, but the dosage of slag in the concrete was significantly increased, improving the economic value of slag and expanding the scope of application of slag concrete, thus addressing the issue of slag open-air stacking caused by environmental pollution.

Author Contributions

J.Z.: Conceptualization, Methodology, Data Curation, and Original Draft Writing; G.L.: Supervision, Writing—review, Project administration, and Funding acquisition; D.Y.: Resources and Formal analysis; Y.L.: Investigation, Data Collection, Formal analysis; Y.Z.: Investigation and Validation. All authors have read and agreed to the published version of the manuscript.

Funding

This study was funded by Yili Normal University Research Project (2022YSYY002), Yili Prefecture Science and Technology Plan Project (YZ2022YD008), and the Eighth Division Science and Technology Plan Project (2024GY03).

Data Availability Statement

Data underpinning the findings of this investigation are accessible upon reasonable request from the corresponding author and are subject to compliance with the applicable data protection regulations.

Conflicts of Interest

The authors report no potential conflicts of interest.

References

  1. China Electric Power Planning & Engineering Institute. China Energy Development Report 2023; People’s Daily Press: Beijing, China, 2024; p. 306. [Google Scholar]
  2. Zhang, M.; Lv, T.; Deng, X.; Dai, Y.; Sajid, M. Diffusion of China’s coal-fired power generation technologies: Historical evolution and development trends. Nat. Hazards 2018, 95, 7–23. [Google Scholar] [CrossRef]
  3. Jayaranjan, M.L.D.; van Hullebusch, E.D.; Annachhatre, A.P. Reuse options for coal fired power plant bottom ash and fly ash. Rev. Environ. Sci. Bio/Technol. 2014, 13, 467–486. [Google Scholar] [CrossRef]
  4. Orozco, C.; Babel, S.; Tangtermsirikul, S.; Sugiyama, T. Comparison of environmental impacts of fly ash and slag as cement replacement materials for mass concrete and the impact of transportation. Sustain. Mater. Technol. 2024, 39, e00796. [Google Scholar] [CrossRef]
  5. Li, Y.; Liu, Y.; Gong, X.; Nie, Z.; Cui, S.; Wang, Z.; Chen, W. Environmental impact analysis of blast furnace slag applied to ordinary Portland cement production. J. Clean. Prod. 2016, 120, 221–230. [Google Scholar] [CrossRef]
  6. Orna Carmona, M.; González Paules, J.; Sánchez Catalán, J.C.; Fernández Pousa, L.; Ade Beltrán, R.; Quero Sanz, F. Recycling power plant slag for use as aggregate in precast concrete components. Mater. Construcción 2010, 60, 99–113. [Google Scholar] [CrossRef]
  7. Mohammed, S.A.; Koting, S.; Katman, H.Y.B.; Babalghaith, A.M.; Abdul Patah, M.F.; Ibrahim, M.R.; Karim, M.R. A Review of the Utilization of Coal Bottom Ash (CBA) in the Construction Industry. Sustainability 2021, 13, 8031. [Google Scholar] [CrossRef]
  8. Andreev, V.; Bryukhan, F. Some prospects for the use of ash and slag wastes of coal power plants for production of building materials. MATEC Web Conf. 2016, 86, 04004. [Google Scholar] [CrossRef]
  9. Ashish, D.K.; Verma, S.K.; Singh, J.; Sharma, N. Strength and durability characteristics of bricks made using coal bottom and coal fly ash. Adv. Concr. Constr. 2018, 6, 407422. [Google Scholar] [CrossRef]
  10. Siddique, R. Utilization of coal combustion by-products in sustainable construction materials. Resour. Conserv. Recycl. 2010, 54, 1060–1066. [Google Scholar] [CrossRef]
  11. Argiz, C.; Menéndez, E.; Moragues, A.; Sanjuán, M.Á. Recent Advances in Coal Bottom Ash Use as a New Common Portland Cement Constituent. Struct. Eng. Int. 2018, 24, 503–508. [Google Scholar] [CrossRef]
  12. Skoko, B.; Babić, D.; Marović, G.; Papić, S. Environmental radiological risk assessment of a coal ash and slag disposal site with the use of the ERICA Tool. J. Environ. Radioact. 2019, 208–209, 106018. [Google Scholar] [CrossRef] [PubMed]
  13. Saha, D.; Chatterjee, D.; Chakravarty, S.; Roychowdhury, T. Investigation of Environmental-Concern Trace Elements in Coal and Their Combustion Residues from Thermal Power Plants in Eastern India. Nat. Resour. Res. 2019, 28, 1505–1520. [Google Scholar] [CrossRef]
  14. Singh, M.; Siddique, R. Compressive strength, drying shrinkage and chemical resistance of concrete incorporating coal bottom ash as partial or total replacement of sand. Constr. Build. Mater. 2014, 68, 39–48. [Google Scholar] [CrossRef]
  15. Huang, Y.; Zhou, A.; Gong, B. Study on Mechanical Properties of PET Fiber-Reinforced Coal Gangue Fine Aggregate Concrete. Geofluids 2021, 2021, 6627447. [Google Scholar] [CrossRef]
  16. Zhao, Y.; Li, S.; Jin, B.; Li, S.; Zheng, C.; Wang, J. Study on the mechanical properties of self-compacting recycled aggregate concrete using CFB slag as fine aggregate. Phys. Chem. Earth Parts A/B/C 2023, 132, 103476. [Google Scholar] [CrossRef]
  17. Horiguchi, I.; Shirai, A.; Watanabe, M.; Sugihara, S. Fundamental study on concrete with coal gasification slag. Cem. Sci. Concr. Technol. 2012, 66, 615–621. [Google Scholar] [CrossRef]
  18. Jianpeng, Z.; Gang, L.; Yuwei, M.; Hua, T.; Haifeng, X.; Fangfang, Y.; Pengfei, S.; Yangmei, Z. Experimental study on the performance of the self-compacting slag concrete. New Build. Mater. 2017, 44, 43–45+76. [Google Scholar]
  19. Mingkai, Z.; Yuqiang, W.; Xiao, C. Influence Mechanism of Circulating Fluidized Bed Slag Replacing Machine-Made Sand on Concrete Strength. J. Build. Mater. 2022, 25, 1241–1247. [Google Scholar]
  20. Guo, Z.; Liu, W.; Wang, C.; He, C.; Zhang, F. Fractal characteristics of mesostructure and optimization of axial compression constitutive model of coal-fired slag concrete. Mater. Today Commun. 2021, 28, 102686. [Google Scholar] [CrossRef]
  21. Tyulenev, M.; Murko, V.; Khyamyalyainen, V.; Baranova, M.; Zhironkin, S.; Khoreshok, A.; Vöth, S.; Cehlár, M.; Nuray, D.; Janocko, J.; et al. Use of Ash-and-Slag Wastes after Burning of Fine-Dispersed Coal-Washing Wastes. E3S Web Conf. 2018, 41, 01042. [Google Scholar] [CrossRef]
  22. Poudel, S.; Menda, S.; Useldinger-Hoefs, J.; Guteta, L.E.; Dockter, B.; Gedafa, D.S. The Use of Ground Coal Bottom Ash/Slag as a Cement Replacement for Sustainable Concrete Infrastructure. Materials 2024, 17, 01042. [Google Scholar] [CrossRef] [PubMed]
  23. Reshma, T.V.; Kumar, P.C. Effect of slag sand as river sand and its influence on compressive strength of the cement mortar. Mater. Today Proc. 2023. [Google Scholar] [CrossRef]
  24. Korkut, F.; Karalar, M.; Motameni, A.; Althaqafi, E.; Özdöner, N.; Özkılıç, Y.O. Experimental and Numerical Investigation of the Flexural Behavior of Reinforced-Concrete Beams Utilizing Waste Andesite Dust. Materials 2024, 17, 4413. [Google Scholar] [CrossRef] [PubMed]
  25. Ecemiş, A.S.; Madenci, E.; Karalar, M.; Fayed, S.; Althaqafi, E.; Özkılıç, Y.O. Shear performance of reinforced concrete beams with rubberas form of fiber from waste tire. Steel Compos. Struct. 2024, 51, 337–349. [Google Scholar] [CrossRef]
  26. Alharthai, M.; Özkılıç, Y.O.; Karalar, M.; Mydin, M.A.O.; Özdöner, N.; Çelik, A.İ. Performance of aerated lightweighted concrete usingaluminum lathe and pumice under elevated temperature. Steel Compos. Struct. 2024, 51, 271–288. [Google Scholar] [CrossRef]
  27. GB175-2007; Common Portland Cement. General Administration of Quality Supervision, Inspection and Quarantine of the People’s Republic of China & China National Standardization Administration: Beijing, China, 2007.
  28. JGJ 55-2011; Specification for the Design of Ordinary Concrete Ratio. Ministry of Housing and Urban-Rural Construction of the People’s Republic of China: Beijing, China, 2019.
  29. GB/T 50080-2016; Standard of Test Methods for Properties of Ordinary Concrete Mixes. Ministry of Housing and Urban-Rural Construction of the People’s Republic of China & General Administration of Quality Supervision, Inspection and Quarantine of the People’s Republic of China: Beijing, China, 2016.
  30. GB/T 50081-2019; Standard of Test Methods for Physical and Mechanical Properties of Concrete. Ministry of Housing and Urban-Rural Construction of the People’s Republic of China & State Administration for Market Regulation of the People’s Republic of China: Beijing, China, 2019.
  31. Singh, M.; Siddique, R. Effect of coal bottom ash as partial replacement of sand on workability and strength properties of concrete. J. Clean. Prod. 2016, 112, 620–630. [Google Scholar] [CrossRef]
  32. Singh, M.; Siddique, R. Strength properties and micro-structural properties of concrete containing coal bottom ash as partial replacement of fine aggregate. Constr. Build. Mater. 2014, 50, 246–256. [Google Scholar] [CrossRef]
  33. Juntao, H.; Xiangdong, S. Experimental study on early mechanical properties of natural lightweight aggregate concrete with external mixing fly ash. Bull. Chin. Ceram. Soc. 2012, 31, 847–851. [Google Scholar] [CrossRef]
  34. Chanda, S.S.; Patel, S.K.; Nayak, A.N.; Mohanty, C.R. Performance evaluation on bond, durability, micro-structure, cost effectiveness and environmental impacts of fly ash cenosphere based structural lightweight concrete. Constr. Build. Mater. 2023, 397, 132429. [Google Scholar] [CrossRef]
  35. Ma, X.; He, T.; Xu, Y.; Yang, R.; Sun, Y. Hydration reaction and compressive strength of small amount of silica fume on cement-fly ash matrix. Case Stud. Constr. Mater. 2022, 16, e00989. [Google Scholar] [CrossRef]
  36. Carreira, D.J.; Kuanghan, C. Stress-strain relationship for plain concrete in compression. ACI J. Proc. 1985, 82, 797–804. [Google Scholar]
  37. Zhenhai, G. Principles and Applications of Strength and Constitutive Relationship of Concrete; China Architecture & Building Press: Beijing, China, 2004; p. 247. [Google Scholar]
  38. Weibull, W. A statistical distribution function of wide applicability. J. Appl. Mech. Trans. ASME 1951, 18, 293–297. [Google Scholar] [CrossRef]
  39. Lemaitre, J. Evalution of dissipation and damage in metals submitted to dynamic loading. In Proceedings of the International Conference of Mechanical Behavior of Materials, Kyoto, Japan, 15–20 August 1971. [Google Scholar]
  40. Zhiqiang, L.; Guoqing, W.; Sen, Y.; Guannan, J. Experimental study on mechanical properties and stress-strain constitutive relations of desert sand concrete. Chin. J. Appl. Mech. 2019, 36, 1131–1137. [Google Scholar]
Figure 1. Particle size distribution curves of sand and coal-fired slag.
Buildings 14 03103 g001
Figure 2. Sample preparation process.
Buildings 14 03103 g002
Figure 3. The loading method used to test the performance of the SC.
Buildings 14 03103 g003
Figure 4. Schematic diagram of loading method for elasticity model test.
Buildings 14 03103 g004
Figure 5. Damage patterns observed during the cubic compressive strength test of SC.
Buildings 14 03103 g005
Figure 6. Morphology of SC specimens during the splitting tensile strength test.
Buildings 14 03103 g006
Figure 7. Split cross-sections of split SC specimens.
Buildings 14 03103 g007
Figure 8. Axial compressive strength test of SC specimens.
Buildings 14 03103 g008
Figure 9. SEM images of the base-phase interface of an SC-5 specimen with 5% slag replacement (SC-5).
Buildings 14 03103 g009
Figure 10. XRD patterns of the SC hydration products (A: Aft; B: Ca(OH)2; C: SiO2; D: CaCO3; E: C-S-H; F: CASH; G: CaSiO3; H: NaAlSiO4).
Buildings 14 03103 g010
Figure 11. Dimensionless cubic compressive strength of SC as a function of the slag replacement ratio.
Buildings 14 03103 g011
Figure 12. Dimensionless splitting tensile strength of SC as a function of the slag replacement ratio.
Buildings 14 03103 g012
Figure 13. Normalized axial compressive strength of SC as a function of the slag replacement ratio.
Buildings 14 03103 g013
Figure 14. Normalized static modulus of elasticity of SC as a function of the slag replacement ratio.
Buildings 14 03103 g014
Figure 15. Complete curve of the normalized stress–strain data for SC.
Buildings 14 03103 g015
Figure 16. Comparison of the best-fit curves for the stress–strain constitutive equations of SC.
Buildings 14 03103 g016
Figure 17. Best-fit curve for the damage constitutive equation of SC.
Buildings 14 03103 g017
Figure 18. Schematic representation of the calculation for the dissipation factor of SC.
Buildings 14 03103 g018
Table 1. Properties of the cement used in the study.
PropertiesCementLimit as Per GB175-2007
Fineness (m2·kg)356.4Minimum 300
Soundness: pat testPassNo cracks or bends
Initial setting time (min)178Minimum 45
Final setting time (min)228Maximum 600
3-day compressive strength [11]30.6Minimum 22.0
3-day flexural strength [11]6.4Minimum 4.0
MgO (%)2.13Maximum 5.0
SO3 (%)2.58Maximum 3.5
LOI (%)1.10Maximum 5.0
Table 2. Parameters of fly ash.
GradeFineness/%Loss on Ignition/%Water Demand Ratio/%Moisture Content/%
7.72.1940.3
Table 3. Chemical composition of the coal-fired slags %.
SiO2Al2O3CaOFe2O3TiO2SO3MgOK2ONa2OLOI
42.1616.8512.6410.120.869.963.781.151.920.56
Table 4. Mixing ratios for the coal-fired SC.
Test NumberCoal-Fired Slag
Replacement Ratio/%
Water/kg·m−3Cement/kg·m−3Fly Ash/kg·m−3Slags/kg·m−3Sand/kg·m−3Rock/kg·m−3Water-Reducing Agent/kg·m−3
SC-0017535039079310733.89
SC-1010175350397971410733.89
SC-20201753503915963410733.89
SC-30301753503923855510733.89
SC-40401753503931747610733.89
SC-50501753503939739710733.89
SC-60601753503947631710733.89
SC-70701753503955523810733.89
SC-80801753503963415910733.89
SC-9090175350397147910733.89
SC-10010017535039793010733.89
Table 5. Test results of the mechanical properties of the SC.
Test NumberCubic Compressive Strength/MPaSplitting Tensile Strength/MPaAxial Compressive Strength/MPaAxial Compressive StrainStatic Elastic Modulus/MPaSlump/mm
SC-065.242.2455.335.36 × 10−345,250270
SC-1069.492.6257.235.46 × 10−341,700276
SC-2065.783.0656.285.34 × 10−340,267268
SC-3068.723.1253.705.40 × 10−343,067248
SC-4063.023.8641.335.32 × 10−341,200213
SC-5065.613.5056.225.37 × 10−341,667190
SC-6065.662.4153.045.39 × 10−343,933132
SC-7064.493.0148.165.35 × 10−340,50064
SC-8061.743.1545.065.22 × 10−339,70019
SC-9061.372.3353.405.37 × 10−346,8007
SC-10057.831.9842.985.33 × 10−337,7674
Table 6. Two typical curve equations.
Model NameCurvilinear Equation
Guo-Zhenhai model y = α x + ( 3 2 α ) x 2 + ( α 2 ) x 3 , ( 0 x 1 )
y = x β ( x 1 ) 2 + x , ( x 1 )
Carreira and Chu model y = β x β 1 + x β
Table 7. Experimental results of the energy dissipation coefficient test for the SC.
Energy
Dissipation
Coefficient
SC-0SC-1SC-2SC-3SC-4SC-5SC-6SC-7SC-8SC-9SC-10
δ0.6520.6450.6420.6440.6360.6330.6210.6180.6090.5780.562
Disclaimer/Publisher’s Note: The statements, opinions and data contained in all publications are solely those of the individual author(s) and contributor(s) and not of MDPI and/or the editor(s). MDPI and/or the editor(s) disclaim responsibility for any injury to people or property resulting from any ideas, methods, instructions or products referred to in the content.

